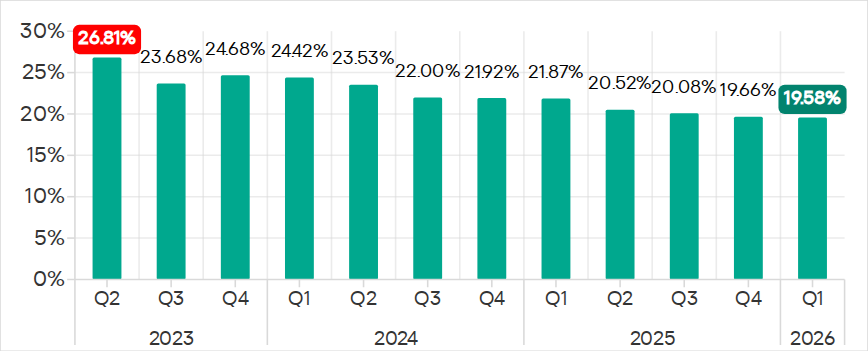
The percentage of ICS computers on which malicious objects were blocked continued to decrease, reaching 19.6% in Q1 2026. This is the lowest value in three years, and it is 1.4 times lower than in Q2 2023.
Percentage of ICS computers on which malicious objects were blocked, Q2 2023–Q1 2026
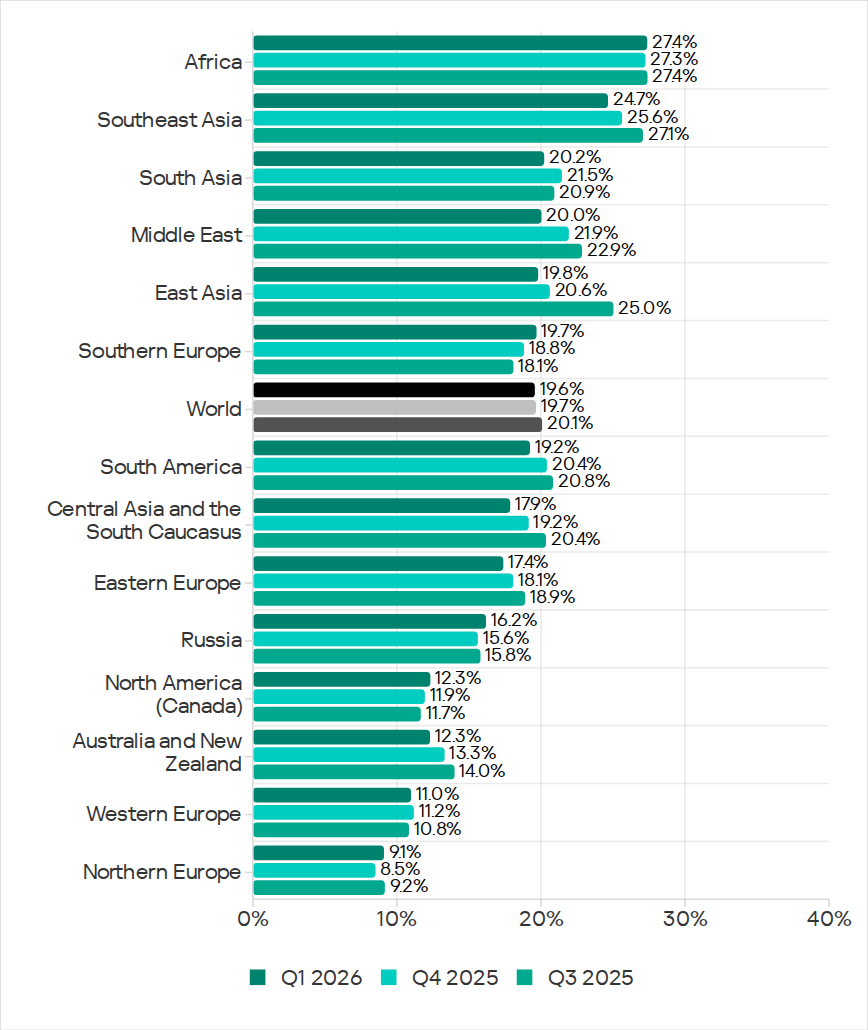
Regionally, the percentages ranged from 9.1% in Northern Europe to 27.4% in Africa.
Regions ranked by percentage of attacked ICS computers
The percentage of ICS computers on which malicious objects were blocked increased in five regions over the quarter, most notably in Southern Europe, Northern Europe, and Russia.
In Q1 2026, Southern Europe led the way in growth for internet and email threats. The region also saw the fastest growth in spyware, as well as malicious scripts and phishing pages.
In Russia, the percentage of ICS computers on which malicious objects were blocked exceeded the figures for the previous two quarters. Russia saw an increase in the percentage for threats from the internet, and a slight increase in the figure for threats from email clients (Russia is one of three regions where this figure did not decrease).
Among the threat categories, the greatest increases were observed in the percentages for denylisted internet resources, as well as spyware (distributed in the region via the internet and email clients).
Selected industries
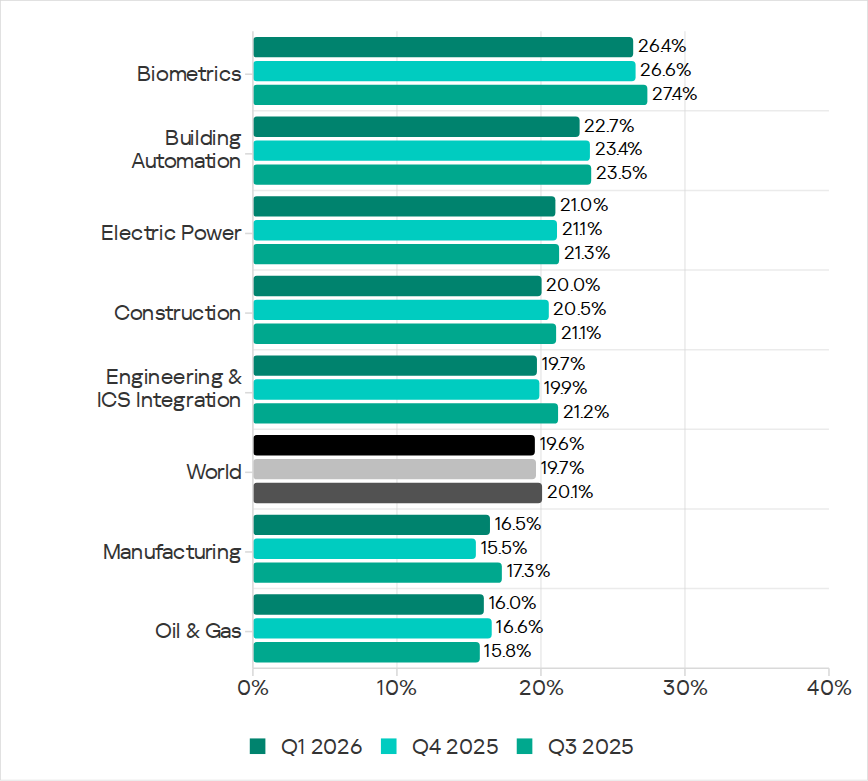
Biometric systems (26.4%) traditionally rank top among the industries and OT infrastructure types covered in this report in terms of the percentage of ICS computers on which malicious objects were blocked. These systems are characterized by internet access, extensive email use for data exchange and approvals (such as access granting), and, in many cases, minimal cybersecurity controls within the organizations that use these systems.
Industries ranked by the percentage of ICS computers on which malicious objects were blocked
Biometric systems rank first among industries in terms of email threats. At the same time, unlike other industries, the percentage for email threats in biometric systems exceeds that for internet threats.
In all selected industries, the global average follows a downward trend. In Q1 2026, the percentage of ICS computers on which malicious objects were blocked increased only in the manufacturing sector — by 1.0 pp. The percentages for this industry increased across 10 regions, with the most notable increases in Western Europe, Northern Europe, and Russia.
Threat categories
In Q1 2026, Kaspersky security solutions blocked malware from 10,052 different malware families of various categories on industrial automation systems.
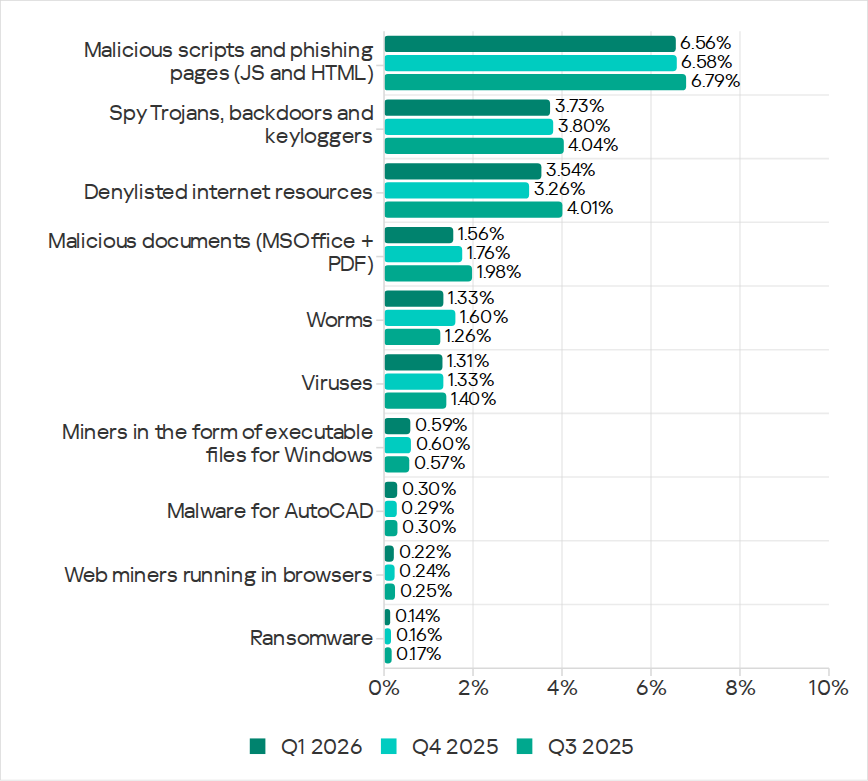
Over the quarter, the percentage of ICS computers on which denylisted internet resources were blocked increased (after decreasing over the previous two quarters), and there was a slight increase in the percentage for AutoCAD malware.
Percentage of ICS computers on which the activity of malicious objects from various categories was prevented
Malicious scripts and phishing pages (JS and HTML)
Malicious scripts and phishing pages retained their to spot among threat categories by the percentage of ICS computers on which these threats were blocked. The global average in Q1 2026 was 6.56%.
Over the quarter, the percentages increased in four regions. The most significant change was observed in Southern Europe (9.85%, +0.94 pp). The figures for malicious scripts in the region increased over three consecutive quarters.
Among the selected industries, across all regions, the highest percentages for the malicious scripts and phishing pages category were recorded for biometric systems (19.59%) and building automation (15.43%) in Southern Europe. These same industries lead in similar rankings for malicious documents and spyware.
Spyware
The percentage of ICS computers on which spyware was blocked decreased over two consecutive quarters, dropping to 3.73%. Despite the decline, spyware has ranked second among threat categories by the percentage of attacked computers for three consecutive quarters.
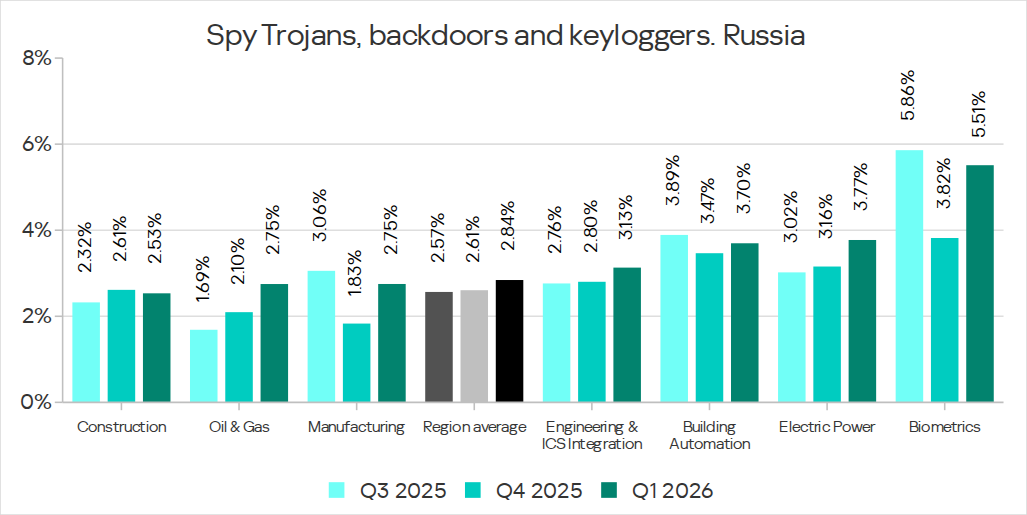
The percentages increased in five regions over the quarter, most notably in Southern Europe (5.46%, +0.35 pp) and Russia (2.84%, +0.24 pp).
In Southern Europe, the percentage of ICS computers on which spyware was blocked increased in all the selected industries except manufacturing. The greatest increase was observed in biometric systems.
Among the selected industries, the highest percentage of spyware in Russia was recorded in biometric systems. That said, the percentage of ICS computers on which spyware was blocked increased in all industries in the region except construction. The percentage figure has been increasing for two consecutive quarters in the oil and gas industry (by a factor of 1.63 over six months), and for three consecutive quarters in engineering and ICS integration, as well as electric power. In the remaining sectors, the values have been fluctuating.
Percentage of ICS computers on which spyware was blocked in various industries in Russia, Q3 2025–Q1 2026
Denylisted internet resources
The percentage of ICS computers on which denylisted internet resources were blocked increased to 3.54%.
The most notable increase over the quarter occurred in Southeast Asia (4.58%, +0.65 pp). Among the industries in the region, the highest percentage figures for this threat category were recorded in electric power and construction. Over the quarter, the largest increases in percentages figures were observed in the electric power and manufacturing industries.
In North America (Canada), denylisted internet resources (2.14%) showed the greatest increase among all categories — by a factor of 1.22.
Among the selected industries across all regions, the highest percentage figures for the denylisted internet resources category were in the electric power (7.11%) and construction (6.25%) industries in Southeast Asia.
Malicious documents (Microsoft Office + PDF)
The percentage figure for this category decreased over two consecutive quarters, reaching its lowest value (1.56%) for the entire period of observations in Q1 2026. It increased just in two regions: Australia and New Zealand (1.12%, +0.04 pp), and Russia (0.62%, +0.01 pp).
Among the selected industries across all regions, the highest percentages for malicious documents were recorded for biometric systems (9.02%) and building automation (6.97%) in Southern Europe. These same industries also lead in similar rankings for malicious scripts and spyware.
Ransomware
The percentage of ICS computers on which ransomware was blocked has decreased for two consecutive quarters, dropping to 0.14%. This is the lowest value among all categories.
The percentage increased in two regions: North America (Canada) (0.11%, +0.04 pp) and slightly in Northern Europe (0.06%, +0.01 pp).
Among the selected industries across all regions, the highest percentages for ransomware were recorded in the oil and gas and manufacturing industries (0.92% and 0.65%, respectively) in Central Asia and the South Caucasus, and in biometric systems (0.89%) in Russia.
Miners in the form of executable files for Windows
The percentage of ICS computers on which miners in the form of executable files for Windows were blocked decreased to 0.59%.
The percentage increased in seven regions. The largest increase was observed in Africa (0.63%, +0.16 pp). Among the selected industries, the largest increases in the region were in the manufacturing and oil and gas industries.
Among the selected industries across all regions, the highest percentages for miners in the form of executable files were recorded in construction (1.99%), biometric systems (1.98%), and the oil and gas industry (1.97%) in Central Asia and the South Caucasus.
Web miners
The percentage of ICS computers on which web miners were blocked has been declining for a year, and in Q1 2026, it reached the lowest value for the entire period under review (0.22%).
At the same time, the percentage increased in seven regions. The largest increases were observed in South Asia (0.28%, +0.11 pp), the Middle East (0.31%, +0.09 pp), and Africa (0.34%, +0.08 pp). Despite the increases, the percentages in these regions for Q1 2026 did not exceed those observed in 2023–2024 and in Q1 2025.
Among the selected industries across all regions, the highest percentages for web miners were recorded for biometric systems (0.97%) in Russia. Biometric systems in South Asia (0.79%) ranked second, and the electric power sector in Southeast Asia (0.76%) ranked third.
Worms
The percentage of ICS computers on which worms were blocked decreased to 1.33%.
The percentage decreased across all regions following an increase in the previous quarter (due to a wave of phishing attacks that distributed the Backdoor.MSIL.XWorm backdoor worm across all regions of the world).
Among the selected industries across all regions, the highest percentage figure for worms was recorded for biometric systems (4.80%) in Central Asia and the South Caucasus. Two industries in Africa – biometric systems (4.04%) and electric power (3.53%) – took the second and third spots, respectively.
Viruses
The percentage of ICS computers on which viruses were blocked decreased to 1.31%.
The top 3 regions by this figure remained the same: Southeast Asia (6.11%, first by a wide margin), Africa (4.15%), and East Asia (2.97%). These same regions are also among the leaders by the percentage of systems affected by AutoCAD malware. The largest increase in this figure was observed in Africa (+0.41 pp).
Among the selected industries across all regions, the highest percentages for viruses were recorded in the construction industry (6.35%) and building automation (5.50%) in Southeast Asia.
Malware for AutoCAD
The percentage of ICS computers on which malware for AutoCAD was blocked increased to 0.30%.
The most notable increase over the quarter was observed in Africa, with the region’s percentage figure rising by 0.47 pp, a very significant increase for this category, and almost doubling (to 0.91%).
Among the selected industries across all regions, the highest percentages for AutoCAD malware were recorded in the construction industry in East Asia (5.58%) and Southeast Asia (3.87%).
Main threat sources
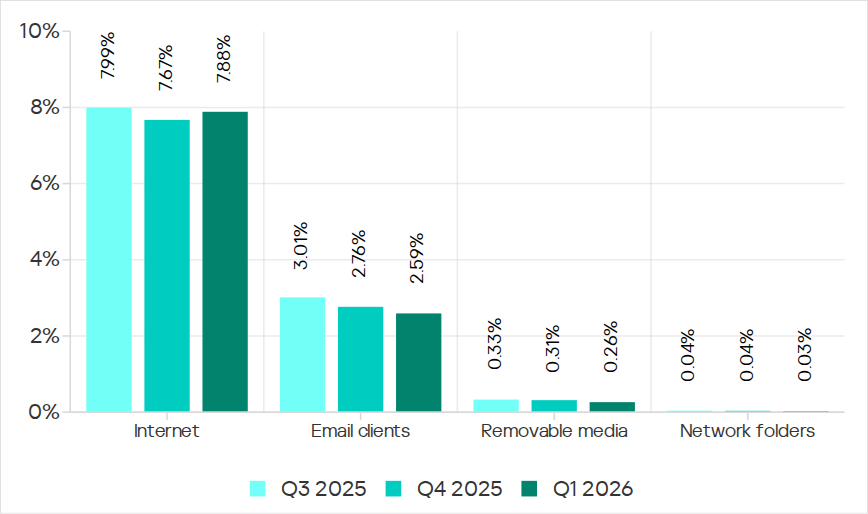
In Q1 2026, the average percentages across all threat sources, except threats from the internet, decreased globally.
Percentage of ICS computers on which malicious objects from various sources were blocked
Internet
The percentage of ICS computers on which threats from the internet were blocked increased to 7.88%. However, over the past three years, the percentage figure for internet threats has followed a downward trend.
The largest increases in the percentages were recorded in Southern Europe (8.59%, +0.59 pp), Southeast Asia (10.16%, +0.55 pp), and Northern Europe (4.47%, +0.51 pp).
Among the selected industries across all regions, the highest percentages for threats from the internet were recorded in electric power (13.16%) and construction (12.55%) in Southeast Asia, and in the engineering and ICS integration sector (12.33%) in South Asia.
Email clients
The percentage of ICS computers on which threats delivered via email clients were blocked decreased to 2.59%. This is a three-year low.
The percentage of this threat source increased in three regions: Southern Europe (6.54%, +0.2 pp), East Asia (1.5%, +0.09 pp), and slightly in Russia (0.7%, +0.04 pp).
Among the selected industries across all regions, the highest percentages for email threats were recorded for biometric systems (19.78%) and building automation (12.34%) in Southern Europe. In these two industries, the percentage of ICS computers on which email threats are blocked is higher than the percentage for threats from the internet. A similar situation was observed in two other instances, both in biometric systems (in South America and Southeast Asia).
Removable media
The percentage of ICS computers on which threats were detected when connecting removable media continued to decrease, reaching its lowest value for the period under review (0.26%).
Among the selected industries across all regions, the highest percentages for removable media threats blocked on ICS computers were observed in the electric power sector in Central Asia and the South Caucasus (1.45%), East Asia (1.34%), and Africa (1.16%).
Network folders
The percentage of ICS computers on which threats are blocked in network folders is steadily decreasing. In Q1 2026, it was the lowest for the period under review (0.029%).
East Asia has traditionally led by a wide margin. The percentage for East Asia (0.135%) is 27 times higher than the lowest regional value (recorded in Northern Europe).
The largest increases in the percentages for threats from network folders were observed in Africa (0.037%, +0.006 pp) and South America (0.013%, +0.006 pp).
Among the selected industries across all regions, the construction industry in East Asia, at 0.36%, holds the top positions in the ranking by the percentage of ICS computers on which threats are blocked in network folders.
The percentage of ICS computers on which malicious objects were blocked continued to decrease, reaching 19.6% in Q1 2026. This is the lowest value in three years, and it is 1.4 times lower than in Q2 2023.
Percentage of ICS computers on which malicious objects were blocked, Q2 2023–Q1 2026
Regionally, the percentages ranged from 9.1% in Northern Europe to 27.4% in Africa.
Regions ranked by percentage of attacked ICS computers
The percentage of ICS computers on which malicious objects were blocked increased in five regions over the quarter, most notably in Southern Europe, Northern Europe, and Russia.
In Q1 2026, Southern Europe led the way in growth for internet and email threats. The region also saw the fastest growth in spyware, as well as malicious scripts and phishing pages.
In Russia, the percentage of ICS computers on which malicious objects were blocked exceeded the figures for the previous two quarters. Russia saw an increase in the percentage for threats from the internet, and a slight increase in the figure for threats from email clients (Russia is one of three regions where this figure did not decrease).
Among the threat categories, the greatest increases were observed in the percentages for denylisted internet resources, as well as spyware (distributed in the region via the internet and email clients).
Selected industries
Biometric systems (26.4%) traditionally rank top among the industries and OT infrastructure types covered in this report in terms of the percentage of ICS computers on which malicious objects were blocked. These systems are characterized by internet access, extensive email use for data exchange and approvals (such as access granting), and, in many cases, minimal cybersecurity controls within the organizations that use these systems.
Industries ranked by the percentage of ICS computers on which malicious objects were blocked
Biometric systems rank first among industries in terms of email threats. At the same time, unlike other industries, the percentage for email threats in biometric systems exceeds that for internet threats.
In all selected industries, the global average follows a downward trend. In Q1 2026, the percentage of ICS computers on which malicious objects were blocked increased only in the manufacturing sector — by 1.0 pp. The percentages for this industry increased across 10 regions, with the most notable increases in Western Europe, Northern Europe, and Russia.
Threat categories
In Q1 2026, Kaspersky security solutions blocked malware from 10,052 different malware families of various categories on industrial automation systems.
Over the quarter, the percentage of ICS computers on which denylisted internet resources were blocked increased (after decreasing over the previous two quarters), and there was a slight increase in the percentage for AutoCAD malware.
Percentage of ICS computers on which the activity of malicious objects from various categories was prevented
Malicious scripts and phishing pages (JS and HTML)
Malicious scripts and phishing pages retained their to spot among threat categories by the percentage of ICS computers on which these threats were blocked. The global average in Q1 2026 was 6.56%.
Over the quarter, the percentages increased in four regions. The most significant change was observed in Southern Europe (9.85%, +0.94 pp). The figures for malicious scripts in the region increased over three consecutive quarters.
Among the selected industries, across all regions, the highest percentages for the malicious scripts and phishing pages category were recorded for biometric systems (19.59%) and building automation (15.43%) in Southern Europe. These same industries lead in similar rankings for malicious documents and spyware.
Spyware
The percentage of ICS computers on which spyware was blocked decreased over two consecutive quarters, dropping to 3.73%. Despite the decline, spyware has ranked second among threat categories by the percentage of attacked computers for three consecutive quarters.
The percentages increased in five regions over the quarter, most notably in Southern Europe (5.46%, +0.35 pp) and Russia (2.84%, +0.24 pp).
In Southern Europe, the percentage of ICS computers on which spyware was blocked increased in all the selected industries except manufacturing. The greatest increase was observed in biometric systems.
Among the selected industries, the highest percentage of spyware in Russia was recorded in biometric systems. That said, the percentage of ICS computers on which spyware was blocked increased in all industries in the region except construction. The percentage figure has been increasing for two consecutive quarters in the oil and gas industry (by a factor of 1.63 over six months), and for three consecutive quarters in engineering and ICS integration, as well as electric power. In the remaining sectors, the values have been fluctuating.
Percentage of ICS computers on which spyware was blocked in various industries in Russia, Q3 2025–Q1 2026
Denylisted internet resources
The percentage of ICS computers on which denylisted internet resources were blocked increased to 3.54%.
The most notable increase over the quarter occurred in Southeast Asia (4.58%, +0.65 pp). Among the industries in the region, the highest percentage figures for this threat category were recorded in electric power and construction. Over the quarter, the largest increases in percentages figures were observed in the electric power and manufacturing industries.
In North America (Canada), denylisted internet resources (2.14%) showed the greatest increase among all categories — by a factor of 1.22.
Among the selected industries across all regions, the highest percentage figures for the denylisted internet resources category were in the electric power (7.11%) and construction (6.25%) industries in Southeast Asia.
Malicious documents (Microsoft Office + PDF)
The percentage figure for this category decreased over two consecutive quarters, reaching its lowest value (1.56%) for the entire period of observations in Q1 2026. It increased just in two regions: Australia and New Zealand (1.12%, +0.04 pp), and Russia (0.62%, +0.01 pp).
Among the selected industries across all regions, the highest percentages for malicious documents were recorded for biometric systems (9.02%) and building automation (6.97%) in Southern Europe. These same industries also lead in similar rankings for malicious scripts and spyware.
Ransomware
The percentage of ICS computers on which ransomware was blocked has decreased for two consecutive quarters, dropping to 0.14%. This is the lowest value among all categories.
The percentage increased in two regions: North America (Canada) (0.11%, +0.04 pp) and slightly in Northern Europe (0.06%, +0.01 pp).
Among the selected industries across all regions, the highest percentages for ransomware were recorded in the oil and gas and manufacturing industries (0.92% and 0.65%, respectively) in Central Asia and the South Caucasus, and in biometric systems (0.89%) in Russia.
Miners in the form of executable files for Windows
The percentage of ICS computers on which miners in the form of executable files for Windows were blocked decreased to 0.59%.
The percentage increased in seven regions. The largest increase was observed in Africa (0.63%, +0.16 pp). Among the selected industries, the largest increases in the region were in the manufacturing and oil and gas industries.
Among the selected industries across all regions, the highest percentages for miners in the form of executable files were recorded in construction (1.99%), biometric systems (1.98%), and the oil and gas industry (1.97%) in Central Asia and the South Caucasus.
Web miners
The percentage of ICS computers on which web miners were blocked has been declining for a year, and in Q1 2026, it reached the lowest value for the entire period under review (0.22%).
At the same time, the percentage increased in seven regions. The largest increases were observed in South Asia (0.28%, +0.11 pp), the Middle East (0.31%, +0.09 pp), and Africa (0.34%, +0.08 pp). Despite the increases, the percentages in these regions for Q1 2026 did not exceed those observed in 2023–2024 and in Q1 2025.
Among the selected industries across all regions, the highest percentages for web miners were recorded for biometric systems (0.97%) in Russia. Biometric systems in South Asia (0.79%) ranked second, and the electric power sector in Southeast Asia (0.76%) ranked third.
Worms
The percentage of ICS computers on which worms were blocked decreased to 1.33%.
The percentage decreased across all regions following an increase in the previous quarter (due to a wave of phishing attacks that distributed the Backdoor.MSIL.XWorm backdoor worm across all regions of the world).
Among the selected industries across all regions, the highest percentage figure for worms was recorded for biometric systems (4.80%) in Central Asia and the South Caucasus. Two industries in Africa – biometric systems (4.04%) and electric power (3.53%) – took the second and third spots, respectively.
Viruses
The percentage of ICS computers on which viruses were blocked decreased to 1.31%.
The top 3 regions by this figure remained the same: Southeast Asia (6.11%, first by a wide margin), Africa (4.15%), and East Asia (2.97%). These same regions are also among the leaders by the percentage of systems affected by AutoCAD malware. The largest increase in this figure was observed in Africa (+0.41 pp).
Among the selected industries across all regions, the highest percentages for viruses were recorded in the construction industry (6.35%) and building automation (5.50%) in Southeast Asia.
Malware for AutoCAD
The percentage of ICS computers on which malware for AutoCAD was blocked increased to 0.30%.
The most notable increase over the quarter was observed in Africa, with the region’s percentage figure rising by 0.47 pp, a very significant increase for this category, and almost doubling (to 0.91%).
Among the selected industries across all regions, the highest percentages for AutoCAD malware were recorded in the construction industry in East Asia (5.58%) and Southeast Asia (3.87%).
Main threat sources
In Q1 2026, the average percentages across all threat sources, except threats from the internet, decreased globally.
Percentage of ICS computers on which malicious objects from various sources were blocked
Internet
The percentage of ICS computers on which threats from the internet were blocked increased to 7.88%. However, over the past three years, the percentage figure for internet threats has followed a downward trend.
The largest increases in the percentages were recorded in Southern Europe (8.59%, +0.59 pp), Southeast Asia (10.16%, +0.55 pp), and Northern Europe (4.47%, +0.51 pp).
Among the selected industries across all regions, the highest percentages for threats from the internet were recorded in electric power (13.16%) and construction (12.55%) in Southeast Asia, and in the engineering and ICS integration sector (12.33%) in South Asia.
Email clients
The percentage of ICS computers on which threats delivered via email clients were blocked decreased to 2.59%. This is a three-year low.
The percentage of this threat source increased in three regions: Southern Europe (6.54%, +0.2 pp), East Asia (1.5%, +0.09 pp), and slightly in Russia (0.7%, +0.04 pp).
Among the selected industries across all regions, the highest percentages for email threats were recorded for biometric systems (19.78%) and building automation (12.34%) in Southern Europe. In these two industries, the percentage of ICS computers on which email threats are blocked is higher than the percentage for threats from the internet. A similar situation was observed in two other instances, both in biometric systems (in South America and Southeast Asia).
Removable media
The percentage of ICS computers on which threats were detected when connecting removable media continued to decrease, reaching its lowest value for the period under review (0.26%).
Among the selected industries across all regions, the highest percentages for removable media threats blocked on ICS computers were observed in the electric power sector in Central Asia and the South Caucasus (1.45%), East Asia (1.34%), and Africa (1.16%).
Network folders
The percentage of ICS computers on which threats are blocked in network folders is steadily decreasing. In Q1 2026, it was the lowest for the period under review (0.029%).
East Asia has traditionally led by a wide margin. The percentage for East Asia (0.135%) is 27 times higher than the lowest regional value (recorded in Northern Europe).
The largest increases in the percentages for threats from network folders were observed in Africa (0.037%, +0.006 pp) and South America (0.013%, +0.006 pp).
Among the selected industries across all regions, the construction industry in East Asia, at 0.36%, holds the top positions in the ranking by the percentage of ICS computers on which threats are blocked in network folders.
Legacy systems, safety concerns, and critical infrastructure risks make OT vulnerability disclosure one of cybersecurity's most challenging balancing acts.
We’ve taken one small step towards robot police officers: a drone capable of disarming a suspect:
In a June 22 video posted on the Sacramento County Sheriff’s Office’s Instagram page, an officer wearing goggles can be seen operating a drone to retrieve a knife from an armed suspect hiding inside a cluttered house. “After not responding to negotiators, a drone was deployed inside the residence,” the post says. “Drone pilots located the suspect hiding in a corner of a garage” and then used a high-powered magnet attached to the drone to grab the knife out of the suspect’s hand. In the video which is soundtracked by the “Mission: Impossible” theme song—the intercepted knife can be seen spinning around in the air as the drone carries it back to the deputies.
I am incredibly proud to share that Palo Alto Networks has been named a Leader in the 2026 Gartner® Magic Quadrant for Endpoint Protection Platforms for the fourth consecutive year. For us, this recognition is a testament to our team's relentless vision as we continue to define endpoint defense—from the pioneer days of XDR to the new frontier of agentic AI.
We believe our repeated recognition as a Leader is built on a single, uncompromising commitment to our customers and partners: empowering organizations with reduced overhead, rapid threat response, a strengthened security posture, and the resilient protection required to close the most critical security gaps. We are now leading the shift into the agentic era. While AI agents significantly boost enterprise productivity, they also introduce novel attack surfaces that legacy EDR tools are unable to protect. As the pioneer of XDR, we are committed to defining the next generation of cybersecurity by securing this new frontier.
Cortex® XDR is helping customers:
Secure Agentic AI with Koi: Gain unprecedented visibility, guardrails, and control over AI agents and agentic tools before they become a liability.
Stop the Unseen: Leverage battle-tested prevention powered by behavioral analytics, and industry-leading automation and response.
Unify Your Defense: Consolidate your endpoint and workspace security with a proven, four-time industry Leader.
We are incredibly proud to be recognized as a Leader once again, an acknowledgement that belongs just as much to our customers and partners as it does to us. Your trust, feedback, and real-world challenges keep us sharp and dictate our roadmap. At the end of the day, our continued leadership is built on one core promise: make each day more secure than the day before.
To get the full story and a comprehensive analysis of the endpoint security market, I invite you to read the 2026 Gartner Magic Quadrant report.
Gartner, Magic Quadrant for Endpoint Protection Platforms, By Deepak Mishra, Evgeny Mirolyubov, Nikul Patel, May 29, 2026
Gartner and Magic Quadrant are trademarks of Gartner, Inc. and/or its affiliates. Gartner does not endorse any company, vendor, product or service depicted in its publications, and does not advise technology users to select only those vendors with the highest ratings or other designation. Gartner publications consist of the opinions of Gartner’s business and technology insights organization and should not be construed as statements of fact. Gartner disclaims all warranties, expressed or implied, with respect to this publication, including any warranties of merchantability or fitness for a particular purpose.
Anna Turley gives Reform leader 24 hours to report Russian hacking claim in ‘public and national interest’
The Labour chair has given Nigel Farage 24 hours to report to security services the claim that his phone was hacked by Russia-linked actors or the party will do it for him.
In a letter to the Reform UK leader, Anna Turley said it was “in the public and national interest” to ensure that a suspected overseas hack of a senior politician’s phone by a hostile state was properly investigated.
Ciaran Martin says Reform UK leader’s allegation over Guardian report on £5m gift ‘entirely unsubstantiated’
Nigel Farage’s claim that a Russian hack was behind a Guardian report on the £5m gift he received from a crypto billionaire has been described as “without any merit” by a former head of the National Cyber Security Centre.
Ciaran Martin, founding chief executive of the agency, which is part of GCHQ, said Farage’s allegation, if true, would have major implications for UK policy towards Russia but that the Reform UK leader had yet to provide “a shred of evidence”.
NYC Health + Hospitals (NYC H+H) posted a data breach notice about a months‑long breach via a third‑party vendor that exposed highly sensitive patient and employee data for at least 1.8 million people, including medical records, government IDs, geolocation data, and even fingerprint and palm‑print biometrics.
NYC H+H detected suspicious activity on February 2, 2026, and later confirmed that an unauthorized actor had access to parts of its network from roughly late November 2025 through February 2026.
During this window, attackers copied files containing personal, medical, financial, and biometric information. The incident was reported to the US Department of Health and Human Services (HHS) on March 24, 2026, and currently affects at least 1.8 million individuals, making it one of the largest healthcare breaches of 2026 so far.
NYC H+H attributes the intrusion to a breach at an unnamed third‑party vendor that had access to its systems. This fits the current pattern of supply-chain compromises, where a vendor becomes the entry point for attackers to gain access to their clients’ systems or data.
Incidents like these are a textbook example of how deeply personal health data can fuel long‑term fraud, stalkerware‑like abuse, and permanent privacy loss.
According to NYC H+H’s notice and related write‑ups, the exposed dataset is unusually broad and detailed.
We can divide the data into three distinct layers:
Classical PII, which can be combined with other leaked datasets: Full names and contact details. Government‑issued identifiers, including Social Security Numbers, driver’s license and passport numbers, other government ID numbers, taxpayer IDs, and IRS identity protection PINs. The breach also exposed billing and payment records, plus bank and card data, which can be used for direct financial theft and highly convincing social engineering.
Medical and insurance data: Detailed diagnoses, medication lists, and test results expose conditions people may have kept private from employers, family, or insurers, enabling blackmail, targeted scams, and discrimination. Insurance and claims data can be abused to submit fraudulent claims, redirect reimbursements, or impersonate existing identities in healthcare systems.
Biometrics: These are at least as sensitive as medical history because they tend to stay with you for life. They are not easy to erase or replace. Once compromised, large biometric databases become long‑term liabilities for everyone who relies on them as trustworthy identifiers.
Unfortunately, this is part of a broader pattern. The FBI’s Internet Crime Complaint Center (IC3) reports that healthcare was the most targeted critical infrastructure sector for ransomware in 2025, with 460 ransomware incidents and 182 reported healthcare data breaches.
The Change Healthcare ransomware attack alone exposed medical and billing data for more than 190 million Americans, highlighting how a single healthcare intermediary can disrupt an entire system.
What to do if you’re involved
If you’ve interacted with NYC Health + Hospitals, there’s a possibility your personal information could be affected.
NYC Health + Hospitals is making identity theft prevention and mitigation services, including credit monitoring, available through Kroll Information Assurance, LLC for a period of 24 months at no cost to all individuals who have worked for or been a patient of NYC Health + Hospitals. For more details check its data breach notice.
If you think you’ve been affected by a data breach, here are steps you can take to protect yourself:
Check the company’s advice. Every breach is different, so check with the company to find out what’s happened and follow any specific advice it offers.
Change your password. You can make a stolen password useless to thieves by changing it. Choose a strong password that you don’t use for anything else. Better yet, let a password manager choose one for you.
Enable two-factor authentication (2FA). If you can, use a FIDO2-compliant hardware key, laptop, or phone as your second factor. Some forms of 2FA can be phished just as easily as a password, but 2FA that relies on a FIDO2 device can’t be phished.
Watch out for impersonators. The criminals may contact you posing as the breached platform. Check the official website to see if it’s contacting victims and verify the identity of anyone who contacts you using a different communication channel.
Take your time. Phishing attacks often impersonate people or brands you know, and use themes that require urgent attention, such as missed deliveries, account suspensions, and security alerts.
Consider not storing your card details. It’s definitely more convenient to let sites remember your card details, but it increases risk if a retailer suffers a breach.
Let’s face it, an incognito window can only do so much.
Breaches, dark web trading, credit fraud. Malwarebytes Identity Theft Protection monitors for all of it, alerts you fast, and comes with identity theft insurance.
NYC Health + Hospitals (NYC H+H) posted a data breach notice about a months‑long breach via a third‑party vendor that exposed highly sensitive patient and employee data for at least 1.8 million people, including medical records, government IDs, geolocation data, and even fingerprint and palm‑print biometrics.
NYC H+H detected suspicious activity on February 2, 2026, and later confirmed that an unauthorized actor had access to parts of its network from roughly late November 2025 through February 2026.
During this window, attackers copied files containing personal, medical, financial, and biometric information. The incident was reported to the US Department of Health and Human Services (HHS) on March 24, 2026, and currently affects at least 1.8 million individuals, making it one of the largest healthcare breaches of 2026 so far.
NYC H+H attributes the intrusion to a breach at an unnamed third‑party vendor that had access to its systems. This fits the current pattern of supply-chain compromises, where a vendor becomes the entry point for attackers to gain access to their clients’ systems or data.
Incidents like these are a textbook example of how deeply personal health data can fuel long‑term fraud, stalkerware‑like abuse, and permanent privacy loss.
According to NYC H+H’s notice and related write‑ups, the exposed dataset is unusually broad and detailed.
We can divide the data into three distinct layers:
Classical PII, which can be combined with other leaked datasets: Full names and contact details. Government‑issued identifiers, including Social Security Numbers, driver’s license and passport numbers, other government ID numbers, taxpayer IDs, and IRS identity protection PINs. The breach also exposed billing and payment records, plus bank and card data, which can be used for direct financial theft and highly convincing social engineering.
Medical and insurance data: Detailed diagnoses, medication lists, and test results expose conditions people may have kept private from employers, family, or insurers, enabling blackmail, targeted scams, and discrimination. Insurance and claims data can be abused to submit fraudulent claims, redirect reimbursements, or impersonate existing identities in healthcare systems.
Biometrics: These are at least as sensitive as medical history because they tend to stay with you for life. They are not easy to erase or replace. Once compromised, large biometric databases become long‑term liabilities for everyone who relies on them as trustworthy identifiers.
Unfortunately, this is part of a broader pattern. The FBI’s Internet Crime Complaint Center (IC3) reports that healthcare was the most targeted critical infrastructure sector for ransomware in 2025, with 460 ransomware incidents and 182 reported healthcare data breaches.
The Change Healthcare ransomware attack alone exposed medical and billing data for more than 190 million Americans, highlighting how a single healthcare intermediary can disrupt an entire system.
What to do if you’re involved
If you’ve interacted with NYC Health + Hospitals, there’s a possibility your personal information could be affected.
NYC Health + Hospitals is making identity theft prevention and mitigation services, including credit monitoring, available through Kroll Information Assurance, LLC for a period of 24 months at no cost to all individuals who have worked for or been a patient of NYC Health + Hospitals. For more details check its data breach notice.
If you think you’ve been affected by a data breach, here are steps you can take to protect yourself:
Check the company’s advice. Every breach is different, so check with the company to find out what’s happened and follow any specific advice it offers.
Change your password. You can make a stolen password useless to thieves by changing it. Choose a strong password that you don’t use for anything else. Better yet, let a password manager choose one for you.
Enable two-factor authentication (2FA). If you can, use a FIDO2-compliant hardware key, laptop, or phone as your second factor. Some forms of 2FA can be phished just as easily as a password, but 2FA that relies on a FIDO2 device can’t be phished.
Watch out for impersonators. The criminals may contact you posing as the breached platform. Check the official website to see if it’s contacting victims and verify the identity of anyone who contacts you using a different communication channel.
Take your time. Phishing attacks often impersonate people or brands you know, and use themes that require urgent attention, such as missed deliveries, account suspensions, and security alerts.
Consider not storing your card details. It’s definitely more convenient to let sites remember your card details, but it increases risk if a retailer suffers a breach.
Let’s face it, an incognito window can only do so much.
Breaches, dark web trading, credit fraud. Malwarebytes Identity Theft Protection monitors for all of it, alerts you fast, and comes with identity theft insurance.
In the third quarter of 2025, we updated the methodology for calculating statistical indicators based on the Kaspersky Security Network. These changes affected all sections of the report except for the statistics on installation packages, which remained unchanged.
To illustrate the differences between the reporting periods, we have also recalculated data for the previous quarters. Consequently, these figures may significantly differ from the previously published ones. However, subsequent reports will employ this new methodology, enabling precise comparisons with the data presented in this post.
The Kaspersky Security Network (KSN) is a global network for analyzing anonymized threat information, voluntarily shared by users of Kaspersky solutions. The statistics in this report are based on KSN data unless explicitly stated otherwise.
The quarter in numbers
According to Kaspersky Security Network, in Q1 2026:
More than 2.67 million attacks utilizing malware, adware, or unwanted mobile software were prevented.
The Trojan-Banker category was the prevalent mobile malware threat with a 52.96% share of total detected applications.
More than 306,000 malicious installation packages were discovered, including:
162,275 packages related to mobile banking Trojans;
439 packages related to mobile ransomware Trojans.
Quarterly highlights
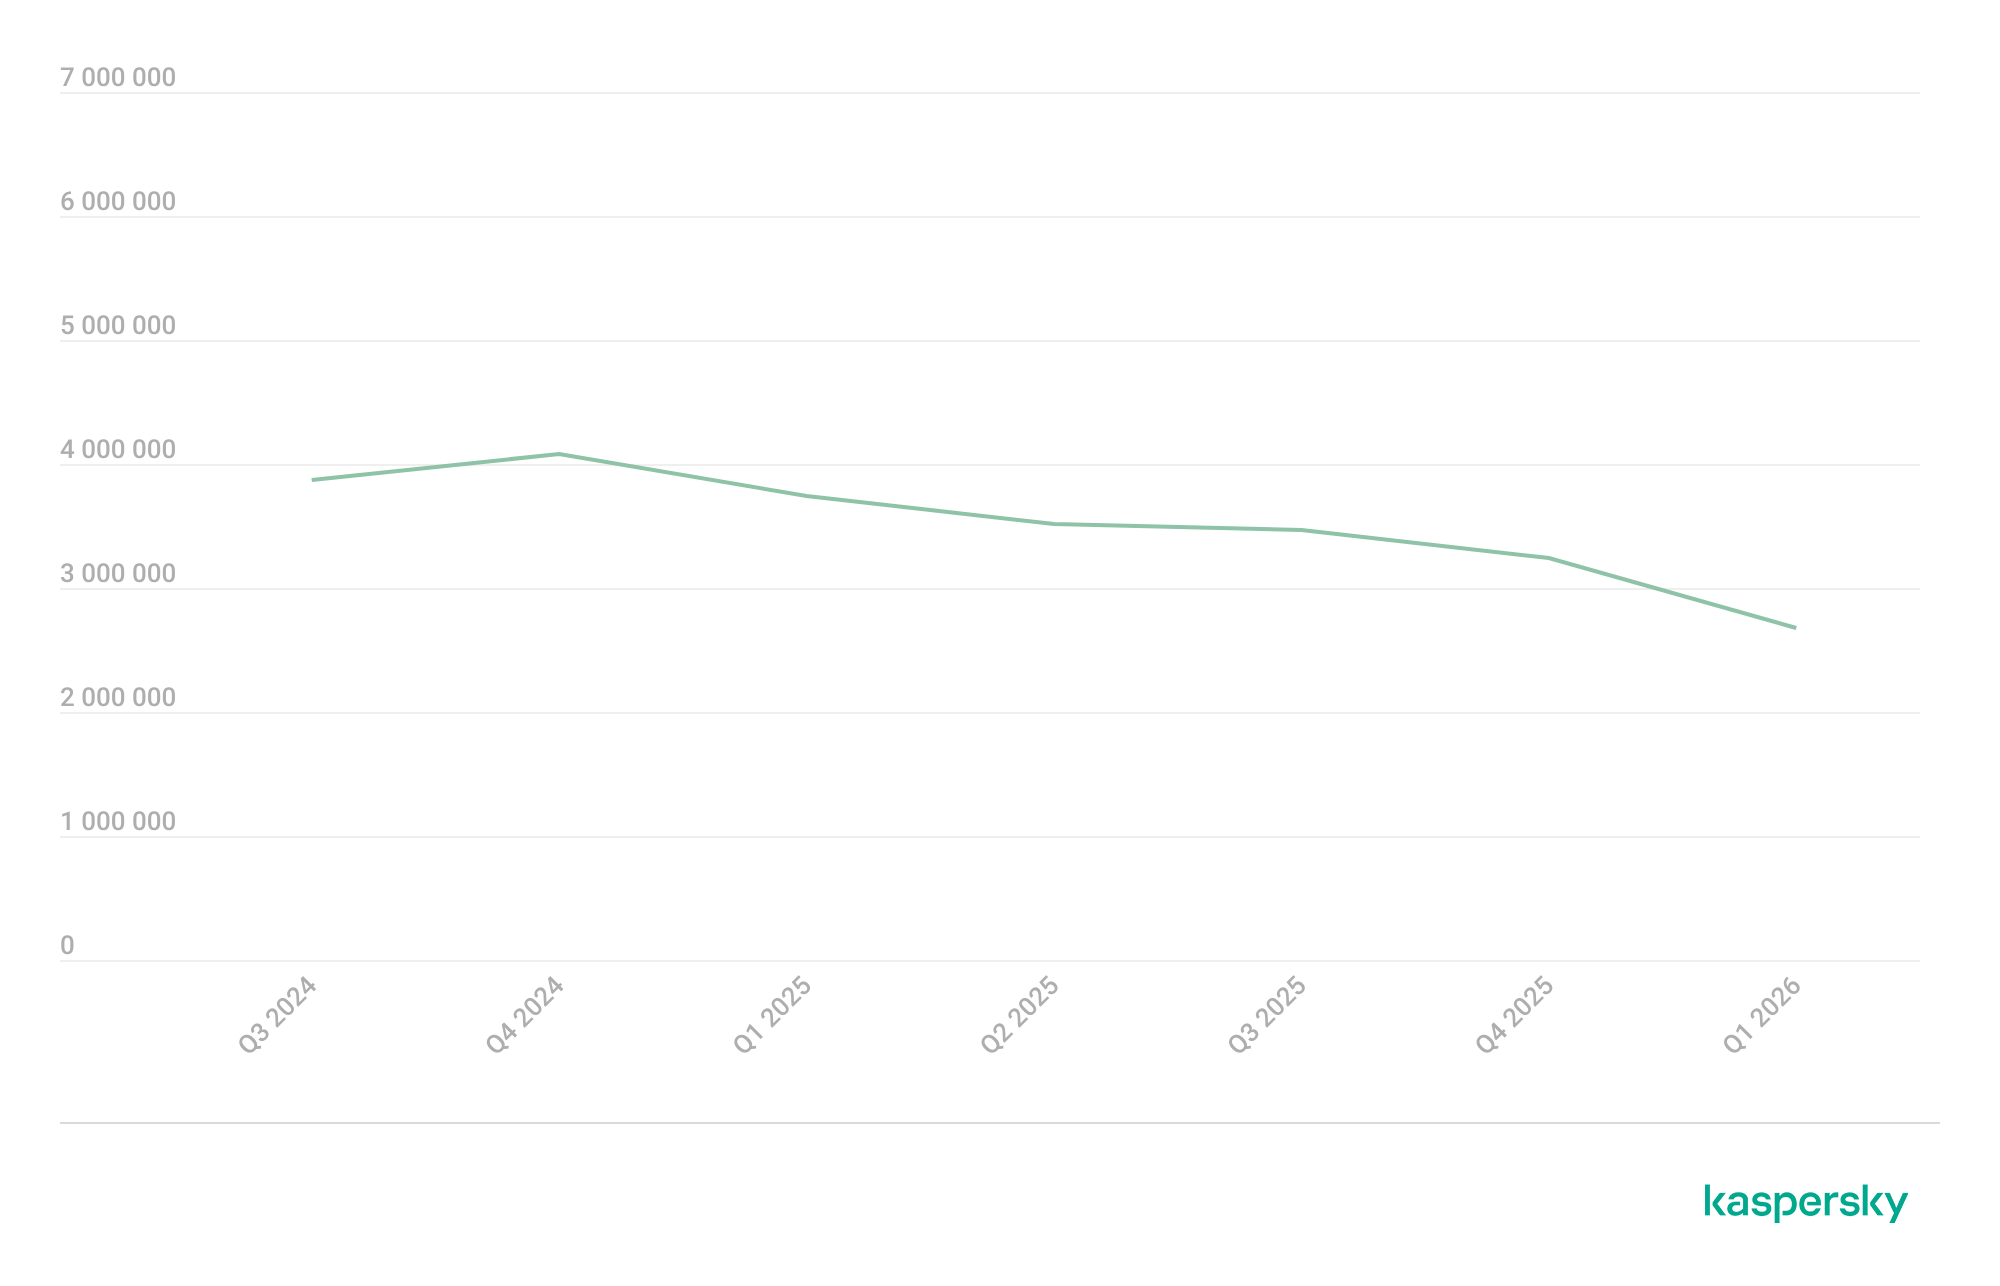
The number of malware, adware, or unwanted software attacks on mobile devices decreased to 2,676,328 in Q1, down from 3,239,244 in the previous quarter.
Attacks on users of Kaspersky mobile solutions, Q3 2024 — Q1 2026 (download)
The overall drop in attack volume stems primarily from a reduction in adware and RiskTool detections. Nonetheless, this trend does not equate to a lower risk for mobile users. As shown later in this report, the number of unique users targeted by these threats remained relatively stable.
In Q1, Synthient researchers identified a link between the notorious Kimwolf botnet and the IPIDEA proxy network. This network was later taken down in cooperation with GTIG.
In early 2026, we discovered several apps on Google Play and the App Store that contained a new version of the SparkCat crypto stealer.
The Trojan code, meticulously concealed, was embedded into the infected Android apps. The obfuscated malicious Rust library was decrypted using a Dalvik-like virtual machine custom-built by the attackers. The iOS version of the malware also underwent several changes; specifically, the attackers began leveraging Apple’s proprietary Vision framework for optical character recognition (OCR).
Mobile threat statistics
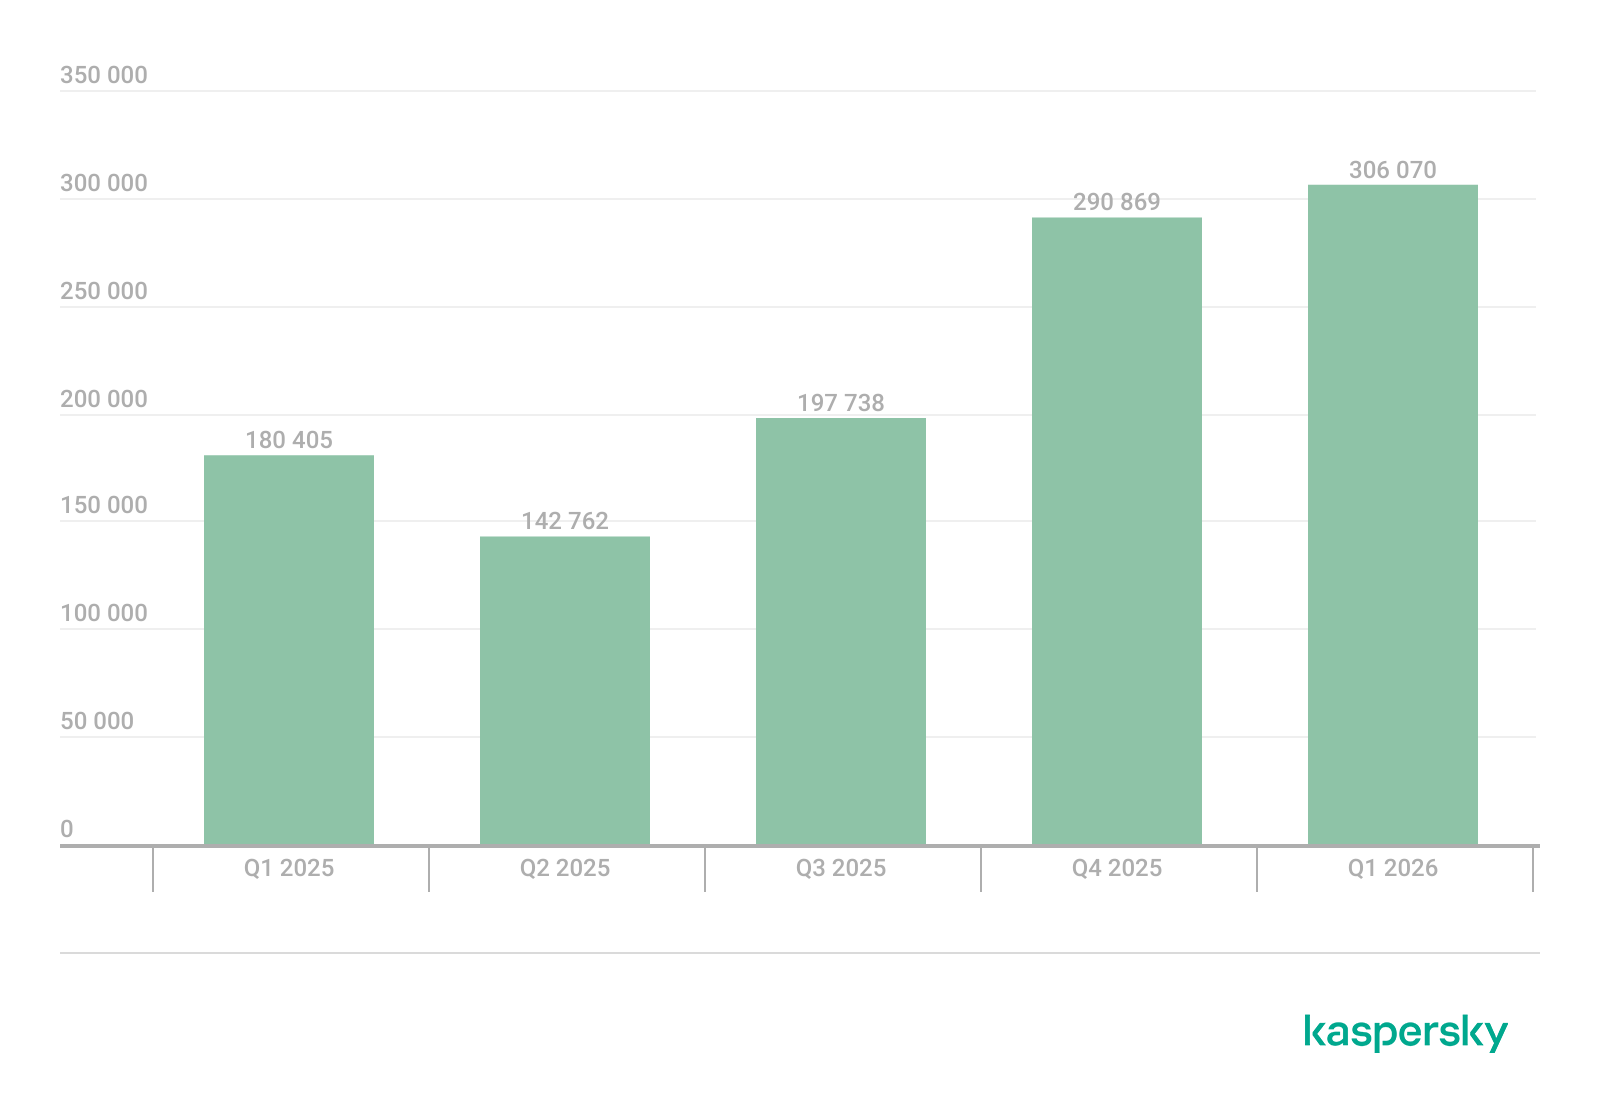
The number of Android malware samples saw a slight increase compared to Q4 2025, reaching a total of 306,070.
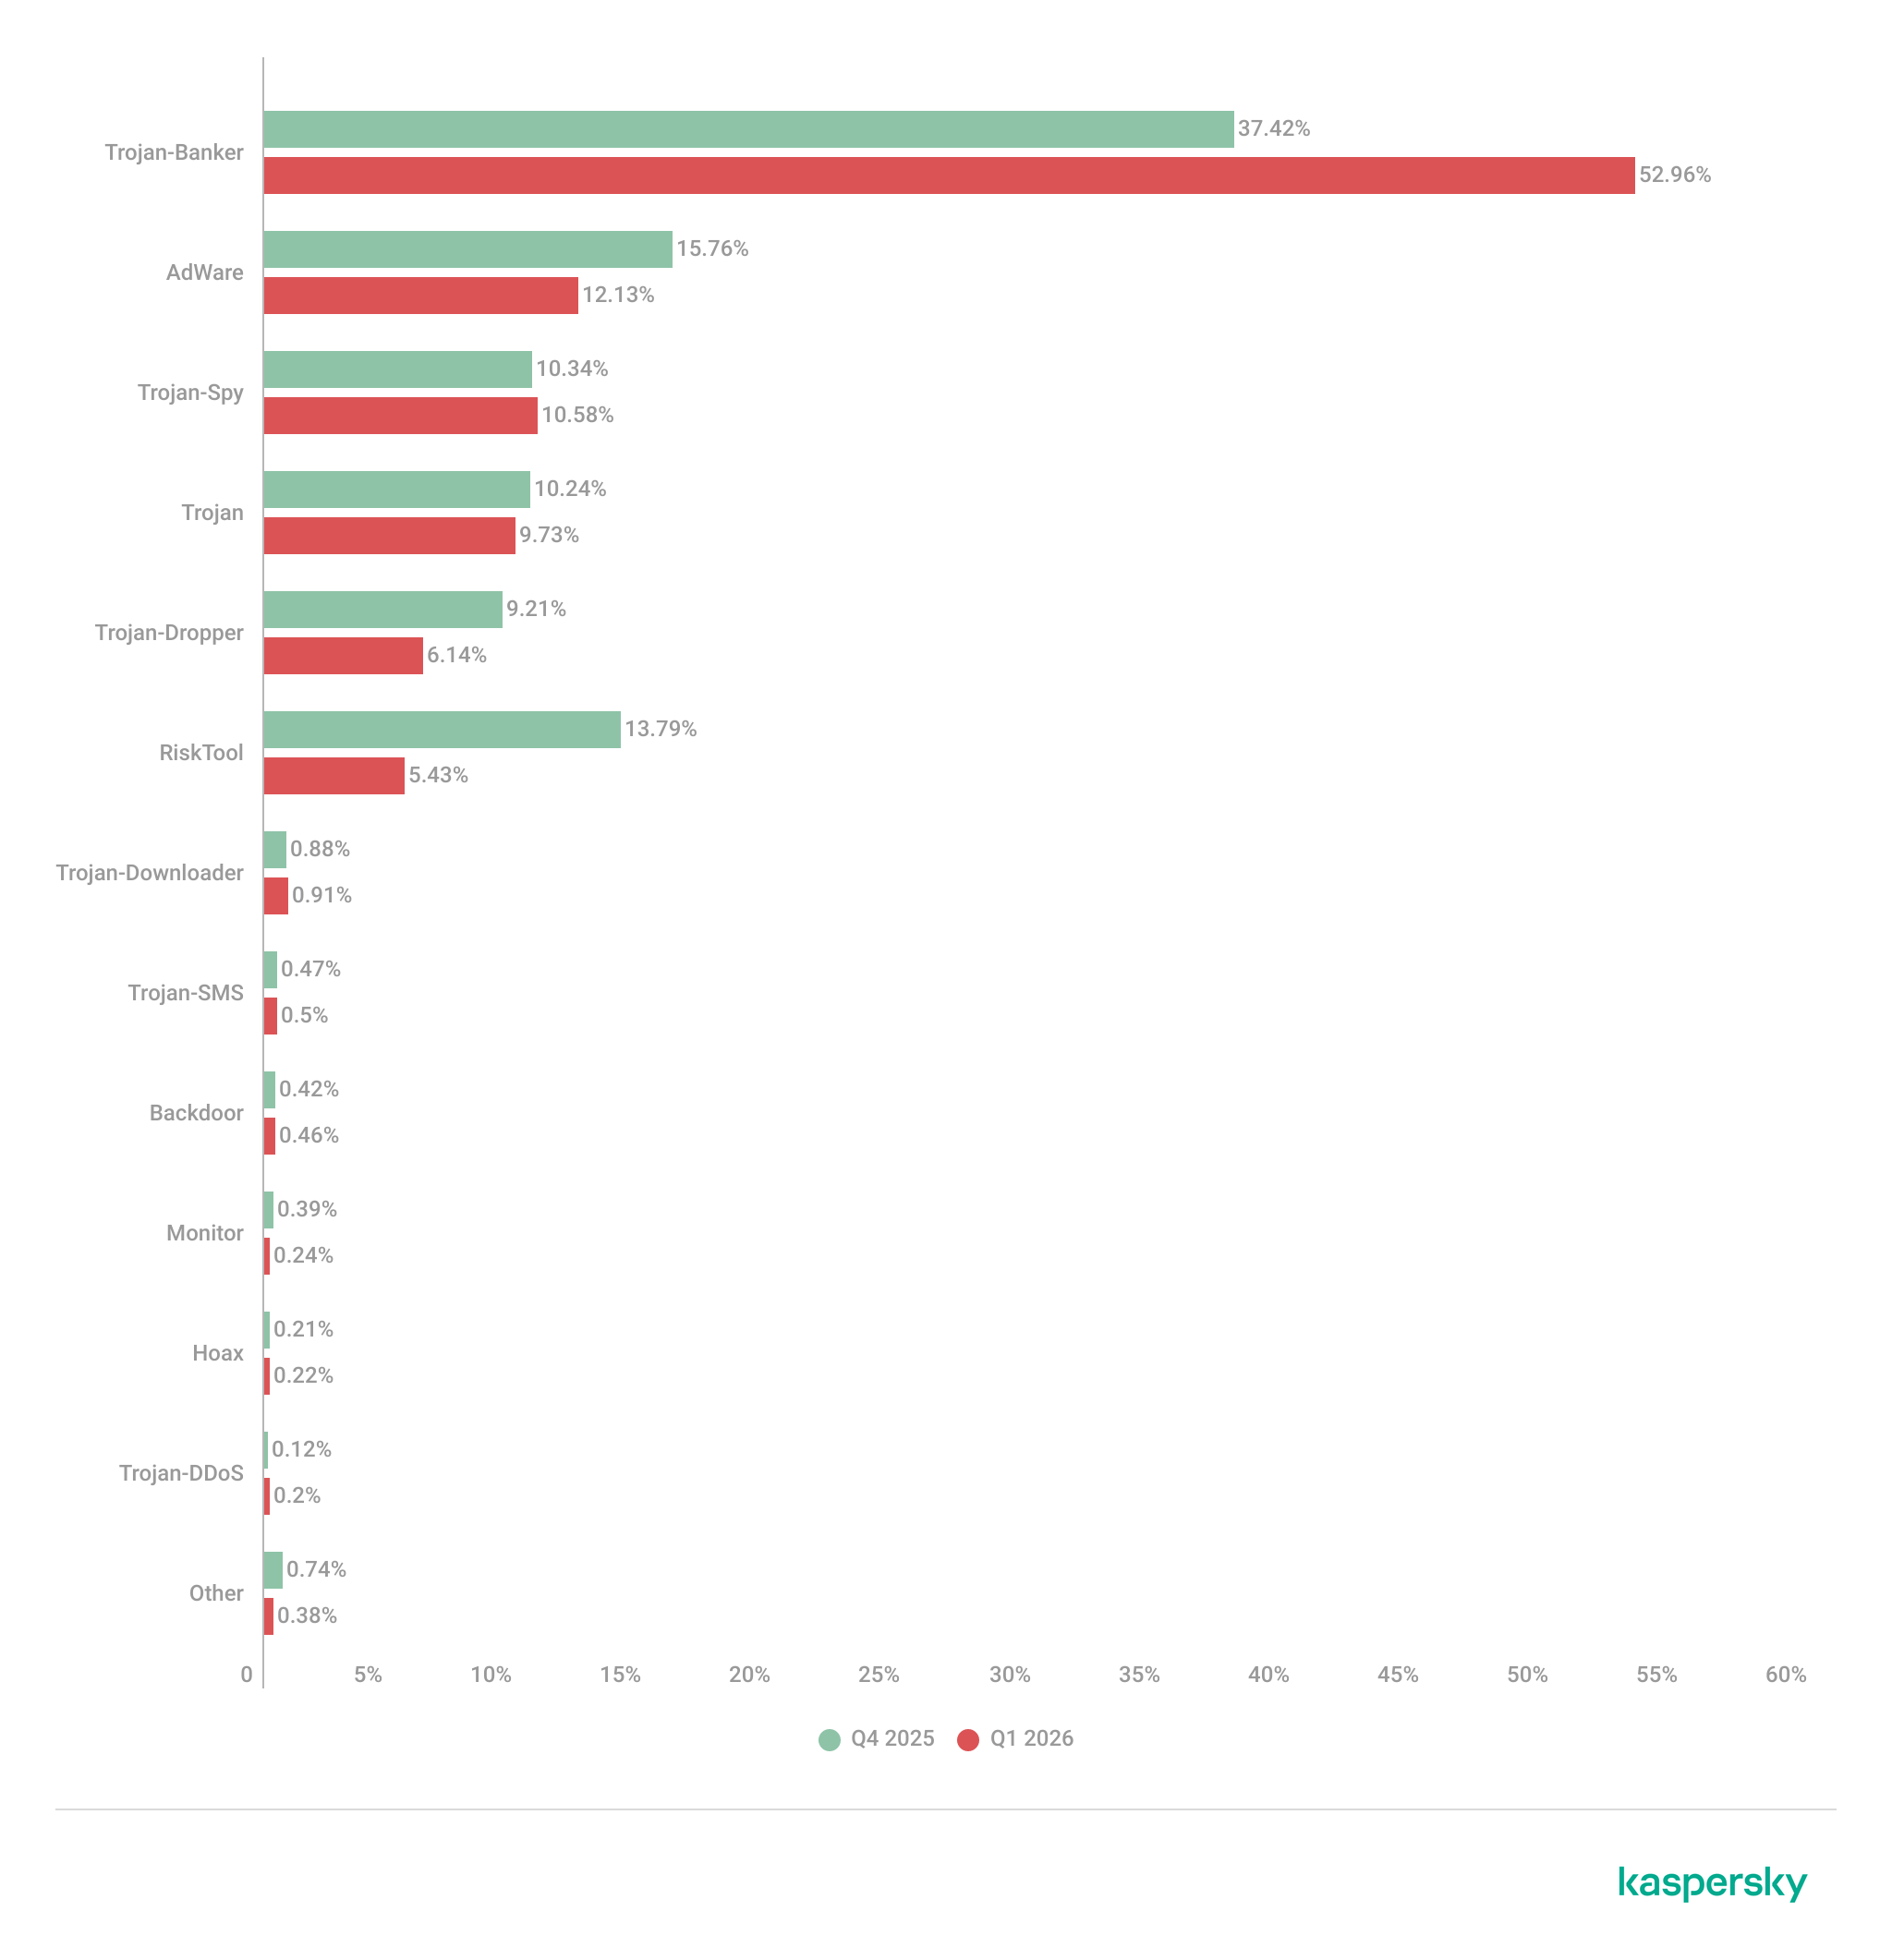
The detected installation packages were distributed by type as follows:
Detected mobile apps by type, Q4 2025* — Q1 2026 (download)
* Data for the previous quarter may differ slightly from previously published figures due to certain verdicts being retrospectively revised.
Threat actors once again ramped up the production of new banking Trojans; as a result, this category overtook all others in volume, accounting for more than half of all installation packages.
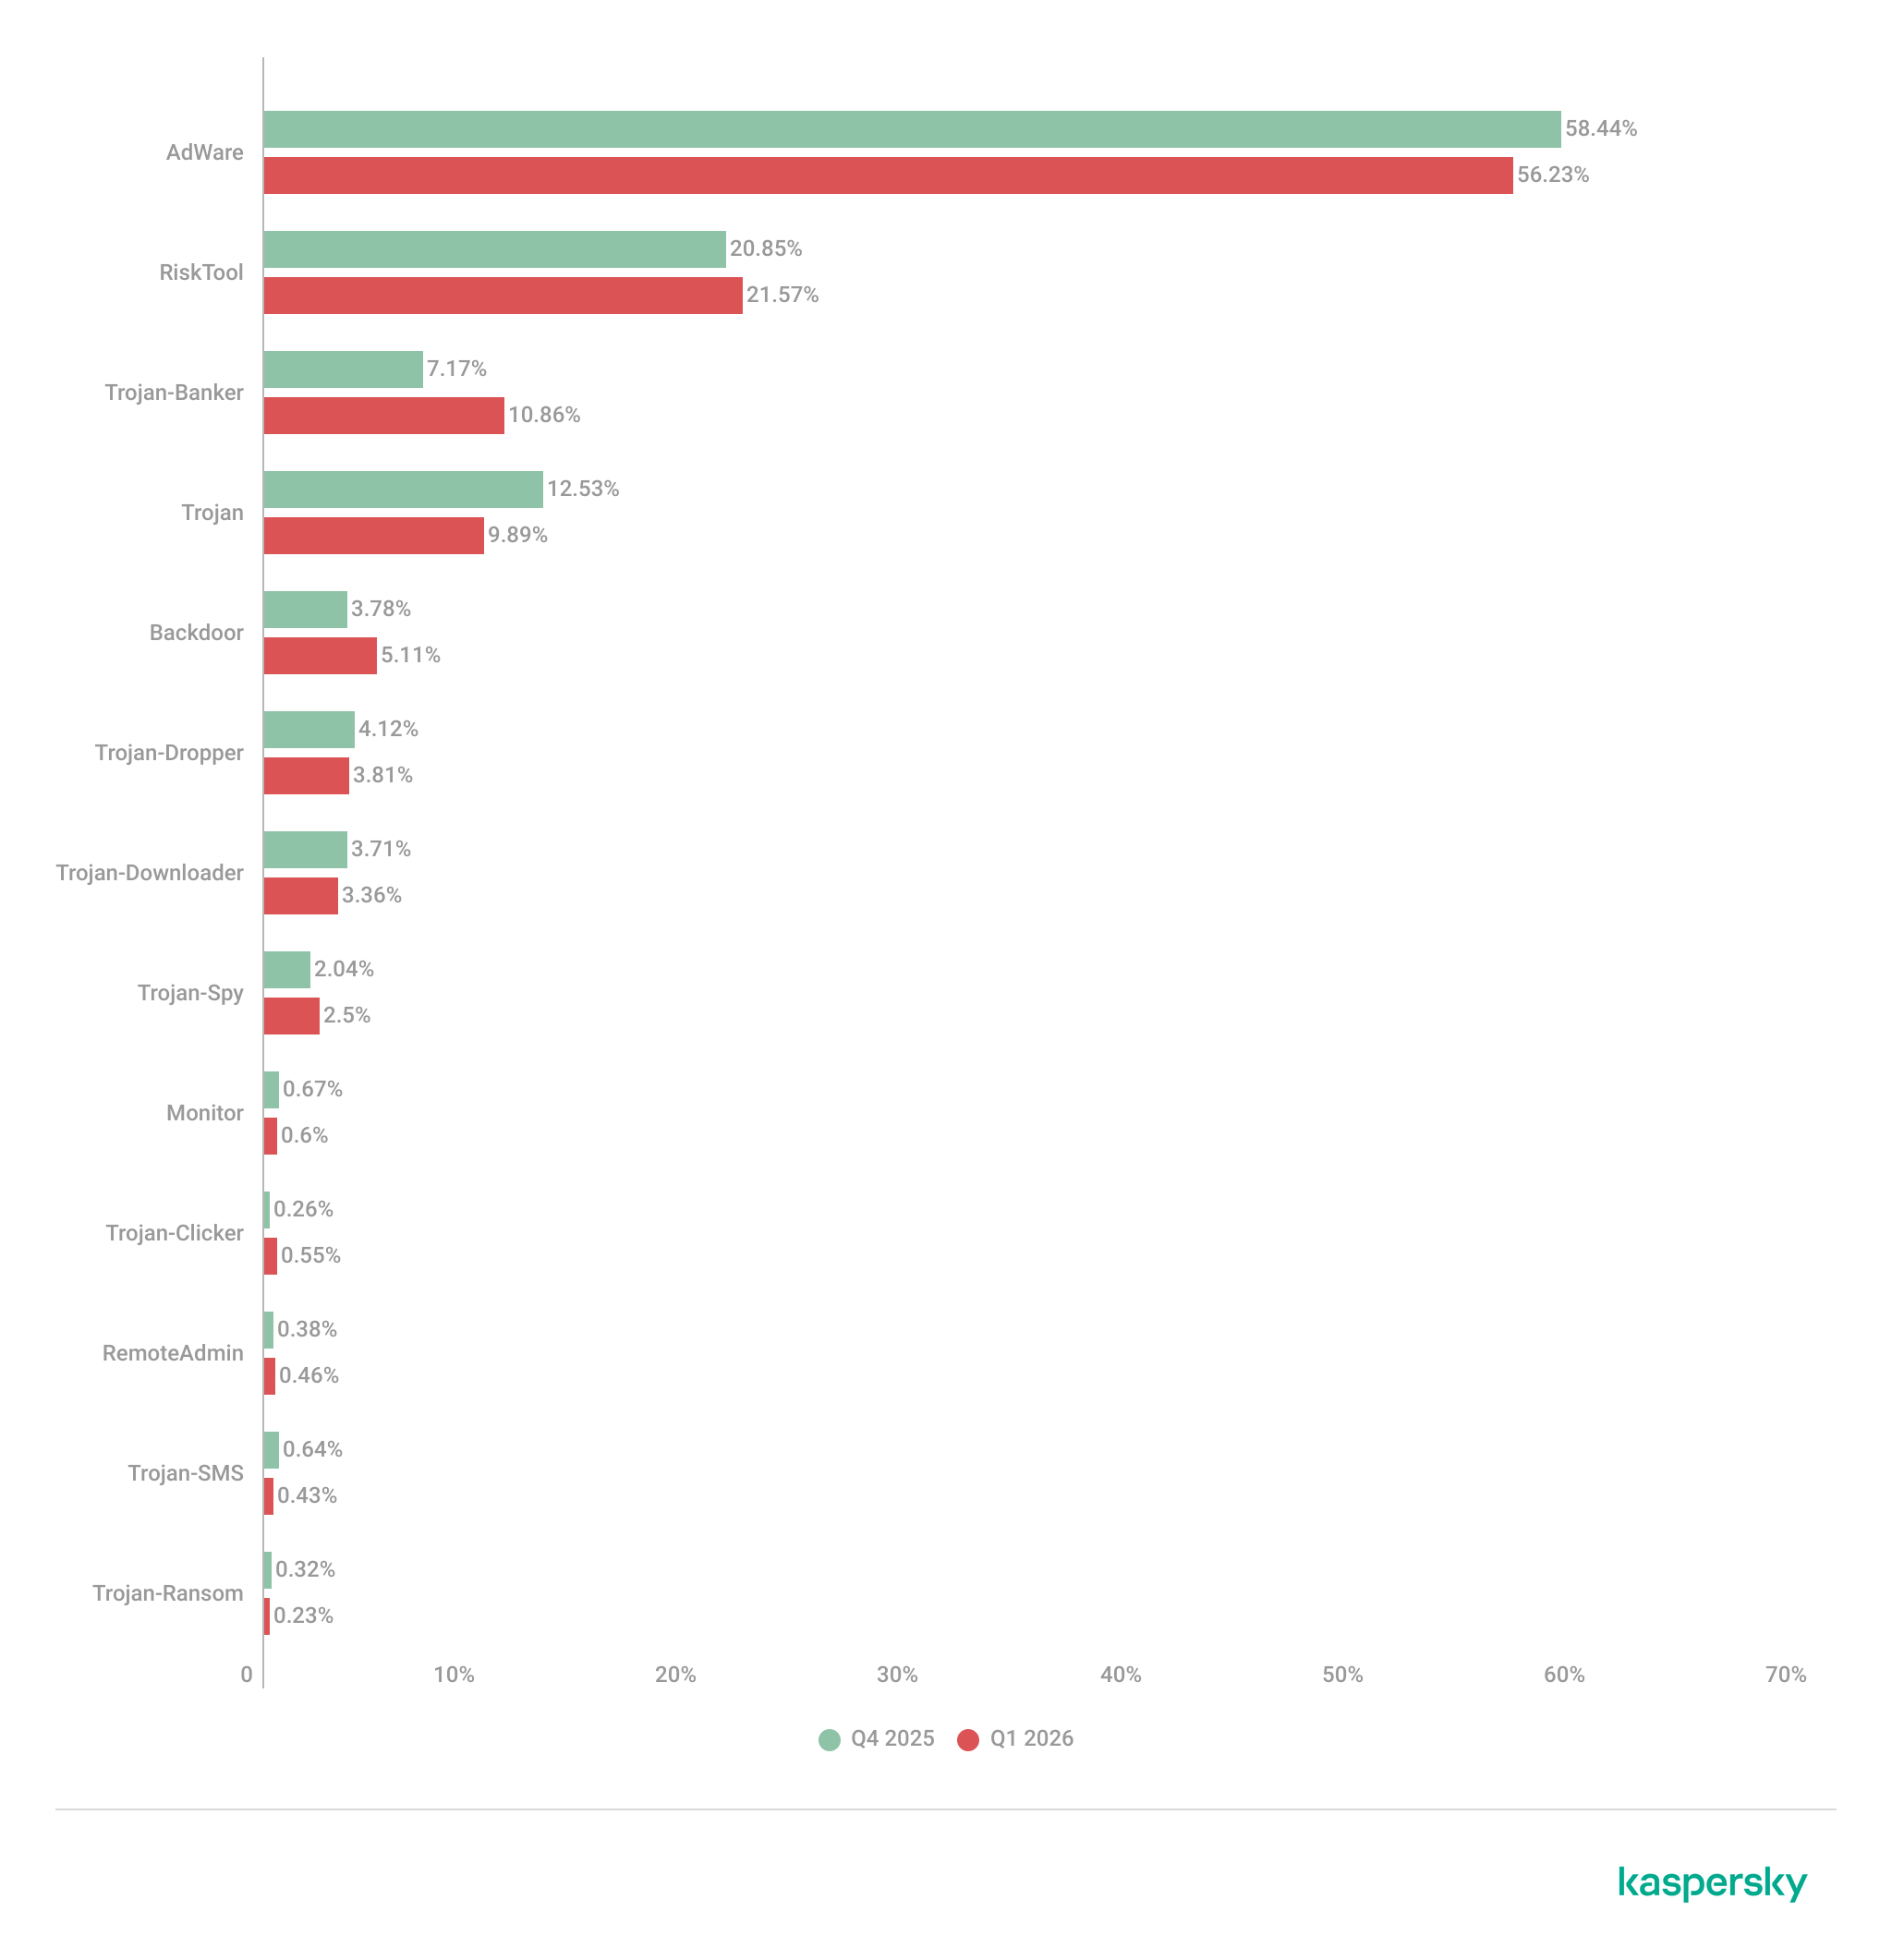
Share* of users attacked by the given type of malicious or potentially unwanted app out of all targeted users of Kaspersky mobile products, Q4 2025 — Q1 2026 (download)
* The total percentage may exceed 100% if the same users encountered multiple attack types.
Following the surge in banking Trojan installation packages, the number of associated attacks also rose, causing Trojan-Banker apps to climb one spot in terms of their share of targeted users. Mamont variants emerged as the most prevalent banking Trojans, accounting for 73.5% of detections, with the rest of the users encountering Faketoken, Rewardsteal, Creduz, and other families.
Yet banking Trojans were still outpaced by adware and RiskTool-type unwanted apps when measured by the total number of affected users. Despite a decrease in their share of installation packages, these two app types retained their positions as the top two threats by attack volume. The most common adware detections involved HiddenAd (44.9%) and MobiDash (38.1%), while most frequently seen RiskTool apps were Revpn (67%) and SpyLoan (20.5%).
TOP 20 most frequently detected types of mobile malware
Note that the malware rankings below exclude riskware or potentially unwanted software, such as RiskTool or adware.
Verdict
%* Q4 2025
%* Q1 2026
Difference in p.p.
Change in ranking
Backdoor.AndroidOS.Triada.ag
2.62
7.09
+4.48
+10
DangerousObject.Multi.Generic.
6.75
5.84
-0.92
-1
DangerousObject.AndroidOS.GenericML.
3.52
5.51
+1.99
+6
Trojan-Banker.AndroidOS.Mamont.jo
0.00
5.28
+5.28
Trojan.AndroidOS.Fakemoney.v
5.40
3.44
-1.96
-1
Trojan-Downloader.AndroidOS.Keenadu.l
0.00
3.35
+3.35
Trojan-Banker.AndroidOS.Mamont.jx
0.00
3.09
+3.09
Backdoor.AndroidOS.Triada.z
4.87
3.08
-1.79
-2
Trojan.AndroidOS.Triada.fe
5.01
2.98
-2.02
-4
Backdoor.AndroidOS.Keenadu.a
2.07
2.73
+0.66
+6
Trojan-Banker.AndroidOS.Mamont.jg
0.34
2.37
+2.03
Trojan.AndroidOS.Triada.hf
2.15
2.23
+0.07
+3
Trojan.AndroidOS.Boogr.gsh
2.35
2.15
-0.20
0
Trojan.AndroidOS.Triada.ii
5.68
2.07
-3.60
-11
Backdoor.AndroidOS.Triada.ae
1.91
1.76
-0.16
+3
Backdoor.AndroidOS.Triada.ab
1.79
1.72
-0.08
+3
Trojan.AndroidOS.Triada.gn
2.38
1.58
-0.80
-5
Trojan-Banker.AndroidOS.Mamont.gg
1.56
1.50
-0.06
+2
Trojan.AndroidOS.Triada.ga
1.48
1.50
+0.01
+4
Backdoor.AndroidOS.Triada.ad
0.53
1.40
+0.87
+44
* Unique users who encountered this malware as a percentage of all attacked users of Kaspersky mobile solutions.
The pre-installed Triada.ag backdoor rose to the top spot; it is similar to the older Triada.z version we documented previously. Because the same variant was pre-installed across a wide range of devices, the total number of affected users is aggregated. Consequently, Triada outpaced even Mamont, as users encountered a variety of Mamont variants, causing the share of that banking Trojan to spread across multiple rows. Other pre-installed Triada variants (Triada.z, Triada.ae, Triada.ab, and Triada.ad) also made the rankings. Furthermore, we observed increasing activity from the Keenadu.a backdoor, while diverse variants of the embedded Triada Trojan remained in the rankings.
Mobile banking Trojans
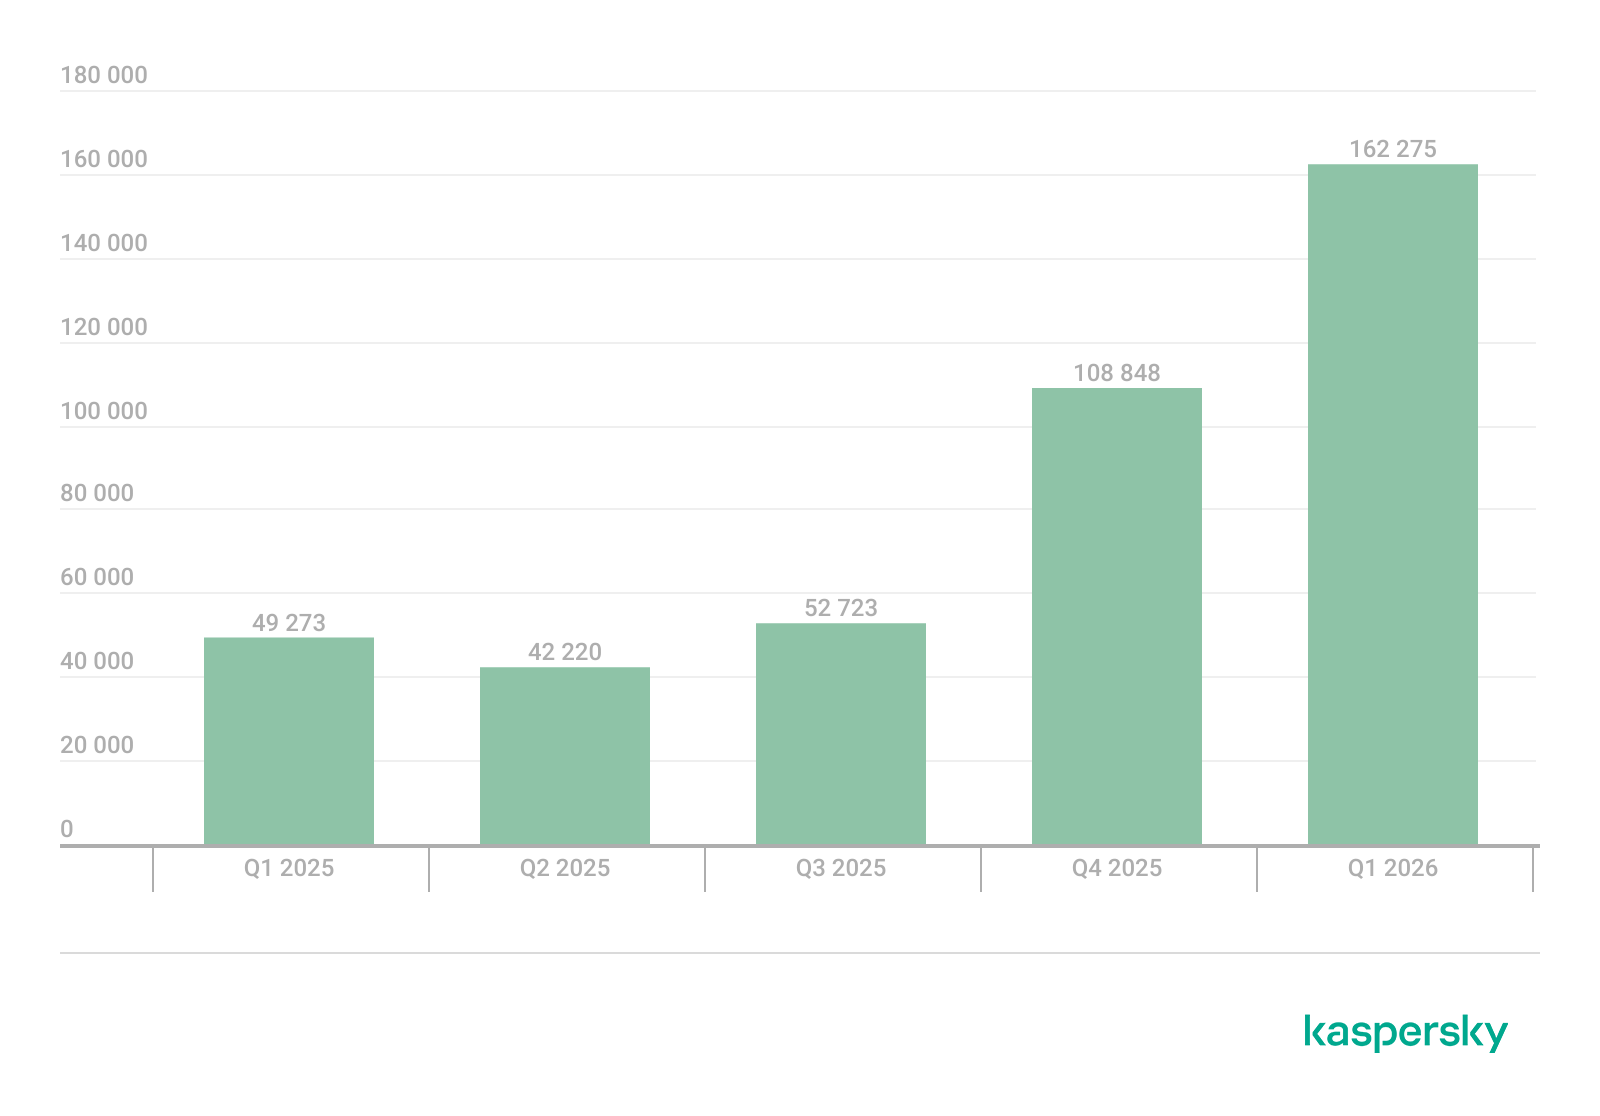
Q1 2026 saw a characteristic rise in mobile banking Trojan activity, with the number of packages totaling 162,275, a 50% increase compared to the prior quarter.
Number of installation packages for mobile banking Trojans detected by Kaspersky, Q1 2025 — Q1 2026 (download)
We saw a similar growth in the previous quarter, with banking Trojan volumes rising by 50% during that period as well. Various Mamont variants accounted for the absolute majority of packages and represented nearly every entry in the rankings of most frequent banking Trojans by affected user count.
TOP 10 mobile bankers
Verdict
%* Q4 2025
%* Q1 2026
Difference in p.p.
Change in ranking
Trojan-Banker.AndroidOS.Mamont.jo
0.00
15.75
+15.75
Trojan-Banker.AndroidOS.Mamont.jx
0.00
9.22
+9.22
Trojan-Banker.AndroidOS.Mamont.jg
1.47
7.08
+5.61
+24
Trojan-Banker.AndroidOS.Mamont.gg
6.79
4.48
-2.32
-3
Trojan-Banker.AndroidOS.Mamont.ks
0.00
3.98
+3.98
Trojan-Banker.AndroidOS.Agent.ws
6.03
3.78
-2.25
-2
Trojan-Banker.AndroidOS.Mamont.hl
4.30
3.27
-1.03
+1
Trojan-Banker.AndroidOS.Mamont.iv
6.00
3.08
-2.92
-3
Trojan-Banker.AndroidOS.Mamont.jb
3.93
3.07
-0.86
+1
Trojan-Banker.AndroidOS.Mamont.jv
0.00
2.79
+2.79
* Unique users who encountered this malware as a percentage of all users of Kaspersky mobile security solutions who encountered banking threats.
The statistics in this report are based on detection verdicts returned by Kaspersky products unless otherwise stated. The information was provided by Kaspersky users who consented to sharing statistical data.
Quarterly figures
In Q1 2026:
Kaspersky products blocked more than 343 million attacks that originated with various online resources.
Web Anti-Virus responded to 50 million unique links.
File Anti-Virus blocked nearly 15 million malicious and potentially unwanted objects.
2938 new ransomware variants were detected.
More than 77,000 users experienced ransomware attacks.
14% of all ransomware victims whose data was published on threat actors’ data leak sites (DLS) were victims of Clop.
More than 260,000 users were targeted by miners.
Ransomware
Quarterly trends and highlights
Law enforcement success
In January 2026, it was reported that the FBI had seized the domains of the RAMP cybercrime forum, a major platform used extensively by ransomware developers to advertise their RaaS programs and to recruit affiliates. There has been no official statement from the FBI, nor is it clear if RAMP servers were seized. In a post on an external website, a RAMP moderator mentioned law enforcement agencies gaining control over the forum. The takedown disrupted a key element of the RaaS ecosystem, creating ripple effects for ransomware operators, affiliates, and initial access brokers.
A man suspected of links to the Phobos group was apprehended in Poland. He was charged with the creation, acquisition, and distribution of software designed for unlawfully obtaining information, including data that facilitates unauthorized access to information stored within a computer system.
In March, a Phobos ransomware administrator pleaded guilty to the creation and distribution of the Trojan, which had been used in international attacks dating back to at least November 2020.
In March, the U.S. Department of Justice charged a man who had acted as a negotiator for ransomware groups. The company he worked for specializes in cyberincident investigations. The prosecution alleges the suspect colluded with the BlackCat threat actor to share privileged insights into the ongoing progress of negotiations. Additionally, the suspect is alleged to have had a prior direct role in BlackCat attacks, serving as an affiliate for the RaaS operation.
In a separate development this March, a U.S. court sentenced an initial access broker associated with the Yanluowang ransomware group to 81 months of imprisonment. According to the U.S. Department of Justice, the convict facilitated dozens of ransomware attacks across the United States, resulting in over $9 million in actual loss and more than $24 million in intended loss.
Vulnerabilities and attacks
The Interlock group has been heavily exploiting the CVE-2026-20131 zero-day vulnerability in Cisco Secure FMC firewall management software since at least January 26, 2026. The vulnerability enabled arbitrary Java code execution with root privileges on the affected device. This campaign demonstrates the ongoing reliance on zero-day vulnerabilities for initial access, a focus on network appliances as high-value entry points, and the rapid weaponization of new vulnerabilities within the ransomware ecosystem.
The most prolific groups
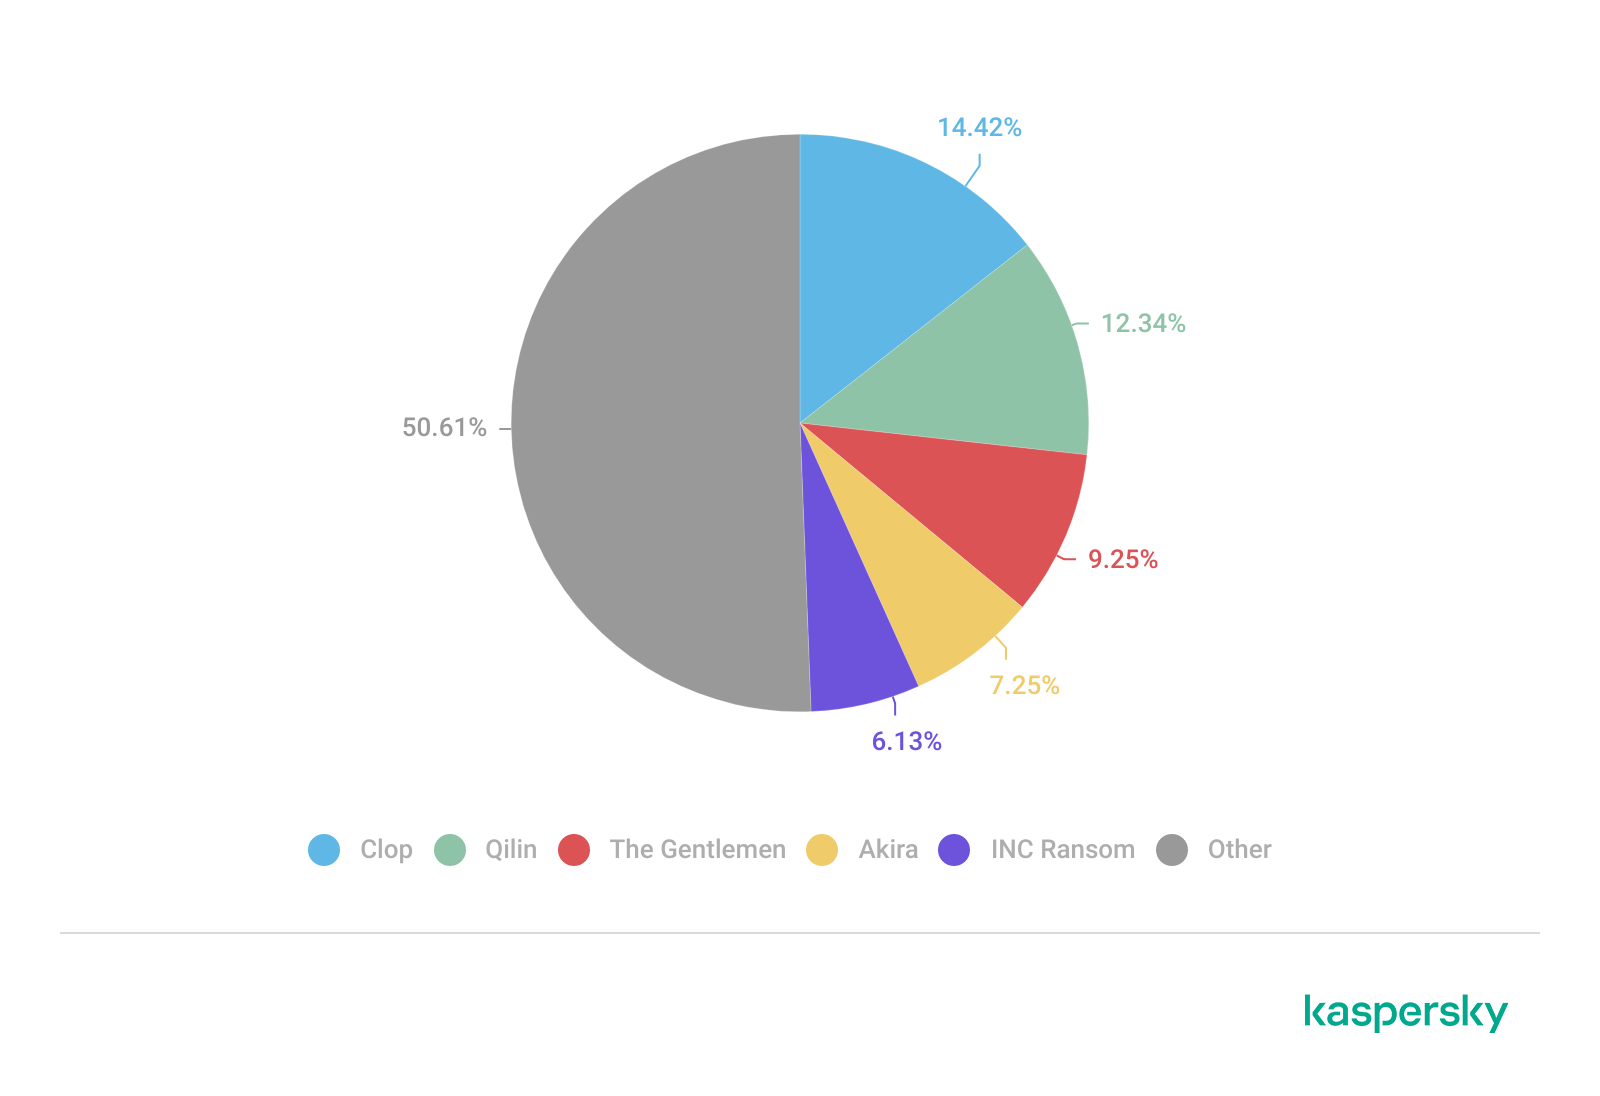
This section highlights the most prolific ransomware gangs by number of victims added to each group’s DLS. This quarter, the Clop ransomware (14.42%) returned to the top of the rankings, displacing Qilin (12.34%), which had held the leading position in the previous reporting period. Following closely is a new threat actor, The Gentlemen (9.25%). Emerging no later than July 2025, the group had already surpassed the activity levels of mainstays such as Akira (7.25%) and INC Ransom (6.13%).
Number of each group’s victims according to its DLS as a percentage of all groups’ victims published on all the DLSs under review during the reporting period (download)
Number of new variants
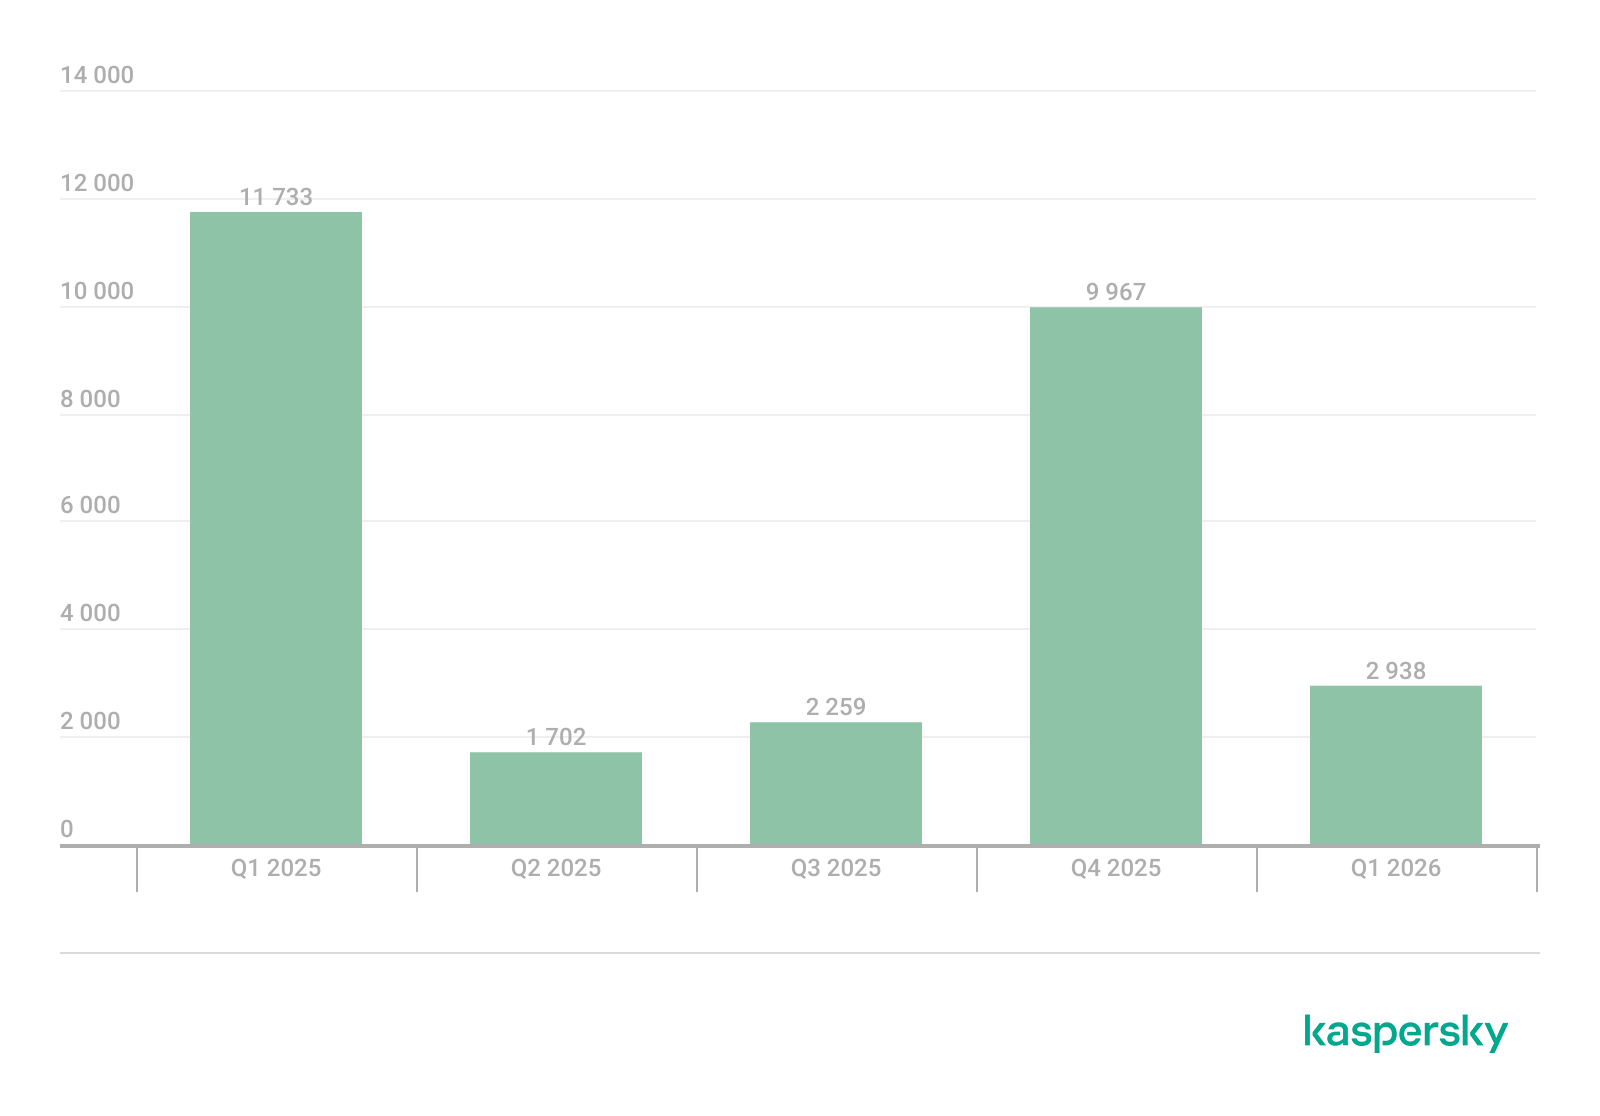
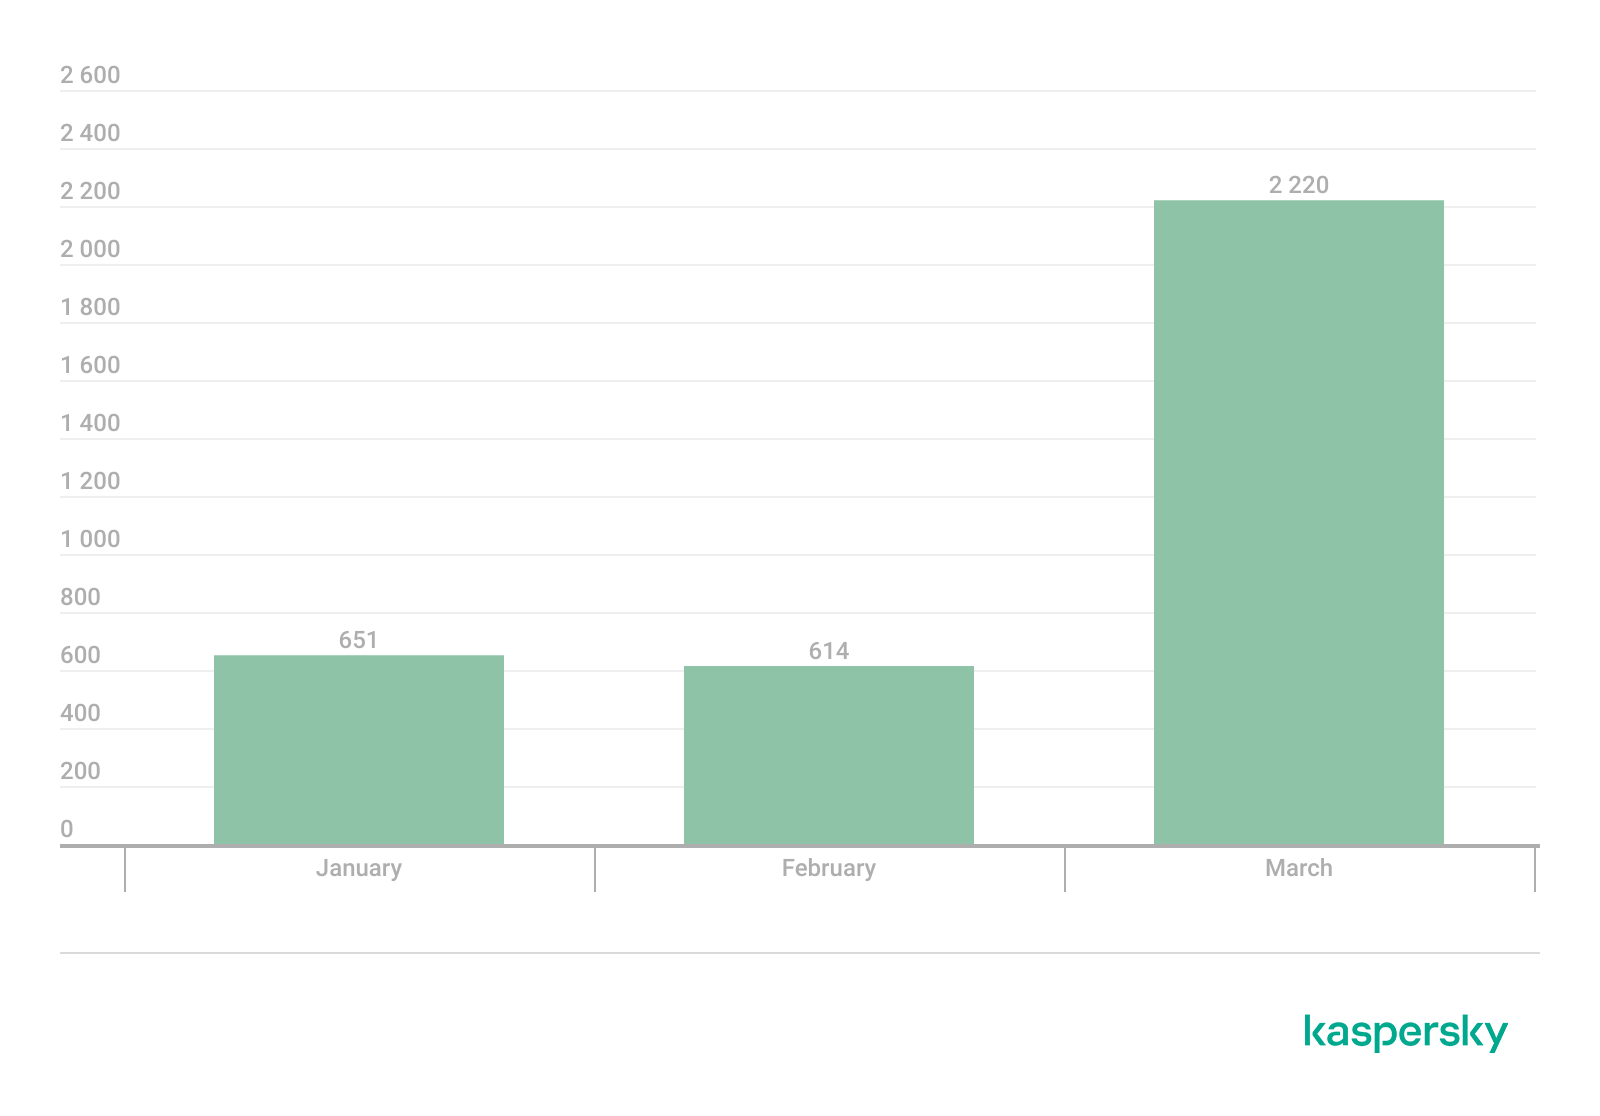
In Q1 2026, Kaspersky solutions detected six new ransomware families and 2938 new modifications. Volumes have returned to Q3 2025 levels following a surge in Q4 2025.
Number of new ransomware modifications, Q1 2025 — Q1 2026 (download)
Number of users attacked by ransomware Trojans
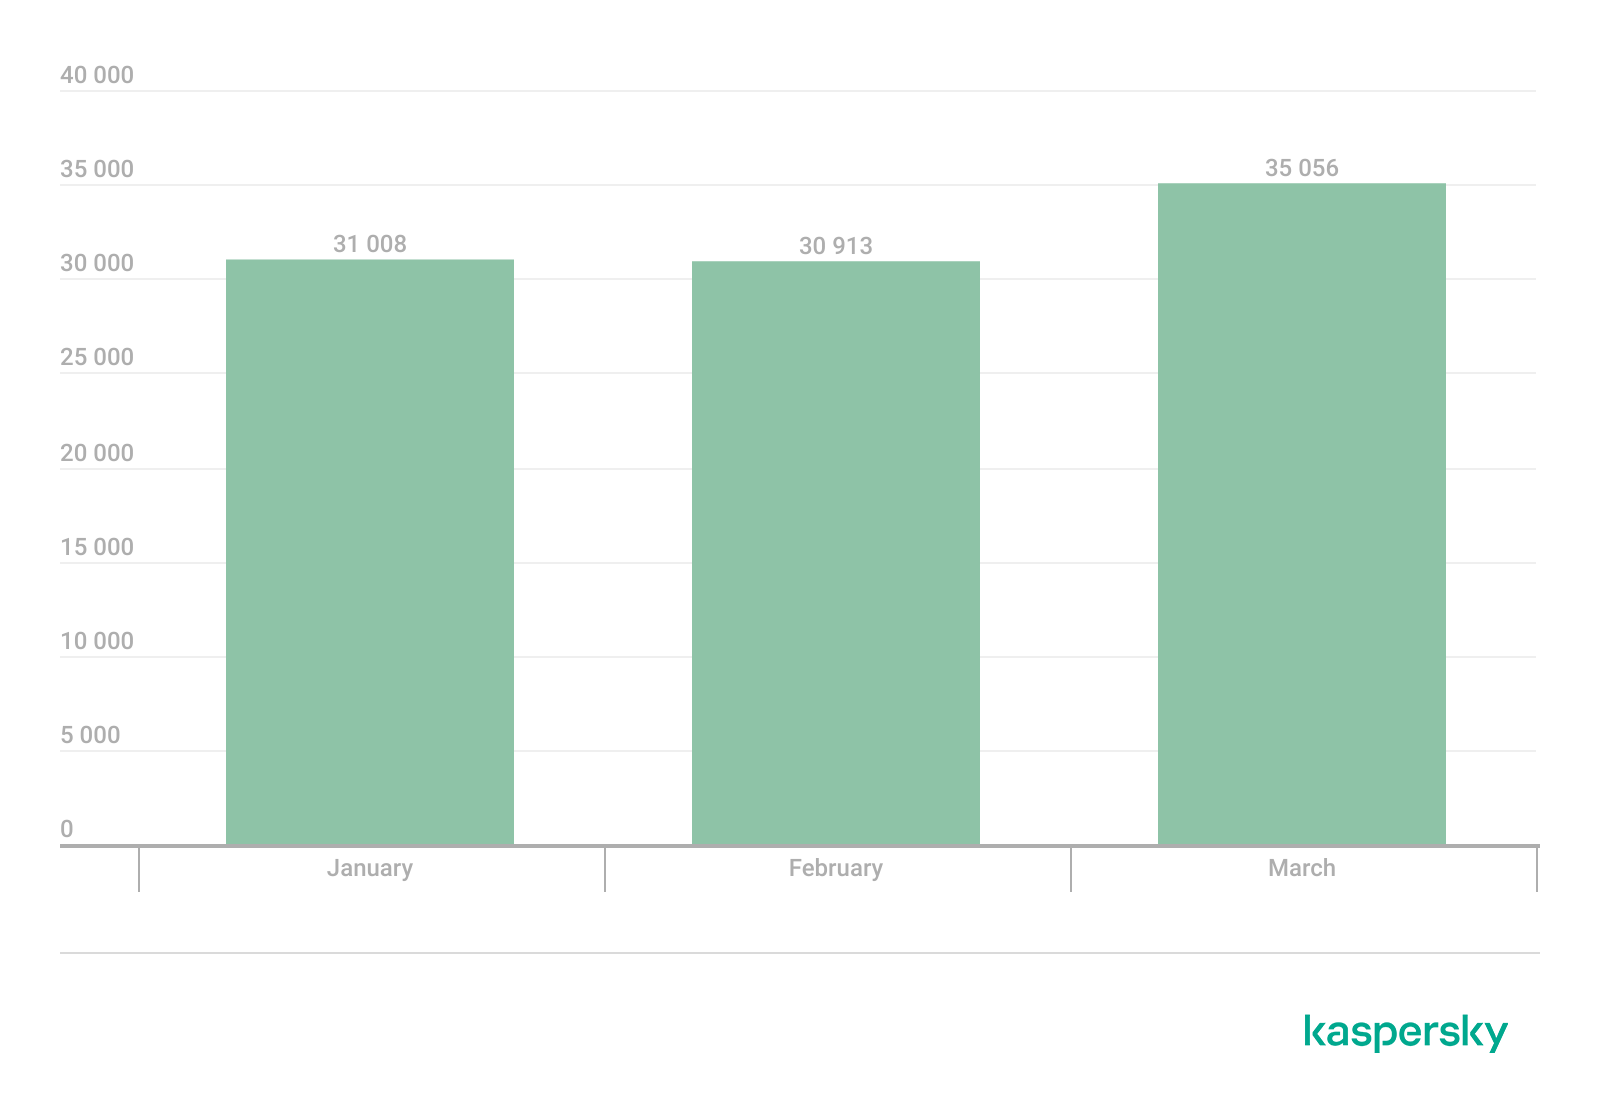
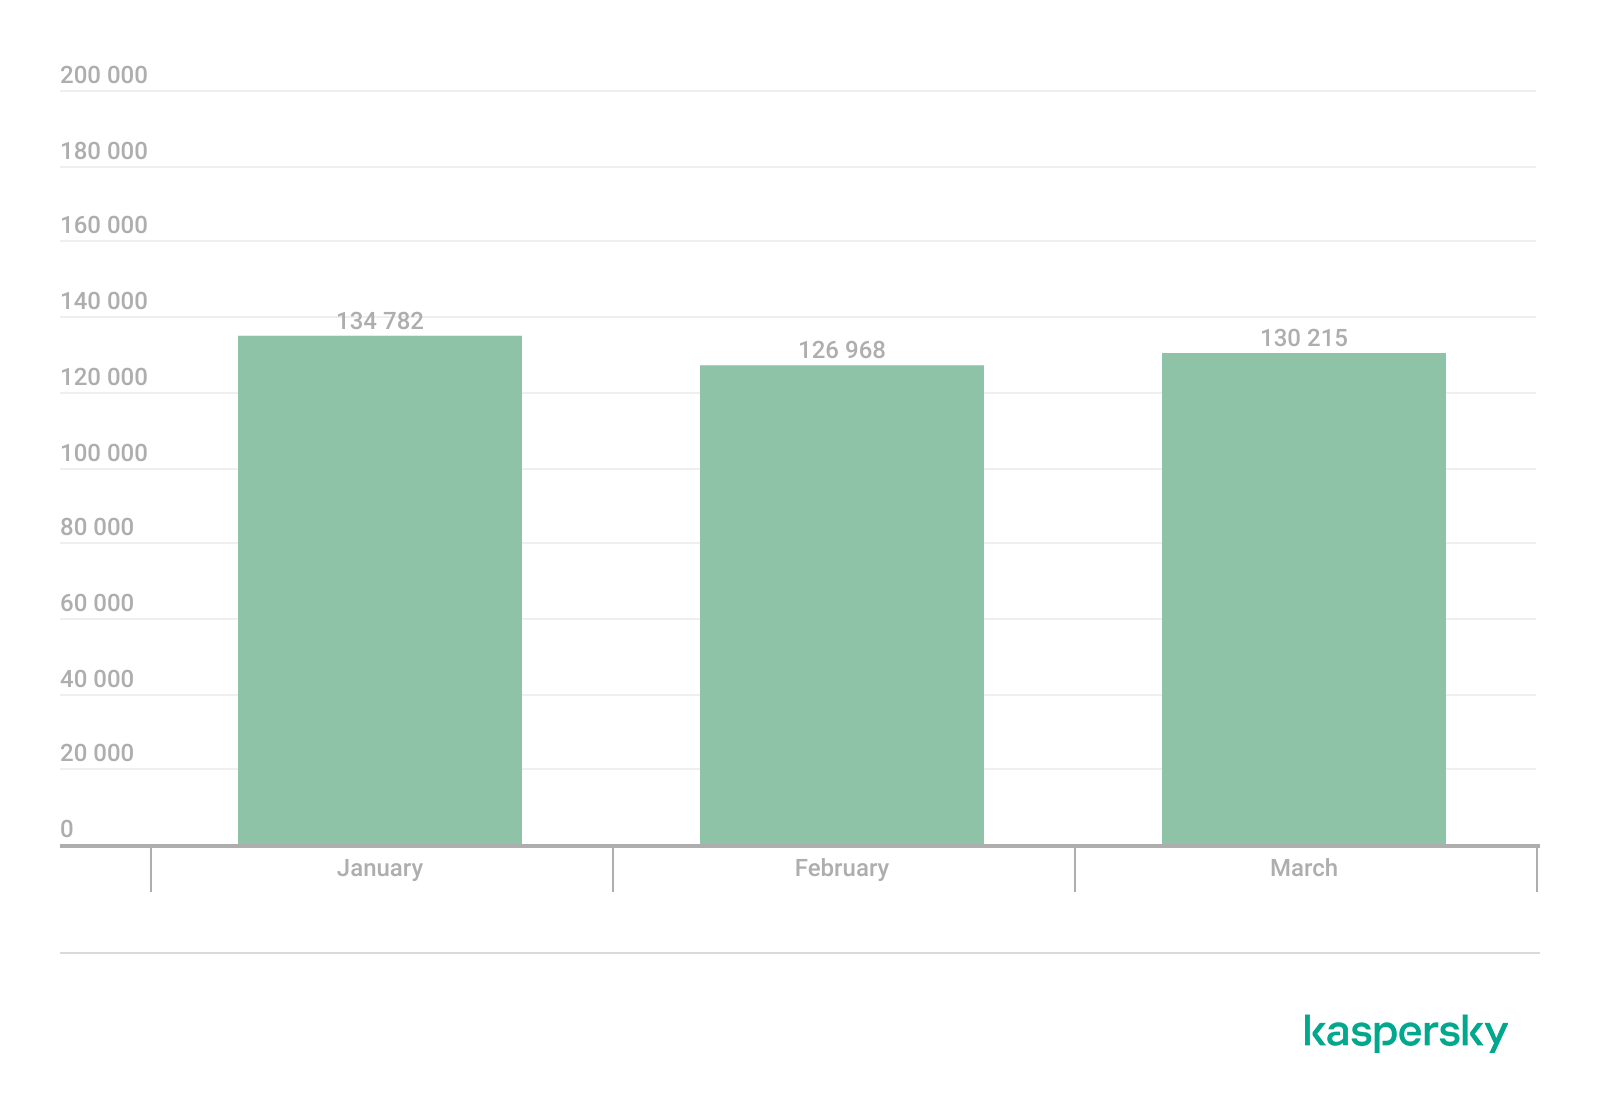
Throughout Q1, our solutions protected 77,319 unique users from ransomware. Ransomware activity was highest in March, with 35,056 unique users encountering such attacks during the month.
Number of unique users attacked by ransomware Trojans, Q1 2026 (download)
Attack geography
TOP 10 countries and territories attacked by ransomware Trojans
Country/territory*
%**
1
Pakistan
0.79
2
South Korea
0.64
3
China
0.52
4
Tajikistan
0.40
5
Libya
0.38
6
Turkmenistan
0.36
7
Iraq
0.35
8
Bangladesh
0.33
9
Rwanda
0.30
10
Cameroon
0.28
* Excluded are countries and territories with relatively few (under 50,000) Kaspersky users.
** Unique users whose computers were attacked by ransomware Trojans as a percentage of all unique users of Kaspersky products in the country/territory.
TOP 10 most common families of ransomware Trojans
Name
Verdict
%*
1
(generic verdict)
Trojan-Ransom.Win32.Gen
33.90
2
(generic verdict)
Trojan-Ransom.Win32.Crypren
6.38
3
WannaCry
Trojan-Ransom.Win32.Wanna
5.87
4
(generic verdict)
Trojan-Ransom.Win32.Encoder
4.68
5
(generic verdict)
Trojan-Ransom.Win32.Agent
3.80
6
LockBit
Trojan-Ransom.Win32.Lockbit
2.80
7
(generic verdict)
Trojan-Ransom.Win32.Phny
1.99
8
(generic verdict)
Trojan-Ransom.MSIL.Agent
1.96
9
(generic verdict)
Trojan-Ransom.Python.Agent
1.93
10
(generic verdict)
Trojan-Ransom.Win32.Crypmod
1.89
* Unique Kaspersky users attacked by the specific ransomware Trojan family as a percentage of all unique users attacked by this type of threat.
Miners
Number of new variants
In Q1 2026, Kaspersky solutions detected 3485 new modifications of miners.
Number of new miner modifications, Q1 2026 (download)
Number of users attacked by miners
In Q1, we detected attacks using miner programs on the computers of 260,588 unique Kaspersky users worldwide.
Number of unique users attacked by miners, Q1 2026 (download)
Attack geography
TOP 10 countries and territories attacked by miners
Country/territory*
%**
1
Senegal
3.19
2
Turkmenistan
3.06
3
Mali
2.63
4
Tanzania
1.62
5
Bangladesh
1.06
6
Ethiopia
0.95
7
Panama
0.88
8
Afghanistan
0.79
9
Kazakhstan
0.77
10
Bolivia
0.75
* Excluded are countries and territories with relatively few (under 50,000) Kaspersky users.
** Unique users whose computers were attacked by miners as a percentage of all unique users of Kaspersky products in the country/territory.
Attacks on macOS
In Q1 2026, Google uncovered a new cryptocurrency theft campaign. The scammers directed victims to a fraudulent video call, prompting them to execute malicious scripts under the guise of technical support fixes for connection problems.
In March, researchers with GTIG and iVerify reported the discovery of an in-the-wild exploit chain targeting both iOS and macOS devices. The exploit kit was apparently marketed on the dark web, providing threat actors with a suite of spyware capabilities alongside specialized cryptocurrency exfiltration modules. The exploit was delivered via drive-by downloads when victims visited various compromised websites. Our analysis confirmed that the toolkit included an updated version of a component previously identified in the Operation Triangulation attack chain.
Devices running macOS were similarly impacted by the high-profile supply chain attack targeting the Axios npm package, a widely used HTTP client for JavaScript. The installation of the infected package led to the deployment of a backdoor on macOS devices.
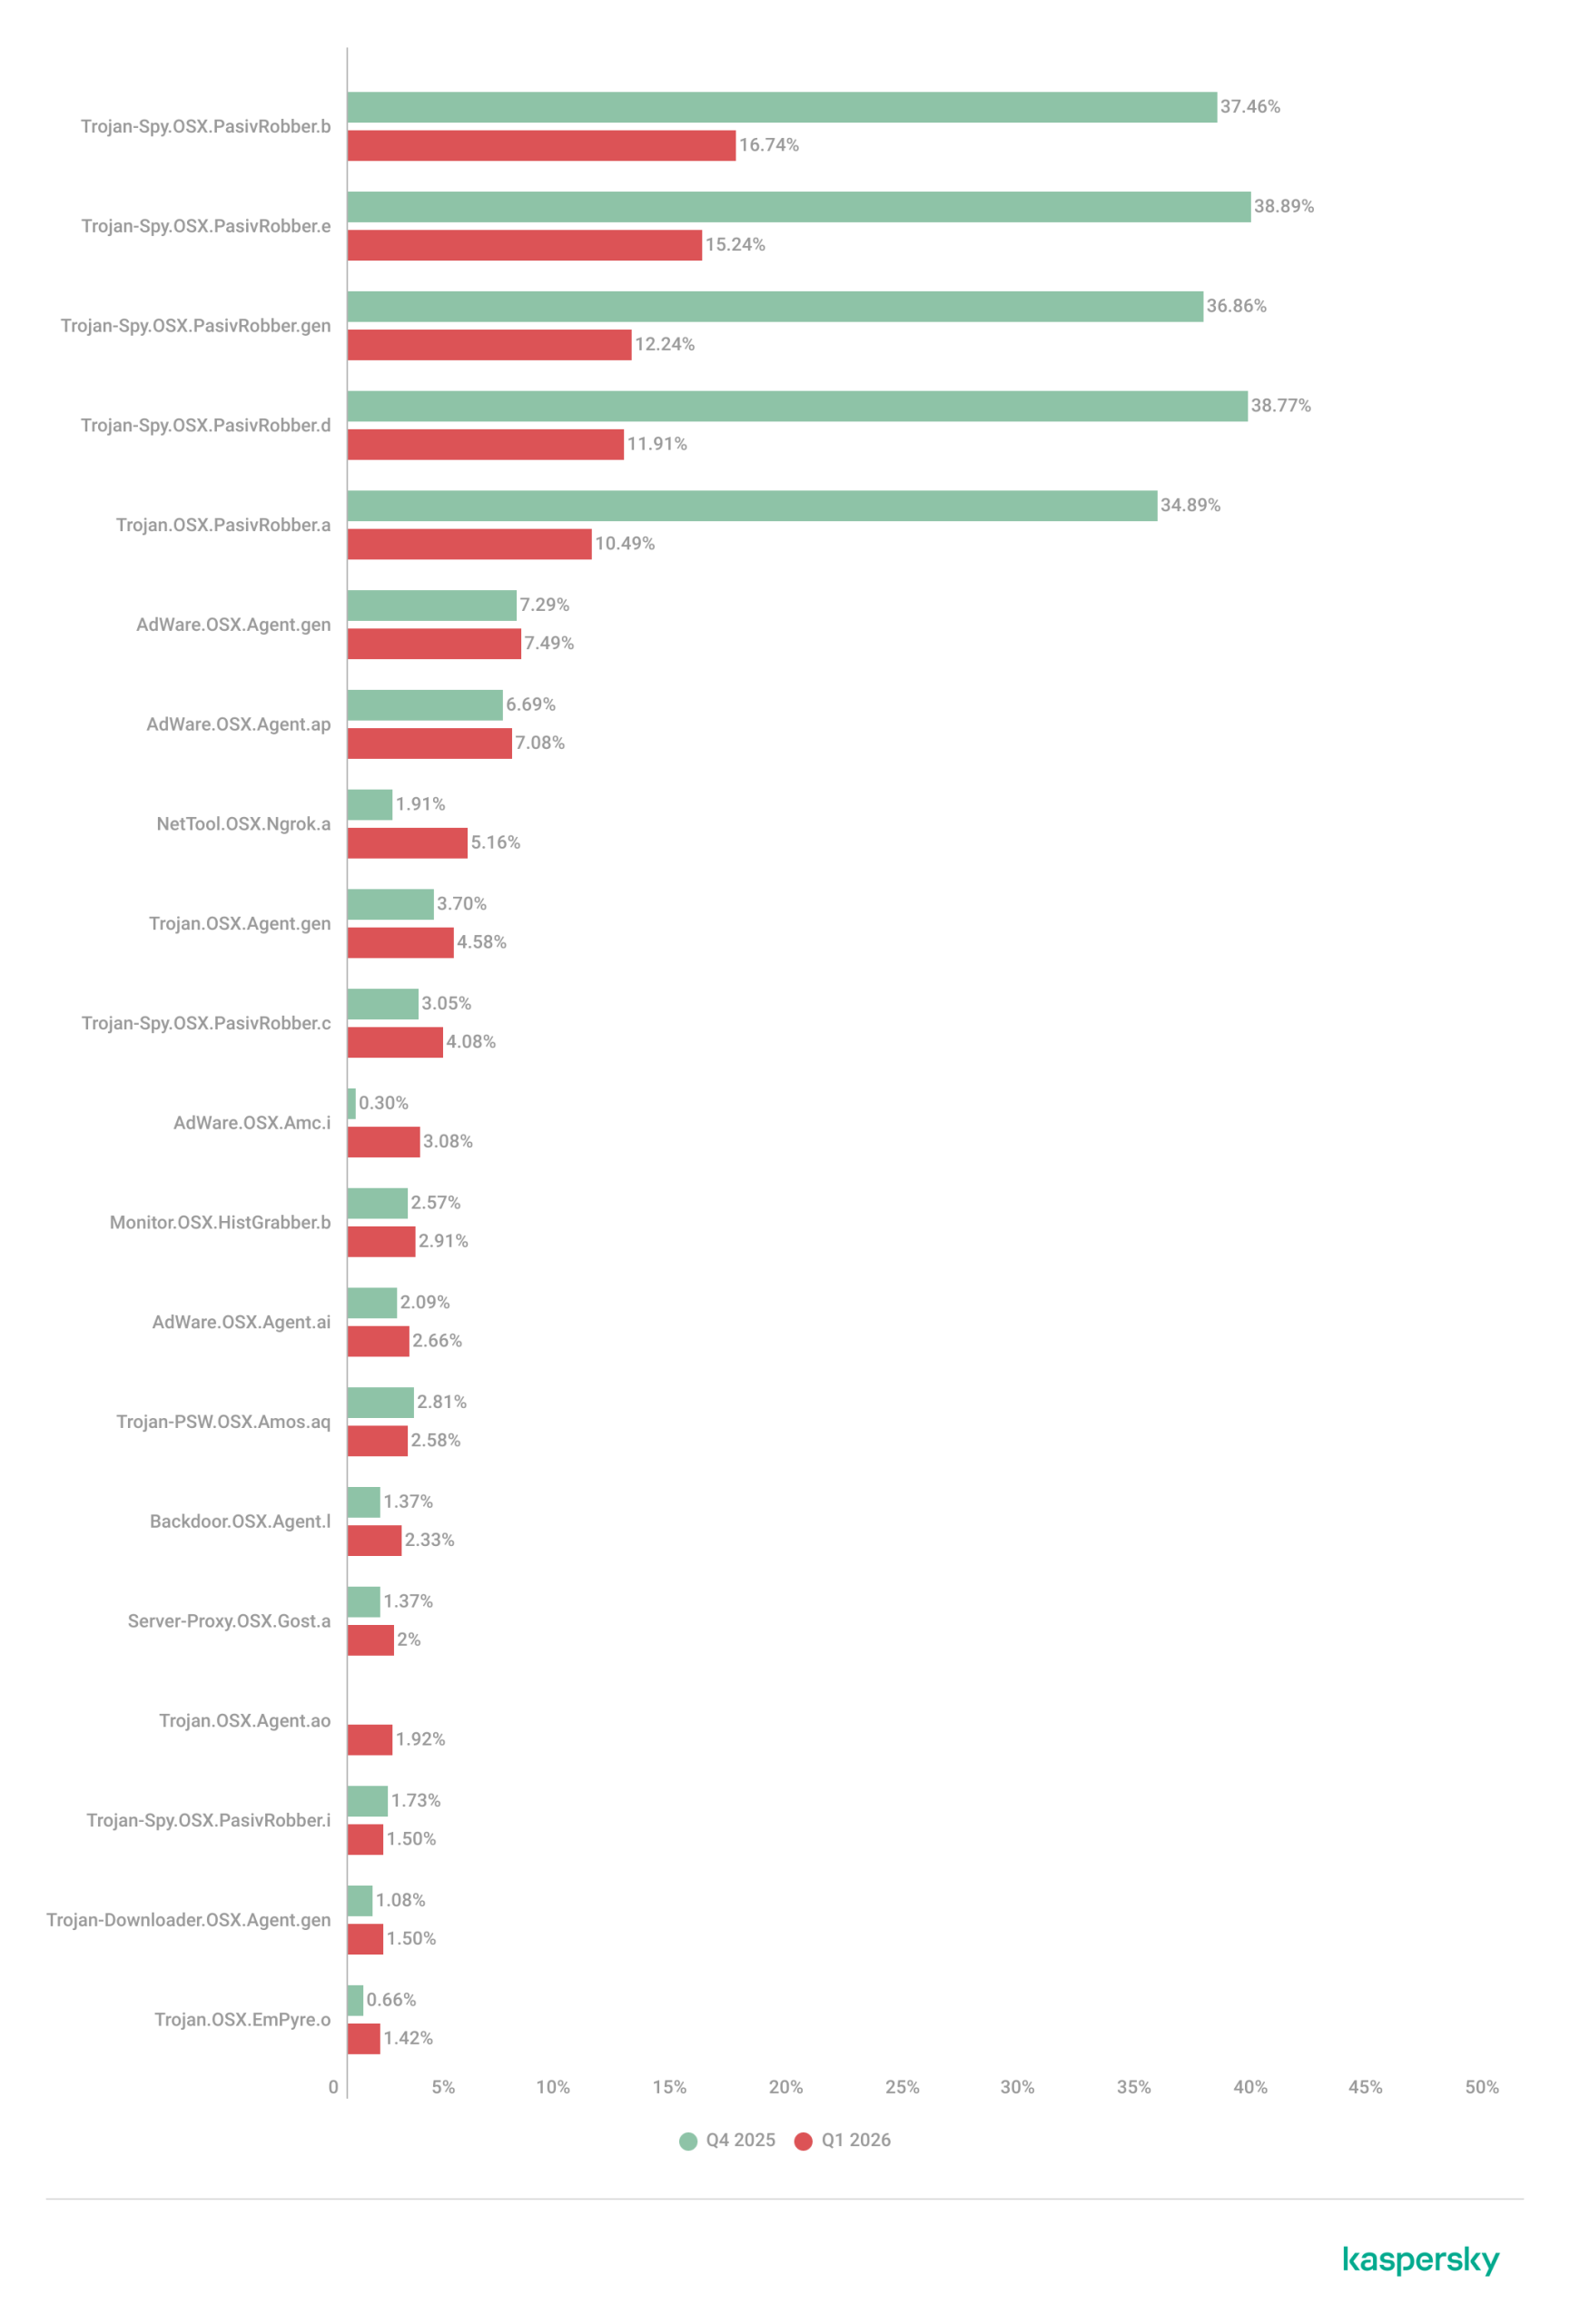
TOP 20 threats to macOS
Unique users* who encountered this malware as a percentage of all attacked users of Kaspersky security solutions for macOS (download)
* Data for the previous quarter may differ slightly from previously published data due to some verdicts being retrospectively revised.
The share of PasivRobber spyware attacks is beginning to decline, giving way to more traditional adware and Monitor-class software capable of tracking user activity. The popular Amos stealer also maintains its presence within the TOP 20.
Geography of threats to macOS
TOP 10 countries and territories by share of attacked users
Country/territory
%* Q4 2025
%* Q1 2026
China
1.28
1.97
France
1.18
1.07
Brazil
1.13
0.98
Mexico
0.72
0.52
Germany
0.71
0.45
The Netherlands
0.62
0.75
Hong Kong
0.49
0.53
India
0.42
0.48
Russian Federation
0.34
0.37
Thailand
0.24
0.27
* Unique users who encountered threats to macOS as a percentage of all unique Kaspersky users in the country/territory.
IoT threat statistics
This section presents statistics on attacks targeting Kaspersky IoT honeypots. The geographic data on attack sources is based on the IP addresses of attacking devices.
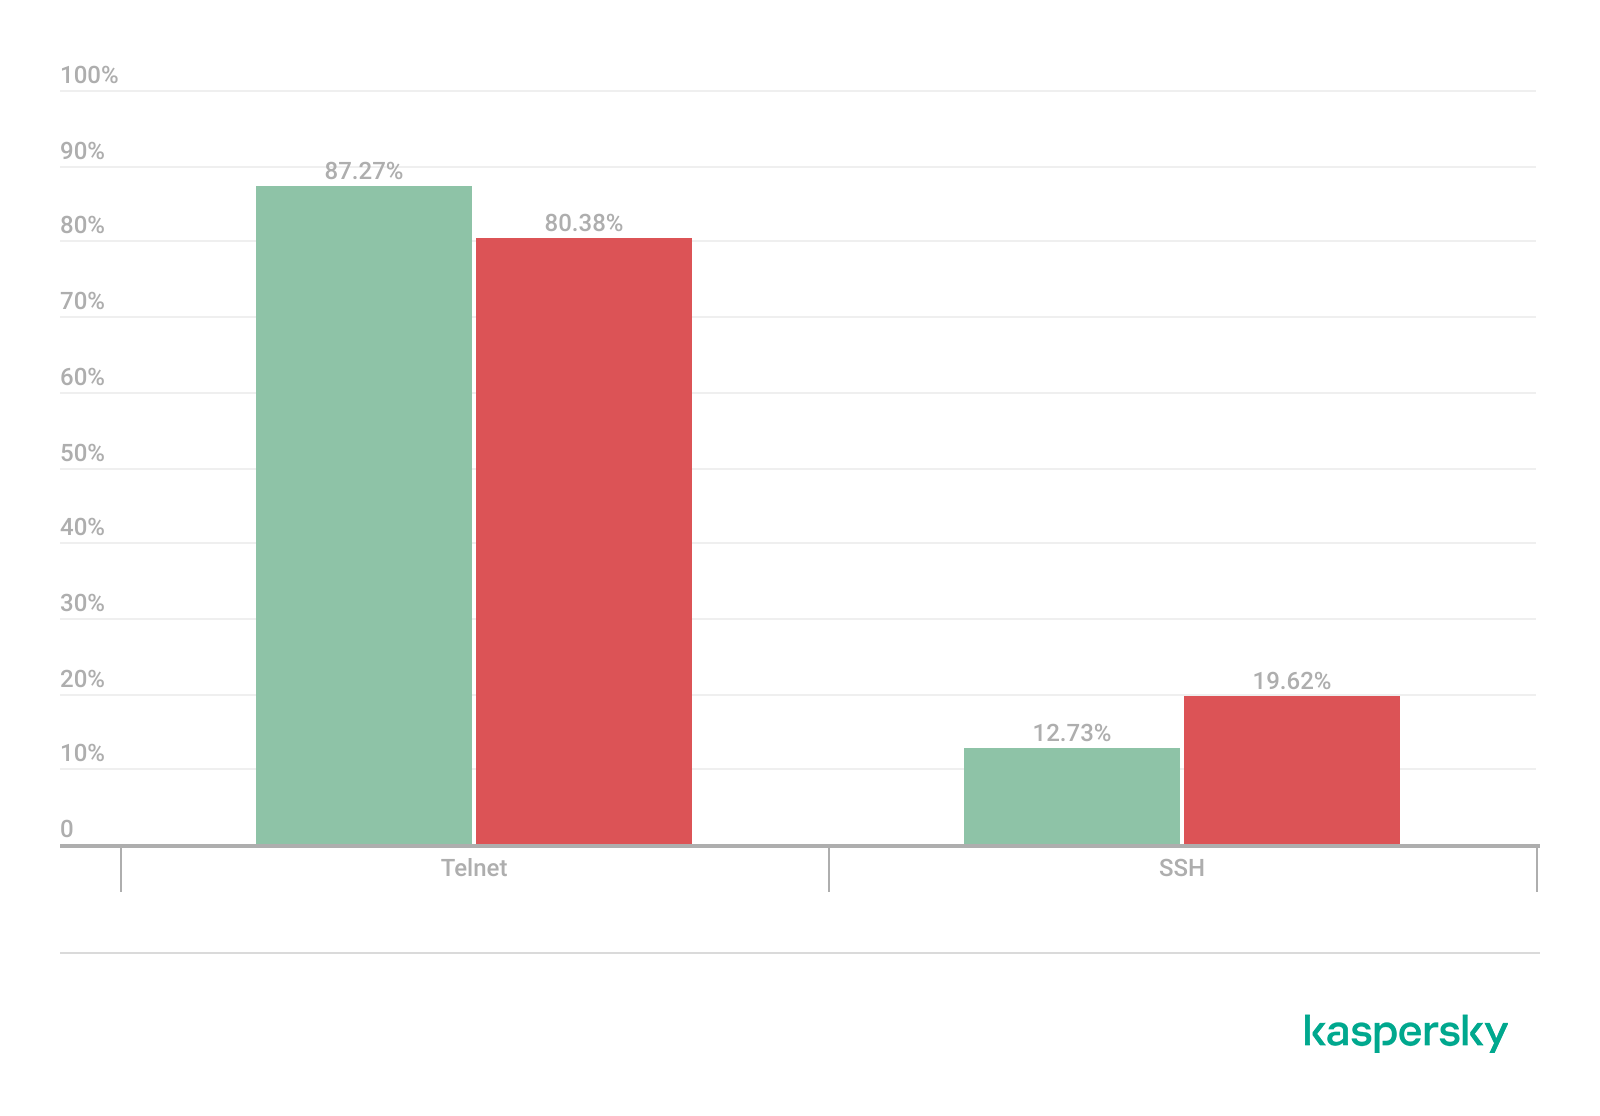
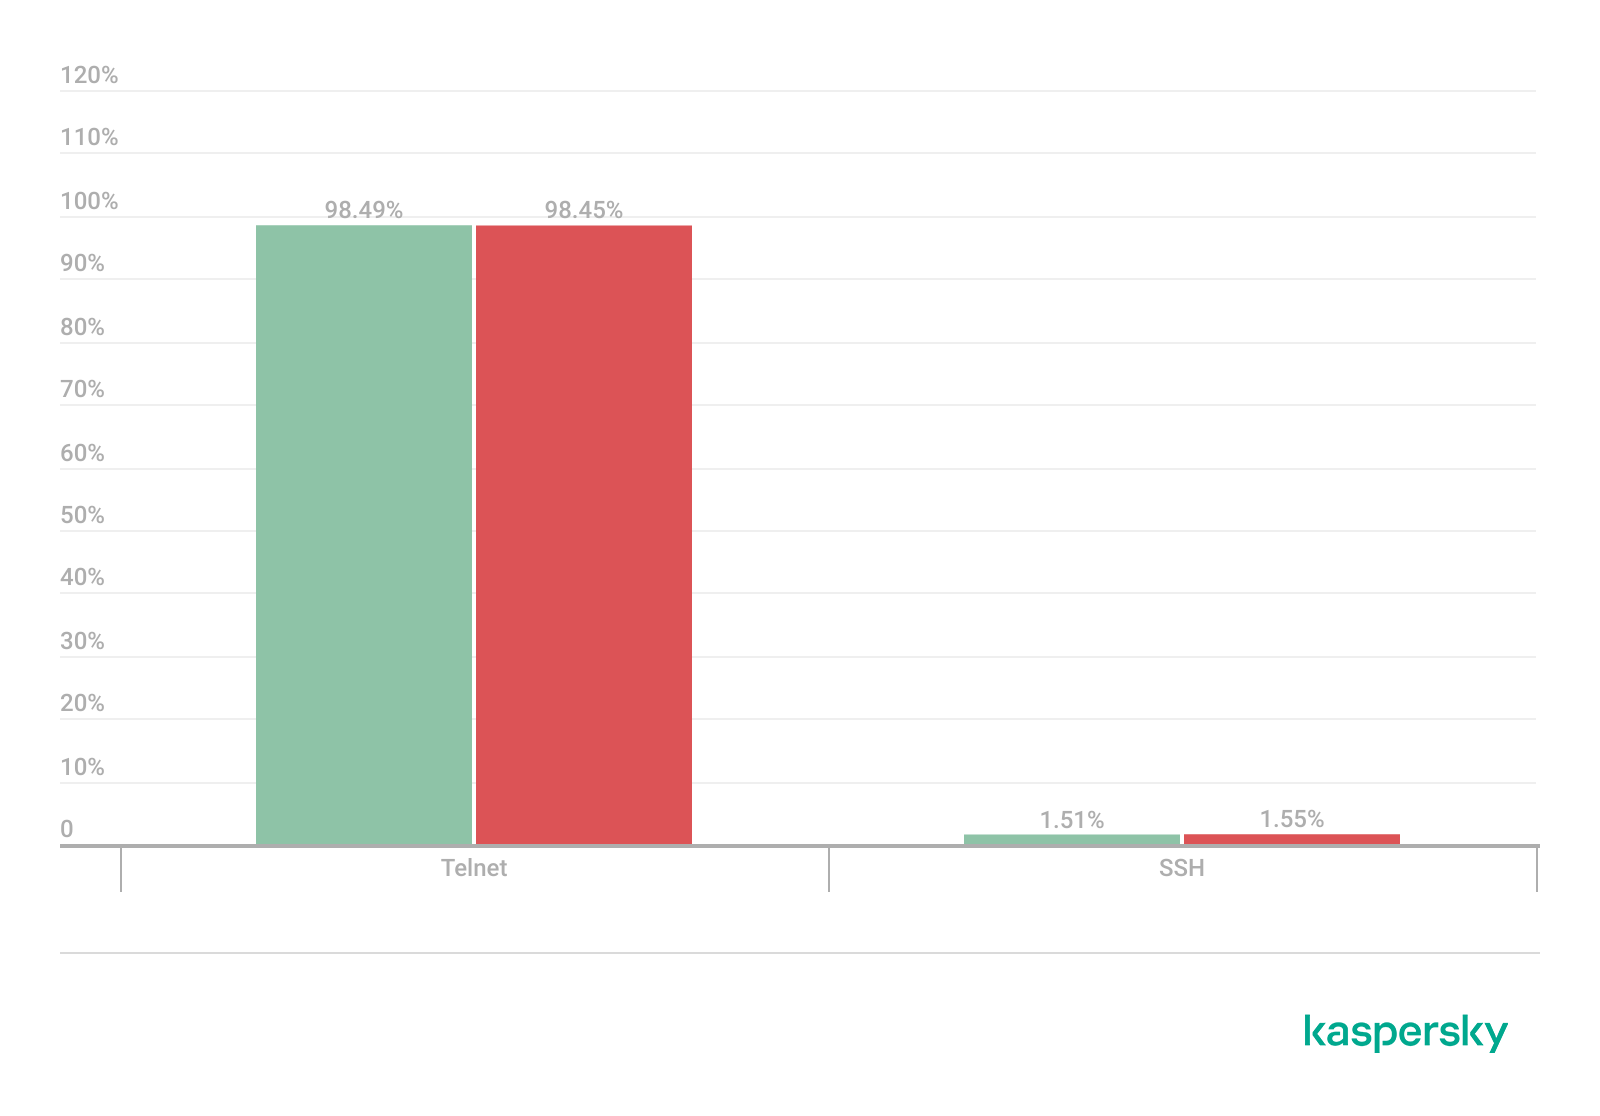
In Q1 2026, the share of devices attacking Kaspersky honeypots via the SSH protocol saw a significant increase compared to the previous reporting period.
Distribution of attacked services by number of unique IP addresses of attacking devices (download)
The distribution of attacks between Telnet and SSH maintained the ratio observed in Q4 2025.
Distribution of attackers’ sessions in Kaspersky honeypots (download)
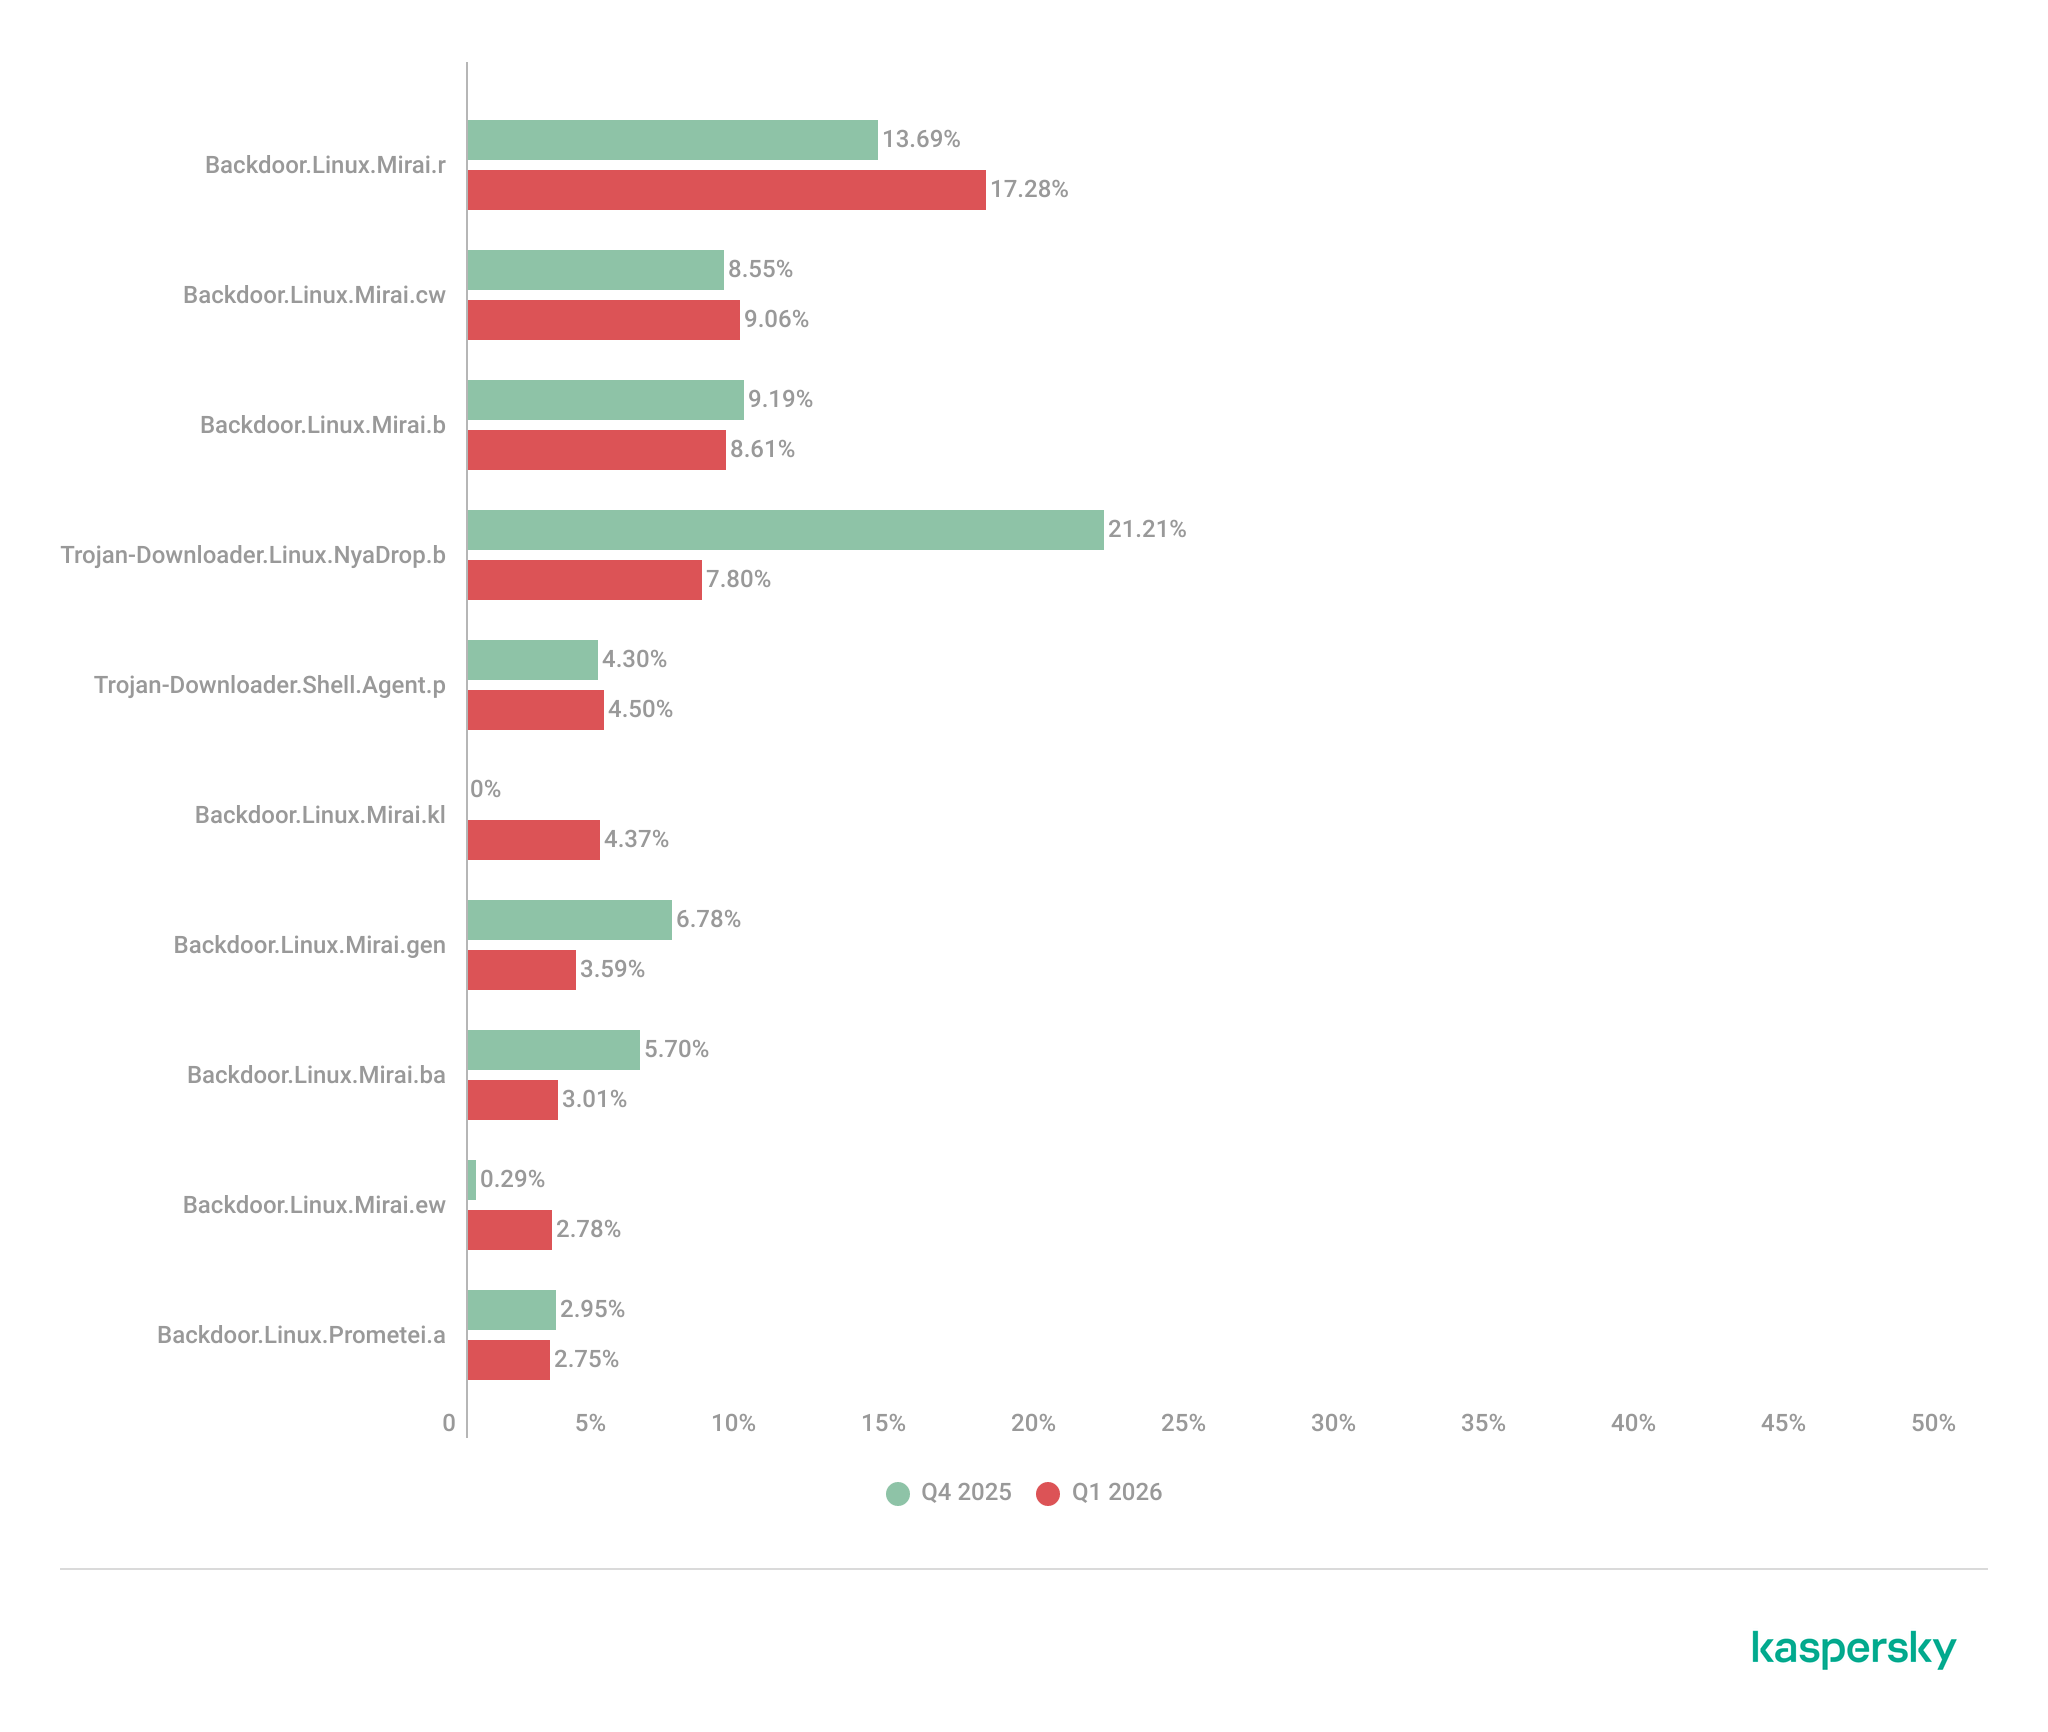
TOP 10 threats delivered to IoT devices
Share of each threat delivered to an infected device as a result of a successful attack, out of the total number of threats delivered (download)
The primary shifts in the IoT threat distribution are linked to the activity of various Mirai botnet variants, although members of this family continue to account for the majority of the list. Furthermore, a new variant, Mirai.kl, surfaced in the rankings. We also observed a significant decline in NyaDrop botnet activity during Q1.
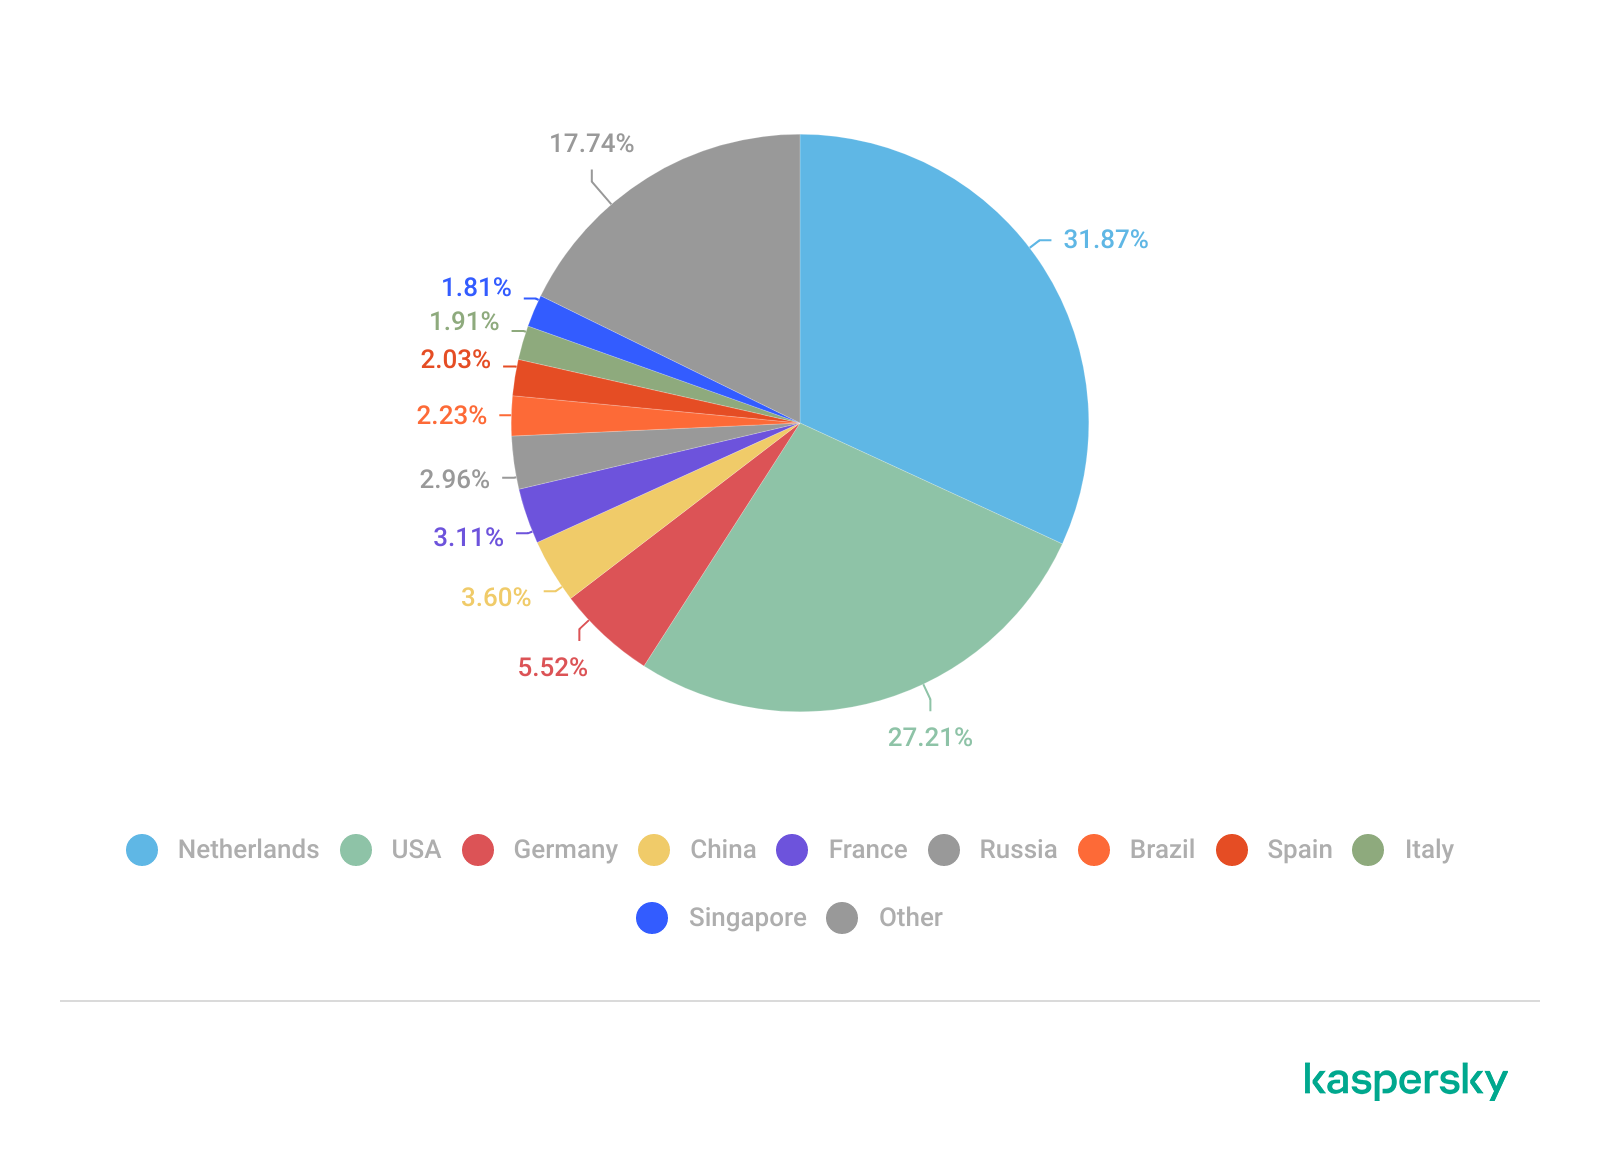
Attacks on IoT honeypots
The United States, the Netherlands, and Germany accounted for the highest proportions of SSH-based attacks during this period.
Country/territory
Q4 2025
Q1 2026
United States
16.10%
23.74%
The Netherlands
15.78%
17.57%
Germany
12.07%
10.34%
Panama
7.72%
6.34%
India
5.32%
6.05%
Romania
4.05%
5.82%
Australia
1.62%
4.61%
Vietnam
4.21%
3.50%
Russian Federation
3.79%
2.35%
Sweden
2.25%
2.09%
China continues to account for the largest proportion of Telnet attacks, though there was a marked increase in activity originating from Pakistan.
Country/territory
Q4 2025
Q1 2026
China
53.64%
39.54%
Pakistan
14.27%
27.31%
Russian Federation
8.20%
8.25%
Indonesia
8.58%
6.71%
India
4.85%
4.66%
Brazil
0.06%
3.30%
Argentina
0.02%
2.51%
Nigeria
1.22%
1.38%
Thailand
0.01%
0.55%
Sweden
0.54%
0.55%
Attacks via web resources
The statistics in this section are based on detection verdicts by Web Anti-Virus, which protects users when suspicious objects are downloaded from malicious or infected web pages. These malicious pages are purposefully created by cybercriminals. Websites that host user-generated content, such as message boards, as well as compromised legitimate sites, can become infected.
TOP 10 countries and territories that served as sources of web-based attacks
The following statistics show the distribution by country/territory of the sources of internet attacks blocked by Kaspersky products on user computers (web pages redirecting to exploits, sites containing exploits and other malicious programs, botnet C&C centers, and so on). One or more web-based attacks could originate from each unique host.
To determine the geographic source of web attacks, we matched the domain name with the real IP address where the domain is hosted, then identified the geographic location of that IP address (GeoIP).
In Q1 2026, Kaspersky solutions blocked 343,823,407 attacks launched from internet resources worldwide. Web Anti-Virus was triggered by 49,983,611 unique URLs.
Web-based attacks by country/territory, Q1 2026 (download)
Countries and territories where users faced the greatest risk of online infection
To assess the risk of malware infection via the internet for users’ computers in different countries and territories, we calculated the share of Kaspersky users in each location on whose computers Web Anti-Virus was triggered during the reporting period. The resulting data provides an indication of the aggressiveness of the environment in which computers operate in different countries and territories.
This ranked list includes only attacks by malicious objects classified as Malware. Our calculations leave out Web Anti-Virus detections of potentially dangerous or unwanted programs, such as RiskTool or adware.
Country/territory*
%**
1
Venezuela
9.33
2
Hungary
8.16
3
Italy
7.58
4
Tajikistan
7.48
5
India
7.21
6
Greece
7.13
7
Portugal
7.10
8
France
7.05
9
Belgium
6.83
10
Slovakia
6.80
11
Vietnam
6.62
12
Bosnia and Herzegovina
6.57
13
Canada
6.56
14
Serbia
6.50
15
Tunisia
6.36
16
Qatar
6.01
17
Spain
5.95
18
Germany
5.95
19
Sri Lanka
5.89
20
Brazil
5.88
* Excluded are countries and territories with relatively few (under 10,000) Kaspersky users.
** Unique users targeted by web-based Malware attacks as a percentage of all unique users of Kaspersky products in the country/territory.
On average during the quarter, 4.73% of users’ computers worldwide were subjected to at least one Malware web attack.
Local threats
Statistics on local infections of user computers are an important indicator. They include objects that penetrated the target computer by infecting files or removable media, or initially made their way onto the computer in non-open form. Examples of the latter are programs in complex installers and encrypted files.
Data in this section is based on analyzing statistics produced by anti-virus scans of files on the hard drive at the moment they were created or accessed, and the results of scanning removable storage media. The statistics are based on detection verdicts from the On-Access Scan (OAS) and On-Demand Scan (ODS) modules of File Anti-Virus and include detections of malicious programs located on user computers or removable media connected to the computers, such as flash drives, camera memory cards, phones, or external hard drives.
In Q1 2026, our File Anti-Virus detected 15,831,319 malicious and potentially unwanted objects.
Countries and territories where users faced the highest risk of local infection
For each country and territory, we calculated the percentage of Kaspersky users whose computers had the File Anti-Virus triggered at least once during the reporting period. This statistic reflects the level of personal computer infection in different countries and territories around the world.
Note that this ranked list includes only attacks by malicious objects classified as Malware. Our calculations leave out File Anti-Virus detections of potentially dangerous or unwanted programs, such as RiskTool or adware.
Country/territory*
%**
1
Turkmenistan
47.96
2
Tajikistan
31.48
3
Cuba
31.03
4
Yemen
29.59
5
Afghanistan
28.47
6
Burundi
26.93
7
Uzbekistan
24.81
8
Syria
23.08
9
Nicaragua
21.97
10
Cameroon
21.60
11
China
21.09
12
Mozambique
21.02
13
Algeria
20.64
14
Democratic Republic of the Congo
20.63
15
Bangladesh
20.44
16
Mali
20.35
17
Republic of the Congo
20.23
18
Madagascar
20.00
19
Belarus
19.78
20
Tanzania
19.52
* Excluded are countries and territories with relatively few (under 10,000) Kaspersky users.
** Unique users on whose computers local Malware threats were blocked, as a percentage of all unique users of Kaspersky products in the country/territory.
On average worldwide, Malware local threats were detected at least once on 11.55% of users’ computers during Q1.
In the third quarter of 2025, we updated the methodology for calculating statistical indicators based on the Kaspersky Security Network. These changes affected all sections of the report except for the statistics on installation packages, which remained unchanged.
To illustrate the differences between the reporting periods, we have also recalculated data for the previous quarters. Consequently, these figures may significantly differ from the previously published ones. However, subsequent reports will employ this new methodology, enabling precise comparisons with the data presented in this post.
The Kaspersky Security Network (KSN) is a global network for analyzing anonymized threat information, voluntarily shared by users of Kaspersky solutions. The statistics in this report are based on KSN data unless explicitly stated otherwise.
The quarter in numbers
According to Kaspersky Security Network, in Q1 2026:
More than 2.67 million attacks utilizing malware, adware, or unwanted mobile software were prevented.
The Trojan-Banker category was the prevalent mobile malware threat with a 52.96% share of total detected applications.
More than 306,000 malicious installation packages were discovered, including:
162,275 packages related to mobile banking Trojans;
439 packages related to mobile ransomware Trojans.
Quarterly highlights
The number of malware, adware, or unwanted software attacks on mobile devices decreased to 2,676,328 in Q1, down from 3,239,244 in the previous quarter.
Attacks on users of Kaspersky mobile solutions, Q3 2024 — Q1 2026 (download)
The overall drop in attack volume stems primarily from a reduction in adware and RiskTool detections. Nonetheless, this trend does not equate to a lower risk for mobile users. As shown later in this report, the number of unique users targeted by these threats remained relatively stable.
In Q1, Synthient researchers identified a link between the notorious Kimwolf botnet and the IPIDEA proxy network. This network was later taken down in cooperation with GTIG.
In early 2026, we discovered several apps on Google Play and the App Store that contained a new version of the SparkCat crypto stealer.
The Trojan code, meticulously concealed, was embedded into the infected Android apps. The obfuscated malicious Rust library was decrypted using a Dalvik-like virtual machine custom-built by the attackers. The iOS version of the malware also underwent several changes; specifically, the attackers began leveraging Apple’s proprietary Vision framework for optical character recognition (OCR).
Mobile threat statistics
The number of Android malware samples saw a slight increase compared to Q4 2025, reaching a total of 306,070.
The detected installation packages were distributed by type as follows:
Detected mobile apps by type, Q4 2025* — Q1 2026 (download)
* Data for the previous quarter may differ slightly from previously published figures due to certain verdicts being retrospectively revised.
Threat actors once again ramped up the production of new banking Trojans; as a result, this category overtook all others in volume, accounting for more than half of all installation packages.
Share* of users attacked by the given type of malicious or potentially unwanted app out of all targeted users of Kaspersky mobile products, Q4 2025 — Q1 2026 (download)
* The total percentage may exceed 100% if the same users encountered multiple attack types.
Following the surge in banking Trojan installation packages, the number of associated attacks also rose, causing Trojan-Banker apps to climb one spot in terms of their share of targeted users. Mamont variants emerged as the most prevalent banking Trojans, accounting for 73.5% of detections, with the rest of the users encountering Faketoken, Rewardsteal, Creduz, and other families.
Yet banking Trojans were still outpaced by adware and RiskTool-type unwanted apps when measured by the total number of affected users. Despite a decrease in their share of installation packages, these two app types retained their positions as the top two threats by attack volume. The most common adware detections involved HiddenAd (44.9%) and MobiDash (38.1%), while most frequently seen RiskTool apps were Revpn (67%) and SpyLoan (20.5%).
TOP 20 most frequently detected types of mobile malware
Note that the malware rankings below exclude riskware or potentially unwanted software, such as RiskTool or adware.
Verdict
%* Q4 2025
%* Q1 2026
Difference in p.p.
Change in ranking
Backdoor.AndroidOS.Triada.ag
2.62
7.09
+4.48
+10
DangerousObject.Multi.Generic.
6.75
5.84
-0.92
-1
DangerousObject.AndroidOS.GenericML.
3.52
5.51
+1.99
+6
Trojan-Banker.AndroidOS.Mamont.jo
0.00
5.28
+5.28
Trojan.AndroidOS.Fakemoney.v
5.40
3.44
-1.96
-1
Trojan-Downloader.AndroidOS.Keenadu.l
0.00
3.35
+3.35
Trojan-Banker.AndroidOS.Mamont.jx
0.00
3.09
+3.09
Backdoor.AndroidOS.Triada.z
4.87
3.08
-1.79
-2
Trojan.AndroidOS.Triada.fe
5.01
2.98
-2.02
-4
Backdoor.AndroidOS.Keenadu.a
2.07
2.73
+0.66
+6
Trojan-Banker.AndroidOS.Mamont.jg
0.34
2.37
+2.03
Trojan.AndroidOS.Triada.hf
2.15
2.23
+0.07
+3
Trojan.AndroidOS.Boogr.gsh
2.35
2.15
-0.20
0
Trojan.AndroidOS.Triada.ii
5.68
2.07
-3.60
-11
Backdoor.AndroidOS.Triada.ae
1.91
1.76
-0.16
+3
Backdoor.AndroidOS.Triada.ab
1.79
1.72
-0.08
+3
Trojan.AndroidOS.Triada.gn
2.38
1.58
-0.80
-5
Trojan-Banker.AndroidOS.Mamont.gg
1.56
1.50
-0.06
+2
Trojan.AndroidOS.Triada.ga
1.48
1.50
+0.01
+4
Backdoor.AndroidOS.Triada.ad
0.53
1.40
+0.87
+44
* Unique users who encountered this malware as a percentage of all attacked users of Kaspersky mobile solutions.
The pre-installed Triada.ag backdoor rose to the top spot; it is similar to the older Triada.z version we documented previously. Because the same variant was pre-installed across a wide range of devices, the total number of affected users is aggregated. Consequently, Triada outpaced even Mamont, as users encountered a variety of Mamont variants, causing the share of that banking Trojan to spread across multiple rows. Other pre-installed Triada variants (Triada.z, Triada.ae, Triada.ab, and Triada.ad) also made the rankings. Furthermore, we observed increasing activity from the Keenadu.a backdoor, while diverse variants of the embedded Triada Trojan remained in the rankings.
Mobile banking Trojans
Q1 2026 saw a characteristic rise in mobile banking Trojan activity, with the number of packages totaling 162,275, a 50% increase compared to the prior quarter.
Number of installation packages for mobile banking Trojans detected by Kaspersky, Q1 2025 — Q1 2026 (download)
We saw a similar growth in the previous quarter, with banking Trojan volumes rising by 50% during that period as well. Various Mamont variants accounted for the absolute majority of packages and represented nearly every entry in the rankings of most frequent banking Trojans by affected user count.
TOP 10 mobile bankers
Verdict
%* Q4 2025
%* Q1 2026
Difference in p.p.
Change in ranking
Trojan-Banker.AndroidOS.Mamont.jo
0.00
15.75
+15.75
Trojan-Banker.AndroidOS.Mamont.jx
0.00
9.22
+9.22
Trojan-Banker.AndroidOS.Mamont.jg
1.47
7.08
+5.61
+24
Trojan-Banker.AndroidOS.Mamont.gg
6.79
4.48
-2.32
-3
Trojan-Banker.AndroidOS.Mamont.ks
0.00
3.98
+3.98
Trojan-Banker.AndroidOS.Agent.ws
6.03
3.78
-2.25
-2
Trojan-Banker.AndroidOS.Mamont.hl
4.30
3.27
-1.03
+1
Trojan-Banker.AndroidOS.Mamont.iv
6.00
3.08
-2.92
-3
Trojan-Banker.AndroidOS.Mamont.jb
3.93
3.07
-0.86
+1
Trojan-Banker.AndroidOS.Mamont.jv
0.00
2.79
+2.79
* Unique users who encountered this malware as a percentage of all users of Kaspersky mobile security solutions who encountered banking threats.
The statistics in this report are based on detection verdicts returned by Kaspersky products unless otherwise stated. The information was provided by Kaspersky users who consented to sharing statistical data.
Quarterly figures
In Q1 2026:
Kaspersky products blocked more than 343 million attacks that originated with various online resources.
Web Anti-Virus responded to 50 million unique links.
File Anti-Virus blocked nearly 15 million malicious and potentially unwanted objects.
2938 new ransomware variants were detected.
More than 77,000 users experienced ransomware attacks.
14% of all ransomware victims whose data was published on threat actors’ data leak sites (DLS) were victims of Clop.
More than 260,000 users were targeted by miners.
Ransomware
Quarterly trends and highlights
Law enforcement success
In January 2026, it was reported that the FBI had seized the domains of the RAMP cybercrime forum, a major platform used extensively by ransomware developers to advertise their RaaS programs and to recruit affiliates. There has been no official statement from the FBI, nor is it clear if RAMP servers were seized. In a post on an external website, a RAMP moderator mentioned law enforcement agencies gaining control over the forum. The takedown disrupted a key element of the RaaS ecosystem, creating ripple effects for ransomware operators, affiliates, and initial access brokers.
A man suspected of links to the Phobos group was apprehended in Poland. He was charged with the creation, acquisition, and distribution of software designed for unlawfully obtaining information, including data that facilitates unauthorized access to information stored within a computer system.
In March, a Phobos ransomware administrator pleaded guilty to the creation and distribution of the Trojan, which had been used in international attacks dating back to at least November 2020.
In March, the U.S. Department of Justice charged a man who had acted as a negotiator for ransomware groups. The company he worked for specializes in cyberincident investigations. The prosecution alleges the suspect colluded with the BlackCat threat actor to share privileged insights into the ongoing progress of negotiations. Additionally, the suspect is alleged to have had a prior direct role in BlackCat attacks, serving as an affiliate for the RaaS operation.
In a separate development this March, a U.S. court sentenced an initial access broker associated with the Yanluowang ransomware group to 81 months of imprisonment. According to the U.S. Department of Justice, the convict facilitated dozens of ransomware attacks across the United States, resulting in over $9 million in actual loss and more than $24 million in intended loss.
Vulnerabilities and attacks
The Interlock group has been heavily exploiting the CVE-2026-20131 zero-day vulnerability in Cisco Secure FMC firewall management software since at least January 26, 2026. The vulnerability enabled arbitrary Java code execution with root privileges on the affected device. This campaign demonstrates the ongoing reliance on zero-day vulnerabilities for initial access, a focus on network appliances as high-value entry points, and the rapid weaponization of new vulnerabilities within the ransomware ecosystem.
The most prolific groups
This section highlights the most prolific ransomware gangs by number of victims added to each group’s DLS. This quarter, the Clop ransomware (14.42%) returned to the top of the rankings, displacing Qilin (12.34%), which had held the leading position in the previous reporting period. Following closely is a new threat actor, The Gentlemen (9.25%). Emerging no later than July 2025, the group had already surpassed the activity levels of mainstays such as Akira (7.25%) and INC Ransom (6.13%).
Number of each group’s victims according to its DLS as a percentage of all groups’ victims published on all the DLSs under review during the reporting period (download)
Number of new variants
In Q1 2026, Kaspersky solutions detected six new ransomware families and 2938 new modifications. Volumes have returned to Q3 2025 levels following a surge in Q4 2025.
Number of new ransomware modifications, Q1 2025 — Q1 2026 (download)
Number of users attacked by ransomware Trojans
Throughout Q1, our solutions protected 77,319 unique users from ransomware. Ransomware activity was highest in March, with 35,056 unique users encountering such attacks during the month.
Number of unique users attacked by ransomware Trojans, Q1 2026 (download)
Attack geography
TOP 10 countries and territories attacked by ransomware Trojans
Country/territory*
%**
1
Pakistan
0.79
2
South Korea
0.64
3
China
0.52
4
Tajikistan
0.40
5
Libya
0.38
6
Turkmenistan
0.36
7
Iraq
0.35
8
Bangladesh
0.33
9
Rwanda
0.30
10
Cameroon
0.28
* Excluded are countries and territories with relatively few (under 50,000) Kaspersky users.
** Unique users whose computers were attacked by ransomware Trojans as a percentage of all unique users of Kaspersky products in the country/territory.
TOP 10 most common families of ransomware Trojans
Name
Verdict
%*
1
(generic verdict)
Trojan-Ransom.Win32.Gen
33.90
2
(generic verdict)
Trojan-Ransom.Win32.Crypren
6.38
3
WannaCry
Trojan-Ransom.Win32.Wanna
5.87
4
(generic verdict)
Trojan-Ransom.Win32.Encoder
4.68
5
(generic verdict)
Trojan-Ransom.Win32.Agent
3.80
6
LockBit
Trojan-Ransom.Win32.Lockbit
2.80
7
(generic verdict)
Trojan-Ransom.Win32.Phny
1.99
8
(generic verdict)
Trojan-Ransom.MSIL.Agent
1.96
9
(generic verdict)
Trojan-Ransom.Python.Agent
1.93
10
(generic verdict)
Trojan-Ransom.Win32.Crypmod
1.89
* Unique Kaspersky users attacked by the specific ransomware Trojan family as a percentage of all unique users attacked by this type of threat.
Miners
Number of new variants
In Q1 2026, Kaspersky solutions detected 3485 new modifications of miners.
Number of new miner modifications, Q1 2026 (download)
Number of users attacked by miners
In Q1, we detected attacks using miner programs on the computers of 260,588 unique Kaspersky users worldwide.
Number of unique users attacked by miners, Q1 2026 (download)
Attack geography
TOP 10 countries and territories attacked by miners
Country/territory*
%**
1
Senegal
3.19
2
Turkmenistan
3.06
3
Mali
2.63
4
Tanzania
1.62
5
Bangladesh
1.06
6
Ethiopia
0.95
7
Panama
0.88
8
Afghanistan
0.79
9
Kazakhstan
0.77
10
Bolivia
0.75
* Excluded are countries and territories with relatively few (under 50,000) Kaspersky users.
** Unique users whose computers were attacked by miners as a percentage of all unique users of Kaspersky products in the country/territory.
Attacks on macOS
In Q1 2026, Google uncovered a new cryptocurrency theft campaign. The scammers directed victims to a fraudulent video call, prompting them to execute malicious scripts under the guise of technical support fixes for connection problems.
In March, researchers with GTIG and iVerify reported the discovery of an in-the-wild exploit chain targeting both iOS and macOS devices. The exploit kit was apparently marketed on the dark web, providing threat actors with a suite of spyware capabilities alongside specialized cryptocurrency exfiltration modules. The exploit was delivered via drive-by downloads when victims visited various compromised websites. Our analysis confirmed that the toolkit included an updated version of a component previously identified in the Operation Triangulation attack chain.
Devices running macOS were similarly impacted by the high-profile supply chain attack targeting the Axios npm package, a widely used HTTP client for JavaScript. The installation of the infected package led to the deployment of a backdoor on macOS devices.
TOP 20 threats to macOS
Unique users* who encountered this malware as a percentage of all attacked users of Kaspersky security solutions for macOS (download)
* Data for the previous quarter may differ slightly from previously published data due to some verdicts being retrospectively revised.
The share of PasivRobber spyware attacks is beginning to decline, giving way to more traditional adware and Monitor-class software capable of tracking user activity. The popular Amos stealer also maintains its presence within the TOP 20.
Geography of threats to macOS
TOP 10 countries and territories by share of attacked users
Country/territory
%* Q4 2025
%* Q1 2026
China
1.28
1.97
France
1.18
1.07
Brazil
1.13
0.98
Mexico
0.72
0.52
Germany
0.71
0.45
The Netherlands
0.62
0.75
Hong Kong
0.49
0.53
India
0.42
0.48
Russian Federation
0.34
0.37
Thailand
0.24
0.27
* Unique users who encountered threats to macOS as a percentage of all unique Kaspersky users in the country/territory.
IoT threat statistics
This section presents statistics on attacks targeting Kaspersky IoT honeypots. The geographic data on attack sources is based on the IP addresses of attacking devices.
In Q1 2026, the share of devices attacking Kaspersky honeypots via the SSH protocol saw a significant increase compared to the previous reporting period.
Distribution of attacked services by number of unique IP addresses of attacking devices (download)
The distribution of attacks between Telnet and SSH maintained the ratio observed in Q4 2025.
Distribution of attackers’ sessions in Kaspersky honeypots (download)
TOP 10 threats delivered to IoT devices
Share of each threat delivered to an infected device as a result of a successful attack, out of the total number of threats delivered (download)
The primary shifts in the IoT threat distribution are linked to the activity of various Mirai botnet variants, although members of this family continue to account for the majority of the list. Furthermore, a new variant, Mirai.kl, surfaced in the rankings. We also observed a significant decline in NyaDrop botnet activity during Q1.
Attacks on IoT honeypots
The United States, the Netherlands, and Germany accounted for the highest proportions of SSH-based attacks during this period.
Country/territory
Q4 2025
Q1 2026
United States
16.10%
23.74%
The Netherlands
15.78%
17.57%
Germany
12.07%
10.34%
Panama
7.72%
6.34%
India
5.32%
6.05%
Romania
4.05%
5.82%
Australia
1.62%
4.61%
Vietnam
4.21%
3.50%
Russian Federation
3.79%
2.35%
Sweden
2.25%
2.09%
China continues to account for the largest proportion of Telnet attacks, though there was a marked increase in activity originating from Pakistan.
Country/territory
Q4 2025
Q1 2026
China
53.64%
39.54%
Pakistan
14.27%
27.31%
Russian Federation
8.20%
8.25%
Indonesia
8.58%
6.71%
India
4.85%
4.66%
Brazil
0.06%
3.30%
Argentina
0.02%
2.51%
Nigeria
1.22%
1.38%
Thailand
0.01%
0.55%
Sweden
0.54%
0.55%
Attacks via web resources
The statistics in this section are based on detection verdicts by Web Anti-Virus, which protects users when suspicious objects are downloaded from malicious or infected web pages. These malicious pages are purposefully created by cybercriminals. Websites that host user-generated content, such as message boards, as well as compromised legitimate sites, can become infected.
TOP 10 countries and territories that served as sources of web-based attacks
The following statistics show the distribution by country/territory of the sources of internet attacks blocked by Kaspersky products on user computers (web pages redirecting to exploits, sites containing exploits and other malicious programs, botnet C&C centers, and so on). One or more web-based attacks could originate from each unique host.
To determine the geographic source of web attacks, we matched the domain name with the real IP address where the domain is hosted, then identified the geographic location of that IP address (GeoIP).
In Q1 2026, Kaspersky solutions blocked 343,823,407 attacks launched from internet resources worldwide. Web Anti-Virus was triggered by 49,983,611 unique URLs.
Web-based attacks by country/territory, Q1 2026 (download)
Countries and territories where users faced the greatest risk of online infection
To assess the risk of malware infection via the internet for users’ computers in different countries and territories, we calculated the share of Kaspersky users in each location on whose computers Web Anti-Virus was triggered during the reporting period. The resulting data provides an indication of the aggressiveness of the environment in which computers operate in different countries and territories.
This ranked list includes only attacks by malicious objects classified as Malware. Our calculations leave out Web Anti-Virus detections of potentially dangerous or unwanted programs, such as RiskTool or adware.
Country/territory*
%**
1
Venezuela
9.33
2
Hungary
8.16
3
Italy
7.58
4
Tajikistan
7.48
5
India
7.21
6
Greece
7.13
7
Portugal
7.10
8
France
7.05
9
Belgium
6.83
10
Slovakia
6.80
11
Vietnam
6.62
12
Bosnia and Herzegovina
6.57
13
Canada
6.56
14
Serbia
6.50
15
Tunisia
6.36
16
Qatar
6.01
17
Spain
5.95
18
Germany
5.95
19
Sri Lanka
5.89
20
Brazil
5.88
* Excluded are countries and territories with relatively few (under 10,000) Kaspersky users.
** Unique users targeted by web-based Malware attacks as a percentage of all unique users of Kaspersky products in the country/territory.
On average during the quarter, 4.73% of users’ computers worldwide were subjected to at least one Malware web attack.
Local threats
Statistics on local infections of user computers are an important indicator. They include objects that penetrated the target computer by infecting files or removable media, or initially made their way onto the computer in non-open form. Examples of the latter are programs in complex installers and encrypted files.
Data in this section is based on analyzing statistics produced by anti-virus scans of files on the hard drive at the moment they were created or accessed, and the results of scanning removable storage media. The statistics are based on detection verdicts from the On-Access Scan (OAS) and On-Demand Scan (ODS) modules of File Anti-Virus and include detections of malicious programs located on user computers or removable media connected to the computers, such as flash drives, camera memory cards, phones, or external hard drives.
In Q1 2026, our File Anti-Virus detected 15,831,319 malicious and potentially unwanted objects.
Countries and territories where users faced the highest risk of local infection
For each country and territory, we calculated the percentage of Kaspersky users whose computers had the File Anti-Virus triggered at least once during the reporting period. This statistic reflects the level of personal computer infection in different countries and territories around the world.
Note that this ranked list includes only attacks by malicious objects classified as Malware. Our calculations leave out File Anti-Virus detections of potentially dangerous or unwanted programs, such as RiskTool or adware.
Country/territory*
%**
1
Turkmenistan
47.96
2
Tajikistan
31.48
3
Cuba
31.03
4
Yemen
29.59
5
Afghanistan
28.47
6
Burundi
26.93
7
Uzbekistan
24.81
8
Syria
23.08
9
Nicaragua
21.97
10
Cameroon
21.60
11
China
21.09
12
Mozambique
21.02
13
Algeria
20.64
14
Democratic Republic of the Congo
20.63
15
Bangladesh
20.44
16
Mali
20.35
17
Republic of the Congo
20.23
18
Madagascar
20.00
19
Belarus
19.78
20
Tanzania
19.52
* Excluded are countries and territories with relatively few (under 10,000) Kaspersky users.
** Unique users on whose computers local Malware threats were blocked, as a percentage of all unique users of Kaspersky products in the country/territory.
On average worldwide, Malware local threats were detected at least once on 11.55% of users’ computers during Q1.

 Login
Login