Reading view

How AWS IAM role manager rethinks the starting point for IAM roles

When you build a new application or capability on Amazon Web Services (AWS), you want to focus on what you’re building. Getting a service running almost always begins with AWS Identity and Access Management (IAM). Many AWS services that act on your behalf need an IAM role, an identity the service assumes to access your resources with a defined set of permissions. You then author a trust policy so the service can assume the role, choose the permissions the workload needs, and attach it. Configuring roles and policies for common patterns is repeatable work that doesn’t need to be manual.

IAM role manager does that work for you. When role manager is enabled, AWS creates and configures the IAM roles as you build in supported service consoles, so you can start using a service and let AWS handle the role behind it. You create the resource you want, and role manager provisions and attaches the role you need as part of the same flow, so you can build now and refine permissions as your workload matures.

With that step automated, getting started takes minutes. You can create an AWS Lambda function and start running your code, with its execution role already created and attached, without switching context to set one up. Role creation becomes an automated part of building your application rather than a separate step.

Role manager is especially useful when you’re getting started: the moments when you want to stand up a service or get a proof of concept running and want to defer role configuration until later in your development process. You don’t need prior IAM experience to get started. You keep full control of what it creates, because the roles are ordinary IAM roles that you can view, edit, or delete like any role you author yourself. When you want to tighten a role, AWS IAM Access Analyzer reviews how it has been used and recommends a policy scoped to only the permissions it needs.

How to enable role manager

Role manager has two states, enabled and disabled. Enabling it for an account authorizes AWS to create roles in that account. In an organization, administrators can use a service control policy (SCP) to control whether member accounts can enable or use role manager. To enable it:

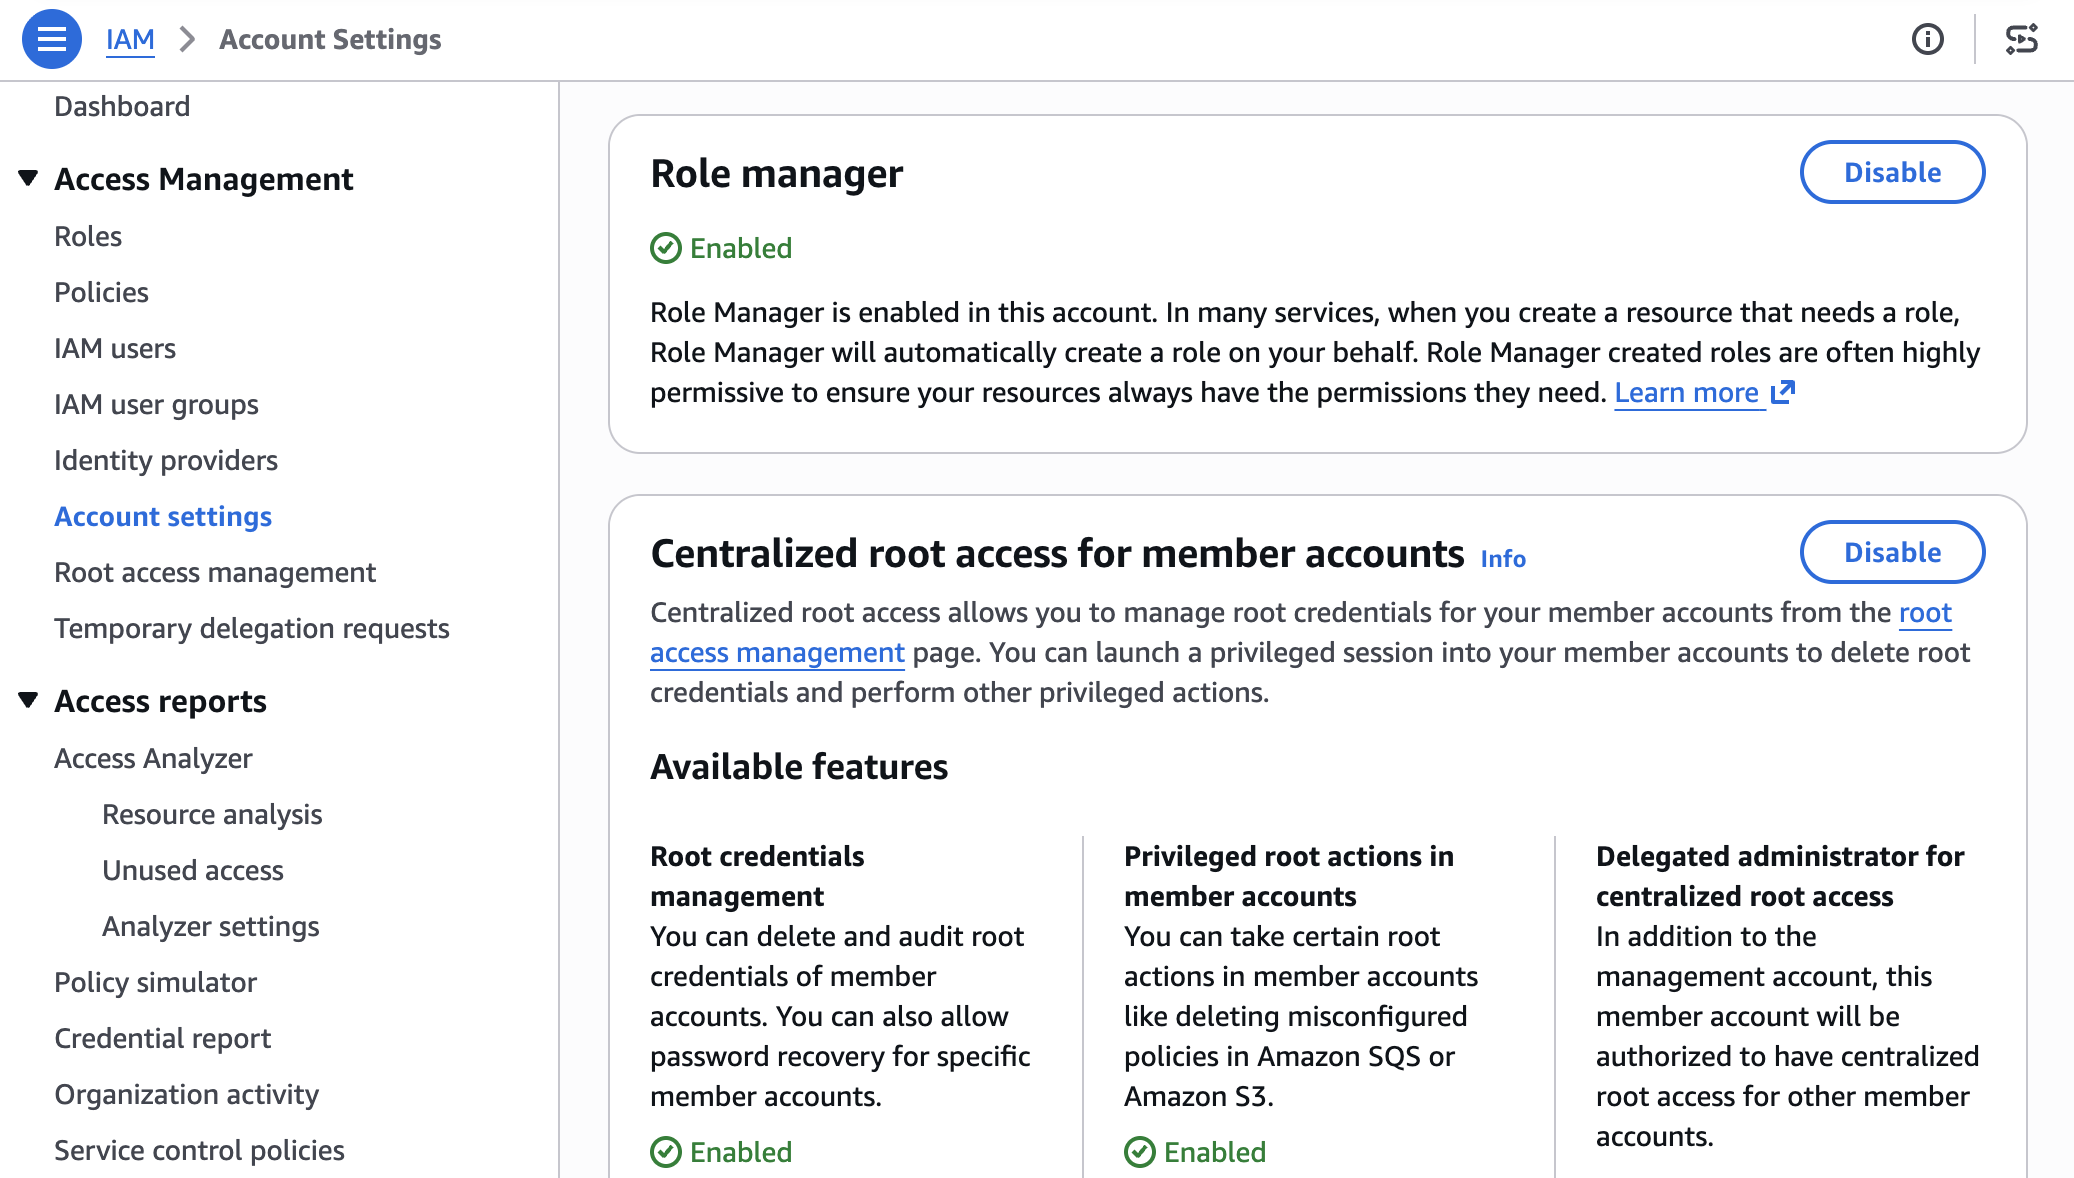
  1. Open the IAM console and choose Account settings.
  2. In the role manager section, choose Enable.

Figure 1: Enable Role Manager

Figure 1: Enable Role Manager

Some AWS services already create a role for you when you create a resource that needs one. Role manager doesn’t change that: those services keep creating roles automatically, and roles you already created keep working. What role manager adds is a single account-level control, and coverage for a case that built-in flows can’t handle: tasks whose permissions AWS can’t determine in advance, such as running your own code. For those tasks, role manager provisions a role that you can narrow later.

Example: Create an Amazon EventBridge rule

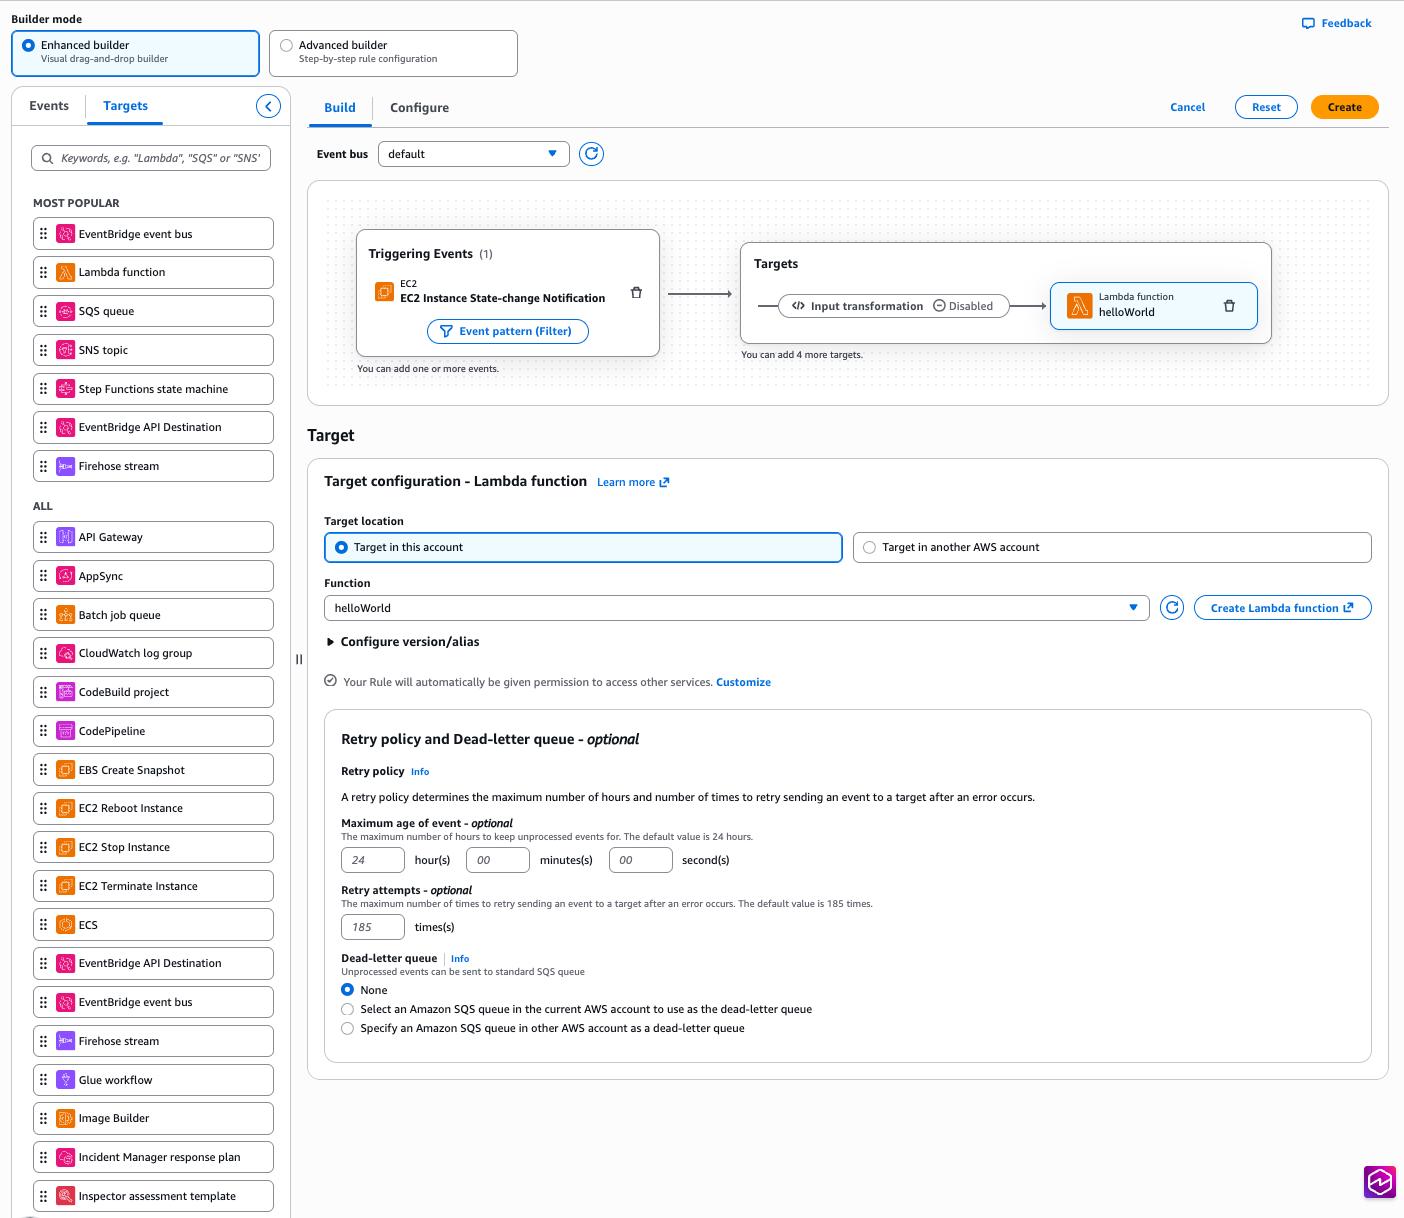
Start with a common task: an Amazon EventBridge rule that invokes a target, such as an Amazon Simple Queue Service (Amazon SQS) queue or an Amazon Simple Notification Service (Amazon SNS) topic. Without role manager, you would pause here to create a role that lets EventBridge invoke the target, write the role’s trust policy, attach the required permissions, and then return to finish the rule. With role manager enabled, you define the rule and its target, choose Create, and role manager provisions the role and attaches it for you. The EventBridge console shows the rule created and ready, and you never open the role-creation flow.

Figure 2: Creating an EventBridge rule with no manual role setup

Figure 2: Creating an EventBridge rule with no manual role setup

The role comes from an AWS managed role template: a definition AWS builds and maintains for a specific task, with the trust policy and permissions already worked out. The console calls a new IAM API, AcquireRole, which finds the matching template, provisions the role from it, and returns it to EventBridge. Depending on the service, AcquireRole either creates a new role or reuses one that already fits, so an account does not fill up with duplicate roles for the same task.

Role manager creates the role using your own IAM permissions, not a separate role-manager permission. To provision a new role, you need permission for the actions the template performs: at minimum, you need permissions to create and attach roles. When AcquireRole reuses an existing role instead of creating one, it needs only iam:GetRole and iam:GetRoleTemplateVersion. If you’re missing either of these permissions, the console tells you which one is needed rather than creating the role.

Run code that calls other AWS services

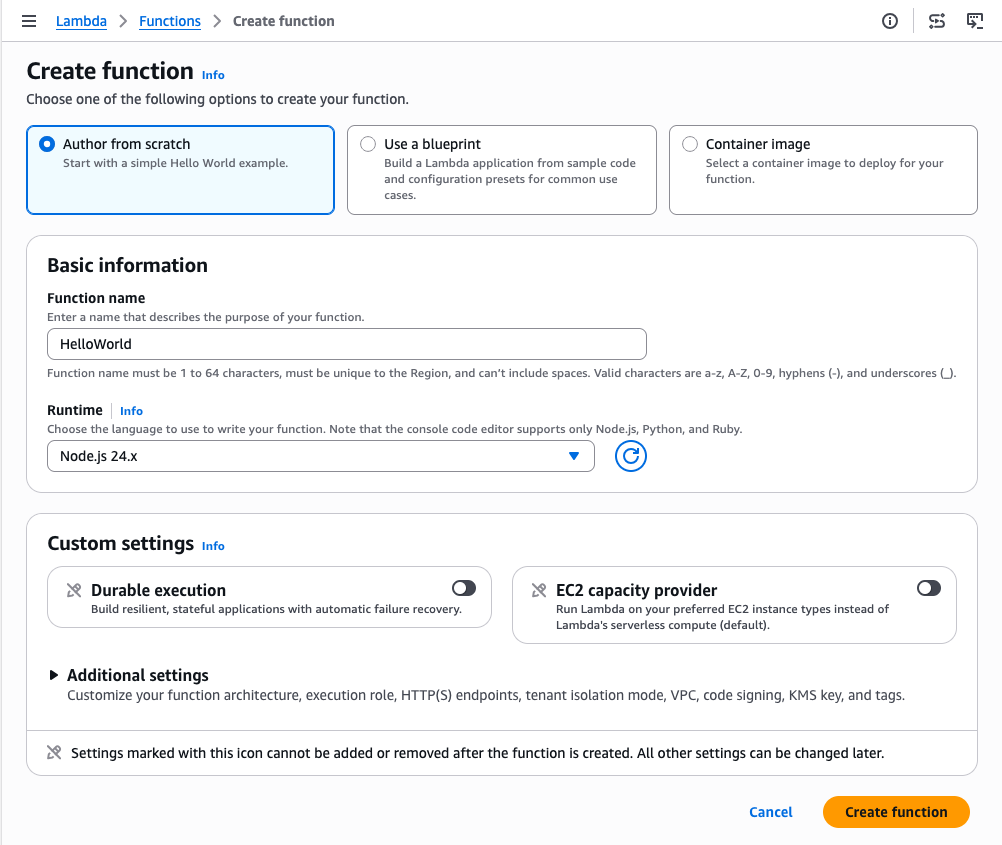
Not every task has a set of permissions AWS can define in advance. When a role runs your own code, such as a Lambda function, AWS has no way of knowing which services that code will call. Role manager covers this case too: create a Lambda function with role manager enabled, and it attaches an execution role that your code can use right away and that you can narrow once you know what the function calls.

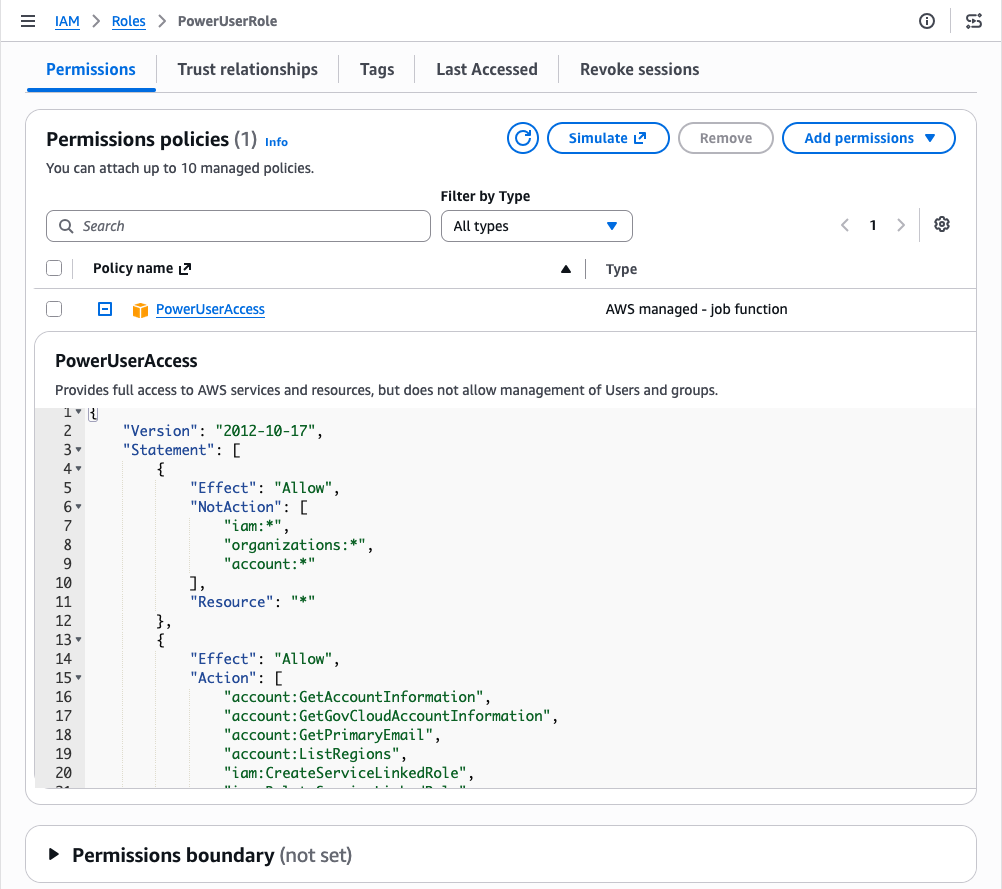
Because the permissions your code needs aren’t known up front, role manager attaches the AWS managed policy PowerUserAccess to the role. PowerUserAccess grants access to AWS services so your function can call what it needs. By design, it doesn’t grant permission to manage IAM, AWS Organizations, or account settings. The template also configures the role to trust only the Lambda service.

Figure 3: Create an AWS Lambda function with no manual role setup

Figure 3: Create an AWS Lambda function with no manual role setup

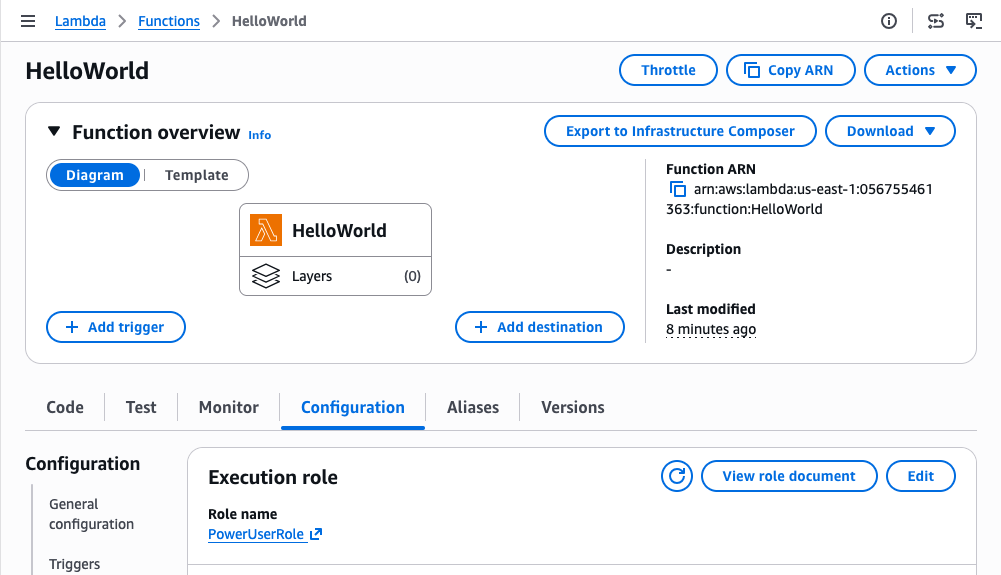
Role manager attaches an execution role, and your function is ready to run. Figure 4 shows the Execution role panel on the function’s Configuration tab, with the role that role manager attached.

Figure 4: Role manager provides a role automatically to an AWS Lambda function

Figure 4: Role manager provides a role automatically to an AWS Lambda function

You can open the role in the IAM console to review its permissions. Figure 5 shows the role’s Permissions tab with the PowerUserAccess policy attached.

Figure 5: Permissions of the role provided by role manager for an AWS Lambda function

Figure 5: Permissions of the role provided by role manager for an AWS Lambda function

You keep full visibility into what role manager creates. Every role it creates records the role template it came from, and both GetRole and ListRoles return that template reference. You can inspect any role in your account and tell which were created by role manager. You read a role’s trust policy and permissions the same way you would for a role you authored, and AWS CloudTrail records each role’s creation.

Refining roles as workloads mature

As your workloads mature, refine the roles that role manager created to follow least privilege. When you’re ready, you can disable role manager and get IAM Access Analyzer unused access analysis at no additional cost for 90 days. Access Analyzer looks at how each role has been used and recommends a policy you can apply that keeps only the permissions the role needs. Start with the roles attached to your most critical workloads and work outward.

Disabling role manager doesn’t disrupt anything already running: your resources keep the roles they have, those roles stay in your account until you change them, and from that point you author new roles yourself, the same as before. If you would rather narrow a single role than the whole account, editing that role removes it from role manager’s control and it becomes a standard customer-managed role, with your changes preserved. In sandbox or development accounts, keeping role manager enabled saves time. For production workloads, disable role manager and refine the roles it created to least privilege before going live.

Conclusion

Role manager automates IAM role setup so you can focus on building from the start. When you enable it, AWS creates and attaches the IAM roles your resources need as you build, so you can start in minutes without prior IAM experience. Because these are IAM roles that you fully control, you keep the same visibility and the same tools you already use. Keep role manager enabled while you build, and refine the roles it created as your workloads mature.

To get started, enable role manager in the IAM console and create a resource in a supported service. To learn more, see IAM role creation and the list of supported services in the IAM User Guide.

If you have feedback about this post, submit comments in the Comments section below.


Zach Jiang

Zach Jiang

Zach is a Senior Technical Product Manager at AWS, specializing in AWS Identity products. He focuses on making identity the easy part of building on AWS for customers. Outside of technology, Zach enjoys traveling and exploring new cultures and cuisines.

David Sing

David Sing

David is a Principal Product Manager at AWS, specializing in AWS IAM. He focuses on simplifying IAM for builders and AI agents, safe credential issuance for AI agents, and authorization policy governing agent access. Outside of technology, David enjoys economics and markets, fishing, and time outdoors with his family.

Punit Deotale

Punit Deotale

Punit is a Software Development Manager on the AWS IAM team. He leads work on making it easier for customers to create and manage IAM roles directly within AWS service workflows, so they can set up the right permissions without leaving what they are doing. His focus is reducing permission-setup friction across AWS while helping customers stay aligned with least privilege. Outside of work, Punit enjoys reading, building side projects, and being outdoors.

  •  

From 2 weeks to 2 minutes: Amazon Cognito launches Provisioned limits for self-service rate limit management

Imagine preparing for your biggest sales event of the year, and you want to ensure your customer identity management service can handle the elevated traffic for carrying out application activities. For security teams, business leaders, and technologists managing identity infrastructure at scale, this scenario has been all too familiar. Whether you’re a CISO evaluating security controls, a CFO managing cloud costs, traditional support ticket processes for adjusting Amazon Cognito rate limits meant waiting 10–14 days for capacity increases, requiring teams to plan weeks in advance or rush to escalate.

Today, we’re announcing provisioned limits for Amazon Cognito, a capability that transforms how you manage authentication rate limits. This introduces a feature in the AWS Management Console for Amazon Cognito for on-demand capacity adjustments, working alongside the existing account-level maximum limits in AWS Service Quotas. Together, they give you self-service control over your authentication infrastructure so you can scale up for Black Friday (or similar sales events), scale down after tax season, and optimize costs with unprecedented precision. What once took up to 2 weeks now happens in minutes.

In this post, you’ll learn how provisioned limits work, the relationship between account-level maximums and provisioned capacity, the cost implications and optimization strategies, and step-by-step implementation guidance. This capability fundamentally changes how you approach authentication capacity planning.

Manual processes that can’t keep pace

Identity management services open the front door to your application. When users can’t sign in, everything else stops. Amazon Cognito offers extremely flexible limit management: customers can request adjustments as granular as 1 request per second (RPS) for as short as 1 day. As customer demand for faster, self-service adjustments grew, we identified opportunities to address the following challenges:

  • Support tickets required for each rate limit change
  • 10–14 day approval timelines for standard review and processing
  • Advance planning needed weeks ahead of anticipated traffic spikes

For businesses with seasonal traffic, like tax preparation services that see 90% of annual authentication volume in March and April, or ecommerce platforms preparing for Black Friday, these factors meant teams had to plan capacity decisions well in advance with limited ability to adjust in the moment.

Provisioned limits and account-level max limits

Starting July 6, 2026, Amazon Cognito introduced provisioned limits in the Amazon Cognito console. At the account level (per AWS Region, per account), you’ll find a Provisioned limits tab next to the User Pools tab. This gives you direct control over your authentication rate limits through two complementary mechanisms:

  • Provisioned limits (Amazon Cognito console) – Adjust your provisioned capacity up or down on-demand. Changes take effect immediately. You’re billed for the capacity you provision above the default limit, regardless of how much you use.
  • Account-level max limit (Service Quotas console) – Set your account’s ceiling, the maximum RPS your account is allowed to provision. Raising this ceiling doesn’t incur additional charges. Approximately 90% of requests are automatically approved within minutes. For larger limit increases (depending on the API category and Region), manual approval through AWS Support might still be required.

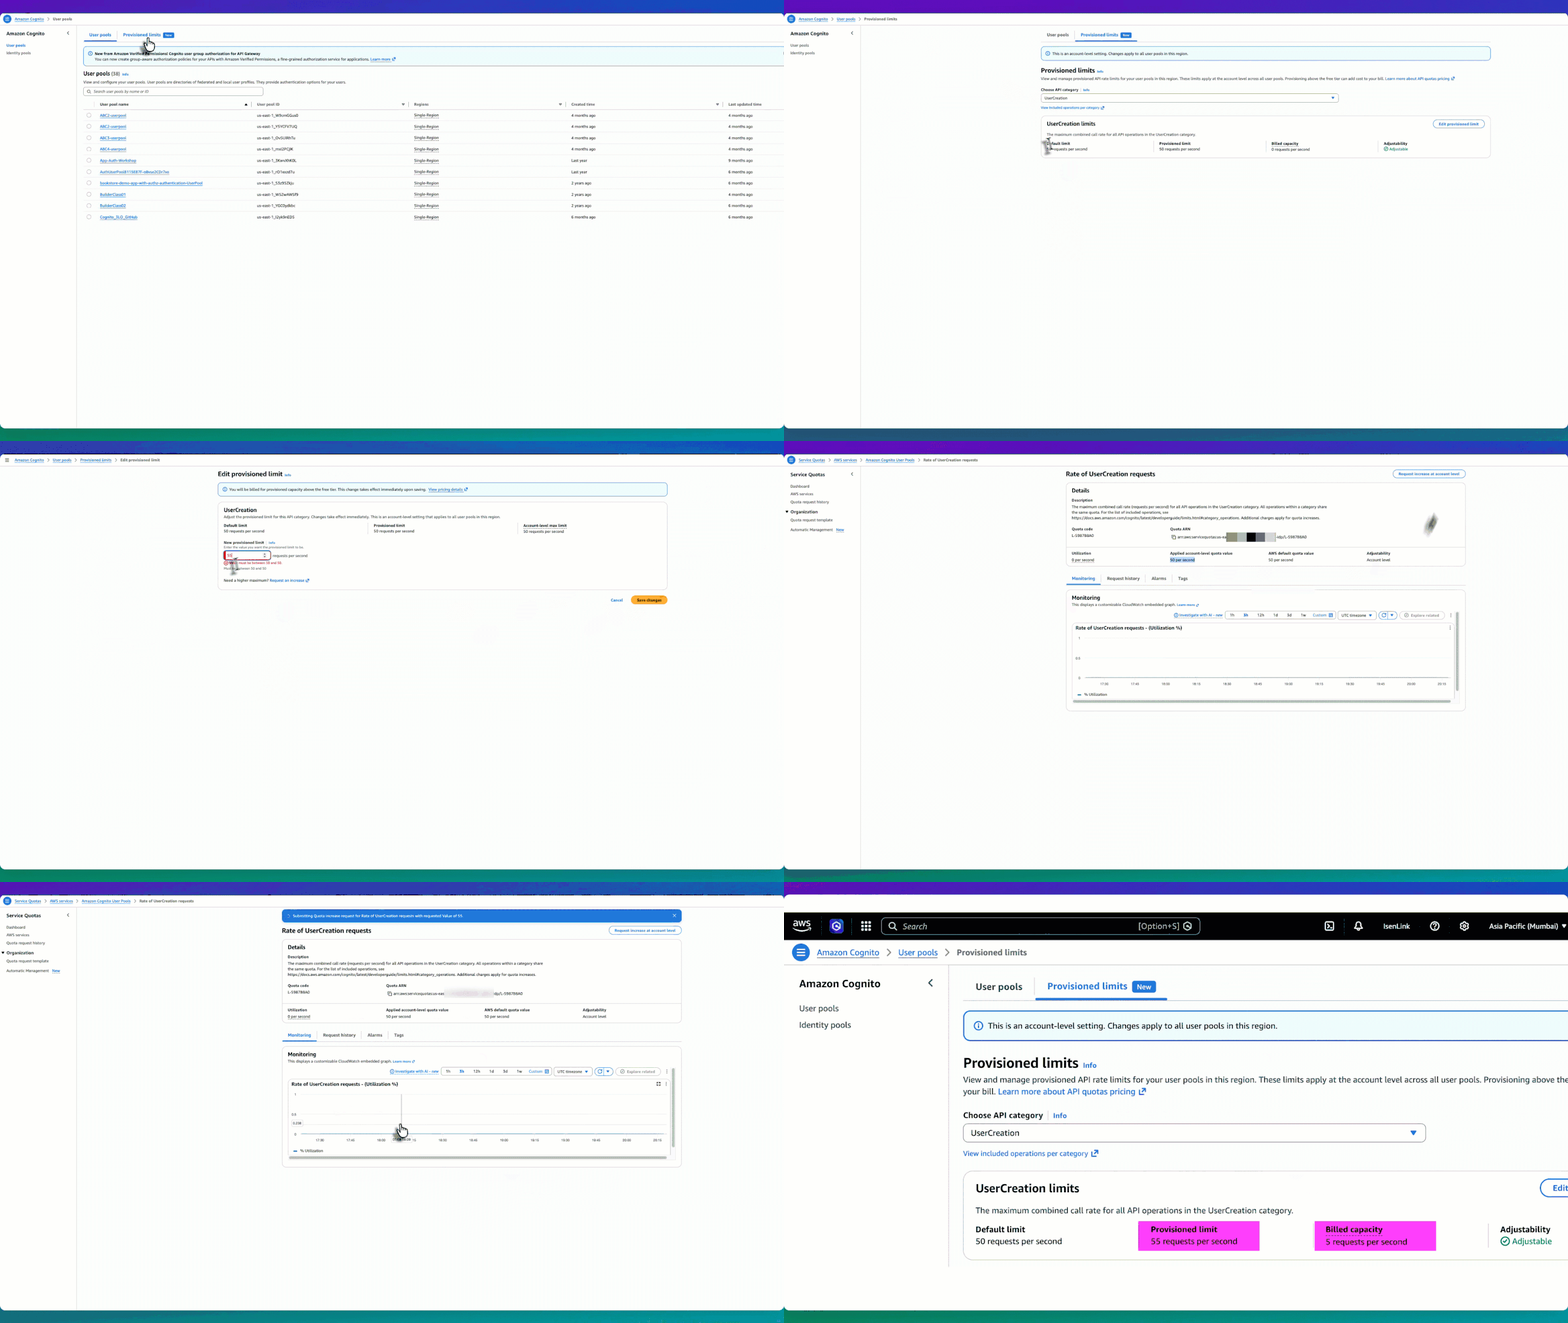
The following experience shows the end-to-end workflow of adjusting your provisioned limits and requesting a higher account-level max.

Figure 1: Provisioned limit experience workflow

Figure 1: Provisioned limit experience workflow

How they work together

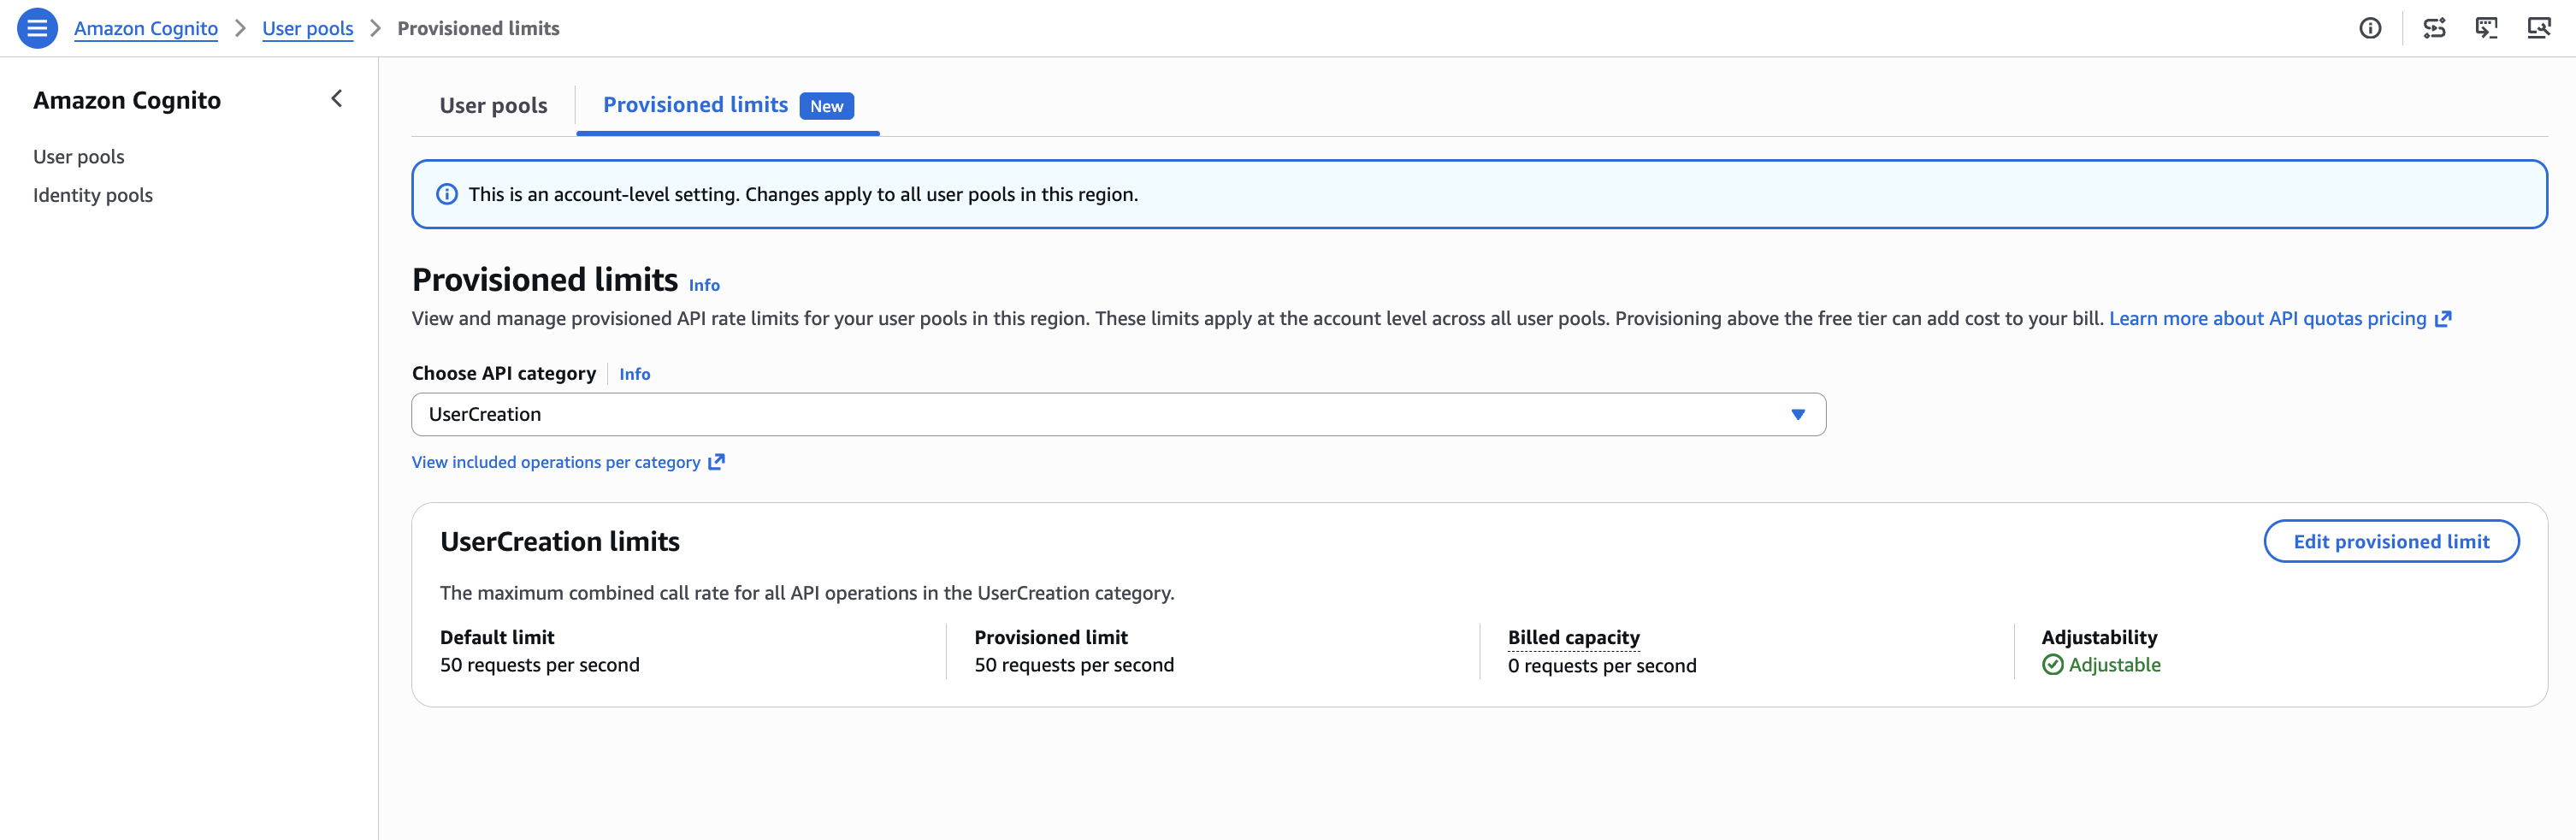
Let’s use the UserCreation API as an example. The default limit is 50 RPS, and initially the provisioned limit is also 50 RPS—meaning billed capacity is 0 (no additional charge). The applied account-level max limit is also 50 RPS. So you have three values: default (50), provisioned limit (50), and account-level max (50).

  1. Start by going to the Amazon Cognito console and choosing User pools from the navigation pane.

    Figure 2: UserCreation with default values

    Figure 2: UserCreation with default values

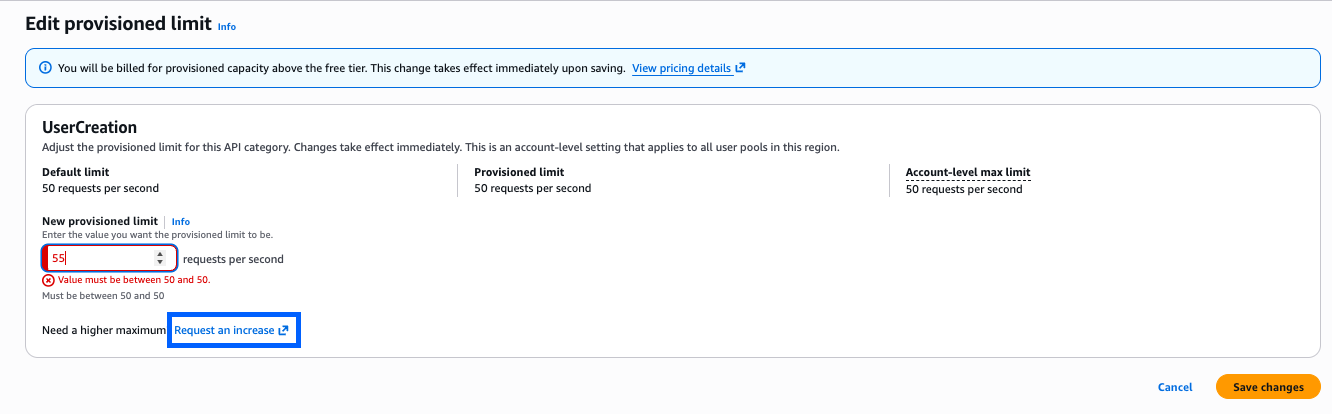
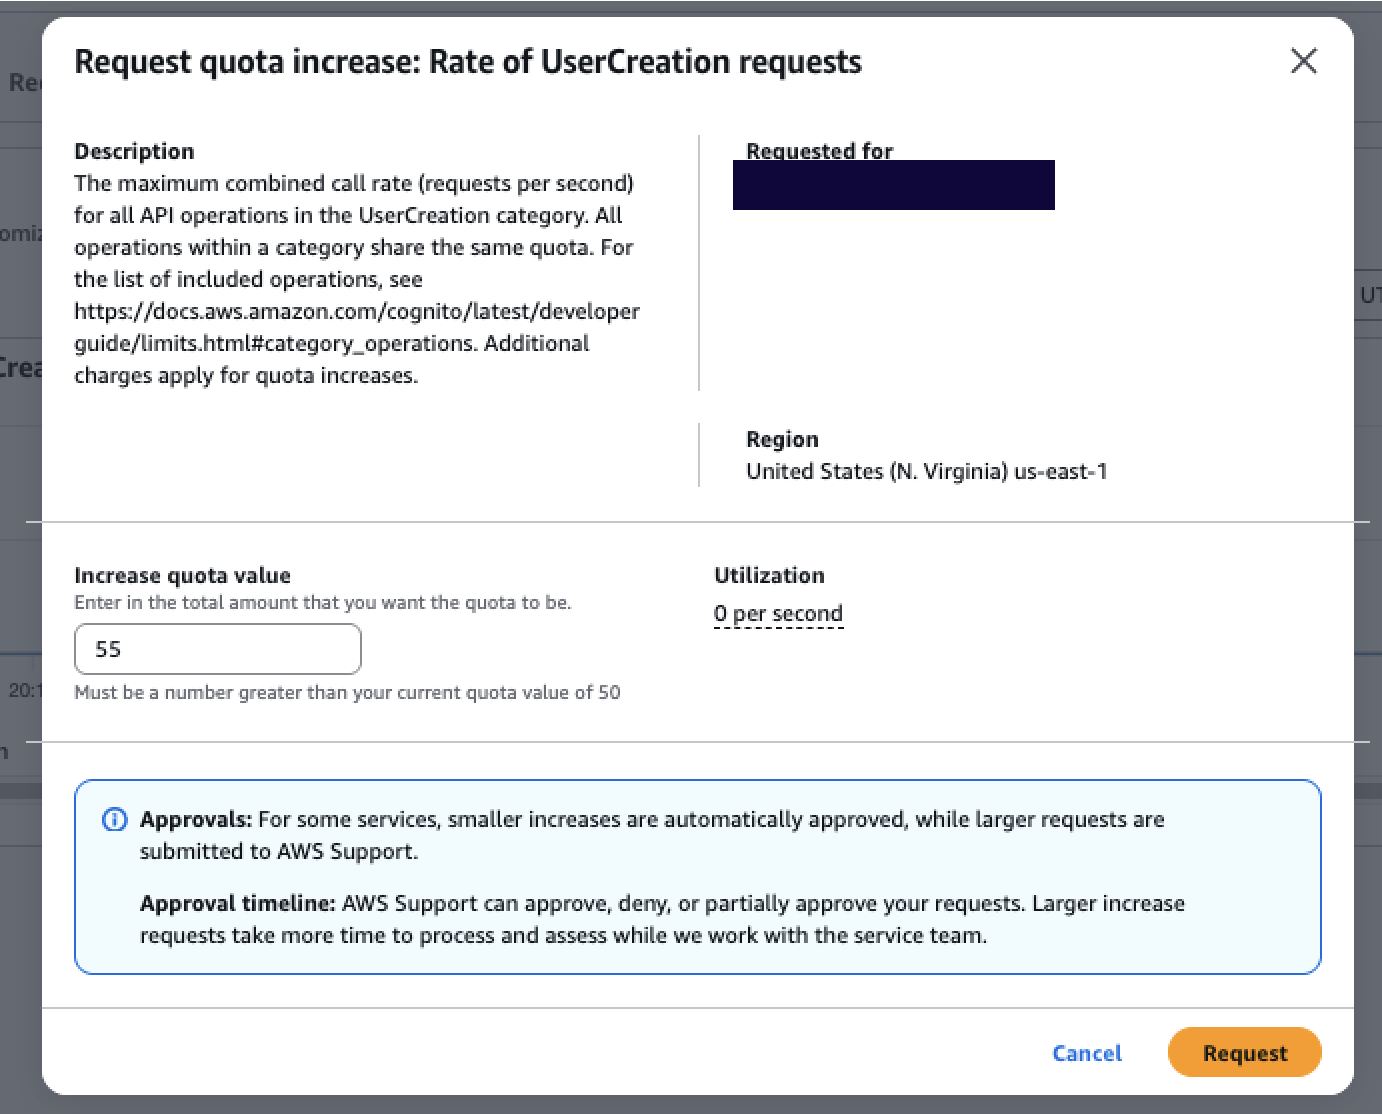
  2. Choose Edit provisioned limit, to go to the Edit provisioned limit page with an input field for New provisioned limit. However, because the account-level max limit is 50 RPS, you can’t set the provisioned limit above 50. For example, if you want to provision 55 RPS, the console won’t allow it because 55 exceeds the current account max of 50.

    Figure 3: Editing the provisioned limit constraint constraint to more than the account-level max

    Figure 3: Editing the provisioned limit constraint constraint to more than the account-level max

  3. To set a higher limit, choose Request an increase. This takes you to the Service Quotas console, where you can choose Request increase at account level to request a higher account-level max, for example, 55 RPS. Most requests are automatically approved within minutes. At any time, you can check the status of the request using the Request history tab.

    Figure 4: Service Quotas page where the account-level max increase is requested and auto-approved

    Figure 4: Service Quotas page where the account-level max increase is requested and auto-approved

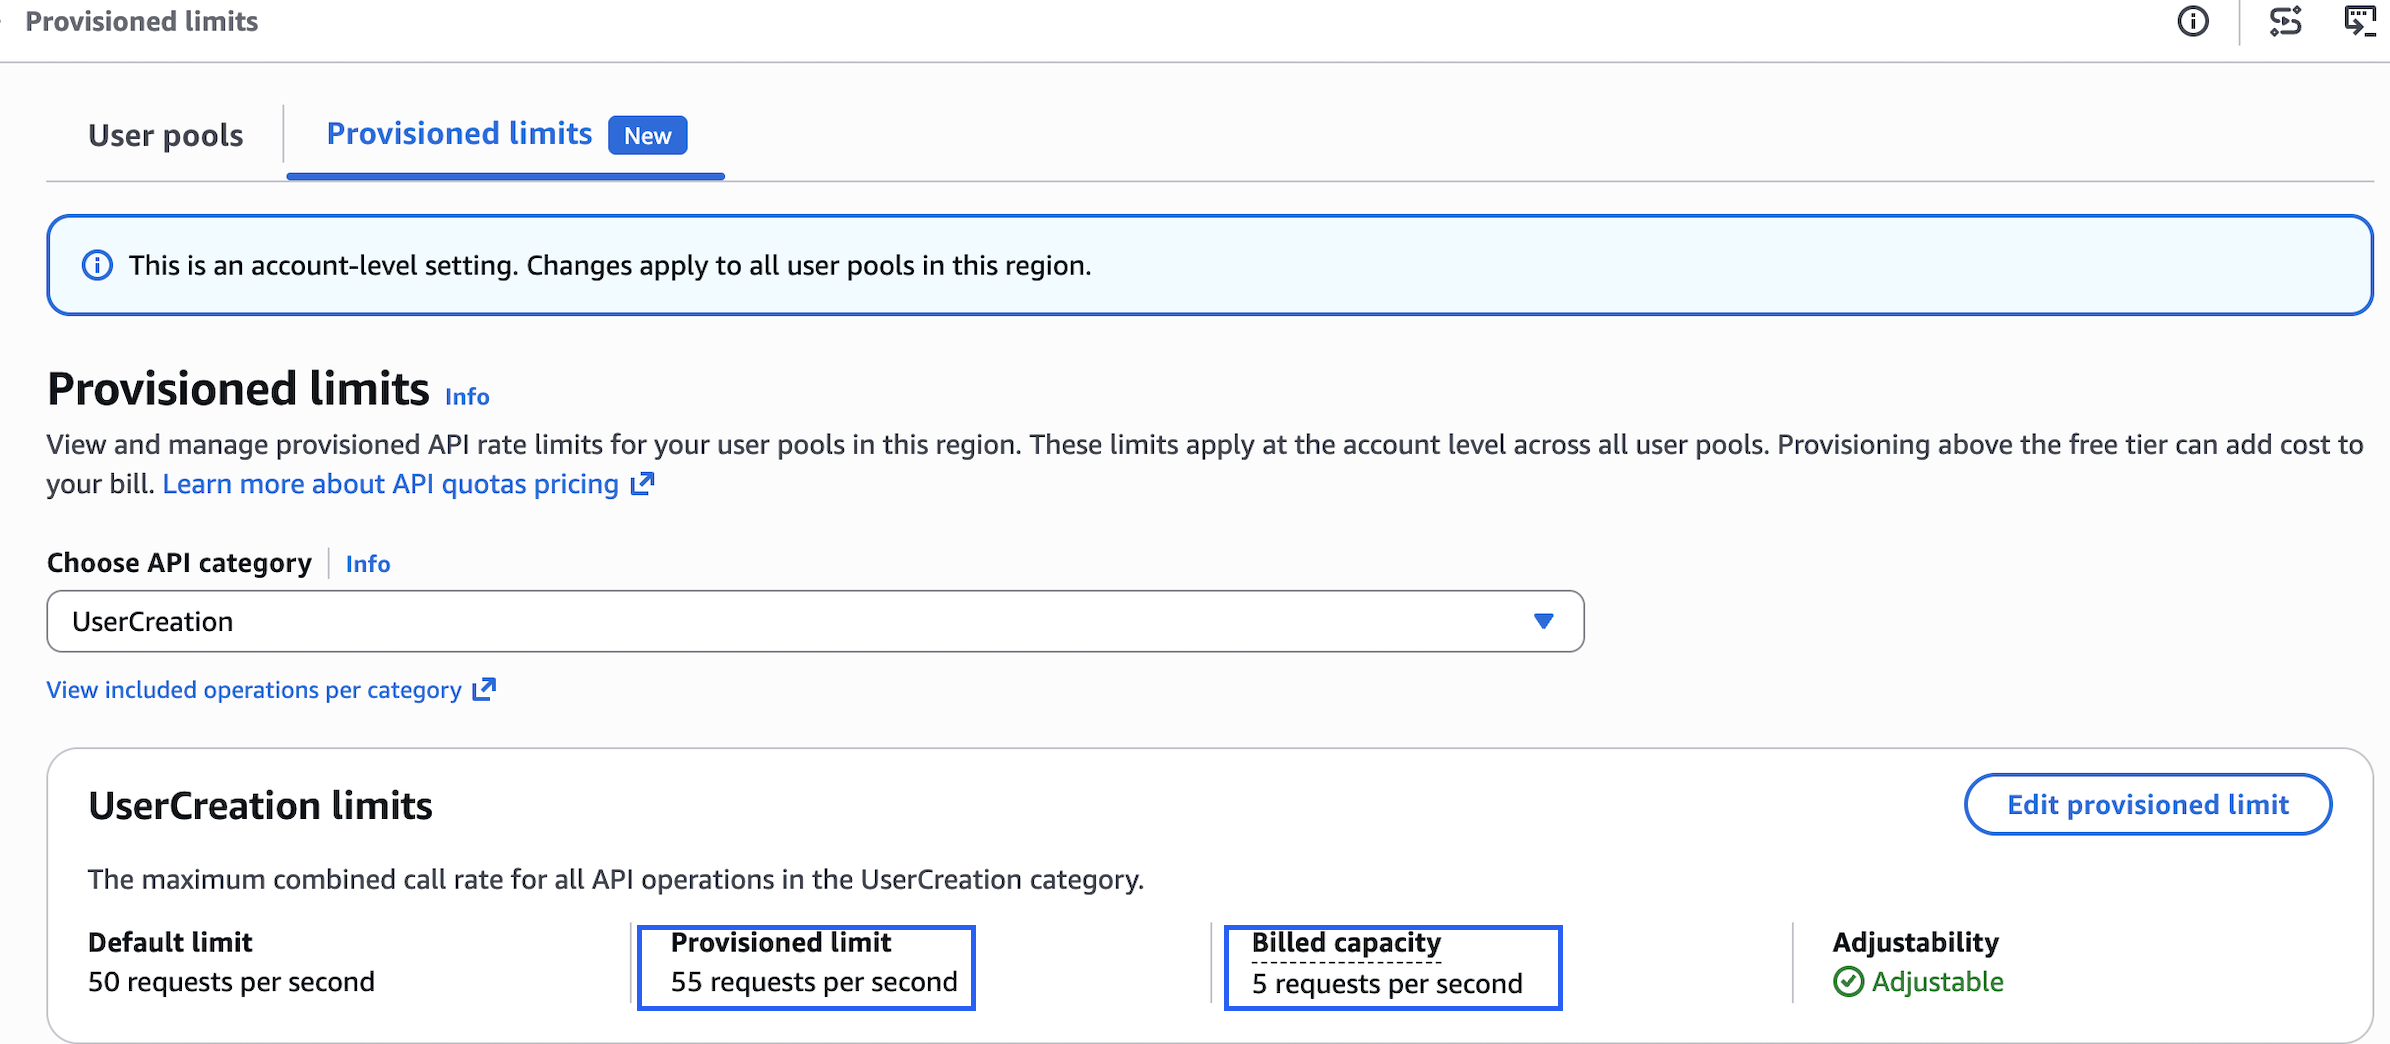
  4. After receiving approval, return to the Amazon Cognito console to edit your provisioned limit up to 55 RPS. Your billed capacity becomes 5 RPS (55 minus the 50 default).

    Figure 5: Provisioned after increasing the provisioned limit to 55 RPS, with billed capacity of 5 RPS.

    Figure 5: Provisioned after increasing the provisioned limit to 55 RPS, with billed capacity of 5 RPS.

This two-part model gives you precise control over both cost and capacity. Raising the account-level max in Service Quotas doesn’t incur additional charges—it only sets your ceiling. You are billed for what you provision in the Amazon Cognito console above the default, so you benefit from right-sizing your provisioned capacity to match expected demand. Raise your account max ahead of time to prepare for future scaling needs without incurring any cost. When the time comes, increase your provisioned limit to what you need, and scale back down after the event. You stop being charged for the extra capacity as soon as you reduce the provisioned limit. This applies equally to seasonal spikes, planned load tests, or unexpected viral growth—all self-service, all within minutes.

How the provisioned limits experience works

The provisioned limits experience introduces three key concepts that work together:

  • Default limit – The baseline rate included at no additional cost (for example, 50 RPS for UserCreation).
  • Provisioned limit – The capacity you actively request and reserve in the Amazon Cognito console. Because this capacity is reserved specifically for your account, it’s the chargeable dimension. You’re billed for any provisioned capacity above the default, regardless of how much you consume. For example, if the default is 50 RPS and you provision 80 RPS, you’re billed for 30 RPS even if your actual usage is only 60 RPS. If your provisioned capacity is 50 RPS (the default), your billed capacity is 0.
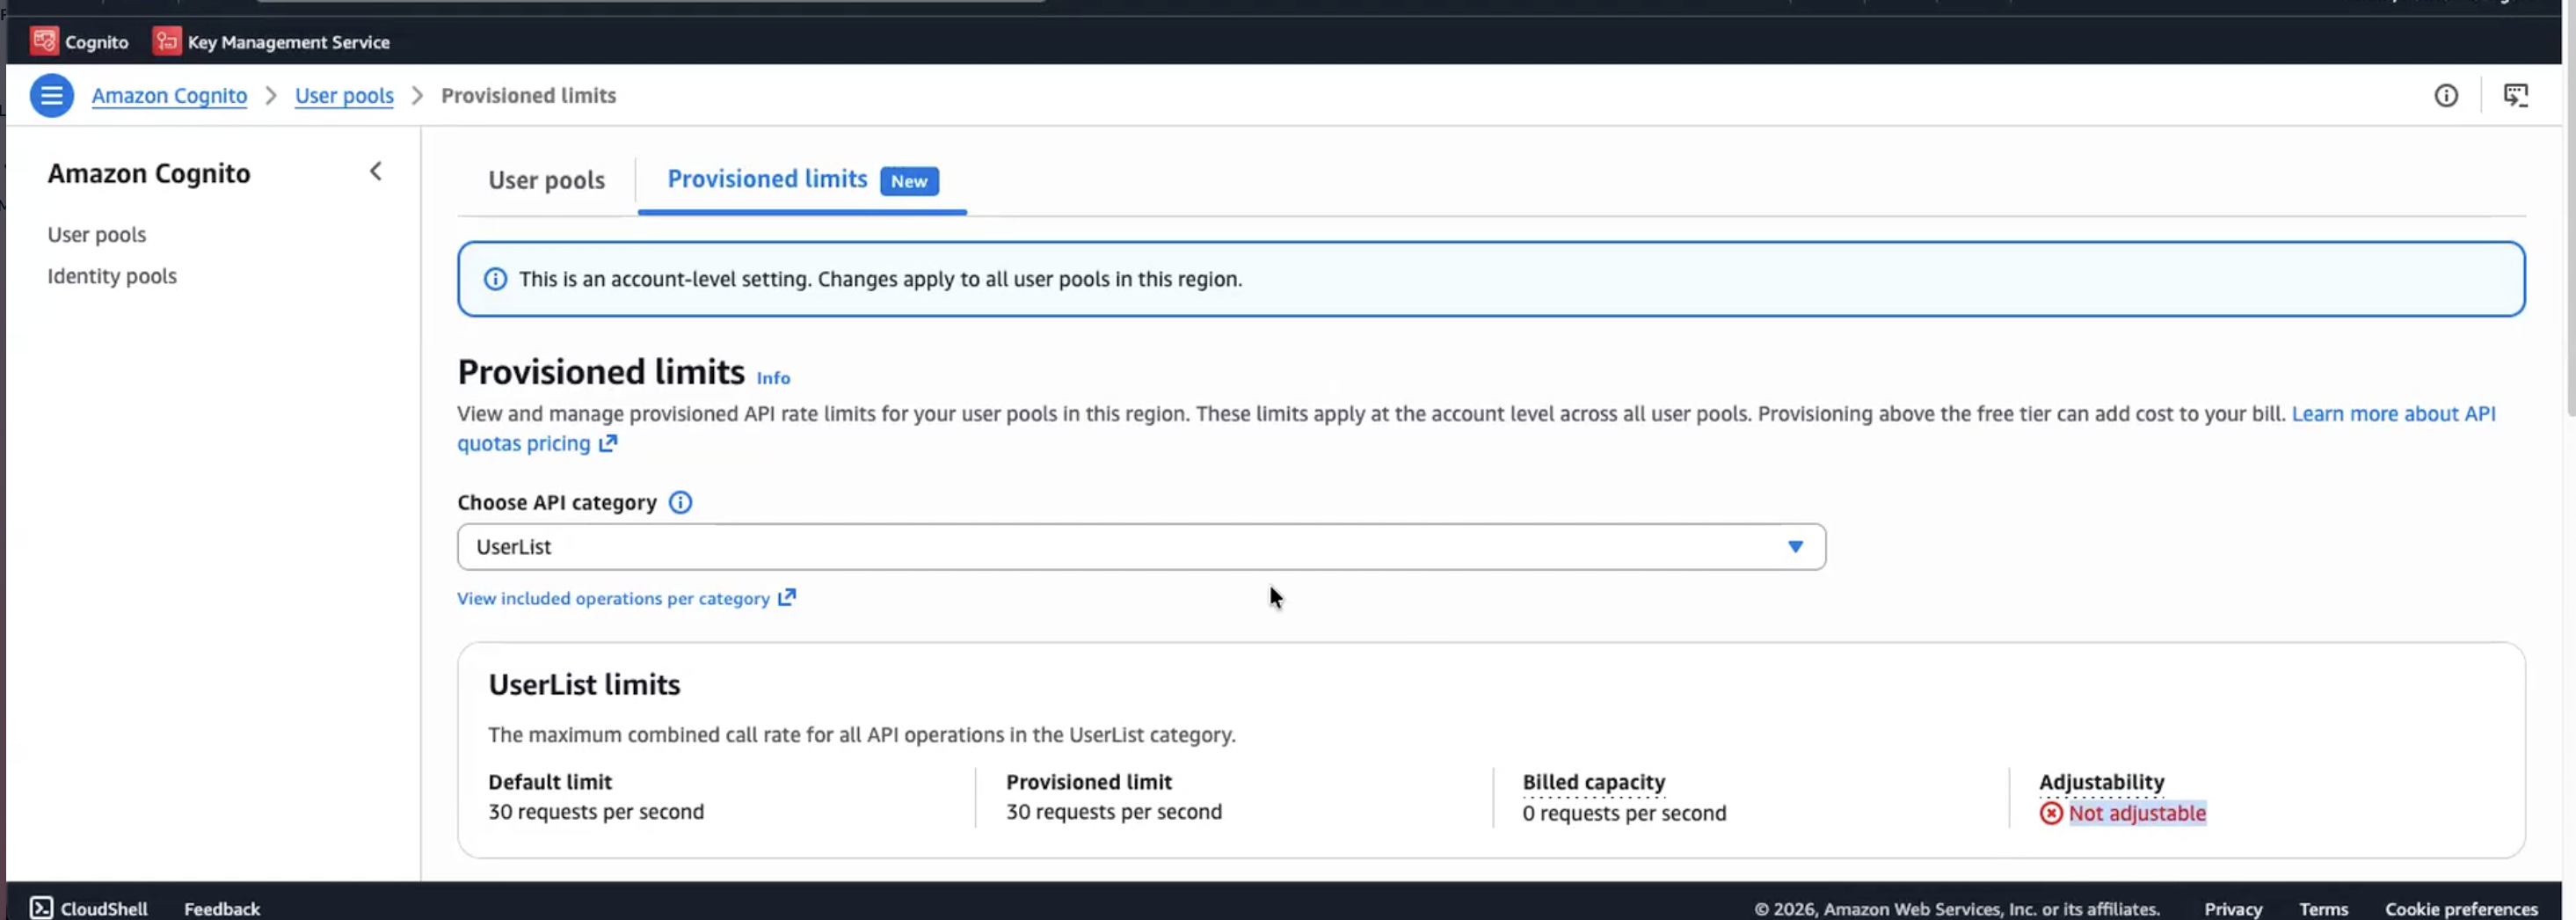
  • Applied account-level max limit – The ceiling managed through Service Quotas. This determines how high you can set your provisioned limit. Raising this ceiling doesn’t incur charges, it only unlocks the ability to provision higher capacity. Importantly, the Provisioned limits page displays each API category with its adjustability status. For example, UserCreation is marked Adjustable (shown earlier in Figure 5) and can be modified. However, UserList is marked Not adjustable, meaning the account-level max limit can’t be adjusted for that category. You can still see its default and provisioned limit on the page, but you can’t modify them. For adjustable categories, you will see the default limit, current provisioned limit, and billed capacity at a glance.
Figure 6: Provisioned limits overview with non-adjustable API categories.

Figure 6: Provisioned limits overview with non-adjustable API categories.

Multi-tenant SaaS considerations

For software as a service (SaaS) providers managing multiple tenants with varying throughput requirements, the UpdateProvisionedLimit API enables programmatic management of provisioned capacity. Teams using dedicated user pools per tenant, for example, can integrate this into their infrastructure-as-code pipelines to adjust provisioned limits per tenant tier. With provisioned limits, SaaS vendors can tier their capacity management per tenant, for example, provisioning higher capacity for enterprise-tier tenants and lower capacity for free-tier tenants, and adjust each tenant’s provisioned capacity independently through the API based on their service tier and demand patterns.

Conclusion

With provisioned limits, whether you’re preparing for peak shopping season, tax filing deadlines, or any other scaling event, you can now adjust provisioned limits to respond to your organization’s needs on demand. The separation between the account-level max (in Service Quotas) and the provisioned limit (in the Amazon Cognito console) gives you full control to plan ahead, respond to demand changes in minutes, and optimize costs on your own terms.

Get started

The provisioned limits experience for Amazon Cognito user pools launched on July 6, 2026, and is available across all AWS Regions where Amazon Cognito is supported. To get started:

  1. Review your current authentication traffic patterns using Amazon CloudWatch metrics to understand your baseline
  2. Set up CloudWatch alarms at 70% and 85% of your current rate limits
  3. Ensure your team has appropriate AWS Identity and Access Management ( IAM) permissions for both Service Quotas and the Provisioned limits tab in the Amazon Cognito console
  4. Raise your account-level max in Service Quotas based on your demand expectations
  5. Use the Amazon Cognito console Provisioned limits tab to adjust capacity up or down as needed

Resources:

Need help? Contact your AWS account team or visit AWS Support for assistance with planning your rate limit strategy.

If you have feedback about this post, submit comments in the Comments section below.


Kiran Dongara

Kiran is an Enterprise Solutions Architect at AWS, primarily supporting Retail, Restaurant, and CPG customers. His primary focus is application identity within the IAM domain. His expertise includes deep technical understanding across technical and industry domains, which he integrates to design scalable and efficient architectures using best practices. When not working, Kiran prioritizes family time, nature walks, and cycling.

Howie Li

Howie Li

Howie Li is a Product Manager at Amazon Web Services, where he strives to make authentication straightforward by default. Outside of work, Howie enjoys exploring cultures and food through travels and making new ice cream flavors inspired by them.

  •  

HIPAA Security Rule on AWS – Technical Safeguards Implementation and Readiness Guidance

Today, we’re releasing the HIPAA Security Rule on AWS: Technical Safeguards Implementation and Readiness Guidance. This helps covered entities and business associates configure, implement, and evidence compliance with the HIPAA Security Rule Technical Safeguard requirements (45 CFR §164.312) when building healthcare workloads on AWS.

The HIPAA Security Rule’s Technical Safeguards (§164.312) define five standards and nine implementation specifications covering access control, audit controls, integrity, authentication, and transmission security.

The guidance also covers the 2025 NPRM proposed changes, including encryption at rest and in transit becoming required, multi-factor authentication (MFA) becoming mandatory for all electronic Personal Health Information (ePHI) access, and new specifications for network segmentation, configuration management, anti-malware protection, patch management, software removal, incident response and breach notification.

Key topics included

  • Shared responsibility for HIPAA on AWS – A responsibility matrix mapping each §164.312 specification to what AWS manages nd what the customer must configure and operate.
  • ePHI boundary architecture – Guidance on establishing a defined ePHI boundary
  • ePHI data flow and encryption – A reference architecture tracing ePHI with the applicable §164.312 specification
  • Foundation checklist – Prerequisite recommendation before configuring individual Technical Safeguard controls.

This guidance is written for cloud architects, security engineers, CISOs, and compliance teams at covered entities and business associates building or operating AWS healthcare workloads. It assumes familiarity with AWS services and is intended as a practical implementation reference, not a legal or regulatory interpretation. This guidance focuses exclusively on Technical Safeguards.

HHS published a Notice of Proposed Rulemaking in January 2025, proposing significant updates to the HIPAA Security Rule—including eliminating the Addressable designation, making encryption, MFA, and asset inventory mandatory, and introducing new technical requirements not present in the current rule. As of June 2026, the final rule has not been published. This guidance covers both the current rule and the proposed changes and recommends treating all specifications as Required for new workloads.

Download HIPAA Security Rule on AWS: Technical Safeguards Implementation and Readiness Guidance.

For questions about HIPAA readiness on AWS, including Administrative Safeguards, Physical Safeguards, risk analysis, and assessment preparation, contact the AWS Security Assurance Services team or your AWS account representative.

This guidance is provided by AWS Security Assurance Services, LLC, a HITRUST External Assessor Firm and PCI-QSAC along with contribution from AWS HCLS, AWS Compliance teams. It is for informational and guidance purposes only and does not constitute legal, regulatory, or compliance advice. Recipients are solely responsible for determining applicability to their specific environments and legal obligations.

If you have feedback about this post, submit comments in the Comments section below.


Abdul Javid

Abdul Javid

Abdul is a Senior Security Assurance Consultant at AWS Security Assurance Services. He holds HITRUST certifications and has led HITRUST r2 and i1 engagements across multiple healthcare technology companies. Abdul holds multiple security and auditing certifications and supports customers building responsible AI governance programs on AWS. He has over 25 years of experience and holds certifications across AWS, CMMC, PCI DSS, PMI, ISC2, and ISACA.

Shreya Singh

Shreya Singh

Shreya is a Security Assurance Consultant at AWS with more than eight years of experience in governance, risk, compliance, and cloud security. She holds the CISA and HITRUST Certified CSF Practitioner (CCSFP) certifications and supports healthcare and technology organizations with HITRUST, HIPAA, SOC 2, risk management, and audit readiness initiatives.She holds a Master of Engineering in Cybersecurity from the University of Maryland, College Park.

Kapil Temghare

Kapil Temghare

Kapil is a Security Industry Specialist at AWS with over 10 years of experience spanning compliance, cloud security, and regulatory operations. He manages HIPAA compliance within the Regulatory Operations Center (ROC), including service eligibility assessments, controls validation, and compliance sign-off. Beyond healthcare, Kapil supports various regulatory programs such as FedRAMP and the EU Data Act and holds CISSP certification.

Hector Rodriguez

Hector Rodriguez

Hector is a Principal Industry Specialist and Executive Security Advisor, AWS Health & Life Sciences. He has over 25 years of experience enabling Health & Life Sciences business and clinical transformation and innovation and with multiple industry and academic groups. He is a board advisor for healthcare startups, a founding member of the HITRUST Business Associate Council and a health industry and cybersecurity curriculum advisor and lecturer.

  •  

Extend Amazon Inspector SBOM Generator with Plugins

Amazon Inspector is an automated vulnerability management service that continually scans Amazon Web Services (AWS) workloads for software vulnerabilities. The vulnerability management capabilities of Amazon Inspector are powered by an asset inventory engine known as the Amazon Inspector SBOM Generator (inspector-sbomgen), a standalone command-line tool that produces a software bill of materials (SBOM) from container images, directories, archives, local systems, compiled binaries, and more. Over the past two years, we’ve expanded inspector-sbomgen’s coverage across dozens of programming language ecosystems, operating systems, and widely deployed applications.

We’re pleased to announce a new capability for builders using inspector-sbomgen: a plugin system for writing your own custom package collectors that you can use right away, without requiring source code compilation nor waiting for an official release.

You can download the latest version of inspector-sbomgen from the Amazon Inspector User Guide.

In this post, we walk you through what the inspector-sbomgen plugin system does, why we built it, and how you can write your first plugin in a few minutes. Along the way, we also cover how plugin-generated package components integrate with Amazon Inspector for vulnerability scanning, and we explore the plugin safety model, which helps ensure security-hardened and predictable plugin behavior.

Why we built a plugin system

Software ecosystems are dynamic. New language package managers, lockfile formats, and end user applications ship constantly, and many are adopted quickly, in some cases with little security scrutiny. That leaves security teams with a visibility gap: production workloads running software that their SBOM tooling doesn’t yet recognize. Customers have asked us to inventory many of these ecosystems directly, and until recently, the only path to support was to open a feature request and wait for the inspector-sbomgen team to onboard the ecosystem and deploy a new release.

The inspector-sbomgen plugin system changes that. With plugins, you can:

  • Onboard ecosystems that inspector-sbomgen doesn’t support out of the box. New open source ecosystems, niche or fast-moving package formats, and internal or proprietary tooling can all be inventoried without modifying inspector-sbomgen.
  • Prototype detection for an ecosystem quickly. We designed a plugin system that is friendly to developers and AI coding assistants alike. Plugins are written in Lua, loaded at runtime, and require no Go toolchain nor compilation. You can use the built in test harness to iterate on a plugin and see results immediately.
  • Build on a stable foundation. The plugin API abstracts away artifact-type differences, so you write your detection logic once and it works seamlessly across container images, archives, local systems, and more. And because plugins stay decoupled from the internals of sbomgen, the core tool’s regression surface stays small.

Internally, we’ve used the plugin system to ship new ecosystem coverage faster than before. In our 1.13 release, more than 20 ecosystems that were previously implemented in Go, including Apache Tomcat, NGINX, MySQL, Redis, WordPress, and the OpenSSH toolchain, are now embedded as plugins inside the sbomgen binary. The same release also added more than ten brand-new ecosystems as plugins, including Apache Cassandra, Apache Struts, Conda, Swift packages, and AI-agent collectors (Amazon Q Developer, Kiro CLI, Claude Code, GitHub Copilot, and Ollama).

How inspector-sbomgen plugins work

Sbomgen plugins follow a two-step pipeline:

  1. Discovery – Scan the artifact’s file system to identify files that contain installed package metadata.
  2. Collection Open each discovered file, parse file contents, and publish findings into the SBOM.

Under the hood, an event bus connects discovery and collection plugins. Discovery plugins publish events listing discovered files, and one or more collection plugins subscribe to these events, triggering package collection. Developers might recognize this behavior as the observer pattern.

This decoupling lets a single discovery plugin feed multiple collectors, for example, one extracting package metadata, another scanning for secrets, and another checking policy. Each collection plugin works from the same file list without re-walking the artifact filesystem, a computationally expensive operation.

Write your first plugin in 5 minutes

Inspector-sbomgen makes it straightforward to bootstrap a plugin environment. The plugin new command tells sbomgen to create a new plugin workspace, and the —-with-example flag populates the workspace with a discovery-collection plugin pair, that you can run immediately.

inspector-sbomgen plugin new --with-example 

After invoking the preceding command, you will be prompted to provide a plugin name and a directory that will contain your plugin workspace. You can provide custom values or use the default values:

Plugin name (identifies the software ecosystem your plugin will inventory, e.g. debian-dpkg, rhel-rpm, python-pip, cmake) [my-custom-ecosystem]: <enter>
Project directory [my-sbomgen-plugins]: <enter>

Created plugin "my-custom-ecosystem" in my-sbomgen-plugins/

Note that you can skip interactive prompts by specifying the plugin name and directory using the corresponding command line interface (CLI) arguments:

inspector-sbomgen plugin new \
    --with-example \
    --name my-custom-ecosystem \
    --path my-sbomgen-plugins

After creating your plugin workspace, inspector-sbomgen will display a next steps screen, which guides developers and AI code assistants to the source files they need to change and to supporting documentation:

Next steps:

  Get started:
    1. Open plugin folder in a code editor (VS Code recommended)
    2. Add test files that your plugin will discover and parse
       (e.g., config files, lockfiles, binaries, etc.):
       my-sbomgen-plugins/discovery/cross-platform/extra-ecosystems/my-custom-ecosystem/_testdata/

  Develop:
    3. Edit discovery:    my-sbomgen-plugins/discovery/cross-platform/extra-ecosystems/my-custom-ecosystem/init.lua
    4. Edit collection:   my-sbomgen-plugins/collection/cross-platform/extra-ecosystems/my-custom-ecosystem/init.lua

  Test:
    5. Write unit tests:  my-sbomgen-plugins/discovery/cross-platform/extra-ecosystems/my-custom-ecosystem/init_test.lua
    6. Run unit tests:    inspector-sbomgen plugin test --path my-sbomgen-plugins

  Deploy:
    7. Distribute your plugin directory wherever you run inspector-sbomgen:
       inspector-sbomgen <arguments> --plugin-dir /path/to/my-sbomgen-plugins

       Example:
       inspector-sbomgen container --image alpine:latest -o /tmp/sbom.json --plugin-dir /path/to/my-sbomgen-plugins

For code completion, install the VS Code Lua language server extension:
  https://luals.github.io/#vscode-install

For more information:
  - Plugin guide:    my-sbomgen-plugins/docs/sbomgen-plugin-developer-guide.md
  - Testing guide:   my-sbomgen-plugins/docs/sbomgen-plugin-testing-guide.md
  - API reference:   my-sbomgen-plugins/docs/sbomgen-plugin-api-reference.md
  - Documentation:   https://docs.aws.amazon.com/inspector/latest/user/sbom-generator.html

Now that you have a plugin workspace, let’s explore its contents in greater detail:

tree my-sbomgen-plugins

├── AGENTS.md
├── collection
│   └── cross-platform
│       └── extra-ecosystems
│           └── my-custom-ecosystem
│               └── init.lua
├── discovery
│   └── cross-platform
│       └── extra-ecosystems
│           └── my-custom-ecosystem
│               ├── _testdata
│               │   ├── empty
│               │   └── example.lock
│               ├── init_test.lua
│               └── init.lua
├── docs
│   ├── sbomgen-plugin-api-reference.md
│   ├── sbomgen-plugin-developer-guide.md
│   └── sbomgen-plugin-testing-guide.md
├── library
│   └── sbomgen.lua
└── README.md

The scaffolded project includes a working discovery and collection plugin pair, passing unit tests with test fixtures under _testdata/, a .vscode/settings.json for integrated development environment (IDE) integration, and a local copy of the developer documentation.

The scaffolding is deliberately succinct and complete, so it reads well for both humans and AI coding assistants. Every file has clear comments that explain what each function does and what the plugin author needs to fill in.

To test a plugin, you first need something to scan, such as a package lock file or a compiled binary. The example plugin inventories a fictional example.lock with the following contents:

my-package-alpha==1.0.0 
my-package-beta==2.3.1 
my-package-gamma==0.9.5 

The provided discovery plugin knows how to look for instances of example.lock within the artifact file system:

-- my-custom-ecosystem discovery plugin
-- Discovers example.lock files in the artifact file list.

function discover()
    return sbomgen.find_files_by_name({"example.lock"})
end

And the provided collection plugin knows how to parse the contents of example.lock and publish package findings to the output SBOM.

-- my-custom-ecosystem collection plugin
-- Parses example.lock files and extracts package name and version.

function collect(file_path)
    local content = sbomgen.read_file(file_path)
    if content == nil then
        return
    end

    for line in content:gmatch("[^\n]+") do
        local name, ver = line:match("^(.+)==(.+)$")
        if name and ver then
            sbomgen.push_package({
                name = name,
                version = ver,
                purl_type = "generic",
                namespace = "my-custom-ecosystem",
                component_type = sbomgen.component_types.APPLICATION,
            })
        end
    end
end

Run the tests

Plugins ship with a built-in test framework so you can validate your logic before scanning a real artifact. Tests are written in Lua, live next to the plugin in init_test.lua, and reference fixture data in _testdata/:

function test_discovers_packages() 
    local result = testing.scan_directory("_testdata") 
    testing.assert_equals(3, #result.findings) 
    testing.assert_equals("my-package-alpha", result.findings[1].name) 
    testing.assert_equals("1.0.0", result.findings[1].version) 
end 
 
function test_no_findings_for_empty_directory() 
    local result = testing.scan_directory("_testdata/empty") 
    testing.assert_equals(0, #result.findings) 
end

Run the tests with the following command:

inspector-sbomgen plugin test --path my-sbomgen-plugins -v

=== RUN   my-custom-ecosystem/discovery/init_test/test_discovers_packages 
--- PASS: my-custom-ecosystem/discovery/init_test/test_discovers_packages (0.04s) 
=== RUN   my-custom-ecosystem/discovery/init_test/test_no_findings_for_empty_directory 
--- PASS: my-custom-ecosystem/discovery/init_test/test_no_findings_for_empty_directory (0.04s) 
ok    2 tests passed 

This is the tightest development loop we could design: no Go toolchain, no rebuild, no container spin-up. Write a test, run it, iterate.

Scan a real artifact

For plugins to produce findings, inspector-sbomgen needs an artifact that contains the files your plugin looks for. For the example plugin, any directory with an example.lock file works. The fixture we generated earlier is a good stand-in:

inspector-sbomgen directory \ 
    --plugin-dir ./my-sbomgen-plugins \ 
    --path ./my-sbomgen-plugins/discovery/cross-platform/extra-ecosystems/my-custom-ecosystem/_testdata \ 
    -o sbom.json 

The --plugin-dir flag tells inspector-sbomgen where to load your Lua plugins from. The resulting SBOM contains a CycloneDX component for each of the three packages in example.lock, for example:

{
  "bom-ref": "comp-2",
  "type": "application",
  "name": "my-package-alpha",
  "version": "1.0.0",
  "scope": "optional",
  "purl": "pkg:generic/my-sbomgen-plugin/my-package-alpha@1.0.0",
  "properties": [
    {
      "name": "amazon:inspector:sbom_generator:source_path",
      "value": "./my-sbomgen-plugins/example.lock"
    }
  ]
}

Every plugin-generated component carries an amazon:inspector:sbom_generator:source_path property that records the file the component was collected from, so you can always trace a component back to the artifact that produced it.

Vulnerability scanning with Amazon Inspector

Plugin-generated findings are first-class SBOM components. They work with every downstream consumer that reads CycloneDX SBOMs, including Amazon Inspector. To send an SBOM to Amazon Inspector for vulnerability analysis, add the --scan-sbom flag (this requires an active AWS account):

inspector-sbomgen directory \ 
    --path ./my-sbomgen-plugins/discovery/cross-platform/extra-ecosystems/my-custom-ecosystem/_testdata \ 
    --plugin-dir ./my-sbomgen-plugins \ 
    --scan-sbom \ 
    --aws-profile your_profile \ 
    --aws-region your_region \ 
    -o /tmp/sbom.json 

An important caveat when you onboard a brand-new ecosystem: Plugin authors can inventory arbitrary ecosystems, but Amazon Inspector can only report vulnerabilities for components it has advisories for. When you point Amazon Inspector at a component whose ecosystem isn’t in its advisory feeds yet, Inspector will return the component with a property, Component skipped: no supported rules found. For example:

{ 
  "bom-ref": "comp-1", 
  "name": "my-package-alpha", 
  "properties": [ 
    { 
      "name": "amazon:inspector:sbom_scanner:path", 
      "value": "my-sbomgen-plugins/discovery/cross-platform/extra-ecosystems/my-custom-ecosystem/_testdata/example.lock" 
    }, 
    { 
      "name": "amazon:inspector:sbom_scanner:info", 
      "value": "Component skipped: no supported rules found." 
    } 
  ], 
  "purl": "pkg:generic/my-custom-ecosystem/my-package-alpha@1.0.0", 
  "type": "application", 
  "version": "1.0.0" 
} 

This is expected behavior, not an error. The SBOM is still generated correctly, the component is still tracked, and the source_path tells you exactly which file produced it. If and when Amazon Inspector adds advisory coverage for the ecosystem, the same SBOM will start producing vulnerability findings without any change to your plugin. For ecosystems Inspector already supports, plugin-generated components are indistinguishable from components produced by built-in scanners.

First class IDE support

We care about productivity and efficiency when writing plugins. Writing Lua without modern conveniences such as autocomplete isn’t fun, so every plugin project scaffolded with the plugin new command ships with a library/sbomgen.lua definition file and a .vscode/settings.json that automatically wires it up to the Lua Language Server extension for VS Code.

For code completion and IDE support, first install the sumneko.lua extension, open your plugin project in VS Code, and every sbomgen.* function will get:

  • Parameter hints with types.
  • Hover documentation.
  • Autocomplete for constants (sbomgen.component_types.*, sbomgen.groups.*, sbomgen.platform.*).
  • Type checking on function calls.
  • Inline warnings when required fields are missing from push_package().

The same definition file makes plugin development work well with AI coding assistants. The types and documentation are embedded in a form that tools can read, so assistants can generate correct plugin code with far less monitoring than writing against a raw language would require.

A safe foundation

Plugins run real code inside the same process as inspector-sbomgen, so we designed the execution environment to keep that code stable and security-hardened. Every Lua plugin runs in an isolated sandbox. Every Lua virtual machine (VM) has access to a restricted subset of the Lua standard library to ensure only safe operations are permitted:

  • No direct filesystem access. The Lua io library isn’t loaded. All file operations go through sbomgen.* functions, which route through sbomgen’s internals so your plugin behaves identically whether it’s scanning a directory on disk, a container image, a compressed archive, or a mounted volume.
  • No subprocess execution or environment mutation. The Lua os library is blocked, so plugins can’t spawn processes, modify environment variables, or touch files outside the artifact.
  • No VM introspection. The Lua debug library is blocked.
  • No unbounded code loading. dofile, loadfile, and loadstring are removed. require() is available but restricted to the plugin’s own directory tree, so plugins can share helper modules with themselves but cannot load code from other plugins or system paths.

If a plugin raises an unhandled Lua error, inspector-sbomgen logs a warning and continues with the next file or plugin; one faulty plugin does not prevent other plugins from running. Plugins never override inspector-sbomgen’s built-in package collectors. Every plugin must declare a unique name. If a custom plugin uses a name that’s already claimed by an official built-in plugin, the custom plugin is skipped with a warning. Built-in plugins always take precedence, so a custom plugin can never silently replace or shadow the tool’s own detection behavior.

Next steps

To start building your own plugins today:

  1. Install the latest inspector-sbomgen from the Amazon Inspector user guide.
  2. Run inspector-sbomgen plugin new --with-example and follow the prompts.
  3. Run inspector-sbomgen plugin test --path ./my-sbomgen-plugins -v to see the example tests pass.
  4. Replace the example logic with detection for your own ecosystem.

The full reference documentation covers every function, constant, and command in depth:

Conclusion

Whether you’re adding support for an internal lockfile format, prototyping detection for a new open source ecosystem, or replacing a home-grown scanner with something your whole organization can run at scale, the plugin system is designed to make the path from idea to working SBOM as short as possible. We can’t wait to see what you build with it.
If you have feedback about this post, submit comments in the Comments section below. If you have questions about this post, contact AWS Support.


Michael Long

Michael Long

Michael is a Senior Security Researcher for Amazon Inspector at AWS. He leads research and development of the Amazon Inspector SBOM Generator and Amazon Inspector for GitHub Actions. Before joining AWS, he was a principal adversary emulation engineer on the MITRE ATT&CK team. He also served honorably for nearly 10 years in the U.S. Army spanning military intelligence and cyber operations.

Charlie Bacon

Charlie Bacon

Charlie is Head of Security Engineering and Research for Amazon Inspector at AWS. He leads the teams behind the vulnerability scanning and inventory collection services that power Amazon Inspector and other Amazon Security vulnerability management tools. Before joining AWS, he spent two decades in the financial and security industries where he held senior roles in both research and product development.

Anthony Verleysen

Anthony Verleysen

Anthony is a Senior Technical Product Management for Amazon Inspector. Before Amazon Inspector, Anthony worked as a Product Manager in AWS Systems Manager owning Node Management capabilities. Outside of work, Anthony is an avid tennis and soccer player.

  •  

Secure your npm and pip package updates in Amazon Linux

If you use and install packages from npm or PyPI, the first hours after a package is published are the riskiest because scanners can’t analyze packages before publication. Recent supply chain events affecting NodeJS and Python packages have been detected and removed within hours. However, while those packages were available to the general public, it’s possible that they were installed by users, creating the potential for a security incident. As you will see from the data that follows, if users had waited 1 day before accessing those packages, none of the recent supply chain security events would have had an impact.

In this post, I show you a one-line configuration that you can use to eliminate this exposure in your environment: a dependency cooldown for npm and pip. This change tells your package manager to skip versions published in the last 24 hours, giving the security community time to detect and remove unexpected packages before they reach your systems. These settings secure the default setup. There’s another use case of package updates: receiving security fixes to address security risks. This process involves updating packages to a more recent version. I also show you how to override the cooldown configuration so you can install the latest security patches while newly installed package updates are delayed. We recommend that you assess the severity of code defects and apply security fixes if there’s known risk. Handling security fixes based on their severity—and how to specify SLAs for these fixes based on severity—is beyond the scope of this blog post.

Background: Two risks pull in opposite directions

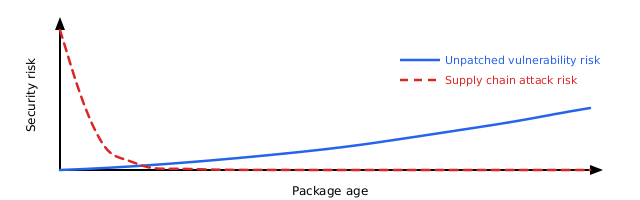
Software delivered by Amazon Linux packages go through review by Amazon package maintainers and pass guardrails before release. Open source software is developed and maintained with similar processes and guardrails. The npm and PyPI registries have open publishing access and don’t enforce reviews. Unexpected packages are potentially added to the registries because of risks like impersonation or stolen credentials. You’re caught between two risks: older software accumulates unpatched vulnerabilities, while new packages potentially contain unexpected vulnerabilities that haven’t been detected yet. The best approach is to stay current without adopting the newest releases immediately, while applying recommended security fixes. The following diagram illustrates the relation between the two types of risks in an abstract way, where the supply chain risk is highest immediately after a package is published, because unexpected updates can potentially bypass guardrails. After a package is published, auditing can review it and identify potential defects over time. If no security fixes are applied, the risk of all the code defects adds up.

Figure 1: Software risk over lifetime. Unpatched vulnerabilities risk increases over time. Very recent software also carries more supply chain risk.

Figure 1: Software risk over lifetime. Unpatched vulnerabilities risk increases over time. Very recent software also carries more supply chain risk.

The problem: The first day presents the highest risk

Supply chain events follow a consistent pattern. An unexpected author publishes an unexpected package or package version and waits for automated systems and users to pull it in. Security researchers and automated scanners typically detect and remove these packages within hours, but by then, systems have been exposed to the risk.

Datadog’s 2026 State of DevSecOps report found that 54% of JavaScript applications install at least one dependency within a day of its release. That’s the time window that presents the highest supply chain risk. Recent events show how fast detection happens:

Event Exposure window
Nx s1ngularity (Aug 2025) 4–5 hours
axios (Mar 2026) 2–3 hours
Bitwarden CLI (Apr 2026) 93 minutes
TanStack (May 2026) 30 minutes
node-ipc (May 2026) less than 24 hours

The solution: Skip packages published today

A dependency cooldown tells your package manager to skip recently published versions. If a version hasn’t existed on the registry for the configured timespan, for example, 1 day, it won’t be installed, giving the security community time to detect and remove unexpected versions.

A 1-day cooldown blocks each event listed in the preceding table. Notably, several of these events produced valid provenance attestations and passed build verification. These provenance checks alone didn’t stop them. A cooldown works independently of authorization mechanisms, because it blocks by age rather than by trust.

Both npm (v11.10.0+) and pip (v26.1+) support cooldowns . Amazon Linux 2023 ships these packages in NodeJS 24 and Python 3.14 since release 2023.11.20260608.

If you use lockfile-based installations through npm ci or pip install -r requirements.txt with pinned versions, you won’t pull latest package updates. The cooldown doesn’t apply to those installations. The cooldown only affects resolution of new or updated packages. See the Lockfile-based installs and the cooldown section for details.

Prerequisites

To implement the following solution, you first need to have the following prerequisites in place:

  • Node.js 24 with npm 11.10.0 or later (in nodejs24-24.14.1-1.amzn2023.0.1 or later).
  • Python 3.14 with pip 26.1 (in python3.14-pip-26.1.1-1.amzn2023.0.1 or later)
  • pip-audit (tool to scan python packages required for defect-based override scripts). Use python3.14 -m pip install pip-audit to install.

Future versions of Node.js and Python will bring new commands. The following tool commands work for Amazon Linux 2023 with Node.js 24 and Python 3.14. The provided commands target specific package versions. Adjust the commands if you use later releases.

To set up the npm cooldown

  1. Create the global configuration directory, depending on your NodeJS version.
    sudo mkdir -p /usr/lib/nodejs24/etc
  2. Add the npm configuration file with the cooldown setting.
    sudo npm-24 config set min-release-age 1 --location=global
  3. Check that the cooldown is active by running the next command.
    npm-24 config list

You will see before = "<timestamp from 24 hours ago>" in the output, confirming npm converted the 1-day cooldown into a date filter.
For more information, see the npm min-release-age documentation.

To set up the pip cooldown

  1. Create the system-wide pip configuration file with the cooldown setting.
    sudo python3.14 -m pip config set --global global.uploaded-prior-to P1D
  2. Verify the configuration (for Python 3.14 and pip 26.1+).
    python3.14 -m pip config list

You will see global.uploaded-prior-to='P1D' in the output.

This configuration is safe to deploy immediately, because older pip versions (25.x) silently ignore the setting.

To install a package’s latest version without cooldown

What if you want to install the latest version of a package, for example to receive security fixes? The following sections describe how to override the flag using the tool command line. To identify which packages need urgent updates, run the appropriate audit command for your package manager.

npm auditor python3.14 -m pip_audit

For npm packages

Install the package with the cooldown override.
npm-24 install <package-name> --min-release-age=0

For pip packages

Install the package with the cooldown override.
python3.14 -m pip install <package-name> --uploaded-prior-to="P0D"

Update packages that need urgent updates

We recommend that you apply security fixes for packages that have known security risks. You don’t need to turn off the cooldown entirely to apply security fixes. Use the audit tools to identify packages with known issues, then override the cooldown for only these packages.

Prerequisites: Ensure you have Python 3 and pip-audit installed (python3.14 -m pip install pip-audit).

Important: These scripts demonstrate the concept. For production use, add error handling, logging, and testing. Review packages before updating them in automated pipelines.

For npm packages

The following script demonstrates the required steps to identify npm packages with a known security fix. The npm audit command prints these packages as JSON. Next, packages in this list are updated with an npm install command, where their cooldown is overridden so that the latest version is picked up.

npm audit --json | python3 -c "
import json, sys, subprocess
data = json.load(sys.stdin)
for pkg in data.get('vulnerabilities', {}):
    subprocess.run(['npm-24', 'install', f'{pkg}@latest', '--min-release-age=0'])
"

For pip packages

The following script demonstrates the required steps to identify pip packages with a known security fix. The pip_audit command prints these packages as JSON. Next, all packages in this list are updated with an pip install command that overrides the cooldown so that the latest version can be picked up.

python3.14 -m pip_audit --format=json | python3.14 -c "
import json, sys, subprocess
from packaging.version import Version
data = json.load(sys.stdin)
for dep in data.get('dependencies', []):
    pkg = dep['name']
    vulns = dep.get('vulns', [])
    if not vulns:
        continue
    fix_versions = [v for vuln in vulns for v in vuln.get('fix_versions', [])]
    if not fix_versions:
        print(f'{pkg}: vulnerable but no fix published, skipping')
        continue
    fix = max(fix_versions, key=Version)
    print(f'Updating {pkg} -> {fix}')
    subprocess.run(['python3.14', '-m', 'pip', 'install', f'{pkg}=={fix}', '--uploaded-prior-to=P0D'])
"

Lockfile-based installs and the cooldown

If you use npm ci or pip install -r requirements.txt with pinned versions, the cooldown doesn’t apply. These commands install what the lockfile specifies, regardless of package age. The cooldown only affects resolution of new or updated packages.

Industry adoption: Cooldowns are now used across PyPI and NodeJS

Major package managers and enterprises have started to adopt dependency cooldowns. As of May 2026, several popular package management tools now include cooldown features: pnpm (a fast Node.js package manager), Renovate (an automated dependency update tool), and StepSecurity (a supply chain security platform).

  • pnpm 11 ships with minimumReleaseAge enabled by default. It’s one of the first major package manager to make cooldowns opt-out rather than opt-in.
  • Renovate’s config best-practices preset has included a 3-day npm cooldown since 2025 and is widely adopted across enterprises.
  • StepSecurity Secure Registry uses a configurable cooldown period for enterprise customers. StepSecurity recommends a 10 day delay as default.

How AWS is helping protect the open source supply chain

AWS scans upstream package registries to catch unexpected packages before they reach customers.

Unexpected packages are typically caught within hours of publication. A 1-day cooldown ensures you don’t install them during that detection window.

Recommendations

To secure your Amazon Linux 2023 configuration:

  1. Set a 1-day cooldown for npm and pip as shown in the preceding sections. External registries don’t have human review, so give the defenders time to catch problems.
  2. Override when needed for urgent security patches using the per-command flags.
  3. Run npm audit or pip_audit regularly to identify packages that need immediate attention.

Set up the cooldown with one line of configuration, and the protection is immediate.

Conclusion

By implementing the solutions presented in the post, you secure your npm and PyPI environment from most instances of unexpected code. The update delay of 1 day protects your environment, while still allowing to apply the latest security fixes. To learn about how to protect your environment further, see the following resources:

If you have feedback about this post, submit comments in the Comments section below.


Norbert Manthey

Norbert Manthey

Norbert is a Security Engineer in the Amazon Linux team, focusing on proactive security across hypervisors and operating systems in Amazon EC2. His work includes hardening operating system defaults, detecting code issues early through static and AI-driven analysis, and improving supply chain security for packages shipped with Amazon Linux. Norbert advocates for automating these process improvements, injecting them into the software development lifecycle, and shifting left.

  •  

AWS Shield Advanced is embracing the AWS WAF Anti-DDoS managed rule group: What changes and how to prepare

July 29, 2026: We’ve updated this post to clarify the AWS Firewall Manager migration path.


Application-layer distributed denial of service (DDoS) attacks are difficult to detect because they closely resemble legitimate traffic. HTTP request floods are now among the most common vectors targeting web applications, using valid-looking requests that blend in with normal user activity.

In June 2025, AWS launched the AWS WAF Anti-DDoS managed rule group, built specifically for application-layer (L7) DDoS protection. AWS Shield Advanced is adopting it as the default application-layer protection, and in time as the only one. On July 27, AWS Shield Advanced begins adding the Anti-DDoS managed rule group to eligible web access control lists (ACLs) in Count mode. It will not cause any interruption to your traffic alongside your existing L7 automatic mitigation and WAF rules. In this blog post, we provide details regarding the Anti-DDoS managed rule group and when the change is expected to reach your web ACLs. You will understand the phases and steps that you need to take before the finish date, including how the monitoring and metrics will change.

Anti-DDoS managed rule group features

The Anti-DDoS managed rule group builds on what Shield Advanced automatic mitigation already provides. It profiles your traffic, learns what normal traffic looks like for your application, and establishes a baseline in minutes rather than hours. When an attack starts, it reacts within seconds and there are no health checks to configure. The rule group adds a Challenge action to the Block and Count actions you already use. Challenge decisions are driven by the AMR labels that mark the suspicion level of each inspected request. One option is a silent browser challenge, which has a background verification that runs in the visitor’s browser with no interstitial page, so legitimate users are never interrupted while automated traffic is filtered out. You can also exclude workload paths that don’t support Challenge, which fall back to Block mitigations instead. Sensitivity is configurable to Low, Medium, or High, and you set it separately for Block and Challenge. Block and Challenge are tuned independently; meaning you can run Challenge at high sensitivity to catch more suspicious traffic while keeping Block low to avoid dropping legitimate requests or reverse it for a stricter posture.

The rest is about cost and visibility:

  • It uses less capacity than before. The rule group needs 50 web ACL capacity units (WCUs), down from the 150 the previous protection required, providing you with capacity for the rest of your rules.
  • The dashboard ships in the AWS Management Console for AWS WAF. It’s there now, showing live DDoS events, match metrics, and the top URIs, geographies, and IP addresses driving traffic.
  • It labels everything it inspects. Requests get labels for event-detected, graduated suspicion levels, and specific rules. Match on those labels in your own AWS WAF rules when you need logic the rule group doesn’t cover.
  • You don’t pay for the attack traffic. During active mitigation, blocked DDoS requests drop out of your monthly count. That exclusion covers AWS WAF request fees, Anti-DDoS managed rule group request fees, and Shield Advanced request charges.

AWS Shield Advanced isn’t required to use any of these features. Shield Advanced subscribers get the rule group included with AWS WAF and any customer can turn it on independently. See AWS WAF pricing for more information on costs.

Implementation details

Shield Advanced upgrades application-layer DDoS protection in five phases. The following dates are when AWS will act automatically, not the earliest date when you can act. After the rule group is deployed in Count mode on July 27, 2026, you can begin migrating right away rather than waiting for the October auto-upgrade. There’s no window where protection lapses. Your current automatic mitigation stays active through every phase until the Anti-DDoS managed rule group takes over. That handoff happens in a single operation, with no cutover window and no gap for your traffic flows.

Phase 1: Anti-DDoS managed rule group deployed in Count mode (rolling out July 27–August 7, 2026)

AWS adds the Anti-DDoS managed rule group in Count mode to every web ACL eligible for this rollout. Eligible means any Shield Advanced web ACL with at least one resource using application-layer automatic mitigation that isn’t already running the Anti-DDoS rule group. This is a broader set than the web ACLs eligible for the October auto-upgrade (Phase 3), which applies a stricter test. The deployment rolls out gradually, starting July 27 and expected to finish by August 7, 2026, so different web ACLs might be updated on different days. There’s no impact to your traffic because the rule group watches and labels requests without acting on them while your existing automatic mitigation keeps running. Throughout the evaluation period, you receive DDoS events, metrics, and AWS WAF labels at no additional charge.

Phase 2: Free evaluation period (July 27–September 30, 2026)

The existing automatic mitigation and the Anti-DDoS managed rule group run side by side each detecting independently. Automatic mitigation continues to protect your resources while the rule group operates in Count mode. To compare their detection results, use the DDoSAttackRequests metric, AWS WAF labels, and the Anti-DDoS dashboard. All Anti-DDoS managed rule group charges are waived during this period, including the subscription fee, per-request fees, and WCU consumption costs for the eligible web ACLs from phase 1.

Phase 3: Auto-upgrade begins (October 1, 2026)

For eligible web ACLs, the auto-upgrade mirrors your existing automatic mitigation configuration. The rule group inherits your current setting, so a Block configuration comes up in Block mode and a Count configuration comes up in Count mode in a single, atomic operation. The rule group takes over in the same step that disables automatic mitigation, so protection never drops for an instant. This is a handoff rather than a cutover with no window where your resources are unprotected. If you’d rather not upgrade you can opt out by contacting AWS Support before the auto-upgrade date.

Phase 4: Guided migration (available July 27–December 31, 2026)

You don’t have to wait for the October auto-upgrade to migrate. As soon as the rule group is deployed in Count mode between July 27 and August 7, 2026, you can move to it on your own schedule. This is the path to use for web ACLs that aren’t eligible for the Phase 3 auto-upgrade, meaning mixed-mode web ACLs or ones with resources that don’t have automatic mitigation enabled. Work with your AWS account team and AWS Support at any point in this window to plan and complete the migration. Eligible web ACLs are also upgraded automatically starting October 1 (Phase 3), so guided migration is mainly for the web ACLs the auto-upgrade can’t cover.

Phase 5: Shield Advanced application-layer automatic mitigation sunset (January 1, 2027)

As of January 1, 2027, the Shield Advanced application-layer automatic mitigation feature will no longer be available. Resources that haven’t migrated to the Anti-DDoS managed rule group will lose automatic application-layer DDoS mitigation.

Capability

Shield Advanced application layer automatic mitigation

Anti-DDoS managed rule group (AWSManagedRulesAntiDDoSRuleSet)

Feature type

Shield Advanced automatic mitigation

AWS WAF managed rule group

Detection and mitigation speed

Requires a baseline period; mitigation varies per event

Enhanced detection and faster mitigation

Configuration scope

Per resource (Shield API)

Per web ACL (AWS WAF API)

Mitigation actions

Count, Block

Count, Block, and Challenge

Sensitivity controls

None

Low, Medium, and High for both Block and Challenge

Non-HTML path handling

N/A

URI regex exemptions for Challenge

WCU consumption

150 WCUs

50 WCUs

Health checks

Required (Amazon Route 53 health-based detection)

Not required, provides automatic traffic profiling

Availability

Shield Advanced only

AWS WAF and Shield Advanced (see pricing)

Observability

The existing automatic mitigation and the Anti-DDoS managed rule group use separate Amazon CloudWatch namespaces and metric structures. The rule group gives you three tiers of observability: tier 1 tells you an attack is happening, tier 2 shows which requests it flagged and why, and tier 3 shows what it did about them. You don’t need all three on day 1 because most customer teams start at tier 1 to confirm detection is working, then add the others as they tune.

Tier 1: Event detection alarms

You can detect DDoS events using two CloudWatch metrics, each with its own namespace.

DDoSDetected (Shield)

DDoSAttackRequests (Anti-DDoS managed rule group)

Namespace

AWS/DDoSProtection

AWS/WAFV2

Requires Shield Advanced

Yes

No

Scope

L3, L4, and L7 events

L7 events only

Value during event

Binary (0 or 1)

Count of requests observed

Value outside event

Reported once daily (keeps metric alive)

Absent (no data points)

Dimensions

ResourceArn

Resource, ResourceType

What this means for your existing alarms:

  • After the application-layer automatic mitigation feature is sunset, DDoSDetected still fires for infrastructure layer 3 and layer 4 events, so your existing network layer and transport layer alarms remain valid. For the full list, see AWS Shield Advanced metrics.
  • DDoSAttackRequests is the Anti-DDoS managed rule group equivalent for application-layer event detection. Alarm on Sum >= 1 to detect any event, or set a volume threshold (for example, more than 10,000 requests per minute) for severity-based alerting.
  • During the evaluation period, both metrics fire independently and you can validate detection parity before migrating your application-layer alarms.
  • Because DDoSAttackRequests is absent when there are no active DDoS events, set treat-missing-data to missing or notBreaching for alarms on this metric.

Tier 2: Detection labels for custom monitoring

Every request the Anti-DDoS managed rule group evaluates gets a label. Where tier 1 tells you an attack started, tier 2 shows which requests looked suspicious and how confident the rule group was. The labels surface as AWS WAF metrics in the AWS/WAFV2 namespace: AllowedRequests, BlockedRequests, and CountRuleMatch. Each carries the LabelName and LabelNamespace dimensions under the awswaf:managed:aws:anti-ddos: namespace.

  • event-detected – Requests observed during a detected DDoS event
  • ddos-request – Requests identified as part of the attack
  • low-suspicion-ddos-request, medium-suspicion-ddos-request, high-suspicion-ddos-request – Graduated suspicion levels
  • challengeable-request – Requests eligible for browser challenge

Chart suspicion-level trends on a CloudWatch dashboard to see how an attack builds. Match on the labels in your own AWS WAF rules or dig into them in your AWS WAF logs with CloudWatch Logs Insights or Amazon Athena when you need to understand a specific event after the fact.

Tier 3: Mitigation action metrics

Where tier 2 shows what the rule group flagged, tier 3 shows what it did about those requests during an event. You’ll find these metrics as ChallengeRequests, BlockedRequests, and CountRuleMatch, each scoped by the rule label that produced it.

  • ChallengeAllDuringEvent – Requests challenged during an active event
  • ChallengeDDoSRequests – Suspected DDoS requests challenged based on suspicion level
  • DDoSRequests – Requests blocked (or counted in Count mode)

Watch these during a live event to see whether mitigation is keeping up. If you’re challenging far more requests than you’re blocking, your configuration might be too cautious, and you can raise the sensitivity level after you trust the numbers.

Observability summary

Tier

Automatic mitigation

Anti-DDoS managed rule group

Event alarm

DDoSDetected in AWS/DDoSProtection (binary, L3/L4/L7)

DDoSAttackRequests in AWS/WAFV2 (request count, L7)

Detection labels

None

event-detected, ddos-request, suspicion levels, challengeable-request

Mitigation actions

Not visible (Shield-managed rule group metrics not exposed)

ChallengeAllDuringEvent, ChallengeDDoSRequests, DDoSRequests

Dashboard

Shield console event history

Shield console and Anti-DDoS dashboard in the AWS WAF console

Historical analysis

Shield event history only

AWS WAF logs (CloudWatch Logs, Amazon Simple Storage Service (Amazon S3), Amazon Data Firehose)

Billing

Your Shield Advanced subscription includes the Anti-DDoS managed rule group for up to 50 billion requests per month, counted across your whole organization at the payer account level. For most customers that ceiling is well above normal traffic, so you won’t see a line item here unless you’re operating at very high volume. For the exact rates, see AWS WAF pricing and Shield Advanced pricing.

You aren’t charged for DDoS traffic while the Anti-DDoS managed rule group is actively mitigating, which means Block or Challenge mode rather than Count. This applies to AWS WAF request fees, Anti-DDoS managed rule group request fees, and Shield Advanced request charges. Leaving the rule group in Count mode past the evaluation period costs you the protection without the billing relief, so avoid staying in Count mode longer than you need to validate.

During the evaluation period (July 27 to September 30, 2026), the eligible web ACLs AWS auto-enrolled don’t incur per-request fees or WCU consumption, even when configured in Count mode.

The Anti-DDoS managed rule group works at the web ACL level, so every resource you associate with a web ACL shares that coverage. Before assuming a single resource accounts for the whole cost, look at how many resources sit behind each web ACL. A web ACL fronting 20 resources bills differently from one fronting 2, so check that count first and familiarize yourself with the workload protected by each web ACL.

Adding the Anti-DDoS managed rule group to a web ACL yourself isn’t part of the upgrade path, so standard pricing applies from the moment you enable it. The same is true for any resource that was already running the rule group before the rollout. To get the free evaluation, let the automatic rollout reach your web ACLs rather than adding the rule group ahead of it. There’s no penalty for adding it yourself; you just don’t receive the waiver on that web ACL.

Update your infrastructure as code

If you manage web ACLs with AWS CloudFormation, AWS Cloud Development Kit (AWS CDK), Terraform, or other infrastructure as code (IaC), the auto-upgrade changes your infrastructure configuration outside your templates. Your code is still the source of truth, so you need to do two things. First, change where the protection is declared. Today you enable application-layer automatic mitigation through the Shield API (EnableApplicationLayerAutomaticResponse), configured per protected resource. The Anti-DDoS managed rule group is configured through the AWS WAF API instead (CreateWebACL and UpdateWebACL), as a managed rule group statement inside the web ACL, scoped per web ACL rather than per resource. In IaC terms, you remove the Shield automatic-response block (for example, Terraform’s aws_shield_application_layer_automatic_response) and add the WAF managed rule group statement shown in the following section. Second, pull the upgraded web ACL back into your tooling before your next deploy, or your pipeline will try to revert the change.

For the full statement in Terraform, CloudFormation, and the AWS CDK, plus how to sync state after the auto-upgrade (terraform plan, CloudFormation drift detection, cdk diff), see the iac-webacl-examples helper.

Update your AWS Firewall Manager policy

If you’re currently running a Shield Advanced policy in AWS Firewall Manager, check its Automatic application layer DDoS mitigation setting before you start, because that setting decides how much of this section applies to you. Where it reads Ignore or Disable, the policy isn’t managing that mitigation at all: whatever mitigation your resources have was enabled on the resources themselves, or through Shield, and that’s where you turn it off when the time comes.

If the Shield Advanced policy reads Enable, you first need to add or reuse an AWS WAF Firewall Manager policy, put the Anti-DDoS managed rule group in it and scope that policy to the same accounts and resources your Shield Advanced policy covers.

Keep the Shield Advanced policy in place throughout the process. Don’t remove accounts or resources from its scope, and don’t delete it. Firewall Manager revokes the Shield Advanced protections it created for anything that leaves scope, which ends L3 and L4 coverage, along with the application-layer mitigation you’re replacing. Instead, use a setting change to retire the older mitigation: when the new rule group is live and you’ve compared the two, set Automatic application layer DDoS mitigation to Disable on the Shield Advanced policy that currently reads Enable.

Set up the AWS WAF Firewall Manager policy

You can make this change in the console or as code. If you manage your Firewall Manager policies as code, don’t edit them in the console: add a new AWS WAF policy or update an existing one in your templates with the Anti-DDoS managed rule group included, and deploy it using the following Firewall Manager policies using IaC steps. Otherwise, use the console.

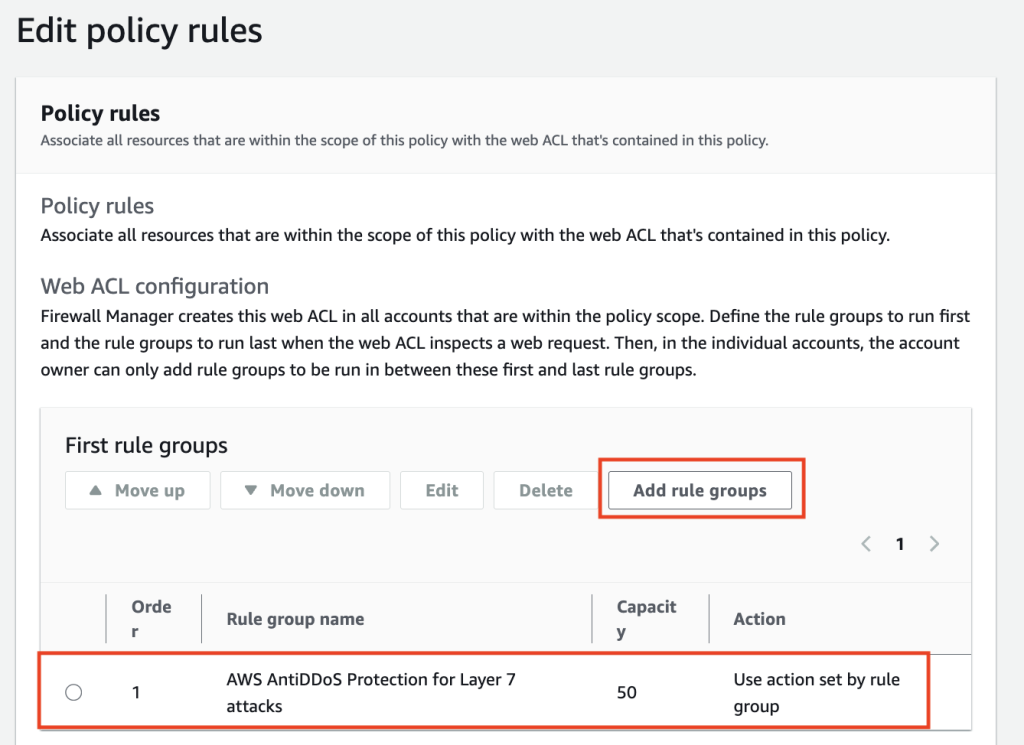
In the console, follow Creating an AWS Firewall Manager policy for AWS WAF to create the policy and reach the Edit policy rules page. Add the Anti-DDoS rule group, listed there as AWS AntiDDoS Protection for Layer 7 attacks (AWSManagedRulesAntiDDoSRuleSet), as a new rule group under First rule groups so it evaluates before your other managed groups, but below any Allow custom rules you use to fast-path known-good traffic.

If you protect CloudFront distributions, make this change in your Global policy, and repeat it in each AWS Regional policy for regional resources. Save the policy, and Firewall Manager rolls the change out to in-scope accounts, which can take a few minutes.

After being added, the rule group appears as the first rule group in the policy, as shown in the following screenshot:

Figure 1: AntiDDoS enabled

Figure 1: AntiDDoS enabled

Firewall Manager policies using IaC

If you manage Firewall Manager policies as code, make the change in your template instead of the console. The Anti-DDoS managed rule group goes into the AWS WAF policy’s ManagedServiceData, a WAFV2 policy definition carried as a JSON string, added to the first rule groups so it evaluates early. For the ManagedServiceData JSON with CloudFormation, Terraform, and AWS CDK examples, see the firewall-manager-examples helper.

Whichever path you take, scope the policy to the same accounts and resources your Shield Advanced policy already covers, so no resource loses application-layer protection during the move.

Getting started

Between July 27 and August 7, 2026, AWS will add the Anti-DDoS managed rule group in Count mode to Shield Advanced web ACLs that have resources using application layer automatic mitigation but not yet the Anti-DDoS rule group. After it reaches your web ACL, you can evaluate it, and migrate whenever you’re ready, without waiting for the October auto-upgrade.

  • Review the Anti-DDoS dashboard in the AWS WAF console. The dashboard shows real-time DDoS events, match metrics, and top traffic sources.
  • Compare event detection side by side. During Count mode, both systems detect independently. Check the DDoSDetected metric in AWS/DDoSProtection alongside DDoSAttackRequests in AWS/WAFV2 to validate detection parity for your resources. You can deploy the CloudWatch comparison dashboard from the AWS Samples repository to view both systems on a single dashboard.
  • Explore AWS WAF labels. Enable AWS WAF logging and query for labels in the awswaf:managed:aws:anti-ddos: namespace. Look at suspicion levels (low-suspicion-ddos-request, medium-suspicion-ddos-request, high-suspicion-ddos-request), event-detected, and challengeable-request to see per-request visibility into detected events.
  • Start with Low sensitivity for Block actions during evaluation to minimize false positive risk. Tune up as you gain confidence from the Anti-DDoS dashboard and AWS WAF label data.
  • Plan your configuration. Review sensitivity levels, URI exemptions for non-HTML paths, and web ACL priority placement. The Anti-DDoS managed rule group should run at the highest priority in your web ACL, or right below any custom rules with the Allow action.
  • Sync your IaC templates. After the auto-upgrade adds the Anti-DDoS managed rule group to your web ACL, fetch the current state into your IaC tooling (Terraform refresh, CloudFormation drift detection, AWS CDK import) before your next deployment.

Conclusion

The Anti-DDoS managed rule group profiles your traffic within minutes and mitigates within seconds, where the automatic mitigation it builds on established its baseline over hours, and it gives you granular visibility into what it’s doing. The evaluation period exists so you can watch both systems run on your own traffic before anything changes. Spend the first few weeks in Count mode confirming the new detection matches what you see today, then move your alarms over and pick a sensitivity level you’re comfortable with. If you run a web ACL across several resources, or you manage rules through AWS Firewall Manager, contact AWS Support before you start so you don’t have to unwind anything later. The Shield Advanced application-layer automatic mitigation feature retires on January 1, 2027, and anything still relying on it needs to be migrated by then.

Resources

If you have feedback about this post, submit comments in the Comments section below.


Eitav Arditti

Eitav is a Senior Solutions Architect at AWS and a technology leader with over 15 years of experience in the tech industry. He specializes in edge computing, serverless, and platform engineering, and works with engineering teams to design secure, globally scalable architectures on CloudFront and AWS WAF. His current focus is on internet-scale systems—from global content delivery to edge security.

Andrew Chen

Andrew is a Senior Product Manager focused on DDoS protection at AWS. He leads the AWS Shield product line, helping safeguard both AWS infrastructure and customers from volumetric and network-layer threats. Andrew works closely with security and networking teams to strengthen internet safety.

Justin Kurpius

Justin is a Security Go-to-Market Specialist at AWS, based in Chicago, IL. He focuses on AWS edge and security services, including Amazon CloudFront, AWS WAF, AWS Shield, and AWS Firewall Manager, helping customers architect scalable, resilient web application defenses. Justin works across monetization strategy, ISV partnerships, and field enablement to accelerate adoption of the AWS edge security portfolio.

  •  

Introducing the Amazon GuardDuty investigation agent: on-demand AI-powered threat assessment

The new Amazon GuardDuty investigation agent (now in public preview) investigates security findings across your Amazon Web Services (AWS) environment, reducing investigation time from hours to minutes.

GuardDuty is our managed threat detection service that continuously monitors your AWS accounts and workloads for suspicious, potentially malicious activity, and unauthorized behavior, delivering detailed security findings for visibility and remediation.

Whether you’re investigating a single suspicious finding or assessing security posture across your entire organization, the investigation agent provides structured assessments providing risk levels, confidence scores, and actionable recommendations.

Security teams can spend hours investigating security findings and correlating data across multiple tools. The GuardDuty investigation agent automates this correlation, providing actionable intelligence, built directly into GuardDuty and accessible on demand through the AWS Management Console, AWS Command Line Interface (AWS CLI), AWS APIs, or AWS SDKs.

This post shows you how to:

  • Enable the investigation agent in your GuardDuty console.
  • Create your first investigation through the console or AWS CLI.
  • Use the investigation agent with the AWS MCP server for AI-assisted security operations

Key features of the GuardDuty investigation agent

The GuardDuty investigation agent provides APIs using the same patterns you already know from GuardDuty. Each completed investigation returns a risk level, confidence assessment, MITRE ATT&CK® technique mapping, resource mapping, and prioritized recommendations.

You can scope investigations from the console for a specific finding, an account, or all accounts across your organization. Alternatively, the AWS CLI and API accept a free-form trigger prompt of up to 2,048 characters, so you can describe what to investigate in natural language and guide the analysis of the agent by specifying areas of concern, suspected root causes, or priorities for the investigation.

The investigation agent APIs are also available through the official AWS MCP server, part of the Agent Toolkit for AWS, enabling integration into your existing security toolchains and AI-powered workflows. You don’t need to manage or interact with the agent directly. Call API endpoints, and the agent investigates findings, correlates evidence, and delivers an assessment without the overhead of managing complex configurations.

How the investigation agent analyzes findings

When you create an investigation, the agent uses cross-Region inference to process your findings based on scope and produces a structured output.

Cross-Region inference – GuardDuty investigation uses the Cross-Region Inference Service (CRIS), which selects the optimal AWS Region within your geography to process the investigation assessment. Your data remains stored only in the Region where the investigation request originates. However, investigation data and summary results might be processed outside that Region. Data is transmitted encrypted across the secure network provided by Amazon.

For more information about which inference Regions your request might be routed to see the Cross-Region inference routing table located in the investigation section of the Amazon GuardDuty User Guide.

Investigation output – Each completed investigation produces the following insights: Risk level (Info, Low, Medium, High, or Critical), Confidence (Unknown, Low, Medium, or High), Summary (description of findings and key observations), Investigation Details (additional context), and Recommended Actions (detailed actions including AWS CLI commands).

Account scoping – Account specification is required only when investigating a specific member account. For broader scopes such as your entire organization, no account ID is needed. The agent will only investigate findings within accounts you’re authorized to access per the authorization model that follows.

Prerequisites

Before you get started, make sure you have the following prerequisites in place:

  • Amazon GuardDuty enabled in your account
  • AWS account in a supported Region (see Availability section)

Required IAM permissions

You will need three new permissions: guardduty:CreateInvestigation to start new investigations, guardduty:GetInvestigation to retrieve results, and guardduty:ListInvestigations to view investigations for a given detector.

Example IAM policy:

{
  "Version": "2012-10-17",
  "Statement": [
    {
      "Effect": "Allow",
      "Action": [
        "guardduty:CreateInvestigation",
        "guardduty:GetInvestigation",
        "guardduty:ListInvestigations"
      ],
      "Resource": "*"
    }
  ]
}

Authorization model

Administrator accounts can create investigations, retrieve results, and view investigation lists for themselves and their member accounts. Member accounts can only retrieve results and view investigation lists for their own account. Member accounts can’t create investigations and can’t access investigations belonging to other accounts or the administrator account. Account specification is required only when investigating a specific member account. For your own account or accounts across your organization, no account ID is needed.

To enable and create your first investigation

Before you begin, verify you have the required IAM permissions as described in the prerequisites .

  1. Open the AWS Management Console in the desired supported Region and navigate to Amazon GuardDuty.
  2. In the navigation pane, choose Investigations.
Figure 1: GuardDuty investigation dashboard

Figure 1: GuardDuty investigation dashboard

  1. If investigations aren’t enabled choose Go to Settings and then enable investigations by choosing Enable.
Figure 2: GuardDuty investigations enablement screen

Figure 2: GuardDuty investigations enablement screen

  1. After investigations are enabled, navigate back to the investigations page.
  2. In the navigation pane, choose Initiate Investigation.
Figure 3: GuardDuty initiate investigation

Figure 3: GuardDuty initiate investigation

  1. Select a scope for your investigation:
    • Enter a GuardDuty Finding ID: Use when you want to investigate a specific GuardDuty finding in depth
    • Enter an AWS Account ID: Use when you want to assess the overall security posture of a specific AWS account
    • All accounts: Use for organization-wide security assessment or when investigating potential lateral movement
    • Choose Initiate investigation.
Figure 4: GuardDuty investigation setup

Figure 4: GuardDuty investigation setup

  1. Wait for the investigation to complete (typically 2–5 minutes for account level and 10–12 minutes for specific finding investigations during preview). The status updates automatically.
  2. When the investigation completes, select the investigation title to view the full assessment.
Figure 5: GuardDuty investigation completed menu

Figure 5: GuardDuty investigation completed menu

The investigation assessment contains detailed information about the investigation including general information, a summary of the investigation, mapping, assessment of the threat, and recommended actions.

The General Information section displays the investigation ID, status, triggered-by account, and creation timestamp.

Figure 6: General information section of the assessment

Figure 6: General information section of the assessment

The summary section provides a narrative of key observations and findings.

Figure 7: Summary section of the assessment

Figure 7: Summary section of the assessment

The mapping section shows attack techniques and affected AWS resources.

Figure 8: MITRE ATT&CK mapping section of the assessment

Figure 8: MITRE ATT&CK mapping section of the assessment

The Threat Assessment section displays the risk level, confidence score, and detailed threat analysis.

Figure 9: Threat assessment section

Figure 9: Threat assessment section

The Recommended Actions section lists prioritized remediation steps.

Figure 10: Recommended actions section of the assessment

Figure 10: Recommended actions section of the assessment

Investigations can also be conducted with the AWS CLI or SDK using the following API endpoints:

  • CreateInvestigation – Initiates a GuardDuty investigation that automatically analyzes security findings, correlates related activity, performs account-level analysis, and produces a structured investigation summary with recommended next steps.
  • GetInvestigation – Retrieve the status and results of a specific investigation, including the assessment from the agent, correlated evidence, and recommended actions when completed.
  • ListInvestigations – View investigations across your environment with filtering and pagination.

To run investigations using the AWS CLI

Investigations are asynchronous because the agent queries multiple data sources, correlates findings across services, and performs AI-based analysis. After creating an investigation, you’ll need to check its status periodically until it completes.

Step 1: Find your detector ID

Each GuardDuty deployment has a unique detector ID per-account and per-Region that identifies your specific GuardDuty configuration. You will need this for all AWS CLI operations, especially if you have GuardDuty enabled in multiple Regions. You can find your detector ID in the GuardDuty console under Settings, or by running the following command and specifying the Region. For example, if the GuardDuty detector of interest were in the us-east-1 (N. Virginia) Region

aws guardduty list-detectors –-region=us-east-1

Expected response:

{
  "DetectorIds": [
    "12abc34d567e8fa901bc2d34eexample"
  ]
}

Note: the DetectorIDvalue from the response, you will use it in all subsequent commands.

Or if working only in the same Region, the session can be set as an environment variable to avoid repetition, for example on Linux:

export AWS_DEFAULT_REGION=us-east-1

See the AWS CLI documentation for guidance on configuring this for additional operating systems.

Step 2: Create an investigation

The following is an example of code to investigate a specific finding:

aws guardduty create-investigation us-east-1 \
--detector-id 12abc34d567e8fa901bc2d34eexample \
--trigger-prompt "Investigate this finding ID 1ab2c3d4e5f6a7b8c9d0e1f2a3b4c5d6"

The --trigger-prompt parameter is useful when you have context that isn’t captured in GuardDuty metadata or consumable through the API.

Expected response:

{
  "InvestigationId":"a1b2c3d4-5678-90ab-cdef-ef1234567890"
}

To investigate findings across an entire AWS account, use the following example:

aws guardduty create-investigation –-region=us-east-1 \
--detector-id 12abc34d567e8fa901bc2d34eexample \
--trigger-prompt “Investigate findings in Account 123456789012”

To investigate findings across an entire organization:

aws guardduty create-investigation –-region=us-east-1 \
--detector-id 12abc34d567e8fa901bc2d34eexample \
--trigger-prompt “Investigate findings across my AWS Organization”

Step 3: Check investigation status

Check the status of the investigation shown here using the AWS CLI query command to filter and list only the Status section of the output for simplicity:

aws guardduty get-investigation –-region=us-east-1 \
--detector-id 12abc34d567e8fa901bc2d34eexample \
--investigation-id a1b2c3d4-5678-90ab-cdef-ef1234567890 --query 'Investigation.Status'

Repeat this command until the Status field shows COMPLETED.

Example completed response output:

{
  "Investigation": {
    "InvestigationId": "a1b2c3d4-5678-90ab-cdef-ef1234567890",
    "Status": "COMPLETED",
    "TriggerPrompt": "Investigate finding 1ab2c3d4e5f6a7b8c9d0e1f2a3b4c5d6 in account 123456789012",
    "TriggeredBy": "123456789012",
    "RiskLevel": "Critical",
    "Risk": "Active multi-stage runtime compromise on EKS worker node with root-privileged reverse shell, Docker socket access, malicious file execution, and 500 multi-tactic runtime signals — behavioral evidence is consistent with a genuine intrusion.",
    "Confidence": "High",
    "Summary": "{\"keyObservations\":{\"title\":\"...\",\"narrative\":\"...\",\"observations\":[...]},\"countermeasures\":[...],\"threatAssessment\":{...}}",
    "Cloud": {
      "Provider": "AWS",
      "Region": "us-east-1",
      "Account": "123456789012"
    },
    "Metadata": {
      "Product": {
        "Name": "AmazonGuardDuty AI Analyst",
        "Feature": "Investigation"
      },
      "Version": "1.0.0"
    },
    "StartTime": 1705319400.0,
    "EndTime": 1705319700.0
  }
}
  • Status values RUNNING, COMPLETED, FAILED
  • Timing Investigation times can very. Checking status every 30 seconds should be sufficient to yield results.
  • If status shows FAILED Review the error message in the response and verify your permissions match the authorization model requirements.

To list all investigations for a given detector run the following, the max-results command is optional but useful to filter the number of returned results.

aws guardduty list-investigations –-region=us-east-1 \
--detector-id 12abc34d567e8fa901bc2d34eexample \
--max-results=10

Beyond running investigations manually, the API-first design addresses a common customer pattern: sending GuardDuty findings to third-party tools. You can now add automated investigation to those existing pipelines, so your team receives enriched, prioritized intelligence rather than raw alerts.

Consider a customer that routes GuardDuty findings through Amazon EventBridge to their Security Information and Event Management (SIEM) platform, where analysts manually investigate each alert. With the investigation agent, an AWS Lambda function can be placed into the pipeline that calls CreateInvestigation with the finding ID, waits for completion, and forwards the enriched results (risk level, confidence score, MITRE ATT&CK mapping, and recommended actions) to their SIEM alongside the original finding. Critical findings route directly to the customer incident response queue for further analysis or automation. Low-risk findings with high confidence get auto-closed or batched for weekly review. The analyst’s time shifts from repetitive log correlation to validating assessments and acting on confirmed threats.

This pattern works with SIEMs, ticketing systems, or automation platforms that can be customized to use the API or EventBridge messaging. The investigation agent fits into the pipeline as a processing step, not a destination.

The agent is fine-tuned on investigating GuardDuty findings. It’s distinct from other AWS frontier agents such as the AWS Security Agent and AWS DevOps Agent. The scope of the investigation agent is focused to deliver specialized analysis of GuardDuty findings.

Integration with the AWS MCP server

The Model Context Protocol (MCP) is an open standard that allows AI assistants to securely connect to external data sources and tools. Because the AWS MCP server implements this standard for AWS services, you can use it to add GuardDuty investigations into AI-powered workflows using tools like Kiro, Anthropic’s Claude, or other MCP-compatible clients.

To configure the AWS MCP server

  1. Configure your MCP client to connect to the AWS MCP server.
  2. Use natural language to invoke investigations (for example,“Investigate the recent Unauthorized Access finding for account 123456789012″).
  3. Review the investigation results returned through your MCP client. These results can vary depending on the model or agent being used, configuration, and the non-deterministic nature of AI.

Integrate the results into your existing agent automation or take manual action based on the findings.

Additional usage examples

  • “Investigate the latest high-severity finding in my production account”
  • “Create an investigation for finding ID abc123 in account 987654321098 and summarize what happened”
  • “List investigations from the last 24 hours and flag those that need human review”

How the investigation agent relates to AWS Security Incident Response

At re:Invent 2024, AWS launched AWS Security Incident Response (AWS SIR), a managed service that you can use to quickly prepare for, respond to, and recover from security incidents. AWS SIR and the GuardDuty investigation agent address different stages of your security workflow. The GuardDuty investigation agent provides an on-demand assessment capability. When your team needs deeper context on a specific finding, an account security posture, or the overall security posture of your organization. You create an investigation and receive a structured assessment with risk levels, confidence scores, MITRE ATT&CK® technique mappings, and actionable recommendations. Security analysts can use this to quickly understand the scope and severity of what GuardDuty has detected.

When you create an AWS-supported case through AWS SIR, a SIR investigation agent activates, working in parallel with AWS Security Incident Response engineers to gather evidence and deliver an investigation summary within minutes. AWS SIR is purpose-built for active security events where you need both AI-powered automation and human expertise to coordinate containment and recovery.

Security teams can use these capabilities to assess and prioritize findings on demand using the GuardDuty investigation agent, escalate confirmed issues to stakeholders with supporting evidence, and create or update an AWS-supported case to accelerate involvement from the AWS SIR team when additional support is needed.

Availability and pricing

Public preview of the GuardDuty investigation agent is available in 10 AWS Regions including US East (N. Virginia), US East (Ohio), US West (Oregon), Canada (Central), Europe (Frankfurt), Europe (Ireland), Europe (London), Europe (Paris), Europe (Stockholm), and Asia Pacific (Tokyo).

During public preview, the investigation agent is available at no charge. Usage is limited to 10 investigations per account per day, with a cumulative limit of 100 investigations per account during the preview period. Failed investigations do not count toward these quotas.

Start investigating findings today

The Amazon GuardDuty investigation agent reduces investigation time from hours to minutes, letting your security team focus on confirmed security events rather than manual correlation.

Get started by:

  1. Enabling the investigation agent in your GuardDuty console
  2. Creating your first investigation using a recent GuardDuty finding
  3. Reviewing the structured assessment, including risk level and recommended next steps

For organizations using the AWS MCP server, you can also invoke investigations through natural language in your AI assistant of choice.

Learn more

If you have feedback about this post, submit comments in the Comments section below.


Allan Holmes

Allan Holmes

Allan brings over 20 years of experience spanning security & compliance, networking, and DevOps to his current role as a Security Specialist. Giving him a uniquely holistic view of cloud security challenges. Allan holds multiple technical certifications from AWS, ISC2, CompTIA, and an MBA, enabling him to bridge deep technical expertise with business strategy. Outside of work, Allan is an avid gardener and electronics enthusiast who enjoys exploring innovative technologies hands-on.

  •  

Authenticate legitimate AI agent traffic with AWS WAF Bot Control

As AI agents and automated tools increasingly access web applications, distinguishing legitimate bot traffic from malicious attempts has become a critical security challenge. Traditional approaches such as IP-based filtering and reverse DNS lookups fail in multi-tenant systems (such as Amazon Bedrock AgentCore) where thousands of distinct workloads share the same IP space. Attackers can easily spoof user agents, and manual allowlists don’t scale with growing demand.

Web Bot Authentication (WBA), available in AWS WAF Bot Control since November 2025, solves this challenge by implementing cryptographic signatures that provide tamper-proof verification of bot identities. WBA uses asymmetric cryptography to verify that a request comes from an authorized automated agent, relying on two active Internet Engineering Task Force (IETF) drafts: a directory draft for sharing public keys, and a protocol draft defining how keys attach crawler identity to HTTP requests.

With WBA, you can confidently identify trusted automated access while maintaining granular control through WAF labels, creating a more secure and manageable ecosystem for both bot operators and website owners. AWS WAF Bot Control respects WBA verification status by default, automatically allowing verified AI agent traffic.

This post provides a deeper technical guide to implementing WBA with AWS WAF. You learn how WBA works, explore the new labels and capabilities it introduces, and walk through a step-by-step implementation—including signing code—to authenticate bot traffic using cryptographic signatures.

How Web Bot Authentication works with AWS WAF

WBA uses asymmetric cryptography to verify bot identities through HTTP message signatures. The process works as follows:

  1. Bot registration – Bot operators publish their public keys in a signature directory. AWS WAF regularly polls these directories and maintains a valid key registry.
  2. Request signing – Each bot operator’s request is signed using their private key following the IETF standard HTTP Message Signatures (RFC 9421).
  3. Verification – AWS WAF verifies signatures against known public keys associated with the bot operator and appends labels related to verification status.

A typical WBA-signed request includes headers like the following:

Signature-Agent: https://signature-agent.test
Signature-Input: sig2=("@authority" "signature-agent")
;created=1735689600
;keyid="poqkLGiymh_W0uP6PZFw-dvez3QJT5SolqXBCW38r0U"
;alg="ed25519"
;expires=1735693200
;nonce="e8N7S2MFd/qrd6T2R3tdfA..."
;tag="web-bot-auth"
Signature: sig2=:jdq0SqOwHdyHr9+r5jw3iYZH6aNGKijYp/EstF4RQ..

The following sequence diagram shows how AWS WAF verifies bot signatures and applies labels for allow or block decisions.

Figure 1 – AWS WAF Web Bot Authentication verification flow

Figure 1 – AWS WAF Web Bot Authentication verification flow

The workflow shown in figure 1 includes the following steps:

  1. A bot sends a signed request to Amazon CloudFront and is inspected by AWS WAF Bot Control
  2. AWS WAF Bot Control retrieves the bot operator’s public key from the signature directory
  3. AWS WAF Bot Control verifies the ed25519 signature
  4. AWS WAF Bot Control appends a verification label (verified, invalid, expired, or unknown_bot)

AWS WAF Bot Control evaluates rules using the label to allow or block the request.

New capabilities added to AWS WAF

With the addition of WBA, the following capabilities were added to AWS WAF.

Cryptographic bot verification

When a bot sends a request, it includes HTTP message signatures that AWS WAF validates at the edge using the AWS WAF Bot Control rule group (version 4.0 and later). This validation process adds minimal latency to requests while providing cryptographic certainty about the bot’s identity. HTTP Message Signatures is an open IETF standard (RFC 9421) that defines a mechanism for signing and verifying HTTP messages using asymmetric keys—in practice, this means a bot cryptographically signs specific headers and metadata of each request, and the receiver can verify the signature using the bot’s published public key.

New labels within AWS WAF for granular control

AWS WAF automatically validates signatures, and successfully validated traffic is immediately marked as verified. This verification status can be used in WAF rules and bot management policies, giving you the ability to write your own rules based on the new functionality.

The following table describes the new labels.

Label Meaning Suggested action
awswaf:managed:aws:bot-control:bot:web_bot_auth:verified Successful cryptographic verification Allow
awswaf:managed:aws:bot-control:bot:web_bot_auth:invalid Failed verification attempt Block or rate-limit
awswaf:managed:aws:bot-control:bot:web_bot_auth:expired Expired key used Block and alert
awswaf:managed:aws:bot-control:bot:web_bot_auth:unknown_bot Unrecognized key Monitor or block
awswaf:managed:aws:bot-control:bot:vendor:<vendor_name> Bot vendor or operator Use for vendor-specific rules
awswaf:managed:aws:bot-control:bot:name:<rfc_name> Bot name (RFC token from WBA) Use for bot-specific rules
awswaf:managed:aws:bot-control:bot:account:<hash> AWS account identifier (Amazon Bedrock AgentCore agents only) Use for account-level controls

AWS WAF now automatically allows verified AI agent traffic

AWS WAF Bot Control now respects WBA verification status by default, automatically allowing verified AI agent traffic. This includes two specific behavior changes:

  • Category:AI rule update – Previously, the Category:AI rule under common Bot Control blocked unverified bots. Bot Control now checks WBA verification status before applying this rule.
  • TGT_TokenAbsent rule update – The TGT_TokenAbsent rule, which detects requests without a WAF token, no longer matches requests that carry the web_bot_auth:verified label.

Key benefits for AWS WAF customers

WBA with AWS WAF delivers several advantages for organizations managing automated traffic at scale.

  • Enhanced bot visibility – Clear identification of distinct bots operating from multi-tenant platforms like Amazon Bedrock AgentCore, providing transparency into automated traffic sources. The AWS WAF console includes a new AI activity dashboard that provides a centralized view of AI bot and agent traffic across your protected resources.
  • Enhanced security – Cryptographic verification of bot identities using industry-standard signing mechanisms.
  • Reduced false positives – Accurate distinction between legitimate and malicious automated traffic, particularly in shared IP environments.
  • Industry alignment – Alignment with industry standards and major content delivery network (CDN) providers for consistent bot authentication across platforms.

Customer use cases for WBA with AWS WAF

Across industries, organizations use WBA to grant automated agents secure, controlled access to their web applications. The following scenarios highlight where this capability delivers real-world value:

  • Verified customer support agents – Authenticate AI-powered chat and support bots so websites can recognize them as approved, registered agents. This enables seamless customer service automation while maintaining security controls and audit trails.
  • Automated crawling and indexing – Allow search engine crawlers and content indexers to fetch pages with clear identity and scoped permissions. This reduces false-positive blocks, improves crawl efficiency, and helps legitimate bots access your content without triggering security controls.
  • Partner integrations – Third-party agents can access customer portals and APIs with explicit consent and granular, scoped access controls. This facilitates secure business-to-business (B2B) integrations while maintaining visibility into partner bot activity.
  • Enterprise automations and agents – Internal automation tools—including monitoring systems, QA bots, continuous integration and delivery (CI/CD) pipelines, and robotic process automation (RPA) solutions—get authenticated access to web applications with least-privilege access principles and full auditability.

Availability

WBA was introduced in Bot Control rule group Version_4.0 (November 2025) for Amazon CloudFront distributions, with continued support in later versions. With Version_6.0, WBA is available for resource types supported by AWS WAF across standard commercial AWS Regions.

Getting started: Developers or agents quick start

Whether you’re implementing WBA yourself or working with an AI coding assistant, the following steps walk you through deploying WBA, signing requests, and writing custom rules.

Step 1: Deploy the WBA-enabled Bot Control

Add the AWS WAF Bot Control rule group to your CloudFront-associated web ACL using static Version_4.0 or Version_5.0—both include WBA support for cryptographic bot verification. Version_5.0 (released February 2026) covers more than 650 unique bots and agents spanning categories including AI search engine crawlers, AI data collectors, AI assistants, and large language model (LLM) training crawlers.

Important: You must explicitly select one of these static versions.

The following example CloudFormation YAML snippet shows a bot control rule set configuration:

# Bot Control rule group with WBA support
ManagedRuleGroupStatement:
  VendorName: AWS
  Name: AWSManagedRulesBotControlRuleSet
  # Use Version_4.0 or higher for WBA support
  Version: Version_5.0
  ManagedRuleGroupConfigs:
    - AWSManagedRulesBotControlRuleSet:
        # COMMON level provides WBA verification
        # TARGETED level adds additional bot-specific protections
        InspectionLevel: COMMON

Step 2: Sign requests from your bot

If your agent runs on Amazon Bedrock AgentCore Browser, request signing is handled automatically—no additional configuration is required.

For agents running outside of AgentCore, registration APIs are on the roadmap that you can use to sign requests independently by:

  1. Generating an ed25519 key pair
  2. Hosting your public key in a signature directory
  3. Signing outbound HTTP requests using the Signature-Input and Signature headers with the web-bot-auth tag. For language-specific signing implementations, see the HTTP Message Signatures RFC (RFC 9421) and the AWS WAF Bot Control documentation.

Step 3: Write custom rules using WBA labels

Use the verification labels in custom WAF rules for granular traffic control, for example:

  • Allow – awswaf:managed:aws:bot-control:bot:web_bot_auth:verified
  • Rate-limit – awswaf:managed:aws:bot-control:bot:web_bot_auth:invalid
  • Alert on – awswaf:managed:aws:bot-control:bot:web_bot_auth:expired

Step 4: Monitor WBA traffic

Use AWS WAF metrics and logs to monitor authenticated bot traffic:

  • Review Amazon CloudWatch metrics for Bot Control rule group matches and set up alarms for anomalous or unexpected spikes in invalid or expired verification attempts.
  • Analyze AWS WAF logs to identify patterns in bot authentication attempts and filter on web_bot_auth labels.
  • Use the AI Activity Dashboard in the AWS WAF console for a centralized view of AI bot traffic. Visualize traffic trends, identify top bots and frequently targeted paths, and filter by verification status to decide which bots to allow, rate-limit, or block.

Conclusion

WBA with AWS WAF provides a cryptographically secure, standards-based approach to authenticating legitimate AI agent traffic. By moving from IP-based allowlisting to signature-based verification, you gain accurate bot identification that works across multi-tenant environments.

Looking ahead, our focus is to simplify bot authentication and make it safer by default. Registration APIs that agent owners can use to cryptographically verify bot identity and intent are on the roadmap, helping website owners quickly distinguish trusted automation from unknown traffic.

If you own an agent, adopt WBA and register your agent to receive verified status. In parallel, AWS continues to actively participate in the IETF web-bot-auth working group, advocating for complementary approaches—using both identifying and anonymous verification protocols—and will incorporate these standards into products as they mature to help your deployments stay aligned with the broader ecosystem.

To get started, see the AWS WAF Bot Control documentation and the HTTP Message Signatures RFC (RFC 9421).

If you have feedback about this post, submit comments in the Comments section below.


Harith Gaddamanugu

Harith Shantan Gaddamanugu

Harith is a Sr Edge Specialist Solutions Architect at AWS, where he architects critical infrastructure and security solutions that serve millions of users globally. With a decade of expertise in cloud perimeter protection and web acceleration, he guides large enterprises building resilient architectures. Outside work, Harith enjoys hiking and landscape photography with his family.

Author

Kaustubh Phatak

Kaustubh is a product leader specializing in AI/ML systems and enterprise security solutions. He has led cross-functional teams in deploying AI-powered products at scale, working closely with security architects and CISOs to address the intersection of AI innovation and cybersecurity risk. His work focuses on translating complex technical capabilities into business value, particularly in emerging technology domains where traditional frameworks don’t apply.

  •  

New compliance guidance available: HITRUST i1 on AWS

We are pleased to announce the publication of a new AWS compliance implementation guidance: HITRUST i1 Compliance on AWS: Customer Implementation Guidance with an Illustrative Healthcare Platform.

Healthcare organizations seeking HITRUST i1 certification increasingly rely on Amazon Web Services (AWS) as their cloud foundation. The HITRUST i1 assessment covers 182 curated controls at the Implemented level and is the most widely required HITRUST certification tier in healthcare vendor contracts and Business Associate Agreements required by health plans, hospital systems, and business associates as a condition of working with them.

This guide is designed to close the gap between understanding what HITRUST i1 requires and knowing how to implement it on AWS. It walks cloud architects, security engineers, compliance leads, and assessment preparation teams through the full lifecycle of an i1 engagement from defining the assessment boundary to implementing controls across each technical domain.

What the guide covers

The guide addresses 11 HITRUST i1 technical control domains, with supporting AWS implementation components relative to these domains. The domains include access control, endpoint protection, configuration management, vulnerability management, network protection, transmission protection, incident management, data protection and privacy, audit logging and monitoring, password management, and business continuity and disaster recovery.

The guidance is grounded in a fictional but realistic connected healthcare platform deployed on AWS Landing Zone Accelerator. The scenario is used to make abstract HITRUST concepts concrete, not to suggest that the same architecture or control choices apply universally. HITRUST i1 scoping is inherently organization-specific. The assessment boundary, applicable controls, and evidence requirements are determined by each organization’s system scope and delivered through the HITRUST MyCSF portal. Readers should treat the guidance as a starting point and work with a HITRUST Authorized External Assessor to validate what applies to their specific environment. This guide doesn’t constitute a compliance certification advisory.

Getting started

You can download the guide here: HITRUST i1 Compliance on AWS: A Customer Implementation Guidance with an Illustrative Healthcare Platform.

AWS HITRUST assurance documentation and the Customer Responsibility Matrix are available through AWS Artifact. For assessment readiness support, visit AWS Security Assurance Services.

If you have feedback about this post, submit comments in the Comments section below.


Abdul Javid

Abdul is a Senior Security Assurance Consultant at AWS Security Assurance Services. He holds HITRUST certifications and has led HITRUST r2 and i1 engagements across multiple healthcare technology companies. Abdul holds multiple security and auditing certifications and supports customers building responsible AI governance programs on AWS. He has over 25 years of experience and holds certifications across AWS, CMMC, PCI DSS, PMI, ISC2, and ISACA.

Shreya Singh

Shreya Singh

Shreya is a Security Assurance Consultant at AWS with more than eight years of experience in governance, risk, compliance, and cloud security. She holds the CISA and HITRUST Certified CSF Practitioner (CCSFP) certifications and supports healthcare and technology organizations with HITRUST, HIPAA, SOC 2, risk management, and audit readiness initiatives. She holds a Master of Engineering in Cybersecurity from the University of Maryland, College Park.

  •  

Introducing OAuth Support for AWS MCP Server

You can now connect your agents to the AWS MCP Server using the same credentials and sign-in methods that you already use for connecting to the AWS Management Console or AWS Command Line Interface (AWS CLI) through a familiar browser-based experience powered by industry-standard OAuth. This new sign-in path supports AWS Identity and Access Management (IAM) federation, AWS IAM Identity Center, and root or IAM users.

In addition, AWS is introducing several new security and governance tools, including: new global condition keys for OAuth, token introspection and revocation, dynamic client registration, new AWS CloudTrail elements, and a new API for headless OAuth connectivity. All of this is compatible with your existing IAM configuration including permissions, roles, and federated access.

In this post, you’ll learn how to connect your agents to the AWS MCP Server, understand how AWS Sign-In authorizes agent access, and manage access using new security and governance capabilities.

How to connect an agent to the AWS MCP Server

This walkthrough uses Claude Code, but the same steps apply to any agent that supports Model Context Protocol (MCP) such as Kiro, Codex, and Gemini. See Setting up the AWS MCP Server for how to connect the AWS MCP Server to an agent.

Prerequisite permissions

To connect an agent to the AWS MCP Server, you’ll need the IAM permissions required for OAuth-based sign-in. The following AWS CLI command adds a managed policy with required permissions to your IAM role (remember to replace <MyRole> with your IAM role):

aws iam attach-role-policy \
  --role-name <MyRole> \
  --policy-arn arn:aws:iam::aws:policy/AWSMCPSignInOAuthAccessPolicy

Step 1: Configure the AWS MCP Server on your agent

Run the following command to add the AWS MCP Server endpoint to your agent’s configuration as shown in Figure 1:

claude mcp add --transport http aws-mcp https://aws-mcp.us-east-1.api.aws/mcp

Figure 1: Adding the AWS MCP Server endpoint to Claude Code

Figure 1: Adding the AWS MCP Server endpoint to Claude Code

Step 2: Review the authorization request

The first time your agent needs to access the AWS MCP Server, it opens a browser and redirects you to an AWS Sign-In page, shown in Figure 2. Authenticate as you would on AWS console or AWS CLI, review the authorization request, and approve access. You should receive an Authorization successful message.

Figure 2: Review authorization request

Figure 2: Review authorization request

Note that if you already have an active AWS Sign-In session (e.g., because you previously signed in to the console earlier in the day), you can reuse that session without needing to sign in again.

Step 3: Start using AWS tools

After connecting your agent to the AWS MCP Server, you can begin invoking tools provided by the server. To verify that Claude Code is connected to the AWS MCP Server, start Claude Code and run the following command:

/mcp

The command displays the configured MCP servers and confirms that the AWS MCP Server is connected and ready to use with your AWS credentials.

Figure 3 shows an example of a successful connection to the AWS MCP Server.

Figure 3: Verifying the AWS MCP Server connection in Claude Code

Figure 3: Verifying the AWS MCP Server connection in Claude Code

After the connection is established, you can ask Claude Code to invoke tools provided by the AWS MCP Server. For example, enter the following prompt:

Deploy a sample serverless web application into my development AWS account

Claude Code uses the AWS MCP Server to identify the active AWS account, confirm the target account, and describe the deployment it plans to perform before invoking AWS services on your behalf.

Figure 4 shows Claude Code confirming the active AWS account and outlining the resources that will be deployed.

Figure 4: Using Claude Code to deploy a sample serverless application through the AWS MCP Server

Figure 4: Using Claude Code to deploy a sample serverless application through the AWS MCP Server

Authorization models and how they work

AWS Sign-In supports two authorization models for connecting agents to the AWS MCP Server:

  • Interactive authorization for developers’ AI agents using browser based authentication
  • Non-interactive (headless) authorization for applications and AI agents that already have AWS credentials and don’t have access to a browser

Note that authorizing an agent allows it to access the AWS MCP Server on your behalf. It doesn’t grant the agent additional AWS permissions. Every request is still evaluated using your existing IAM policies, SCPs, RCPs, permission boundaries, and other organizational controls.

Interactive access

In the interactive case, the agent first discovers the AWS Sign-In OAuth server and then registers itself as an OAuth client using Dynamic Client Registration (DCR). It then redirects you to an AWS Sign-In page where you authenticate and authorize access (step 2 in the preceding section). After successful authorization, AWS Sign-In then issues short-lived access tokens and refresh tokens that authorize the agent to access the AWS MCP Server on your behalf. AWS Sign-In automatically manages token issuance and token refresh, enabling authorized agents to continue accessing the AWS MCP Server without requiring you to repeatedly sign in.

The interactive authorization model supports three distinct sign-in methods: native AWS IAM credentials for individual developers, managed access through AWS IAM Identity Center for enterprises, and seamless federated access via third-party providers like Okta and Ping Identity for larger organizations.

OAuth server metadata and DCR

Before an agent can request authorization, it must discover the AWS Sign-In OAuth endpoints and register itself as an OAuth client. AWS Sign-In supports OAuth metadata discovery and DCR, allowing supported agents to configure themselves automatically without requiring developers to manually provision OAuth client IDs and client secrets. When an agent connects to the AWS MCP Server for the first time, it retrieves the AWS MCP Server’s protected resource metadata (RFC 9728) and the AWS Sign-In OAuth metadata (RFC 8414). The agent then uses (RFC 7591) to register with AWS Sign-In, obtain a client ID, and initiate the standard OAuth authorization code flow.

AWS Sign-In supports OAuth discovery and DCR for agents running on local workstations and supported hosted environments. For the current list of supported agents and environments, see Supported redirect URIs for the AWS MCP Server.

Non-interactive access to the AWS MCP Server

Non-interactive (headless) authorization is for agents and applications that run without a browser or human in the loop, and thus don’t require interactive sign-in. This allows agents that already have AWS credentials to obtain OAuth access tokens and connect to the AWS MCP Server. The following is an example of how to obtain an access token.

aws signin create-oauth2-token-with-iam \ 
--grant-type client_credentials \ 
--resource aws-mcp.amazonaws.com \  
--region us-east-1 
{ 
"accessToken": "ASOA****************************************...", 
"tokenType": "Bearer", 
"expiresIn": 3600 
}

In the non-interactive case, AWS Sign-In implements the OAuth client credentials grant using AWS security credentials instead of a static client secret. Applications authenticate to the AWS Sign-In token endpoint using SigV4 creds, and AWS Sign-In returns a short-lived OAuth access token that can be used to access the AWS MCP Server.

Please note you may have to update the SDK and AWS CLI, please refer to CLI guide.

Managing OAuth access

AWS Sign-In extends the existing IAM authorization model with capabilities for governing OAuth access to the AWS MCP Server. Administrators can use familiar IAM policies together with new OAuth-specific controls.

Granting OAuth permissions

OAuth access is governed using IAM policies and requires the following IAM actions:

  • signin:AuthorizeOAuth2Access – Allows users to sign in interactively using the OAuth authorization code flow
  • signin:CreateOAuth2Token – Allows applications to obtain OAuth access tokens by exchanging authorization codes, refresh tokens, or using client credentials

When an application requests access, AWS Sign-In creates an OAuth authorization grant between the agent and the AWS MCP Server. This grant is represented as an IAM resource, which the preceding AWS Sign-In actions are authorized against.

arn:aws:signin:us-east-1:012345678910:service-principal/aws-mcp.amazonaws.com

OAuth authorization grants are represented as an IAM resource enabling administrators to use standard IAM policy constructs, including global condition keys, together with OAuth-specific condition keys to control how authorization grants are created and used.

Governing OAuth access

AWS Sign-In introduces OAuth-specific condition keys that allow administrators to govern how agents obtain OAuth authorization. The following examples demonstrate common governance patterns.

To restrict OAuth authorization to localhost:

In addition to accessing the AWS MCP Server with agents on your local workstation, AWS supports signing into the AWS MCP Server on select hosted providers through dynamic client registration. Click here to view the list of supported remote providers. Many organizations want to allow developers to authorize agents running on their local workstations while preventing OAuth tokens from being delivered to untrusted redirect URIs or using unsupported authorization flows. The following policy allows only the OAuth authorization code and refresh token flows for the AWS MCP server and restricts token delivery tolocalhost.

{
  "Version": "2012-10-17",
  "Statement": [
    {
      "Effect": "Allow",
      "Action": [
        "signin:AuthorizeOAuth2Access",
        "signin:CreateOAuth2Token"
      ],
      "Resource": "arn:aws:signin:*:*:service-principal/aws-mcp.amazonaws.com",
      "Condition": {
        "StringLike": {
          "signin:OAuthRedirectUri": "http://localhost:*"
        },
        "StringEquals": {
          "signin:OAuthGrantType": [
            "authorization_code",
            "refresh_token"
          ]
        }
      }
    }
  ]
}

To deny access for a specific OAuth session

Use the aws:SignInSessionArn global condition key to deny authorization associated with a specific sign-in session. This allows administrators to contain a suspicious or compromised authorization session without affecting other active sessions.

{
  "Version": "2012-10-17",
  "Statement": [
    {
      "Effect": "Deny",
      "Action": [
        "*"
      ],
      "Resource": "*",
      "Condition": {
        "ArnEquals": {
          "aws:SignInSessionArn": "arn:aws:signin:us-east-1:111122223333:session/abc123-example-session-id"
        }
      }
    }
  ]
}

These examples demonstrate common governance patterns. Additional IAM and SCP examples are available in the AWS Sign-In condition keys reference.

Revoking OAuth tokens

AWS Sign-In provides OAuth token introspection and token revocation APIs that allow administrators to build custom tools for token validation and revocation. Access to these APIs is controlled through the signin:IntrospectOAuth2Token and signin:RevokeOAuth2Token permissions. IAM principals with permissions are allowed to introspect and revoke tokens for the same account.

The introspection API can be used to determine whether a token is active and obtain information about the associated authorization. The revocation API allows administrators and security tools to revoke individual refresh tokens without affecting other active sessions. For example, if an organization needs to invalidate access for a specific OAuth authorization, account admins can revoke the associated refresh token without affecting other active sessions.

Monitoring OAuth activity

OAuth-related activities are recorded in AWS CloudTrail, including authorization requests, token issuance, token revocation, and token introspection events. CloudTrail logs also capture details such as the OAuth client, target the AWS MCP Server, redirect URI, authorization flow, and associated sign-in session. In addition, AWS API calls made using OAuth access tokens include the associated aws:SignInSessionArn context, allowing organizations to correlate API activity with the originating OAuth sign-in session.

This allows security teams to monitor OAuth usage, investigate authorization activity, detect anomalous behavior, and integrate OAuth events into existing auditing, compliance, and incident response workflows alongside other AWS activity.

Here’s a CloudTrail sample for an AuthorizeOAuth2Access event:

{
    "eventVersion": "1.11",
    "userIdentity": {
        "type": "AssumedRole",
        "principalId": "AROATJHQDX737YZP****:testuser",
        "arn": "arn:aws:sts::111111111111:assumed-role/Admin/testuser",
        "accountId": "111111111111",
        "sessionContext": {
            "sessionIssuer": {
                "type": "Role",
                "principalId": "AROA2IRT4N5U4RDHM2LG4",
                "arn": "arn:aws:iam::111111111111:role/Admin",
                "accountId": "111111111111",
                "userName": "Admin"
            },
            "attributes": {
                "creationDate": "2026-06-09T05:06:39Z",
                "mfaAuthenticated": "false"
            }
        }
    },
    "eventTime": "2026-06-09T05:09:00Z",
    "eventSource": "signin.amazonaws.com",
    "eventName": "AuthorizeOAuth2Access",
    "awsRegion": "us-west-2",
    "sourceIPAddress": "192.0.0.2",
    "userAgent": "Mozilla/5.0 (Macintosh; Intel Mac OS X 10_15_7) AppleWebKit/537.36 (KHTML, like Gecko) Chrome/149.0.0.0 Safari/537.36",
    "requestParameters": {
        "resource": "https://aws-mcp.us-west-2.api.aws/mcp",
        "redirect_uri": "http://127.0.0.1:60432/oauth/callback",
        "code_challenge_method": "S256",
        "client_id": "arn:aws:signin:us-west-2::external-client/dcr/609544da-aasa-49a4-ab11-c2r457fa999"
    },
    "responseElements": null,
    "additionalEventData": {
        "success": "true"
    },
    "requestID": "4fb4ff7b-6yu7-9090-78i9-9c0088a65134",
    "eventID": "bb05b222-31ec-4237-b8e7-8eb26d4fd48b",
    "readOnly": true,
    "eventType": "AwsApiCall",
    "managementEvent": true,
    "recipientAccountId": "111111111111",
    "eventCategory": "Management",
    "tlsDetails": {
        "tlsVersion": "TLSv1.3",
        "cipherSuite": "TLS_AES_128_GCM_SHA256",
        "clientProvidedHostHeader": "us-west-2.oauth.signin.aws"
    }
}

Here’s a CloudTrail sample for a CreateOAuth2Token event:

{
    "eventVersion": "1.11",
    "userIdentity": {
        "type": "AssumedRole",
        "principalId": "AROATJHQDX737YZP7****:testuser",
        "arn": "arn:aws:sts::111111111111:assumed-role/Admin/testuser",
        "accountId": "111111111111",
        "sessionContext": {
            "sessionIssuer": {
                "type": "Role",
                "principalId": "AROA2IRT4N5U4RDHM****",
                "arn": "arn:aws:iam::111111111111:role/Admin",
                "accountId": "111111111111",
                "userName": "Admin"
            },
            "attributes": {
                "creationDate": "2026-06-09T05:06:39Z",
                "mfaAuthenticated": "false"
            },
            "signInSessionArn":"arn:aws:signin:us-west-2:111111111111:session/daff060f-7871-5tg6-67yu-a07bbdabe61a"
            
        }
    },
    "eventTime": "2026-06-09T05:10:04Z",
    "eventSource": "signin.amazonaws.com",
    "eventName": "CreateOAuth2Token",
    "awsRegion": "us-west-2",
    "sourceIPAddress": "192.0.0.2",
    "userAgent": "curl/8.7.1",
    "requestParameters": {
        "resource": "https://aws-mcp.us-west-2.api.aws/mcp",
        "client_id": "arn:aws:signin:us-west-2::external-client/dcr/609544da-b3dd-49a4-ab11-c2e98d7fa999"
    },
    "responseElements": null,
    "additionalEventData": {
        "signInSessionArn": "arn:aws:signin:us-west-2:111111111111:session/daff060f-7871-5tg6-67yu-a07bbdabe61a",
        "grant_type": "refresh_token",
        "success": "true"
    },
    "requestID": "44d6d7ce-e4r5-4cbf-0909-bfb8a8295a76",
    "eventID": "f79cc63f-b383-4e3c-a1e5-97c7db1ab833",
    "readOnly": true,
    "eventType": "AwsApiCall",
    "managementEvent": true,
    "recipientAccountId": "111111111111",
    "eventCategory": "Management",
    "tlsDetails": {
        "tlsVersion": "TLSv1.3",
        "cipherSuite": "TLS_AES_128_GCM_SHA256",
        "clientProvidedHostHeader": "us-west-2.oauth.signin.aws"
    }
}

Additional audit events and logging details for calls made using OAuth access tokens to the AWS MCP Server can be found in Logging AWS MCP Server API calls using AWS CloudTrail.

Conclusion

AWS Sign-In support for OAuth enables you to securely connect to the AWS MCP Server using industry-standard authorization. This release simplifies application and agent integration with AWS while supporting your existing IAM setup, governance, and auditing capabilities.

To learn more, see Sign-In with OAuth 2.0 in the AWS Sign-In User Guide and Setting up the AWS MCP Server in the Agent Toolkit for AWS User Guide.

If you have feedback about this post, submit comments in the Comments section below.


Vaibhav Chowla

Vaibhav Chowla

Vaibhav is a Senior Technical Product Manager at AWS, specializing in AWS Identity products. He focuses on enhancing user authentication and security, helping customers of all sizes solve complex identity and access management (IAM) challenges. Outside of technology, Vaibhav enjoys traveling and exploring new cultures and cuisines.

Jaimin Bhatt

Jaimin Bhatt

Jaimin is a Principal Software Engineer at AWS. He works on AWS Identity and Access Management (IAM) across sign-in, threat detection, and the authentication and authorization that secures access to AWS. Jaimin is an active participant in multiple industry standards bodies. Previously, he led work on data perimeter controls for AWS Management Console sign-in, multi-session support for the console, a simplified AWS CLI sign-in experience, and the internal Amazon identity provider.

Ankur Joshi

Ankur Joshi

Ankur is a Software Development Manager on the AWS Identity Sign-In team. His team focuses on delivering secure and resilient authentication mechanisms and access controls for AWS customers.

  •  

The CISO’s guide to post-quantum mandates and migrations

Over a dozen major economies have now published post-quantum cryptography (PQC) adoption guidance. As a CISO, you’re probably well into your migration plan and know the most difficult part has little to do with changing algorithms. The real leadership challenge is driving coordinated change across a large, complex organization where asymmetric cryptography is embedded in every protocol, every vendor dependency, and every legacy system that quietly handles key exchange or digital signatures. This guide provides the regulatory context and the strategic playbook for CISOs, CTOs, or any senior leader who needs to deliver a program that meets compliance deadlines while modernizing your organization’s security governance.

Overview for busy executives

There are five key takeaways to the information presented in this post:

  • Start at the top. Secure board-level sponsorship by framing cryptographic modernization as enterprise risk reduction with a defined timeline and measurable milestones. Stand up a centralized program office that owns the mandate, sets prioritization criteria, and coordinates delivery across business units.
  • Classify dependencies, don’t inventory everything. At the workload level, you need to understand three things: what your providers will upgrade on your behalf, what they won’t upgrade in time and needs replacing, and what you own and must address directly. The fastest path to reduce your migration scope is to shift cryptographic responsibility to the first category (what providers will upgrade for you) wherever possible.
  • Invest in cryptographic telemetry. Build visibility and monitoring in parallel with your migration work. Although this capability is critical, it shouldn’t come at the cost of momentum. Track algorithm usage, PQC coverage percentage, and migration velocity at the workload level. Telemetry sustains board sponsorship over a multiyear program and gives your centralized team the feedback loop to set priorities.
  • Build for agility, not one-time compliance. Your goal should extend beyond deploying PQC one time. Build the organizational muscle to rotate protocols, algorithms, and key lengths as standards evolve, because cryptographic migration will be a recurring operational requirement.
  • Treat this as security and governance modernization. Strong patching discipline, reliable continuous integration and delivery (CI/CD), and automated lifecycle management are capabilities that will outlast your PQC migration. They’re the same capabilities you need to respond to AI-accelerated threats, where vulnerability discovery timelines are compressing from weeks to hours. An organization that can rotate algorithms on demand can also patch against novel AI-driven exploits.

Read on for the full playbook.

Global regulatory landscape

In August 2024, NIST published the first three post-quantum standards covering key encapsulation (ML-KEM), lattice-based digital signatures (ML-DSA), and hash-based signature alternatives (SLH-DSA). These standards now serve as the baseline that most jurisdictions reference when setting migration deadlines. The United States, European Union, United Kingdom, Germany, France, Australia, Canada, Japan, South Korea, India, Singapore, and the UAE have all published formal guidance. Industry groups like FS-ISAC in financial services and GSMA in telecom have their own additional timelines.

These timelines vary by jurisdiction, but all follow the same direction. Most regions require PQC readiness for new procurement by 2027, with full migration deadlines falling between 2030 and 2035 depending on industry and geography. For any organization operating across borders, navigating the specific requirements in each jurisdiction where you do business is critical to both compliance and competitive positioning. Amazon Web Services (AWS) maintains a detailed breakdown of regional mandates and timelines in the FAQ section of the Migration to quantum-resistant cryptography page.

Scoping your migration

Historically, cryptographic migrations have taken far longer than you might expect. The deprecation of SHA-1 took nearly twenty years from the first published vulnerability until major browsers finally rejected it. MD5, 3DES, and RC4 all followed the same pattern of slow organizational response despite clear technical consensus that migration was overdue. Those transitions also happened without the modern cloud infrastructure, automated orchestration, and real-time telemetry that exists today. Organizations that use these capabilities can migrate faster while simultaneously building a future-ready security foundation.

The migration scoping challenge splits cleanly into two families. The first is software systems that negotiate algorithms as part of short-lived authentication or encryption protocols, such as TLS, IPsec, or SSH. For these workloads, cloud-centered lifecycle management, automated patching, and centralized library upgrades make this more straightforward than previous cryptographic migrations. Managed services can handle upgrades transparently and telemetry tooling gives real-time visibility into algorithm usage across endpoints. CI/CD pipelines enable incremental rollout with clean rollback paths. Organizations with modern cloud infrastructure have never been better positioned to execute this side of cryptographic transition at speed.

The second family of things to migrate are long-lived embedded systems, which are devices with burned-in firmware that contain keys and algorithm code that can’t be updated in place. The fastest way to reduce this surface area is to offload their cryptographic workloads to managed services, where your provider absorbs the hardware refresh cycle and every migrated workload is one fewer device you need to plan around. For what remains on dedicated hardware, build quantum readiness into your annual capex review. Because quantum advances don’t arrive on a fixed schedule, evaluate embedded cryptographic assets yearly against developments in quantum hardware. Some devices will stay operationally sound for years, whereas others will need accelerated replacement as threat timelines compress. Annual evaluation means early deprecation becomes a planned business decision rather than an unbudgeted emergency.

The strategic playbook

The following playbook outlines a strategic approach to PQC migration that you can adapt to your organizational context. Each step is designed to build enterprise-wide alignment, replace ambiguity with actionable frameworks, and deliver measurable progress to keep your program funded and on track.

Secure board-level commitment

CISOs need to bring PQC to the board as a business risk conversation anchored to regulatory compliance and competitive exposure rather than a technical briefing on lattice-based algorithms. During this process, it’s important to battle misconceptions. One common misconception at the board level is that PQC migration requires re-encrypting all stored data. It does not. Data encrypted at rest using standard 256-bit symmetric encryption is not vulnerable to a quantum computer. This distinction significantly narrows the actual scope of change and should be communicated early to prevent over-scoping.

Present the regulatory timeline with specificity. For example, explain how CNSA 2.0 mandates PQC for new products by January 2027 and that these timelines will function as procurement gates in regulated industries like financial services, healthcare, government, and defense. You can also quantify the organizational exposure by mapping revenue and workloads that sit in regulated verticals. This could be using existing contracts and pending opportunities with public sector customers as the quantifiable data for business at risk.

Here’s an example of what this could look like in practice. First, identify existing contracts in regulated verticals where PQC compliance language is appearing or will appear at renewal. Calculate the revenue attached and flag renewal dates within 18 months as compliance cliffs. Second, look at your open pipeline. Do you have RFPs, vendor questionnaires, or procurement requirements already referencing post-quantum readiness? That pipeline value is at risk of disqualification if you can’t demonstrate compliance and a competitor can. Third, size the total addressable opportunity in verticals where mandates are taking effect and frame what share becomes inaccessible without readiness. With customers writing PQ readiness requirements into vendor contracts, organizations that can’t demonstrate compliance risk being disqualified from future business.

Finally, request dedicated headcount and vendor budget with board-level sponsorship. This can’t be a side project absorbed into existing security operations. Prioritize executive reviews with quantifiable outcomes tracked quarterly at the leadership level.

Assign single-threaded migration leaders

Stand up a cryptography center of excellence with a cross-functional mandate that spans security, engineering, compliance, and procurement. Appoint a migration lead with direct executive reporting who owns the program end-to-end. Staff the team with representation from networking, identity, application development, vendor management, and compliance because PQC touches all these domains simultaneously.

Give the team authority to set organizational standards for cryptographic policy, library usage, and migration timelines. Align this body with vendor and supplier engagement so there’s one accountable team driving the cloud provider and third-party vendor relationships on PQC readiness.

Fund this team to drive centralized remediation patterns that individual business units adopt rather than reinvent. They own the reference implementations, the approved library versions, the testing frameworks, and the rollout playbooks. When one team solves a migration pattern for a given workload type, the centralized team packages that solution and distributes it across every similar workload in the organization.

Classify dependencies and reduce migration surface area

Beware of guidance that recommends a comprehensive bottom-up cryptographic inventory, except in jurisdictions where it’s explicitly required. That exercise can consume months and delay actual migration. Instead, classify your dependencies into three categories:

  1. Workloads where someone else will upgrade for you. Managed cloud services, software as a service (SaaS) providers, and infrastructure vendors with active PQC roadmaps fall here. Your job is to validate their timelines and hold them accountable.
  2. Workloads where someone else owns the stack but won’t upgrade in time. These are vendor dependencies that you need to replace, potentially before the end of their planned useful life. Flag them now so replacement decisions enter your procurement and capex cycles early.
  3. The third is workloads you own and must upgrade yourself. For these, the decision is whether to upgrade in place or modernize into the cloud where the cryptographic layer becomes managed for you.

The first two categories fall into a vendor risk assessment program. The third category is the workstream that must be managed within your own organization and driven to completion on a workback schedule. Track which dependencies have been validated, which replacements are in flight, and which of your self-managed stacks have active upgrade plans. The three-category model gives your centralized team a clear decision framework instead of going into an unbounded discovery exercise.

Build observability and continuously monitor progress

Visibility into your cryptographic posture is a necessity for planning, execution, and demonstrating compliance to auditors. However, observability shouldn’t be a prerequisite to migrating workloads and should be viewed as a parallel workstream so it doesn’t come at the cost of momentum. After your visibility tooling is in place, it will retroactively show all previous work completed and give a real-time view of progress at the organization level.

Many organizations start with TLS because it’s typically the broadest deployment of cryptography and the primary mechanism protecting sensitive data in transit across web applications, APIs, and microservices. Sponsor TLS metric dashboards that show algorithm usage across all endpoints, differentiating between post-quantum and classical TLS traffic using metadata fields in service logs. The PQC Readiness Scanner serves as an example of how to build and deploy this type of visibility tooling. Over time, extend the same observability to other transport protocols like IPSec, SFTP, and SSH.

Establish a continuous evaluation program with company-wide KPIs, which can feed into executive reviews. Beyond discovery, telemetry provides the executive-level progress metrics that sustain board sponsorship over a multiyear program. Some examples include:

  • Percentage of TLS connections using TLS 1.3 and ML-KEM key exchange
  • PQC coverage percentage across your defined categories
  • Ratio of validated vendor timelines to unconfirmed ones
  • Time-to-remediation when a new dependency is flagged as noncompliant.

Track PQC coverage percentage at the workload and organization level. These metrics turn PQC migration from a one-time project into an ongoing governance function, the same way you already govern patching cadence, vulnerability SLAs, and compliance posture. The goal is to develop a standing capability that absorbs future cryptographic transitions as routine operational work rather than requiring a new program each time.

Align with vendors, regulators, and industry groups

PQC migration crosses organizational boundaries and requires coordinated movement across your supply chain. Engage your cloud providers on their PQC roadmaps and understand which services already support PQ-TLS, which are on the roadmap, and when support is expected. Engage third-party software vendors and SaaS providers with explicit questions about PQC support timelines and write PQC readiness into procurement requirements and vendor contracts going forward.

Engage regulators and standards bodies in your jurisdictions to understand the specific timelines, compliance mechanisms, and audit expectations that apply to your industry. Participate in industry forums because financial services, telecom, healthcare, and critical infrastructure each have sector-specific PQC working groups where peer organizations are sharing approaches and lessons learned. This collaborative approach can also help you get the investment you need for a migration when you have unwilling stakeholders across the business.

Prioritize and roadmap the workloads you own

Adopt a phased approach rather than attempting to migrate everything all at once. Prioritize workloads based on risk and use case. The AWS post-quantum cryptography migration plan blog post provides an example of this prioritization. As you execute on your roadmap, build reliable release and rollback mechanisms at every stage. PQC algorithms have different performance and size characteristics that might surface unexpected behavior under production load. Identify legacy dependencies before they become migration blockers. Systems running custom TLS libraries or hardcoded cipher suites need to be flagged early in the process.

The fastest path to reducing your PQC surface area is eliminating custom cryptographic stacks entirely. Every workload you migrate to a managed service is one fewer workload that your team must upgrade manually. AWS has already delivered post-quantum key exchange across several service endpoints with imperceptible performance impact, and post-quantum signing through AWS Key Management Service (AWS KMS) and AWS Private Certificate Authority. For bespoke code on cloud compute or on premises, open source cryptographic libraries like AWS-LC provide production-ready, FIPS 140-3 validated PQC implementations that your teams can adopt immediately.

Transition to a crypto agile enterprise

Crypto agility is the operational capability to rotate algorithms, update protocols, and absorb cryptographic change as business as usual rather than a dedicated program. Cryptographic standards will continue to evolve. Algorithms will be deprecated and replaced. The organizations that build the ability to do this now won’t need a new program next time.

Crypto agility demands excellence at four disciplines:

  • Patching and upgrade discipline: If you can’t maintain consistent patching cadences across your fleet today, PQC migration will surface that gap at enterprise scale. Mature vulnerability management programs adopt PQC as a natural extension of existing operations.
  • Incremental release with clean rollback: PQ algorithms carry larger signatures, larger keys, and different performance profiles. You need to be able to deploy changes incrementally, validate behavior in production, and rollback cleanly when something doesn’t perform as expected.
  • Consistent CI/CD pipelines: Every application touching asymmetric cryptography will need to be evaluated and potentially rebuilt and redeployed with updated algorithms or libraries. Fragile or manual deployment processes will impede the entire migration.
  • Automated security lifecycle management: Certificate lifecycle, key rotation, secrets vaulting, signature operations, and compliance validation must all operate at machine speed. Manual processes that function today will fail as security requirements evolve.

These aren’t necessarily PQC-specific investments. They’re the foundational capabilities of a well-run security organization. With AI accelerating the speed at which vulnerabilities are discovered and exploited, organizations that have built crypto agility into their operational posture are better positioned to respond to AI-accelerated threats. Savvy security leaders can use PQC as a forcing function to build the operational resilience your organization needs as the threat landscape evolves.

Conclusion

PQC migration will define how the next generation of enterprise security programs are built and measured. The technical tooling exists to execute this transition faster than any previous cryptographic migration. The organizations that move now will shape procurement requirements and set the competitive baseline for their industries. Those that defer will inherit compressed timelines, increased costs, and diminished optionality.

AWS is here to help as you navigate the PQC migration process. You can find our latest guidance and publications in Migration to quantum-resistant cryptography.

AWS Security Assurance Services and AWS Professional Services provide expert guidance, and validated implementation approaches to help you upgrade your own applications and workloads. To get started, you can request a complimentary Post-Quantum Readiness Accelerator introductory call.

If you have feedback about this post, submit comments in the Comments section below.


Rushir Patel

Rushir Patel

Rushir leads Worldwide Data Protection Business Development at AWS, driving go-to-market strategy for the AWS cryptography, identity, and data protection services. He brings over 15 years of experience in cybersecurity, cloud, and AI, with a background in corporate finance and electrical engineering. Outside of work, Rushir enjoys gardening, skiing, wine, and traveling.

  •  

What the June 2026 Threat Technique Catalog update means for your AWS environment

The AWS Customer Incident Response Team (AWS CIRT) encounters patterns that repeat across engagements when helping customers respond to security incidents. We’re passionate about making sure that information is accessible so that everyone can improve their security posture and their organization’s resilience to disruption. The primary method we use to share this information is the Threat Technique Catalog for AWS (TTC). The latest update to the catalog for June 2026 focuses on container security, organization-level trust, and compute hijacking. Each new entry reflects something we’ve encountered in practice, and each provides straightforward mitigation. This post breaks down what changed, why it matters, and what you can do about it today.

What we’re seeing

We’ve added five new entries to the TTC.

EKS workload modification

Amazon Elastic Kubernetes Service (Amazon EKS) gives teams powerful orchestration capabilities. We’re seeing threat actors who have obtained Kubernetes credentials or an AWS Identity and Access Management (IAM) role with EKS permissions modify running workloads—altering container images, injecting sidecar containers, or changing pod specifications to introduce malicious code into a deployment.

Nothing new is created. The workload already exists, it might be running in production, and by modifying it in place the threat actor inherits the network access, service account permissions, and data access the legitimate workload already had. Without admission controllers or image verification, these changes can go unnoticed until the impact shows up downstream. Enforcing image signing through admission controllers, restricting workload changes with Kubernetes role-based access control (RBAC), and enabling Amazon GuardDuty EKS Protection to surface anomalous cluster activity all reduce this risk. For more information, see EKS Modification – Workload Integrity Degradation.

Exploit public-facing application – EKS

Publicly exposed Kubernetes API servers and misconfigured ingress controllers continue to be an entry point we see exploited. This technique captures threat actors targeting the customer-deployed workloads running on Amazon EKS—not EKS itself—and their exposure to the internet.

The pattern starts with an exposed service and an application-level weakness, then pivots from the compromised pod toward broader cluster access. When inside a pod, a threat actor can query the instance metadata service, read mounted service account tokens, or move laterally across the cluster network. Limiting public exposure of the Kubernetes API server, applying network policies to restrict pod-to-pod communication, and running workloads with least-privilege service accounts reduce the risk of this technique succeeding. For more information about this technique, see Exploit Public-Facing Application.

Assume root into organization member account

AWS Organizations centralizes trust across member accounts, and that trust runs in one direction—from the management account downward. We’ve observed threat actors who compromise a management account—or gain sufficient privilege within one—use that position to assume root access into member accounts using sts:AssumeRoot. Because the trust is inherent to the organization structure, this can avoid the access controls a member account administrator has configured.

With root access to a member account, a threat actor can disable security controls, delete resources, change billing configurations, and establish persistence that survives remediation focused on IAM principals. We strongly encourage implementing service control policies (SCPs) that restrict which principals can call sts:AssumeRoot and under what conditions, and monitoring for sts:AssumeRoot calls in AWS CloudTrail. For more information, see Assume Root into Organization Member Account.

Compute hijacking – EKS

Compute hijacking remains one of the most common motivations we see behind unauthorized access, and Amazon EKS clusters are increasingly the target. Threat actors deploy cryptocurrency mining or other compute-intensive workloads inside compromised clusters, consuming customer resources and generating unexpected cost.

What sets EKS-based hijacking apart is scale. In clusters without resource quotas, a single compromised service account can consume all available capacity across nodes. The workloads use legitimate-looking images pulled from public registries, which makes image scanning alone insufficient. Setting resource quotas and limit ranges, restricting which registries workloads can pull from, and enabling Amazon GuardDuty EKS Protection to flag mining behavior provides effective detection. For more information, see Resource Hijacking: Compute Hijacking – EKS.

Invite accounts to unknown organization

A threat actor with access to a standalone account—or one they’ve removed from its legitimate organization—invites it into an organization they control. After the account joins, it falls under the threat actor’s governance. The threat actor’s organization can apply SCPs that restrict the legitimate owner’s actions, gain visibility into the account’s resources through organizational services, and access consolidated billing information. The legitimate owner finds themselves locked out of their own governance controls. Monitoring organizations:InviteAccountToOrganization and organizations:AcceptHandshake, and implementing SCPs that prevent accounts from leaving their legitimate organization are important preventive measures. For more information, see Modify Cloud Resource Hierarchy: Invite Accounts to Unknown Organization.

What’s updated

We’ve refreshed three existing entries. S3 Object Collection now captures additional API calls used for bulk data staging from Amazon Simple Storage Service (Amazon S3), with refined detection guidance and mitigations that use recent Amazon S3 security features. Compute Hijacking – ECS adds methods threat actors use to deploy unauthorized tasks in Amazon Elastic Container Service (Amazon ECS), including abuse of overly permissive task execution roles. Role Assumption and Federated Access has been expanded to cover new cross-account role assumption variations and identity provider manipulation, with sharper guidance for distinguishing legitimate federated access from unauthorized use.

The current trend

This June update reflects a clear trend: threat actors are increasingly targeting container orchestration platforms and using organizational trust relationships to their advantage. The container techniques show that as organizations adopt Kubernetes at scale, the attack surface grows with it. The organization-level techniques show that threat actors understand organizational trust relationships.

The common thread is that every one of these techniques operates within the boundaries of legitimate functionality. Modifying a workload, assuming cross-account trust, and joining an organization are all expected actions in healthy environments.. Detection, then, depends entirely on context: the principal, the timing, and the sequence of events that follows.

The Threat Technique Catalog for AWS is designed to help with this. We encourage teams to review the relevant entries and assess whether their current monitoring would catch these patterns:

  • Unexpected modifications to EKS workload specifications
  • Pod deployments that use unsigned container images
  • sts:AssumeRoot calls into member accounts
  • Unbounded compute consumption in your EKS clusters that could be prevented by resource quotas
  • Unexpected organization invitations to your accounts

Each of the threats leaves traces in AWS CloudTrail and Kubernetes audit logs, and the TTC provides specific guidance on what to watch for and how to respond.

Looking ahead

The Threat Technique Catalog for AWS exists because we believe the patterns we observe during security engagements shouldn’t stay behind closed doors. When we see techniques repeating across customers, the most effective thing we can do is document them and make that knowledge available so you can act on it before you’re in the middle of an incident.

This June update adds five new entries and updates three existing ones, and the catalog will continue to evolve. Our team updates it based on what we’re seeing in the real world when helping customers respond to security events. We encourage security teams to review the catalog, incorporate its techniques into threat modeling exercises, and use it as a shared vocabulary for discussing cloud-specific threats.

Explore the full catalog: Threat Technique Catalog for AWS – Full Matrix

Additional resources

If you have feedback about this post, submit comments in the Comments section below.


Shannon Brazil

Shannon Brazil is a Sr. security engineer, managing a team on the AWS Customer Incident Response Team (CIRT), specializing in digital forensics and cloud security investigations. Known in the community as 4n6lady, she is passionate about security education and mentoring the next generation of defenders.

Cydney Stude

Cydney Stude

Cydney is a security engineer specializing in threat intelligence and incident response at AWS. Cydney works on the ground in incident response and is passionate about turning observables into security outcomes. Cydney is an author and maintainer of the Threat Technique Catalog for AWS.

Javier Teitelbaum

Javier Teitelbaum

Javier is security engineer on the AWS Customer Incident Response Team (CIRT), with a focus in building and threat intelligence.

  •  

Restrict AWS Management Console access to expected networks with sign-in resource-based policies and RCPs

Amazon Web Services (AWS) recently announced support for resource-based policies and resource control policies (RCPs) for AWS Sign-In. By using resource-based policies and RCPs, you can restrict access to the AWS Management Console sign-in and aws login CLI sessions to requests from your expected networks, your on-premises data center networks, and your Amazon Virtual Private Cloud (Amazon VPC) VPCs.

Sign-in resource-based policies and RCPs support several security objectives: restricting console sign-in to corporate networks, limiting which principals can sign-in to the console, and applying consistent network perimeter controls across an entire AWS Organizations organization.

In this post, we walk through a common use case: a financial services company restricting console access to its corporate network for regulatory compliance. We show you how to implement this using a sign-in resource-based policy for a single account, verify the controls with AWS CloudTrail, and explain how these policies integrate with AWS Management Console Private Access and the broader AWS data perimeter framework.

Restricting console sign-in access to a corporate network

Consider a financial services company that requires access to AWS Management Console sign-in to originate from the corporate network. The company has the following requirements:

  • Users sign in to the console only from the corporate VPN, office network, or customer VPC.
  • Sign-in attempts from personal networks, public Wi-Fi, or other unexpected locations must be denied.
  • A designated principal should retain access from any network to prevent lockout.
  • All sign-in attempts (allowed and denied) must be logged to CloudTrail for compliance evidence.

In the steps that follow, we show you how to create a resource-based policy to enforce these requirements on a single account.

Prerequisites

  • AWS Command Line Interface (AWS CLI) installed and configured with the latest version.
  • Permission to manage Sign-in resource policies. Attach the AWS managed policy AWSSignInResourcePolicyManagement or grant permissions to the following actions to respective principals:
    • Manage resource permission statements: signin:PutResourcePermissionStatement, signin:DeleteResourcePermissionStatement, signin:ListResourcePermissionStatements, signin:GetResourcePolicy.
    • Manage console authorization: signin:PutConsoleAuthorizationConfiguration, signin:GetConsoleAuthorizationConfiguration, signin:DeleteConsoleAuthorizationConfiguration
  • Identified corporate network: IP CIDR range or VPC ID.
  • Designated principal Amazon Resource Name (ARN) to exclude, so it retains access if network conditions change.

Note: For the complete list of AWS Sign-In actions see Actions, resources, and condition keys for AWS Sign-In in the Service Authorization Reference.

Step 1: Create resource permission statements

Most resource-based policies require the author to input the full policy document (JSON statements). A Sign-in resource permission statement is different: you provide parameters, and AWS Sign-In generates the policy for you.

The following command provides your corporate IP range, your VPC, and an excluded principal as parameters. AWS Sign-In uses these parameters to generate a policy that restricts console sign-in to those networks, while letting the excluded principal sign in from any network. You control the parameter values, not the policy structure. You can review the generated policy at any time with the get-resource-policy command.

Note: Creating resource permission statements has no effect until console authorization is enabled in Step 2, so you can review the complete policy before it takes effect. Write operations must target us-east-1.

To create resource permission statements

1. Open your terminal and ensure you have the latest AWS CLI installed.
2. Run the following command, replacing the placeholder values <my-vpc>, <my-vpc-region>, <my-corporate-cidr>, and <excluded-IAM-principal-arn> with your specific configuration:

aws signin put-resource-permission-statement \
  --source-vpc <my-vpc> \
  --requested-region <my-vpc-region> \
  --source-ip <my-corporate-cidr> \
  --excluded-principal <excluded-IAM-principal-arn> \
  --region us-east-1

3. Verify the command succeeded by checking for a statementId in the output.

Example output:
{
“statementId":"b2HfHli9qCF1P4eGNll13CrZtusXlcPxxVBqz2aYLjlAcWtWQHP6Hg0"
}

4. Review the complete resource-based policy by running get-resource-policy command.

aws signin get-resource-policy

Example output:

{
  "signinResourceBasedPolicy": {
    "Version": "2012-10-17",
    "Statement": [
      {
        "Effect": "DENY",
        "Principal": {"AWS": "*"},
        "Action": ["signin:Authenticate"],
        "Resource": "*",
        "Condition": {
          "ArnNotEquals": {"signin:PrincipalArn": ["<excluded-IAM-principal-arn>"]},
          "NotIpAddress": {"aws:SourceIp": ["<my-corporate-cidr>"]},
          "StringEquals": {"aws:ResourceAccount": ["<account-id>"]},
          "StringNotEquals": {"aws:SourceVpc": ["<my-vpc>"]}
        }
      },
      {
        "Effect": "DENY",
        "Principal": {"AWS": "*"},
        "Action": ["signin:CreateOAuth2Token", "signin:AuthorizeOAuth2Access"],
        "Resource": "*",
        "Condition": {
          "ArnNotEquals": {"aws:PrincipalArn": ["<excluded-IAM-principal-arn>"]},
          "NotIpAddress": {"aws:SourceIp": ["<my-corporate-cidr>"]},
          "StringEquals": {"aws:ResourceAccount": ["<account-id>"]},
          "StringNotEquals": {"aws:SourceVpc": ["<my-vpc>"]}
        }
      },
      {
        "Effect": "DENY",
        "Principal": {"AWS": "*"},
        "Action": ["signin:Authenticate"],
        "Resource": "*",
        "Condition": {
          "ArnNotEquals": {"signin:PrincipalArn": ["<excluded-IAM-principal-arn>"]},
          "StringEquals": {"aws:SourceVpc": ["<my-vpc>"]},
          "StringNotEquals": {"aws:RequestedRegion": ["<my-vpc-region>"]}
        }
      },
      {
        "Effect": "DENY",
        "Principal": {"AWS": "*"},
        "Action": ["signin:CreateOAuth2Token", "signin:AuthorizeOAuth2Access"],
        "Resource": "*",
        "Condition": {
          "ArnNotEquals": {"aws:PrincipalArn": ["<excluded-IAM-principal-arn>"]},
          "StringEquals": {"aws:SourceVpc": ["<my-vpc>"]},
          "StringNotEquals": {"aws:RequestedRegion": ["<my-vpc-region>"]}
        }
      }
    ]
  }
}

The generated policy contains four statements, grouped into two pairs. The first pair restricts access by network source—it denies any principal making a request from outside your corporate IP range (<my-corporate-cidr>) or your VPC (<my-vpc>). The second pair restricts which AWS Region your VPC can target—it denies requests originating from <my-vpc> unless they are directed at <my-vpc-region>. This Region binding is necessary because VPC IDs are only unique within a single Region.

AWS Sign-In evaluates these policies in two phases: before authentication and after authentication. The post-authentication evaluation repeats each time the console session requests new credentials. Within each pair, one statement covers the pre-authentication phase and one covers the post-authentication phase.

The pre-authentication statement evaluates the signin:Authenticate action. Since the principal is not yet authenticated in this phase, the statement uses the signin:PrincipalArn condition key to exempt your excluded principal. This key supports all principal types: root user, AWS Identity and Access Management (IAM) user, federated user, and role.

The post-authentication statement evaluates the signin:AuthorizeOAuth2Access and signin:CreateOAuth2Token actions. AWS Sign-In evaluates these actions after authentication, when it issues the tokens that establish the console session. These actions do not support the signin:PrincipalArn key. Instead, they use aws:PrincipalArn, which resolves to the authenticated principal.

The aws:ResourceAccount value is the recipient account ID. AWS Sign-In pulls it automatically from your caller credentials, so you do not set it yourself. For the full list of supported actions and condition keys, including which keys apply at each phase and to each principal type, see Controlling console access with resource-based policies and resource control policies and AWS Sign-In condition keys reference.

Step 2: Turn on sign-in policy enforcement for your account

This step turns on enforcement of the policy you created in Step 1. Until you run this step, the resource permission statements you created in Step 1 have no effect.

5. Turn on enforcement of sign-in policies using the following command:

aws signin put-console-authorization-configuration \
  --target-id <account-id> \
  --region us-east-1

6. Verify the command succeeded by checking for a “consoleAuthorizationEnabled": true in the output.

Example output:

{
“Output": {
“consoleAuthorizationEnabled": true,
“scope": “ACCOUNT”,
“targetId": "<account-id>"
}
}

7. You can also verify the configuration by executing the get-console-authorization-configuration command as shown below:

aws signin get-console-authorization-configuration \
  --target-id <account-id> \
  --region us-east-1

8. To disable enforcement or remove individual statements, use delete-console-authorization-configuration or delete-resource-permission-statement. For more details, see Controlling console access with resource-based policies and resource control policies in the AWS Sign-In User Guide.

Verifying the implementation

Now that enforcement is active, sign-in attempts are evaluated against your resource-based policy. Verify the behavior by testing sign-in from different network conditions.

Scenario 1: Allowed sign-in from the corporate network

A principal signing in from the allowed corporate IP range or VPC succeeds normally. The CloudTrail event shows ConsoleLogin:Success

Example CloudTrail event details for successful console sign-in:

{
    "userIdentity": {
        "type": "AssumedRole",
        "principalId": "AROAEXAMPLEID:Dev1",
        "arn": "arn:aws:sts::123456789123:assumed-role/Developer/Dev1",
        "accountId": "123456789123"
    },
    "eventTime": "2026-06-09T19:20:38Z",
    "eventSource": "signin.amazonaws.com",
    "eventName": "ConsoleLogin",
    "awsRegion": "us-east-1",
    "sourceIPAddress": "192.0.2.100",
    "responseElements": {
        "ConsoleLogin": "Success"
    },
    "eventID": "dd004e78-6447-4f56-8d2d-a795da66f598",
    "readOnly": false,
    "eventType": "AwsConsoleSignIn",
    "managementEvent": true,
    "recipientAccountId": "123456789123",
    "eventCategory": "Management"
}

Scenario 2: Denied sign-in from an unexpected network

A principal signing in from a network other than the allowed IP address range or a VPC endpoint attached to the source VPC, is blocked. The CloudTrail event shows ConsoleLogin: Failure with an error message identifying the policy that caused the denial:

Example CloudTrail event details for failed console sign-in:

{    
"userIdentity": {
    "type": "IAMUser",
    "accountId": "123456789123",
    "accessKeyId": "",
    "userName": "Dev1"
    },
    "eventTime": "2026-06-09T19:20:38Z",
    "eventSource": "signin.amazonaws.com",
    "eventName": "ConsoleLogin",
    "awsRegion": "us-east-1",
    "sourceIPAddress": "198.51.100.76",
    "userAgent": "Mozilla/5.0 (Macintosh; Intel Mac OS X 10_15_7) AppleWebKit/537.36 (KHTML, like Gecko) Chrome/148.0.0.0 Safari/537.36",
    "errorCode": "AccessDenied",
    "errorMessage": "Authorization denied because of a resource-based policy",
    "requestParameters": null,
    "responseElements": {
        "ConsoleLogin": "Failure"
    },
"eventID": "d88a7543-ae89-4186-b1b6-d3116413f2ee",
"readOnly": false,
"eventType": "AwsConsoleSignIn",
"managementEvent": true,
"recipientAccountId": "123456789123",
"eventCategory": "Management"
}

The error message field shows the policy type that caused the denial: “Authorization denied because of a resource-based policy”.

Scaling with RCPs

The steps above apply a Sign-in resource-based policy to a single account. For organizations managing many accounts, RCPs offer a better path: they can be attached at the organization, OU, or account level in AWS Organizations and apply automatically to every account in scope. To view an RCP example, see here .

When a sign-in to the console is denied because of an RCP, the error message field shows the denial as “Authorization denied because of a resource control policy”.

Extending with Console Private Access and data perimeters

The sign-in resource-based policy you created controls which networks can reach your account’s sign-in flow. AWS Management Console Private Access adds a complementary control: from within your network, it limits console access to a known set of AWS accounts, preventing sign-in to unexpected AWS accounts.

Together, these capabilities contribute to a data perimeter for console access:

  • Network perimeter: Sign-in resource-based policies and RCPs restrict console sign-in to expected networks (corporate IP ranges, VPCs).
  • Identity perimeter: Sign-in resource-based policy and RCP ensure only trusted identities can sign in to the console. Console VPC endpoint policy and Sign-in VPC endpoint policy ensure only trusted identities can use the console from your VPC.
  • Resource perimeter: Sign-in VPC endpoint policy and Console VPC endpoint policy restrict which AWS accounts are reachable from your network.

The controls in this post focus on console access. To extend these perimeters to other AWS services and broader implementation scenarios, see the Data perimeter policy examples repository and the Data Perimeters Blog Post Series.

Conclusion

By using sign-in resource-based policies and RCPs, you can restrict AWS Management Console access to expected networks. These controls are available at no additional cost in all AWS commercial Regions.

To get started, see the AWS Sign-in User Guide. For organization-wide enforcement, see Resource control policies in the AWS Organizations User Guide.

If you have feedback about this post, submit comments in the Comments section below.


Swara Gandhi

Swara Gandhi is a Senior Solutions Architect on the AWS Identity Solutions team. She works on building secure and scalable end-to-end identity solutions. She is passionate about everything identity, security, and cloud.

Rishi Tripathy

Rishi Tripathy

Rishi is a Principal Product Manager on the AWS Identity and Access Management (IAM) team. He focuses on access control mechanisms that help enterprises secure their AWS environments at scale. He is passionate about building security primitives that are straightforward to adopt and hard to misconfigure.

  •  

Accelerate security investigations with Kiro CLI

When a security event occurs in your Amazon Web Services (AWS) environment, rapid response is critical. However security teams often struggle with time-consuming, manual processes that slow down investigations. Analysts must recall complex AWS Command Line Interface (AWS CLI) syntax for multiple services, manually correlate findings across Amazon GuardDuty, AWS CloudTrail, and other security tools, and document every investigation step for compliance requirements. They make critical decisions under pressure while active threats continue. For analysts without deep AWS expertise, these challenges are even more pronounced, creating bottlenecks in your security operations.

Kiro is an AI-powered coding assistant that helps users write, understand, and optimize code through integrated development environment (IDE) and command line integrations. Beyond traditional development tasks, it offers AWS-specific expertise including architecture guidance, best practices, cost optimization recommendations, and service documentation navigation. Kiro CLI puts Kiro’s full capabilities in your terminal, making it a natural fit for security operations workflows. For example, with built-in tools, Kiro CLI can be used to help with investigation of a GuardDuty finding—it will propose the appropriate AWS CLI commands, explain what each command does, and wait for your approval before executing. This approach lets you focus on analyzing threats rather than figuring out how to investigate them.

This blog post demonstrates how to use Kiro CLI to conduct a security investigation following the AWS Security Incident Response Guide framework. This framework organizes incident response into five phases:

  1. Preparation: Having the right tools and processes in place before an incident occurs
  2. Detection and analysis: Identifying security events and understanding their scope
  3. Containment: Limiting the impact of an incident and preventing further damage
  4. Eradication and recovery: Removing threats and restoring normal operations
  5. Post-incident activity: Learning from incidents to improve future response

You’ll see how you can use Kiro CLI to triage GuardDuty findings, assess impacted Amazon Elastic Compute Cloud (Amazon EC2) resources, analyze AWS CloudTrail logs, and generate remediation scripts. By the end of this post, you’ll learn how to use Kiro CLI to run security investigations in minutes rather than hours — without skipping steps.

Prerequisites

Before getting started, confirm you have the following:

  • Install Kiro CLI (available for macOS, Linux and Windows)
  • Kiro access, either:
    • Create a free AWS Builder ID account
    • Use your organization’s Kiro Pro subscription
  • AWS CLI: Configure using one of the methods in Configuring settings for the AWS CLI. Kiro CLI uses the default AWS CLI profile (or the profile specified by the AWS_PROFILE environment variable) to interact with AWS resources and will request your approval before executing any actions.

Solution overview

To show Kiro CLI in action, we investigate a GuardDuty finding end to end — following the AWS Security Incident Response Guide framework through the following steps.

  1. Discovery: Retrieve and analyze a high-severity GuardDuty finding
  2. Resource analysis: Examine EC2 instance configuration, security groups, and AWS Identity and Access Management (IAM) permissions
  3. Containment: Isolate the compromised instance and revoke excessive permissions
  4. Evidence preservation: Create forensic snapshots using Amazon Elastic Block Store (Amazon EBS) snapshots
  5. Scope assessment: Analyze CloudTrail logs to determine event scope
  6. Proactive defense: Establish automated alerting using Amazon Simple Notification Service (Amazon SNS) and Amazon EventBridge
  7. Knowledge capture: Create reusable investigation workflows through steering files

Throughout this investigation, Kiro CLI will propose commands, explain their purpose, wait for approval, and automatically document findings—transforming an inefficient manual process into a guided, efficient workflow.

Kiro CLI combines AI reasoning with deep AWS knowledge to analyze security findings, correlate evidence across services, and propose appropriate AWS CLI commands at each step of an investigation. While this AI-powered approach accelerates investigations, it’s important to validate outputs and recommendations before taking action. The specific commands and analysis shown in this walkthrough are examples—your results will vary based on your specific findings and environment configuration.

The investigation: From alert to resolution

In this section, we walk you through the phases of an investigation, from discovery through analysis.

Discovery: A high-severity GuardDuty finding

Our investigation began with a GuardDuty finding requiring immediate attention. Rather than manually constructing AWS CLI commands, we used Kiro CLI’s natural language interface:

I need to investigate GuardDuty finding 58cddb4e8705cde3f595ef5805f50491 in us-east-1. Please help me understand this finding by checking the finding details, resource details, and threat details. For each investigation step, propose the AWS CLI command, explain what information we'll get, and wait for my confirmation before showing the next command. Document everything in a findings.md file in the current directory, including finding summary, investigation steps, evidence collected, and remediation guidance. Structure it for both technical and executive audiences.

This single prompt establishes the entire investigation framework, as shown in Figure 1. By requesting step-by-step approval, we maintain control while benefiting from AI guidance. The documentation requirement helps ensure that we’re building an audit trail in real-time for compliance requirements.
Figure 1: Kiro CLI interface showing the initial investigation prompt and proposed first command to retrieve GuardDuty detector ID and finding details

Figure 1: Kiro CLI interface showing the initial investigation prompt and proposed first command to retrieve GuardDuty detector ID and finding details

Kiro CLI proposed retrieving the detector ID and complete finding details. After approval, it executed the commands and revealed critical information, as shown in Figure 2.Key findings:

  • Type: CryptoCurrency:EC2/BitcoinTool.B!DNS
  • Severity: HIGH (8.0)
  • Instance: i-05447e6dacd0a7e7e (m5.xlarge)
  • Threat: 617 DNS queries to pool.minergate.com
  • Timeline: Started 9 minutes after instance launch

We can see that it took 9 minutes from instance launch to mining activity, which suggests automated event rather than manual action. This timeline information, automatically extracted and highlighted by Kiro CLI, helps security teams understand event patterns.
Figure 2: GuardDuty finding details showing HIGH severity cryptocurrency mining detection with threat indicators and timeline

Figure 2: GuardDuty finding details showing HIGH severity cryptocurrency mining detection with threat indicators and timeline

Resource and scope analysis

Kiro CLI proposed investigating the EC2 instance configuration, security groups, IAM permissions, and checking for additional findings. This proactive suggestion demonstrates Kiro CLI’s understanding of security investigation workflows, it knows that understanding the potential impact requires examining not just what the unauthorized user did, but what might possibly be a next step in a typical threat scenario.

The following information is also shown in Figure 3.

Instance configuration: Kiro CLI retrieved the instance details, revealing:

  • Amazon Linux 2023 AMI
  • Instance Metadata Service version 2 (IMDSv2) required (good security posture)
  • Public IP address with unrestricted outbound access
  • IAM instance profile attached

Security group assessment: Kiro CLI analyzed the security group rules and identified:

  • No inbound rules
  • Unrestricted outbound access to 0.0.0.0/0, enabling mining traffic

IAM permission analysis: Kiro CLI examined the instance profile and attached role policies, uncovering a critical security risk:

  • Critical finding: AdministratorAccess policy attached to the EC2 instance profile
  • Full AWS account access from compromised instance
  • Potential for complete account takeover

While the observed activity is cryptocurrency mining, the attached AdministratorAccess policy means the unauthorized user could have exfiltrated data, created backdoors, or compromised other resources. This highlights why least-privilege IAM policies are critical. Even if an instance is compromised, limited permissions help reduce the potential impact.
Figure 3: Kiro CLI’s instance configuration summary highlighting the AdministratorAccess policy, unrestricted outbound access, and multiple concurrent security findings

Figure 3: Kiro CLI’s instance configuration summary highlighting the AdministratorAccess policy, unrestricted outbound access, and multiple concurrent security findings

Scope assessment: Kiro CLI checked for additional unexpected activity and discovered seven security findings on this single instance, indicating a multi-vector attack, as shown in Figure 4.
Figure 4: Kiro CLI’s summary highlighting a multi-vector attack.

Figure 4: Kiro CLI’s summary highlighting a multi-vector attack.

Containment actions

Kiro CLI proposed a systematic remediation plan aligned with the knowledge obtained by following AWS Security Incident Response Guide’s containment strategy, as shown in Figure 5.
Figure 5: Kiro CLI’s summary of the investigation and recommendations for immediate actions.

Figure 5: Kiro CLI’s summary of the investigation and recommendations for immediate actions.

Instance isolation: Kiro CLI produced commands to create an isolation security group with no inbound or outbound rules (as shown in Figure 6), then applied it to the compromised instance. This containment step stops new connections without destroying evidence. However, it’s important to understand that security groups are stateful and use connection tracking. When you change security group rules, existing connections aren’t immediately interrupted and continue to allow packets until they time out.

This means that if an unauthorized user has an active connection to the instance, that connection might persist temporarily even after applying the isolation security group. For immediate interruption of all traffic including active connections, consider also implementing network access control lists (NACLs), which are stateless and don’t track connection state. Unlike security groups, NACLs can immediately break existing connections when rules are applied. While NACLs operate at the subnet level (broader scope than instance-level security groups), they provide an additional layer of defense that helps ensure network isolation.

This scenario illustrates an important principle: while AI-powered tools such as Kiro CLI can help you respond more quickly by generating appropriate commands, it’s critical to keep a human in the loop who understands these nuances. Kiro CLI might not have complete information about edge cases, so security professionals should validate recommendations and consider additional controls based on their expertise and the specific threat scenario.
Figure 6: Instance successfully isolated with confirmation showing no inbound or outbound rules, blocking all network traffic including command-and-control (C&C) communications and mining activity

Figure 6: Instance successfully isolated with confirmation showing no inbound or outbound rules, blocking all network traffic including command-and-control (C&C) communications and mining activity

Privilege revocation: Kiro CLI generated commands to attach a deny-all policy to the compromised IAM role (as shown in Figure 7). The AI assistant explained that even though the AdministratorAccess policy remains attached, the deny-all policy takes precedence because of the evaluation logic used by IAM, where explicit denies always override any allows. This immediately revoked all permissions while preserving the original configuration for forensic analysis.
Figure 7: IAM credentials revocation confirmation with current status checklist showing network isolated, IAM credentials revoked, and forensic snapshot pending

Figure 7: IAM credentials revocation confirmation with current status checklist showing network isolated, IAM credentials revoked, and forensic snapshot pending

Evidence preservation

Before making mutating changes, Kiro CLI recommended creating a forensic snapshot of the compromised instance’s Amazon EBS volume (as shown in figure 8). This step can be missed when teams are under pressure to contain an active threat, but it’s critical for post-incident analysis and potential legal proceedings.

Memory preservation decision: We chose to leave the instance running in its isolated state rather than stopping it immediately. Stopping an EC2 instance results in loss of volatile memory containing forensic evidence such as running processes, network connections, loaded malware, and encryption keys. By maintaining the instance in an isolated security group with all network access blocked, we neutralized the threat while preserving the ability to conduct deeper forensic investigation if needed.

Volatile memory often contains evidence that explains how an event occurred, malware binaries, decryption keys, or command-and-control (C&C) communications that disappear when an instance stops. This decision point illustrates the balance between immediate threat elimination and thorough investigation.

Capturing volatile memory requires specialized tools and techniques. For Linux instances, LiME (Linux Memory Extractor) can capture physical memory, while Windows instances can use tools like Winpmem. After being captured, memory dumps can be analyzed using Volatility, an open source memory forensics framework. Forensics tools should be pre-installed on your systems to avoid changes being made during the evidence gathering process. AWS provides guidance on automating forensic kernel module builds for Amazon Linux EC2 instances to streamline this process.
Figure 8: Forensic snapshot creation confirmation with proper tagging including purpose, incident ID, and severity for evidence preservation

Figure 8: Forensic snapshot creation confirmation with proper tagging including purpose, incident ID, and severity for evidence preservation

CloudTrail analysis

To understand the full scope of compromise, we asked Kiro CLI to analyze CloudTrail logs. The AI assistant identified available CloudTrail trails and proposed queries to find any API calls made from the compromised instance using its temporary credentials (as shown in Figure 9).

CloudTrail analysis is often the most time-consuming part of incident investigation, requiring analysts to construct complex queries and correlate events across time. Kiro CLI automates this process, immediately identifying the relevant log sources and proposing appropriate queries.
Figure 9: Kiro CLI identifying available CloudTrail trails and proposing targeted queries

Figure 9: Kiro CLI identifying available CloudTrail trails and proposing targeted queries

Kiro CLI found no unexpected API calls originating from the instance credentials—no IAM users created, no S3 buckets accessed, and no secrets stolen. The event appeared limited to cryptocurrency mining activity conducted through DNS queries, with no evidence of data exfiltration or lateral movement.

Figure 10: Investigation results from Kiro CLI

Figure 10: Investigation results from Kiro CLI

This shows the value of thorough CloudTrail analysis: even when initial findings suggest a contained threat, confirming the absence of broader compromise is essential before closing an investigation.

Building proactive defenses

The AWS Security Incident Response Guide emphasizes that preparation is the foundation of effective incident response. With the immediate threat contained, we used Kiro CLI to strengthen our preparation phase by establishing automated alerting for future incidents.

As shown in Figure 11, we used natural language to request

Set up a notification system that sends an email to [email] for any high severity or higher severity findings.

Kiro CLI understood the requirement and proposed a multi-step solution involving Amazon SNS and EventBridge:

  1. Create an SNS topic for GuardDuty alerts
  2. Subscribe an email address to the topic
  3. Create an EventBridge rule to trigger on high-severity findings (severity greater than or equal to 7.0)
  4. Configure the SNS topic as the EventBridge target
  5. Grant EventBridge permissions to publish to the SNS topic

Building automated alerting requires understanding multiple AWS services, their interactions, and correct configuration syntax. Kiro CLI translates a straightforward natural language request into a complete, production-ready solution.

Auto-correction and testing: When setting up complex integrations, commands can fail because of permission issues, incorrect Amazon Resource Name (ARN) references, or malformed JSON policies. Kiro CLI automatically detects these failures and proposes corrected commands.
Figure 11: Notification system setup completion showing SNS topic created, EventBridge rule configured, and confirmation that notifications will trigger on HIGH and CRITICAL severity findings

Figure 11: Notification system setup completion showing SNS topic created, EventBridge rule configured, and confirmation that notifications will trigger on HIGH and CRITICAL severity findings

You can also prompt Kiro CLI to test the setup: Test this notification system to verify it’s working correctly. Kiro CLI will verify that the SNS subscription is confirmed, check that the EventBridge rule is properly configured, validate IAM permissions, identify any misconfigurations, and publish a test event to verify end-to-end functionality. This intelligent error handling means security teams can confidently deploy automation without manual troubleshooting.

Creating reusable investigation workflows

With the immediate threat contained and proactive defenses in place, we then used Kiro CLI to create a reusable steering file that codifies this investigation workflow for future incidents. Steering files are Markdown files stored in .kiro/steering/ that act as persistent memory for Kiro CLI, helping security teams capture institutional knowledge and standardize response procedures. To share them across your team, add them to a Git repository or publish them to your documentation system like Confluence — the same places you’d keep any other runbook.

We recommend running the full investigation and generating the steering file in the same Kiro CLI session. This way, the steering file captures the exact steps, commands, and decisions from your investigation. Navigate the process the way that fits your organization — the steering file will reflect your workflow, not a generic template.

We asked Kiro CLI:

Create a steering file that captures this GuardDuty investigation workflow so future analysts can follow the same systematic approach.

Kiro CLI generated a detailed steering file at .kiro/steering/guardduty-incident-response.md that includes:

  • Investigation phases aligned with the AWS Security Incident Response Guide
  • AWS CLI command patterns for GuardDuty, Amazon EC2, IAM, and CloudTrail
  • Documentation requirements and approval gates
  • Containment, eradication, and evidence preservation procedures

This is the example steering file that was created by Kiro cli:

--- 
inclusion: manual 
--- 
 
# GuardDuty Incident Response Workflow 
 
This steering file guides systematic investigation of GuardDuty findings following AWS Security Incident Response Guide best practices. 
 
## Investigation Phases 
 
### Detection and Analysis 
1. Retrieve GuardDuty finding details using finding ID 
2. Extract finding type, severity, affected resources, and threat indicators 
3. Document timeline of events (instance launch, threat detection) 
 
### Resource Analysis 
4. Investigate EC2 instance configuration (AMI, IMDS version, network access) 
5. Analyze security group rules (inbound/outbound access) 
6. Review IAM permissions attached to instance profile 
7. Check for additional findings on the same resource 
 
### Containment 
8. Create isolation security group with no inbound/outbound rules 
9. Apply isolation security group to compromised instance 
10. Create forensic snapshot before making destructive changes 
11. Preserve volatile memory by keeping instance running if forensic analysis needed 
 
### Eradication 
12. Revoke excessive IAM permissions 
13. Document all actions in findings.md with technical and executive summaries 
 
### Analysis 
14. Query CloudTrail for API calls from compromised instance credentials 
15. Assess scope of compromise and potential lateral movement 
 
## Documentation Requirements 
- Finding summary with severity and type 
- Investigation steps with timestamps 
- Evidence collected (security groups, IAM policies, CloudTrail logs) 
- Remediation actions taken 
- Recommendations for prevention 
 
## AWS CLI Command Patterns 
- GuardDuty: `aws guardduty get-findings` 
- EC2: `aws ec2 describe-instances`, `aws ec2 describe-security-groups` 
- IAM: `aws iam get-instance-profile`, `aws iam list-attached-role-policies` 
- CloudTrail: `aws cloudtrail lookup-events` 
 
## Approval Gates 
Always propose commands with explanations before execution and wait for approval. 

Traditional incident response playbooks are static documents that quickly become outdated. Kiro CLI steering files are executable playbooks that guide AI-assisted investigations with consistency while remaining flexible enough to adapt to specific scenarios. Steering files stay current because updating them is part of the workflow, not a separate task. When you adjust your investigation process, ask Kiro CLI to update the steering file at the end of the session. It captures your changes, and you share the updated version with the team through Git or Confluence — everyone works from the latest version.

Conclusion

Security incidents require accurate and rapid response, but traditional investigation workflows create bottlenecks that extend mean time to respond (MTTR). By following the framework provided by the AWS Security Incident Response Guide and using Kiro CLI’s AI-powered capabilities, you can transform incident response from reactive to proactive, well-documented operations.

In this post, we demonstrated how Kiro CLI accelerates each phase of the incident response lifecycle—from initial detection and analysis through containment, eradication, and recovery. You learned how to use natural language prompts to investigate GuardDuty findings, analyze compromised resources, implement containment measures, preserve forensic evidence, and establish automated alerting for future incidents. The steering file capability helps your team embed hard-won expertise in reusable workflows that benefit analysts at all skill levels.

Whether you’re investigating alerts, building defenses, or documenting procedures, Kiro CLI provides the expertise and automation to respond faster, learn continuously, build better defenses, and document thoroughly. When commands fail or configurations are wrong, Kiro CLI identifies the issue and corrects it, reducing time spent troubleshooting.

If you have feedback about this post, submit comments in the Comments section below.


Sibasankar Behera

Sibasankar Behera

Sibasankar is a Senior Solutions Architect at AWS in the Automotive and Manufacturing team. He is passionate about AI, data and security. In his free time, he loves spending time with his family and reading non-fiction books.

Author

Marshall Jones

Marshall is a Worldwide Security Specialist Solutions Architect at AWS. His background is in AWS consulting and security architecture and focused on a variety of security domains including edge, threat detection, and compliance. Today, he’s focused on helping enterprise AWS customers adopt and operationalize AWS security services to increase security effectiveness and reduce risk.

  •  

Threat tactic spotlight: Subdomain takeover

In this blog post you’ll learn how to detect and prevent subdomain takeover – a tactic where threat actors exploit dangling DNS records to redirect traffic to attacker-controlled resources. We’ll explain the issue, how the situation arises, and how you can use various AWS features and services to help mitigate the impact of this tactic.

Under the shared responsibility model, securing configurations in the cloud is your responsibility. AWS supports you through strong defaults, guidance in the Security Pillar of the Well-Architected Framework, and security services to help you meet that responsibility. The AWS Customer Incident Response Team (AWS CIRT) also monitors for new and trending tactics that threat actors use to exploit specific customer configurations, so that you can make informed design decisions and improve your response plans.

AWS CIRT has observed threat actors actively scanning for public DNS CNAME records that point to resources that no longer exist, looking for subdomain takeover opportunities.

Note: The subdomain takeover tactic does not leverage vulnerabilities of AWS services. It exploits a dangling DNS record to redirect traffic to an attacker-controlled resource.

Quick DNS Primer

CNAME Records: A CNAME (Canonical Name) record is a DNS entry that points one domain name to another. For example, api.example.com can be configured to point to api.example.s3-website-us-east-1.amazonaws.com. This feature of DNS enables users to configure a memorable, human-friendly domain name while the actual resource lives at a longer, machine-generated AWS hostname. A security issue emerges when the target resource is deleted but the CNAME record pointing to it remains – creating a “dangling” record.

Dangling Records: When a resource (like an S3 bucket) is deleted but the DNS record pointing to it is left behind, that DNS record becomes “dangling”, pointing to a resource that no longer exists. For resources in globally shared namespaces, threat actors can potentially reclaim the name of your deleted resource and serve malicious content through your DNS record.

What is subdomain takeover?

A subdomain is a prefix added to a domain that allows you to organize access to your resources. A subdomain takeover occurs when you delete the underlying resource and a threat actor creates a new resource with the same name to take advantage of the DNS records still pointing to it.

A subdomain takeover is possible when a CNAME record points to an AWS resource that uses a globally shared DNS namespace where the resource name can be chosen by any AWS customer. The following AWS resources meet these criteria:

Amazon S3 (global namespace): Bucket names like mybucket.s3.amazonaws.com are globally unique and can be claimed by any account if the bucket is deleted. Note: S3 buckets created with account regional namespaces (launched March 2026) are scoped to your account and are not subject to this issue.

Amazon CloudFront: Distribution domain names like d111111abcdef8.cloudfront.net are assigned by AWS and cannot be chosen by an attacker. However, if you delete a distribution and another customer creates one that happens to receive the same domain name, a dangling CNAME could resolve to their content.

AWS Elastic Beanstalk: Environment names like myapp.elasticbeanstalk.com are globally unique and can be claimed by any account if the environment is terminated.

Resources like Amazon VPC, Amazon EC2 instances, or private hosted zones are not subject to this tactic because they do not expose globally claimable DNS namespaces.

MITRE ATT&CK classifies this technique under T1584.001: Compromise Infrastructure – Domains.

Analyzing an example scenario

Consider the following scenario:

You create a DNS CNAME record pointing to your S3 website endpoint. The subdomain subdomain.example.com now resolves to subdomain.example.s3-website-us-east-1.amazonaws.com, which serves content from the S3 bucket named subdomain.example. If your team deletes the bucket and forgets to delete the DNS record, users that navigate to the site will see an error stating that the bucket doesn’t exist. However, at this point, if a threat actor sees this error and moves in to claim the bucket name, they will be able to set up their own site that users will see when they navigate to the subdomain.example.com site.

Figure 1 shows an S3 bucket named subdomain.example (a globally unique bucket name) configured to host a static website, with the S3 website endpoint subdomain.example.s3-website-us-east-1.amazonaws.com.

Figure 1: S3 bucket configured as a static website

Figure 1: S3 bucket configured as a static website

As shown in Figure 2, we use Amazon Route 53 to create a CNAME record to resolve to our Amazon domain name; to give users a friendly name and so they do not have to remember the long S3 website name in URLs.

Figure 2: DNS Resolver configured with CNAME record pointing to origin bucket

Figure 2: DNS Resolver configured with CNAME record pointing to origin bucket

The customer’s AWS administrator decides to stop serving content from the S3 bucket and deletes it, as shown in Figure 3.

Figure 3: Resource deleted without removing the CNAME record

Figure 3: Resource deleted without removing the CNAME record

With the S3 bucket deleted and the CNAME record still in place, the DNS record is now dangling. A threat actor identifies this situation and creates a new S3 bucket with the same global name subdomain.example in an AWS account that the threat actor controls, as shown in Figure 4. The threat actor can now serve content from this new bucket, including potentially malicious content. End users remain unaware of this switch and continue to access subdomain.example.com, trusting the content because it appears to originate from a URL they recognize.

Figure 4: Subdomain takeover happens

Figure 4: Subdomain takeover happens

Potential impacts of a sub-domain takeover

Consider these potential impacts:

Reputation risk: There is a potential risk to your organization’s reputation, because you don’t control the content being served from the threat actor’s site that your DNS record points to.

Potential exposure to phishing campaigns: Users within your organization might have the subdomain bookmarked in their browser, not knowing the resource is no longer available, then unsuspectingly navigate to the site that now hosts malware or is used to phish user credentials.

Blocking: If the subdomain is flagged by security vendors for malicious activity, it could impact your business operations.

Financial loss: Subdomain takeover incidents can result in a financial impact due to the potential disruption to service delivery as you deal with the event.

Proactive detection

AWS Config for proactive detection

For proactive detection, you can use AWS Config to continuously monitor your Route 53 CNAME records and verify that the target resources exist in your account.

Prerequisite: This approach requires AWS Config recorder to be enabled for the resource types you want to monitor (S3 buckets, CloudFront distributions, Elastic Beanstalk environments). If Config isn’t recording a resource type, it won’t appear in the inventory check. For more information, see Setting up AWS Config with the console.

Why use AWS Config inventory instead of DNS resolution checks?

A common approach is to check whether a CNAME resolves to a valid endpoint. However, this method has a critical flaw: if an attacker has already claimed the resource, DNS resolution will succeed – to their resource, not yours. You would have no indication that you don’t own what’s responding.

By querying AWS Config’s recorded configuration items, you’re checking whether the resource exists in your account inventory, not just whether something responds at that DNS name. This approach correctly identifies dangling CNAMEs even after a takeover has occurred.

Implementation approach:

Account-level vs. organization-level scope

The reference implementation queries AWS Config inventory within a single account. This means that if a CNAME record in Account A points to a resource that legitimately exists in Account B within the same AWS organization, the rule will flag it as NON_COMPLIANT.

For organizations that share resources across accounts, you can modify the solution to use an AWS Config Aggregator, which queries resource inventory across all accounts in your organization. This is similar to how IAM Access Analyzer supports both account-level and organization-level scopes. To use this approach, you need an organization-level Config Aggregator already configured, and the Lambda function’s IAM role needs the config:SelectAggregateResourceConfig permission.

We recommend starting with account-level scope for simplicity, then expanding to organization-level if your environment includes cross-account resource sharing.

The main idea is to create a custom AWS Config rule that queries your Route 53 hosted zones for CNAME records, then parses each CNAME target to determine whether it points to a known AWS resource pattern such as S3, CloudFront, or Elastic Beanstalk. For each match, the rule cross-references the target against your AWS Config inventory to verify that the resource actually exists in your account. If the resource isn’t found, the rule marks the CNAME record as NON_COMPLIANT, surfacing it for review.

The Config rule should focus on known AWS resource patterns:

  • S3: *.s3.amazonaws.com, *.s3-website-<region>.amazonaws.com
  • CloudFront: *.cloudfront.net
  • Elastic Beanstalk: *.elasticbeanstalk.com

Note: CNAME records pointing to external third-party services are outside the scope of this detection mechanism, as those resources won’t appear in your AWS Config inventory.

NON_COMPLIANT findings from your Config rule can be routed to AWS Security Hub for centralized visibility, or trigger SNS notifications to alert your security team.

Figure 5: Dangling DNS Detection Solution

Figure 5: Dangling DNS Detection Solution

Reference implementation:

We’ve published a complete implementation of this detection approach as an open-source solution. The solution deploys a Lambda function that discovers CNAME records across all your Route 53 hosted zones and uses pattern matching to identify targets pointing to S3, CloudFront, and Elastic Beanstalk. It then queries your AWS Config inventory to verify whether each target resource still exists in your account. When a dangling record is detected, the solution generates a HIGH severity finding in Security Hub and can optionally send SNS notifications to alert your security team. A CloudWatch metrics dashboard is also included for ongoing compliance tracking.

Deployment:

# Clone the repository
git clone https://github.com/aws-samples/sample-dangling-dns-detection
cd sample-dangling-dns-detection

# Build the Lambda deployment package
./scripts/package.sh

# Upload to S3
aws s3 cp dist/dangling-dns-detection.zip s3://YOUR_BUCKET/

# Deploy the CloudFormation stack
aws cloudformation deploy \
  --template-file infrastructure/template.yaml \
  --stack-name dangling-dns-detection \
  --parameter-overrides \
      LambdaCodeS3Bucket=YOUR_BUCKET \
      EvaluationFrequency=TwentyFour_Hours \
  --capabilities CAPABILITY_NAMED_IAM

The stack creates an AWS Config custom rule that runs on your specified schedule (default: every 24 hours), evaluating all CNAME records and reporting compliance status.

Mitigating the effects

Mitigating subdomain takeover requires both preventive procedures and responsive capabilities.

Prevention: Standard operating procedure

The most effective mitigation is a standard operating procedure for resource deprovisioning that ensures DNS records are removed before the underlying resource:

  1. Within your DNS zone, delete the CNAME record that points to the fully qualified domain name (FQDN) of the resource that you plan to deprovision.
  2. Wait for the DNS TTL to expire before deleting the resource. DNS resolvers cache records for the duration of the TTL (for example, a TTL of 3600 means resolvers may serve the old record for up to one hour). If you delete the resource before the TTL expires, a threat actor could claim the resource name while cached CNAME entries are still directing traffic to it.
  3. Deprovision the resource that you no longer want to use.
  4. Run a DNS check of the CNAME record that you removed to verify that the resource is no longer resolving.

Key principle: Always delete DNS first, wait for the TTL to expire, then delete the resource. This order eliminates the window where a dangling record could be exploited.

Prevention: S3 account regional namespaces

As mentioned earlier, AWS introduced account regional namespaces for Amazon S3 general purpose buckets in March 2026. While this is a meaningful step toward mitigating the S3-specific takeover vector, there are important operational limitations to be aware of:

Existing buckets are unaffected. Buckets already created in the global namespace cannot be migrated to an account regional namespace. The bucket names remain globally unique and claimable by anyone if the bucket is deleted.

Global namespace is still the default. When creating a new bucket through the console, CLI, or SDK, the global namespace remains the default selection. Users who aren’t aware of the new option will continue creating globally-scoped buckets.

Existing IaC templates require updates. Existing infrastructure-as-code templates (CloudFormation, CDK, Terraform) that don’t explicitly opt in to the account regional namespace will continue provisioning buckets in the global namespace. For CloudFormation, this means setting the BucketNamespace property to account-regional. For other IaC tools, consult their documentation for the equivalent configuration. Organizations need to audit and update their templates to opt in.

For these reasons, the dangling DNS detection approach described in this post remains critical – particularly for organizations with existing S3 infrastructure, and for CloudFront, and Elastic Beanstalk resources where no equivalent namespace scoping exists.

Response: Notification and remediation

When a dangling DNS record is detected, the reference solution described in the Detection section automatically creates a HIGH severity finding in AWS Security Hub and reports the CNAME record as NON_COMPLIANT in AWS Config. If you provide an SNS topic ARN during deployment, the solution also sends notifications to alert your security or operations team via email, Slack, or other channels. For production environments, consider a human-in-the-loop workflow where these notifications are reviewed by a team member who approves the DNS record deletion before it’s executed. This prevents accidental deletion of legitimate records during transient issues.

The reference solution also includes a CloudWatch dashboard for tracking compliance status and evaluation metrics over time, giving your team ongoing visibility into DNS health across your hosted zones.

Note: Fully automated remediation (auto-deleting DNS records) carries risk – a false positive could disrupt legitimate services. We recommend starting with detection and notification, then evaluating automation based on your detection accuracy and operational maturity.

Conclusion

Subdomain takeover is a preventable misconfiguration that can have significant impact on your organization. A layered defense approach provides the best protection:

Prevention: Implement a standard operating procedure that deletes DNS records before deprovisioning the underlying resource.

Detection: Use AWS Config custom rules to proactively identify CNAME records pointing to resources that no longer exist in your account.

Response: Configure notifications through SNS or Security Hub so your team can respond quickly when dangling records are detected.

Monitoring: Maintain ongoing visibility through CloudWatch dashboards to track DNS health and compliance status.

The key insight is that good DNS hygiene – knowing when your CNAME records point to a nonexistent resource – is your first line of defense. Automated detection through AWS Config provides a safety net when operational procedures fail. And if you detect an issue, having a playbook ready to enact your response can lower the impact and your mean time to recovery.

If you have feedback about this post, submit comments in the Comments section below.


Matt Gurr

Matthew Gurr

Matthew is the Senior Incident Response lead in the Asia-Pacific region for the AWS Customer Incident Response Team (AWS CIRT). He has a passion for helping customers proactively prepare for a security event. In his spare time, he enjoys cycling, music, and reading.

Luis Pastor

Luis Pastor

Luis is a Senior Security Solutions Architect at AWS leading the Infrastructure Security and Compliance Technical Field Communities. He drives security architecture for enterprise customers across financial services, healthcare, and retail, specializing in cloud security transformation and regulatory compliance frameworks. Before AWS, Luis architected security solutions in hybrid cloud environments.

Geoff Sweet

Geoff Sweet

Geoff has been in industry since the late 1990s. He began his career in electrical engineering. Starting in IT during the dot-com boom, he has held a variety of diverse roles, such as systems architect, network architect, and, for the past several years, security architect. Geoff specializes in infrastructure security.

Ariam Michael

Ariam Michael

Ariam is a Solutions Architect at AWS. She has supported various customers in the Worldwide Public Sector, specifically SLG and Federal Civilian customers. She is passionate about security, specifically Data Protection helping customers implement encryption and best practices.

  •  

Operationalizing AWS security: A maturity roadmap

Enabling security tooling is the starting point. Making it operational—where findings drive decisions, response times are measurable, and your security posture improves week over week—is where most organizations struggle.

This blog post provides a phased maturity roadmap for organizations that have already enabled AWS Security Hub and Amazon GuardDuty. These two services form the foundation of a cloud-centered security operations capability on AWS. Security Hub provides centralized security posture management and aggregates findings from multiple AWS security services, while GuardDuty provides intelligent threat detection by continuously monitoring for malicious activity and unauthorized behavior. For any production or enterprise AWS environment, having both services enabled across all accounts and AWS Regions is a baseline expectation; not because they’re optional add-ons, but because effective security operations require both the ability to detect threats and the ability to understand your overall security posture. If you haven’t yet enabled them, the Security Hub documentation and GuardDuty documentation provide setup guidance, including multi-account deployment with AWS Organizations.

Customers consistently tell us that while individual AWS security service documentation is thorough, what’s missing is a consolidated operational playbook—one resource that ties the services together into a working security operations practice with clear phases, progression criteria, and an operational cadence. That’s the gap this post fills. Rather than covering how each feature works (the documentation does that well), this post focuses on when and why to use each capability, and how to build the organizational habits that make them effective.

What follows is a six-phase roadmap for moving from these services are active to these services are driving our security operations. Each phase builds on the previous one, and each is designed to deliver tangible, measurable improvement.

Phase 0: Assess your current state

Goal: Understand what’s working before changing anything.

Estimated timeline: 1–2 weeks

Move to Phase 1 when: You have a documented current-state assessment covering all the following items.

Before introducing new processes or automation, establish a clear picture of the current environment. This assessment informs every decision that follows.

Actions:

  • Findings inventory: Review existing active GuardDuty findings to determine how many there are, the severity distribution, and how old the oldest findings are. A large backlog of untouched HIGH or CRITICAL findings that have been sitting for weeks is a strong signal about where to focus first.
  • Security Hub score baseline: Determine your current compliance score against AWS Foundational Security Best Practices (FSBP) and The CIS AWS Foundations Benchmark. Check to see which standards are enabled; if multiple standards are enabled, review for overlapping standards (creating noise) or unused standards.
  • Multi-account and multi-Region check: Look to see if GuardDuty is enabled in every account and every Region, or only in Regions with active workloads. Threat actors frequently operate in Regions that organizations don’t actively monitor. Also check to see if Security Hub aggregation is configured with a delegated administrator account or if each account is being managed independently.
  • Integration check: Determine if GuardDuty findings are flowing into Security Hub and if Amazon Inspector and Amazon Macie are enabled and feeding findings in. Without integration, Security Hub might be only surfacing its own compliance checks.
  • Notification check: See if there’s an Amazon EventBridge rule configured for notifications and if so, how findings are being routed and to whom. Know if notifications are being sent using an Amazon Simple Notification Service (Amazon SNS) topic or a chat channel integration. Without a clear notification and response workflow, findings can accumulate silently in the console with no one looking at them.

Deliverable: A one-page current state assessment that identifies what’s enabled, what’s flowing where, who’s looking at it, and what’s in the existing backlog.

Phase 1: Reduce the noise

Goal: Make the signal meaningful before asking anyone to act on it.

Estimated timeline: 2–3 weeks

Move to Phase 2 when: Remaining findings represent items requiring real decisions, compliance scores reflect actual posture, and you can articulate why every suppression rule and disabled control exists.

This is the single most important phase. If this step is skipped in favor of jumping straight to automation, the result is automated chaos. Alert fatigue is the primary reason security tooling is ignored, and addressing it first is what makes everything that follows sustainable.

GuardDuty tuning:

  • Create suppression rules for known-benign findings. The goal is to suppress activity you’ve already evaluated and accepted—such as expected traffic from corporate egress IPs (based on trusted IP lists), internal tools that trigger DNS-based findings, or internet-facing resources that naturally receive port scanning. The principle: if you’ve investigated a finding and it’s expected, suppress it so your team can focus on what matters.
  • Triage every active HIGH and CRITICAL finding into three categories: needs immediate investigation (real threat, not yet reviewed), true positive, already addressed (archive using workflow status), or false positive or expected behavior (create a suppression rule). Every finding must be categorized into one of these three states.
  • Review GuardDuty protection plans and enable any that are relevant but not yet active. Organizations that enabled GuardDuty years ago might not have activated protection plans released since then (such as Runtime Monitoring, Malware Protection, RDS Protection, and Lambda Protection). Evaluate each against your workload profile and enable what applies.

Security Hub tuning:

  • Disable controls that aren’t relevant to the environment. This is the highest-value quick win. If a service isn’t in use, disable its controls. If a control is addressed by an alternative solution, disable it. A 47% compliance score where half the failures are irrelevant trains teams to ignore the dashboard entirely. See the Security Hub controls reference for the full list.
  • Choose a primary standard. AWS Foundational Security Best Practices is a strong default. The CIS AWS Foundations Benchmark adds value when there’s a specific compliance mandate. Avoid enabling PCI DSS or NIST 800-53 standards unless there’s a reporting requirement—they add significant volume without proportional signal for most organizations.
  • Configure cross-Region aggregation to the delegated administrator account if not already in place. A single aggregated view eliminates the need to check findings across multiple Regional consoles.
  • Use the workflow status field operationally. Findings should progress from NEW to NOTIFIED to RESOLVED or SUPPRESSED. If everything remains in NEW indefinitely, the system carries no operational meaning.

Deliverable: A tuned environment where remaining findings represent items that require real decisions. Compliance scores should now reflect your organization’s actual security posture rather than noise.

Phase 2: Build the notification and routing layer

Goal: Get the right findings to the right people at the right time.

Estimated timeline: 2–3 weeks

Move to Phase 3 when: CRITICAL and HIGH findings reach the security team within minutes, MEDIUM findings create tracked tickets, and notifications include enriched context. No action is taken until a person or an automation is informed that something needs attention.

Architecture: Security Hub to EventBridge rule to routing logic to destination

Tiered notification strategy:

CRITICAL Page on-call immediately PagerDuty or Opsgenie 15 minutes
HIGH Alert security team channel Slack or Teams channel and ticket creation 4 hours
MEDIUM Create ticket for review Jira or ServiceNow 48 hours
LOW or INFORMATIONAL Batch digest Weekly email summary or dashboard review Next review cycle

Key design decisions:

  • Route from Security Hub, not individual services. Because findings from GuardDuty, Inspector, Macie, and Security Hub compliance checks all aggregate in Security Hub, build your EventBridge rules there for centralized management.
  • Create a fast path for the most dangerous finding types. Certain GuardDuty findings, particularly those involving credential exfiltration, cryptocurrency activity, trojans, and active compromises, warrant a separate, faster routing path that bypasses normal triage. Identify these based on your threat model and the GuardDuty finding types reference.
  • Enrich notifications before delivery. A raw JSON finding in a chat channel provides little actionable context. Use an AWS Lambda function to format notifications with the information responders need: account alias, Region, Amazon Resource Name (ARN), finding type, severity, a console deep link, and a plain-language description. The Security Hub CloudWatch Events integration guide describes the event format.

Deliverable: A working notification pipeline where CRITICAL and HIGH findings reach the security team within minutes, MEDIUM findings create tracked work items, and LOW and INFORMATIONAL findings are batched for periodic review.

Phase 3: Build automated remediation for high-confidence findings

Goal: For findings where the correct response is deterministic, remove the human from the loop.

Estimated timeline: 3–4 weeks

Move to Phase 4 when: At least 3–5 high-confidence finding types have automated responses deployed with audit trails, and the team has established a process for evaluating new auto-remediation candidates.

The guiding principle: Only auto-remediate when all three conditions are met: the finding is high-confidence, the response is deterministic, and the blast radius of the automated action is limited. Automated remediation must not create the risk of a production outage.

Decision framework:

Confidence level High – no false positive risk Medium – context-dependent Low – requires investigation
Response complexity Single, well-defined action Multiple steps or judgment calls Requires forensic analysis
Blast radius Limited to one resource Could affect dependent services Production-wide impact
Rollback difficulty Straightforward to reverse Moderate effort to reverse Difficult or impossible to reverse

Common auto-remediation categories:

  • Instance isolation for confirmed compromise findings (cryptocurrency mining, malware, and trojans): Replace the security group, snapshot volumes for forensics, and notify.
  • Credential revocation for confirmed credential compromise: Attach deny-all policies, revoke sessions, and deactivate access keys as appropriate to the credential type.
  • Compliance drift correction for deterministic misconfigurations: Re-enable Amazon Simple Storage Service (Amazon S3) Block Public Access, revoke overly permissive security group rules, and re-enable AWS CloudTrail logging.
  • Notification-only escalation for findings that require human judgment before action: Amazon Elastic Block Store (Amazon EBS) encryption gaps (require migration) and access key rotation (requires coordination with the key owner).

For implementation, AWS provides Security Hub Automated Response and Remediation (SHARR), a solution that includes pre-built remediation playbooks deployed as AWS Step Functions workflows triggered by EventBridge. This is a strong starting point—evaluate the provided playbooks, enable the ones that fit, and extend with custom remediations as needed.

Note: For findings that recur because the environment lacks preventive guardrails, the best long-term response is often a service control policy (SCP) that prevents the misconfiguration from occurring in the first place. Phase 5 covers this preventive controls layer.

Deliverable: A library of automated and semi-automated remediation runbooks with full audit trails, and a documented decision framework the team uses to evaluate new auto-remediation candidates.

Phase 4: Build the operational rhythm

Goal: Turn security findings management into a sustained organizational practice, not a one-time cleanup.

Estimated timeline: 4–6 weeks to establish, then ongoing

Move to Phase 5 when: The weekly cadence has been running consistently for at least 8 weeks, monthly metrics show positive trends, and the first quarterly review has been completed.

This is where many organizations stall, and it’s the most important phase in the entire roadmap. The technology is working, the notifications are flowing, automated remediations are firing, but there’s no organizational habit built around it. Without this phase, everything you’ve built in Phases 0–3 will gradually decay. Suppression rules will go stale, new team members won’t know the system exists, and findings will start accumulating again. The operational rhythm is what converts a security tooling deployment into a security operations practice.

Weekly security review (30 minutes)

Attendees: Security team lead, cloud platform team representative, rotating engineering lead from an application team

Why the rotating engineering lead matters: Security findings don’t exist in a vacuum; they’re generated by workloads that engineering teams own. Rotating an engineering representative through this meeting accomplishes three things: it builds security awareness across the organization, ensures findings are routed to people with the context to resolve them, and creates organizational accountability beyond the security team.

Agenda template:

5 minutes Compliance score trend – Review Security Hub scores by account and standard. Is the trend improving, declining, or flat? If declining, why? Security lead Identified regression areas
5 minutes Critical and high findings review – Walk through new HIGH and CRITICAL GuardDuty findings from the past week. Are there any that need immediate escalation? Security lead Escalation actions assigned
10 minutes Top five failing controls – Identify the five Security Hub controls with the most failures. Assign an owner and a target date for each. Platform lead Owners and dates documented
5 minutes Automation review – Did any auto-remediations fire this week? Did they work correctly? Were there any false triggers? Security lead Automation adjustments queued
5 minutes Tuning decisions – Are new suppression rules needed based on this week’s findings? Are any new finding types candidates for auto-remediation? All Tuning backlog updated

Running the meeting effectively:

  • Keep a running document (such as a wiki page or shared document) that captures decisions and action items week over week. This becomes your institutional memory.
  • If the compliance score hasn’t moved in over 3 weeks, that’s a signal. Either the assigned work isn’t happening, or the remaining findings are genuinely difficult to address. Both need to be discussed.
  • Track action items from previous weeks. A review that generates action items but never follows up on them will lose credibility and attendance quickly.

Escalation procedures

Define clear escalation paths before they’re needed:

CRITICAL finding not acknowledged within the SLA Auto-escalate to security team manager 15 minutes after SLA breach
HIGH finding not resolved within the SLA Escalate to finding owner’s manager 4 hours after SLA breach
Compliance score drops more than 5 points in a week Escalate to cloud platform team lead for investigation Next business day
Auto-remediation failure Page security on-call Immediate
New finding type not covered by existing runbooks Add to weekly review agenda for triage and runbook development Next weekly review

Monthly metrics report

Compile these metrics monthly and review them with security and engineering leadership. The goal is to tell a story about whether the organization’s security posture is improving, stable, or degrading, and why.

Mean time to acknowledge (MTTA) for CRITICAL findings Are findings being seen promptly? Decreasing month over month
Mean time to resolve (MTTR) for CRITICAL and HIGH findings Are findings being acted on? Decreasing month over month
Security Hub compliance score by standard, by account What is the posture trend over time? Increasing month over month
Number of active GuardDuty findings by severity Is the backlog growing or shrinking? Decreasing for HIGH and CRITICAL
Findings auto-remediated compared to manually resolved Is automation delivering value? Auto-remediation ratio increasing
Number of suppressed findings (with quarterly justification review) Is noise being managed, or are problems being hidden? Stable or decreasing
New findings introduced compared to resolved this month Is the organization getting ahead or falling behind? More finding resolved than introduced
SLA adherence rate by severity Are response commitments being met? More than 95% for CRITICAL, and more than 90% for HIGH

Building the dashboard: Use Amazon CloudWatch dashboards for real-time operational visibility or Amazon QuickSight connected to Security Hub findings through Amazon Security Lake for historical trend analysis and executive reporting. The dashboard should be visible to—and regularly viewed by—everyone in the weekly review, not locked in a security team tool.

Quarterly reviews

The quarterly review is a deeper inspection of the system itself; not just the findings, but the machinery processing them.

Quarterly review checklist:

  • Suppression rules audit: Review every active suppression rule to determine if the underlying condition is still present and the suppression is still justified. Document the review outcome for each rule.
  • Disabled controls audit: Review every disabled Security Hub control. Check that the justification is still valid and if the environment changed (for example, a service that wasn’t in use is now in use).
  • Automation audit: Review AWS Identity and Access Management (IAM) roles used by remediation functions and verify least privilege. Review execution logs for any anomalies or failures that weren’t caught.
  • New capabilities review: Evaluate newly released GuardDuty protection plans and Security Hub controls from that quarter. AWS releases new detection and compliance capabilities regularly. If you’re not reviewing them quarterly, you’re accumulating blind spots.
  • Process effectiveness review: Determine if the weekly meeting is well-attended and if action items are being completed. Make sure SLAs are being met. If attendance, action item completion, and SLA compliance aren’t where they should be, explore structural changes to address the gaps.

Operational maturity scoring

Use this rubric to assess the maturity of your operational rhythm itself. Score each dimension 1–3 and use the total to track progress over time.

Review cadence One time reviews when someone remembers Weekly review happens, but attendance is inconsistent Weekly review is consistently attended with documented outcomes
Metrics tracking No metrics captured Metrics are collected monthly but not acted on Metrics drive decisions and declining trends trigger specific actions
Finding ownership Findings sit in queue with no owner Findings are assigned to teams but SLAs aren’t tracked Every finding has an owner, SLAs are tracked, and breaches are escalated
Automation management Set-and-forget automations Automation logs are reviewed periodically Automation is reviewed weekly, and new candidates are evaluated continuously
Tuning lifecycle Suppression rules created but never reviewed Annual review of suppressions and disabled controls Quarterly reviews with documented justification for every rule
Cross-team engagement Security team works in isolation Platform team participates Engineering teams actively participate and own remediation

Scoring (revisit quarterly):

  • Beginning: 6–9
  • Established: 10–14
  • Optimized: 15–18

Deliverable: A documented operational cadence with clear ownership (consider a RACI matrix), metrics dashboards, escalation procedures, and a continuous improvement loop. The cadence should survive team member turnover—if it depends on one person remembering to run it, it’s not yet operational.

Phase 5: Mature the architecture

Goal: Fill remaining gaps and build toward a comprehensive security operations capability. Estimated timeline: Ongoing. Prioritize based on organizational risk profile and compliance requirements.

  • Amazon Inspector integration: Enable Amazon Inspector for Amazon Elastic Compute Cloud (Amazon EC2) instances, Lambda functions, and Amazon Elastic Container Registry (Amazon ECR) container images. Findings flow into Security Hub automatically, adding vulnerability management alongside threat detection and posture management. Prioritize this if you have Amazon EC2 or container workloads without an existing vulnerability scanning solution.
  • Amazon Macie: Enable Amazon Macie for S3 buckets containing potentially sensitive data. Particularly important for organizations with compliance requirements around personally identifiable information (PII), protected health information (PHI), or Payment Card Industry (PCI) data. Configure automated sensitive data discovery and route findings to Security Hub.
  • Amazon Security Lake: Amazon Security Lake centralizes security-relevant logs in OCSF format for long-term retention, forensic investigation, and threat hunting. This is valuable when you need historical analysis beyond the Security Hub retention window, or when feeding a third-party Security Information and Event Management (SIEM) tool.
  • Preventive controls layer: Convert recurring detective findings into preventive policies. Use SCPs to prevent disabling GuardDuty, Security Hub, and CloudTrail, IAM permission boundaries on developer roles, AWS WAF on public endpoints, and AWS Network Firewall for VPC traffic inspection. The pattern is to make recurring misconfigurations impossible to introduce.
  • Detective controls expansion: Use AWS IAM Access Analyzer for external access and unused access findings, AWS CloudTrail Lake for long-term queryable audit logs, and AWS Config custom rules for organization-specific compliance checks.
  • Incident response readiness: Have incident response playbooks referencing specific GuardDuty finding types, pre-built forensics infrastructure (isolated VPC, forensic AMIs, and pre-configured IAM roles), regular tabletop exercises, and AWS CloudFormation templates to deploy isolation infrastructure on demand. See the AWS Security Incident Response Guide for a comprehensive framework.

Conclusion

In this post, I provided a six-phase roadmap for operationalizing Security Hub and GuardDuty and showed that it isn’t a single project, but a progression. Phase 0 and Phase 1 can typically be completed in 3–5 weeks and deliver immediate clarity. Phases 2 and 3 build the response infrastructure that turns findings into action over the following 5–7 weeks. Phase 4 is what makes everything sustainable and is where you should invest the most attention. And Phase 5 expands the aperture from Security Hub and GuardDuty into a comprehensive security operations capability.

If you walked away from this post and did one thing, run the Phase 0 assessment this week. That single deliverable tells you exactly where to focus next. Use the following self-assessment checklist to identify your current phase, then focus on the next one. A tuned environment with working notifications and a weekly review cadence is dramatically more effective than a fully featured but neglected deployment. Start where you are, reduce the noise, build the habits, and iterate. To learn more, explore the AWS Security Hub User Guide, the Amazon GuardDuty User Guide, and the AWS Security Incident Response Guide. If you’ve implemented a similar operational cadence, or have questions about any phase, share your experience in the comments.

Self-assessment checklist

Phase 0 We know how many active GuardDuty findings exist across all accounts
We know our current Security Hub compliance score
We know whether GuardDuty is enabled in every account and region
We know who (if anyone) is reviewing findings today
Phase 1 GuardDuty suppression rules exist for known-benign activity
Irrelevant Security Hub controls have been disabled with documented justification
All active HIGH and CRITICAL findings have been triaged
Security Hub compliance scores reflect actual posture, not noise
Phase 2 HIGH and CRITICAL findings generate real-time notifications to the security team
MEDIUM findings automatically create tracked work items
Notifications include enriched context (account alias, resource ARN, and console link)
Phase 3 At least three high-confidence finding types trigger automated remediation
Auto-remediation actions have full audit trails
Remediation runbooks are documented and version-controlled
Phase 4 A weekly security review meeting occurs with defined attendees and agenda
MTTA and MTTR are tracked monthly for CRITICAL and HIGH findings
Suppression rules and disabled controls are reviewed quarterly
Security metrics trend positively over the past 3 months
Phase 5 Amazon Inspector, Macie, or Security Lake are integrated
Preventive controls (SCPs, permission boundaries) address recurring findings
Incident response playbooks exist and are tested through tabletop exercises

If you have feedback about this post, submit comments in the Comments section below.


Joseph Sadler

Joseph Sadler

Joseph is a Senior Solutions Architect on the Worldwide Public Sector team at AWS, specializing in cybersecurity and machine learning. With public and private sector experience, he has expertise in cloud security, artificial intelligence, threat detection, and incident response. His diverse background helps him architect robust, secure solutions that use cutting-edge technologies to safeguard mission-critical systems

  •  

Building secure B2C applications with fine-grained access control using Amazon Cognito and Amazon Verified Permissions

Modern web applications require robust security controls to protect user data and application resources. Authentication and authorization are two fundamental pillars of application security that answer critical questions: Who are you? and What are you allowed to do? Implementing these controls correctly can be challenging for developers, especially when building data-intensive applications with frameworks like Streamlit (an open-source Python framework for building interactive web applications) or when requiring fine-grained access control. Key challenges include protecting access to application resources, implementing application identity with multi-factor authentication (MFA), and implementing usage-based controls.

In this post, you will learn how to build fine-grained access controls for a sample Streamlit application using Amazon Cognito for authentication and Amazon Verified Permissions with Cedar policies for authorization. This architecture provides enterprise-grade security with minimal development effort, so you can focus on your application’s core functionality. You will learn how to reduce development time for secure applications, implement enterprise-grade authentication, through proper access management, and scale security with growing user bases.

Security architecture overview

The reference architecture follows a layered security design with four key components; separating identity verification, authorization evaluation, application logic, and enforcement boundaries. By assigning clear responsibilities to each layer, the architecture limits blast radius and ensures that a failure in any single control does not compromise the overall system.

  • Authentication layer: Amazon Cognito handles user authentication with secure credential validation and JSON web tokens (JWTs). It provides built-in password policies, account lockout protection, and session management.
  • Authorization layer: Verified Permissions uses the Cedar policy engine to evaluate fine-grained access requests based on centrally stored policies.
  • Application layer: The Streamlit frontend integrates with both services, managing user sessions and enforcing access controls in the user interface.
  • Security boundaries: Multiple layers of security controls protect against unauthorized access, privilege escalation, authentication verification, authorization checks, and input validation.

This separation of concerns enables authentication and authorization to function as complementary security controls, following defense-in-depth principles. Figure 1 illustrates the end-to-end authentication and authorization workflow, showing how a user’s sign-in request flows through Amazon Cognito for identity verification, then through Verified Permissions for Cedar policy-based access decisions, before the application enforces the result.

Figure 1: Solution architecture and workflow

Figure 1: Solution architecture and workflow

The following workflow demonstrates how the three architecture layers work together: the authentication layer (steps 1–3) handles identity verification using Amazon Cognito, the authorization layer (steps 4–6) evaluates Cedar policies using Verified Permissions, and the application layer (steps 7–8) enforces the decision in Streamlit.

  1. The user sends a sign-in request, which is submitted through Streamlit
  2. The request is authenticated by Amazon Cognito
  3. An access token is sent back to Streamlit
  4. An authorization request is sent to Verified Permissions
  5. The Cedar policy engine evaluates the request
  6. A decision is sent back by the policy engine
  7. The instruction to allow or deny is sent back to Streamlit
  8. If the instruction is to allow, access is provided

Understanding authorization with Cedar

While authentication establishes user identity, authorization determines what actions users can perform. Verified Permissions provides a scalable authorization service based on Cedar, a policy language specifically designed for fine-grained access control.

Cedar policies follow a structured format that defines who can perform which actions on what resources. Let’s examine the anatomy of a Cedar policy:

permit(
    principal == ?principal,
    action == application::Action::"ViewGrade",
    resource == ?resource
) when {
    principal has role == "Student" &&
    resource.student == principal.entityId
};

Policy components

  • Effectpermitor forbid determines whether the policy allows or denies access
  • Principal: The entity (user) making the request, represented by ?principal as a variable
  • Action: The operation being performed, scoped to your application namespace
  • Resource: The target of the action, also represented as a variable
  • Conditions: The when clause contains logical expressions that must evaluate to true

Advanced Cedar policy patterns

This section describes commonly used Cedar policy patterns for implementing fine-grained authorization with Amazon Verified Permissions. The examples illustrate how to model ownership, role-based access, hierarchical permissions, and administrative controls in real-world applications

Resource ownership control

This pattern helps ensure that users can only access resources they own:

permit(
    principal == ?principal,
    action == application::Action::"ViewGrade",
    resource == ?resource
) when {
    principal has role == "Student" &&
    resource.student == principal.entityId
};

What it does – This policy allows students to view only their own grades by:

  • Checking that the user has the Student role
  • Verifying that the grade resource’s student attribute matches the student’s entityId
  • Preventing students from accessing other students’ grades while allowing access to their own academic performance

Role-based access with resource type

This pattern grants access based on role and resource type:

permit(
    principal == ?principal,
    action == application::Action::"EditCourse",
    resource == ?resource
) when {
    principal has role == "Faculty" &&
    resource has resourceType == "Course" &&
    resource.instructor == principal.entityId
};

What it does – This policy allows faculty members to edit courses they teach by:

  • Verifying the user has the Faculty role
  • Confirming the resource is of type Course
  • Verifying that the course’s instructor attribute matches the faculty member’s entityId
  • Restricting faculty to modify only their own courses, not courses taught by other instructors

Hierarchical authorization

This pattern allows department heads to manage faculty in their department:

permit(
    principal == ?principal,
    action == application::Action::"ManageFaculty",
    resource == ?resource
) when {
    principal has role == "DepartmentHead" &&
    resource has role == "Faculty" &&
    resource.department == principal.department
};

What it does – This policy implements departmental hierarchy controls by:

  • Requiring the user to be a DepartmentHead
  • Verifying the resource is a faculty member
  • Matching the faculty member’s department with the department head’s department
  • Preventing department heads from managing faculty in other departments

Administrative override

This pattern provides emergency access with proper justification:

permit(
    principal == ?principal,
    action == ?action,
    resource == ?resource
) when {
    principal has role == "Administrator" &&
    context has emergencyAccess == true &&
    context has justification
};

What it does – This policy provides emergency access capabilities by:

  • Allowing administrators to perform any action on any resource
  • Requiring an emergency access flag to be set to true
  • Requiring a justification for emergency access
  • Supporting accountability through required documentation while enabling emergency operations

Cedar policy evaluation flow

Understanding how policies are evaluated helps design effective authorization systems. Figure 2 shows a common evaluation pattern for an academic scenario

Note: A policy match evaluates to the policy’s effect (permit or forbid). Forbid policies take precedence: if any forbid policy matches, access is denied regardless of permit policies.

Figure 2: Policy evaluation process

Figure 2: Policy evaluation process

The policy evaluation process follows these steps:

  1. User attempts to access a protected resource
  2. Application sends an authorization request to Verified Permissions
  3. Verified Permissions retrieves applicable Cedar policies from the policy store
  4. The Cedar policy engine evaluates each policy against the request
  5. If any forbid policy matches, access is denied immediately
  6. If any permit policy matches and no forbid policies match, access is allowed
  7. If no policies match, access is denied by default
  8. The evaluation result (ALLOW or DENY) is returned to the application
  9. Application enforces the authorization decision

Cedar policy language

Cedar is an Amazon open source policy language designed for fine-grained authorization. Every policy defines who (principal) can perform what action on which resource under what conditions, as shown in Figure 3.

Figure 3: Cedar policy definitions

Figure 3: Cedar policy definitions

Policy interaction

The following table shows how different policies interact in complex scenarios where multiple policies could apply:

Scenario Student policy Faculty policy Department head policy Admin policy
Student accessing own grade Permit N/A N/A Override
Faculty editing course N/A Permit N/A Override
Department head managing faculty N/A N/A Permit Override
Emergency admin access N/A N/A N/A Permit

Legend:

  • Permit – Policy allows access
  • N/A – Policy doesn’t apply
  • Override – Emergency admin access

The preceding table shows how each role’s policy applies to different scenarios, with admin access having override capabilities across most situations except for emergency admin access where it’s the primary permit authority. The Override column specifically indicates that the administrator’s emergency access policy can supersede other role-specific policies, but only when the emergencyAccess context flag is explicitly set and a justification is provided. This is not an automatic override.

Policy optimization tips:

  • Order conditions by likelihood of success – Place the most frequently true conditions first in your when clause to enable short-circuit evaluation. For example, check role before resource ownership, because role mismatches are caught earlier. See Cedar best practices.
  • Use indexed attributes for faster lookups – Use entity attributes that Verified Permissions indexes natively (entityId, role, resource type) as primary conditions. Best practices for designing an authorization model
  • Cache policy evaluations when appropriate
  • Monitor evaluation metrics and performance

Real-world application: Academic system

Consider an academic system with different user roles and their corresponding permissions:

Student: View own grades

  • Policy helps ensure students can only access grade resources where they are listed as the student
  • The policy verifies the student’s role and matches the resource owner to the principal’s entity ID

Faculty: Edit course content, manage grades

  • Policy allows faculty to edit courses they teach
  • Faculty can view and modify grades for students in their courses

Teaching assistant (TA): Grade management and course support

  • Policy permits TAs to manage grades for courses they assist with
  • Access is limited to specific courses assigned to the TA

Department head: Manage faculty assignments

  • Policy allows department heads to manage faculty in their department
  • Access is scoped to the department hierarchy

Administrator: System-wide access

  • Policy provides emergency access with proper justification
  • Administrative actions are logged and audited

Prerequisites

To implement the preceding Academic system application, you need an active AWS account, Python 3.8 or later, basic Streamlit knowledge, and AWS Identity and Access Management (IAM) permissions for Amazon Cognito and Verified Permissions.

Run the sample and extend the solution

  1. Download the code base: Start by downloading the code base from the avp streamlit samples repository
  2. Set up your development environment: Install the AWS SDK for Python (boto3) and configure your AWS credentials.
    • Install the AWS SDK for Python:
      pip install boto3
      
    • Log in to your AWS account:
      aws login --region $REGION
    • Verify that your AWS Command Line Interface (AWS CLI), Python, and dependencies are correctly configured.
      ./verify-setup.sh
  3. Create your AWS resources: Use the AWS Management Console or infrastructure as code (IaC) tools to provision your Amazon Cognito user pool and Verified Permissions policy store.
    ./deploy-demo-environment.sh
    Do you want to start the demo now? (Y/N): Y

    This provisions an Amazon Cognito user pool, a Verified Permissions policy store, and any sample resources needed for the demo.

  4. Verify the login screen:
    Figure 4: Verify login credentials
    Figure 4: Verify login credentials

  5. Demo walkthrough and shut down: Interact with the demo and test the policies and features. When you’re ready to exit, press Ctrl+C to shut down and stop.
  6. Define your Cedar policies: Start with basic policies and gradually add complexity as you understand the evaluation model.
  7. Implement authentication: Integrate Amazon Cognito authentication into your application with proper error handling.
  8. Add authorization checks: Implement authorization checks at critical access points in your application. For authentication, implement proper error handling for expired tokens, failed MFA challenges, and account lockouts. Use the Amazon Cognito built-in token refresh flow. For authorization, place Verified Permissions checks at every API endpoint and UI component that accesses protected resources.
  9. Test thoroughly: Create test scenarios for each user role and permission combination.
  10. Monitor and iterate: Set up AWS CloudTrail logging and Amazon CloudWatch alarms to monitor your security controls and refine them based on real-world usage.

Security best practices

When implementing this architecture, follow these best practices to support security:

  • Layer your security controls: Use both authentication and authorization as complementary controls rather than relying on a single mechanism.
  • Follow least privilege principles: Grant only the permissions needed for specific user roles. Start with minimal permissions and add more as needed.
  • Implement proper session management: Set appropriate token expiration and refresh policies. Amazon Cognito handles much of this automatically, but you should configure timeouts based on your security requirements.
  • Validate all inputs: Sanitize user inputs to prevent injection attacks. Don’t rely on client-side validation alone.
  • Monitor authentication events: Set up logging and alerts for suspicious activities such as repeated failed login attempts or unusual access patterns.
  • Conduct regular security reviews: Periodically audit your policies and security configurations to verify they still meet your requirements and follow current best practices.
  • Implement secure error handling: Avoid information disclosure through error messages. Provide helpful feedback to users without revealing system details that could aid attackers.

Conclusion

Implementing proper authentication and authorization is critical for application security. By using Amazon Cognito and Amazon Verified Permissions, you can build robust security controls without complex custom code. Through this approach, you can implement enterprise-grade authentication with minimal effort, define and enforce fine-grained authorization policies, scale your security controls as your application grows, and centrally manage and audit security policies.

To get started with your implementation, create your AWS resources including an Amazon Cognito user pool and Verified Permissions policy store. Define your Cedar policies based on your application’s access requirements. Integrate authentication and authorization checks into your application flow. Test thoroughly with different user roles and access scenarios. Finally, monitor and refine your security controls based on usage patterns.

For additional resources, check out the Amazon Cognito documentation and Amazon Verified Permissions documentation.

If you have feedback about this post, submit comments in the Comments section below.


Sowmya Vemuri

Sowmya Vemuri

Sowmya is a Senior Technical Customer Solutions Manager at AWS, where she partners with AWS’s largest customers to drive agentic AI transformation, cloud security strategy, and compute modernization at scale. She has 14+ years of engineering, product, and technical leadership experience building and scaling distributed systems across the stack: bare-metal servers, data platforms, enterprise and consumer applications, and autonomous cloud architectures with zero human operator access.

  •  

Amazon Cognito unlocks advanced capabilities with next-generation infrastructure

Amazon Cognito recently introduced high-throughput performance for demanding workloads, customer-managed keys for full control over data encryption at rest, and multi- Region replication for business continuity improvement. These capabilities were made possible through a next-generation storage infrastructure designed for extensibility and scale. To deliver this, we migrated hundreds of millions of user profiles, and you probably didn’t even notice. In this post, we walk through what’s new, the architecture behind it, and how we got here with a zero-downtime migration that kept your applications running.

New capabilities now available on Cognito

The migration to the new infrastructure wasn’t just about maintaining existing functionality—it created the foundation for delivering capabilities that solve customer challenges while positioning Amazon Cognito for continuous improvements.

High-throughput performance: The new architecture supports the higher request volumes and scale requirements of modern applications while maintaining the low latency performance that your applications depend on—able to support tens of millions of users per user pool and thousands of transactions per second (TPS).

Customer-managed keys: Customers can now use their own encryption keys stored in AWS Key Management Service (AWS KMS) for encrypting data at rest. This provides enhanced security control and capabilities, giving customers full ownership over their encryption key lifecycle.

Multi-Region replication: Customers can now synchronize their entire user pool data, including user passwords, attributes, and configurations to another user pool in another Region of their choice. This means that customers can implement business continuity strategies and maintain authentication availability in case of a Regional failover, helping their applications remain accessible to users even during unexpected disruptions.

An architecture for innovation

The new architecture uses a purpose-built storage layer designed for extensibility and scale of identity operations. We anchored the new architecture around a set of design tenets:

  • Identity-first design: The storage layer understands user identities. There’s no client-specific business logic and no generalizations beyond identity management; keeping the system focused, portable, and optimized.
  • Avoid one-way doors: Deliver value incrementally while keeping architectural choices reversible, so we can evolve as new needs arise.
  • Backward compatible: Changes to the underlying infrastructure should never break customers’ applications.

These tenets shaped every architectural decision. The architecture separates into independently deployable domains. Previously, while using Amazon Cloud Directory, the service architecture relied on a single data store to persist all customer information. This provided straightforward data traversal mechanisms but required multi-service coordination to adjust database schema when new features were required. The new architecture uses different datasets, allowing them to evolve independently for faster feature iterations.

Migration with zero-downtime

Migrating users requires extreme precautions and a strategy designed to maintain zero downtime and ensure data integrity at every step. Our approach prioritizes both immediate stability and long-term flexibility through the following measures:

  1. Shadow mode validation: We ran customer API requests through both old and new infrastructures simultaneously, comparing response structures, status codes, and behavioral characteristics. The validation was designed so that sensitive information was never exposed in plaintext during comparison. We accounted for known variances—for example, timestamps could differ slightly between systems—so that only meaningful discrepancies surfaced as actionable alerts.
  2. Data backfill: Before switching a user pool to the new infrastructure, we performed a bulk backfill of all existing user records from the legacy system into the new storage. The backfill ran alongside live traffic with dual-write capturing any changes made during the backfill window, ensuring no data loss or stale data. Shadow mode served as the validation layer for the backfill; as we addressed more edge cases in data syncing, shadow mode match rates increased, confirming data completeness before we proceeded to the switchover.
  3. Dual-write architecture: We implemented a system where all identity operations were simultaneously written to both legacy and new services, with comprehensive validation to ensure consistency. Even when a dual-write to the new infrastructure failed, the operation still succeeded in the legacy system, preserving all customer-initiated requests. This means any dual-write failure was contained as an internal consistency issue and not customer-impacting.
  4. Antientropy validation: We implemented a data validation and correction system that continuously compared records across old and new infrastructures, detecting and resolving any data divergence. Anti-entropy scans compared user attributes, credential hashes, group memberships, and configurations, among other records. When true discrepancies were found, the system automatically reconciled them using the legacy system as the source of truth. This layer was able to catch edge cases that shadow mode and dual writes alone could not cover.
  5. Incremental rollout with rollback capability: We established controlled deployment phases with immediate rollback capabilities. After switching a user pool to the new infrastructure, we continued replicating all writes back to the legacy system, ensuring we can revert any user pool to the legacy infrastructure at any point without data loss. If a rollback was needed during migration, an orchestrator replayed entries in timestamp order, syncing user profiles back to the legacy system.

Lessons learned for infrastructure modernization

This modernization taught us valuable principles that apply to any large-scale infrastructure project, therefore we choose to share these learnings to help you perform similar migrations.

  • Customer access patterns drive architecture decisions: Analyzing actual customer access patterns revealed that identity workloads follow predictable patterns, which meant we could adopt a synchronous dual-write approach that balanced completeness with operational simplicity. This principle applies to any domain-specific migration: understand your workload’s actual access patterns before reaching for general-purpose solutions.
  • Behavioral preservation requires techniques beyond traditional testing: Ensuring equivalent functionality across old and new systems was straightforward. Preserving identical API behavior was not. Functional tests validate intended behaviors, but we identified scenarios where customers had built applications around specific API behaviors such that a change could have silently broken their applications. For example, concurrent writes to the same user could resolve to different final states between old and new systems where writes all succeed but outcome diverges slightly. Similarly, customers who write an attribute and immediately read it are affected by the consistency window. Subtle timing differences in when updates become visible could cause stale reads. These aren’t functional failures, but behavior under real traffic patterns can vary. Shadow mode verification surfaced edge cases that automated tests alone would have missed. Invest in these techniques early.
  • Gradual validation builds confidence that testing alone cannot: Layer multiple independent validation techniques, such as shadow mode, dual writes, and anti-entropy scans—each covering a different access pattern. No single approach will catch everything, and the gaps between them are where production issues hide. Incremental rollout with immediate rollback capability lets you validate each step while maintaining the ability to revert quickly.
  • Key principles for your own modernization projects: Invest in purpose-built solutions, design for extensibility, and implement gradual validation. Or use managed services so your infrastructure improves without effort on your part while your applications keep running; helping you focus on your business needs.

Conclusion

In this post, we shared the high-level approach and learnings from the Amazon Cognito infrastructure modernization that create a foundation for modern identity management capabilities. The new Cognito infrastructure is live, delivering capabilities such as customer-managed keys and multi-Region replication. As the migration continues, all Cognito customers will gain access to these capabilities on the same service they rely on today, with no action required.

Ready to modernize your authentication infrastructure? Visit Amazon Cognito to learn more.

If you have feedback about this post, submit comments in the Comments section below.

Howie Li

Howie Li

Howie is a Product Manager at Amazon Web Services, where he strives to make auth easy by default. Outside of work, Howie enjoys exploring cultures and food through travels and making new ice cream flavors inspired by them.

Georgi Baghdasaryan

Georgi Baghdasaryan

Georgi is a Principal Engineer at Amazon Web Services, where he builds identity systems that help organizations securely manage access and authentication at scale. His broader focus is on reliable, high-impact infrastructure that enables customers to operate confidently in the cloud. Outside of work, Georgi enjoys experimenting with new matcha latte recipes and going on long bike rides.

  •  

Gain visibility into DDoS attacks with flow logs in AWS Shield Advanced

Reconstructing distributed denial of service (DDoS) attack traffic used to mean combining data from multiple sources after the fact. AWS Shield Advanced attack flow logs change that—they capture traffic metadata during attacks so you can pinpoint sources, verify mitigations, and feed your existing analysis pipelines.

Shield publishes logs to Amazon Simple Storage Service (Amazon S3), Amazon CloudWatch Logs, or Amazon Data Firehose using the same CloudWatch Logs delivery infrastructure as other AWS flow logs, so they fit directly into the monitoring and analysis tools you already use.

In this post, you will learn how Shield Advanced attack flow logs capture metadata during DDoS events, what each field in a flow log entry means, and how to enable and configure flow logging for your protected resources.

How DDoS attacks affect your applications

A DDoS attack floods an application with traffic, making it unavailable to users. Infrastructure-layer attacks saturate bandwidth and exhaust connection tables—you see packet loss and timeouts.

Shield Advanced is a managed DDoS protection service that detects and mitigates attacks for Amazon CloudFront distributions, Elastic Load Balancing load balancers, Amazon Route 53 hosted zones, AWS Global Accelerator standard accelerators, and Elastic IP (EIP) addresses. See the AWS Shield Advanced documentation for full coverage details. Initially, Shield Advanced will provide infrastructure-layer attack flow logs for EIP protections, with support for additional resource types to follow.

Key benefits

Flow logs help you understand attacks in several ways:

  • Reconstruct traffic patterns – Query logs after an attack to analyze volume, source distribution, and protocol mix without relying only on aggregate CloudWatch metrics.
  • Identify attack origins – The srccountry and location fields show where traffic originated and which AWS edge location it entered.
  • Verify mitigation behavior – The action field records what Shield did with each flow.

Logs go to Amazon S3, CloudWatch Logs, or Data Firehose. You can then query them with Amazon Athena (a serverless query service for analyzing data in Amazon S3), route them to third-party Security Information and Event Management (SIEM) platforms or build CloudWatch Logs Insights queries (an interactive log analysis feature) without deploying new infrastructure.

What attack flow logs capture

Log records capture source and destination IP addresses and ports, protocol, packet and byte counts, the action Shield Advanced took, and TCP flags. They also include the AWS ingress location where traffic entered and a two-letter country code for the traffic source when available. Logs are written at 5-minute intervals and are available during an active attack and after it concludes.

The maximum file size is 75 MB. If a file reaches that limit within the 5-minute window, the file will be closed, published, and a new file will start. Flow logs support JSON, plain text, W3C, and Parquet output formats and contain the following fields:

Field Description
protection_arn Amazon Resource Name (ARN) of the Shield protection
event_timestamp Timestamp of log generation
version Flow log version number
srcaddr Source IP address
dstaddr Destination IP address
srcport Source port
dstport Destination port
protocol IP protocol number
packets Packet count within the aggregation window
bytes Byte count within the aggregation window
starttime Aggregation window start time
endtime Aggregation window end time
action Action taken by Shield
location AWS ingress location
sampling_rate Sampling rate used during packet processing
tcp_flags TCP flags from the packet
srccountry Two-letter country code for the traffic source

How to configure flow logs for Shield Advanced protected resources

The following steps walk you through creating the CloudWatch Logs delivery resources that connect a Shield Advanced protection to your preferred log destination.

Prerequisites

Before configuring flow logs, make sure you have:

Flow logs incur standard CloudWatch Logs vended log charges, and the destination resources (S3 bucket storage, CloudWatch Logs log group storage, or Firehose data processing) incur separate charges. Review the Vended Logs entry on the CloudWatch pricing page and the pricing for your chosen destination service before enabling flow logs on high-traffic resources.

How it works

Log delivery requires three objects:

  • DeliverySource – Represents the Shield Advanced protection that produces the logs
  • DeliveryDestination – Represents where logs should be sent (Amazon S3, CloudWatch Logs, or Amazon Data Firehose)
  • Delivery – Connects the source to the destination

This three-object model lets you reuse destinations across multiple sources and manage delivery pipelines independently. For example, you can send logs from multiple Shield protections to the same S3 bucket by creating multiple DeliverySource objects that reference the same DeliveryDestination.

Because Shield Advanced attack flow logs use the CloudWatch Logs delivery infrastructure, you can aggregate them across accounts and Regions just like other vended logs. Deliver directly to a centralized S3 bucket with a cross-account policy, replicate CloudWatch Logs log groups using cross-account cross-Region centralization rules, or stream to a shared Firehose stream using cross-account subscriptions. Explore these options to build a unified view of DDoS attack traffic across your multi-account, multi-Region footprint.

Step 1: Create your destination resource

Choose a destination:

Step 2: Configure the destination resource policy (if needed)

The destination resource needs a policy that grants the CloudWatch Logs delivery service write permissions. The policy varies by destination type. For more information, see Logs sent to Amazon S3, Logs sent to CloudWatch Logs, or Logs sent to Firehose.

For Amazon S3 destinations, you have two options:

  • Automatic policy creation: If your bucket has no existing resource policy and you have the s3:GetBucketPolicy and s3:PutBucketPolicy permissions, AWS automatically creates the required policy when you create the delivery in step 6. You can skip to step 3.
  • Manual policy update: If you need to customize the policy or your organization requires pre-approved policies, create the policy manually by following the instructions for Logs sent to Amazon S3.

Step 3: Get your protection ARN

Shield Advanced is a global service and uses the us-east-1 AWS Region for management. Run the following command to list your Shield Advanced protections.

aws shield list-protections \
  --region us-east-1

In the output, copy the ProtectionArn value for the protection you want to log.

Step 4: Create a delivery source

Run the following command to create the delivery source, replace <protection-arn> with the ProtectionArn value from step 3.

aws logs put-delivery-source \
  --name my-shield-delivery-source \
  --resource-arn <protection-arn> \
  --log-type FLOW_LOGS \
  --region us-east-1

The --resource-arn is the ARN of your Shield Advanced protection—not the protected resource itself. Shield Advanced creates a separate protection object that wraps your resource, and flow logs are generated by that protection layer rather than the underlying resource.

Step 5: Create a delivery destination

Run the following command to create the delivery destination, replace <resource-arn> with the ARN of the destination resource you created in step 1.

aws logs put-delivery-destination \
  --name my-shield-delivery-destination \
  --output-format plain \
  --delivery-destination-configuration '{"destinationResourceArn":"<resource-arn>"}' \
  --region us-east-1

The --delivery-destination-configuration parameter takes a JSON object with a destinationResourceArn key whose value is the ARN of your S3 bucket, log group, or Firehose stream.

In the output, copy the value of the top-level ARN field—this is the delivery destination ARN (different from the bucket ARN). You will use this in step 6.

Step 6: Create the delivery

Run the following command to connect the delivery source to the delivery destination, replace <delivery-destination-arn> with the delivery destination ARN from step 5.

aws logs create-delivery \
  --delivery-source-name my-shield-delivery-source \
  --delivery-destination-arn <delivery-destination-arn> \
  --region us-east-1

Step 7: Verify the delivery

Run the following command to confirm the delivery is active.

aws logs describe-deliveries \
  --region us-east-1

After delivery is active, Shield Advanced publishes flow log records to your destination during DDoS events.

Clean up

To avoid ongoing charges, delete the resources you created.

  1. Delete the delivery:
    aws logs delete-delivery \
      --id <delivery-id> \
      --region us-east-1
  2. Delete the delivery source:
    aws logs delete-delivery-source \
      --name my-shield-delivery-source \
      --region us-east-1
  3. Delete the delivery destination:
    aws logs delete-delivery-destination \
      --name my-shield-delivery-destination \
      --region us-east-1
  4. (Optional) Back up flow log data if you need to retain logs for compliance or analysis.
  5. Delete the destination resource. Warning: Deleting the destination resource will permanently delete all flow log data.

    For an S3 bucket:

    aws s3 rb s3://<bucket-name> \
      --force \
      --region <region>

    For a CloudWatch Logs log group:

    aws logs delete-log-group \
      --log-group-name <log-group-name> \
      --region <region>

    For a Firehose stream:

    aws firehose delete-delivery-stream \
      --delivery-stream-name <stream-name> \
      --region <region>

Conclusion

Shield Advanced attack flow logs provide the visibility you need to understand and respond to DDoS attacks effectively. By integrating with your existing observability infrastructure, they deliver actionable insights without requiring new tooling or complex setup. Enable flow logs on your Shield Advanced protections today to gain immediate visibility into attack patterns and strengthen your DDoS defense posture.

Next steps:

For the full reference about flow log configuration, see the AWS Shield Advanced documentation.

If you have feedback about this post, submit comments in the Comments section below.


Ken Kitts

Ken Kitts

Ken is a Technical Account Manager at Amazon Web Services (AWS) with over 20 years of experience in computer networking, including software-defined networking in the financial technology sector. Outside of work, Ken is an avid traveler who enjoys exploring archaeological sites and museums, with Teotihuacan in Mexico as a favorite.

  •  

Why Policy in Amazon Bedrock AgentCore chose Cedar for securing agentic workflows

Agents have agency: they adapt and find multiple ways to solve problems. This autonomy creates a fundamental security challenge: the large language model (LLM) at the heart of the agent is non-deterministic, and its decisions can’t be predicted or guaranteed in advance. It can hallucinate harmful actions with complete confidence. It’s vulnerable to prompt injection attacks, where adversaries inject malicious commands through tool responses or user inputs. LLMs don’t robustly differentiate between commands and data, everything is only tokens. For these reasons, if you want defense in depth, you must treat the LLM as an untrusted actor from a security point of view.

The insight is that the LLM can’t affect the external world directly: it has to go through an orchestrator that invokes tools based on the LLM’s output. This is precisely where the controls must be applied. What you need at this boundary is authorization: a decision about whether each tool invocation should be allowed and under what conditions. Consider a customer service agent for an online retailer. Without proper controls, it could process refunds that exceed authorized limits, apply discounts to product categories that should be excluded, or look up one customer’s data while handling another customer’s session.

If you control agents’ access to tools, you can establish a safety envelope within which the agent can operate freely. This differs from two common but unsatisfactory approaches:

  • Creating hard-coded workflows eliminates uncertainty, but by itself defeats the purpose of using an LLM as the brain of the agent, because you’ve built a traditional application with an LLM interface. And even with this restriction, using LLM outputs at any step can open up the same risks. While it’s a useful technique for well-understood workflows, it’s not sufficient for agents that need to adapt.
  • Human-in-the-loop provides a safety net for critical operations, and it will always have a role. But relying on it as the main control mechanism sacrifices autonomy and can lead to approval fatigue.

You need agents that are safe and autonomous. This requires an auditable, deterministic enforcement layer that sits outside the agent and tools. Why outside? Because the LLM’s plan is the thing you can’t trust—it can’t be responsible for enforcing its own constraints. Controls at the LLM layer—such as system prompts and training-time alignment—can be bypassed by prompt injection or hallucination. Hard-coded checks in agent or tool code are more robust, but become difficult to audit and manage at scale, especially when security logic is scattered across many tools and services. Centralizing authorization outside both gives you a single checkpoint the LLM can’t circumvent; one that’s auditable and can be verified independently of the application code.

This is where AgentCore Policies come in. Amazon Bedrock AgentCore Gateway sits between the agent and the remote tools it calls. When you associate a Policy with a Gateway, it blocks everything by default. Policies selectively open this boundary by specifying which tool invocations are allowed and under what conditions. This enforcement applies to all tool traffic routed through the Gateway. For this approach to scale, it must be more straightforward to reason about the policies than about the agent’s behavior.

AgentCore policies are expressed in Cedar. Cedar is an open source authorization policy language developed by AWS that has recently joined the Cloud Native Computing Foundation (CNCF). Cedar was designed with exactly these properties: it’s purpose-built for authorization, readable by humans, and analyzable by machines using automated reasoning. This gives enterprises the ability to scale policy definition and enforcement to their AI agents.

How Cedar is used by Amazon Bedrock AgentCore

Amazon Bedrock AgentCore provides the infrastructure to deploy and manage agents at scale. It includes AgentCore Runtime for hosting agents, AgentCore Gateway for managing how agents connect to tools using Model Context Protocol (MCP), and Policy in AgentCore. Policy intercepts all agent traffic through AgentCore gateways and evaluates each request against defined policies in the policy engine before allowing tool access. Cedar powers the policy layer.

AgentCore Policy uses Cedar and its mathematical analysis capabilities at several points in the AgentCore Gateway workflow: the Cedar authorization engine is used at policy evaluation and Cedar Analysis is used during policy authoring, and in the control plane.

Policy authoring: Developers can write Cedar policies directly or use natural language that gets translated to Cedar through a neuro-symbolic AI feedback loop. Neuro-symbolic AI combines machine learning’s flexibility with automated reasoning’s provable correctness. An LLM generates policies from natural language, while Cedar Analysis validates them using symbolic, mathematical reasoning. The following diagram illustrates this workflow:

Figure 1: Cedar policy generation workflow

Figure 1: Cedar policy generation workflow

An administrator specifies—in natural language—which MCP tools the agent can call and under what conditions. The neuro-symbolic feedback loop then formalizes this description into Cedar policies. Here’s how it works: first, the LLM translates the natural language into Cedar policies. These policies are then run through two stages of verification. In the first stage, AgentCore Policy uses a Cedar schema generator that takes the MCP tool descriptions and produces a Cedar schema. Cedar validates the policies against this schema, helping to ensure that they reference valid tools and parameters and ruling out whole classes of runtime errors. If validation passes, the second stage runs Cedar Analysis, which encodes each policy as a mathematical formula and detects issues like policies that grant or deny everything, or that contain impossible conditions. These mathematical proofs identify errors in the process of translating from the natural language description to Cedar policies, and guide corrections.

The neuro-symbolic feedback loop significantly improves the accuracy of the generated policies. This demonstrates the power of combining neural and symbolic approaches—the LLM provides creative translation from natural language, while automated reasoning provides rigorous validation.

Control plane: When attaching policies to an AgentCore Gateway, Cedar Analysis performs holistic analysis of the entire policy set. Instead of analyzing policies in isolation, it examines how they interact and their combined effect. This analysis identifies potential logical errors—such as conflicting or redundant policies—and detects whether the policy set produces unintended authorization outcomes. When Cedar Analysis detects these errors, the operation fails and returns a description of the issue, so the policy author can fix and retry. See the Formal analysis for policy verification section for examples of the checks.

MCP tool invocation enforcement: Each agent tool request made to the AgentCore gateway is evaluated against Cedar policies which determine whether the MCP tool invocation with the given arguments should be allowed. This creates the safety envelope while allowing the necessary bridges to enable the agent to perform its job.

MCP tool filtering: Cedar enables an additional layer of protection that operates before any tool invocation occurs. When an agent issues a list tools command, AgentCore Gateway uses Cedar’s partial evaluation capability to determine which actions would always be denied under the current policy set. Those actions are omitted from the list tool response. The agent and the underlying LLM never see those tool actions, eliminating an entire class of risk: the agent and LLM can’t attempt to invoke a tool it doesn’t know exists. This is a direct benefit of Cedar’s partial evaluation: the system can determine that certain tool actions are unreachable without needing to wait for an actual tool invocation attempt.

Why Cedar: Analyzability enables safety at scale

Natural language is too ambiguous for security-critical infrastructure, and general-purpose programming languages, like Python, are very expressive but too difficult to analyze. They can have unintended side effects, termination issues, and can be difficult to understand.

Cedar avoids these issues by excluding loops and stateful operations, so policy evaluation terminates in O(n) time in common cases. This bounded execution time means agents can make authorization decisions without disrupting user experience or workflow efficiency.

Cedar is straightforward to read. Regulatory compliance and security audits require policies that humans can understand and verify. Cedar policies read like structured natural language, making them accessible to security teams, compliance officers, and business stakeholders:

// Only allow bulk discounts for premium customers with sufficient quantity
permit (
  principal is AgentCore::OAuthUser,
  action == AgentCore::Action::"ApplyBulkDiscount",
  resource
)
when
{
  principal.hasTag("customer_tier") &&
  principal.getTag("customer_tier") == "Platinum" &&
  context.input.orderQuantity >= 50
}
unless
{
  context.input
    .productTypes
    .containsAny
    (
      ["limited_edition", "seasonal_specials"]
    )
};

Auditors without a technical background can understand this policy: “Allow bulk discounts for platinum customers who order at least 50 items, except for limited edition or seasonal special products.” The unless clause makes the exception clear, which is how business rules are typically expressed in natural language. Notice that this single policy constrains two different sources of data. The customer tier comes from a JSON Web Token (JWT) claim—it can’t be hallucinated or manipulated by the LLM. The tool inputs like order quantity and product types, however, originate from the LLM’s tool call. Cedar policies constrain these inputs to only allowed values, ensuring that even if the LLM produces unexpected arguments, the policy enforcement layer rejects them deterministically.

Cedar is the right choice because it’s fast, straightforward to read, and analyzable through automated reasoning. This analyzability is why you can reason about the safety envelope around agents that’s expressed as Cedar policies. As agentic systems grow the number of tools grows. Without proper tooling, policy management becomes intractable; policies can conflict, create security gaps, or produce unintended authorization outcomes.

In the rest of this section, we examine how Cedar’s analyzability directly addresses this challenge through its deterministic, mathematically sound analysis. Because Cedar analysis can reliably detect conflicts and logical errors across large policy sets it enables scalable policy management through neuro-symbolic AI.

Formal analysis for policy verification

Cedar policies can be encoded as mathematical formulas and analyzed using automated reasoning techniques through a symbolic encoder. This enables AgentCore Policy to provide sophisticated policy verification capabilities during policy authoring and beyond. AgentCore Policy uses this analysis when authoring or attaching policies to detect possible logical errors, such as conflicting or redundant policies. Policy analysis, including policy comparison is available as an open source CLI tool. Next, we will take a look at some concrete examples of these checks.

Detecting logical errors in policies: Cedar Analysis can detect when policies contain logical errors. For example, the following policy has contradictory constraints that mean it can’t allow any request: the customer tier can’t be both gold and platinum at the same time. The intention was to use an || instead of &&, a mistake that can be made by both humans and AI systems that author policies.

// This policy cannot allow any requests due to logical errors
permit (
  principal is AgentCore::OAuthUser,
  action == AgentCore::Action::"ProcessRefund",
  resource
)
when
{
  principal.hasTag("customer_tier") &&
  principal.getTag("customer_tier") == "Gold" &&
  principal.getTag("customer_tier") == "Platinum"
}
unless { context.input.refundAmount > 1000 };

Similarly, Cedar Analysis can detect policies that always allow a given action, usually an indication of an overly permissive policy. For example, the following policy will allow all ApplyBulkDiscount requests because any order quantity will either be greater than or equal to 100 or less than 100.

// This policy allows all ApplyBulkDiscount requests
permit (
  principal is AgentCore::OAuthUser,
  action == AgentCore::Action::"ApplyBulkDiscount",
  resource
)
when
{
  context.input.orderQuantity >= 100 ||
  context.input.orderQuantity < 100 ||
  (principal.hasTag("customer_tier") &&
   principal.getTag("customer_tier") == "Platinum")
};

Detecting such logical errors isn’t easy for humans, and can’t be done by pattern matching: you need the formal rigor of mathematical analysis, which is exactly what Cedar Analysis does.

Detecting policy conflicts: Cedar Analysis can also analyze the entire policy set to detect inconsistencies between different individual policies:

// These policies conflict - Analysis will detect the subtle issue
permit (
  principal is AgentCore::OAuthUser,
  action == AgentCore::Action::"ProcessRefund",
  resource
)
when
{
  principal.hasTag("customer_tier") &&
  principal.getTag("customer_tier") == "Gold" &&
  context.input.refundAmount < 100
};

forbid (
  principal is AgentCore::OAuthUser,
  action == AgentCore::Action::"ProcessRefund",
  resource
)
when
{
  principal.hasTag("customer_tier") &&
  ["Gold", "Platinum"].contains(principal.getTag("customer_tier")) &&
  context.input.refundAmount < 500
};

The permit policy allows gold customers to process refunds less than $100, while the forbid policy blocks gold customers (and platinum customers) from processing refunds less than $500. Because forbid overrides permit in Cedar, the forbid policy would block all gold customer refunds despite the permit policy.

Comparing policy changes: When updating policies, Cedar Analysis can also determine the exact impact of a change. Consider the following update to the unless clause (the policy lines with + have been added and those with - have been removed): we now block ApplyBulkDiscount only when the product type is limited_edition and the quantity exceeds 200.

 permit (
   principal is AgentCore::OAuthUser,
   action == AgentCore::Action::"ProcessRefund",
   resource
 )
 when
 {
   context.input.refundAmount < 500
 };
 
 permit (
   principal is AgentCore::OAuthUser,
   action == AgentCore::Action::"ApplyBulkDiscount",
   resource
 )
 when
 {
   context.input.orderQuantity >= 50
 }
 unless
 {
-  context.input.productTypes.containsAny(["limited_edition"])
+  context.input.productTypes.containsAny(["limited_edition"]) &&
+  context.input.orderQuantity > 200
 };

At first glance, adding a condition to the unless clause might seem more restrictive. In fact, it’s the opposite: narrowing when the unless applies means the permit now covers more requests. For example, an order of 73 units of a limited_edition product would have been blocked before but is now allowed. Cedar Analysis can automatically detect this and generates the following table showing the difference in permissiveness between the original policy set and the updated one:

Principal type

Action

Resource type

Status

OAuthUser

ProcessRefund

Gateway

Equivalent

OAuthUser

ApplyBulkDiscount

Gateway

More permissive

In the preceding example, the analysis tells us that the updated policy allows allows exactly the same ProcessRefund requests, but allows more ApplyBulkDiscount requests.

This formal verification capability is essential when agents operate autonomously and can affect the real world. Organizations need mathematical certainty that their policies will behave as intended.

Deterministic behavior for reliable governance

Unlike probabilistic AI models, enterprise security requires deterministic guarantees. Cedar policies always produce the same authorization decision for identical requests, regardless of evaluation order or system state. Cedar’s default deny, forbid wins, no ordering semantics help ensure predictable behavior.

// Policy evaluation order does not affect the authorization decision
permit(
    principal,
    action == AgentCore::Action::"ProcessRefund",
    resource
) when {
    context.input.refundAmount < 500
};

forbid(
    principal,
    action == AgentCore::Action::"ProcessRefund", 
    resource
) when {
    context.input.orderDate.offset(duration("90d")) < context.system.now
};

Whether the permit or forbid policy is evaluated first, a refund request over $500 will always be denied, and any refund issued more than 90 days after the order date will also be denied. This predictability gives enterprises confidence in their agent governance.

From policies to production

By choosing AgentCore Policy and Cedar, organizations can deploy autonomous agents with policies they can reason about mathematically, not only hope the agents work correctly. Cedar’s combination of expressiveness, readability, and formal verification means that you can design agents with the flexibility needed to function and the certainty security teams demand.

Automated reasoning has already proven its value across AWS, from AWS IAM Access Analyzer verifying access policies to provable security for network configurations. Applying these same techniques to agentic AI is a natural extension: as agents take on more responsibility, the need for mathematically grounded guarantees only grows. The neuro-symbolic approach we’ve described in this post—combining LLM flexibility with the rigor of automated reasoning—points toward a future where agents can be both more autonomous and more trustworthy, because the verification keeps pace with the autonomy.

Learn more

Policy is now available as part of Amazon Bedrock AgentCore Gateway. To learn more about Cedar and its capabilities, visit the Cedar website, try the Cedar playground, or join the Cedar community on Slack.

For more information about Policy in Amazon Bedrock AgentCore Gateway, visit the AWS documentation or explore the AgentCore Gateway console.

If you have feedback about this post, submit comments in the Comments section below.

Liana Hadarean

Liana Hadarean

Liana is a Principal Applied Scientist at AWS. She has worked on the code analysis tools that power Amazon Q Java security detectors, and is now a contributor to the Cedar policy language.

John Tristan

Jean-Baptiste Tristan

Jean-Baptiste is a Senior Principal Applied Scientist at AWS Agentic AI where he works on neurosymbolic AI and agentic safety.

  •  
❌