Palo Alto Networks recently joined the DNS-OARC community as a Platinum Member. Together, our organizations share a commitment to advancing collaboration in research and operational excellence across the global DNS ecosystem. DNS is critical to both internet infrastructure and security, and this collaboration facilitates the sharing of real-world insights among researchers and practitioners.
Our Contribution
We help organizations secure their digital environment with a comprehensive portfolio of cybersecurity solutions spanning Network, Cloud, Security Operations, AI and Identity. Trusted by more than 70,000 customers worldwide and informed by Unit 42® Threat Intelligence, their AI-driven platforms help organizations reduce complexity, modernize with confidence, and securely enable innovation.
As a Platinum Member, our subject matter experts will actively participate in the DNS-OARC community by engaging in discussions and contributing to research on evolving DNS threats and network challenges. The growing intersection of DNS and security makes access to intelligence and experience increasingly important. It strengthens the community’s ability to respond to emerging challenges and improves resilience across the internet.
Through our participation, our customers will gain stronger protection informed by community-driven intelligence and real-world operational insight. These learnings are continuously integrated into our threat intelligence and security capabilities. Our participation signals our support for DNS-OARC’s mission of fostering open dialogue and shared learning across the DNS ecosystem. This collaboration helps bridge DNS operations with broader security practices, improving coordination between operators, researchers and security practitioners.
Our Commitment to the DNS-OARC and Global Communities
Collaboration between our organizations strengthens the connection among DNS operations and modern security practices by bringing together operational insight and a global community dedicated to advancing the internet’s resilience.
For the DNS-OARC community, our commitment enhances knowledge sharing around evolving DNS threats, large-scale network operations and practical approaches to emerging challenges.
For organizations and customers, it reinforces a stronger alignment between DNS infrastructure and security, expands access to community-driven intelligence and supports more resilient, well-informed defenses.
Tong Zhao, Senior Manager of DNS Security Engineering, Palo Alto Networks:
We recognize the critical role of DNS-OARC in DNS operations and research. The teams from Palo Alto Networks believe that our DNS-OARC membership aligns perfectly with our goals. We are eager to participate in and contribute to the DNS community.
Our partnership with the DNC-OARC highlights the value of open collaboration in helping both the community and its participants stay ahead of an increasingly complex threat landscape. To learn more about how our expertise and insights support DNS-OARC’s mission to improve the security and stability of the internet’s DNS, visit DNS-OARC.
Last week, Anthropic pulled back the curtain on Claude Mythos Preview, an AI model so capable at finding and exploiting software vulnerabilities that the company decided it was too dangerous to release to the public. Instead, access has been restricted to roughly 50 organizations—Microsoft, Apple, Amazon Web Services, CrowdStrike and other vendors of critical infrastructure—under an initiative called Project Glasswing.
The announcement was accompanied by a barrage of hair-raising anecdotes: thousands of vulnerabilities uncovered across every major operating system and browser, including a 27-year-old bug in OpenBSD, a 16-year-old flaw in FFmpeg. Mythos was able to weaponize a set of vulnerabilities it found in the Firefox browser into 181 usable attacks; Anthropic’s previous flagship model could only achieve two.
This is, in many respects, exactly the kind of responsible disclosure that security researchers have long urged. And yet the public has been given remarkably little with which to evaluate Anthropic’s decision. We have been shown a highlight reel of spectacular successes. However, we can’t tell if we have a blockbuster until they let us see the whole movie.
For example, we don’t know how many times Mythos mistakenly flagged code as vulnerable. Anthropic said security contractors agreed with the AI’s severity rating 198 times, with an 89 per cent severity agreement. That’s impressive, but incomplete. Independent researchers examining similar models have found that AI that detects nearly every real bug also hallucinates plausible-sounding vulnerabilities in patched, correct code.
This matters. A model that autonomously finds and exploits hundreds of vulnerabilities with inhuman precision is a game changer, but a model that generates thousands of false alarms and non-working attacks still needs skilled and knowledgeable humans. Without knowing the rate of false alarms in Mythos’s unfiltered output, we cannot tell whether the examples showcased are representative.
There is a second, subtler problem. Large language models, including Mythos, perform best on inputs that resemble what they were trained on: widely used open-source projects, major browsers, the Linux kernel and popular web frameworks. Concentrating early access among the largest vendors of precisely this software is sensible; it lets them patch first, before adversaries catch up.
But the inverse is also true. Software outside the training distribution—industrial control systems, medical device firmware, bespoke financial infrastructure, regional banking software, older embedded systems—is exactly where out-of-the-box Mythos is likely least able to find or exploit bugs.
However, a sufficiently motivated attacker with domain expertise in one of these fields could nevertheless wield Mythos’s advanced reasoning capabilities as a force multiplier, probing systems that Anthropic’s own engineers lack the specialized knowledge to audit. The danger is not that Mythos fails in those domains; it is that Mythos may succeed for whoever brings the expertise.
Broader, structured access for academic researchers and domain specialists—cardiologists’ partners in medical device security, control-systems engineers, researchers in less prominent languages and ecosystems—would meaningfully reduce this asymmetry. Fifty companies, however well chosen, cannot substitute for the distributed expertise of the entire research community.
None of this is an indictment of Anthropic. By all appearances the company is trying to act responsibly, and its decision to hold the model back is evidence of seriousness.
But Anthropic is a private company and, in some ways, still a start-up. Yet it is making unilateral decisions about which pieces of our critical global infrastructure get defended first, and which must wait their turn.
It has finite staff, finite budget and finite expertise. It will miss things, and when the thing missed is in the software running a hospital or a power grid, the cost will be borne by people who never had a say.
The security problem is far greater than one company and one model. There’s no reason to believe that Mythos Preview is unique. (Not to be outdone, OpenAI announced that its new GPT-5.4-Cyber is so dangerous that the model also will not be released to the general public.) And it’s unclear how much of an advance these new models represent. The security company Aisle was able to replicate many of Anthropic’s published anecdotes using smaller, cheaper, public AI models.
Any decisions we make about whether and how to release these powerful models are more than one company’s responsibility. Ultimately, this will probably lead to regulation. That will be hard to get right and requires a long process of consultation and feedback.
In the short term, we need something simpler: greater transparency and information sharing with the broader community. This doesn’t necessarily mean making powerful models like Claude Mythos widely available. Rather, it means sharing as much data and information as possible, so that we can collectively make informed decisions.
We need globally co-ordinated frameworks for independent auditing, mandatory disclosure of aggregate performance metrics and funded access for academic and civil-society researchers.
This has implications for national security, personal safety and corporate competitiveness. Any technology that can find thousands of exploitable flaws in the systems we all depend on should not be governed solely by the internal judgment of its creators, however well intentioned.
Until that changes, each Mythos-class release will put the world at the edge of another precipice, without any visibility into whether there is a landing out of view just below, or whether this time the drop will be fatal. That is not a choice a for-profit corporation should be allowed to make in a democratic society. Nor should such a company be able to restrict the ability of society to make choices about its own security.
This essay was written with David Lie, and originally appeared in The Globe and Mail.
In the race to digitise public services, the UK’s digital estate has grown into a vast, borderless ecosystem that manual audits can no longer track. For UK Government departments, local authorities and NHS trusts, it is a sprawling, shifting landscape of cloud workloads, legacy infrastructure, shadow IT and third-party supplier connections.
This complexity creates blind spots that modern threats exploit. Recognising this vulnerability, the UK Government is moving toward a secure-by-design digital infrastructure, with the 2026 Government Cyber Action Plan (GCAP) setting a high bar for resilience. A central theme of the GCAP is the urgent need for the government to have better visibility of cyber security and resilience risk. Fundamentally, organisations cannot secure what they cannot see. As the GCAP explicitly states, the Government will use “data sources from across the government to truly understand government-wide and departmental cyber risks.”
The Challenge: Visibility in a “Landscape”
Many public sector organisations rely on a complex web of spreadsheets, data calls, legacy tools and manually curated lists to create an inventory of their internet-connected assets. But attackers do not look at an organisation's internal lists; they scan the internet for what they have forgotten to secure. Whether it is an unpatched server from a legacy project or a misconfigured database in a department, these "unknown unknowns" are the primary entry points for attackers.
The Strategic Mission: Empowering the Public Sector and Critical Industries
Palo Alto Networks Cortex Xpanse® is an active external attack surface management (EASM) solution that provides an outside-in view of organisations' entire digital footprint. It helps leaders meet national resilience goals:
Comprehensive, Continuous Visibility: Xpanse scans the global internet space continuously and identifies every asset associated with an organisation, without requiring software agents to be installed on your systems.
Accelerate Response: Leveraging automation, the solution streamlines response processes and enhances collaboration across dispersed teams from the sharing of findings to tracking actions and remediation.
Supply Chain Integrity: Inline with the new Cyber Security and Resilience Bill (bringing managed service providers and critical third parties into scope), Xpanse allows organisations to assess the internet-facing security posture of third-party partners and suppliers, ensuring a weak link elsewhere doesn't compromise the broader mission.
Alignment with GovAssure: Xpanse provides a consolidated risk profile and inventory for all internet-facing and cloud assets required for GovAssure assessments, turning a manual, months-long audit process into a continuous, data-driven cycle.
Investment prioritisation: Xpanse provides that much needed visibility to help executive committees and boards prioritise investment decisions on legacy IT and technical debt.
Aligning to National Cybersecurity Centre (NCSC) Guidance
Palo Alto Networks Cortex Xpanse aligns with the National Cyber Security Centre (NCSC) external attack surface management (EASM) buyer's guide by providing automated discovery, continuous monitoring and risk prioritisation of internet-facing assets. It replaces manual, point-in-time audits with a proactive, agentless solution. By automating the discovery of all internet-accessible assets (including shadow IT and unmanaged cloud operations) the platform fulfills the NCSC’s core requirement for continuous global monitoring and rapid attribution. This data-driven approach allows for the automated prioritisation of critical exposures, such as RDP, and integrates seamlessly with multiple third-party automation and visualisation tools, including Cortex XSOAR® and XSIAM, to accelerate remediation with national incident response standards.
In fact, with Palo Alto Networks deployment of Cortex Xpanse, we were able to achieve a 95% reduction in external vulnerability management spending across more than 700,000 cloud instances, while improving coverage and outcomes.
Palo Alto Networks Cortex Xpanse Capabilities
Discover Assets: Leveraging organisations' known asset inventory and other data points, Xpanse performs continual, automated discovery of all internet-accessible assets, effectively eliminating blind spots created by shadow IT and unmanaged cloud operations.
Obtain Information: Always-on, continuous monitoring of an organisation's entire attack surface through daily scans of the global IP address space, ensuring that newly exposed services are identified quickly and accurately.
Perform Analysis: Xpanse automates and prioritises alerts on all identified risks by severity, enabling organisations to optimise resolution and risk management, allowing teams to properly allocate resources and focus on the most critical risks to the organisation.
Display Information and Provide Advice: Leveraging a unified view of the internet facing and cloud-based estate, Xpanse provides specific resolver guidance for every identified issue, supporting and monitoring automated resolution through multiple native integrations.
Monitor Risk: Always on, discreet continual monitoring provides an independent real time status of the digital estate. Leveraging the threat intelligence capabilities of Palo Alto Networks, Xpanse is uniquely positioned to provide rapid coverage for newly discovered vulnerabilities, exploits or misconfigurations.
Securing the public sector requires a move from manual, point in time assessments to data-driven intelligence. Cortex Xpanse provides the foundations to remove blind spots, secure the supply chain and prevent unknown vulnerabilities in the face of sophisticated threats.
For further information and case studies, visit the links below, or schedule a demo.
Palo Alto Networks: Slash false positives, remediation time budget with Cortex attack surface management.
U.S. Pentagon: Palo Alto Networks Cortex Xpanse supercharge the Cyber Defences for the Department of Defense.
Accenture: Secure rapid growth with Cortex Xpanse.
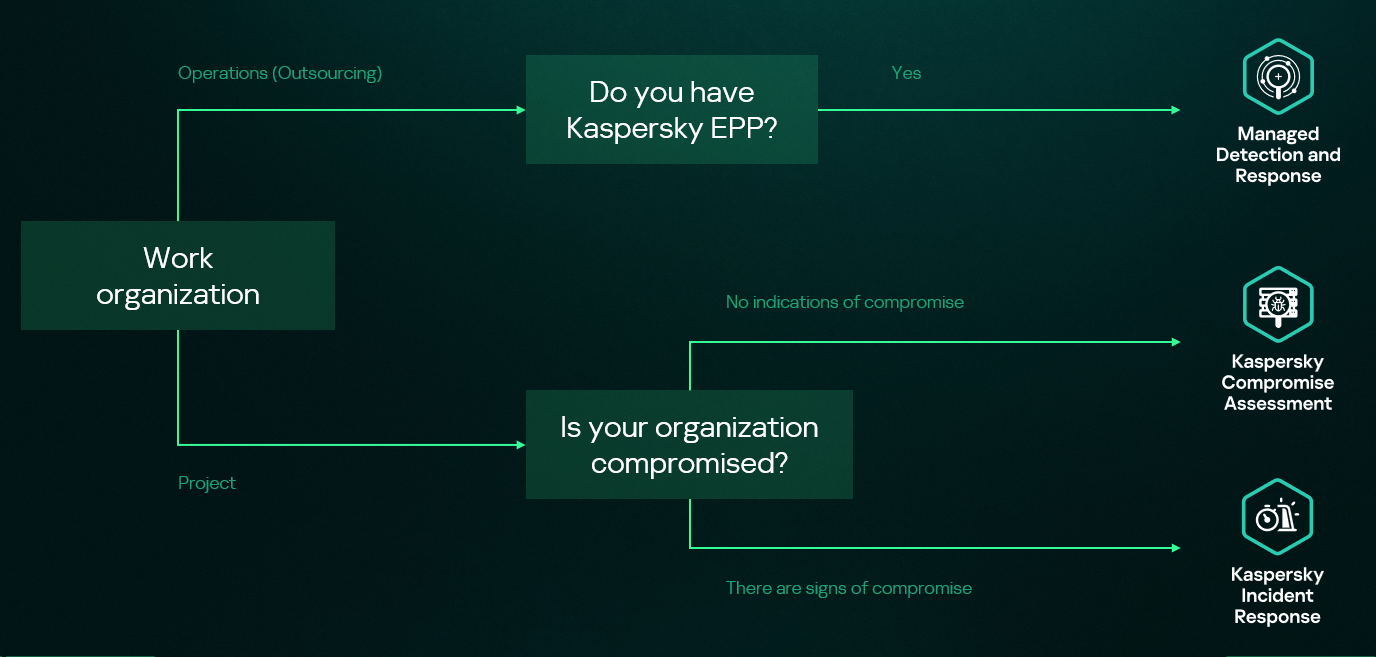
Kaspersky Security Services provide a comprehensive cybersecurity ecosystem, taking enterprise threat protection to another level. Services like Kaspersky Managed Detection and Response and Compromise Assessment allow for timely detection of threats and cyberattacks. SOC Consulting provides a practical approach ensuring the corporate infrastructure stays secured, while Incident Response is suited for timely remediation with a maximized recovery rate.
High-level overview of the MDR, IR and CA connection
This new report brings together statistics across regions and industries from our Managed Detection and Response and Incident Response services, and for the first time, it also includes insights from our Compromise Assessment and SOC Consulting services — all to provide you with more comprehensive view of different aspects of corporate information security worldwide.
The scope of MDR and IR services
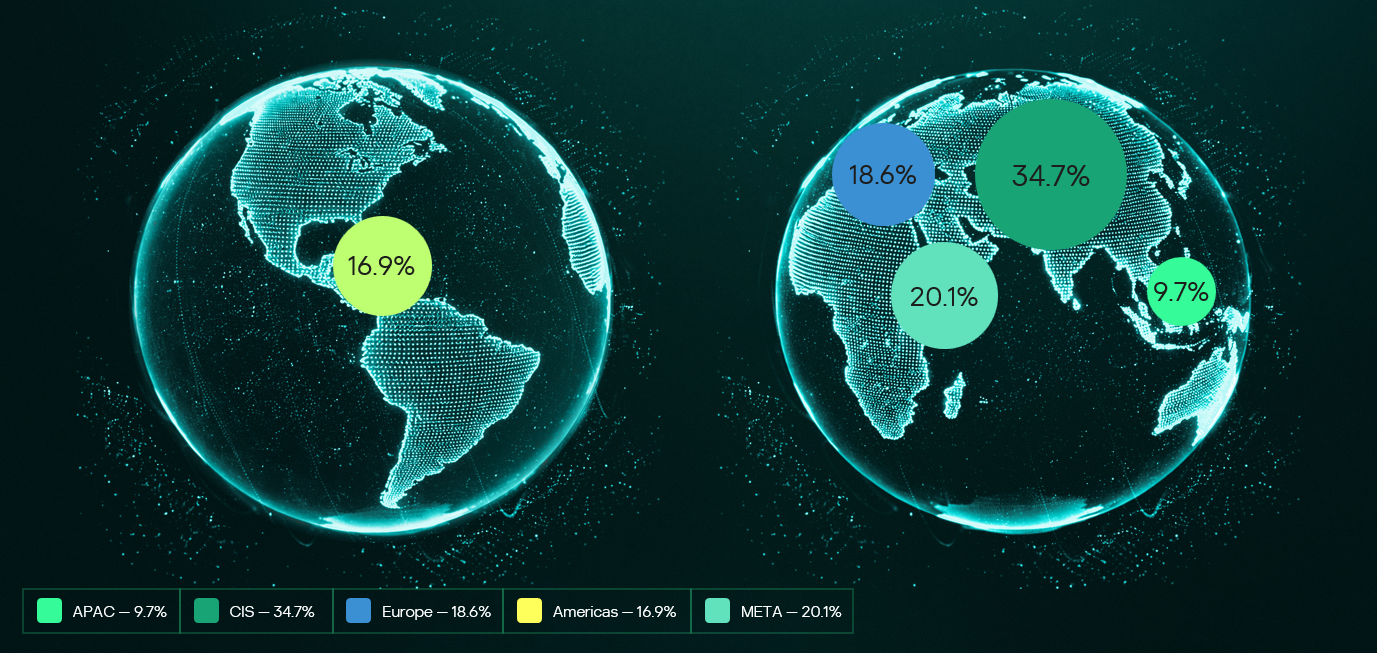
Provision of Kaspersky’s MDR and IR services follows a global approach. The majority of customers accounted for the CIS (34.7%), the Middle East (20.1%), and Europe (18.6%).
Distribution of customers by geographical region, 2025
MDR telemetry
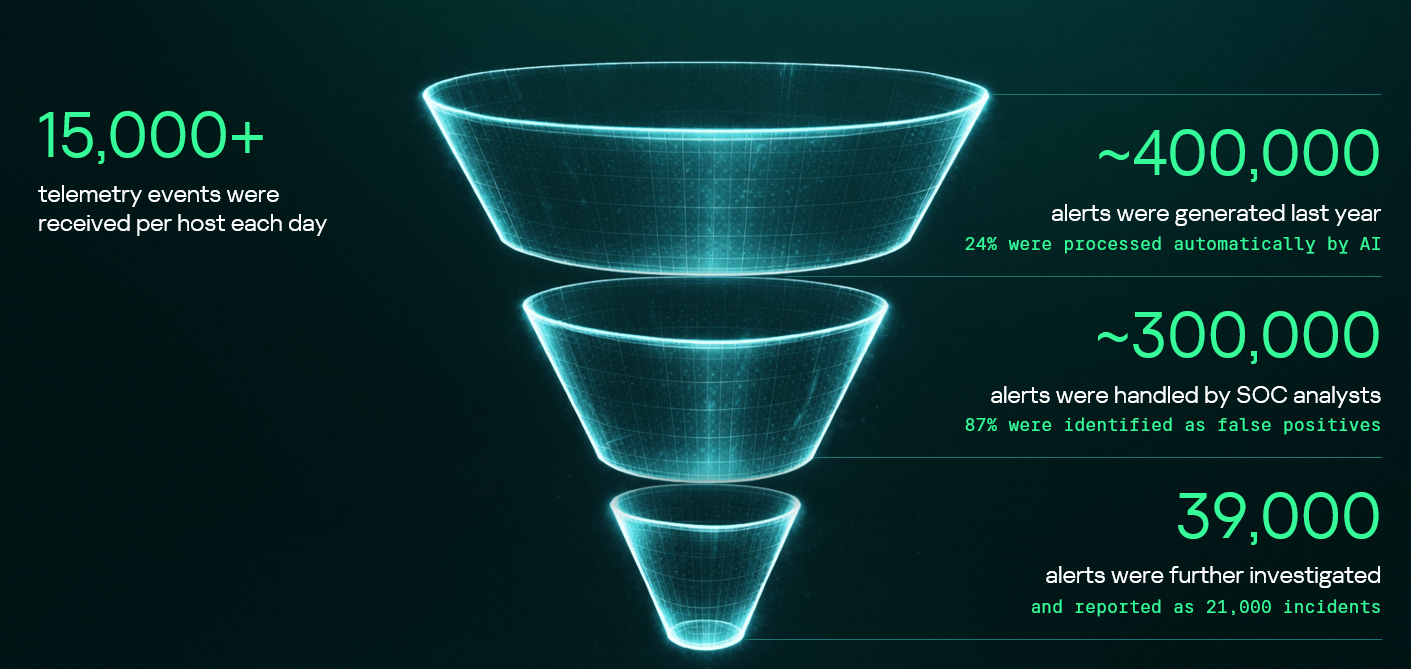
Following the previous year’s numbers, in 2025, the MDR infrastructure received and processed an average of 15,000 telemetry events per host every day, generating security alerts as a result. These alerts are first processed by AI-powered detection logic, after which Kaspersky SOC analysts handle them as required. Overall, a total of approximately 400,000 alerts were generated in 2025. After counting out false positives, 39,000 alerts were further investigated.
MDR telemetry statistics, 2025
Incident statistics
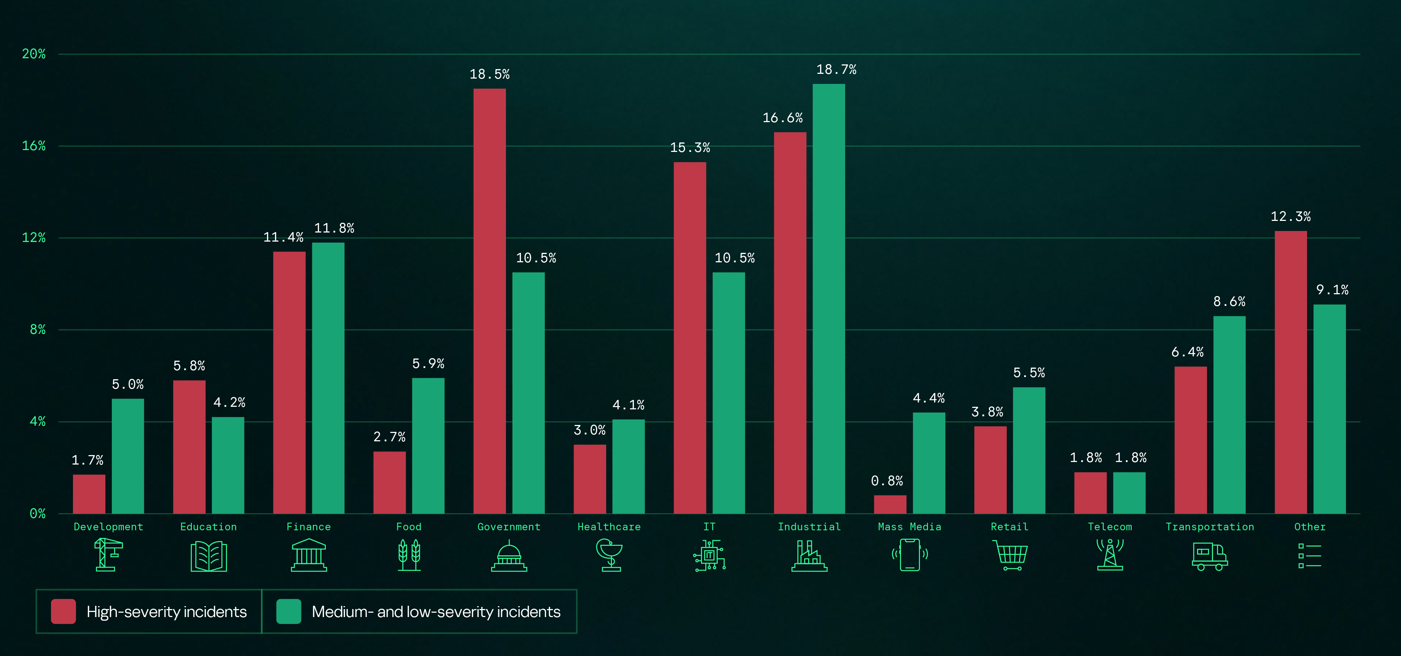
The distribution of remediation requests by industry has slightly changed as compared to previous years’ pattern. Government (18.5%) and industrial (16.6%) organizations are still the most targeted industries in regards to cyberattacks that require incident response activities. However, this year, the IT sector saw a growth in the number of IR requests, eventually being placed third in the overall industry distribution rankings and thus replacing financial organizations, which were targeted less often than in 2024. This is equally true for smaller-scale attacks that can be contained and remediated through automated means — the only difference is that medium- and low-severity incidents are more often experienced by financial organizations.
Distribution of all incidents by industry sector, 2025
Key trends and statistics
This section presents key findings and trends in cyberattacks in 2025:
The number of high-severity incidents decreased, following a downward trend that we’ve been observing since 2021. The majority of those incidents account for APT attacks and red teaming exercises, which indicates two landscape trends. On the one hand, skilled adversaries make efforts to increase impact, while on the other, organizations spend more resources on probing their defense systems.
The most common vulnerabilities exploited in the wild were related to Microsoft products. Half of all identified CVEs led to remote code execution, notably without authentication in some cases.
Exploitation of public-facing applications, valid accounts, and trusted relationships remain the most popular initial vectors, and their overall share has increased, accounting to over 80% of all attacks in 2025. In particular, attacks through trusted relationships are evolving: their share has increased to 15.5% from 12.8% in 2024. They are also becoming more complex: for instance, we witnessed a case where adversaries had compromised more than two organizations in sequence to ultimately gain access to a third target.
Standard Windows utilities remain a popular LotL tool. Adversaries use those to minimize the risk of detection during delivery to a compromised system. The most popular LOLBins we observed in high-severity incidents were powershell.exe (14.4%), rundll32.exe (5.9%), and mshta.exe (3.8%). Among the most popular legitimate tools used in incidents we flag Mimikatz (14.3%), PowerShell (8.1%), PsExec (7.5%), and AnyDesk (7.5%).
The full 2026 Global Report provides additional information about cyberattacks, including real-world cases discovered by Kaspersky experts. We also describe SOC Consulting projects and Compromise Assessment requests. The report includes comprehensive analysis of initial attack vectors in correlation with the MITRE ATT&CK tactics and techniques and the full list of vulnerabilities that we detected during Incident Response engagements.
Kaspersky Security Services provide a comprehensive cybersecurity ecosystem, taking enterprise threat protection to another level. Services like Kaspersky Managed Detection and Response and Compromise Assessment allow for timely detection of threats and cyberattacks. SOC Consulting provides a practical approach ensuring the corporate infrastructure stays secured, while Incident Response is suited for timely remediation with a maximized recovery rate.
High-level overview of the MDR, IR and CA connection
This new report brings together statistics across regions and industries from our Managed Detection and Response and Incident Response services, and for the first time, it also includes insights from our Compromise Assessment and SOC Consulting services — all to provide you with more comprehensive view of different aspects of corporate information security worldwide.
The scope of MDR and IR services
Provision of Kaspersky’s MDR and IR services follows a global approach. The majority of customers accounted for the CIS (34.7%), the Middle East (20.1%), and Europe (18.6%).
Distribution of customers by geographical region, 2025
MDR telemetry
Following the previous year’s numbers, in 2025, the MDR infrastructure received and processed an average of 15,000 telemetry events per host every day, generating security alerts as a result. These alerts are first processed by AI-powered detection logic, after which Kaspersky SOC analysts handle them as required. Overall, a total of approximately 400,000 alerts were generated in 2025. After counting out false positives, 39,000 alerts were further investigated.
MDR telemetry statistics, 2025
Incident statistics
The distribution of remediation requests by industry has slightly changed as compared to previous years’ pattern. Government (18.5%) and industrial (16.6%) organizations are still the most targeted industries in regards to cyberattacks that require incident response activities. However, this year, the IT sector saw a growth in the number of IR requests, eventually being placed third in the overall industry distribution rankings and thus replacing financial organizations, which were targeted less often than in 2024. This is equally true for smaller-scale attacks that can be contained and remediated through automated means — the only difference is that medium- and low-severity incidents are more often experienced by financial organizations.
Distribution of all incidents by industry sector, 2025
Key trends and statistics
This section presents key findings and trends in cyberattacks in 2025:
The number of high-severity incidents decreased, following a downward trend that we’ve been observing since 2021. The majority of those incidents account for APT attacks and red teaming exercises, which indicates two landscape trends. On the one hand, skilled adversaries make efforts to increase impact, while on the other, organizations spend more resources on probing their defense systems.
The most common vulnerabilities exploited in the wild were related to Microsoft products. Half of all identified CVEs led to remote code execution, notably without authentication in some cases.
Exploitation of public-facing applications, valid accounts, and trusted relationships remain the most popular initial vectors, and their overall share has increased, accounting to over 80% of all attacks in 2025. In particular, attacks through trusted relationships are evolving: their share has increased to 15.5% from 12.8% in 2024. They are also becoming more complex: for instance, we witnessed a case where adversaries had compromised more than two organizations in sequence to ultimately gain access to a third target.
Standard Windows utilities remain a popular LotL tool. Adversaries use those to minimize the risk of detection during delivery to a compromised system. The most popular LOLBins we observed in high-severity incidents were powershell.exe (14.4%), rundll32.exe (5.9%), and mshta.exe (3.8%). Among the most popular legitimate tools used in incidents we flag Mimikatz (14.3%), PowerShell (8.1%), PsExec (7.5%), and AnyDesk (7.5%).
The full 2026 Global Report provides additional information about cyberattacks, including real-world cases discovered by Kaspersky experts. We also describe SOC Consulting projects and Compromise Assessment requests. The report includes comprehensive analysis of initial attack vectors in correlation with the MITRE ATT&CK tactics and techniques and the full list of vulnerabilities that we detected during Incident Response engagements.
Cyber threats to water systems are no longer hypothetical. When attacks succeed, communities can face loss of trust, safety concerns, or service disruptions.
Today, Microsoft, in collaboration with the Cyber Readiness Institute (CRI) and the Center on Cyber Technology and Innovation (CCTI), is releasing a report that examines both the urgency of this challenge and what it will take to close the cyber readiness gap in the water sector. The report draws on a pilot program that provided water and wastewater utilities with practical cybersecurity training paired with hands‑on coaching, testing whether real-world support can meaningfully improve cyber readiness.
The findings point to a clear conclusion: improving cyber resilience in the water sector is achievable when training is paired with hands-on support and delivered through trusted sector partners. Because of the success of this pilot, the program is now a permanent offering, giving water utilities continued access to practical training and support to strengthen cyber resilience and better protect their communities from evolving threats.
Why cyber resilience in the water sector matters now
Water and wastewater utilities underpin public health, economic activity, and community resilience across all critical infrastructure. Yet recent assessments from the U.S. intelligence community and public reporting on cyber incidents underscore how exposed many systems remain. Even larger, well-resourced utilities have experienced cyber incidents, highlighting vulnerabilities that are far more pronounced among smaller operators serving rural and underserved communities.
Awareness of cyber risk is growing, but awareness is not preparedness. The challenge is how to move from growing awareness to sustained, operational readiness, especially for utilities with limited time, funding, and technical capacity.
What the pilot set out to test and what it showed
The CRI pilot was designed to answer a practical question facing the water sector: can accessible, behavior‑focused cybersecurity training paired with hands‑on support meaningfully improve cyber readiness?
Participating utilities used CRI’s free Cyber Readiness Program, which focuses on core cybersecurity practices such as strong authentication, software updates, phishing awareness, and secure data handling. Utilities also had access to CRI Certified Cyber Coaches, who worked directly with designated “Cyber Leaders” inside utilities to help translate training into policies, playbooks, and incident response planning. This model paired accessible training with personalized support to help utilities make meaningful progress despite resource constraints. The pilot revealed three clear findings about what helps and what limits cyber readiness in the water sector.
CRI program improves readiness: Participating utilities reported stronger cybersecurity fundamentals, greater confidence responding to incidents, and the identification of previously undocumented, yet critical, gaps such as missing continuity plans and weak password practices.
Hands-on support accelerates success: Utilities paired with a CRI‑certified coach were significantly more likely to complete the program than those participating on a self‑paced basis.
Demand exceeds capacity: While interest in cybersecurity support is high, staffing shortages, limited funding, and dependence on third-party vendors continue to limit utilities’ ability to fully implement improvements. Participation data helps explain this finding: of the 113 utilities that expressed initial interest, 72 began the program and 43 completed it.
Implications for policymakers and the ecosystem
The findings point to a central takeaway for policymakers and the ecosystem: improving cybersecurity outcomes requires moving beyond sharing information to providing hands-on support that helps utilities implement and sustain change.
Free resources are necessary but not enough: No-cost guidance alone cannot overcome staffing and funding constraints. Effective programs must include implementation support, like cyber coaches, to drive real outcomes.
Incentives increase participation: Tying cybersecurity training to operator licensing or continuing education requirements helps embed cyber readiness into routine professional development.
Trusted messengers drive engagement: Participation and completion were highest when programs were facilitated through established sector associations and networks that utilities already trust.
A path forward through collaboration
The lesson from this pilot is clear: cyber readiness improves when training is paired with hands‑on support and facilitated through trusted partners. But the findings also underscore a broader reality: lasting progress will require moving beyond information sharing toward approaches that build real, sustained capacity building on the ground.
At Microsoft, this work reflects a practical commitment to supporting cyber resilience across critical infrastructure, helping to move from awareness to action. Addressing the challenges identified in this report will require continued collaboration among policymakers, sector associations, nonprofits, and the private sector.
This work also complements Microsoft’s broader commitment to be water positive, including minimizing our water use and replenishing more water than we consume[1][2], by helping strengthen the resilience of the water systems and utilities that serve communities. Supporting practical cyber readiness is one way we can contribute to more resilient water systems for the future.
Look, I’m not a developer, and the last time I truly “wrote code” was probably a good number of years ago (and it was probably Perl so you may hate me). I am also not an appsec expert (as I often remind people).
Below I am describing my experience “vibe coding” an application. Before I go into the details of my lessons — and before this turns into a complete psychotherapy session — I want to briefly describe what the application is supposed to do.
Anton’s vibe app screenshot
We have a podcast (Cloud Security Podcast by Google), and I often feel that old episodes containing useful information aren’t being listened to and the insights from them go to waste. At the same time, for many organizations today, the answer to their current security problems may well have been discussed and solved in 2021. This may be strange to some, but for many organizations, the future is in the past. Somebody else’s past!
So I wanted “a machine” that turns old episodes into role-specific insights, without too much work by a human (me). This blog is a reflection on how things went.
First, my app is using public data — namely podcast transcripts and audio — to create other public data (social media posts). Since the inputs and outputs are public, this certainly made me at peace with vibe coding. Naturally, I needed to understand how the app would be coded, where it would live and what I should do to make it manifest in the real world. So I asked Gemini, and it suggested I use AI Studio by Google, and I did (non-critically) exactly that.
When I started creating the app, the question of storage immediately came up. Jumping a little bit ahead, you will see that authentication / credentials and storage were two security themes I reflected on the most.
You want to read a file from storage, but what storage? More importantly, whose storage? At this point, I had my first brush with anxiety of the “vibe process.” I didn’t want to just vibe code without a full understanding of the data access machinery. I immediately said, “No, I don’t want to store data in my Google Drive using my credentials.” I just didn’t trust it.
In fact, I didn’t trust the app with any credentials for anything — work or personal — at all! Given that I have public data, I decided to store it in a public web folder. AI Studio suggested ways to store data that people might not fully understand, and this is my other reflection: If I’m not a developer, and I don’t know the machinery behind the app, how do I decide? These decisions are risk decisions and “a citizen vibe coder” is very much not equipped to make them. Well, I sure wasn’t.
So what are the security implications of the decisions a developer makes — sometimes guided by AI and sometimes on their own? Can I truly follow an AI recommendation that I don’t understand? Should I follow it? If you don’t understand what happens, I can assure you, you certainly do not understand the risks!
As a result, I did not trust the app with any credentials or authenticated access. Of course, a solution may have been to use throwaway storage with throwaway credentials, but I think I do not need this in my life... Anyhow, many actions that you take during vibe coding, whether suggested by AI or not, have security implications.
In addition, the app interacts with the environment. If the app is being built in a corporate environment, it interacts with corporate security “rules and tools”, and some things you may want to do wouldn’t work. I’m not going into details, but I had a couple of examples of that. If you vibe code at work and you are doing it through, let’s say, shadow AI, there will be things your AI (and you) would want to do, but your employer security would not allow. And often with good reasons too! So you ask AI for more ways and hope it won’t say “just disable the firewall.”
The next conundrum, apart from storage, was output quality. What about quality and those hallucinatory mistakes? Now, I know my app uses an LLM to condense a summary of the podcast transcript into brief insights for social media. And before my app runs, another LLM turns MP3 into text. And it also uses an LLM to make the visual summaries. So, the question is: who handles the mistakes, and how?
For example, I tried to use a certain “well known” model to create a visual summary. Of course, the visual summary was incredibly accurate in most cases, but sometimes “mistakes were made” and words were corrupted (“verifigement” happened to me in one case). If an LLM powered tool can do something, it does not mean it will do it equally well every time (unless you build validators AND the things that you need to do can in fact be validated). So validate!
Further, I read somewhere that the process for dealing with AI mistakes is different from the process for dealing with human mistakes. I am sure I could write another module for the app to check if an image has correct text or add another validation technique, but it is interesting that I faced this very quickly.
Thus I have to deal with “AI-style mistakes”, and I cannot solve them by having a human review everything. I can tell you right away, even from my small project, that having a human review is a non-starter. It’s theoretically correct, but practically won’t happen. It absolutely will not happen if you take the koolaid and transform your business process to be “AI native.” Having humans review boring tasks like checking image text is completely insane. That’s not going to fly. HITL is DOA (for these tasks).
So: storage, credentials, trust, and quality all came up. Another decision arose when I needed to store intermediate results of my insight generation. Again, trust issues surfaced because data storage. AI Studio suggested choices, I asked AI about pros/cons, and made the decision. Again all these decisions are risk decisions.
Finally, certain mistakes come up all the time, repeatedly, and I have to tell AI Studio to write things multiple times because it doesn’t always “get” it (example: my podcast episode URLs). This is another lesson: sometimes it takes multiple prompts, and constant reminders (say to validate the links)
All in all, I’ll continue to experiment — got more ideas that I want. Here are some outputs of my app…
Now the explicit lessons for those who need this crisp and actionable:
1. You Make Implied Security Decisions with Every Prompt
When you “vibe code,” you aren’t just describing features; you are making risk and security decisions. If you ask an AI to “save this data,” and you don’t specify how or where, the AI may choose the path of least resistance — usually a public bucket or a local file with cleartext credentials. In the world of AI-generated code, silence is a security decision.
2. Credentials and Storage: The Boring Stuff is Still the Hard Stuff
Storage and credentials were the key themes for me. This is the great irony of modern development: AI can write a complex LLM orchestration layer in seconds, but it may struggle to help a novice set up a secure, encrypted secrets manager. The “plumbing” of security remains the primary friction point.
3. AI Mistakes Require a New Response Model
Traditional QA seems designed for deterministic human error. AI “style mistakes” (like corrupted words in a visual summary) are stochastic and weird. And common! Human review is a “non-starter” for these tasks. Security and quality validation for AI-generated content must itself be automated (AI-on-AI validation) because humans simply won’t do the “deathly boring” work of checking verbatim accuracy at scale. Turtles all the way down can happen to you.
4. Corporate Guardrails vs. AI Ambition
The AI you vibe code with may not know your corporate policy. It will suggest “awesome” features that would immediately trigger a compliance violation. A few times while vibe coding, I heard a subtle lawyercat meowing in the air duct… When vibe coding in a corporate environment, you quickly hit the wall where “what the AI wants to do” meets “what security allows.” This reinforces the need for platform-level guardrails rather than just merely developer education.
5. Public Data is the Only “Safe” Vibe
My “peace of mind” came from the fact that your inputs and outputs were already public. To me, this is the only way to vibe code safely without a full understanding of the underlying security stack. The moment you move from “public podcast audio” to “proprietary customer data,” the risk model shifts from “fun experiment” to “data breach.”
Anyhow, this was my mildly-AI-assisted stream of vibe consciousness.
This alignment with DESC requirements demonstrates our continued commitment to adhere to the heightened expectations for CSPs. Government customers of AWS can run their applications in AWS Cloud-certified Regions with confidence.
The AWS compliance to the DESC Framework requirements were validated by an independent third-party auditor (BSI) prior to issuance of a renewed certificate by DESC. The updated DESC CSP certificate is available through AWS Artifact, and is valid for one year to January 22, 2027. AWS Artifact is a self-service portal for on-demand access to AWS compliance reports. Sign in to AWS Artifact in the AWS Management Console, or learn more at Getting Started with AWS Artifact.
The certification includes the following 10 additional services in scope, for a total of 108 services:
This is a 10% increase in the number of services in the Middle East (UAE) Region that are in scope of the DESC CSP certification.
AWS strives to continuously bring services into the scope of its compliance programs to help you meet your architectural and regulatory needs. You can view the current list of services in scope on our Services in Scope page. You can also reach out to your AWS account team if you have any questions or feedback about DESC compliance.
To learn more about our compliance and security programs, see AWS Compliance Programs. As always, we value your feedback and questions; reach out to the AWS Compliance team through the Contact Us page.
If you have feedback about this post, submit comments in the Comments section below
Shortly after the first set of explosions, Iranians received bursts of notifications on their phones. They came not from the government advising caution, but from an apparently hacked prayer-timing app called BadeSaba Calendar that has been downloaded more than 5 million times from the Google Play Store.
The messages arrived in quick succession over a period of 30 minutes, starting with the phrase ‘Help has arrived’ at 9:52 am Tehran time, shortly after the first set of explosions. No party has claimed responsibility for the hacks.
It happened so fast that this is most likely a government operation. I can easily envision both the US and Israel having hacked the app previously, and then deciding that this is a good use of that access.
One email was all it took. An employee clicked what looked like a routine sign‑in request. Behind the scenes, attackers swiped credentials, slipped past security controls, impersonated a trusted user, and gained access to critical systems. In other cases, similar intrusions delayed paychecks, rerouted invoices, stole sensitive data, locked up entire networks, interrupted patient care, and strained already tight budgets at schools and critical services.
Those attacks were powered by Tycoon 2FA. Today, Microsoft, Europol, and industry partners announced a coordinated action to disrupt the service responsible for tens of millions of fraudulent emails reaching over 500,000 organizations each month worldwide.
Disrupting a global phishing operation
Active since at least 2023, Tycoon 2FA enabled thousands of cybercriminals to impersonate real users and gain unauthorized access to email and online service accounts, including Microsoft 365, Outlook, and Gmail. Unlike traditional phishing kits, Tycoon 2FA was designed to defeat additional security protections, including multifactor authentication, allowing cybercriminals to log in as legitimate users without triggering alerts, even on protected accounts.
Acting under a court order from the U.S. District Court for the Southern District of New York, and for the first time in coordination with Europol’s Cyber Intelligence Extension Programme (CIEP), Microsoft seized 330 active domains that powered Tycoon 2FA’s core infrastructure, including control panels and fraudulent login pages. The CIEP framework brought public‑ and private‑sector partners together to move from simply sharing intelligence to coordinated, cross‑border action, accelerating disruption and limiting further harm.
Taking this infrastructure offline cuts off a major pipeline for account takeovers and helps protect people and organizations from follow‑on attacks such as data theft, ransomware, business email compromise, and financial fraud.
The scale and real‑world impact of Tycoon 2FA
By mid‑2025, Tycoon 2FA accounted for approximately 62 percent of all phishing attempts Microsoft blocked, including more than 30 million emails in a single month. That placed Tycoon 2FA among the largest phishing operations globally.
Despite extensive defenses, the service is linked to an estimated 96,000 distinct phishing victims worldwide since 2023, including more than 55,000 Microsoft customers.
Healthcare and education organizations were hit hardest. More than 100 members of Health‑ISAC, a global threat-sharing group for the health sector and a co-plaintiff in this case, were successfully phished. In New York alone, at least two hospitals, six municipal schools, and three universities faced attempted or successful compromise through Tycoon 2FA. These incidents had tangible consequences: disrupted operations, diverted resources, and delayed patient care.
Why Tycoon 2FA was so dangerous
Tycoon 2FA combined convincing phishing templates, realistic landing pages, and real‑time capture of credentials and authentication codes into an easy‑to‑use package that scaled quickly. By lowering the technical barrier to entry, it allowed criminals with limited expertise to run sophisticated impersonation campaigns.
With each successful phishing victim, attackers could operate with the same level of trust as legitimate users moving laterally across systems, accessing sensitive data, and abusing sign‑on connections without raising alarms. Research from Microsoft Threat Intelligence provides more details on how Tycoon 2FA operated.
The Tycoon 2FA customer dashboard.
This shift reflects a broader trend in cybercrime: identity, not infrastructure, has become the primary target. A single compromised account can now unlock banking systems, healthcare portals, workplace applications, and social media accounts.
Inside the impersonation economy
Tycoon 2FA operated like a business within the broader impersonation‑for‑hire ecosystem. The primary developer, Saad Fridi, who is believed to be based in Pakistan, worked alongside partners responsible for marketing, payments, and technical support.
Cybercriminals typically used Tycoon 2FA alongside other illicit services. While Tycoon 2FA captured credentials and session tokens, other services handled mass email delivery, malware distribution, hosting, and access monetization. For example, RedVDS, disrupted by Microsoft in January 2026, provided inexpensive virtual computers, which cybercriminals paired with Tycoon 2FA to deliver phishing campaigns. Together, these different services created an interconnected ecosystem for identity‑based attacks. Disrupting one component can have cascading effects across the cybercrime economy.
Sustained pressure reshapes the market
Over the past 18 months, Microsoft’s Digital Crimes Unit has targeted multiple services that enable impersonation and initial access, including extensive disruption operations of Lumma Stealer, RaccoonO365, Fake ONNX (aka “Caffeine”), and RedVDS.
When widely used tools are disrupted, attackers are forced to adapt, often shifting to alternatives like Tycoon 2FA. This substitution pattern shows how sustained pressure prevents any single service from remaining dominant while steadily raising the cost and risk of cybercrime.
These efforts have led to arrests in Egypt and Nigeria, complete service shutdowns, infrastructure loss, and reputational damage for operators beyond law‑enforcement reach. RedVDS alone lost more than 95 percent of its infrastructure since January 2026, significantly degrading its ability to support mass impersonation campaigns and other online scams.
As pressure increased, many operators tightened access controls, retreated into closed channels, or shut down entirely to avoid legal action. In Tycoon 2FA’s case, Microsoft could not purchase access to the service; the operator rejected attempts by our investigators, requiring a trusted intermediary. In fact, Tycoon 2FA’s operator and the now‑arrested developer of RaccoonO365 communicated with one another, highlighting the ecosystem’s interdependence and how disruptions in one area influence activity elsewhere.
Correspondence suggesting interactions between the operators of RaccoonO365 and Tycoon 2FA.
Global threats require global action
Cybercrime operates across borders, and effective response must do the same. Disrupting Tycoon 2FA spanned multiple jurisdictions, underscoring why sustained, coordinated pressure is essential, especially as cybercrime becomes more scalable through automation and AI.
Microsoft Threat Intelligence, joining many security researchers, identified Tycoon 2FA as one of the most significant threats to identity-based attacks. Microsoft’s Digital Crimes Unit consulted with Europol, which also tracked the actor based on intelligence supplied by TrendAI. Through the CIEP, Europol convened partners to take action. Microsoft worked with industry partners to pursue a coordinated infrastructure disruption, while law enforcement authorities in Latvia, Lithuania, Portugal, Poland, Spain, and the United Kingdom conducted seizures of infrastructure and carried out other operational measures linked to Tycoon 2FA.
Industry partners, including Proofpoint, Intel 471, and eSentire, expanded visibility through telemetry, threat intelligence, and criminal‑forum insight. Cloudflare assisted by taking down infrastructure outside U.S. jurisdiction, while Health‑ISAC quantified impacts on healthcare organizations. SpyCloud contributed key victimology data, Resecurity facilitated access to Tycoon 2FA, and Coinbasehelped trace the movement of stolen funds. Finally, the Shadowserver Foundation supported notifications to more than 200 computer emergency response teams worldwide, helping limit further harm.
No single organization could have assembled this full picture alone.
Splash page appearing on seized domains.
Sustaining pressure, together
Stopping identity‑based cybercrime requires action across individuals, organizations, and governments. Multifactor authentication, scrutiny of unexpected messages, strong session controls, and coordinated threat‑sharing all reduce risk. Early enforcement matters too; it prevents small intrusions from escalating into systemic harm.Microsoft will continue applying the lessons learned from Tycoon 2FA and prior disruptions to fragment the impersonation economy, limit scale, and make cybercrime riskier and less profitable.
The Swiss Financial Market Supervisory Authority (FINMA) has published several requirements and guidelines about engaging with outsourced services for the regulated financial services customers in Switzerland.
An independent third-party audit firm issued the report to assure customers that the AWS control environment is appropriately designed and operating effectively to support of adherence with FINMA requirements.
The latest report covers the 12-month period from October 1, 2024 to September 30, 2025 for the following circulars:
2018/03 Outsourcing – banks, insurance companies and selected financial institutions under FinIA
2023/01 Operational risks and resilience – banks
Business Continuity Management (BCM) minimum standards proposed by the Swiss Insurance Association.
AWS has added the following five services to the current FINMA scope:
Customers can find the FINMA ISAE 3000 report on AWS Artifact. AWS Artifact is a self-service portal for on-demand access to AWS compliance reports. Sign in to AWS Artifact in the AWS Management Console, or learn more at Getting Started with AWS Artifact. Security and compliance is a shared responsibility between AWS and the customer. When customers move their computer systems and data to the cloud, security responsibilities are shared between the customer and the cloud service provider. For more information, see the AWS Shared Security Responsibility Model.
To learn more about our compliance and security programs, see AWS Compliance Programs. As always, we value your feedback and questions; reach out to the AWS Compliance team through the Contact Us page.
If you have feedback about this post, submit comments in the Comments section below
The Finnish Transport and Communications Agency (Traficom) Cyber Security Centre published PiTuKri, which consists of 52 criteria that provide guidance across 11 domains for assessing the security of cloud service providers.
An independent third-party audit firm issued the report to assure customers that the AWS control environment is appropriately designed and operating effectively to demonstrate adherence with PiTuKri requirements. This attestation demonstrates the AWS commitment to meet security expectations for cloud service providers set by Traficom.
The latest report covers a 12-month period from October 1, 2024 to September 30, 2025. AWS has added the following five services to the current PiTuKri scope:
Security and compliance is a shared responsibility between AWS and the customer. When customers move their computer systems and data to the cloud, security responsibilities are shared between the customer and the cloud service provider. For more information, see the AWS Shared Security Responsibility Model.
To learn more about our compliance and security programs, see AWS Compliance Programs. As always, we value your feedback and questions; reach out to the AWS Compliance team through the Contact Us page.
If you have feedback about this post, submit comments in the Comments section below
In a recent evaluation of AI models’ cyber capabilities, current Claude models can now succeed at multistage attacks on networks with dozens of hosts using only standard, open-source tools, instead of the custom tools needed by previous generations. This illustrates how barriers to the use of AI in relatively autonomous cyber workflows are rapidly coming down, and highlights the importance of security fundamentals like promptly patching known vulnerabilities.
[…]
A notable development during the testing of Claude Sonnet 4.5 is that the model can now succeed on a minority of the networks without the custom cyber toolkit needed by previous generations. In particular, Sonnet 4.5 can now exfiltrate all of the (simulated) personal information in a high-fidelity simulation of the Equifax data breach—one of the costliest cyber attacks in historyusing only a Bash shell on a widely-available Kali Linux host (standard, open-source tools for penetration testing; not a custom toolkit). Sonnet 4.5 accomplishes this by instantly recognizing a publicized CVE and writing code to exploit it without needing to look it up or iterate on it. Recalling that the original Equifax breach happened by exploiting a publicized CVE that had not yet been patched, the prospect of highly competent and fast AI agents leveraging this approach underscores the pressing need for security best practices like prompt updates and patches.
AI models are getting better at this faster than I expected. This will be a major power shift in cybersecurity.
In a recent evaluation of AI models’ cyber capabilities, current Claude models can now succeed at multistage attacks on networks with dozens of hosts using only standard, open-source tools, instead of the custom tools needed by previous generations. This illustrates how barriers to the use of AI in relatively autonomous cyber workflows are rapidly coming down, and highlights the importance of security fundamentals like promptly patching known vulnerabilities.
[…]
A notable development during the testing of Claude Sonnet 4.5 is that the model can now succeed on a minority of the networks without the custom cyber toolkit needed by previous generations. In particular, Sonnet 4.5 can now exfiltrate all of the (simulated) personal information in a high-fidelity simulation of the Equifax data breach—one of the costliest cyber attacks in history—using only a Bash shell on a widely-available Kali Linux host (standard, open-source tools for penetration testing; not a custom toolkit). Sonnet 4.5 accomplishes this by instantly recognizing a publicized CVE and writing code to exploit it without needing to look it up or iterate on it. Recalling that the original Equifax breach happened by exploiting a publicized CVE that had not yet been patched, the prospect of highly competent and fast AI agents leveraging this approach underscores the pressing need for security best practices like prompt updates and patches.
Read the whole thing. Automatic exploitation will be a major change in cybersecurity. And things are happening fast. There have been significant developments since I wrote this in October.
Why the GSA OneGov Agreement Is a Game-Changer for Federal Cybersecurity
The mission to modernize government IT is accelerating at lightning speed, largely thanks to the transformative power of artificial intelligence (AI). Federal agencies are strategically leveraging AI to boost efficiency, enhance citizen services, and strengthen national security – a vision fully supported by the administration’s AI Action Plan.
At Palo Alto Networks, we are all-in on helping agencies deploy AI bravely and securely. Because the challenge isn't just about using AI for cyberdefense, but also about defending AI itself. We appreciate the U.S. General Services Administration (GSA) recognizing the critical need for scalable, efficient solutions.
That is precisely why the GSA OneGov Initiative is a massive, game-changing step forward. We are proud to be the first pure-play cybersecurity vendor to secure a OneGov agreement with the GSA. This strategic alliance simplifies and standardizes the process for agencies to access our world-class, AI-powered security platform, ensuring security is foundational to this crucial modernization mission.
The Wake-Up Call: The Silent Threat of AI Agent Corruption
If you needed a clear sign that AI has fundamentally shifted the cybersecurity landscape, our own Unit 42 research provides it. The new reality isn't just about hackers using AI in their attacks; it’s also about how internal AI provides another attack surface for threat actors.
The most insidious new threat we've observed is AI Agent Smuggling, where malicious attackers use AI agents to exploit other agents. Our Unit 42 research highlights two major vectors:
Indirect Prompt Injection: A security risk in LLMs where a user crafts input containing deceptive instructions to manipulate the model’s behavior, which can lead to unauthorized data access or unintended actions.
Agent Session Smuggling: Exploit vulnerabilities in agent-to-agent communication, injecting malicious instructions into a conversation, hiding them among otherwise benign client requests and server responses.
This confirms our core belief as stated in a recent secure AI by Design blog: The AI ecosystem (the models, data and infrastructure) is now a complex, expanding attack surface that traditional perimeter defenses were simply not designed to protect.
As I’ve said before, “If you’re deploying AI, you must deploy AI security.”
Secure AI by Design: A Strategic Alliance with GSA
The GSA’s OneGov Initiative aims to streamline procurement and drive down costs by leveraging the purchasing power of the entire federal government. This is more than an agreement; it’s a direct response to the call for a "secure-by-design" approach to federal AI adoption. This agreement simplifies and standardizes the process for agencies to access our world-class, AI-powered security platform, ensuring that security is foundational, not an afterthought. It provides industry leading AI security tools into the hands of our cyber defenders today.
Under the Hood: Technical Capabilities for the AI Ecosystem
To counter the autonomous threats we’re seeing, we provide a platform that protects the entire AI lifecycle, from the developer's keyboard to the data center.
1. Runtime Protection for AI Workloads
Securing the AI supply chain requires visibility across every stage, especially during runtime when models are processing sensitive data.
Prisma® AIRSdelivers comprehensive security for the entire AI lifecycle, in one unified platform. It allows organizations to deploy traditional apps as well as AI applications, models and agents with confidence by reducing risk from misuse, data loss and sophisticated AI-driven threats. Prisma AIRS provides a clear, connected view of assets in multicloud environments, so teams can eliminate silos, accelerate responses, as well as scale cloud and AI apps securely.
Our Cloud-Native Application Protection Platform (CNAPP) has achieved the FedRAMP High designation, making it the preferred Code to Cloud solution to secure the entire application lifecycle from development to runtime. Our industry-leading CNAPP eliminates silos to deliver comprehensive visibility and best-in-class protection across multicloud environments.
2. Protecting Users and Data at the Edge
Even the most advanced AI defenses are undermined if users accessing applications and data are left vulnerable outside corporate security boundaries. The explosive growth of generative AI tools and the unseen behavior of AI agents are amplifying data exposure risks.
Prisma SASE (secure access service edge) secures all users, apps, devices and data, no matter where they are and no matter where applications reside.
Prisma Access (FedRAMP High Authorized) and Prisma Browser(FedRAMP-Moderate Authorized) integrate security capabilities, like zero trust network access (ZTNA), secure web gateway (SWG) and cloud access security broker (CASB), to provide a unified policy framework and a consistent user experience.
This approach helps agencies outpace the speed of AI-driven threats, safeguarding critical data and simplifying operations for a frictionless user experience. It ensures that the human element interacting with the AI is protected by the most stringent security controls available.
Deploy AI Bravely
The GSA OneGov agreement is a pivotal moment that provides federal agencies with the cost-effective, streamlined access they need to deploy AI with confidence. By leveraging our unified, AI-powered platform, government organizations can stop reacting to threats and start building secure-by-design AI environments. We are committed to remaining a key partner in this strategic initiative and helping the government achieve its mission outcomes safely.
For more information and access to promotional offers for new contracts signed on or before January 31, 2028, federal agencies can visit the GSA OneGov website.
Strengthening Cyber Resilience Across Northern Europe
Across Northern Europe, organizations are redefining how they work, innovate and compete. From the Netherlands’ smart logistics hubs to Finland’s AI-driven public services and the UK’s digital-first financial sector, this region is setting the global pace for responsible, data-driven transformation.
Yet behind this progress lies a growing challenge: security complexity.
According to the IBM Institute for Business Value (IBV), the average enterprise now manages 83 security tools from 29 vendors, leading to fragmented visibility, slower responses and rising risk exposure. In contrast, 96% of organizations that have unified their security platforms say they now view cybersecurity as a driver of business value, not a barrier to it.
That’s where the IBM and Palo Alto Networks partnership is making an impact. Together they are helping Northern European enterprises simplify, secure and accelerate their digital transformation with unified, AI-powered cybersecurity.
From Fragmented Tools to an Integrated Security Foundation
Northern Europe’s strength lies in its strong culture of trust and transparency, advanced digital infrastructure, as well as progressive regulatory frameworks. But as the EU NIS2 Directive, DORA and the AI Act come into force, achieving both compliance and cyber resilience require board-level oversight.
IBM and Palo Alto Networks are helping organizations lead this change. They combine IBM’s deep consulting and industry expertise with Palo Alto Networks market-leading security platforms and solutions, including Cortex XSIAM®, Cortex® Cloud™ and Prisma® Access. This integrated approach protects innovation, enables compliance efforts, and enhances operational efficiency.
The partnership not only secures organizational estates, but empowers faster decision-making, measurable ROI and sustainable transformation.
Five Capabilities Powering Secure Transformation
Organizations want to strengthen cyber resilience without slowing innovation. IBM and Palo Alto Networks help them do just that, through five connected capabilities that turn complex challenges into measurable outcomes.
1. Unified Security Platform: Simplify and See More
The Challenge: Too many tools, too little visibility.
The Reality: Most enterprises run more than 80 security tools from nearly 30 vendors.
By consolidating with IBM’s unified security approach and the Palo Alto Networks platforms, organizations are cutting total product costs by up to 19.4% and gaining a single, trusted view of their security posture.
The Outcome: Streamlined operations, faster decision-making and improved compliance enablement for frameworks like NIS2, all while reducing the energy footprint of sprawling infrastructure.
2. Cloud Security: Innovate Without the Risk
The Challenge: Cloud transformation introduces new risks and blind spots.
The Reality: 82% of breaches now involve cloud data, and nearly 40% span multiple environments.
IBM and Palo Alto Networks secure the journey from code to cloud to SOC, embedding security early in design and automating protection across environments. IBM’s AI deployment accelerators slash rollout time, while Cortex Cloud™ provides continuous visibility and compliance enablement.
The Outcome: Faster innovation with cloud operations that are secure by design, from day one.
3. Security for AI: Build Trust in Every Algorithm
The Challenge: Rapid AI adoption without consistent oversight.
The Reality: 82% of executives say trustworthy AI is critical to success, yet few have the controls in place.
IBM and Palo Alto Networks help organizations govern and protect their use of AI, securing data pipelines, scanning models and preventing adversarial attacks.
The Outcome: Confident AI adoption aligned to the EU AI Act requirements, where innovation can move forward without compromising data integrity or customer trust.
4. Security Service Edge (SSE): Connect People Securely, Anywhere
The Challenge: Hybrid work models demand reliable secure access everywhere.
The Reality: Human risk, not technology alone, is now the dominant factor in breaches, with 95% of data breaches involving human error, such as insider missteps, credential misuse and careless actions, underscoring how remote and hybrid workers’ behaviors significantly expand exposure.
With Palo Alto Networks Prisma Access and IBM’s consulting expertise, enterprises across Europe are simplifying secure connectivity through a unified zero trust framework.
The Outcome: Simpler, more efficient policy management and stronger protection across hybrid environments, where risk exposure is reduced, visibility is enhanced, and a seamless user experience is delivered.
The Challenge: SOC teams are overwhelmed, missing as many as two thirds of daily alerts due to alert fatigue and limited resources.
The Reality: Over half of organizations report they can’t hire or retain enough skilled analysts, leaving gaps in coverage and consistency.
By combining IBM’s Autonomous Threat Operations Machine (ATOM) with Palo Alto Networks Cortex XSIAM, organizations can streamline and automate core SOC workflows, reducing response times by more than half and enabling analysts to focus on the most critical incidents.
The Outcome: Faster detection, shorter resolution times and a more proactive, resilient security posture. AI-driven automation not only boosts accuracy but can also shorten breach lifecycles by more than 100 days, helping teams defend smarter.
Built for Northern Europe’s Next Decade of Growth
As Northern Europe is a leader in digital innovation, the stakes for cybersecurity have never been higher. Trust, transparency and compliance are not simply checkboxes, but are competitive advantages.
IBM and Palo Alto Networks are helping organizations across the region turn that reality into action. By uniting AI-powered automation, cloud-native security and deep industry expertise, they’re enabling enterprises to move faster, reduce complexity and strengthen resilience. This is achieved while enabling alignment with the region’s evolving frameworks, such as NIS2, DORA and the EU AI Act.
To stay ahead, security can no longer be a fragmented layer sitting outside transformation; it must be the foundation that powers it. With IBM and Palo Alto Networks, organizations gain a unified security platform built for the next decade of digital progress – one that protects every connection, every line of code and every moment of innovation.
Resilient. Compliant. Unified.
That’s the future of cybersecurity in Northern Europe.
A SIEM is a complex system offering broad and flexible threat detection capabilities. Due to its complexity, its effectiveness heavily depends on how it is configured and what data sources are connected to it. A one-time SIEM setup during implementation is not enough: both the organization’s infrastructure and attackers’ techniques evolve over time. To operate effectively, the SIEM system must reflect the current state of affairs.
We provide customers with services to assess SIEM effectiveness, helping to identify issues and offering options for system optimization. In this article, we examine typical SIEM operational pitfalls and how to address them. For each case, we also include methods for independent verification.
This material is based on an assessment of Kaspersky SIEM effectiveness; therefore, all specific examples, commands, and field names are taken from that solution. However, the assessment methodology, issues we identified, and ways to enhance system effectiveness can easily be extrapolated to any other SIEM.
Methodology for assessing SIEM effectiveness
The primary audience for the effectiveness assessment report comprises the SIEM support and operation teams within an organization. The main goal is to analyze how well the usage of SIEM aligns with its objectives. Consequently, the scope of checks can vary depending on the stated goals. A standard assessment is conducted across the following areas:
Composition and scope of connected data sources
Coverage of data sources
Data flows from existing sources
Correctness of data normalization
Detection logic operability
Detection logic accuracy
Detection logic coverage
Use of contextual data
SIEM technical integration into SOC processes
SOC analysts’ handling of alerts in the SIEM
Forwarding of alerts, security event data, and incident information to other systems
Deployment architecture and documentation
At the same time, these areas are examined not only in isolation but also in terms of their potential influence on one another. Here are a couple of examples illustrating this interdependence:
Issues with detection logic due to incorrect data normalization. A correlation rule with the condition deviceCustomString1 not contains <string> triggers a large number of alerts. The detection logic itself is correct: the specific event and the specific field it targets should not generate a large volume of data matching the condition. Our review revealed the issue was in the data ingested by the SIEM, where incorrect encoding caused the string targeted by the rule to be transformed into a different one. Consequently, all events matched the condition and generated alerts.
When analyzing coverage for a specific source type, we discovered that the SIEM was only monitoring 5% of all such sources deployed in the infrastructure. However, extending that coverage would increase system load and storage requirements. Therefore, besides connecting additional sources, it would be necessary to scale resources for specific modules (storage, collectors, or the correlator).
The effectiveness assessment consists of several stages:
Collect and analyze documentation, if available. This allows assessing SIEM objectives, implementation settings (ideally, the deployment settings at the time of the assessment), associated processes, and so on.
Interview system engineers, analysts, and administrators. This allows assessing current tasks and the most pressing issues, as well as determining exactly how the SIEM is being operated. Interviews are typically broken down into two phases: an introductory interview, conducted at project start to gather general information, and a follow-up interview, conducted mid-project to discuss questions arising from the analysis of previously collected data.
Gather information within the SIEM and then analyze it. This is the most extensive part of the assessment, during which Kaspersky experts are granted read-only access to the system or a part of it to collect factual data on its configuration, detection logic, data flows, and so on.
The assessment produces a list of recommendations. Some of these can be implemented almost immediately, while others require more comprehensive changes driven by process optimization or a transition to a more structured approach to system use.
Issues arising from SIEM operations
The problems we identify during a SIEM effectiveness assessment can be divided into three groups:
Performance issues, meaning operational errors in various system components. These problems are typically resolved by technical support, but to prevent them, it is worth periodically checking system health status.
Efficiency issues – when the system functions normally but seemingly adds little value or is not used to its full potential. This is usually due to the customer using the system capabilities in a limited way, incorrectly, or not as intended by the developer.
Detection issues – when the SIEM is operational and continuously evolving according to defined processes and approaches, but alerts are mostly false positives, and the system misses incidents. For the most part, these problems are related to the approach taken in developing detection logic.
Key observations from the assessment
Event source inventory
When building the inventory of event sources for a SIEM, we follow the principle of layered monitoring: the system should have information about all detectable stages of an attack. This principle enables the detection of attacks even if individual malicious actions have gone unnoticed, and allows for retrospective reconstruction of the full attack chain, starting from the attackers’ point of entry.
Problem: During effectiveness assessments, we frequently find that the inventory of connected source types is not updated when the infrastructure changes. In some cases, it has not been updated since the initial SIEM deployment, which limits incident detection capabilities. Consequently, certain types of sources remain completely invisible to the system.
We have also encountered non-standard cases of incomplete source inventory. For example, an infrastructure contains hosts running both Windows and Linux, but monitoring is configured for only one family of operating systems.
How to detect: To identify the problems described above, determine the list of source types connected to the SIEM and compare it against what actually exists in the infrastructure. Identifying the presence of specific systems in the infrastructure requires an audit. However, this task is one of the most critical for many areas of cybersecurity, and we recommend running it on a periodic basis.
We have compiled a reference sheet of system types commonly found in most organizations. Depending on the organization type, infrastructure, and threat model, we may rearrange priorities. However, a good starting point is as follows:
High Priority – sources associated with:
Remote access provision
External services accessible from the internet
External perimeter
Endpoint operating systems
Information security tools
Medium Priority – sources associated with:
Remote access management within the perimeter
Internal network communication
Infrastructure availability
Virtualization and cloud solutions
Low Priority – sources associated with:
Business applications
Internal IT services
Applications used by various specialized teams (HR, Development, PR, IT, and so on)
Monitoring data flow from sources
Regardless of how good the detection logic is, it cannot function without telemetry from the data sources.
Problem: The SIEM core is not receiving events from specific sources or collectors. Based on all assessments conducted, the average proportion of collectors that are configured with sources but are not transmitting events is 38%. Correlation rules may exist for these sources, but they will, of course, never trigger. It is also important to remember that a single collector can serve hundreds of sources (such as workstations), so the loss of data flow from even one collector can mean losing monitoring visibility for a significant portion of the infrastructure.
How to detect: The process of locating sources that are not transmitting data can be broken down into two components.
Checking collector health. Find the status of collectors (see the support website for the steps to do this in Kaspersky SIEM) and identify those with a status of Offline, Stopped, Disabled, and so on.
Checking the event flow. In Kaspersky SIEM, this can be done by gathering statistics using the following query (counting the number of events received from each collector over a specific time period):
SELECT count(ID), CollectorID, CollectorName FROM `events` GROUP BY CollectorID, CollectorName ORDER BY count(ID)
It is essential to specify an optimal time range for collecting these statistics. Too large a range can increase the load on the SIEM, while too small a range may provide inaccurate information for a one-time check – especially for sources that transmit telemetry relatively infrequently, say, once a week. Therefore, it is advisable to choose a smaller time window, such as 2–4 days, but run several queries for different periods in the past.
Additionally, for a more comprehensive approach, it is recommended to use built-in functionality or custom logic implemented via correlation rules and lists to monitor event flow. This will help automate the process of detecting problems with sources.
Event source coverage
Problem: The system is not receiving events from all sources of a particular type that exist in the infrastructure. For example, the company uses workstations and servers running Windows. During SIEM deployment, workstations are immediately connected for monitoring, while the server segment is postponed for one reason or another. As a result, the SIEM receives events from Windows systems, the flow is normalized, and correlation rules work, but an incident in the unmonitored server segment would go unnoticed.
How to detect: Below are query variations that can be used to search for unconnected sources.
SELECT count(distinct, DeviceAddress), DeviceVendor, DeviceProduct FROM events GROUP BY DeviceVendor, DeviceProduct ORDER BY count(ID)
SELECT count(distinct, DeviceHostName), DeviceVendor, DeviceProduct FROM events GROUP BY DeviceVendor, DeviceProduct ORDER BY count(ID)
We have split the query into two variations because, depending on the source and the DNS integration settings, some events may contain either a DeviceAddress or DeviceHostName field.
These queries will help determine the number of unique data sources sending logs of a specific type. This count must be compared against the actual number of sources of that type, obtained from the system owners.
Retaining raw data
Raw data can be useful for developing custom normalizers or for storing events not used in correlation that might be needed during incident investigation. However, careless use of this setting can cause significantly more harm than good.
Problem: Enabling the Keep raw event option effectively doubles the event size in the database, as it stores two copies: the original and the normalized version. This is particularly critical for high-volume collectors receiving events from sources like NetFlow, DNS, firewalls, and others. It is worth noting that this option is typically used for testing a normalizer but is often forgotten and left enabled after its configuration is complete.
How to detect: This option is applied at the normalizer level. Therefore, it is necessary to review all active normalizers and determine whether retaining raw data is required for their operation.
Normalization
As with the absence of events from sources, normalization issues lead to detection logic failing, as this logic relies on finding specific information in a specific event field.
Problem: Several issues related to normalization can be identified:
The event flow is not being normalized at all.
Events are only partially normalized – this is particularly relevant for custom, non-out-of-the-box normalizers.
The normalizer being used only parses headers, such as syslog_headers, placing the entire event body into a single field, this field most often being Message.
An outdated default normalizer is being used.
How to detect: Identifying normalization issues is more challenging than spotting source problems due to the high volume of telemetry and variety of parsers. Here are several approaches to narrowing the search:
First, check which normalizers supplied with the SIEM the organization uses and whether their versions are up to date. In our assessments, we frequently encounter auditd events being normalized by the outdated normalizer, Linux audit and iptables syslog v2 for Kaspersky SIEM. The new normalizer completely reworks and optimizes the normalization schema for events from this source.
Execute the query:
SELECT count(ID), DeviceProduct, DeviceVendor, CollectorName FROM `events` GROUP BY DeviceProduct, DeviceVendor, CollectorName ORDER BY count(ID)
This query gathers statistics on events from each collector, broken down by the DeviceVendor and DeviceProduct fields. While these fields are not mandatory, they are present in almost any normalization schema. Therefore, their complete absence or empty values may indicate normalization issues. We recommend including these fields when developing custom normalizers.
To simplify the identification of normalization problems when developing custom normalizers, you can implement the following mechanism. For each successfully normalized event, add a Name field, populated from a constant or the event itself. For a final catch-all normalizer that processes all unparsed events, set the constant value: Name = unparsed event. This will later allow you to identify non-normalized events through a simple search on this field.
Detection logic coverage
Collected events alone are, in most cases, only useful for investigating an incident that has already been identified. For a SIEM to operate to its full potential, it requires detection logic to be developed to uncover probable security incidents.
Problem: The mean correlation rule coverage of sources, determined across all our assessments, is 43%. While this figure is only a ballpark figure – as different source types provide different information – to calculate it, we defined “coverage” as the presence of at least one correlation rule for a source. This means that for more than half of the connected sources, the SIEM is not actively detecting. Meanwhile, effort and SIEM resources are spent on connecting, maintaining, and configuring these sources. In some cases, this is formally justified, for instance, if logs are only needed for regulatory compliance. However, this is an exception rather than the rule.
We do not recommend solving this problem by simply not connecting sources to the SIEM. On the contrary, sources should be connected, but this should be done concurrently with the development of corresponding detection logic. Otherwise, it can be forgotten or postponed indefinitely, while the source pointlessly consumes system resources.
How to detect: This brings us back to auditing, a process that can be greatly aided by creating and maintaining a register of developed detection logic. Given that not every detection logic rule explicitly states the source type from which it expects telemetry, its description should be added to this register during the development phase.
If descriptions of the correlation rules are not available, you can refer to the following:
The name of the detection logic. With a standardized approach to naming correlation rules, the name can indicate the associated source or at least provide a brief description of what it detects.
The use of fields within the rules, such as DeviceVendor, DeviceProduct (another argument for including these fields in the normalizer), Name, DeviceAction, DeviceEventCategory, DeviceEventClassID, and others. These can help identify the actual source.
Excessive alerts generated by the detection logic
One criterion for correlation rules effectiveness is a low false positive rate.
Problem: Detection logic generates an abnormally high number of alerts that are physically impossible to process, regardless of the size of the SOC team.
How to detect: First and foremost, detection logic should be tested during development and refined to achieve an acceptable false positive rate. However, even a well-tuned correlation rule can start producing excessive alerts due to changes in the event flow or connected infrastructure. To identify these rules, we recommend periodically running the following query:
SELECT count(ID), Name FROM `events` WHERE Type = 3 GROUP BY Name ORDER BY count(ID)
In Kaspersky SIEM, a value of 3 in the Type field indicates a correlation event.
Subsequently, for each identified rule with an anomalous alert count, verify the correctness of the logic it uses and the integrity of the event stream on which it triggered.
Depending on the issue you identify, the solution may involve modifying the detection logic, adding exceptions (for example, it is often the case that 99% of the spam originates from just 1–5 specific objects, such as an IP address, a command parameter, or a URL), or adjusting event collection and normalization.
Lack of integration with indicators of compromise
SIEM integrations with other systems are generally a critical part of both event processing and alert enrichment. In at least one specific case, their presence directly impacts detection performance: integration with technical Threat Intelligence data or IoCs (indicators of compromise).
A SIEM allows conveniently checking objects against various reputation databases or blocklists. Furthermore, there are numerous sources of this data that are ready to integrate natively with a SIEM or require minimal effort to incorporate.
Problem: There is no integration with TI data.
How to detect: Generally, IoCs are integrated into a SIEM at the system configuration level during deployment or subsequent optimization. The use of TI within a SIEM can be implemented at various levels:
At the data source level. Some sources, such as NGFWs, add this information to events involving relevant objects.
At the SIEM native functionality level. For example, Kaspersky SIEM integrates with CyberTrace indicators, which add object reputation information at the moment of processing an event from a source.
At the detection logic level. Information about IoCs is stored in various active lists, and correlation rules match objects against these to enrich the event.
Furthermore, TI data does not appear in a SIEM out of thin air. It is either provided by external suppliers (commercially or in an open format) or is part of the built-in functionality of the security tools in use. For instance, various NGFW systems can additionally check the reputation of external IP addresses or domains that users are accessing. Therefore, the first step is to determine whether you are receiving information about indicators of compromise and in what form (whether external providers’ feeds have been integrated and/or the deployed security tools have this capability). It is worth noting that receiving TI data only at the security tool level does not always cover all types of IoCs.
If data is being received in some form, the next step is to verify that the SIEM is utilizing it. For TI-related events coming from security tools, the SIEM needs a correlation rule developed to generate alerts. Thus, checking integration in this case involves determining the capabilities of the security tools, searching for the corresponding events in the SIEM, and identifying whether there is detection logic associated with these events. If events from the security tools are absent, the source audit configuration should be assessed to see if the telemetry type in question is being forwarded to the SIEM at all. If normalization is the issue, you should assess parsing accuracy and reconfigure the normalizer.
If TI data comes from external providers, determine how it is processed within the organization. Is there a centralized system for aggregating and managing threat data (such as CyberTrace), or is the information stored in, say, CSV files?
In the former case (there is a threat data aggregation and management system) you must check if it is integrated with the SIEM. For Kaspersky SIEM and CyberTrace, this integration is handled through the SIEM interface. Following this, SIEM event flows are directed to the threat data aggregation and management system, where matches are identified and alerts are generated, and then both are sent back to the SIEM. Therefore, checking the integration involves ensuring that all collectors receiving events that may contain IoCs are forwarding those events to the threat data aggregation and management system. We also recommend checking if the SIEM has a correlation rule that generates an alert based on matching detected objects with IoCs.
In the latter case (threat information is stored in files), you must confirm that the SIEM has a collector and normalizer configured to load this data into the system as events. Also, verify that logic is configured for storing this data within the SIEM for use in correlation. This is typically done with the help of lists that contain the obtained IoCs. Finally, check if a correlation rule exists that compares the event flow against these IoC lists.
As the examples illustrate, integration with TI in standard scenarios ultimately boils down to developing a final correlation rule that triggers an alert upon detecting a match with known IoCs. Given the variety of integration methods, creating and providing a universal out-of-the-box rule is difficult. Therefore, in most cases, to ensure IoCs are connected to the SIEM, you need to determine if the company has developed that rule (the existence of the rule) and if it has been correctly configured. If no correlation rule exists in the system, we recommend creating one based on the TI integration methods implemented in your infrastructure. If a rule does exist, its functionality must be verified: if there are no alerts from it, analyze its trigger conditions against the event data visible in the SIEM and adjust it accordingly.
The SIEM is not kept up to date
For a SIEM to run effectively, it must contain current data about the infrastructure it monitors and the threats it’s meant to detect. Both elements change over time: new systems and software, users, security policies, and processes are introduced into the infrastructure, while attackers develop new techniques and tools. It is safe to assume that a perfectly configured and deployed SIEM system will no longer be able to fully see the altered infrastructure or the new threats after five years of running without additional configuration. Therefore, practically all components – event collection, detection, additional integrations for contextual information, and exclusions – must be maintained and kept up to date.
Furthermore, it is important to acknowledge that it is impossible to cover 100% of all threats. Continuous research into attacks, development of detection methods, and configuration of corresponding rules are a necessity. The SOC itself also evolves. As it reaches certain maturity levels, new growth opportunities open up for the team, requiring the utilization of new capabilities.
Problem: The SIEM has not evolved since its initial deployment.
How to detect: Compare the original statement of work or other deployment documentation against the current state of the system. If there have been no changes, or only minimal ones, it is highly likely that your SIEM has areas for growth and optimization. Any infrastructure is dynamic and requires continuous adaptation.
Other issues with SIEM implementation and operation
In this article, we have outlined the primary problems we identify during SIEM effectiveness assessments, but this list is not exhaustive. We also frequently encounter:
Mismatch between license capacity and actual SIEM load. The problem is almost always the absence of events from sources, rather than an incorrect initial assessment of the organization’s needs.
Lack of user rights management within the system (for example, every user is assigned the administrator role).
Poor organization of customizable SIEM resources (rules, normalizers, filters, and so on). Examples include chaotic naming conventions, non-optimal grouping, and obsolete or test content intermixed with active content. We have encountered confusing resource names like [dev] test_Add user to admin group_final2.
Use of out-of-the-box resources without adaptation to the organization’s infrastructure. To maximize a SIEM’s value, it is essential at a minimum to populate exception lists and specify infrastructure parameters: lists of administrators and critical services and hosts.
Disabled native integrations with external systems, such as LDAP, DNS, and GeoIP.
Generally, most issues with SIEM effectiveness stem from the natural degradation (accumulation of errors) of the processes implemented within the system. Therefore, in most cases, maintaining effectiveness involves structuring these processes, monitoring the quality of SIEM engagement at all stages (source onboarding, correlation rule development, normalization, and so on), and conducting regular reviews of all system components and resources.
Conclusion
A SIEM is a powerful tool for monitoring and detecting threats, capable of identifying attacks at various stages across nearly any point in an organization’s infrastructure. However, if improperly configured and operated, it can become ineffective or even useless while still consuming significant resources. Therefore, it is crucial to periodically audit the SIEM’s components, settings, detection rules, and data sources.
If a SOC is overloaded or otherwise unable to independently identify operational issues with its SIEM, we offer Kaspersky SIEM platform users a service to assess its operation. Following the assessment, we provide a list of recommendations to address the issues we identify. That being said, it is important to clarify that these are not strict, prescriptive instructions, but rather highlight areas that warrant attention and analysis to improve the product’s performance, enhance threat detection accuracy, and enable more efficient SIEM utilization.
A SIEM is a complex system offering broad and flexible threat detection capabilities. Due to its complexity, its effectiveness heavily depends on how it is configured and what data sources are connected to it. A one-time SIEM setup during implementation is not enough: both the organization’s infrastructure and attackers’ techniques evolve over time. To operate effectively, the SIEM system must reflect the current state of affairs.
We provide customers with services to assess SIEM effectiveness, helping to identify issues and offering options for system optimization. In this article, we examine typical SIEM operational pitfalls and how to address them. For each case, we also include methods for independent verification.
This material is based on an assessment of Kaspersky SIEM effectiveness; therefore, all specific examples, commands, and field names are taken from that solution. However, the assessment methodology, issues we identified, and ways to enhance system effectiveness can easily be extrapolated to any other SIEM.
Methodology for assessing SIEM effectiveness
The primary audience for the effectiveness assessment report comprises the SIEM support and operation teams within an organization. The main goal is to analyze how well the usage of SIEM aligns with its objectives. Consequently, the scope of checks can vary depending on the stated goals. A standard assessment is conducted across the following areas:
Composition and scope of connected data sources
Coverage of data sources
Data flows from existing sources
Correctness of data normalization
Detection logic operability
Detection logic accuracy
Detection logic coverage
Use of contextual data
SIEM technical integration into SOC processes
SOC analysts’ handling of alerts in the SIEM
Forwarding of alerts, security event data, and incident information to other systems
Deployment architecture and documentation
At the same time, these areas are examined not only in isolation but also in terms of their potential influence on one another. Here are a couple of examples illustrating this interdependence:
Issues with detection logic due to incorrect data normalization. A correlation rule with the condition deviceCustomString1 not contains <string> triggers a large number of alerts. The detection logic itself is correct: the specific event and the specific field it targets should not generate a large volume of data matching the condition. Our review revealed the issue was in the data ingested by the SIEM, where incorrect encoding caused the string targeted by the rule to be transformed into a different one. Consequently, all events matched the condition and generated alerts.
When analyzing coverage for a specific source type, we discovered that the SIEM was only monitoring 5% of all such sources deployed in the infrastructure. However, extending that coverage would increase system load and storage requirements. Therefore, besides connecting additional sources, it would be necessary to scale resources for specific modules (storage, collectors, or the correlator).
The effectiveness assessment consists of several stages:
Collect and analyze documentation, if available. This allows assessing SIEM objectives, implementation settings (ideally, the deployment settings at the time of the assessment), associated processes, and so on.
Interview system engineers, analysts, and administrators. This allows assessing current tasks and the most pressing issues, as well as determining exactly how the SIEM is being operated. Interviews are typically broken down into two phases: an introductory interview, conducted at project start to gather general information, and a follow-up interview, conducted mid-project to discuss questions arising from the analysis of previously collected data.
Gather information within the SIEM and then analyze it. This is the most extensive part of the assessment, during which Kaspersky experts are granted read-only access to the system or a part of it to collect factual data on its configuration, detection logic, data flows, and so on.
The assessment produces a list of recommendations. Some of these can be implemented almost immediately, while others require more comprehensive changes driven by process optimization or a transition to a more structured approach to system use.
Issues arising from SIEM operations
The problems we identify during a SIEM effectiveness assessment can be divided into three groups:
Performance issues, meaning operational errors in various system components. These problems are typically resolved by technical support, but to prevent them, it is worth periodically checking system health status.
Efficiency issues – when the system functions normally but seemingly adds little value or is not used to its full potential. This is usually due to the customer using the system capabilities in a limited way, incorrectly, or not as intended by the developer.
Detection issues – when the SIEM is operational and continuously evolving according to defined processes and approaches, but alerts are mostly false positives, and the system misses incidents. For the most part, these problems are related to the approach taken in developing detection logic.
Key observations from the assessment
Event source inventory
When building the inventory of event sources for a SIEM, we follow the principle of layered monitoring: the system should have information about all detectable stages of an attack. This principle enables the detection of attacks even if individual malicious actions have gone unnoticed, and allows for retrospective reconstruction of the full attack chain, starting from the attackers’ point of entry.
Problem: During effectiveness assessments, we frequently find that the inventory of connected source types is not updated when the infrastructure changes. In some cases, it has not been updated since the initial SIEM deployment, which limits incident detection capabilities. Consequently, certain types of sources remain completely invisible to the system.
We have also encountered non-standard cases of incomplete source inventory. For example, an infrastructure contains hosts running both Windows and Linux, but monitoring is configured for only one family of operating systems.
How to detect: To identify the problems described above, determine the list of source types connected to the SIEM and compare it against what actually exists in the infrastructure. Identifying the presence of specific systems in the infrastructure requires an audit. However, this task is one of the most critical for many areas of cybersecurity, and we recommend running it on a periodic basis.
We have compiled a reference sheet of system types commonly found in most organizations. Depending on the organization type, infrastructure, and threat model, we may rearrange priorities. However, a good starting point is as follows:
High Priority – sources associated with:
Remote access provision
External services accessible from the internet
External perimeter
Endpoint operating systems
Information security tools
Medium Priority – sources associated with:
Remote access management within the perimeter
Internal network communication
Infrastructure availability
Virtualization and cloud solutions
Low Priority – sources associated with:
Business applications
Internal IT services
Applications used by various specialized teams (HR, Development, PR, IT, and so on)
Monitoring data flow from sources
Regardless of how good the detection logic is, it cannot function without telemetry from the data sources.
Problem: The SIEM core is not receiving events from specific sources or collectors. Based on all assessments conducted, the average proportion of collectors that are configured with sources but are not transmitting events is 38%. Correlation rules may exist for these sources, but they will, of course, never trigger. It is also important to remember that a single collector can serve hundreds of sources (such as workstations), so the loss of data flow from even one collector can mean losing monitoring visibility for a significant portion of the infrastructure.
How to detect: The process of locating sources that are not transmitting data can be broken down into two components.
Checking collector health. Find the status of collectors (see the support website for the steps to do this in Kaspersky SIEM) and identify those with a status of Offline, Stopped, Disabled, and so on.
Checking the event flow. In Kaspersky SIEM, this can be done by gathering statistics using the following query (counting the number of events received from each collector over a specific time period):
SELECT count(ID), CollectorID, CollectorName FROM `events` GROUP BY CollectorID, CollectorName ORDER BY count(ID)
It is essential to specify an optimal time range for collecting these statistics. Too large a range can increase the load on the SIEM, while too small a range may provide inaccurate information for a one-time check – especially for sources that transmit telemetry relatively infrequently, say, once a week. Therefore, it is advisable to choose a smaller time window, such as 2–4 days, but run several queries for different periods in the past.
Additionally, for a more comprehensive approach, it is recommended to use built-in functionality or custom logic implemented via correlation rules and lists to monitor event flow. This will help automate the process of detecting problems with sources.
Event source coverage
Problem: The system is not receiving events from all sources of a particular type that exist in the infrastructure. For example, the company uses workstations and servers running Windows. During SIEM deployment, workstations are immediately connected for monitoring, while the server segment is postponed for one reason or another. As a result, the SIEM receives events from Windows systems, the flow is normalized, and correlation rules work, but an incident in the unmonitored server segment would go unnoticed.
How to detect: Below are query variations that can be used to search for unconnected sources.
SELECT count(distinct, DeviceAddress), DeviceVendor, DeviceProduct FROM events GROUP BY DeviceVendor, DeviceProduct ORDER BY count(ID)
SELECT count(distinct, DeviceHostName), DeviceVendor, DeviceProduct FROM events GROUP BY DeviceVendor, DeviceProduct ORDER BY count(ID)
We have split the query into two variations because, depending on the source and the DNS integration settings, some events may contain either a DeviceAddress or DeviceHostName field.
These queries will help determine the number of unique data sources sending logs of a specific type. This count must be compared against the actual number of sources of that type, obtained from the system owners.
Retaining raw data
Raw data can be useful for developing custom normalizers or for storing events not used in correlation that might be needed during incident investigation. However, careless use of this setting can cause significantly more harm than good.
Problem: Enabling the Keep raw event option effectively doubles the event size in the database, as it stores two copies: the original and the normalized version. This is particularly critical for high-volume collectors receiving events from sources like NetFlow, DNS, firewalls, and others. It is worth noting that this option is typically used for testing a normalizer but is often forgotten and left enabled after its configuration is complete.
How to detect: This option is applied at the normalizer level. Therefore, it is necessary to review all active normalizers and determine whether retaining raw data is required for their operation.
Normalization
As with the absence of events from sources, normalization issues lead to detection logic failing, as this logic relies on finding specific information in a specific event field.
Problem: Several issues related to normalization can be identified:
The event flow is not being normalized at all.
Events are only partially normalized – this is particularly relevant for custom, non-out-of-the-box normalizers.
The normalizer being used only parses headers, such as syslog_headers, placing the entire event body into a single field, this field most often being Message.
An outdated default normalizer is being used.
How to detect: Identifying normalization issues is more challenging than spotting source problems due to the high volume of telemetry and variety of parsers. Here are several approaches to narrowing the search:
First, check which normalizers supplied with the SIEM the organization uses and whether their versions are up to date. In our assessments, we frequently encounter auditd events being normalized by the outdated normalizer, Linux audit and iptables syslog v2 for Kaspersky SIEM. The new normalizer completely reworks and optimizes the normalization schema for events from this source.
Execute the query:
SELECT count(ID), DeviceProduct, DeviceVendor, CollectorName FROM `events` GROUP BY DeviceProduct, DeviceVendor, CollectorName ORDER BY count(ID)
This query gathers statistics on events from each collector, broken down by the DeviceVendor and DeviceProduct fields. While these fields are not mandatory, they are present in almost any normalization schema. Therefore, their complete absence or empty values may indicate normalization issues. We recommend including these fields when developing custom normalizers.
To simplify the identification of normalization problems when developing custom normalizers, you can implement the following mechanism. For each successfully normalized event, add a Name field, populated from a constant or the event itself. For a final catch-all normalizer that processes all unparsed events, set the constant value: Name = unparsed event. This will later allow you to identify non-normalized events through a simple search on this field.
Detection logic coverage
Collected events alone are, in most cases, only useful for investigating an incident that has already been identified. For a SIEM to operate to its full potential, it requires detection logic to be developed to uncover probable security incidents.
Problem: The mean correlation rule coverage of sources, determined across all our assessments, is 43%. While this figure is only a ballpark figure – as different source types provide different information – to calculate it, we defined “coverage” as the presence of at least one correlation rule for a source. This means that for more than half of the connected sources, the SIEM is not actively detecting. Meanwhile, effort and SIEM resources are spent on connecting, maintaining, and configuring these sources. In some cases, this is formally justified, for instance, if logs are only needed for regulatory compliance. However, this is an exception rather than the rule.
We do not recommend solving this problem by simply not connecting sources to the SIEM. On the contrary, sources should be connected, but this should be done concurrently with the development of corresponding detection logic. Otherwise, it can be forgotten or postponed indefinitely, while the source pointlessly consumes system resources.
How to detect: This brings us back to auditing, a process that can be greatly aided by creating and maintaining a register of developed detection logic. Given that not every detection logic rule explicitly states the source type from which it expects telemetry, its description should be added to this register during the development phase.
If descriptions of the correlation rules are not available, you can refer to the following:
The name of the detection logic. With a standardized approach to naming correlation rules, the name can indicate the associated source or at least provide a brief description of what it detects.
The use of fields within the rules, such as DeviceVendor, DeviceProduct (another argument for including these fields in the normalizer), Name, DeviceAction, DeviceEventCategory, DeviceEventClassID, and others. These can help identify the actual source.
Excessive alerts generated by the detection logic
One criterion for correlation rules effectiveness is a low false positive rate.
Problem: Detection logic generates an abnormally high number of alerts that are physically impossible to process, regardless of the size of the SOC team.
How to detect: First and foremost, detection logic should be tested during development and refined to achieve an acceptable false positive rate. However, even a well-tuned correlation rule can start producing excessive alerts due to changes in the event flow or connected infrastructure. To identify these rules, we recommend periodically running the following query:
SELECT count(ID), Name FROM `events` WHERE Type = 3 GROUP BY Name ORDER BY count(ID)
In Kaspersky SIEM, a value of 3 in the Type field indicates a correlation event.
Subsequently, for each identified rule with an anomalous alert count, verify the correctness of the logic it uses and the integrity of the event stream on which it triggered.
Depending on the issue you identify, the solution may involve modifying the detection logic, adding exceptions (for example, it is often the case that 99% of the spam originates from just 1–5 specific objects, such as an IP address, a command parameter, or a URL), or adjusting event collection and normalization.
Lack of integration with indicators of compromise
SIEM integrations with other systems are generally a critical part of both event processing and alert enrichment. In at least one specific case, their presence directly impacts detection performance: integration with technical Threat Intelligence data or IoCs (indicators of compromise).
A SIEM allows conveniently checking objects against various reputation databases or blocklists. Furthermore, there are numerous sources of this data that are ready to integrate natively with a SIEM or require minimal effort to incorporate.
Problem: There is no integration with TI data.
How to detect: Generally, IoCs are integrated into a SIEM at the system configuration level during deployment or subsequent optimization. The use of TI within a SIEM can be implemented at various levels:
At the data source level. Some sources, such as NGFWs, add this information to events involving relevant objects.
At the SIEM native functionality level. For example, Kaspersky SIEM integrates with CyberTrace indicators, which add object reputation information at the moment of processing an event from a source.
At the detection logic level. Information about IoCs is stored in various active lists, and correlation rules match objects against these to enrich the event.
Furthermore, TI data does not appear in a SIEM out of thin air. It is either provided by external suppliers (commercially or in an open format) or is part of the built-in functionality of the security tools in use. For instance, various NGFW systems can additionally check the reputation of external IP addresses or domains that users are accessing. Therefore, the first step is to determine whether you are receiving information about indicators of compromise and in what form (whether external providers’ feeds have been integrated and/or the deployed security tools have this capability). It is worth noting that receiving TI data only at the security tool level does not always cover all types of IoCs.
If data is being received in some form, the next step is to verify that the SIEM is utilizing it. For TI-related events coming from security tools, the SIEM needs a correlation rule developed to generate alerts. Thus, checking integration in this case involves determining the capabilities of the security tools, searching for the corresponding events in the SIEM, and identifying whether there is detection logic associated with these events. If events from the security tools are absent, the source audit configuration should be assessed to see if the telemetry type in question is being forwarded to the SIEM at all. If normalization is the issue, you should assess parsing accuracy and reconfigure the normalizer.
If TI data comes from external providers, determine how it is processed within the organization. Is there a centralized system for aggregating and managing threat data (such as CyberTrace), or is the information stored in, say, CSV files?
In the former case (there is a threat data aggregation and management system) you must check if it is integrated with the SIEM. For Kaspersky SIEM and CyberTrace, this integration is handled through the SIEM interface. Following this, SIEM event flows are directed to the threat data aggregation and management system, where matches are identified and alerts are generated, and then both are sent back to the SIEM. Therefore, checking the integration involves ensuring that all collectors receiving events that may contain IoCs are forwarding those events to the threat data aggregation and management system. We also recommend checking if the SIEM has a correlation rule that generates an alert based on matching detected objects with IoCs.
In the latter case (threat information is stored in files), you must confirm that the SIEM has a collector and normalizer configured to load this data into the system as events. Also, verify that logic is configured for storing this data within the SIEM for use in correlation. This is typically done with the help of lists that contain the obtained IoCs. Finally, check if a correlation rule exists that compares the event flow against these IoC lists.
As the examples illustrate, integration with TI in standard scenarios ultimately boils down to developing a final correlation rule that triggers an alert upon detecting a match with known IoCs. Given the variety of integration methods, creating and providing a universal out-of-the-box rule is difficult. Therefore, in most cases, to ensure IoCs are connected to the SIEM, you need to determine if the company has developed that rule (the existence of the rule) and if it has been correctly configured. If no correlation rule exists in the system, we recommend creating one based on the TI integration methods implemented in your infrastructure. If a rule does exist, its functionality must be verified: if there are no alerts from it, analyze its trigger conditions against the event data visible in the SIEM and adjust it accordingly.
The SIEM is not kept up to date
For a SIEM to run effectively, it must contain current data about the infrastructure it monitors and the threats it’s meant to detect. Both elements change over time: new systems and software, users, security policies, and processes are introduced into the infrastructure, while attackers develop new techniques and tools. It is safe to assume that a perfectly configured and deployed SIEM system will no longer be able to fully see the altered infrastructure or the new threats after five years of running without additional configuration. Therefore, practically all components – event collection, detection, additional integrations for contextual information, and exclusions – must be maintained and kept up to date.
Furthermore, it is important to acknowledge that it is impossible to cover 100% of all threats. Continuous research into attacks, development of detection methods, and configuration of corresponding rules are a necessity. The SOC itself also evolves. As it reaches certain maturity levels, new growth opportunities open up for the team, requiring the utilization of new capabilities.
Problem: The SIEM has not evolved since its initial deployment.
How to detect: Compare the original statement of work or other deployment documentation against the current state of the system. If there have been no changes, or only minimal ones, it is highly likely that your SIEM has areas for growth and optimization. Any infrastructure is dynamic and requires continuous adaptation.
Other issues with SIEM implementation and operation
In this article, we have outlined the primary problems we identify during SIEM effectiveness assessments, but this list is not exhaustive. We also frequently encounter:
Mismatch between license capacity and actual SIEM load. The problem is almost always the absence of events from sources, rather than an incorrect initial assessment of the organization’s needs.
Lack of user rights management within the system (for example, every user is assigned the administrator role).
Poor organization of customizable SIEM resources (rules, normalizers, filters, and so on). Examples include chaotic naming conventions, non-optimal grouping, and obsolete or test content intermixed with active content. We have encountered confusing resource names like [dev] test_Add user to admin group_final2.
Use of out-of-the-box resources without adaptation to the organization’s infrastructure. To maximize a SIEM’s value, it is essential at a minimum to populate exception lists and specify infrastructure parameters: lists of administrators and critical services and hosts.
Disabled native integrations with external systems, such as LDAP, DNS, and GeoIP.
Generally, most issues with SIEM effectiveness stem from the natural degradation (accumulation of errors) of the processes implemented within the system. Therefore, in most cases, maintaining effectiveness involves structuring these processes, monitoring the quality of SIEM engagement at all stages (source onboarding, correlation rule development, normalization, and so on), and conducting regular reviews of all system components and resources.
Conclusion
A SIEM is a powerful tool for monitoring and detecting threats, capable of identifying attacks at various stages across nearly any point in an organization’s infrastructure. However, if improperly configured and operated, it can become ineffective or even useless while still consuming significant resources. Therefore, it is crucial to periodically audit the SIEM’s components, settings, detection rules, and data sources.
If a SOC is overloaded or otherwise unable to independently identify operational issues with its SIEM, we offer Kaspersky SIEM platform users a service to assess its operation. Following the assessment, we provide a list of recommendations to address the issues we identify. That being said, it is important to clarify that these are not strict, prescriptive instructions, but rather highlight areas that warrant attention and analysis to improve the product’s performance, enhance threat detection accuracy, and enable more efficient SIEM utilization.
If you’re a penetration tester, you know that lateral movement is becoming increasingly difficult, especially in well-defended environments. One common technique for remote command execution has been the use of DCOM objects.
Over the years, many different DCOM objects have been discovered. Some rely on native Windows components, others depend on third-party software such as Microsoft Office, and some are undocumented objects found through reverse engineering. While certain objects still work, others no longer function in newer versions of Windows.
This research presents a previously undescribed DCOM object that can be used for both command execution and potential persistence. This new technique abuses older initial access and persistence methods through Control Panel items.
First, we will discuss COM technology. After that, we will review the current state of the Impacket dcomexec script, focusing on objects that still function, and discuss potential fixes and improvements, then move on to techniques for enumerating objects on the system. Next, we will examine Control Panel items, how adversaries have used them for initial access and persistence, and how these items can be leveraged through a DCOM object to achieve command execution.
Finally, we will cover detection strategies to identify and respond to this type of activity.
COM/DCOM technology
What is COM?
COM stands for Component Object Model, a Microsoft technology that defines a binary standard for interoperability. It enables the creation of reusable software components that can interact at runtime without the need to compile COM libraries directly into an application.
These software components operate in a client–server model. A COM object exposes its functionality through one or more interfaces. An interface is essentially a collection of related member functions (methods).
COM also enables communication between processes running on the same machine by using local RPC (Remote Procedure Call) to handle cross-process communication.
Terms
To ensure a better understanding of its structure and functionality, let’s revise COM-related terminology.
COM interface A COM interface defines the functionality that a COM object exposes. Each COM interface is identified by a unique GUID known as the IID (Interface ID). All COM interfaces can be found in the Windows Registry under HKEY_CLASSES_ROOT\Interface, where they are organized by GUID.
COM class (COM CoClass) A COM class is the actual implementation of one or more COM interfaces. Like COM interfaces, classes are identified by unique GUIDs, but in this case the GUID is called the CLSID (Class ID). This GUID is used to locate the COM server and activate the corresponding COM class.
All COM classes must be registered in the registry under HKEY_CLASSES_ROOT\CLSID, where each class’s GUID is stored. Under each GUID, you may find multiple subkeys that serve different purposes, such as:
InprocServer32/LocalServer32: Specifies the system path of the COM server where the class is defined. InprocServer32 is used for in-process servers (DLLs), while LocalServer32 is used for out-of-process servers (EXEs). We’ll describe this in more detail later.
ProgID: A human-readable name assigned to the COM class.
TypeLib: A binary description of the COM class (essentially documentation for the class).
AppID: Used to describe security configuration for the class.
COM server A COM is the module where a COM class is defined. The server can be implemented as an EXE, in which case it is called an out-of-process server, or as a DLL, in which case it is called an in-process server. Each COM server has a unique file path or location in the system. Information about COM servers is stored in the Windows Registry. The COM runtime uses the registry to locate the server and perform further actions. Registry entries for COM servers are located under the HKEY_CLASSES_ROOT root key for both 32- and 64-bit servers.
Component Object Model implementation
Client–server model
In-process server In the case of an in-process server, the server is implemented as a DLL. The client loads this DLL into its own address space and directly executes functions exposed by the COM object. This approach is efficient since both client and server run within the same process.
In-process COM server
Out-of-process server Here, the server is implemented and compiled as an executable (EXE). Since the client cannot load an EXE into its address space, the server runs in its own process, separate from the client. Communication between the two processes is handled via ALPC (Advanced Local Procedure Call) ports, which serve as the RPC transport layer for COM.
Out-of-process COM server
What is DCOM?
DCOM is an extension of COM where the D stands for Distributed. It enables the client and server to reside on different machines. From the user’s perspective, there is no difference: DCOM provides an abstraction layer that makes both the client and the server appear as if they are on the same machine.
Under the hood, however, COM uses TCP as the RPC transport layer to enable communication across machines.
Distributed COM implementation
Certain requirements must be met to extend a COM object into a DCOM object. The most important one for our research is the presence of the AppID subkey in the registry, located under the COM CLSID entry.
The AppID value contains a GUID that maps to a corresponding key under HKEY_CLASSES_ROOT\AppID. Several subkeys may exist under this GUID. Two critical ones are:
These registry settings grant remote clients permissions to activate and interact with DCOM objects.
Lateral movement via DCOM
After attackers compromise a host, their next objective is often to compromise additional machines. This is what we call lateral movement. One common lateral movement technique is to achieve remote command execution on a target machine. There are many ways to do this, one of which involves abusing DCOM objects.
In recent years, many DCOM objects have been discovered. This research focuses on the objects exposed by the Impacket script dcomexec.py that can be used for command execution. More specifically, three exposed objects are used: ShellWindows, ShellBrowserWindow and MMC20.
ShellWindows
ShellWindows was one of the first DCOM objects to be identified. It represents a collection of open shell windows and is hosted by explorer.exe, meaning any COM client communicates with that process.
In Impacket’s dcomexec.py, once an instance of this COM object is created on a remote machine, the script provides a semi-interactive shell.
Each time a user enters a command, the function exposed by the COM object is called. The command output is redirected to a file, which the script retrieves via SMB and displays back to simulate a regular shell.
Internally, the script runs this command when connecting:
cmd.exe /Q /c cd \ 1> \\127.0.0.1\ADMIN$\__17602 2>&1
This sets the working directory to C:\ and redirects the output to the ADMIN$ share under the filename __17602. After that, the script checks whether the file exists; if it does, execution is considered successful and the output appears as if in a shell.
When running dcomexec.py against Windows 10 and 11 using the ShellWindows object, the script hangs after confirming SMB connection initialization and printing the SMB banner. As I mentioned in my personal blog post, it appears that this DCOM object no longer has permission to write to the ADMIN$ share. A simple fix is to redirect the output to a directory the DCOM object can write to, such as the Temp folder. The Temp folder can then be accessed under the same ADMIN$ share. A small change in the code resolves the issue. For example:
ShellBrowserWindow
The ShellBrowserWindow object behaves almost identically to ShellWindows and exhibits the same behavior on Windows 10. The same workaround that we used for ShellWindows applies in this case. However, on Windows 11, this object no longer works for command execution.
MMC20
The MMC20.Application COM object is the automation interface for Microsoft Management Console (MMC). It exposes methods and properties that allow MMC snap-ins to be automated.
This object has historically worked across all Windows versions. Starting with Windows Server 2025, however, attempting to use it triggers a Defender alert, and execution is blocked.
As shown in earlier examples, the dcomexec.py script writes the command output to a file under ADMIN$, with a filename that begins with __:
OUTPUT_FILENAME = '__' + str(time.time())[:5]
Defender appears to check for files written under ADMIN$ that start with __, and when it detects one, it blocks the process and alerts the user. A quick fix is to simply remove the double underscores from the output filename.
Another way to bypass this issue is to use the same workaround used for ShellWindows – redirecting the output to the Temp folder. The table below outlines the status of these objects across different Windows versions.
Windows Server 2025
Windows Server 2022
Windows 11
Windows 10
ShellWindows
Doesn’t work
Doesn’t work
Works but needs a fix
Works but needs a fix
ShellBrowserWindow
Doesn’t work
Doesn’t work
Doesn’t work
Works but needs a fix
MMC20
Detected by Defender
Works
Works
Works
Enumerating COM/DCOM objects
The first step to identifying which DCOM objects could be used for lateral movement is to enumerate them. By enumerating, I don’t just mean listing the objects. Enumeration involves:
Finding objects and filtering specifically for DCOM objects.
Identifying their interfaces.
Inspecting the exposed functions.
Automating enumeration is difficult because most COM objects lack a type library (TypeLib). A TypeLib acts as documentation for an object: which interfaces it supports, which functions are exposed, and the definitions of those functions. Even when TypeLibs are available, manual inspection is often still required, as we will explain later.
There are several approaches to enumerating COM objects depending on their use cases. Next, we’ll describe the methods I used while conducting this research, taking into account both automated and manual methods.
Automation using PowerShell In PowerShell, you can use .NET to create and interact with DCOM objects. Objects can be created using either their ProgID or CLSID, after which you can call their functions (as shown in the figure below).
Shell.Application COM object function list in PowerShell
Under the hood, PowerShell checks whether the COM object has a TypeLib and implements the IDispatch interface. IDispatch enables late binding, which allows runtime dynamic object creation and function invocation. With these two conditions met, PowerShell can dynamically interact with COM objects at runtime.
Our strategy looks like this:
As you can see in the last box, we perform manual inspection to look for functions with names that could be of interest, such as Execute, Exec, Shell, etc. These names often indicate potential command execution capabilities.
However, this approach has several limitations:
TypeLib requirement: Not all COM objects have a TypeLib, so many objects cannot be enumerated this way.
IDispatch requirement: Not all COM objects implement the IDispatch interface, which is required for PowerShell interaction.
Interface control: When you instantiate an object in PowerShell, you cannot choose which interface the instance will be tied to. If a COM class implements multiple interfaces, PowerShell will automatically select the one marked as [default] in the TypeLib. This means that other non-default interfaces, which may contain additional relevant functionality, such as command execution, could be overlooked.
Automation using C++ As you might expect, C++ is one of the languages that natively supports COM clients. Using C++, you can create instances of COM objects and call their functions via header files that define the interfaces.However, with this approach, we are not necessarily interested in calling functions directly. Instead, the goal is to check whether a specific COM object supports certain interfaces. The reasoning is that many interfaces have been found to contain functions that can be abused for command execution or other purposes.
This strategy primarily relies on an interface called IUnknown. All COM interfaces should inherit from this interface, and all COM classes should implement it.The IUnknown interface exposes three main functions. The most important is QueryInterface(), which is used to ask a COM object for a pointer to one of its interfaces.So, the strategy is to:
Enumerate COM classes in the system by reading CLSIDs under the HKEY_CLASSES_ROOT\CLSID key.
Check whether they support any known valuable interfaces. If they do, those classes may be leveraged for command execution or other useful functionality.
This method has several advantages:
No TypeLib dependency: Unlike PowerShell, this approach does not require the COM object to have a TypeLib.
Use of IUnknown: In C++, you can use the QueryInterface function from the base IUnknown interface to check if a particular interface is supported by a COM class.
No need for interface definitions: Even without knowing the exact interface structure, you can obtain a pointer to its virtual function table (vtable), typically cast as a void*. This is enough to confirm the existence of the interface and potentially inspect it further.
The figure below illustrates this strategy:
This approach is good in terms of automation because it eliminates the need for manual inspection. However, we are still only checking well-known interfaces commonly used for lateral movement, while potentially missing others.
Manual inspection using open-source tools
As you can see, automation can be difficult since it requires several prerequisites and, in many cases, still ends with a manual inspection. An alternative approach is manual inspection using a tool called OleViewDotNet, developed by James Forshaw. This tool allows you to:
List all COM classes in the system.
Create instances of those classes.
Check their supported interfaces.
Call specific functions.
Apply various filters for easier analysis.
Perform other inspection tasks.
Open-source tool for inspecting COM interfaces
One of the most valuable features of this tool is its naming visibility. OleViewDotNet extracts the names of interfaces and classes (when available) from the Windows Registry and displays them, along with any associated type libraries.
This makes manual inspection easier, since you can analyze the names of classes, interfaces, or type libraries and correlate them with potentially interesting functionality, for example, functions that could lead to command execution or persistence techniques.
Control Panel items as attack surfaces
Control Panel items allow users to view and adjust their computer settings. These items are implemented as DLLs that export the CPlApplet function and typically have the .cpl extension. Control Panel items can also be executables, but our research will focus on DLLs only.
Control Panel items
Attackers can abuse CPL files for initial access. When a user executes a malicious .cpl file (e.g., delivered via phishing), the system may be compromised – a technique mapped to MITRE ATT&CK T1218.002.
Adversaries may also modify the extensions of malicious DLLs to .cpl and register them in the corresponding locations in the registry.
Under HKEY_CURRENT_USER:
HKCU\Software\Microsoft\Windows\CurrentVersion\Control Panel\Cpls
Under HKEY_LOCAL_MACHINE:
For 64-bit DLLs:
HKLM\Software\Microsoft\Windows\CurrentVersion\Control Panel\Cpls
For 32-bit DLLs:
HKLM\Software\WOW6432Node\Microsoft\Windows\CurrentVersion\Control Panel\Cpls
These locations are important when Control Panel DLLs need to be available to the current logged-in user or to all users on the machine. However, the “Control Panel” subkey and its “Cpls” subkey under HKCU should be created manually, unlike the “Control Panel” and “Cpls” subkeys under HKLM, which are created automatically by the operating system.
Once registered, the DLL (CPL file) will load every time the Control Panel is opened, enabling persistence on the victim’s system.
It’s worth noting that even DLLs that do not comply with the CPL specification, do not export CPlApplet, or do not have the .cpl extension can still be executed via their DllEntryPoint function if they are registered under the registry keys listed above.
There are multiple ways to execute Control Panel items:
This calls the Control_RunDLL function from shell32.dll, passing the CPL file as an argument. Everything inside the CPlApplet function will then be executed.
However, if the CPL file has been registered in the registry as shown earlier, then every time the Control Panel is opened, the file is loaded into memory through the COM Surrogate process (dllhost.exe):
COM Surrogate process loading the CPL file
What happened was that a Control Panel with a COM client used a COM object to load these CPL files. We will talk about this COM object in more detail later.
The COM Surrogate process was designed to host COM server DLLs in a separate process rather than loading them directly into the client process’s address space. This isolation improves stability for the in-process server model. This hosting behavior can be configured for a COM object in the registry if you want a COM server DLL to run inside a separate process because, by default, it is loaded in the same process.
‘DCOMing’ through Control Panel items
While following the manual approach of enumerating COM/DCOM objects that could be useful for lateral movement, I came across a COM object called COpenControlPanel, which is exposed through shell32.dll and has the CLSID {06622D85-6856-4460-8DE1-A81921B41C4B}. This object exposes multiple interfaces, one of which is IOpenControlPanel with IID {D11AD862-66DE-4DF4-BF6C-1F5621996AF1}.
IOpenControlPanel interface in the OleViewDotNet output
I immediately thought of its potential to compromise Control Panel items, so I wanted to check which functions were exposed by this interface. Unfortunately, neither the interface nor the COM class has a type library.
COpenControlPanel interfaces without TypeLib
Normally, checking the interface definition would require reverse engineering, so at first, it looked like we needed to take a different research path. However, it turned out that the IOpenControlPanel interface is documented on MSDN, and according to the documentation, it exposes several functions. One of them, called Open, allows a specified Control Panel item to be opened using its name as the first argument.
Full type and function definitions are provided in the shobjidl_core.h Windows header file.
Open function exposed by IOpenControlPanel interface
It’s worth noting that in newer versions of Windows (e.g., Windows Server 2025 and Windows 11), Microsoft has removed interface names from the registry, which means they can no longer be identified through OleViewDotNet.
COpenControlPanel interfaces without names
Returning to the COpenControlPanel COM object, I found that the Open function can trigger a DLL to be loaded into memory if it has been registered in the registry. For the purposes of this research, I created a DLL that basically just spawns a message box which is defined under the DllEntryPoint function. I registered it under HKCU\Software\Microsoft\Windows\CurrentVersion\Control Panel\Cpls and then created a simple C++ COM client to call the Open function on this interface.
As expected, the DLL was loaded into memory. It was hosted in the same way that it would be if the Control Panel itself was opened: through the COM Surrogate process (dllhost.exe). Using Process Explorer, it was clear that dllhost.exe loaded my DLL while simultaneously hosting the COpenControlPanel object along with other COM objects.
COM Surrogate loading a custom DLL and hosting the COpenControlPanel object
Based on my testing, I made the following observations:
The DLL that needs to be registered does not necessarily have to be a .cpl file; any DLL with a valid entry point will be loaded.
The Open() function accepts the name of a Control Panel item as its first argument. However, it appears that even if a random string is supplied, it still causes all DLLs registered in the relevant registry location to be loaded into memory.
Now, what if we could trigger this COM object remotely? In other words, what if it is not just a COM object but also a DCOM object? To verify this, we checked the AppID of the COpenControlPanel object using OleViewDotNet.
COpenControlPanel object in OleViewDotNet
Both the launch and access permissions are empty, which means the object will follow the system’s default DCOM security policy. By default, members of the Administrators group are allowed to launch and access the DCOM object.
Based on this, we can build a remote strategy. First, upload the “malicious” DLL, then use the Remote Registry service to register it in the appropriate registry location. Finally, use a trigger acting as a DCOM client to remotely invoke the Open() function, causing our DLL to be loaded. The diagram below illustrates the flow of this approach.
Malicious DLL loading using DCOM
The trigger can be written in either C++ or Python, for example, using Impacket. I chose Python because of its flexibility. The trigger itself is straightforward: we define the DCOM class, the interface, and the function to call. The full code example can be found here.
Once the trigger runs, the behavior will be the same as when executing the COM client locally: our DLL will be loaded through the COM Surrogate process (dllhost.exe).
As you can see, this technique not only achieves command execution but also provides persistence. It can be triggered in two ways: when a user opens the Control Panel or remotely at any time via DCOM.
Detection
The first step in detecting such activity is to check whether any Control Panel items have been registered under the following registry paths:
Although commonly known best practices and research papers regarding Windows security advise monitoring only the first subkey, for thorough coverage it is important to monitor all of the above.
In addition, monitoring dllhost.exe (COM Surrogate) for unusual COM objects such as COpenControlPanel can provide indicators of malicious activity.
Finally, it is always recommended to monitor Remote Registry usage because it is commonly abused in many types of attacks, not just in this scenario.
Conclusion
In conclusion, I hope this research has clarified yet another attack vector and emphasized the importance of implementing hardening practices. Below are a few closing points for security researchers to take into account:
As shown, DCOM represents a large attack surface. Windows exposes many DCOM classes, a significant number of which lack type libraries – meaning reverse engineering can reveal additional classes that may be abused for lateral movement.
Changing registry values to register malicious CPLs is not good practice from a red teaming ethics perspective. Defender products tend to monitor common persistence paths, but Control Panel applets can be registered in multiple registry locations, so there is always a gap that can be exploited.
Bitness also matters. On x64 systems, loading a 32-bit DLL will spawn a 32-bit COM Surrogate process (dllhost.exe *32). This is unusual on 64-bit hosts and therefore serves as a useful detection signal for defenders and an interesting red flag for red teamers to consider.

 Login
Login