❌

Normal view

GuardDuty Extended Threat Detection has added five new indicators to surface attack sequences

12 October 2026 at 23:58

Amazon GuardDuty Extended Threat Detection correlates weak GuardDuty signals into a single, critical-severity attack sequence finding when their composition crosses a threshold of credibility. On May 20, 2026, the service started attaching five new indicator types to those sequences: MALICIOUS_PACKAGE, MISCONFIGURATION, REACHABILITY, SENSITIVE_DATA, and VULNERABILITY. For more information, see Document history for Amazon GuardDuty and Attack sequence finding details.

These indicators come from Amazon Inspector, Amazon Virtual Private Cloud (Amazon VPC) Reachability Analyzer, Amazon Macie, and posture data surfaced through AWS Security Hub. You might already run these services for other reasons, and now Extended Threat Detection folds their signals into attack sequence findings. This post is an operational guide for teams already running the prerequisite services and discusses what the new indicators look like in a finding, what the post-launch data shows, and how to fold them into your incident-response workflow. These indicators help Extended Threat Detection prioritize the highest-priority signals in your account, which provides higher confidence findings on the workload surfaces as part of an active defense strategy monitoring runtime activity on Amazon Elastic Compute Cloud (Amazon EC2), Amazon Elastic Container Service (Amazon ECS), and Amazon Elastic Kubernetes Service (Amazon EKS).

New indicators overview

In GuardDuty, a signal is any event it evaluates when looking for suspicious activity. A weak signal is one that, on its own, doesn’t clearly point to a threat which the five new indicators fall into. A single Common Vulnerabilities and Exposures (CVE) finding on a host, for instance, tells you a vulnerability exists not that an attacker is exploiting it. These findings earn their value when GuardDuty correlates them with the suspicious-activity signals it already tracks, as shown in the following table:

Indicator Source What it tells you
VULNERABILITY Amazon Inspector CVE list with Common Vulnerability Scoring System (CVSS) severity and Exploit Prediction Scoring System (EPSS) exploit-likelihood scores.
MALICIOUS_PACKAGE Amazon Inspector Amazon Inspector MAL-* package indicators. For more on how Amazon Inspector scores vulnerabilities, see Amazon Inspector Security Research.
REACHABILITY Amazon VPC Reachability Analyzer Whether the host or cluster is reachable from the internet
MISCONFIGURATION AWS Security Hub controls (posture management) The resource has configuration that doesn’t align with AWS or industry best practices. For example, IMDSv1 still enabled, overly permissive admin policies, or publicly accessible Amazon Simple Storage Service (Amazon S3) buckets.
SENSITIVE_DATA Amazon Macie Potential sensitive data has been discovered in the resource.

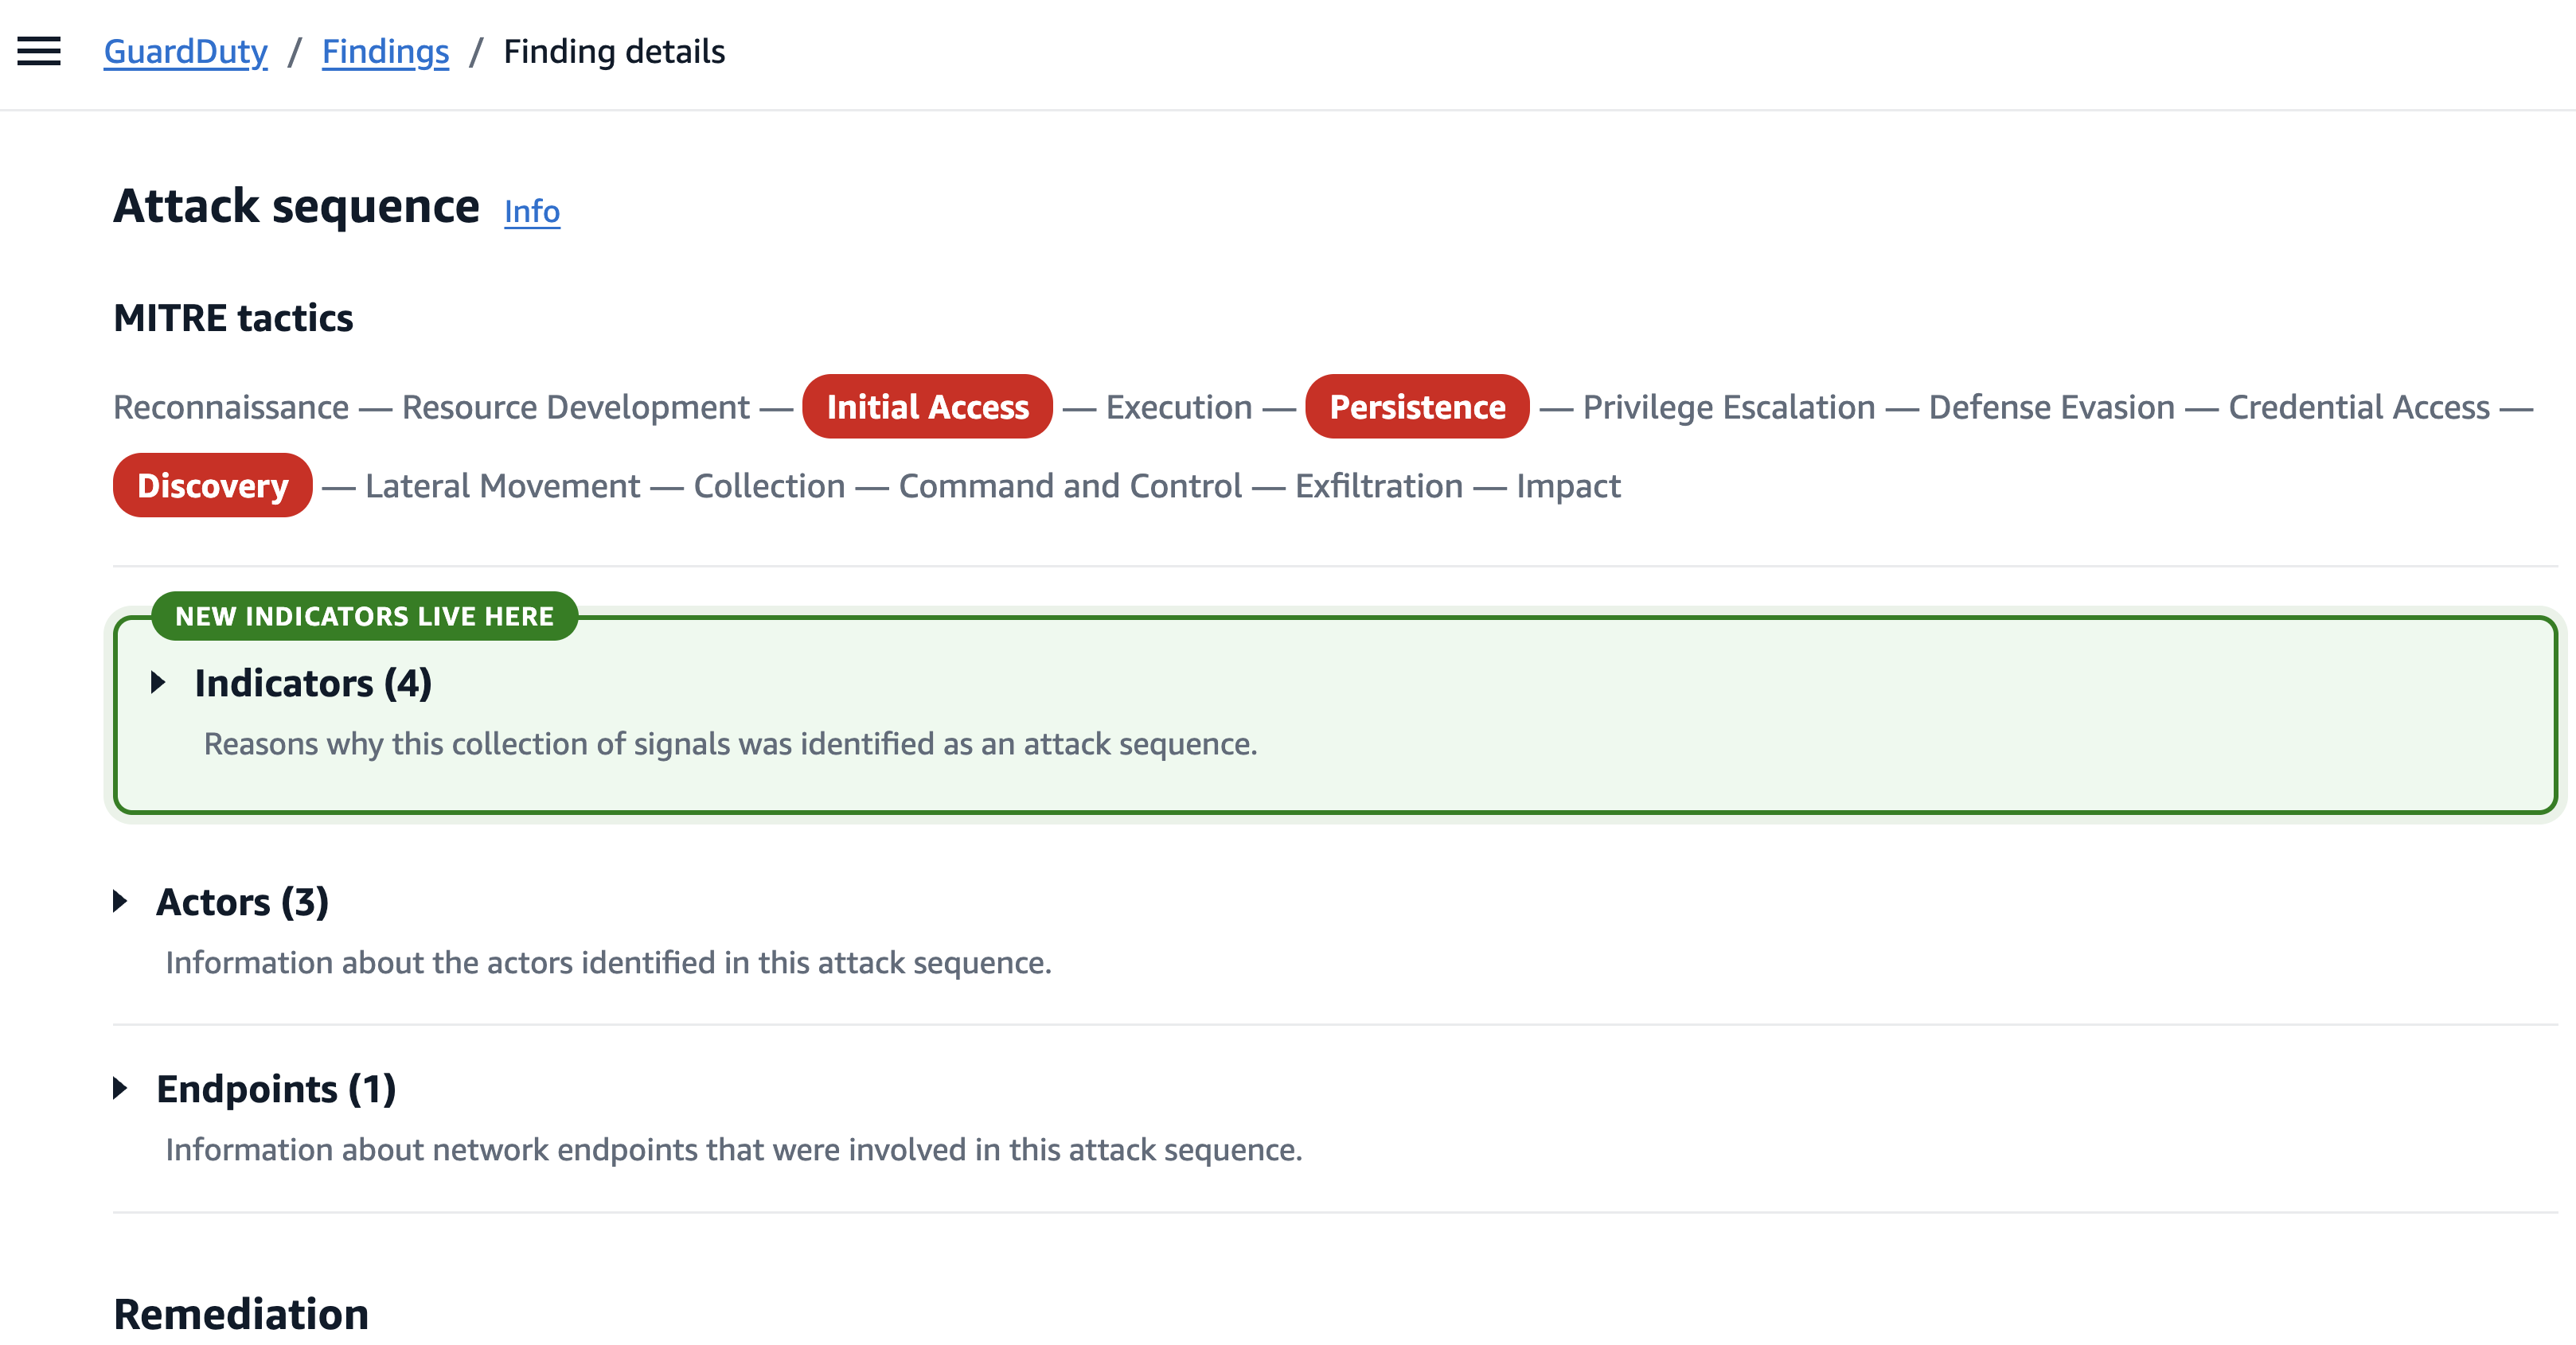
The five values appear on the Indicators tab of the attack-sequence finding in the AWS Management Console for GuardDuty and in the GetFindings JSON file.

Figure 1: Indicators section of an attack sequence finding

Figure 1: Indicators section of an attack sequence finding

A note on EPSS, because the VULNERABILITY indicator carries it. According to the FIRST EPSS overview, the score is the probability that a published CVE will be exploited in the wild in the next 30 days ranging from 0 to 1. EPSS doesn’t replace CVSS, which describes the inherent severity of a vulnerability, whereas EPSS describes how likely it is to be exploited soon making it the more useful number for incident response.

Prerequisites

To populate the indicators, you need to have the following AWS services enabled:

Strengthening weak runtime signals

Runtime signals such as a process invocation, a pod exec, or a syscall pattern can be noisy sometimes. A single runtime signal that doesn’t match a known offensive-tool path isn’t significant on its own, and without resource-state context it typically stays below the threshold for a Critical attack sequence.

The new indicators supply that missing context. When Extended Threat Detection sees a weak runtime signal on a host that also carries a combination of high-priority unpatched CVEs, a known malicious package, an IMDS misconfiguration, and internet reachability, it promotes the collection to a single CRITICAL attack sequence with high confidence. Customer feedback on individual GuardDuty runtime findings has consistently identified noise as a major pain point and adding this resource-state context is what turns those weak signals into actionable alerts.

In practice, this surfaces as a substantial increase in net-new attack-sequence findings on the runtime-process surface to roughly one in four prioritized runtime-process attack sequences, with little change on the network-indicator of compromise (IOC) surface. Within the first week of launch, this pattern showed up across many customer accounts where attack sequences that would previously have surfaced as a collection of weaker, unconnected findings now surface as a single CRITICAL finding.

Example: A net-new attack sequence on Amazon EKS

Now that you understand how Extended Threat Detection has improved through additional indicators, let’s walk through an example of how these indicators add value. In this example we analyze an actual scenario that was observed on an Amazon EKS cluster. The observed activity occurred over an 8-day period with eleven different GuardDuty findings.

Figure 2: Activity summary for the EKS cluster before Extended Threat Detection correlated the signals

Figure 2: Activity summary for the EKS cluster before Extended Threat Detection correlated the signals

What GuardDuty saw on the activity surface over 8 days as shown in Figure 2 was 55 EKS_AUDIT_LOGS signals across pod execs, role assumptions, and AssumeRoleWithWebIdentity calls and 18 finding-level signals all originating from one external IP address of 198.51.100.69. This IP address authenticated as four distinct AWS Identity and Access Management (IAM) identities to the same EKS cluster. Runtime activity on the worker nodes was generic because there was no process that matched a known offensive-tool path and no execution-profile flag was fired. Under the pre-launch correlation, this sequence would have needed the EKS_MALICIOUS_PROCESS rule to fire, which requires either a malicious exec path or an unusual-suspicious-tool profile. Neither was present in this activity, so no correlated attack-sequence finding was raised.

What the new GuardDuty Extended Threat Detection indicators added to the EKS example:

  • MALICIOUS_PACKAGE on the cluster: Amazon Inspector identifier MAL-2022-4933.
  • VULNERABILITY (full Amazon Inspector output) on the cluster: 42 CVEs total, 33 rated CRITICAL by CVSS.
    • On the cluster: 12 CVEs including CVE-2022-1471 (SnakeYAML deserialization, EPSS 0.94), CVE-2024-4577 (PHP-CGI argument injection, EPSS 0.97), CVE-2024-34351 (Next.js SSRF), CVE-2025-29927 (Next.js authentication bypass), CVE-2023-44487 (HTTP/2 Rapid Reset), and CVE-2022-37434 (zlib heap overflow, EPSS 0.92).
    • Across the five worker nodes: 379 CVEs total, with 68 of them marked CRITICAL by Amazon Inspector.
  • REACHABILITY: Cluster API endpoint internet-reachable and three of five worker nodes also internet-reachable.
  • MISCONFIGURATION (EC2 IMDS): All five worker nodes still expose IMDSv1.

When these additional indicators are taken into consideration, this surfaces as a single AttackSequence:EKS/CompromisedCluster with a CRITICAL severity, with all four populated indicators on the Indicators tab and a MITRE ATT&CK® mapping to Initial Access (External Remote Services), Discovery, and Persistence.

Figure 3: New vulnerability indicators within an attack sequence

Figure 3: New vulnerability indicators within an attack sequence

The finding lists more than 100 Amazon EC2 CVEs at the worker-node level, one CRITICAL CVSS, plus a long HIGH tail, but most are LOW vulnerability priority because their EPSS scores are low. Rather than sifting through more than 100 findings to decide which to address first, GuardDuty highlights the high-priority ones so you can focus your response efforts where they have the most impact.

Example: Cryptomining and a vulnerable host

In this second example we walk through an EC2 instance group where GuardDuty already had a strong network-based finding for cryptomining and the new indicators provided additional remediation context that made incident response faster.

Figure 4: Cryptomining attack on EC2 instances

Figure 4: Cryptomining attack on EC2 instances

A set of EC2 instances was communicating with a known cryptomining destination, which was flagged by threat intelligence as mining/misc. The network IOC evidence was strong on its own.

  • Observations added by the new indicators: VULNERABILITY listed CVE-2007-4559 Python tarfile with EPSS around 0.9 on two of the three involved instances.
  • Result: The AttackSequence:EC2/CompromisedInstanceGroup finding is now actionable beyond block the destination IP; it tells you which patch will remediate the vulnerability the cryptominer likely came in through so you can address the underlying entry point rather than only removing the outbound connection.

This attack sequence would have been generated without the vulnerability context because GuardDuty had strong evidence of cryptomining of the EC2 instance group, however, triaging is faster with more context.

Indicators of compromise observed across the first-week launch sample

The following CVEs listed, along with their EPSS scores at the time, were observed on hosts across the customer accounts that received the new Extended Threat Detection indicators during the first week after launch at the moment each indicator finding was generated. EPSS scores are point-in-time, so a CVE’s listed priority on any future finding will reflect the current EPSS rather than the values shown here.

  • CVE-2024-4577 – PHP-CGI argument injection on Windows. EPSS 0.97+.
  • CVE-2022-1471 – SnakeYAML deserialization. EPSS 0.94. Critical CVSS.
  • CVE-2022-37434 – zlib heap buffer overflow. EPSS 0.92.
  • CVE-2007-4559 – Python tarfile path-traversal. EPSS still 0.9+ in 2026.
  • CVE-2025-29927 – Next.js authentication bypass. Frequent on Node web tiers.
  • CVE-2024-34351 – Next.js SSRF.
  • CVE-2023-44487 – HTTP/2 Rapid Reset.

Runtime monitoring surfaced weak signals tied to malware and tooling artifacts recovered from the compromised hosts:

  • HackTool family Linux/frp (Fast Reverse Proxy variants were used as command-and-control tunnels), often disguised as kuboard-agent and kuboard-agent-server binaries on Amazon EKS worker nodes. Container-snapshot path matches were also observed under /var/lib/containerd/io.containerd.snapshotter.v1.overlayfs/snapshots/.../usr/bin/. The frp binaries are present inside the container image and on the node, which means rebuilding the node from an unpatched AMI won’t be sufficient remediation.
  • Burp Collaborator out-of-band callback hostnames were found under *[.]oastify[.]com, matching pattern <35-char base32>[.]oastify[.]com. These co-occurred with frp on the same EKS sequence, probably a second tool or actor on shared infrastructure.
  • The Amazon Inspector malicious-package indicator MAL-2022-4933 was found in both Amazon EC2 and Amazon EKS contexts.

Identity and access patterns correlated with the tooling signals above:

  • A single external source IP authenticated as multiple distinct human IAM identities across separate Amazon EKS, Amazon ECS, and Amazon EC2 surfaces over a short window. This was the most common identity signature on the new Amazon EKS-process net-new class.

Responding to attack sequences with these indicators

The new indicators don’t change incident-response runbooks for attack sequences that have already occurred. They matter for new findings, which are concentrated on enhancing signals related to runtime monitoring. For those:

  1. Treat the sequence with urgency. MALICIOUS_PACKAGE and a high-priority VULNERABILITY mean the host was, and still is, at risk of being compromised. Contain the exposures and remediate the vulnerabilities. Rotate every IAM credential, instance profile, or IAM Roles for Service Accounts (IRSA)-bound role that could have been exposed.
  2. Patch on EPSS-weighted priority, not alone on raw CVSS. The finding’s high-priority VULNERABILITY list is already filtered to high-EPSS CVEs.
  3. Isolate public resources indicated by REACHABILITY indicators. An internet-reachable host with exploitable vulnerabilities should be isolated for remediation.

For more support, see the remediation steps in Remediating detected GuardDuty security findings and GuardDuty Investigation, an AI-powered security analysis of your GuardDuty findings and accounts.

Conclusion

GuardDuty Extended Threat Detection can deliver more high-confidence attack sequence findings on the runtime workload surfaces where your security teams often need help most: Amazon EC2, Amazon ECS, and Amazon EKS. It does this by combining GuardDuty activity signals with resource-state context from other AWS services. Customer feedback on individual GuardDuty runtime findings has consistently identified noise as a major pain point, and correlating those weak signals with vulnerability, package-risk, reachability, misconfiguration, and sensitive-data indicators is how Extended Threat Detection turns the noise into actionable CRITICAL findings. If you’ve already enabled AWS Security Hub, Amazon Inspector, Amazon VPC Reachability Analyzer, Macie, and GuardDuty Runtime Monitoring, the new indicators automatically start showing up on your attack-sequence findings. If you aren’t using these services, we encourage you to explore enabling them to access the new GuardDuty Extended Threat Detection indicators and the value that these individual services deliver.

If you have feedback about this post, submit comments in the Comments section below. If you have questions about this post, start a new thread on AWS re:Post or contact AWS Support.


Aman Khare

Aman Khare

Aman is a senior software developer at AWS GuardDuty. He works on Extended Threat Detection, helping customers pinpoint the malicious attack chains detected in AWS infrastructure. Previously, he led performance and resiliency work on Amazon OpenSearch. Including 10x cluster-manager memory reductions and enabling 1K-node clusters. Outside work, Aman enjoys traveling, adventure activities, reading and playing board games.

Kyle Koeller

Kyle Koeller

Kyle is a security engineer in the Amazon GuardDuty team with a focus on threat detection. He’s passionate about cloud threat detection and offensive security and holds CompTIA Security+, PenTest+, CompTIA Network Vulnerability Assessment Professional, and SecurityX certifications. When not working, Kyle enjoys spending his time in the gym and exploring New York City.

Detecting multi-stage attacks on AWS: A guide to cross-service signal correlation

26 August 2026 at 19:39

A single alert from one security service tells you something happened. Read that signal alongside activity from other services and your own business context, and you will know whether what happened is part of a multi-stage attack.

Consider a short sequence. An identity calls GetCallerIdentity from a source address it hasn’t previously used. Within minutes, that same identity runs a burst of List and Describe calls across several services, and some of them fail with AccessDenied. Soon after, a large volume of data leaves your environment toward a domain that was registered last week. Amazon GuardDuty might already flag pieces of this, such as the reconnaissance from an unfamiliar source, through finding types like Recon:IAMUser/* or Discovery:S3/*. What you gain from correlating the pieces yourself is a single view of the sequence, tied to your own business context, so you can act on the whole rather than triaging findings one at a time.

This post is for security engineers and security operations teams who run Amazon Web Services (AWS) detection services and want to catch patterns specific to their environment. You will see how AWS detection and your business context fit together, and how to build correlations that use that context. The examples run in Amazon CloudWatch Logs Insights so you can try them today, and the closing section describes how to grow them into an automated pipeline. The walkthrough later in this post lists the prerequisites for these queries.

Start with AWS detection services

Begin with the AWS detection services. They cover the threats common across customers, and everything in this post is built on them.

Turn these on and tune them before you build anything custom. Tuning means adjusting sensitivity to reduce false positives for your environment, choosing which data sources each service monitors, and suppressing findings for known-good patterns.

GuardDuty correlates multi-stage attacks for you

Before you build anything by hand, see what GuardDuty already does for you. Amazon GuardDuty Extended Threat Detection correlates signals across multiple data sources including AWS CloudTrail, Amazon S3 data events, runtime monitoring, Amazon Elastic Kubernetes Service (Amazon EKS) audit logs, and more, then raises a single critical severity attack sequence finding when it spots a multi-stage pattern. It recognizes sequences such as credential compromise followed by data exfiltration, maps them to MITRE ATT&CK tactics, and attaches a timeline and remediation guidance. If you have GuardDuty enabled today, then GuardDuty Extended Threat Detection is already enabled by default and needs no queries from you. For details on how GuardDuty charges apply, see Amazon GuardDuty pricing.

The credential compromise sequence in the opening example is the kind of universal pattern GuardDuty Extended Threat Detection is built to catch, so rely on it for those. Attack sequence findings show up in the GuardDuty console next to your other findings, and they route to Security Hub and your response workflows the same way.

GuardDuty handles the threats that look the same in every account. What it doesn’t have is the context that makes a given action suspicious in your account. That’s what you provide.

Add your business context

Business context is what only you know about your environment: which buckets hold sensitive data, which principals have a reason to touch which resources, which role chains your policy permits, and when your production change windows open. GuardDuty Extended Threat Detection learns from patterns common across customers, but it can’t answer these environment-specific questions. Express them as correlations and you add a detection layer tuned to your environment. Each of the following four patterns turns one of these facts into a query.

Run these queries in the AWS Management Console for CloudWatch by choosing Logs, then Logs Insights, using the CloudWatch Logs Insights query language. Most read CloudTrail events from a CloudWatch Logs log group that your trail delivers to. If your trail writes only to Amazon S3, add CloudWatch Logs delivery on the trail, or run equivalent queries in Amazon Athena (a serverless query service for analyzing data in Amazon S3 using SQL).

Note: The queries and code in this post use placeholder values. Replace them with your own before running: your-sensitive-bucket (your S3 bucket name), your-key-id (your AWS KMS key ID), region (your AWS Region, such as us-east-1), account-id (your 12-digit AWS account ID), and aws-cloudtrail-logs-my-trail (your CloudTrail log group name).

A note on multi-account environments. In AWS Organizations, an organization trail delivers every account’s events to one log group, so these queries work as-is but return cross-account results. Filter by recipientAccountId for account-scoped views. Without an organization trail, run queries per account or use Amazon Security Lake as a central query surface.

The attack chain mapped to AWS services

Multi-stage attacks move through five phases, and each phase leaves a signal in a different service. These signals surface across three log sources: CloudTrail, which records API activity in your account; Amazon VPC Flow Logs, which capture network connection metadata; and Amazon Route 53 Resolver query logs, which record DNS queries from your VPCs.

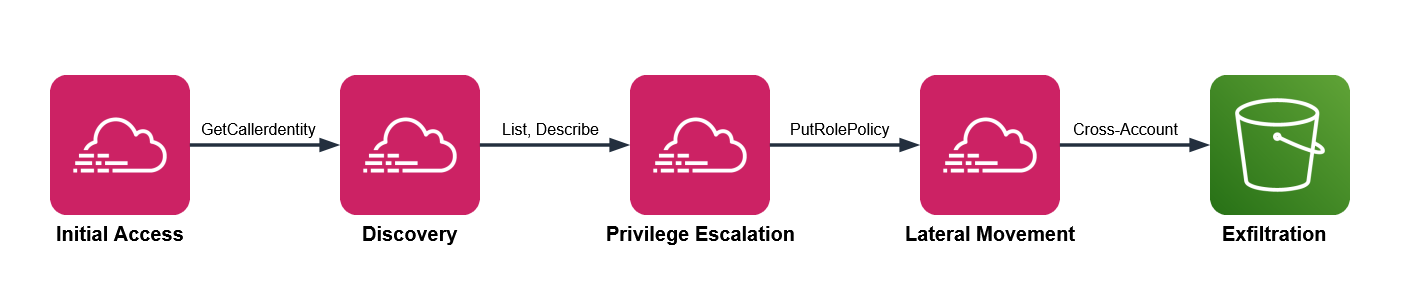
  • Initial access – Stolen credentials reach your environment. CloudTrail records GetCallerIdentity, GetSessionToken, or AssumeRole from an unfamiliar source.
  • Discovery – The threat actor enumerates with List, Describe, and Get calls, often triggering AccessDenied responses.
  • Privilege escalation – The threat actor chains roles or edits policies. CloudTrail records AssumeRole sequences, PutRolePolicy, or CreateAccessKey.
  • Lateral movement – The threat actor moves across accounts or AWS Regions, assuming roles and creating resources in unfamiliar places.
  • Exfiltration – Data leaves through GetObject calls at scale, large outbound transfers in VPC Flow Logs, and DNS queries in Route 53 Resolver query logs to recently registered domains.

Figure 1 shows the five attack phases mapped to the AWS log source that records each one.

Figure 1: Attack chain mapped to AWS services

Figure 1: Attack chain mapped to AWS services

GuardDuty Extended Threat Detection watches this chain for universal patterns. The four patterns that follow add the dimension you supply: your business context.

Pattern one: Sensitive data access by an unexpected principal

Your data classification and access norms drive this detection. One bucket holds customer records, another holds public web assets, and you know which principals have a reason to read the customer records, which are sensitive. Encode that knowledge and an ordinary looking read turns into something worth chasing.

Three signals converge here. CloudTrail shows GetObject at volume on a bucket you’ve classified as sensitive. The principal isn’t on your list of expected readers for that bucket. And VPC Flow Logs show a large outbound transfer from the same source in the same window, while DNS query logs show a recently registered destination domain, which together increase your confidence that there’s a potential threat.

CloudTrail management events don’t record GetObject. You must turn on CloudTrail data events for the buckets you care about to capture GetObject. Many teams miss GetObject because data events weren’t enabled on the relevant buckets.

This query shows bulk reads on a sensitive bucket, grouped by principal. Run it in CloudWatch Logs Insights with your CloudTrail log group selected.

fields @timestamp, userIdentity.arn, requestParameters.bucketName
| filter eventSource = "s3.amazonaws.com" and eventName = "GetObject"
| filter requestParameters.bucketName = "your-sensitive-bucket"
| stats count(*) as objectReads,
        count_distinct(requestParameters.key) as distinctObjects
        by userIdentity.arn, bin(10m)
| filter objectReads > 100
| sort objectReads desc

The threshold of 100 is a placeholder. Run the query over a week of normal activity, find the ninety-fifth percentile read count for that bucket, and set the threshold above it. Then check each principal the query returns against your expected reader list. A principal that isn’t on the list, reading at volume, is the result to investigate.

To corroborate, look for a matching outbound transfer. Switch the log group selector to your VPC Flow Logs log group and run this.

fields @timestamp, srcAddr, dstAddr, bytes
| filter action = "ACCEPT"
# exclude RFC 1918 private ranges so only external destinations remain
| filter dstAddr not like /^10\./
        and dstAddr not like /^192\.168\./
        and dstAddr not like /^172\.(1[6-9]|2[0-9]|3[0-1])\./
| stats sum(bytes) as totalBytes by srcAddr, dstAddr, bin(10m)
| filter totalBytes > 1000000000
| sort totalBytes desc

The Amazon S3 query returns a principal, and the Flow Logs query works on IP addresses, so you translate one into the other. The worked example later in this post covers that translation in full.

Picture an analytics role that reads a reporting bucket all day. One afternoon, it reads a thousand objects from your customer records bucket instead. GuardDuty stays quiet, because an authenticated role making valid GetObject calls isn’t suspicious anywhere else. Your query flags it, because that role isn’t on the expected reader list for that bucket. The classification you applied is what turns silence into a signal.

Figure 2 shows a bulk read from a sensitive bucket in CloudTrail, a large outbound transfer in VPC Flow Logs, and a young domain resolution in Route 53 Resolver logs.

Figure 2: Three signals converging within a single time window to indicate exfiltration

Figure 2: Three signals converging within a single time window to indicate exfiltration

Pattern two: A role chain that crosses your access policy

Picture a deployment that assumes one role to build, then a second to release. For one principal, that two-hop AssumeRole chain is routine; for a different principal it’s a policy violation. This pattern relies on your trust topology—the chains your organization permits—so put that knowledge in the query.

This pattern needs three conditions:

  • CloudTrail shows several AssumeRole calls from the same source inside a short window
  • The chain ends in a sensitive action such as CreateAccessKey, PutRolePolicy, or AttachUserPolicy
  • The starting identity isn’t one your policy expects to run that chain

In CloudWatch Logs Insights, select your CloudTrail log group and run this query, which surfaces chains of two or more hops.

fields @timestamp, userIdentity.arn, requestParameters.roleArn, sourceIPAddress
| filter eventName = "AssumeRole"
| stats count(*) as assumeCount,
        count_distinct(requestParameters.roleArn) as rolesAssumed
        by sourceIPAddress, bin(5m)
| filter assumeCount >= 2 and rolesAssumed >= 2
| sort assumeCount desc

Two hops is the minimum for a chain; raise the count if your environment chains roles often. Your deployment pipeline probably assumes several roles an hour, as do AWS service principals such as AWS Security Hub. Exclude the identities you expect to see assuming multiple roles, including your pipeline role and known AWS service principals. What’s left is the set to investigate, such as a person assuming several roles at an odd hour and ending in a new access key. Treat that distinction as data: list the identities and actions you consider normal, and review the chains that fall outside the list.

Pattern three: An encryption key used outside its owning workload

Resource ownership is the signal here. A given AWS Key Management Service (AWS KMS) key creates and controls the encryption keys for a workload, and a single key should serve a single workload, such as a payments service. A Decrypt call against it is a valid, authorized API action, so nothing about the call itself looks wrong. The ownership rule you set is what makes another principal’s use of the key worth a second look.

This pattern applies only to customer-managed keys scoped to one workload. It doesn’t apply to AWS-managed keys (alias/aws/*) or to customer-managed keys intentionally shared across services. Confirm single-workload intent from the key policy’s Principal block before deploying this rule.

Two conditions indicate misuse:

  • CloudTrail shows Decrypt or GenerateDataKey calls on a key that’s tied to one workload
  • The calling principal isn’t the role that owns that workload

Against your CloudTrail log group, run this query to list the principals that called a specific key.

fields @timestamp, userIdentity.arn, eventName
| filter eventSource = "kms.amazonaws.com"
| filter eventName in ["Decrypt", "GenerateDataKey", "Encrypt"]
| filter resources.0.ARN = "arn:aws:kms:region:account-id:key/your-key-id"
| stats count(*) as keyUses by userIdentity.arn, eventName
| sort keyUses desc

Compare what comes back against the one workload role you expect. A principal you don’t recognize on that key is the signal. Because key misuse is an early move in data theft, this correlation catches activity that only your ownership knowledge can flag.

Consider a key that wraps your payments database. The payments service role calls it in normal operation, and nothing else should. If a developer role or a freshly created role runs Decrypt against it, the call succeeds and reads as ordinary in isolation. The reason it matters is the ownership rule you hold in your head and now state in this query.

Pattern four: A privileged action outside your change window

Start with the query, then read what it means.

fields @timestamp, userIdentity.arn, eventName, sourceIPAddress
| filter eventName in ["PutRolePolicy", "AttachRolePolicy",
        "CreateAccessKey", "AuthorizeSecurityGroupIngress", "PutBucketPolicy"]
| stats count(*) as sensitiveChanges by userIdentity.arn, eventName, sourceIPAddress
| sort sensitiveChanges desc

Run it against your CloudTrail log group, scoped to your off-hours window when you schedule it, so it returns only activity outside the change window. Your change process defines what normal looks like here: production security and identity changes flow through a pipeline during defined hours, run by a known actor. A console-driven policy change at 2:00 AM, made by a person rather than the pipeline, doesn’t fit those expectations. The signal is a sensitive change such as PutRolePolicy or AuthorizeSecurityGroupIngress, made outside the window, by a person rather than your pipeline role.

Exclude the actors you expect, such as your deployment pipeline role, your patch automation role, and AWS service principals like AWS CloudFormation and AWS Systems Manager. What remains is privileged change made outside your process, which is both what an attacker does to establish persistence and what your own change discipline says shouldn’t happen.

Your pipeline might open security group rules during a deployment every weekday afternoon. A person opening a security group rule at midnight on a weekend is the same API call carrying a very different meaning. The schedule and the actor, both facts you define, are what separate the two.

Build your first correlation rule

The following walkthrough uses pattern one as a complete example. The other three patterns follow the same design with their own queries.

Prerequisites

These prerequisites feed the queries in this walkthrough. Confirm each one before you start:

  • A CloudTrail trail logging management events to a CloudWatch Logs log group
  • CloudTrail data events enabled for your sensitive S3 buckets
  • GuardDuty enabled, with its protection plans and Extended Threat Detection
  • VPC Flow Logs on for your production VPCs
  • Amazon Route 53 Resolver query logging on

CloudTrail, GuardDuty, VPC Flow Logs, and Route 53 Resolver query logging provide the raw signals that your correlations connect. Without them, the queries in this post return empty results.

Step 1: Record the bucket and its expected readers

Choose one sensitive bucket to monitor, and write down the principals allowed to read it. Store the list where your automation can reach it, such as a configuration file in version control or an Amazon DynamoDB table (a managed NoSQL database).

{
  "customer-records-prod": [
    "arn:aws:iam::123456789012:role/AnalyticsPipeline",
    "arn:aws:iam::123456789012:role/ComplianceAudit"
  ],
  "financial-data-archive": [
    "arn:aws:iam::123456789012:role/FinanceReporting"
  ]
}

This example hardcodes the list for simplicity. In production, load it from a DynamoDB table or Parameter Store so you can update it without redeploying.

Step 2: Baseline before you set a threshold

Run the pattern one query over one week of normal activity. Find the 95th percentile read count for the bucket and use a value greater than that as your alert threshold. This step keeps legitimate high-volume access from generating false positives later.

Set the THRESHOLD_READS environment variable to this value when you configure the function in Step 5.

Step 3: Run the access query

In the CloudWatch console:

  1. Choose Logs, then choose Logs Insights.
  2. In the Select log group(s) dropdown, select your CloudTrail log group.
  3. Set the time range to 3h (the last three hours).
  4. In the query editor, paste the pattern one query.
  5. Replace your-sensitive-bucket with your bucket name.
  6. Choose Run query.
  7. Review the principals in the results table.
  8. Compare each principal against your expected reader list from step 1, and flag any that are not on it.

Each result includes a principal that step 4 translates into an IP address.

Step 4: Correlate with network activity

CloudTrail logs actions by AWS Identity and Access Management (IAM) principal, while VPC Flow Logs record traffic by IP address. To connect the two signals, translate the principal into its address.

For a role attached to an Amazon Elastic Compute Cloud (Amazon EC2) instance, the userIdentity.principalId field includes the instance ID after the colon, in the form AROAEXAMPLE:i-1234567890abcdef0. Copy the instance ID and look up its private IP address.

aws ec2 describe-instances \
  --instance-ids i-1234567890abcdef0 \
  --query "Reservations[0].Instances[0].PrivateIpAddress" \
  --output text

Other compute types differ. A VPC-connected AWS Lambda function sends traffic through elastic network interfaces in your subnets, so correlate on those interface addresses. An Amazon Elastic Container Service (Amazon ECS) task records its network interface in task metadata. For a plain assumed-role session with no instance behind it, the sourceIPAddress field in CloudTrail already holds the caller’s address, so you correlate on it directly.

Run the Flow Logs query from pattern one, filtering srcAddr to that address within 10 minutes of the Amazon S3 read timestamp. A match places the same source behind both the sensitive read and a large external transfer in one window. CloudTrail events reach CloudWatch Logs 5–15 minutes after the API call, so correlate on eventTime rather than query time. Query a wider lookback than your correlation window: for example, look back 30 to 60 minutes but correlate on a 10-minute eventTime window. Steps 3 and 4 are manual validation; step 5 automates them.

Figure 2 shows DNS resolution as a third corroborating signal. This walkthrough implements the CloudTrail and VPC Flow Logs correlation. To add DNS, apply the same run_query() pattern against your Route 53 Resolver query log group.

Step 5: Automate the check

Move the query into a Lambda function (serverless compute that runs your code without a server to manage), send results to a notification channel, and schedule regular runs. Work through the following sub-procedures.

To create the notification channel

  1. Open the Amazon Simple Notification Service (Amazon SNS) console. Amazon SNS is a managed messaging service that delivers notifications to subscribers.
  2. In the navigation pane, choose Topics.
  3. Choose Create topic.
  4. For Type, select Standard.
  5. For Name, enter security-correlation-alerts.
  6. Choose Create topic.
  7. Note the topic Amazon Resource Name (ARN) at the top of the topic details page. You will use it in the function.
  8. Choose Create subscription.
  9. For Protocol, select Email.
  10. For Endpoint, enter your email address or incident management endpoint.
  11. Choose Create subscription, then confirm the subscription from the email AWS sends.

To create the EventBridge Scheduler execution role

The schedule needs a role that lets it invoke your function, and its trust policy needs conditions that pin the role to the schedule you own. Without those conditions, another account with access to the scheduler service could theoretically call this role; a class of misuse known as the confused deputy problem.

1. Create a trust policy file named scheduler-trust-policy.json.

{
  "Version": "2012-10-17",
  "Statement": [
    {
      "Effect": "Allow",
      "Principal": { "Service": "scheduler.amazonaws.com" },
      "Action": "sts:AssumeRole",
      "Condition": {
        "StringEquals": {
          "aws:SourceAccount": "ACCOUNT-ID"
        },
        "ArnLike": {
          "aws:SourceArn": "arn:aws:scheduler:REGION:ACCOUNT-ID:schedule/*/s3-access-correlation-hourly"
        }
      }
    }
  ]
}

2. Create the role, then attach permission to invoke the function. Scope Resource to the specific function ARN so this role can’t invoke anything else.

aws iam create-role \
  --role-name EventBridgeSchedulerRole \
  --assume-role-policy-document file://scheduler-trust-policy.json

aws iam put-role-policy \
  --role-name EventBridgeSchedulerRole \
  --policy-name LambdaInvokePolicy \
  --policy-document '{
    "Version": "2012-10-17",
    "Statement": [
      {
        "Effect": "Allow",
        "Action": "lambda:InvokeFunction",
        "Resource": "arn:aws:lambda:REGION:ACCOUNT-ID:function:CorrelationFunction"
      }
    ]
  }'

When you create the function, Lambda automatically creates an execution role. You will attach the permissions this function needs to that role in a later step.

To deploy the correlation function

  1. Open the Lambda console.
  2. Choose Create function.
  3. For Function name, enter CorrelationFunction.
  4. For Runtime, select the latest Python runtime.
  5. Choose Create function.
  6. On the Code tab, replace the default code with the following function, then choose Deploy.
import os
import time
import logging
import boto3
from botocore.exceptions import ClientError

logger = logging.getLogger()
logger.setLevel(logging.INFO)

logs = boto3.client("logs")
sns = boto3.client("sns")
ec2 = boto3.client("ec2")

CLOUDTRAIL_LOG_GROUP = os.environ["CLOUDTRAIL_LOG_GROUP"]
FLOWLOGS_LOG_GROUP = os.environ["FLOWLOGS_LOG_GROUP"]
SNS_TOPIC = os.environ["SNS_TOPIC_ARN"]
BUCKET = os.environ["SENSITIVE_BUCKET"]
THRESHOLD = int(os.environ.get("THRESHOLD_READS", "100"))

# Expected readers per bucket
EXPECTED_READERS = {
    "customer-records-prod": [
        "arn:aws:iam::123456789012:role/AnalyticsPipeline",
        "arn:aws:iam::123456789012:role/ComplianceAudit",
    ],
}


def run_query(log_group, query, start, end):
    """Start a Logs Insights query and wait for it to finish."""
    started = logs.start_query(
        logGroupName=log_group,
        startTime=start,
        endTime=end,
        queryString=query,
    )
    query_id = started["queryId"]
    while True:
        outcome = logs.get_query_results(queryId=query_id)
        if outcome["status"] in ("Complete", "Failed", "Cancelled"):
            break
        time.sleep(1)
    if outcome["status"] != "Complete":
        raise RuntimeError(f"Query did not complete: {outcome['status']}")
    return [{f["field"]: f["value"] for f in row} for row in outcome["results"]]


def private_ip_for_principal(principal_id):
    """Resolve an EC2 instance role principalId to its private IP."""
    if ":" not in principal_id:
        return None
    instance_id = principal_id.split(":", 1)[1]
    if not instance_id.startswith("i-"):
        return None
    reservations = ec2.describe_instances(InstanceIds=[instance_id])
    for reservation in reservations["Reservations"]:
        for instance in reservation["Instances"]:
            return instance.get("PrivateIpAddress")
    return None


def egress_bytes(src_addr, start, end):
    """Sum external egress bytes for one source address."""
    query = f"""
    fields srcAddr, dstAddr, bytes
    | filter action = "ACCEPT" and srcAddr = "{src_addr}"
    | filter dstAddr not like /^10\\./
            and dstAddr not like /^192\\.168\\./
            and dstAddr not like /^172\\.(1[6-9]|2[0-9]|3[0-1])\\./
    | stats sum(bytes) as totalBytes
    """
    rows = run_query(FLOWLOGS_LOG_GROUP, query, start, end)
    if rows and rows[0].get("totalBytes"):
        return int(rows[0]["totalBytes"])
    return 0


def lambda_handler(event, context):
    try:
        # 1-hour lookback absorbs CloudTrail's 5-15 min delivery latency;
        # correlation happens on eventTime via 10-min bins in the query below.
        end = int(time.time())
        start = end - 3600  # 1 hour lookback
        allowed = EXPECTED_READERS.get(BUCKET, [])

        access_query = f"""
        fields userIdentity.arn, userIdentity.principalId
        | filter eventSource = "s3.amazonaws.com" and eventName = "GetObject"
        | filter requestParameters.bucketName = "{BUCKET}"
        | stats count(*) as objectReads
                by userIdentity.arn, userIdentity.principalId, bin(10m)
        | filter objectReads > {THRESHOLD}
        """

        for row in run_query(CLOUDTRAIL_LOG_GROUP, access_query, start, end):
            principal = row.get("userIdentity.arn")
            if not principal or principal in allowed:
                continue

            message = (
                f"Principal {principal} read {row.get('objectReads')} "
                f"objects from {BUCKET}."
            )

            ip = private_ip_for_principal(row.get("userIdentity.principalId", ""))
            if ip and egress_bytes(ip, start, end) > 1_000_000_000:
                message += (
                    f" The same source ({ip}) also sent a large volume of "
                    f"data to external destinations in the same window."
                )

            sns.publish(
                TopicArn=SNS_TOPIC,
                Subject="Unexpected S3 access detected",
                Message=message,
            )
    except ClientError as error:
        logger.error(f"AWS API error: {error}")
        raise
    except Exception as error:
        logger.error(f"Unexpected error: {error}")
        raise
    finally:
        logger.info("Correlation check completed")
  1. On the Configuration tab, choose General configuration, then choose Edit. Set Timeout to 5 minutes (300 seconds). CloudWatch Logs Insights queries run asynchronously and can take 30 to 60 seconds against large log groups. Choose Save.
  2. On the Configuration tab, choose Environment variables, then choose Edit, and add CLOUDTRAIL_LOG_GROUP, FLOWLOGS_LOG_GROUP, SNS_TOPIC_ARN, SENSITIVE_BUCKET, and THRESHOLD_READS.
  3. On the Configuration tab, choose Permissions, open the execution role, and attach the following least-privilege policy.
{
  "Version": "2012-10-17",
  "Statement": [
    {
      "Effect": "Allow",
      "Action": ["logs:StartQuery", "logs:GetQueryResults"],
      "Resource": [
        "arn:aws:logs:REGION:ACCOUNT-ID:log-group:aws-cloudtrail-logs-my-trail:*",
        "arn:aws:logs:REGION:ACCOUNT-ID:log-group:vpc-flow-logs:*"
      ]
    },
    {
      "Effect": "Allow",
      "Action": "ec2:DescribeInstances",
      "Resource": "*"
    },
    {
      "Effect": "Allow",
      "Action": "sns:Publish",
      "Resource": "arn:aws:sns:REGION:ACCOUNT-ID:security-correlation-alerts"
    }
  ]
}

Replace REGION, ACCOUNT-ID, and the log-group names with your values. The ec2:DescribeInstances action doesn’t support resource-level permissions, so Resource: "*" is required for that statement; the other statements are scoped to specific ARNs.

To schedule automated runs

Amazon EventBridge (a serverless event bus that connects applications using events) runs targets on a schedule. Create one from the command line, using the role you made earlier.

aws scheduler create-schedule \
  --name s3-access-correlation-hourly \
  --schedule-expression "rate(1 hour)" \
  --target "Arn=arn:aws:lambda:REGION:ACCOUNT-ID:function:CorrelationFunction,RoleArn=arn:aws:iam::ACCOUNT-ID:role/EventBridgeSchedulerRole" \
  --flexible-time-window "Mode=OFF"

Step 6: Add enrichment context (optional)

Enrichment cuts triage time by adding an independent signal, but it isn’t required for the correlation to work. This step adds costs. You pay your geolocation provider for API calls, and the additional Lambda execution time increases your Lambda charges. To add IP geolocation, sign up for a geolocation API, add this function to the code, and call it where the handler resolves an IP.

import urllib.request
import json

def geo_context(ip_address):
    """Enrich an IP address with geolocation data from your provider."""
    try:
        url = f"https://your-geolocation-api.example/json/{ip_address}"
        with urllib.request.urlopen(url, timeout=5) as response:
            data = json.load(response)
        return {
            "country": data.get("country_name"),
            "city": data.get("city"),
            "org": data.get("org"),
        }
    except Exception as error:
        logger.warning(f"Geolocation lookup failed for {ip_address}: {error}")
        return None

Inside the handler’s loop, after you resolve ip, append the location to the alert.

            if ip:
                geo = geo_context(ip)
                if geo:
                    message += (
                        f" Source location: {geo['city']}, "
                        f"{geo['country']} ({geo['org']})."
                    )

Step 7: Scale to additional patterns and accounts

As your library grows, move the logic into automated pipelines with EventBridge, Lambda, and AWS Step Functions (a serverless orchestration service that coordinates multiple services into workflows), and surface correlations next to findings in Security Hub. For cross-service correlation at scale, CloudWatch unified data and telemetry capabilities can convert security and compliance data into the OCSF format and let you query sources such as CloudTrail, VPC Flow Logs, and DNS logs from one interface. Security Lake with Athena is a strong option for long-term analysis. Choose the endpoint that fits your retention and query needs.

Figure 3 shows a correlation pipeline built on AWS services including EventBridge, Lambda, Step Functions, and AWS Security Hub. The pipeline runs from data sources through scheduled queries and enrichment to automated response and centralized visibility.

Figure 3: A correlation pipeline built on AWS services

Figure 3: A correlation pipeline built on AWS services

Conclusion

You now have four correlation patterns that layer your business context on top of GuardDuty Extended Threat Detection to catch attacks specific to your environment. A few principles carry across every correlation you build.

  • Identity is your primary correlation key: Track the same principal across services.
  • Time windows matter, but they depend on the attack: Events minutes apart are usually related for fast, automated sequences; the ten-minute bins here work for that pattern. Slow or manual reconnaissance can stretch across hours or days, so widen the window when the pattern is deliberate rather than automated.
  • Context is what you add: Your data classification, access norms, resource ownership, and change windows are signals you bring to detection.
  • Start with one rule: A single well-tuned correlation catches more significant activity than a wall of uncorrelated alerts.

GuardDuty Extended Threat Detection handles the multi-stage patterns common across customers. The correlations in this post add the layer that only your business context can supply. Start with one pattern this week, validate it against your own traffic, and add the next pattern after the first proves reliable.

Have you built correlation rules for patterns not covered here? Share your experience in the Comments section below.

Further reading


Nisha Kashyap

Nisha Kashyap

Nisha Kashyap is a Senior Support Security Engineer at AWS. She works on threat detection and security operations, helping customers investigate security events and build detection that connects signals across AWS services and reflects their own environment.

Introducing the Amazon GuardDuty investigation agent: on-demand AI-powered threat assessment

20 July 2026 at 23:59

The new Amazon GuardDuty investigation agent (now in public preview) investigates security findings across your Amazon Web Services (AWS) environment, reducing investigation time from hours to minutes.

GuardDuty is our managed threat detection service that continuously monitors your AWS accounts and workloads for suspicious, potentially malicious activity, and unauthorized behavior, delivering detailed security findings for visibility and remediation.

Whether you’re investigating a single suspicious finding or assessing security posture across your entire organization, the investigation agent provides structured assessments providing risk levels, confidence scores, and actionable recommendations.

Security teams can spend hours investigating security findings and correlating data across multiple tools. The GuardDuty investigation agent automates this correlation, providing actionable intelligence, built directly into GuardDuty and accessible on demand through the AWS Management Console, AWS Command Line Interface (AWS CLI), AWS APIs, or AWS SDKs.

This post shows you how to:

  • Enable the investigation agent in your GuardDuty console.
  • Create your first investigation through the console or AWS CLI.
  • Use the investigation agent with the AWS MCP server for AI-assisted security operations

Key features of the GuardDuty investigation agent

The GuardDuty investigation agent provides APIs using the same patterns you already know from GuardDuty. Each completed investigation returns a risk level, confidence assessment, MITRE ATT&CK® technique mapping, resource mapping, and prioritized recommendations.

You can scope investigations from the console for a specific finding, an account, or all accounts across your organization. Alternatively, the AWS CLI and API accept a free-form trigger prompt of up to 2,048 characters, so you can describe what to investigate in natural language and guide the analysis of the agent by specifying areas of concern, suspected root causes, or priorities for the investigation.

The investigation agent APIs are also available through the official AWS MCP server, part of the Agent Toolkit for AWS, enabling integration into your existing security toolchains and AI-powered workflows. You don’t need to manage or interact with the agent directly. Call API endpoints, and the agent investigates findings, correlates evidence, and delivers an assessment without the overhead of managing complex configurations.

How the investigation agent analyzes findings

When you create an investigation, the agent uses cross-Region inference to process your findings based on scope and produces a structured output.

Cross-Region inference – GuardDuty investigation uses the Cross-Region Inference Service (CRIS), which selects the optimal AWS Region within your geography to process the investigation assessment. Your data remains stored only in the Region where the investigation request originates. However, investigation data and summary results might be processed outside that Region. Data is transmitted encrypted across the secure network provided by Amazon.

For more information about which inference Regions your request might be routed to see the Cross-Region inference routing table located in the investigation section of the Amazon GuardDuty User Guide.

Investigation output – Each completed investigation produces the following insights: Risk level (Info, Low, Medium, High, or Critical), Confidence (Unknown, Low, Medium, or High), Summary (description of findings and key observations), Investigation Details (additional context), and Recommended Actions (detailed actions including AWS CLI commands).

Account scoping – Account specification is required only when investigating a specific member account. For broader scopes such as your entire organization, no account ID is needed. The agent will only investigate findings within accounts you’re authorized to access per the authorization model that follows.

Prerequisites

Before you get started, make sure you have the following prerequisites in place:

  • Amazon GuardDuty enabled in your account
  • AWS account in a supported Region (see Availability section)

Required IAM permissions

You will need three new permissions: guardduty:CreateInvestigation to start new investigations, guardduty:GetInvestigation to retrieve results, and guardduty:ListInvestigations to view investigations for a given detector.

Example IAM policy:

{
  "Version": "2012-10-17",
  "Statement": [
    {
      "Effect": "Allow",
      "Action": [
        "guardduty:CreateInvestigation",
        "guardduty:GetInvestigation",
        "guardduty:ListInvestigations"
      ],
      "Resource": "*"
    }
  ]
}

Authorization model

Administrator accounts can create investigations, retrieve results, and view investigation lists for themselves and their member accounts. Member accounts can only retrieve results and view investigation lists for their own account. Member accounts can’t create investigations and can’t access investigations belonging to other accounts or the administrator account. Account specification is required only when investigating a specific member account. For your own account or accounts across your organization, no account ID is needed.

To enable and create your first investigation

Before you begin, verify you have the required IAM permissions as described in the prerequisites .

  1. Open the AWS Management Console in the desired supported Region and navigate to Amazon GuardDuty.
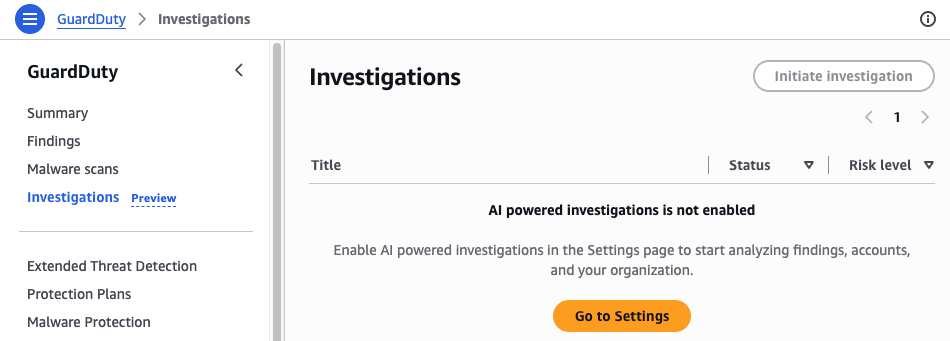
  2. In the navigation pane, choose Investigations.
Figure 1: GuardDuty investigation dashboard

Figure 1: GuardDuty investigation dashboard

  1. If investigations aren’t enabled choose Go to Settings and then enable investigations by choosing Enable.
Figure 2: GuardDuty investigations enablement screen

Figure 2: GuardDuty investigations enablement screen

  1. After investigations are enabled, navigate back to the investigations page.
  2. In the navigation pane, choose Initiate Investigation.
Figure 3: GuardDuty initiate investigation

Figure 3: GuardDuty initiate investigation

  1. Select a scope for your investigation:
    • Enter a GuardDuty Finding ID: Use when you want to investigate a specific GuardDuty finding in depth
    • Enter an AWS Account ID: Use when you want to assess the overall security posture of a specific AWS account
    • All accounts: Use for organization-wide security assessment or when investigating potential lateral movement
    • Choose Initiate investigation.
Figure 4: GuardDuty investigation setup

Figure 4: GuardDuty investigation setup

  1. Wait for the investigation to complete (typically 2–5 minutes for account level and 10–12 minutes for specific finding investigations during preview). The status updates automatically.
  2. When the investigation completes, select the investigation title to view the full assessment.
Figure 5: GuardDuty investigation completed menu

Figure 5: GuardDuty investigation completed menu

The investigation assessment contains detailed information about the investigation including general information, a summary of the investigation, mapping, assessment of the threat, and recommended actions.

The General Information section displays the investigation ID, status, triggered-by account, and creation timestamp.

Figure 6: General information section of the assessment

Figure 6: General information section of the assessment

The summary section provides a narrative of key observations and findings.

Figure 7: Summary section of the assessment

Figure 7: Summary section of the assessment

The mapping section shows attack techniques and affected AWS resources.

Figure 8: MITRE ATT&CK mapping section of the assessment

Figure 8: MITRE ATT&CK mapping section of the assessment

The Threat Assessment section displays the risk level, confidence score, and detailed threat analysis.

Figure 9: Threat assessment section

Figure 9: Threat assessment section

The Recommended Actions section lists prioritized remediation steps.

Figure 10: Recommended actions section of the assessment

Figure 10: Recommended actions section of the assessment

Investigations can also be conducted with the AWS CLI or SDK using the following API endpoints:

  • CreateInvestigation – Initiates a GuardDuty investigation that automatically analyzes security findings, correlates related activity, performs account-level analysis, and produces a structured investigation summary with recommended next steps.
  • GetInvestigation – Retrieve the status and results of a specific investigation, including the assessment from the agent, correlated evidence, and recommended actions when completed.
  • ListInvestigations – View investigations across your environment with filtering and pagination.

To run investigations using the AWS CLI

Investigations are asynchronous because the agent queries multiple data sources, correlates findings across services, and performs AI-based analysis. After creating an investigation, you’ll need to check its status periodically until it completes.

Step 1: Find your detector ID

Each GuardDuty deployment has a unique detector ID per-account and per-Region that identifies your specific GuardDuty configuration. You will need this for all AWS CLI operations, especially if you have GuardDuty enabled in multiple Regions. You can find your detector ID in the GuardDuty console under Settings, or by running the following command and specifying the Region. For example, if the GuardDuty detector of interest were in the us-east-1 (N. Virginia) Region

aws guardduty list-detectors –-region=us-east-1

Expected response:

{
  "DetectorIds": [
    "12abc34d567e8fa901bc2d34eexample"
  ]
}

Note: the DetectorIDvalue from the response, you will use it in all subsequent commands.

Or if working only in the same Region, the session can be set as an environment variable to avoid repetition, for example on Linux:

export AWS_DEFAULT_REGION=us-east-1

See the AWS CLI documentation for guidance on configuring this for additional operating systems.

Step 2: Create an investigation

The following is an example of code to investigate a specific finding:

aws guardduty create-investigation us-east-1 \
--detector-id 12abc34d567e8fa901bc2d34eexample \
--trigger-prompt "Investigate this finding ID 1ab2c3d4e5f6a7b8c9d0e1f2a3b4c5d6"

The --trigger-prompt parameter is useful when you have context that isn’t captured in GuardDuty metadata or consumable through the API.

Expected response:

{
  "InvestigationId":"a1b2c3d4-5678-90ab-cdef-ef1234567890"
}

To investigate findings across an entire AWS account, use the following example:

aws guardduty create-investigation –-region=us-east-1 \
--detector-id 12abc34d567e8fa901bc2d34eexample \
--trigger-prompt “Investigate findings in Account 123456789012”

To investigate findings across an entire organization:

aws guardduty create-investigation –-region=us-east-1 \
--detector-id 12abc34d567e8fa901bc2d34eexample \
--trigger-prompt “Investigate findings across my AWS Organization”

Step 3: Check investigation status

Check the status of the investigation shown here using the AWS CLI query command to filter and list only the Status section of the output for simplicity:

aws guardduty get-investigation –-region=us-east-1 \
--detector-id 12abc34d567e8fa901bc2d34eexample \
--investigation-id a1b2c3d4-5678-90ab-cdef-ef1234567890 --query 'Investigation.Status'

Repeat this command until the Status field shows COMPLETED.

Example completed response output:

{
  "Investigation": {
    "InvestigationId": "a1b2c3d4-5678-90ab-cdef-ef1234567890",
    "Status": "COMPLETED",
    "TriggerPrompt": "Investigate finding 1ab2c3d4e5f6a7b8c9d0e1f2a3b4c5d6 in account 123456789012",
    "TriggeredBy": "123456789012",
    "RiskLevel": "Critical",
    "Risk": "Active multi-stage runtime compromise on EKS worker node with root-privileged reverse shell, Docker socket access, malicious file execution, and 500 multi-tactic runtime signals — behavioral evidence is consistent with a genuine intrusion.",
    "Confidence": "High",
    "Summary": "{\"keyObservations\":{\"title\":\"...\",\"narrative\":\"...\",\"observations\":[...]},\"countermeasures\":[...],\"threatAssessment\":{...}}",
    "Cloud": {
      "Provider": "AWS",
      "Region": "us-east-1",
      "Account": "123456789012"
    },
    "Metadata": {
      "Product": {
        "Name": "AmazonGuardDuty AI Analyst",
        "Feature": "Investigation"
      },
      "Version": "1.0.0"
    },
    "StartTime": 1705319400.0,
    "EndTime": 1705319700.0
  }
}
  • Status values – RUNNING, COMPLETED, FAILED
  • Timing – Investigation times can very. Checking status every 30 seconds should be sufficient to yield results.
  • If status shows FAILED – Review the error message in the response and verify your permissions match the authorization model requirements.

To list all investigations for a given detector run the following, the max-results command is optional but useful to filter the number of returned results.

aws guardduty list-investigations –-region=us-east-1 \
--detector-id 12abc34d567e8fa901bc2d34eexample \
--max-results=10

Beyond running investigations manually, the API-first design addresses a common customer pattern: sending GuardDuty findings to third-party tools. You can now add automated investigation to those existing pipelines, so your team receives enriched, prioritized intelligence rather than raw alerts.

Consider a customer that routes GuardDuty findings through Amazon EventBridge to their Security Information and Event Management (SIEM) platform, where analysts manually investigate each alert. With the investigation agent, an AWS Lambda function can be placed into the pipeline that calls CreateInvestigation with the finding ID, waits for completion, and forwards the enriched results (risk level, confidence score, MITRE ATT&CK mapping, and recommended actions) to their SIEM alongside the original finding. Critical findings route directly to the customer incident response queue for further analysis or automation. Low-risk findings with high confidence get auto-closed or batched for weekly review. The analyst’s time shifts from repetitive log correlation to validating assessments and acting on confirmed threats.

This pattern works with SIEMs, ticketing systems, or automation platforms that can be customized to use the API or EventBridge messaging. The investigation agent fits into the pipeline as a processing step, not a destination.

The agent is fine-tuned on investigating GuardDuty findings. It’s distinct from other AWS frontier agents such as the AWS Security Agent and AWS DevOps Agent. The scope of the investigation agent is focused to deliver specialized analysis of GuardDuty findings.

Integration with the AWS MCP server

The Model Context Protocol (MCP) is an open standard that allows AI assistants to securely connect to external data sources and tools. Because the AWS MCP server implements this standard for AWS services, you can use it to add GuardDuty investigations into AI-powered workflows using tools like Kiro, Anthropic’s Claude, or other MCP-compatible clients.

To configure the AWS MCP server

  1. Configure your MCP client to connect to the AWS MCP server.
  2. Use natural language to invoke investigations (for example,“Investigate the recent Unauthorized Access finding for account 123456789012″).
  3. Review the investigation results returned through your MCP client. These results can vary depending on the model or agent being used, configuration, and the non-deterministic nature of AI.

Integrate the results into your existing agent automation or take manual action based on the findings.

Additional usage examples

  • “Investigate the latest high-severity finding in my production account”
  • “Create an investigation for finding ID abc123 in account 987654321098 and summarize what happened”
  • “List investigations from the last 24 hours and flag those that need human review”

How the investigation agent relates to AWS Security Incident Response

At re:Invent 2024, AWS launched AWS Security Incident Response (AWS SIR), a managed service that you can use to quickly prepare for, respond to, and recover from security incidents. AWS SIR and the GuardDuty investigation agent address different stages of your security workflow. The GuardDuty investigation agent provides an on-demand assessment capability. When your team needs deeper context on a specific finding, an account security posture, or the overall security posture of your organization. You create an investigation and receive a structured assessment with risk levels, confidence scores, MITRE ATT&CK® technique mappings, and actionable recommendations. Security analysts can use this to quickly understand the scope and severity of what GuardDuty has detected.

When you create an AWS-supported case through AWS SIR, a SIR investigation agent activates, working in parallel with AWS Security Incident Response engineers to gather evidence and deliver an investigation summary within minutes. AWS SIR is purpose-built for active security events where you need both AI-powered automation and human expertise to coordinate containment and recovery.

Security teams can use these capabilities to assess and prioritize findings on demand using the GuardDuty investigation agent, escalate confirmed issues to stakeholders with supporting evidence, and create or update an AWS-supported case to accelerate involvement from the AWS SIR team when additional support is needed.

Availability and pricing

Public preview of the GuardDuty investigation agent is available in 10 AWS Regions including US East (N. Virginia), US East (Ohio), US West (Oregon), Canada (Central), Europe (Frankfurt), Europe (Ireland), Europe (London), Europe (Paris), Europe (Stockholm), and Asia Pacific (Tokyo).

During public preview, the investigation agent is available at no charge. Usage is limited to 10 investigations per account per day, with a cumulative limit of 100 investigations per account during the preview period. Failed investigations do not count toward these quotas.

Start investigating findings today

The Amazon GuardDuty investigation agent reduces investigation time from hours to minutes, letting your security team focus on confirmed security events rather than manual correlation.

Get started by:

  1. Enabling the investigation agent in your GuardDuty console
  2. Creating your first investigation using a recent GuardDuty finding
  3. Reviewing the structured assessment, including risk level and recommended next steps

For organizations using the AWS MCP server, you can also invoke investigations through natural language in your AI assistant of choice.

Learn more

If you have feedback about this post, submit comments in the Comments section below.


Allan Holmes

Allan Holmes

Allan brings over 20 years of experience spanning security & compliance, networking, and DevOps to his current role as a Security Specialist. Giving him a uniquely holistic view of cloud security challenges. Allan holds multiple technical certifications from AWS, ISC2, CompTIA, and an MBA, enabling him to bridge deep technical expertise with business strategy. Outside of work, Allan is an avid gardener and electronics enthusiast who enjoys exploring innovative technologies hands-on.

Prevent data exfiltration: AWS egress controls for cloud workloads

22 June 2026 at 17:53

When securing an Amazon Web Services (AWS) environment, teams naturally prioritize inbound controls, firewalls, WAFs, and access policies, because that’s where the most visible threats originate. Outbound traffic, on the other hand, tends to get less attention. It’s often left open by default to avoid breaking application dependencies and because the risk feels less immediate. But overlooking egress means missing a key layer of defense. Without visibility into what’s leaving your network, it’s harder to detect unintended data flows, whether from misconfigured services, overly broad permissions, or workloads with unauthorized access.

Real-world incidents highlight why egress controls deserve attention across both traditional cloud workloads and emerging AI-driven architectures.

In traditional cloud environments, application-level security issues remain a persistent threat. For example, when CVE-2025-55182 (React2Shell) was publicly disclosed in December 2025, multiple organized groups began exploitation attempts within hours, targeting unpatched React Server Components to achieve remote code execution. After a workload is accessed by an unauthorized party, they typically establish outbound command-and-control channels and begin exfiltrating data. Without egress controls in place, that outbound traffic can flow freely, and the unauthorized access might go unnoticed until a compliance audit, customer complaint, or incident notification forces discovery.

Agentic AI systems introduce a new dimension to this risk. The OWASP Top 10 for Agentic Applications identifies threats such as Agent Goal Hijack (ASI01), where unauthorized parties manipulate an autonomous agent’s objectives to silently exfiltrate data, and Unexpected Code Execution (ASI05), where an agent with unauthorized access generates and runs potentially damaging code that establishes reverse shells or transfers sensitive data to external endpoints. As organizations deploy AI agents with access to tools, APIs, and code interpreters, these agents become high-value targets, and their outbound network activity must be constrained with the same rigor as any other workload.

In both scenarios, the common thread is unauthorized outbound traffic. In this post, we show you how to implement layered egress detection and protection using AWS services working together to reduce unauthorized data transfer risk, whether the source is an application with unauthorized access or a manipulated AI agent.

Architecture overview

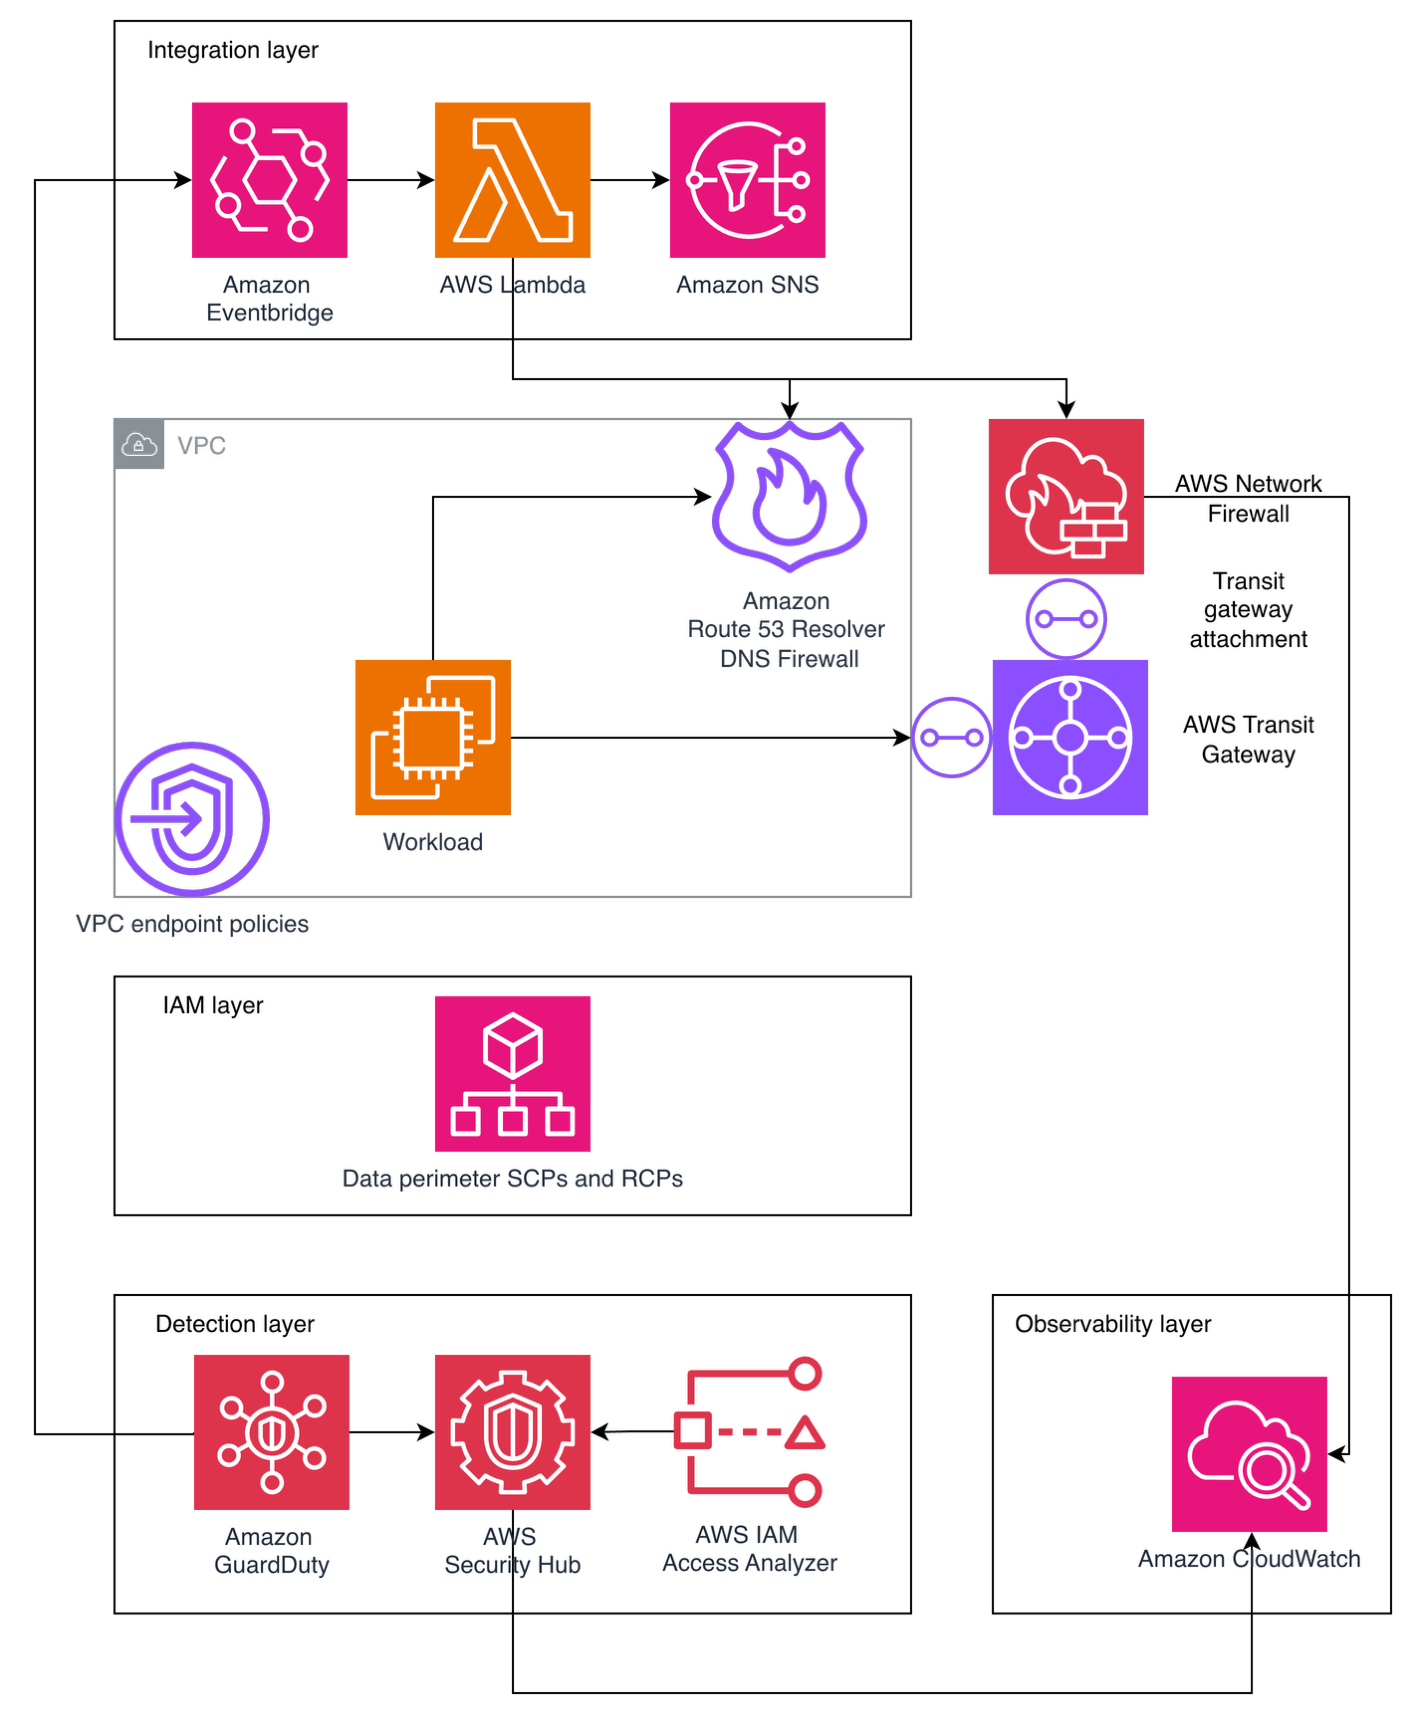
Figure 1: Hub-and-spoke egress control architecture

Figure 1: Hub-and-spoke egress control architecture

The following architecture, shown in Figure 1, illustrates one approach to implementing a hub-and-spoke network pattern for a multi-account AWS environment. Note that alternative designs might be appropriate depending on your organizational requirements and constraints.

Application workloads reside in spoke virtual private clouds (VPCs) that connect to an AWS Transit Gateway, which serves as the central hub for routing inter-VPC and internet-bound traffic while enforcing network segmentation through carefully crafted route tables. Spoke VPCs use VPC endpoints for secure AWS service access, keeping traffic within the AWS network where possible. VPC endpoint policies are applied as key data perimeter controls, restricting which principals can access AWS services and which resources can be accessed through these endpoints.

Internet-bound traffic is routed through a transit gateway-attached AWS Network Firewall, which inspects and filters outbound flows before they reach the internet. This centralized routing model scales horizontally by adding spoke VPCs without modifying the inspection infrastructure, making it well suited for organizations that have multiple AWS accounts.

It’s important to understand that Amazon Route 53 Resolver DNS Firewall must be deployed across your VPCs to filter DNS queries that resolve through the Route 53 VPC Resolver. (DNS queries sent directly to other DNS resolvers bypass it, but can be filtered with AWS Network Firewall.) The DNS firewall uses both managed and custom domain lists to filter DNS queries, blocking resolution of known unauthorized domains before any network connection is established.

Data perimeter controls are enforced at multiple layers: service control policies (SCPs) and resource control policies (RCPs) at the AWS Organizations level, VPC endpoint policies at the network level, and resource policies on individual services. AWS IAM Access Analyzer is deployed at the organization level to continuously detect publicly accessible or externally shared resources.

A detection layer comprising Amazon GuardDuty, AWS Security Hub, and IAM Access Analyzer provides continuous monitoring and threat detection. Findings are routed through an integration layer using Amazon EventBridge, which triggers AWS Lambda-based automated remediation and sends notifications using Amazon Simple Notification Service (Amazon SNS). This integration layer also feeds back into your network controls, automatically updating Network Firewall deny rules and DNS Firewall block lists based on detected threats.

Centralized observability is achieved through Amazon CloudWatch Logs and CloudWatch dashboards. Network Firewall flow logs and alert logs are collected centrally to support incident investigation and compliance reporting.

This architecture applies equally to traditional application workloads and AI-driven workloads. An AI agent running on Amazon Bedrock, for example, typically sits inside a spoke VPC. When that agent invokes an external API or attempts to reach the internet, its traffic follows the same path through Transit Gateway and Network Firewall as any Amazon Elastic Compute Cloud (Amazon EC2) or container workload. The agent doesn’t get a special lane out, it’s subject to the same domain allow-lists, the same DNS filtering, and the same data perimeter policies.

That said, agents often need outbound access to invoke external tools or third-party APIs as part of their normal operation, which makes allow-list design more nuanced. You will want to scope allowing domains tightly to the specific endpoints your agents legitimately need, rather than opening broad categories. Complementing these network-layer controls with application-layer guardrails such as Amazon Bedrock Guardrails—which can filter harmful content and detect prompt attacks before they reach the network layer—adds another layer of defense.

Preventive controls

The following preventive controls block data exfiltration before it occurs. Because they actively disrupt traffic, reserve them for activity that is confirmed or highly likely to be potentially damaging.

AWS Network Firewall

Consider this scenario: an unauthorized party compromises an EC2 instance in one of your spoke VPCs and attempts to exfiltrate sensitive data to an external server. Now consider an agentic AI scenario: an unauthorized party uses prompt injection to hijack an AI agent’s goal (OWASP ASI01), redirecting it to exfiltrate training data to an external endpoint. Network Firewall is designed to block this attempt because the unauthorized destination isn’t on the approved domain allow-list—the same control that stops an EC2 instance with unauthorized access— also stops a manipulated AI agent.

Without centralized egress inspection, that traffic flows directly to the internet through a NAT gateway. Network Firewall prevents this by providing centralized, Layers 3–7 deep packet inspection with advanced threat intelligence capabilities, including IP address, port, and protocol filtering; plus packet content inspection using Suricata-compatible rules.

In this architecture, Transit Gateway funnels internet-bound traffic from multiple spoke VPCs through Network Firewall for centralized inspection. The firewall endpoint becomes the target for 0.0.0.0/0 routes, routing outbound internet traffic for inspection before reaching NAT gateways for address translation. In both scenarios, Network Firewall blocks the exfiltration attempt at the network layer before data leaves your environment. Its key capabilities include:

  • Domain name filtering: Block traffic to unauthorized destinations (such as a command-and-control server at *.untrusted-domain.com)
  • IP and port rules: Define explicit allow-lists for external IPs your applications truly need, blocking everything else
  • Domain category filtering: Block entire categories of domains that your workloads should never communicate with
  • IDS and IPS: Detect and block known attack patterns in outbound traffic using Suricata-compatible rules
  • Port and protocol enforcement: Help ensure only expected protocols use their designated ports (for example, only HTTPS on TCP port 443), preventing protocol tunneling
  • Geographic IP filtering: Block outbound traffic to geographic regions where your organization has no business relationships
  • TLS decryption: Inspect encrypted traffic to detect exfiltration attempts hidden within HTTPS connections
  • Threat intelligence integration: Use managed threat intelligence (such as active threat defense that uses the Amazon threat intelligence system MadPot) feeds or custom Suricata rules to detect unexpected patterns
  • Automatic scaling: Handles up to 100 Gbps per Availability Zone

For multi-account environments, AWS Firewall Manager can centrally deploy and manage Network Firewall across your organization’s accounts, helping maintain consistent egress rules everywhere. Additionally, AWS Network Firewall Proxy (in preview) offers explicit proxy capabilities with granular HTTP/HTTPS filtering—including URL path and HTTP method-level controls—for workloads that require application-layer inspection of outbound web traffic.

Route 53 Resolver DNS Firewall

DNS queries made through Route 53 VPC Resolver don’t pass through the outbound network path inspected by Network Firewall or third-party firewalls. Unauthorized parties can take advantage of this by encoding sensitive data within DNS queries to external servers, a technique known as DNS tunneling. This risk extends to agentic AI workloads. An agent with code execution capabilities (OWASP ASI05) could be tricked into running a script that encodes sensitive data (like customer records, model weights, API keys) into DNS queries directed at an externally controlled nameserver. DNS Firewall is designed to block these queries regardless of whether they originate from a traditional workload or an AI agent, because the filtering happens at the resolver level before any connection is established.

Because DNS traffic is essential for normal operations and often overlooked in security architectures, it represents a common unauthorized data exfiltration channel. Route 53 Resolver DNS Firewall closes this gap by filtering and potentially blocking outbound DNS queries from your VPCs. Its core capabilities consist of:

  • Block unauthorized domains: AWS provides managed domain lists, including an Aggregate Threat List covering malware, ransomware, botnet, spyware, and DNS tunneling
  • Enforce allow-lists: Permit only queries to approved domains, blocking everything else
  • DNS Firewall Advanced features: AI and machine learning (AI/ML)-backed detection of DNS tunneling, Domain Generation Algorithms (DGAs), and dictionary DGAs

Configuration is straightforward: Create rule groups with domain match lists and actions (block, allow, and alert), then associate them with your VPCs. The DNS resolver applies these rules to every DNS query made from instances in the VPC through Route 53 Resolver. This prevents unauthorized parties from using DNS tunneling to exfiltrate data, a technique that completely bypasses inspection by firewalls in the egress VPC.

For a deeper look at the risks associated with DNS exfiltration and DNS Firewall Advanced capabilities, see Protect against advanced DNS threats with Amazon Route 53 Resolver DNS Firewall.

Data perimeters

A data perimeter is a set of preventive guardrails that allow only your trusted identities to access trusted resources from expected networks. While the preceding controls secure the network paths out of your environment, data perimeters secure the API-level paths, helping to ensure that even if an unauthorized party gains access to valid credentials, they can’t use AWS service APIs to move data to resources outside your organization.

This comprehensive approach uses three primary AWS capabilities working together:

  1. Service control policies (SCPs): Organization-wide preventive controls that restrict what identities can do. In the context of egress protection, SCPs can prevent users from creating resources that bypass your egress controls (for example, preventing the creation of VPCs without DNS Firewall associations or blocking the use of services that could establish alternative outbound paths).
  2. Resource control policies (RCPs): Controls that restrict API access to your resources. While RCPs aren’t directly egress controls, they act as a complementary layer. For example, they can block attempts to access your Amazon Simple Storage Service (Amazon S3) buckets from outside your organization at the resource level.
  3. VPC endpoint policies: VPC endpoints enable private communication with AWS services without traffic going through the internet. VPC endpoint policies are resource-based AWS Identity and Access Management (IAM) policies that govern what can be accessed through that endpoint. This is where data perimeters most directly function as an egress control.

Consider the following VPC endpoint policy that restricts Amazon S3 access through the endpoint to only S3 buckets within your organization, directly preventing an insider or a workload with unauthorized access from copying data to an external S3 bucket:

{
  "Statement": [{
    "Sid": "DenyAccessToNonOrgBuckets",
    "Effect": "Deny",
    "Principal": "*",
    "Action": "s3:*",
    "Resource": "*",
    "Condition": {
      "StringNotEqualsIfExists": {
        "aws:ResourceOrgID": "<my-org-id>"
      }
    }
  }]
}

This policy is designed to deny any Amazon S3 operation through this VPC endpoint unless the target S3 bucket belongs to your organization. Without this control, a workload with unauthorized access could use aws s3 cp to copy sensitive data to an externally controlled bucket in a different AWS account.

Data perimeter policies don’t grant new permissions, they narrow what’s accessible by establishing guardrails, acting as a second authorization layer. By implementing these perimeters using IAM condition keys like aws:PrincipalOrgID, aws:ResourceOrgID, aws:SourceVpc, and aws:SourceVpce, you create layered permissions guardrails that help prevent unintended access patterns and configuration errors.

For more information on implementing perimeter controls, explore the Building a Data Perimeter AWS whitepaper.

Detective controls

The following detective controls surface data exfiltration attempts after they occur. Because they observe rather than disrupt traffic, you can apply them broadly to flag unexpected activity for investigation. Use the findings to identify recurring unauthorized patterns that can graduate into preventive controls.

Amazon GuardDuty: Detective control for egress threats

GuardDuty serves as your critical detection layer for egress protection, continuously monitoring for outbound threats that evade or take advantage of your preventive controls. GuardDuty identifies behavioral anomalies and attack patterns that indicate active data exfiltration attempts. Its egress-focused detection capabilities include:

  • DNS-based data exfiltration detection: The Trojan:EC2/DNSDataExfiltration finding alerts when EC2 instances are transferring data through DNS channels. GuardDuty also identifies queries to DGA domains commonly used for command-and-control communication.
  • Known malicious actor detection: Exfiltration:S3/MaliciousIPCaller triggers when Amazon S3 data APIs like GetObject or CopyObject are invoked from IP addresses on AWS threat intelligence feeds, signaling active data extraction attempts.
  • Multi-step attack sequence correlation: GuardDuty Extended Threat Detection correlates multiple unexpected events to identify multi-stage exfiltration campaigns. For example, AttackSequence: S3/CompromisedData detects when unauthorized parties modify S3 bucket policies to broaden access and then systematically extract data using stolen credentials.

GuardDuty findings serve dual purposes in your egress strategy. Alerts about attempted exfiltration that failed confirm your preventive layers (Network Firewall, DNS Firewall, and data perimeters) are functioning effectively: the threat was detected because it progressed far enough to trigger behavioral analysis, but your controls blocked the actual data loss. Conversely, findings indicating successful exfiltration trigger immediate incident response workflows, enabling you to contain active incidents, revoke stolen credentials, and quarantine affected resources before significant damage occurs.

Integrate GuardDuty with Security Hub for centralized correlation across your security services and implement automated response through EventBridge and Lambda functions to enable real-time containment when high-severity exfiltration findings occur.

IAM Access Analyzer

IAM Access Analyzer helps identify potential data exfiltration paths by detecting resources accessible from outside your AWS account or organization. It uses automated reasoning technology to analyze resource-based policies and identify which of your resources can be accessed by external entities (principals outside your zone of trust), continuously monitoring public and cross-account access.

External access analyzers identify resources shared with external principals (such as other AWS accounts or public access). For example, when an S3 bucket is configured to allow access outside your zone of trust through bucket policies, ACLs, or access points, IAM Access Analyzer generates a finding with details about the access path, including the external principal and the level of access granted. Security teams can respond by taking immediate action to remove unintended access or by setting up automated notifications through EventBridge to engage development teams for remediation.

AWS Security Hub

Security Hub exposure findings provide a comprehensive view of potential security risks by correlating data from multiple AWS security services. These findings identify when resources might be vulnerable to data exfiltration by integrating intelligence from GuardDuty (for threat detection), Amazon Inspector (for vulnerability assessment), Security Hub CSPM (for configuration compliance), and Amazon Macie (for sensitive data discovery). For example, it can identify when a publicly exposed S3 bucket contains sensitive data and isn’t encrypted at rest, flagging it as a potential data exfiltration risk that requires immediate attention.

AWS Shield network security director (in preview) complements Security Hub by discovering and analyzing your network topology to identify resources with unrestricted outbound internet access, helping you detect potential egress blind spots across your environment.

Egress security strategy

You don’t need to implement all these controls at once. The following phased approach lets you build your egress security posture incrementally, at a pace that matches your organization’s operational maturity and risk tolerance.

  • Phase 1 – Quick wins: Enable Route 53 DNS Firewall across your VPCs to close the DNS exfiltration gap. Enable GuardDuty across your accounts for baseline threat detection.
  • Phase 2 – Foundational: Deploy organization-wide data perimeters (SCPs, RCPs, and VPC endpoint policies). Deploy Network Firewall as a transit gateway-attached firewall.
  • Phase 3 – Efficient: Enable IAM Access Analyzer for continuous external access detection. Implement automated remediation through EventBridge and Lambda to update firewall rules in real time. Centralize findings in Security Hub with automated alerting.

Conclusion

Egress security isn’t a single control—it’s a layered strategy. Start by assessing your current posture across network filtering, DNS security, data perimeters, and detective controls. Identify the gaps, then follow the phased approach outlined in this post to close them incrementally. Regular testing through simulated exfiltration attempts validates that your controls work effectively. These controls apply with equal force to agentic AI workloads, where manipulated agents can become unintended exfiltration vectors. Put egress under control and turn your outbound blind spots into monitored checkpoints.

If you have feedback about this post, submit comments in the Comments section below.


Merriem-SMACHE

Meriem SMACHE

Meriem is a Security Specialist Solutions Architect at AWS, supporting customers in the design and deployment of resilient cloud and AI solutions, from generative AI workloads to fully autonomous agentic systems, that meet their regulatory requirements and security needs.

Maxim Raya

Maxim Raya

Maxim is a Security Specialist Solutions Architect at AWS. In this role, he helps clients accelerate their cloud transformation by increasing their confidence in the security and compliance of their AWS environments.

Operationalizing AWS security: A maturity roadmap

8 June 2026 at 18:18

Enabling security tooling is the starting point. Making it operational—where findings drive decisions, response times are measurable, and your security posture improves week over week—is where most organizations struggle.

This blog post provides a phased maturity roadmap for organizations that have already enabled AWS Security Hub and Amazon GuardDuty. These two services form the foundation of a cloud-centered security operations capability on AWS. Security Hub provides centralized security posture management and aggregates findings from multiple AWS security services, while GuardDuty provides intelligent threat detection by continuously monitoring for malicious activity and unauthorized behavior. For any production or enterprise AWS environment, having both services enabled across all accounts and AWS Regions is a baseline expectation; not because they’re optional add-ons, but because effective security operations require both the ability to detect threats and the ability to understand your overall security posture. If you haven’t yet enabled them, the Security Hub documentation and GuardDuty documentation provide setup guidance, including multi-account deployment with AWS Organizations.

Customers consistently tell us that while individual AWS security service documentation is thorough, what’s missing is a consolidated operational playbook—one resource that ties the services together into a working security operations practice with clear phases, progression criteria, and an operational cadence. That’s the gap this post fills. Rather than covering how each feature works (the documentation does that well), this post focuses on when and why to use each capability, and how to build the organizational habits that make them effective.

What follows is a six-phase roadmap for moving from these services are active to these services are driving our security operations. Each phase builds on the previous one, and each is designed to deliver tangible, measurable improvement.

Phase 0: Assess your current state

Goal: Understand what’s working before changing anything.

Estimated timeline: 1–2 weeks

Move to Phase 1 when: You have a documented current-state assessment covering all the following items.

Before introducing new processes or automation, establish a clear picture of the current environment. This assessment informs every decision that follows.

Actions:

  • Findings inventory: Review existing active GuardDuty findings to determine how many there are, the severity distribution, and how old the oldest findings are. A large backlog of untouched HIGH or CRITICAL findings that have been sitting for weeks is a strong signal about where to focus first.
  • Security Hub score baseline: Determine your current compliance score against AWS Foundational Security Best Practices (FSBP) and The CIS AWS Foundations Benchmark. Check to see which standards are enabled; if multiple standards are enabled, review for overlapping standards (creating noise) or unused standards.
  • Multi-account and multi-Region check: Look to see if GuardDuty is enabled in every account and every Region, or only in Regions with active workloads. Threat actors frequently operate in Regions that organizations don’t actively monitor. Also check to see if Security Hub aggregation is configured with a delegated administrator account or if each account is being managed independently.
  • Integration check: Determine if GuardDuty findings are flowing into Security Hub and if Amazon Inspector and Amazon Macie are enabled and feeding findings in. Without integration, Security Hub might be only surfacing its own compliance checks.
  • Notification check: See if there’s an Amazon EventBridge rule configured for notifications and if so, how findings are being routed and to whom. Know if notifications are being sent using an Amazon Simple Notification Service (Amazon SNS) topic or a chat channel integration. Without a clear notification and response workflow, findings can accumulate silently in the console with no one looking at them.

Deliverable: A one-page current state assessment that identifies what’s enabled, what’s flowing where, who’s looking at it, and what’s in the existing backlog.

Phase 1: Reduce the noise

Goal: Make the signal meaningful before asking anyone to act on it.

Estimated timeline: 2–3 weeks

Move to Phase 2 when: Remaining findings represent items requiring real decisions, compliance scores reflect actual posture, and you can articulate why every suppression rule and disabled control exists.

This is the single most important phase. If this step is skipped in favor of jumping straight to automation, the result is automated chaos. Alert fatigue is the primary reason security tooling is ignored, and addressing it first is what makes everything that follows sustainable.

GuardDuty tuning:

  • Create suppression rules for known-benign findings. The goal is to suppress activity you’ve already evaluated and accepted—such as expected traffic from corporate egress IPs (based on trusted IP lists), internal tools that trigger DNS-based findings, or internet-facing resources that naturally receive port scanning. The principle: if you’ve investigated a finding and it’s expected, suppress it so your team can focus on what matters.
  • Triage every active HIGH and CRITICAL finding into three categories: needs immediate investigation (real threat, not yet reviewed), true positive, already addressed (archive using workflow status), or false positive or expected behavior (create a suppression rule). Every finding must be categorized into one of these three states.
  • Review GuardDuty protection plans and enable any that are relevant but not yet active. Organizations that enabled GuardDuty years ago might not have activated protection plans released since then (such as Runtime Monitoring, Malware Protection, RDS Protection, and Lambda Protection). Evaluate each against your workload profile and enable what applies.

Security Hub tuning:

  • Disable controls that aren’t relevant to the environment. This is the highest-value quick win. If a service isn’t in use, disable its controls. If a control is addressed by an alternative solution, disable it. A 47% compliance score where half the failures are irrelevant trains teams to ignore the dashboard entirely. See the Security Hub controls reference for the full list.
  • Choose a primary standard. AWS Foundational Security Best Practices is a strong default. The CIS AWS Foundations Benchmark adds value when there’s a specific compliance mandate. Avoid enabling PCI DSS or NIST 800-53 standards unless there’s a reporting requirement—they add significant volume without proportional signal for most organizations.
  • Configure cross-Region aggregation to the delegated administrator account if not already in place. A single aggregated view eliminates the need to check findings across multiple Regional consoles.
  • Use the workflow status field operationally. Findings should progress from NEW to NOTIFIED to RESOLVED or SUPPRESSED. If everything remains in NEW indefinitely, the system carries no operational meaning.

Deliverable: A tuned environment where remaining findings represent items that require real decisions. Compliance scores should now reflect your organization’s actual security posture rather than noise.

Phase 2: Build the notification and routing layer

Goal: Get the right findings to the right people at the right time.

Estimated timeline: 2–3 weeks

Move to Phase 3 when: CRITICAL and HIGH findings reach the security team within minutes, MEDIUM findings create tracked tickets, and notifications include enriched context. No action is taken until a person or an automation is informed that something needs attention.

Architecture: Security Hub to EventBridge rule to routing logic to destination

Tiered notification strategy:

CRITICAL Page on-call immediately PagerDuty or Opsgenie 15 minutes
HIGH Alert security team channel Slack or Teams channel and ticket creation 4 hours
MEDIUM Create ticket for review Jira or ServiceNow 48 hours
LOW or INFORMATIONAL Batch digest Weekly email summary or dashboard review Next review cycle

Key design decisions:

  • Route from Security Hub, not individual services. Because findings from GuardDuty, Inspector, Macie, and Security Hub compliance checks all aggregate in Security Hub, build your EventBridge rules there for centralized management.
  • Create a fast path for the most dangerous finding types. Certain GuardDuty findings, particularly those involving credential exfiltration, cryptocurrency activity, trojans, and active compromises, warrant a separate, faster routing path that bypasses normal triage. Identify these based on your threat model and the GuardDuty finding types reference.
  • Enrich notifications before delivery. A raw JSON finding in a chat channel provides little actionable context. Use an AWS Lambda function to format notifications with the information responders need: account alias, Region, Amazon Resource Name (ARN), finding type, severity, a console deep link, and a plain-language description. The Security Hub CloudWatch Events integration guide describes the event format.

Deliverable: A working notification pipeline where CRITICAL and HIGH findings reach the security team within minutes, MEDIUM findings create tracked work items, and LOW and INFORMATIONAL findings are batched for periodic review.

Phase 3: Build automated remediation for high-confidence findings

Goal: For findings where the correct response is deterministic, remove the human from the loop.

Estimated timeline: 3–4 weeks

Move to Phase 4 when: At least 3–5 high-confidence finding types have automated responses deployed with audit trails, and the team has established a process for evaluating new auto-remediation candidates.

The guiding principle: Only auto-remediate when all three conditions are met: the finding is high-confidence, the response is deterministic, and the blast radius of the automated action is limited. Automated remediation must not create the risk of a production outage.

Decision framework:

Confidence level High – no false positive risk Medium – context-dependent Low – requires investigation
Response complexity Single, well-defined action Multiple steps or judgment calls Requires forensic analysis
Blast radius Limited to one resource Could affect dependent services Production-wide impact
Rollback difficulty Straightforward to reverse Moderate effort to reverse Difficult or impossible to reverse

Common auto-remediation categories:

  • Instance isolation for confirmed compromise findings (cryptocurrency mining, malware, and trojans): Replace the security group, snapshot volumes for forensics, and notify.
  • Credential revocation for confirmed credential compromise: Attach deny-all policies, revoke sessions, and deactivate access keys as appropriate to the credential type.
  • Compliance drift correction for deterministic misconfigurations: Re-enable Amazon Simple Storage Service (Amazon S3) Block Public Access, revoke overly permissive security group rules, and re-enable AWS CloudTrail logging.
  • Notification-only escalation for findings that require human judgment before action: Amazon Elastic Block Store (Amazon EBS) encryption gaps (require migration) and access key rotation (requires coordination with the key owner).

For implementation, AWS provides Security Hub Automated Response and Remediation (SHARR), a solution that includes pre-built remediation playbooks deployed as AWS Step Functions workflows triggered by EventBridge. This is a strong starting point—evaluate the provided playbooks, enable the ones that fit, and extend with custom remediations as needed.

Note: For findings that recur because the environment lacks preventive guardrails, the best long-term response is often a service control policy (SCP) that prevents the misconfiguration from occurring in the first place. Phase 5 covers this preventive controls layer.

Deliverable: A library of automated and semi-automated remediation runbooks with full audit trails, and a documented decision framework the team uses to evaluate new auto-remediation candidates.

Phase 4: Build the operational rhythm

Goal: Turn security findings management into a sustained organizational practice, not a one-time cleanup.

Estimated timeline: 4–6 weeks to establish, then ongoing

Move to Phase 5 when: The weekly cadence has been running consistently for at least 8 weeks, monthly metrics show positive trends, and the first quarterly review has been completed.

This is where many organizations stall, and it’s the most important phase in the entire roadmap. The technology is working, the notifications are flowing, automated remediations are firing, but there’s no organizational habit built around it. Without this phase, everything you’ve built in Phases 0–3 will gradually decay. Suppression rules will go stale, new team members won’t know the system exists, and findings will start accumulating again. The operational rhythm is what converts a security tooling deployment into a security operations practice.

Weekly security review (30 minutes)

Attendees: Security team lead, cloud platform team representative, rotating engineering lead from an application team

Why the rotating engineering lead matters: Security findings don’t exist in a vacuum; they’re generated by workloads that engineering teams own. Rotating an engineering representative through this meeting accomplishes three things: it builds security awareness across the organization, ensures findings are routed to people with the context to resolve them, and creates organizational accountability beyond the security team.

Agenda template:

5 minutes Compliance score trend – Review Security Hub scores by account and standard. Is the trend improving, declining, or flat? If declining, why? Security lead Identified regression areas
5 minutes Critical and high findings review – Walk through new HIGH and CRITICAL GuardDuty findings from the past week. Are there any that need immediate escalation? Security lead Escalation actions assigned
10 minutes Top five failing controls – Identify the five Security Hub controls with the most failures. Assign an owner and a target date for each. Platform lead Owners and dates documented
5 minutes Automation review – Did any auto-remediations fire this week? Did they work correctly? Were there any false triggers? Security lead Automation adjustments queued
5 minutes Tuning decisions – Are new suppression rules needed based on this week’s findings? Are any new finding types candidates for auto-remediation? All Tuning backlog updated

Running the meeting effectively:

  • Keep a running document (such as a wiki page or shared document) that captures decisions and action items week over week. This becomes your institutional memory.
  • If the compliance score hasn’t moved in over 3 weeks, that’s a signal. Either the assigned work isn’t happening, or the remaining findings are genuinely difficult to address. Both need to be discussed.
  • Track action items from previous weeks. A review that generates action items but never follows up on them will lose credibility and attendance quickly.

Escalation procedures

Define clear escalation paths before they’re needed:

CRITICAL finding not acknowledged within the SLA Auto-escalate to security team manager 15 minutes after SLA breach
HIGH finding not resolved within the SLA Escalate to finding owner’s manager 4 hours after SLA breach
Compliance score drops more than 5 points in a week Escalate to cloud platform team lead for investigation Next business day
Auto-remediation failure Page security on-call Immediate
New finding type not covered by existing runbooks Add to weekly review agenda for triage and runbook development Next weekly review

Monthly metrics report

Compile these metrics monthly and review them with security and engineering leadership. The goal is to tell a story about whether the organization’s security posture is improving, stable, or degrading, and why.

Mean time to acknowledge (MTTA) for CRITICAL findings Are findings being seen promptly? Decreasing month over month
Mean time to resolve (MTTR) for CRITICAL and HIGH findings Are findings being acted on? Decreasing month over month
Security Hub compliance score by standard, by account What is the posture trend over time? Increasing month over month
Number of active GuardDuty findings by severity Is the backlog growing or shrinking? Decreasing for HIGH and CRITICAL
Findings auto-remediated compared to manually resolved Is automation delivering value? Auto-remediation ratio increasing
Number of suppressed findings (with quarterly justification review) Is noise being managed, or are problems being hidden? Stable or decreasing
New findings introduced compared to resolved this month Is the organization getting ahead or falling behind? More finding resolved than introduced
SLA adherence rate by severity Are response commitments being met? More than 95% for CRITICAL, and more than 90% for HIGH

Building the dashboard: Use Amazon CloudWatch dashboards for real-time operational visibility or Amazon QuickSight connected to Security Hub findings through Amazon Security Lake for historical trend analysis and executive reporting. The dashboard should be visible to—and regularly viewed by—everyone in the weekly review, not locked in a security team tool.

Quarterly reviews

The quarterly review is a deeper inspection of the system itself; not just the findings, but the machinery processing them.

Quarterly review checklist:

  • Suppression rules audit: Review every active suppression rule to determine if the underlying condition is still present and the suppression is still justified. Document the review outcome for each rule.
  • Disabled controls audit: Review every disabled Security Hub control. Check that the justification is still valid and if the environment changed (for example, a service that wasn’t in use is now in use).
  • Automation audit: Review AWS Identity and Access Management (IAM) roles used by remediation functions and verify least privilege. Review execution logs for any anomalies or failures that weren’t caught.
  • New capabilities review: Evaluate newly released GuardDuty protection plans and Security Hub controls from that quarter. AWS releases new detection and compliance capabilities regularly. If you’re not reviewing them quarterly, you’re accumulating blind spots.
  • Process effectiveness review: Determine if the weekly meeting is well-attended and if action items are being completed. Make sure SLAs are being met. If attendance, action item completion, and SLA compliance aren’t where they should be, explore structural changes to address the gaps.

Operational maturity scoring

Use this rubric to assess the maturity of your operational rhythm itself. Score each dimension 1–3 and use the total to track progress over time.

Review cadence One time reviews when someone remembers Weekly review happens, but attendance is inconsistent Weekly review is consistently attended with documented outcomes
Metrics tracking No metrics captured Metrics are collected monthly but not acted on Metrics drive decisions and declining trends trigger specific actions
Finding ownership Findings sit in queue with no owner Findings are assigned to teams but SLAs aren’t tracked Every finding has an owner, SLAs are tracked, and breaches are escalated
Automation management Set-and-forget automations Automation logs are reviewed periodically Automation is reviewed weekly, and new candidates are evaluated continuously
Tuning lifecycle Suppression rules created but never reviewed Annual review of suppressions and disabled controls Quarterly reviews with documented justification for every rule
Cross-team engagement Security team works in isolation Platform team participates Engineering teams actively participate and own remediation

Scoring (revisit quarterly):

  • Beginning: 6–9
  • Established: 10–14
  • Optimized: 15–18

Deliverable: A documented operational cadence with clear ownership (consider a RACI matrix), metrics dashboards, escalation procedures, and a continuous improvement loop. The cadence should survive team member turnover—if it depends on one person remembering to run it, it’s not yet operational.

Phase 5: Mature the architecture

Goal: Fill remaining gaps and build toward a comprehensive security operations capability. Estimated timeline: Ongoing. Prioritize based on organizational risk profile and compliance requirements.

  • Amazon Inspector integration: Enable Amazon Inspector for Amazon Elastic Compute Cloud (Amazon EC2) instances, Lambda functions, and Amazon Elastic Container Registry (Amazon ECR) container images. Findings flow into Security Hub automatically, adding vulnerability management alongside threat detection and posture management. Prioritize this if you have Amazon EC2 or container workloads without an existing vulnerability scanning solution.
  • Amazon Macie: Enable Amazon Macie for S3 buckets containing potentially sensitive data. Particularly important for organizations with compliance requirements around personally identifiable information (PII), protected health information (PHI), or Payment Card Industry (PCI) data. Configure automated sensitive data discovery and route findings to Security Hub.
  • Amazon Security Lake: Amazon Security Lake centralizes security-relevant logs in OCSF format for long-term retention, forensic investigation, and threat hunting. This is valuable when you need historical analysis beyond the Security Hub retention window, or when feeding a third-party Security Information and Event Management (SIEM) tool.
  • Preventive controls layer: Convert recurring detective findings into preventive policies. Use SCPs to prevent disabling GuardDuty, Security Hub, and CloudTrail, IAM permission boundaries on developer roles, AWS WAF on public endpoints, and AWS Network Firewall for VPC traffic inspection. The pattern is to make recurring misconfigurations impossible to introduce.
  • Detective controls expansion: Use AWS IAM Access Analyzer for external access and unused access findings, AWS CloudTrail Lake for long-term queryable audit logs, and AWS Config custom rules for organization-specific compliance checks.
  • Incident response readiness: Have incident response playbooks referencing specific GuardDuty finding types, pre-built forensics infrastructure (isolated VPC, forensic AMIs, and pre-configured IAM roles), regular tabletop exercises, and AWS CloudFormation templates to deploy isolation infrastructure on demand. See the AWS Security Incident Response Guide for a comprehensive framework.

Conclusion

In this post, I provided a six-phase roadmap for operationalizing Security Hub and GuardDuty and showed that it isn’t a single project, but a progression. Phase 0 and Phase 1 can typically be completed in 3–5 weeks and deliver immediate clarity. Phases 2 and 3 build the response infrastructure that turns findings into action over the following 5–7 weeks. Phase 4 is what makes everything sustainable and is where you should invest the most attention. And Phase 5 expands the aperture from Security Hub and GuardDuty into a comprehensive security operations capability.

If you walked away from this post and did one thing, run the Phase 0 assessment this week. That single deliverable tells you exactly where to focus next. Use the following self-assessment checklist to identify your current phase, then focus on the next one. A tuned environment with working notifications and a weekly review cadence is dramatically more effective than a fully featured but neglected deployment. Start where you are, reduce the noise, build the habits, and iterate. To learn more, explore the AWS Security Hub User Guide, the Amazon GuardDuty User Guide, and the AWS Security Incident Response Guide. If you’ve implemented a similar operational cadence, or have questions about any phase, share your experience in the comments.

Self-assessment checklist

Phase 0 We know how many active GuardDuty findings exist across all accounts ☐
We know our current Security Hub compliance score ☐
We know whether GuardDuty is enabled in every account and region ☐
We know who (if anyone) is reviewing findings today ☐
Phase 1 GuardDuty suppression rules exist for known-benign activity ☐
Irrelevant Security Hub controls have been disabled with documented justification ☐
All active HIGH and CRITICAL findings have been triaged ☐
Security Hub compliance scores reflect actual posture, not noise ☐
Phase 2 HIGH and CRITICAL findings generate real-time notifications to the security team ☐
MEDIUM findings automatically create tracked work items ☐
Notifications include enriched context (account alias, resource ARN, and console link) ☐
Phase 3 At least three high-confidence finding types trigger automated remediation ☐
Auto-remediation actions have full audit trails ☐
Remediation runbooks are documented and version-controlled ☐
Phase 4 A weekly security review meeting occurs with defined attendees and agenda ☐
MTTA and MTTR are tracked monthly for CRITICAL and HIGH findings ☐
Suppression rules and disabled controls are reviewed quarterly ☐
Security metrics trend positively over the past 3 months ☐
Phase 5 Amazon Inspector, Macie, or Security Lake are integrated ☐
Preventive controls (SCPs, permission boundaries) address recurring findings ☐
Incident response playbooks exist and are tested through tabletop exercises ☐

If you have feedback about this post, submit comments in the Comments section below.


Joseph Sadler

Joseph Sadler

Joseph is a Senior Solutions Architect on the Worldwide Public Sector team at AWS, specializing in cybersecurity and machine learning. With public and private sector experience, he has expertise in cloud security, artificial intelligence, threat detection, and incident response. His diverse background helps him architect robust, secure solutions that use cutting-edge technologies to safeguard mission-critical systems

Automating identity lifecycle and security with AWS Directory Service APIs

21 May 2026 at 18:00

Managing identities and access across complex environments has become more critical than ever. AWS Directory Service for Managed Microsoft Active Directory, also known as AWS Managed Microsoft AD, has added new capabilities to manage users and groups. Now, you can perform create, read, update, and delete (CRUD) operations on users and groups directly through AWS Command Line Interface (AWS CLI), APIs, and the AWS Management Console. You can use this powerful capability to automate identity lifecycle management and enhance security in your AWS environment. By using these APIs, collectively known as the Directory Service Data APIs, you can perform operations such as:

  • Listing users and groups
  • Retrieving user and group details
  • Disabling and enabling user accounts
  • Resetting user passwords
  • Managing group memberships

These APIs provide new possibilities for automating identity management tasks and integrating Active Directory management into your existing workflows and applications.

The introduction of these APIs brings several key benefits:

  • Automation of the identity lifecycle: You can now programmatically manage user accounts throughout their lifecycle—from creation to deletion—enabling streamlined onboarding and offboarding processes.
  • Enhanced security: By integrating these APIs with security services like Amazon GuardDuty, you can create automated responses to potential security threats, such as disabling accounts with inappropriate access.
  • Improved compliance: You can use automated user management to help enforce consistent policies and help maintain compliance with various regulatory requirements.
  • Operational efficiency: You can automate routine tasks such as user provisioning, deprovisioning, and group management, reducing manual effort and the potential for human error.
  • Integration capabilities: By using these APIs, you can seamlessly integrate with existing identity management systems, custom applications, and third-party tools.
  • Cost optimization: By automating processes and reducing manual intervention, you can potentially help your organization optimize operational costs associated with identity management.

In this post, we explore these new APIs and demonstrate how you can use them to create an automated solution for detecting and responding to unexpected behavior by Active Directory users. We walk through a practical example that combines GuardDuty, AWS Step Functions, Amazon EventBridge, and the new AWS Directory Service APIs to create a robust security automation workflow.

Solution overview

To demonstrate the power of these new APIs, let’s explore a practical solution that automates the detection and response to unexpected behavior by Active Directory users. This solution combines several AWS services to create a robust security automation workflow:

    1. GuardDuty continuously monitors for unexplained behavior of Active Directory users from AWS Managed Microsoft AD. For the example in this post, we’re using Backdoor:Runtime/C&CActivity.B!DNS
    2. An EventBridge rule detects GuardDuty findings related to these users and triggers a Step Functions workflow.
      {
        "detail-type": ["GuardDuty Finding"],
        "source": ["aws.guardduty"],
        "detail": {
          "type": ["Backdoor:Runtime/C&CActivity.B!DNS"]
        }
      }
    3. The Step Functions workflow will:
      1. Extract the Active Directory username from the instance using a run command.
      2. Start an automation that will disable the account using the DisableUser API.
Figure 1: Diagram of the Step Functions workflow showing the process of Systems Manager finding the username and starting the automation to disable the account

Figure 1: Diagram of the Step Functions workflow showing the process of Systems Manager finding the username and starting the automation to disable the account

  1. Finally, another EventBridge rule will monitor the DisableUser API call. It will send an email to the user using Amazon Simple Notification Service (Amazon SNS) notifications.
    {
      "detail-type": ["AWS API Call via CloudTrail"],
      "source": ["aws.ds"],
      "detail": {
        "eventSource": ["ds.amazonaws.com"],
        "eventName": ["DisableUser"]
      }
    }

This solution delivers automated, near real-time remediation of potential security threats — significantly reducing exposure windows and containing the impact of unauthorized account access.

The following figure shows a high-level architecture diagram of the solution.

Figure 2: Diagram showing the workflow of what happens when potentially damaging activity is detected

Figure 2: Diagram showing the workflow of what happens when potentially damaging activity is detected

Note: The solution must be deployed in the primary AWS Region of your directory.

Prerequisites

To complete the walkthrough in this post, you must have the following prerequisites in place.

GuardDuty

GuardDuty is an automated threat detection service that continuously monitors for unexpected activity and unauthorized behavior to protect your AWS accounts, workloads, and data stored in Amazon Simple Storage Service (Amazon S3).

To activate GuardDuty:

  1. Go to the GuardDuty console.
    1. If you’re activating GuardDuty for the first time, under Try threat detection with GuardDuty, select All Features and then choose Get Started.
    2. If you’ve used GuardDuty before, select Runtime Monitoring and then choose Enable under Runtime Monitoring.
Figure 3: Runtime Monitoring enabled

Figure 3: Runtime Monitoring enabled

AWS Managed Microsoft AD

AWS Managed Microsoft AD provides a fully managed service for Microsoft Active Directory (AD) in the AWS Cloud. When you create your directory, AWS deploys two domain controllers that are exclusively yours in separate Availability Zones for high availability. For use cases that require even higher resilience and performance in a specific AWS Region or during specific hours, you can scale AWS Managed Microsoft AD by deploying additional domain controllers to meet your needs. These domain controllers can help load balance, increase overall performance, or provide additional nodes to protect against temporary availability issues. Using AWS Managed Microsoft AD, you can define the correct number of domain controllers for your directory based on your use case.

To deploy a new AWS Managed Microsoft AD:

  1. Go to the Directory Service console.
  2. Choose Set up directory and select AWS Managed Microsoft AD.
  3. Select Standard Edition and enter a directory DNS name and password.
  4. Select a virtual private cloud (VPC). For this example, use the Default VPC.
  5. Choose Create directory.

Create a test Active Directory user

You will use this test user account to sign in to an EC2 instance and initiate a command that simulates unexplained activity that results in this account being disabled.

To create the test user, you can use AWS CloudShell or the AWS CLI from your local machine. Run the following commands, replacing the --directory-id value with your own:

# Create the test user
aws ds-data create-user \
 --directory-id "your-directory-id" \
 --sam-account-name "TestUser" \
 --given-name "Test" \
 --surname "User"

Then

# Set a password for the test user 
aws ds reset-user-password \
 --directory-id "your-directory-id" \
 --user-name "TestUser" \
 --new-password "YourSecurePassword123!"

In this example, the password is set to YourSecurePassword123!. If you need to replace it with a password that meets your organization’s requirements, see Resetting and enabling an AWS Managed Microsoft AD user’s password. For more information on creating users, see Creating an AWS Managed Microsoft AD user in the AWS Directory Service documentation.

Test EC2 instance

To generate alerts on GuardDuty, you need a domain joined Linux EC2 instance. If you don’t have a domain joined EC2 Linux instance, follow these instructions for joining a Linux instance to an Active Directory domain. This instance will be used to simulate suspicious activity that triggers a GuardDuty finding and initiates the automated remediation workflow.

Implement the solution

Let’s walk through the steps to implement this solution in your AWS environment.

Deploy the solution

  1. Download the CloudFormation template
  2. Navigate to the CloudFormation console in the AWS account.
  3. For Create Stack, choose with new resources (standard).
  4. For Template source, choose Upload a template file. Choose Choose file and select the template you downloaded in step 1.
  5. Choose Next.
  6. For Stack name, enter a stack name (such as CRUD-API-MAD).
  7. In the Parameters area, do the following:
    1. For DirectoryID, enter the AWS Active Directory ID.
    2. For NotificationEmail, enter the email address to send the notification to.
  8. On the Configure stack options page, choose Next.
  9. Select I acknowledge that AWS CloudFormation might create IAM resources with custom names, then choose Submit.

After the page is refreshed, the status of your stack should be CREATE_IN_PROGRESS. When the status changes to CREATE_COMPLETE, proceed to the next section.

Test

To simulate a threat, use a GuardDuty test domain that GuardDuty will recognize as a command and control server.

  1. Go to the Amazon EC2 console.
  2. Choose Instances from the navigation pane.
  3. Select the test EC2 instance that you created earlier.
  4. Choose Connect, select the Session Manager tab, and choose Connect.
  5. Authenticate with your test user by entering su followed by the test user with the domain name that you created earlier. For example su TestUser@example.com, then enter the password.
  6. Enter the command curl guarddutyc2activityb.com.
    You will receive an error because the page won’t resolve, but GuardDuty will have detected concerning events.
  7. Go to the GuardDuty console and select Findings from the navigation pane.
  8. Within 3–5 minutes, you should see a high severity finding for Backdoor:Runtime/C&CActivity.B!DNS.
  9. This will then trigger the automation to disable the account.
    Figure 4: Account successfully disabled

    Figure 4: Account successfully disabled

  10. After the account is disabled, an email notification will be sent notifying an administrator that the account was disabled (it might take up to 5 minutes to receive the notification).

    Figure 5: AWS notification message showing the username has been disabled

    Figure 5: AWS notification message showing the username has been disabled

Note: You must archive the GuardDuty finding before running this test again, because the EventBridge rule only runs once against a GuardDuty finding with the same details. To archive the finding, select the check box next to the Backdoor:Runtime/C&CActivity.B!DNS finding, choose Actions (top right), and select Archive.

Conclusion

The new AWS Directory Service APIs for AWS Managed Microsoft AD provide powerful capabilities for programmatically managing Active Directory users and groups. By using these APIs in conjunction with services such as Amazon GuardDuty and AWS Step Functions, you can create sophisticated automation workflows that enhance your security posture and streamline identity management processes.

The solution we’ve explored in this post demonstrates just one of many possible use cases for these new APIs. As you integrate these capabilities into your own environments, you will probably discover numerous opportunities to improve efficiency, security, and compliance in your identity management practices.

For a solution that uses PowerShell Active Directory cmdlets with AWS Systems Manager Run Command to disable users, see How to automatically disable users in AWS Managed Microsoft AD based on GuardDuty findings.

For more information about AWS Directory Service and its APIs, visit the AWS Directory Service documentation.

We’re excited to see how you’ll use these new APIs to innovate and improve your identity management workflows. If you have any questions or want to share your own use cases, leave a comment below or reach out to AWS Support.

Remember, the cloud journey is all about continuous improvement and innovation. Keep exploring, keep learning, and keep pushing the boundaries of what’s possible with AWS.

Ali Alzand

Ali Alzand

Ali is a Senior Infrastructure Migration & Modernization Specialist Solutions Architect at AWS who helps enterprise customers migrate, modernize, and operate their Microsoft workloads on AWS. He specializes in Infrastructure as Code, automating at scale with AWS Systems Manager, EC2 Image Builder, and CloudFormation. He also designs event-driven architectures building responsive, loosely coupled solutions with EventBridge and Lambda. Outside of work, Ali enjoys grilling with friends and discovering new cuisines around town.

Kevin Sookhan

Kevin Sookhan

Kevin is a Specialist Solutions Architect at Amazon Web Services with over 20 years of experience working with Microsoft technologies. He has expertise in running Microsoft workloads on AWS with specialization in helping customers with their migrations, cost optimization, and infrastructure architecture.

Detecting and preventing crypto mining in your AWS environment

13 May 2026 at 23:47

This article guides you on how to use Amazon GuardDuty to identify and mitigate cryptocurrency mining threats in your Amazon Web Services (AWS) environment. You’ll learn about the specialized detection capabilities of GuardDuty and best practices to build a multi-layered defense strategy that protects your infrastructure costs and security posture.

Understanding the crypto mining challenge

Crypto mining in AWS environments represents a notable security challenge that extends beyond basic resource consumption.

When threat actors gain unauthorized access to cloud resources for mining operations, organizations face multiple consequences:

  • Cost increases that can range from hundreds to thousands of dollars.
  • Performance degradation that can affect legitimate workloads.
  • Potential additional security incidents that can lead to data exposure or ransomware deployment.

The complexity of crypto mining incidents continues to evolve, with unauthorized users employing advanced techniques to evade detection while maximizing resource use. Organizations often discover these intrusions only after they experience the financial effects or when resource exhaustion affects business operations.

When crypto mining indicates broader system vulnerabilities, additional concerns arise. Unauthorized users who gain access for mining purposes can install backdoors, expose sensitive data through compromised credentials, or create pathways for lateral movement within your AWS infrastructure.

Identifying signs of crypto mining activity

Organizations must remain vigilant for several key indicators of crypto mining activities. These indicators include connections to unknown IP addresses or the use of known mining pool ports, such as 3333. Sustained high CPU or GPU usage that doesn’t align with normal business operations can also signal mining activity. Unexpected network traffic patterns, particularly spikes to unfamiliar IP addresses, also warrant investigation.

Security teams must monitor for unfamiliar processes or applications that run without authorization on their resources.

How GuardDuty detects crypto mining

GuardDuty employs advanced detection methods specifically designed to identify crypto mining activities across your AWS environment. The service uses machine learning algorithms to analyze multiple data sources. These data sources are trained on global threat data gathered by AWS, anomaly detection that establishes behavioral baselines, and integrated threat intelligence from AWS Security and partners.

GuardDuty’s crypto mining detection capabilities include several specialized finding types:

GuardDuty monitors Amazon Virtual Private Cloud (Amazon VPC) Flow Logs for suspicious network patterns and analyzes DNS queries for mining-related domains. GuardDuty also scrutinizes AWS CloudTrail events for suspicious API calls and collects workload telemetry when you turn on Runtime Monitoring. This comprehensive approach allows for detection across Amazon EC2 instances, Amazon Elastic Container Service (Amazon ECS) clusters, Kubernetes environments, and standalone containers.

When you turn on the Runtime Monitoring feature, GuardDuty deploys lightweight agents that provide deeper visibility into runtime processes and system behavior, and enables findings such as CryptoCurrency:Runtime/BitcoinTool.B and Impact:Runtime/CryptoMinerExecuted. These findings detect crypto mining software that operates within your workloads. For containerized environments, Amazon Elastic Kubernetes Service (Amazon EKS) findings can indicate when unauthorized access is potentially used for crypto mining operations.

Building multilayered protection against crypto mining

Organizations typically find that crypto mining protection benefits from multiple security layers, with the detection capabilities provided by GuardDuty forming one component of a broader security strategy. Consider turning on GuardDuty across all AWS accounts and AWS Regions through AWS Organizations. Activated Runtime Monitoring and Amazon EKS protection features provide comprehensive coverage.

The following actions can enhance GuardDuty capabilities:

  • Configure Amazon CloudWatch to monitor resource use metrics and set alarms for unusual CPU, network, or GPU usage spikes that might indicate mining activity. Implement AWS Config rules to verify that security configurations are compliant. These checks make sure that security groups don’t allow broad internet access, and that IMDSv2 is enforced.
  • Deploy AWS Network Firewall to enable granular outbound filtering and allow necessary internet connectivity while blocking access to crypto mining infrastructure.
  • Deploy AWS Systems Manager to maintain visibility into instance configurations. Inventory, a capability of Systems Manager, tracks installed applications to detect mining software. Additionally, Run Command and State Manager—capabilities of Systems Manager—enforce security policies across your fleet.
  • Create automated remediation workflows that use Amazon EventBridge and Lambda to respond immediately when GuardDuty detects crypto mining activities.

Best practices for comprehensive protection

Access management and authentication

  • To strengthen your preventive measures, implement least privilege access with AWS Identity and Access Management (IAM). For software use cases, use IAM roles inside of AWS and IAM Roles Anywhere outside of AWS instead of long-lived access keys. For human identities, centralize user management through AWS IAM Identity Center with multi-factor authentication (MFA) features, in addition to attribute-based access control for fine-grained permissions. If you don’t use Identity Center, then turn on MFA for all IAM users, including those with administrative privileges, and require MFA for sensitive operations.
  • If you can’t eliminate the use of long-lived access keys, then implement regular access key rotation policies and apply least privilege access to all IAM policies. Regularly audit IAM permissions to identify and remove excessive privileges.

System maintenance and configuration

  • Use Patch Manager, a capability of Systems Manager, to implement automated patching and maintain current Amazon Machine Images (AMIs) for all deployed EC2 instances. Establish a regular patch cadence for all systems and test patches in non-production environments before you deploy a patch.
  • Implement strict ingress rules in security groups and allow only necessary traffic. Use egress filtering to prevent unauthorized outbound connections to mining pools. Regularly audit security group configurations to make sure that the configurations meet security requirements.

Data protection

  • Use AWS Key Management Service (AWS KMS)S) to turn on encryption for all data at rest, and implement TLS for data in transit. AWS KMS uses envelope encryption by default, and protects your data keys with master keys to provide enhanced security and performance. It’s a best practice to regularly rotate encryption keys.

Benefits of comprehensive crypto mining protection

Organizations that implement these comprehensive security measures can experience the following improvements in their security posture and operational efficiency:

  • Reduced detection time: Detection times for crypto mining activities decrease from days or weeks to minutes so that teams can rapidly contain issues before significant damage occurs.
  • Automated responses: Automated response workflows reduce manual intervention requirements so that security teams can focus on strategic initiatives.
  • Cost control: These measures identify and terminate unauthorized resource consumption and prevent unexpected billing increases.
  • Performance stability: Crypto mining processes no longer monopolize CPU, memory, and network resources so that your organization can maintain application performance.
  • Enhanced visibility: The monitoring approach helps identify crypto mining and other security threats that might go unnoticed.
  • Team confidence: Security teams gain confidence through continuous monitoring and automated alerts. Teams can be secure in knowing that crypto mining attempts are promptly detected and addressed.

The implementation of preventive controls reduces the potential for initial incidents. Regular patching and configuration management further strengthen your overall security posture.

Crypto mining approval on AWS

AWS requires written approval for crypto mining activities on AWS under AWS Service Terms (Section 1.25). This requirement helps protect both your resources and the broader AWS infrastructure.

Requesting approval

AWS Trust & Safety reviews requests to help prevent mining activities from negatively affecting service performance or security. When submitting your request, include the following information:

  • Describe your mining purpose and business case.
  • Outline your infrastructure planning and cost management approach.
  • Detail your security measures to prevent unauthorized access.
  • Provide emergency contacts for rapid communication, if issues arise.
  • Specify the number of instances and type of crypto mining.

What to expect after approval

Approved mining operations must follow specific guidelines to maintain good standing. AWS monitors approved mining activities to verify that the activities don’t generate abuse reports, effect service performance, or deviate from prescribed architecture and security practices.

Important considerations

Review the following information:

  • You can’t use AWS Credits and Free Tier resources for crypto mining activities.
  • It’s essential to continuously monitor your mining resources.
  • Based on changing infrastructure conditions, AWS can adjust approvals.

This approval process distinguishes legitimate mining operations from unauthorized activities that might indicate security compromises.

Conclusion

To protect AWS environments against crypto mining, AWS Trust & Safety recommends taking a comprehensive approach that combines advanced threat detection with proactive security measures. GuardDuty provides foundational detection capabilities that help to identify crypto mining activities, while complementary AWS services create a robust security ecosystem that protects your infrastructure and data.

Security is a shared responsibility. While AWS provides powerful tools and services designed to be highly secure, your organization’s implementation of security practices and controls determines your overall protection level. Regular review and updates of your security measures, as well as team training and awareness, help maintain an effective defense against crypto mining and other security threats in your AWS environment.

If you have feedback about this post, submit comments in the Comments section below.

Jason Palmer

Jason is a Senior Technical Account Manager (TAM) at AWS Enterprise Support, based in Seattle, Washington. With over 6 years at AWS, Jason combines deep technical expertise with a genuine passion for people — helping enterprise customers transform complex challenges into scalable cloud solutions.

Nadia Mahmood

Nadia is a Trust & Safety Customer Advisor at AWS, based in Virginia. Nadia works with enterprise customers on abuse reporting and compliance, handling escalated takedown requests and strategic partnerships to reduce abuse across AWS.

Contributors

Special thanks to James Ferguson, a Principal Solutions Architect and Jeffrey Bickford, a Security Engineering Manager, who made significant contributions to this post.

Complimentary virtual training: Get hands-on with AWS Security Services

11 May 2026 at 19:58

If you’re looking to strengthen your organization’s security posture on Amazon Web Services (AWS) but aren’t sure where to start, then we’re here to help. Security Activation Days are complimentary, virtual, hands-on workshops designed to help you get practical experience with AWS security services in a single session.

What to expect

Each Security Activation Day is a 3–6 hour virtual workshop where you work directly with AWS security services in real-world scenarios. Through a combination of presentations, demos, and workshops, you will get hands-on practice guided by AWS security specialists either in your own environment or in an AWS-provided sandbox.

Topics rotate across the full spectrum of AWS security, identity, and governance services, including threat detection and response, identity and access management, network and application protection, data protection, and governance and compliance. You will leave with actionable knowledge you can apply to your workloads immediately—not a to-do list of things to research later.

Who should attend

Security Activation Days are made for builders—security engineers, cloud architects, and DevOps teams who want to go deeper on specific AWS security capabilities. Whether you’re evaluating a service for the first time or looking to operationalize something you’ve already deployed, these sessions meet you where you are.

What attendees are saying

With over 6,400 attendees across 90 events so far in 2026, Security Activation Days consistently earn a 4.8 out of 5 satisfaction rating. Participants tell us the hands-on format is what makes the difference: there’s no substitute for actually configuring a service and seeing the results in real time.

How to register

We run Security Activation Days year-round across all time zones, with new sessions added regularly. Find a session, show up ready to learn, and start building today.

If you have feedback about this post, submit comments in the Comments section below.

Ashley Nelson

Ashley Nelson

Ashley is a Sr. WW Security Specialist at AWS, where she leads worldwide customer enablement programs for Security, Identity, and Governance services.

Security posture improvement in the AI era

1 May 2026 at 22:58

It’s only been a few weeks since Anthropic announced the Claude Mythos Preview model and launched Project Glasswing with AWS and other leading organizations. This has generated a lot of discussion about the future of cybersecurity and what the ever-increasing capabilities of foundation models mean to organizations.

As AWS CISO Amy Herzog pointed out in the Project Glasswing announcement, “At AWS, we build defenses before threats emerge, from our custom silicon up through the technology stack. Security isn’t a phase for us; it’s continuous and embedded in everything we do.”

Read more from Amy about this in Building AI defenses at scale: Before the threats emerge.

While the discussion around the future of cybersecurity is important, the only thing we know for certain is that organizations need to be able to react quickly to the rapid changes AI is bringing to technology and business in general. And you can’t react quickly if your security fundamentals aren’t dialed in.

The security hygiene gap

It’s easy to assume you have the foundational security elements covered, or to overlook some completely. Basic security use cases like identity management, threat detection, vulnerability management, data protection, and network security can be inconsistently implemented across cloud environments. While AI is reshaping the security landscape, strong security fundamentals continue to be essential for every organization, regardless of size or industry.

These are the security basics that matter whether or not you’re adopting AI: patching consistently, enforcing least-privilege access, enabling logging and monitoring, encrypting data at rest and in transit, and reviewing security configurations regularly. When these fundamentals are in place, you’re better positioned to take advantage of AI-driven tools and respond to newly discovered vulnerabilities, wherever they come from.

While the concepts that drive security fundamentals are universal, implementing them in your environment is best done with an understanding of the context unique to your organization. That’s why we have a multitude of freely available materials—like the AWS Well-Architected Framework—that you can use to help ask the right questions and implement changes in your environment. We also offer programs like the Security Health Improvement Program (SHIP) to help you improve your security posture through prescriptive guidance and continuous improvement.

What is the Security Health Improvement Program (SHIP)?

SHIP is a no-cost program available to every AWS customer, regardless of support tier. SHIP provides a proven, data-driven methodology to:

  • Assess your current security posture using data from your AWS environment
  • Identify specific opportunities to improve across 10 core security use cases
  • Build a prioritized action plan tailored to your environment
  • Establish a mechanism for continuous security improvement

The program is led by AWS Solutions Architects and Technical Account Managers who take you through a personalized report, contextualize findings for your environment, and help you build a prioritized action plan.

Why SHIP matters in the AI era

Project Glasswing highlights an important shift: AI-powered tools are accelerating the pace of vulnerability discovery, which means organizations need to be prepared to assess and respond to findings and changing situations faster than before. In addition to external factors, as organizations adopt AI—whether deploying foundation models, building agentic workflows, or using AI-powered services—how they implement their security controls must change as well. A strong security foundation is what makes confident AI adoption possible.

Here’s how SHIP helps:

Address foundational security gaps proactively

SHIP uses a data-driven methodology to identify opportunities to improve and optimize across 10 core security use cases: threat detection, cloud security posture management, application security testing, configuration management, access governance, vulnerability management, application protection, network security, encryption, and secrets management. The program includes a SHIP assessment to identify critical security findings related to your current security posture, so your team can build a prioritized roadmap for improvement tailored to your environment.

Establish the security baseline AI workloads require

Before you deploy your first model on Amazon Bedrock or build agentic workflows with Amazon Bedrock AgentCore, you need confidence that your underlying infrastructure follows security best practices. SHIP uses actual data from your environment to provide prescriptive, specific guidance rather than generic security recommendations. This is especially relevant as AI-driven vulnerability discovery tools become more widely available: organizations with strong baselines will be able to act on new findings quickly and effectively.

Build a mechanism for continuous security improvement

As AI capabilities evolve, organizations benefit from having a repeatable process to assess and strengthen their security posture over time. SHIP establishes the methodology and mechanisms for your team to continuously assess, prioritize, and improve. By building this operational capability, you’re strengthening your organization’s ability to adapt and contributing to broader industry resilience. As the cybersecurity community integrates AI into defense strategies, SHIP helps you maintain foundational best practices so you can adopt these innovations effectively and with confidence.

Getting started is straightforward

SHIP is available today, at no cost, to every AWS customer. Here’s how to get started:

  1. Talk to your AWS account team. Ask about scheduling a SHIP engagement, or request one directly on the SHIP page.
  2. Attend a SHIP Activation Day. AWS regularly hosts hands-on workshops where you can run the SHIP assessment with AWS Solutions Architects and start building your improvement plan.
  3. Explore the prescriptive guidance. Consult the AWS Well-Architected Framework – Security Lens for documentation, reference architectures, and implementation guides you can start using today.

Take the next step together

AWS is committed to being the most secure cloud, from our participation in Project Glasswing to the security embedded in every layer of our infrastructure. Security is a shared responsibility, and programs like SHIP give customers the tools, guidance, and support to strengthen their security foundations so they can build confidently, no matter what comes next.

Ready to improve your security posture? Contact your AWS account team to schedule a SHIP engagement, or visit the SHIP resources page to learn more.

Celeste Bishop

Celeste Bishop

Celeste is a Senior Security Specialist at AWS, based in Austin, Texas. Over the past five years, she has held a range of security-focused roles spanning field and product marketing, developer relations, and executive engagement. She partners closely with customers, security leaders, and field teams to help organizations operate securely in the cloud. Celeste holds a Bachelor’s in Economics from the University of Texas at Austin.

❌