❌

Reading view

FBI Arrests Executive at Ransomware Negotiation Firm

Agents with the Federal Bureau of Investigation (FBI) on Thursday arrested an executive at a Canadian cybersecurity firm in connection with an investigation into the ShinyHunters hacking group that recently relieved the FBI of sensitive data on thousands of agents, multiple sources tell KrebsOnSecurity.

The New York Times reported today that the FBI has arrested a Canadian man in Pennsylvania on suspicion of assisting ShinyHunters. The Times story did not identify the man, nor did a statement on Twitter/X about the arrest from FBI Director Kash Patel.

One source close to the investigation told KrebsOnSecurity the Canadian person arrested this week was visiting Pennsylvania for a cyber insurance conference, and that the suspect’s company specialized in handling ransomware negotiations with cybercrime groups. Another shared that control over the ShinyHunters investigation has been centralized at an FBI field office in Texas.

An online search reveals the Cyber Risk Summit was held at the Loews Philadelphia Hotel between Oct. 5 and Oct. 7. The conference had several sponsors, but according to the summit’s website its biggest sponsor was a Canadian security company called Cypfer.

According to LinkedIn, one of Cypfer’s “ex-founders” was Edward Dubrovsky, who is now associated with another Canadian security firm and sponsor called CyberSteward. In a post to LinkedIn approximately one month ago, Dubrovsky said he had plans to attend the Cyber Risk Summit with the rest of the CyberSteward team.

[Update: Oct. 10, 9:58 a.m. ET: A spokesperson for Cypfer said Dubrovsky was not a founder or co-founder as his LinkedIn profile claims, but instead served as a managing director before resigning in December 2025].

Edward Dubrovsky’s LinkedIn profile.

“Looking forward to continuing conversations around strategy & compliant driven coercive (ransomware, extortion) advisory, negotiations and settlement services that are global and truly agnostic,” Dubrovsky wrote.

Federal court records show that on October 8, an Edward Dobrovsky (note the slight misspelling of the last name) was arrested in Pennsylvania on cyber extortion and conspiracy charges. Several of those documents — including the core complaint — are now sealed. But a handful of them were indexed at Courtlistener.com, including a summary of the complaint, which charges the defendant with “conspiracy to threaten to impair the confidentiality of information with the intent to extort money,” and “interference with commerce by threats.”

Image: Courtlistener.com

The inmate locator at the U.S. Bureau of Prisons website reports that a 54-year-old Edward Dubrovsky is currently being held at a federal facility in Philadelphia. But the court records indexed by CourtListener include a notice filed on October 9 that moved the case to the Eastern District of Texas, which sources say is now the epicenter of the FBI’s ShinyHunters investigation. The FBI declined to comment for this story.

Dubrovsky’s LinkedIn profile states he is the author of Cyber Extortion Strategic Response, a 252-page book that promises to “take readers beyond the ransom note and into the decisions that determine how an organization responds, recovers, and protects what matters.”

Edward Dubrovsky’s book, which centers on the intricacies of ransomware negotiations.

“At the heart of the book is a critical distinction: communicating with a criminal is not the same as negotiating a payment, and negotiating is not a commitment to pay,” reads an excerpt from the book’s listing on Amazon. “Engagement can serve other objectives, including testing claims, gathering information, creating time, and preserving options while the organization evaluates its next move.”

Mr. Dubrovsky could not be immediately reached for comment. KrebsOnSecurity also sought comment from other executives at CyberSteward, and will update this post in the event they respond. The available court records in Dubrovsky’s case show that he does not currently have an attorney and has yet to be appointed a public defender by the courts.

ShinyHunters typically uses phishing and stolen credentials to siphon data from corporate accounts at software-as-a-service companies, and then threatens to publish the stolen data online unless a ransom demand is paid. According to the FBI, the group has extorted more than $70 million from victims so far this year.

Sources tell KrebsOnSecurity the FBI has been poring over devices that were seized last month when the Dutch police arrested the convicted cybercriminal Pepijn van der Stap in connection with the ShinyHunters investigation, and that charges against principals at other companies that specialize in ransomware negotiation may be forthcoming.

Immediately after Van der Stap’s arrest, another member of ShinyHunters named “Rey” assumed control over the group and began taunting the FBI over data the group stole from the agency’s online recruitment portal, which included each’s person’s unit and specialization, as well as medical and psychiatric records.

Last week, Reuters reported that Rey — identified as a teenager named Saif Al-din Khader — had been detained and was cooperating with FBI investigators. On October 7, we detailed how Rey was apprehended as the cybercrime group allegedly sought to extort a navigation and digital aviation unit that was divested by Boeing in late 2025.

This is likely to be a fast-moving story. Updates will be noted along with timestamps.

  •  

Forensic Data: How to Acquire and Retain Vital Evidence

While "digital forensics" and "incident response" often appear together (as in the acronym "DFIR"), they represent two distinct disciplines.

What's in a Name?

The American Heritage Dictionary defines forensics as "The use of science and technology to investigate and establish facts in criminal or civil courts of law."

Contrast this with IBM's definition of incident response: "Incident response [...] refers to an organization's processes and technologies for detecting and responding to cyberthreats, security breaches or cyberattacks." Note the absence of any reference to legal proceedings—it simply describes the process by which an organization detects, halts, and recovers from an incident.

Legal Considerations

Although most incidents never end up in court, all should be treated as if they might.

Taking the proper steps before, during, and after response ensures that any data collected can be admissible as evidence.

It's important to know the rules of evidence for relevant jurisdictions. Global corporations should consider each jurisdiction they have locations in when developing standard operating procedures (SOPs). Always include legal counsel when developing your organization's SOPs.

Data Preservation

A common rule for digital evidence is the retention of data in its "original state." This is accomplished by using validated hardware and software to create an exact bit-for-bit copy of a piece of digital media. Yet during incident response, it is rare that full forensic images are created—typically, only a small subset of data is collected from victim devices for analysis. Before any action is taken, consult legal advisors to decide whether to collect full forensic images.

A good practice is to create a folder for the original data, generate and document a hash of its contents, and then create a working copy in a separate folder. Only perform analysis on the working copies of your data to preserve the integrity of the original data.

Documentation

Documentation is critical when handling potential evidence. A chain of custody (CoC) records details about what the data is, where it came from, who collected it, whom it was transferred to, a brief description of what was done to it, and so forth.

The National Institute of Standards and Technology (NIST) provides a sample CoC here:
https://www.nist.gov/document/sample-chain-custody-formdocx

Each person working with the data must keep detailed notes: record dates, times, and any actions taken. Binary files often need to be parsed by special tools to make their data human-readable—include any tool names and versions. The same should be done with human-readable data, such as text-based log files. While you likely don't need to document the version of Excel used to read a log file, if you added a column to show UTC date/time stamps in local time, that is worth noting.

The gold standard for documentation is this: notes should be detailed enough that someone with a similar background can recreate your steps and produce the same results.

This is the scientific method part of digital forensics. Processes need to be repeatable and generate the same results.

Tool Validation Procedures

Before an incident occurs, verify that your hardware and software are working. Test write blockers to ensure they do not alter the evidentiary media. Validate that your forensic software functions correctly (it's not unheard of for new versions to report the wrong date/time stamps when parsing binary data).

While there is no set standard for validation processes, some guidelines exist to help you develop validation SOPs.

Validation SOPs guidelines:
NIST: https://www.dhs.gov/science-and-technology/nist-cftt-reports
SWGDE: http://cet4861.pbworks.com/w/file/fetch/120024474/4861.2014-09-05_SWGDE_Recommended_Guidelines_for_Validation_Testing_V2-0.pdf

Additional Considerations for Incident Handling

When managing incidents, also consider:

  • What are the data retention policies of your Endpoint Detection and Response (EDR) tools?
  • How is your cloud data preserved?
  • Who has access to sensitive or personal data?

These factors often depend on your license agreement with providers. Make sure data can be maintained in a secure, long-term manner, as it can take years until an incident makes it into the courtroom. Implement processes to export incident data from systems and services while preserving integrity and meeting long-term storage requirements that protect its availability and confidentiality. Access to confidential information must always be managed carefully.

Remember: Involve your legal team, validate your tools, work from copies (never original data), document everything meticulously, and maintain chain of custody.

  •  

Calling Reinforcements: Your Incident Response Plan, Before The Fire Starts

Many people ask: At what point do I bring in law enforcement during a cyber incident? When should I get outside help such as another consulting firm to support incident response? The honest answer is simple: before you ever need them. The best time to build reinforcements is not during a crisis. It is now.

It’s the same idea as that old proverb: “The best time to plant a tree was 20 years ago. The second best time is now.” Cybersecurity works the same way. Incident response is messy, emotional, and chaotic. You don’t want to be flipping through your contacts for a random phone number when your domain controller is encrypted and your CEO is standing behind you asking for updates. You want relationships, people who already know you and are ready to help.

Build Your Network Before You Need It

Start with your own community. Get involved with organizations such as InfraGard and HTCIA. Attend local cybersecurity meetups, conferences, and regional response groups. Shake hands. Collect business cards. Swap stories. These small moments build the trust you will rely on when your network goes sideways at 2 a.m. on a Saturday.

Identify who your law enforcement contacts are now, such as local FBI field office personnel, state cybercrime investigators, or specialized digital forensic units. Introduce yourself. Learn what they do and how they operate. Because during an incident is a terrible time to be making introductions.

When to Call Law Enforcement

Whenever you are handling an incident, reach out to law enforcement early. They might not jump into every ransomware attack or stolen laptop case, but it is still important to keep them informed. They have something you do not have: legal authority. If you need warrants, subpoenas, or data preserved from third-party providers, law enforcement has the tools to make that happen. If nothing else, contacting them shows you are acting responsibly, and that matters later.

Your next reinforcement is legal. You should already have a law firm on an incident response retainer before something goes wrong. But don’t just pick any law firm. Choose one with real experience handling cyber incidents.

Traditional attorneys often respond to breaches by locking everything down and preventing collaboration. That approach creates chaos. Experienced breach counsel understands that incident response requires teamwork, not isolation.

They know how to:

  • Work with law enforcement
  • Coordinate with security firms
  • Maintain legal privilege where appropriate
  • Guide sensitive communications
  • Draft clear breach notifications
  • Stay cool when everything burns

If they have been through this before, they will not fall apart when it is your turn.

Cyber Insurance Requires Work

If you are in an incident and asking whether your cyber insurance covers it, it is already too late. You either have coverage or you do not. And getting that coverage is becoming harder.

Insurance companies are nervous. Ransomware costs are rising and payouts have become massive. Even if you do get coverage, read the fine print. Most policies require due diligence—you must demonstrate that you were following reasonable security practices. If you have ignored vulnerability management, asset inventory, access control, logging, and backups, your insurer may deny your claim.

Cyber insurance is not a magic safety net. It is a contract that assumes you are taking security seriously.

Build Relationships, Not Just a Plan

If there is one theme here, it is this: In a crisis, you do not rise to the occasion. You fall back on the strength of your relationships. When an incident hits, you should not be scrambling to track down experts. You should already know who to call and they should already know you.

Start building your network today. Law enforcement contacts, legal counsel, insurance providers, and trusted incident response partners should already be in your corner. When the day comes, you will not be calling strangers. You will be calling reinforcements. Friends. Colleagues. People who already have your back.

Start now.

  •  

Tech and Security Companies Respond to PHP2Shell Vulnerabilities

Vendors are checking their products for PHP2Shell, security firms are shipping detections, and governments are urging immediate patching.

The post Tech and Security Companies Respond to PHP2Shell Vulnerabilities appeared first on SecurityWeek.

  •  

The Noise Inside the Network: How an Unsophisticated Attack Exposed a Third-Party Risk

Unit 42 dissects a cyberattack targeting a European bank's IT infrastructure, delivering concrete defense strategies to help organizations detect and counter comparable threats.

The post The Noise Inside the Network: How an Unsophisticated Attack Exposed a Third-Party Risk appeared first on Unit 42.

  •  

Group Policy hijacked: PAYLOAD ransomware weaponizes Active Directory GPO

Executive summary

In April 2026, we at Kaspersky’s Global Emergency Response Team (GERT) responded to a security incident at a manufacturing organization in the Middle East. The threat actor obtained domain admin-equivalent control of the organization’s Active Directory environment and authored a malicious Group Policy Object (GPO) named PAYLOAD, linking it at the domain root. Through that single object, the actor delivered ransom notes, hijacked the desktop wallpaper and lock screen, enforced a logon banner, and disabled the local administrator account across every domain-joined Windows workstation — all without dropping a ransomware binary or encrypting any data. The only ransomware we found in this incident was PAYLOAD sample targeting ESXi on Linux servers. Besides that, data exfiltration was observed originating from the file servers and several additional systems, and was later published on the dark web.

This case is an example of two converging trends that define the 2026 ransomware landscape:

  1. Living-off-the-land abuse of trusted AD infrastructure. Group Policy is a signed, allowlisted, SYSTEM-privileged distribution channel that the majority of endpoint detection and response tools is designed not to inspect. By delivering impact through GPO rather than through malware, the actor sidestepped the entire file- and process-based detection stack.
  2. Encryptionless extortion. Industry telemetry shows extortion-only incidents grow significantly year-on-year. PAYLOAD fits this model; the leverage is operational disruption and the threat of escalation rather than cryptographic denial of data.

We confirmed that no files were encrypted on Windows machines, no malicious binaries were resident on disk, no endpoint persistence was established, and no malicious processes were running at the time of analysis. The entire attack lived inside Active Directory itself. The defensive implication is stark: an organization whose detection strategy depends on catching a ransomware executable would have seen nothing until the first endpoint rebooted and the ransom wallpaper appeared.

In this article, we will describe the GPO attack chain and provide operational advice on how to detect such threats, including detailed remediation recommendations.

Group Policy as an attack surface

Attacks through group policies are nothing new. They can inflict significant, domain-wide damage with multiple malicious capabilities. A Group Policy Object (GPO) is essentially a combination of a Group Policy Container (GPC) in Active Directory and a Group Policy Template (GPT) in SYSVOL. The Group Policy scope depends on whether the GPC is linked to the directory tree at the domain, site, or organization unit (OU) level. A link at the domain root means the policy applies to every computer and user object beneath it. Thus, a GPO compromised at the domain root can affect all in-scope domain users and computers, potentially granting an attacker complete control over the corporate network. What makes GPO abuse even more dangerous is that group policies are processed in a trusted, high-privilege environment, ensuring persistence because endpoint cleanup is not enough to remove them.

We have already discussed GPO architecture and ways it can be compromised in greater detail in an earlier blog post. Other public threat intelligence has also repeatedly documented this technique in ransomware operations. Microsoft observed Ryuk operators distributing ransomware through Group Policy, SYSVOL startup items, and PsExec. LockBit affiliates have been documented modifying SYSVOL Group Policy files, including ScheduledTasks.xml, to support ransomware execution and propagation. BlackCat/ALPHV operators have also abused GPOs to create scheduled tasks and deploy ransomware.

Another notable example of GPO abuse is PAYLOAD ransomware, which weaponizes GPO Preferences and policy settings for pure impact rather than as a launcher for an encryptor. Let’s take a closer look at this attack, which is detailed further below.

Attack timeline

During the April 2026 investigation, we managed to reconstruct the attack timeline as outlined below:

Date Event
11 April Initial access. Threat actor authenticates to the FortiGate SSL VPN using a valid but compromised domain credential.
13 April GPO authored. Malicious GPO, PAYLOAD ({C897F2C7-C2AC-4E6F-BF48-58036FF29E79}) created and linked at the domain root, configuring ransom notes, wallpaper, lock screen, logon banner, and administrator account disablement.
13 April SYSVOL staging. The payload.jpg and hello.txt files written to \\DC.THECOMPANY.local\sysvol\THECOMPANY.local\.
13 April Second GPO. GPO named win Firewall Off ({22099AD2-E062-4F56-B574-5099BBA4E7A6}) linked at the domain root, disabling Windows Firewall on all profiles.
13 April Dormancy. GPO cached on endpoints but computer configuration not yet applied — no endpoint had rebooted since the policy update.
13 April Data exfiltration. Data exfiltration was observed originating from the file servers and several additional systems.
14 April Detonation. Most of the endpoints begin rebooting; computer configuration policies apply. Ransom wallpaper, logon banner, and notes appear. Operational disruption begins.
15 April Response. Kaspersky GERT engaged. Forensic triage of affected workstations and the domain controller initiated.
16 April Assessment. GERT confirms no file encryption, no resident malware, no endpoint persistence.

Next, we will discuss each of these stages in more detail and share the findings from our incident response activities.

Incident overview

Initial access

The entry vector was a compromised valid account (MITRE ATT&CK T1078) used to authenticate through the organization’s FortiGate SSL VPN — an external remote service (T1133). Insufficient logging on the FortiGate appliance prevented us from reconstructing how the credential was originally compromised.

Three hypotheses were considered plausible in the context of the attack, in no particular order:

  • Password spraying or credential stuffing against the SSL VPN portal.
  • Phishing-led credential harvesting.
  • Purchase of pre-compromised credentials from an initial access broker (IAB).

Once on the internal network, the actor operated with the compromised security principal’s privileges. Because the account was able to create and link a GPO at the domain root, it held either domain admin privileges or a delegated equivalent (e.g., membership of Group Policy Creator Owners combined with link rights on the domain object).

FortiGate SSL VPN authentication logs and ESXi/virtualization privilege escalation logs were insufficient to reconstruct the lateral movement and privilege escalation chain between initial VPN access and the GPO write privilege level. The most common real-world routes to GPO control — DCSync, Kerberoasting of privileged service accounts, and Pass-the-Hash/Pass-the-Ticket — could not be confirmed or ruled out.

Execution

Rather than deploying an encryptor, the actor abused the victim’s Active Directory policy infrastructure, resulting in malicious GPOs being configured and linked at the domain root to deliver the observed impact across domain-joined systems. The two GPOs below constitute the entire offensive toolkit observed.

The PAYLOAD GPO

We performed a Resultant Set of Policy (RSOP) analysis, which helped us list all policy settings on the affected workstations. From these results, we reconstructed the following changes delivered by PAYLOAD:

GPO extension/CSE Setting/path Configured value/resulting action
Files (Group Policy Preference) Source SYSVOL\hello.txt → Desktop, C:\, D:\ Dropped as README-payload.txt (ReadOnly)
Registry (Computer) HKLM\SOFTWARE\Microsoft\Windows\CurrentVersion\Policies\System\legalnoticecaption Welcome to Payload!
Registry (Computer) HKLM\…\Policies\System\legalnoticetext (ransom demand text)
Personalization Policy Lock Screen Image \\DC.THECOMPANY.local\sysvol…\payload.jpg
Desktop Policy (User) Wallpaper path \\DC.THECOMPANY.local\sysvol…\payload.jpg
Security Settings (GptTmpl.inf) Accounts: Administrator account status Disabled

The PAYLOAD GPO enabled the following actions:

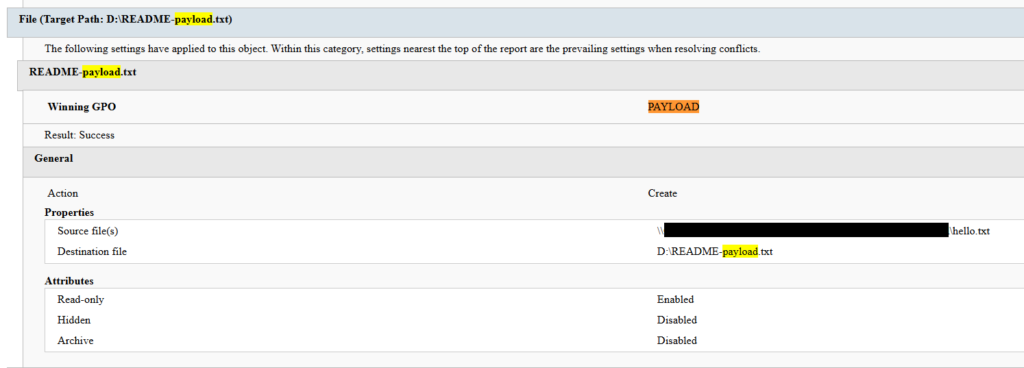
  1. Drop SYSVOL\hello.txt to the desktop and root directories C:\ and D:\ as a read-only README-payload.txt by tampering with the “Group Policy Files” client-side extension (CSE).
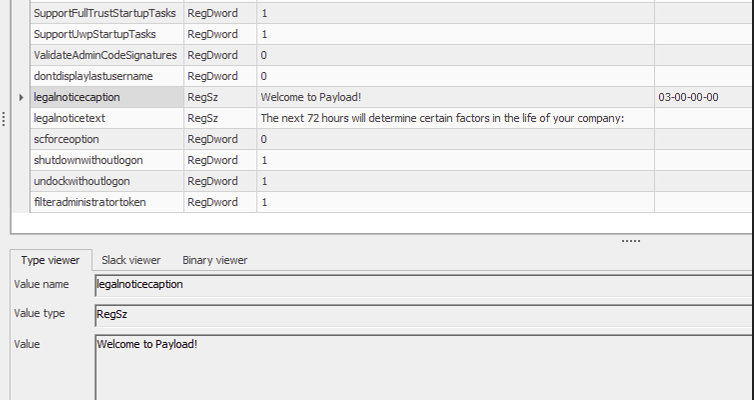
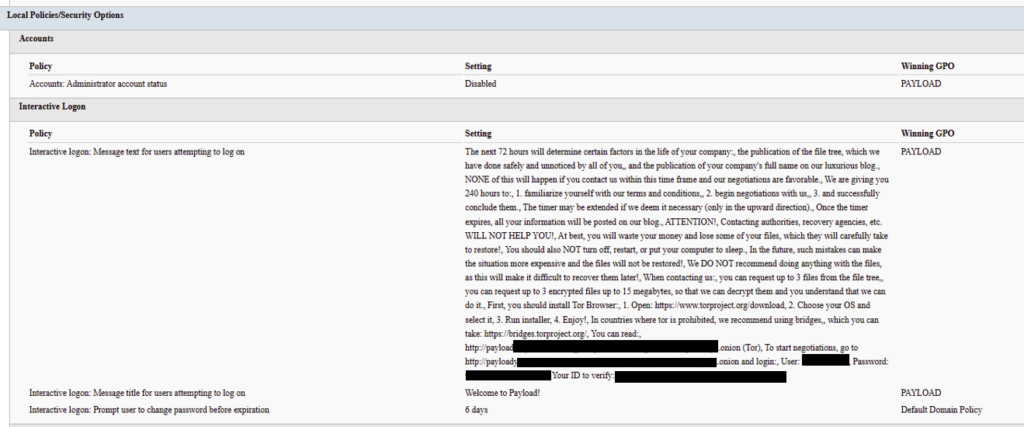
  2. Modify the HKLM\SOFTWARE\Microsoft\Windows\CurrentVersion\Policies\System\ registry key, changing the legalnoticecaption value to "Welcome to Payload!" and the legalnoticetext to the ransom note text through the “Group Policy Registry” CSE.
  3. Set payload.jpg located in the targeted domain controller’s SYSVOL as the lock screen image by altering the personalization policy, and as the wallpaper by altering the desktop policy at the user level.
  4. Revoke administrator rights for the administrator account (locking the account) by editing the Security Settings CSE in the GptTmpl.inf file.

Settings changed by PAYLOAD GPO

Settings changed by PAYLOAD GPO

This activity was enabled entirely through a legitimate group policy mechanism, meaning there is no malware code for security solutions to look for because the malicious logic is contained within the policy configuration.

The win Firewall Off GPO

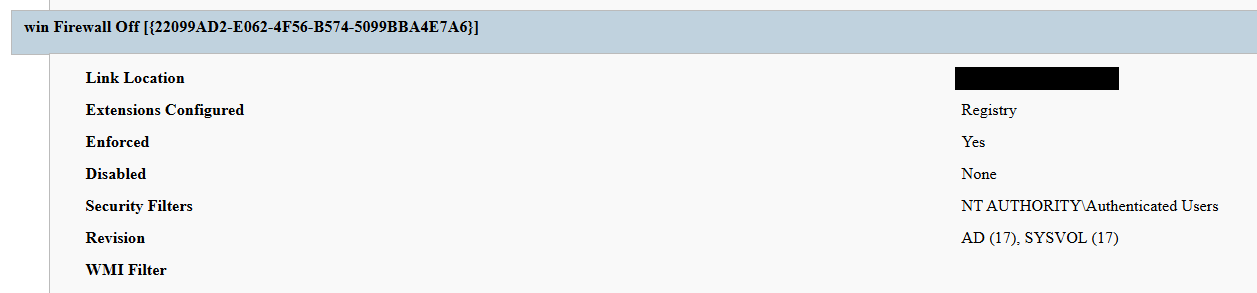
A second domain-root-linked GPO, named “win Firewall Off”, disabled Windows Firewall across the domain, private and public profiles on all endpoints (T1562.004). Deployed independently of PAYLOAD, this object degraded host defenses and ensured the actor retained unimpeded network reach to endpoints for any follow-on activity.

Settings changed by win Firewall Off GPO

Settings changed by win Firewall Off GPO

The one-day delay detonation

The most forensically instructive detail is the one-day gap between GPO creation (13 April) and visible impact (14 April). Analysis of Master File Table (MFT) timestamps and the Group Policy History registry key confirmed the policy was written to SYSVOL and cached on endpoints on 13 April. However, computer configuration settings (wallpaper and lock screen machine policy, security settings, firewall disabling) only apply upon reboot or policy refresh — and no endpoint had rebooted in the interim. The attack therefore remained dormant in the GPO cache for one day before detonating en masse when machines were restarted in accordance with standard procedures.

We have to point out here that this delayed policy application is characteristic of GPO-based operations and has two potential consequences for defenders. Firstly, it may grant the actor a quiet window for exfiltration, persistence, or further staging between weaponization and impact. Secondly, it can be used to sever the temporal link between the cause (a GPO-creation event in the directory log) and the effect (mass user-visible disruption occurring at a later time), complicating timeline reconstruction unless directory service auditing is in place.

Forensic findings

Initial incident response engagement revealed a number of findings associated with the attack that we share below.

  1. No file encryption
    A full review of the MFT on affected workstations found no files bearing a .payload extension characteristic to PAYLOAD ransomware and no evidence of bulk renaming or encryption I/O patterns. The attackers’ objectives were operational disruption and extortion via visual impact and access denial.
  2. No endpoint persistence
    All standard persistence locations were clean:
    • Scheduled tasks — no malicious tasks
    • Run/RunOnce keys — clean
    • Startup folders (user and system) — clean
    • Services — no malicious service installed
    • WMI event subscriptions — none
    • Boot sector/MBR — unmodified

    The attack’s persistence mechanism is the GPO link itself on the domain controller, with no endpoint-resident component.

  3. No active malicious processes
    Live process and memory analysis revealed no injected threads, process hollowing or anomalous outbound connections.
  4. Registry timeline analysis
    Group Policy History, Shadow and State registry keys on the workstation recorded the application of PAYLOAD on 13 April:
    HKLM\…\Group Policy\History\{35378EAC-683F-11D2-A89A-00C04FBBCFA2}\1
    HKLM\…\Group Policy\Shadow\{827D319E-6EAC-11D2-A4EA-00C04F79F83A}\0
    HKLM\…\Group Policy\State\Machine\GPO-List\7
    HKCU\…\Group Policy\History\{7150F9BF-48AD-4da4-A49C-29EF4A8369BA}\1
    HKCU\…\Group Policy\State\S-1-5-21-…\Loopback-GPO-List\5
    The presence of the “Loopback-GPO-List” entry indicates the GPO was processed in loopback mode, ensuring the user configuration (wallpaper) applied regardless of which user logged on to the machine.
  5. SYSVOL artifacts
    Two files were staged on the domain controller’s SYSVOL share and served to endpoints through the Files Group Policy Preference CSE:
    • payload.jpg — the ransom image used for both wallpaper and lock screen.
    • hello.txt — the ransom note, distributed to desktops and drive roots as README-payload.txt.

Detection engineering

Because no malicious binary or process exists, the detection logic should focus on the directory service and SYSVOL indicators. Below are the highest-value telemetry sources for identifying the described malicious activity.

  • Directory service change auditing (DS Access)
    Enable Advanced Audit Policy → DS Access → Audit Directory Service Changes on all domain controllers and set up alerts for the following events:
    Event ID Meaning Hunt focus
    5137 A directory service object was created The account that created new groupPolicyContainer objects must be an authorized GPO administrator
    5136 A directory service object was modified Changes to gPLink on the domain root or sensitive organizational units; changes to gPCMachineExtensionNames/gPCUserExtensionNames/gPCFileSysPath/versionNumber for all GPOs
    5141 A directory service object was deleted GPO deletions (relevant for tamper detection and remediation assessment)

    A gPLink modification at the domain root by a non-standard account is one of the most telling indicators of this attack class.

  • SYSVOL file integrity monitoring
    Monitor \\DC.THECOMPANY.local\sysvol\THECOMPANY.local\Policies\ for unexpected files, particularly image files, text files, scripts, ScheduledTasks.xml, and modified registry.pol/GptTmpl.inf files that were created by sources other than legitimate replication.
  • Endpoint policy application telemetry
    On endpoints, GPO application is logged in the Group Policy Operational log (Microsoft-Windows-GroupPolicy/Operational) and reflected in the History and Shadow registry keys shown above. A sudden domain-wide change to the applied policy set is a strong post-detonation signal.
  • Missing 5136 events
    If the contents of a GPO’s SYSVOL change without a corresponding 5136 event, this can indicate direct SYSVOL/template editing (e.g., via open-source tools such as PowerView or SharpGPOAbuse) that bypasses the normal Group Policy Management Console (GPMC) modification path. While we recommend treating the absence of expected audit events as suspicious, it should be noted that this can be caused by misconfigured auditing.

Anti-forensics and recovery-inhibition capabilities

Confirmed PAYLOAD family capabilities

The Windows endpoint attack described in this report was implemented through malicious Group Policy Objects and did not involve a recovered ransomware executable, resident endpoint malware, confirmed file encryption or active malicious processes at the time of the forensic examination. However, PAYLOAD cryptomalware for Windows does exist, and other sources, including public analysis of its samples, reveal further malicious capabilities of this ransomware that could be used by security teams to enrich detection logic and security policies.

The behaviors documented in this section must therefore be interpreted as family-level capabilities identified through the public reverse engineering of PAYLOAD ransomware samples. They were not confirmed as having executed during the GPO-based incident unless corresponding evidence was identified in the host, memory, process, event-log, or hypervisor.

Windows Event Log clearing

Public reverse engineering of the PAYLOAD Windows variant reveals an optional event log clearing capability (T1685.005, formerly T1070.001). The ransomware dynamically resolves Windows Event Log APIs, enumerates available event log channels, and clears individual channels.

Implementation artifacts include:

  • Runtime loading of wevtapi.dll
  • EvtOpenChannelEnum
  • EvtNextChannelPath
  • EvtClearLog
  • Enumeration of Security, System, Application, and PowerShell logs, and operational channels
  • A command-line option controlling whether log clearing is performed

Clearing event logs reduces the availability of records related to process execution, authentication, PowerShell, service control, and system changes. However, it does not necessarily remove events that were already forwarded to a SIEM, Windows Event Collector, EDR backend, or protected log archive.

Forensic indicators
  • Windows Security Event ID 1102
  • Event logging shutdown or failure events
  • Sudden reductions in event record identifiers
  • Multiple event channels restarting from low record numbers
  • Gaps between endpoint and centrally forwarded telemetry
  • Execution of utilities or APIs associated with log management
  • Direct access to EVTX files (Windows Event Log files) under the Windows event log directory

We should note that these indicators can’t be interpreted on their own. For instance, Event ID 1102 should be correlated with a number of aggravating factors, such as:

  • Event ID 4688 or Sysmon Event ID 1 for process creation
  • Event ID 4624 for the associated administrative logon
  • EDR process trees
  • PowerShell operational logging
  • Windows Event Forwarding records
  • Privileged access management activity

At the same time, the absence of Event ID 1102 does not prove that log clearing did not occur. Direct deletion, truncation, service impairment, or an incomplete audit configuration may produce different evidence.

Security process and service termination

PAYLOAD analysis reveals that the Windows ransomware variant contains logic that targets security processes and services (T1685 and T1489). This capability is intended to stop security products, backup software, database services, and applications that may lock files targeted for encryption.
Process and service termination serves several objectives:

  1. Reduce endpoint detection and response visibility.
  2. Release file handles so data can be modified.
  3. Interrupt backup and recovery services.
  4. Prevent databases and enterprise applications from protecting active data.
  5. Reduce interference with encryption operations.
Forensic indicators
  • Security agent services changing from running to stopped
  • Event ID 7036 service state changes
  • Event ID 7040 service start type changes
  • Event ID 4688 or Sysmon Event ID 1 for service control utilities
  • Sysmon Event ID 5 for terminated processes
  • EDR health degradation affecting many endpoints
  • Repeated termination attempts against security or backup processes
  • Execution of dedicated process killing utilities

VSS deletion, backup and recovery suppression

Public PAYLOAD sample analysis reports the deletion of Windows Volume Shadow Copies before encryption (T1490). This behavior removes local restore points and reduces the victim’s ability to recover files without external backups.

Recovery inhibition is broader than VSS deletion and may include multiple other malicious techniques, including the following:

  • Deleting shadow copies, backup catalogs, and hypervisor snapshots
  • Disabling recovery services
  • Modifying boot recovery settings
  • Compromising backup management platforms
  • Deleting or encrypting backup repositories

In the PAYLOAD Windows sample that is proven to perform encryption, VSS deletion is confirmed to have taken place before encryption. A broader compromise of the backup platform was not established in the investigated incident.

Forensic indicators
  • Execution of shadow copy management utilities
  • Backup catalog deletion attempts
  • Recovery configuration changes
  • Backup service termination
  • Mass snapshot deletions
  • Backup administrator logons outside normal maintenance windows
  • Backup retention or immutability changes
  • Backup jobs failing immediately before disruptive activity

Ecosystem-relevant ransomware techniques

Above, we discussed the techniques specific to PAYLOAD ransomware. In this section, we’ll review other common ransomware techniques, such as BYOVD abuse and ESXi policy weakening, that remain relevant risks in the ransomware ecosystem. However, these techniques should not be attributed to this incident without supporting driver load, process, memory, ESXi, vCenter, or backup platform telemetry. We describe these techniques below as they may prove useful in other ransomware-related forensic investigations.

The examples used in this section are therefore ecosystem-relevant: they are commonly observed in ransomware operations but not conclusively attributed to the analyzed PAYLOAD samples.

ETW suppression and in-memory patching

Event Tracing for Windows (ETW) is a kernel-supported tracing architecture used by Windows components, diagnostic utilities, security products, and endpoint monitoring systems.

Although we didn’t encounter this technique in our case, some ransomware families can patch ETW-related functions inside the ransomware process (T1685, formerly T1562.001). The reported routine changes the memory protection of code pages, overwrites the beginning of selected ETW functions so they return without producing events, restores the original protection, and refreshes the instruction cache.

Reported target functions include EtwEventWrite, EtwEventWriteFull, EtwEventWriteTransfer, and EtwRegister.

This modification applies to the process-local mapping of ntdll.dll. It does not disable ETW globally across Windows, but it can reduce the telemetry generated by the modified process.

Forensic indicators
  • Writable or recently modified executable pages within ntdll.dll
  • Memory protection changes affecting ETW function addresses
  • In-memory code differing from the corresponding clean DLL on disk
  • EDR memory tampering alerts
  • Unexpected calls to memory protection APIs followed by telemetry silence
  • Process execution visible in network or filesystem telemetry but absent from expected ETW-derived sources
  • Inconsistent telemetry between EDR, Sysmon, Windows Event Logs, and network monitoring

It should be noted that telemetry gaps are not conclusive evidence of ETW patching. Other factors include agent upgrades, network outages, endpoint shutdowns, SIEM ingestion failures, collector backpressure, and filtering or licensing changes.

Memory acquisition is the strongest validation source when process-local ETW patching is suspected.

Vulnerable signed driver abuse, BYOVD

Bring Your Own Vulnerable Driver (BYOVD) involves introducing or abusing a legitimately signed but vulnerable kernel driver (T1068 and T1685). The attacker exploits the driver’s exposed functionality to gain kernel-level capabilities, modify protected memory, terminate security processes, remove security callbacks, or bypass operating system security controls.

BYOVD is highly relevant to contemporary ransomware operations. However, the reviewed public PAYLOAD analyses do not provide sufficient evidence to conclude that BYOVD is an intrinsic PAYLOAD capability.

It should therefore be presented as an ecosystem-relevant technique rather than a confirmed PAYLOAD feature.

Forensic indicators
  • Unexpected .sys files written to user-writable or temporary directories
  • New kernel driver services
  • Sysmon Event ID 6
  • Driver hashes matching Microsoft or community vulnerable driver blocklists
  • Invalid, revoked, expired, or unusual driver signatures
  • Driver load followed by EDR termination
  • New privileged processes immediately following driver loading
  • Code Integrity or Defender alerts
  • Service creation events referencing driver files

ESXi security policy weakening

Ransomware operators are increasingly targeting ESXi and vCenter because compromising the virtualization layer provides access to many business-critical virtual machines.

Public research typically describes operators performing the following activities (T1685, T1490 and T1489):

  • Enabling SSH on ESXi hosts
  • Changing root passwords
  • Disabling execInstalledOnly
  • Modifying lockdown mode exceptions
  • Stopping virtual machines
  • Deleting snapshots and backups
  • Changing host firewall policies
  • Copying custom ransomware binaries to hypervisors

On the target organization’s Linux servers we saw an ESXi PAYLOAD variant, which makes this behavior operationally relevant. Nevertheless, the reviewed evidence does not indicate that PAYLOAD operators used any of these policy-weakening actions in the investigated incident.

Forensic indicators
  • Unexpected ESXi SSH enablement
  • Changes to execInstalledOnly
  • Secure Boot enforcement changes
  • Lockdown mode configuration changes
  • Root password changes
  • New or unusual administrator accounts
  • Bulk VM shutdown activity
  • Bulk snapshot deletion
  • New binaries in datastore or temporary paths
  • vCenter tasks originating from unexpected accounts or systems
  • Missing or disabled remote syslog forwarding

Remediation

To contain the described threat and limit possible damage, several remediation steps should be taken. Below, we recommend a four-phase remediation approach for containing this threat and restoring the affected environment.

Phase 1 — domain controller actions (to be performed first)

When dealing with PAYLOAD GPO, the first priority of the remediation plan should be to remove the source GPOs. Until this is done, endpoint cleanup is ineffective because the next policy refresh re-infects cleaned machines.

The immediate domain controller actions to be taken are:

  1. Delete PAYLOAD GPO. Remove {C897F2C7-C2AC-4E6F-BF48-58036FF29E79} via GPMC.
  2. Delete or revert win Firewall Off GPO. Remove {22099AD2-E062-4F56-B574-5099BBA4E7A6}.
  3. Clean SYSVOL. Delete jpg and hello.txt from \\DC.THECOMPANY.local\sysvol\THECOMPANY.local\.
  4. Rotate credentials. Reset the compromised account; audit all privileged accounts and group memberships for unauthorized changes; rotate krbtgt twice if domain admin compromise is confirmed.
  5. Force refresh. Perform gpupdate /force across endpoints after deletion; re-enable local administrator and firewall via clean policy.

Phase 2 — Active Directory and GPO hardening

  • Adopt the AD tiered administration model and confine domain admins to Tier 0 with no interactive logon to workstations and member servers.
  • Separate GPO creation from GPO linking rights, and grant both only to a dedicated, audited administrator role.
  • Enable GPO change auditing (Event IDs 5136, 5137, 5141) and forward to a SIEM.
  • Monitor SYSVOL with file integrity tooling.

Phase 3 — credential and access hardening

  • Enforce phishing-resistant MFA on all VPN and remote access entry points.
  • Deploy Windows LAPS to generate unique, rotated local administrator passwords.
  • Enable Credential Guard to protect LSASS-resident secrets.
  • Adopt Privileged Access Workstations (PAW) for all administration.
  • Implement just-in-time elevation through Privileged Identity Management (PIM) for domain admin.

Phase 4 — detection and monitoring

  • SIEM rule: GPO creation or domain-root gPLink change by a non-standard account.
  • SIEM rule: file creation events under SYSVOL from non-replication sources.
  • Implement enhanced, centrally collected FortiGate SSL VPN logging (auth events, session detail, source IP geolocation, impossible travel check) and detailed perimeter monitoring.
  • Deploy a canary GPO whose application anywhere signals attacker GPO write access.

Conclusion

PAYLOAD demonstrates a maturing tactic of turning the victim’s own trusted infrastructure into a weapon. By weaponizing Group Policy, the actor achieved a domain-wide impact without a single malicious binary on any endpoint, evaded file- and process-based detection entirely, and caused organization-wide disruption within seconds of the first reboot.

The absence of encryption is the most strategically significant finding and is consistent with the 2026 trend toward encryptionless extortion. At Kaspersky GERT, we assess with moderate confidence that the missing encryption reflects one of two scenarios: (1) a deliberate decision to stay below the irreversible data destruction threshold while preserving the option of a follow-on encryption phase, or (2) an operation interrupted before full execution.

The absence of encrypted files must not be mistaken for the absence of a serious compromise — the most critical impact lies in the actor gaining domain admin-level control. This incident proves that a threat actor with domain admin access and a working knowledge of group policy internals can inflict domain-wide disruption equivalent to a ransomware attack without writing a single malicious file to any endpoint.

Detection strategies anchored solely in file- or process-based indicators are blind to this attack class. Effective controls include directory service change auditing, SYSVOL integrity monitoring, and privileged access governance, which allow for GPO protection.

Detection by Kaspersky solutions

Kaspersky security solutions effectively detect the described malicious activity at various stages of the attack. Possible detection scenarios are listed below.
To protect organizations that use our Kaspersky SIEM system, we have prepared a package of correlation rules designed to help detect this type of malicious activity. The rules are now available for customers to download from the SIEM repository; the package name is: [OOTB] Group policy hijacked: PAYLOAD ransomware – ENG.

The “Group policy hijacked: PAYLOAD ransomware” package contains rules that detect suspicious file creation or modification in the SYSVOL shared folder on a domain controller, as well as changes to critical attributes and settings of domain group policies. Some rules may require adjustment if they trigger in response to legitimate activity, such as synchronization between domain controllers or the configuration of a new group policy.

To ensure the detection rules function correctly, verify that events from Windows systems are being received in full, including events with the following identifiers: Sysmon: 11, Security — 4663, 5136, 4657.

We also recommend applying the following rules available in the repository to detect all attack stages.

  • Detection of Windows Event Log clearing to cover up traces of an attack: R050_03_Windows Event Log was cleared
  • Detection of suspicious access to the LSASS process, which may indicate attempts to dump credentials: R262_Suspicious access to the LSASS process
  • Detection of the Volume Shadow Copy service being started, which is used to create shadow copies before deleting them: R231_20_Running the Volume Shadow Copy service
  • Detection of shadow copy deletion: R321_Shadow copy deletion
  • Detection of Windows Defender disablement: R076_01_Windows Defender Antivirus was disabled
  • Detection of attempts to disable or modify the system firewall: R240_03_Disabling system firewall via the registry
  • Detection of a service installation from a non-system folder, which may indicate malware persistence techniques: R281_01_Installation of a service from a non-system folder

For the rules in this list to function correctly, it is necessary to configure Security event auditing for event IDs 4663, 5136, 4657, 7036, and 1102.

In addition to the SIEM system, when audit settings are configured correctly, the process of creating, modifying, and deleting GPOs generates a large number of characteristic artifacts on the domain controller, enabling Kaspersky Endpoint Detection and Response Expert to promptly alert the user to anomalies in the infrastructure.

The creation of a new GPO is covered by the gpo_creation rule, which triggers in response to the corresponding event in the infrastructure. Changes to existing policies are detected by the following rules:

GPO deletion is covered by the gpo_deletion rule.

In the next major version update of Kaspersky EDR Expert, a new event type, GPO, will be introduced, allowing users to track changes to Group Policy Objects.

For information security officers, GPO events will serve as an additional source of context when investigating activity in Active Directory and will help detect changes that could affect the configuration, access rights, and security of endpoints before a potentially malicious policy is deployed.

MITRE ATT&CK mapping

Tactic Technique Observed behavior
Initial Access T1078 — Valid Accounts Compromised domain credential used for VPN authentication
Initial Access T1133 — External Remote Services FortiGate SSL VPN used as entry point
Privilege Escalation T1078.002 — Domain Accounts Account held domain-level GPO create/link rights
Privilege Escalation/Defense Impairment T1484.001 — Group Policy Modification Malicious PAYLOAD GPO created and linked at domain root; re-applies on every refresh/reboot; uses trusted channel to evade EDR
Defense Impairment T1686 — Disable or Modify System Firewall win Firewall Off GPO disables Windows Firewall on all profiles
Impact T1491.001 — Internal Defacement Wallpaper and lock screen replaced with ransom image
Impact T1531 — Account Access Removal Local Administrator account disabled via GPO Security Settings
Collection T1005 — Data from Local System Data exfiltration was observed originating from the file servers
Command and Control T1071 — Application Layer Protocol No live C2 confirmed; delivery achieved entirely via GPO

Indicators of compromise

GPOs
PAYLOAD ransomware GPO: {C897F2C7-C2AC-4E6F-BF48-58036FF29E79}
win Firewall Off GPO: {22099AD2-E062-4F56-B574-5099BBA4E7A6}

File names and MD5 hashes
payload.jpg: Ransom wallpaper and lock screen image (SYSVOL)
hello.txt: Ransom note source (SYSVOL)
README-payload.txt: Ransom note dropped to desktops and drive roots
killer.exe (0108656A3E1ADE6CA4F21B084F5E1208): process killer tool
kill.exe (BEA5E267F24D7DA59F6821BFFDBFF293): process killer tool

IP addresses
37.19.210[.]12
146.70.117[.]239
149.102.229[.]154
104.164.55[.]46
104.28.162[.]228
104.28.163[.]162
64.190.76[.]14
192.42.116[.]50
192.42.116[.]12
192.42.116[.]56
192.42.116[.]97
192.42.116[.]52

Registry keys
HKLM\...\Policies\System\legalnoticecaption = Welcome to Payload!

SYSVOL path
\\DC.THECOMPANY.local\sysvol\THECOMPANY.local\payload.jpg

Event IDs
5137: GPO object creation on DC — review creator account
5136: GPO attribute modification — watch gPLink at domain root

  •  

Group Policy hijacked: PAYLOAD ransomware weaponizes Active Directory GPO

Executive summary

In April 2026, we at Kaspersky’s Global Emergency Response Team (GERT) responded to a security incident at a manufacturing organization in the Middle East. The threat actor obtained domain admin-equivalent control of the organization’s Active Directory environment and authored a malicious Group Policy Object (GPO) named PAYLOAD, linking it at the domain root. Through that single object, the actor delivered ransom notes, hijacked the desktop wallpaper and lock screen, enforced a logon banner, and disabled the local administrator account across every domain-joined Windows workstation — all without dropping a ransomware binary or encrypting any data. The only ransomware we found in this incident was PAYLOAD sample targeting ESXi on Linux servers. Besides that, data exfiltration was observed originating from the file servers and several additional systems, and was later published on the dark web.

This case is an example of two converging trends that define the 2026 ransomware landscape:

  1. Living-off-the-land abuse of trusted AD infrastructure. Group Policy is a signed, allowlisted, SYSTEM-privileged distribution channel that the majority of endpoint detection and response tools is designed not to inspect. By delivering impact through GPO rather than through malware, the actor sidestepped the entire file- and process-based detection stack.
  2. Encryptionless extortion. Industry telemetry shows extortion-only incidents grow significantly year-on-year. PAYLOAD fits this model; the leverage is operational disruption and the threat of escalation rather than cryptographic denial of data.

We confirmed that no files were encrypted on Windows machines, no malicious binaries were resident on disk, no endpoint persistence was established, and no malicious processes were running at the time of analysis. The entire attack lived inside Active Directory itself. The defensive implication is stark: an organization whose detection strategy depends on catching a ransomware executable would have seen nothing until the first endpoint rebooted and the ransom wallpaper appeared.

In this article, we will describe the GPO attack chain and provide operational advice on how to detect such threats, including detailed remediation recommendations.

Group Policy as an attack surface

Attacks through group policies are nothing new. They can inflict significant, domain-wide damage with multiple malicious capabilities. A Group Policy Object (GPO) is essentially a combination of a Group Policy Container (GPC) in Active Directory and a Group Policy Template (GPT) in SYSVOL. The Group Policy scope depends on whether the GPC is linked to the directory tree at the domain, site, or organization unit (OU) level. A link at the domain root means the policy applies to every computer and user object beneath it. Thus, a GPO compromised at the domain root can affect all in-scope domain users and computers, potentially granting an attacker complete control over the corporate network. What makes GPO abuse even more dangerous is that group policies are processed in a trusted, high-privilege environment, ensuring persistence because endpoint cleanup is not enough to remove them.

We have already discussed GPO architecture and ways it can be compromised in greater detail in an earlier blog post. Other public threat intelligence has also repeatedly documented this technique in ransomware operations. Microsoft observed Ryuk operators distributing ransomware through Group Policy, SYSVOL startup items, and PsExec. LockBit affiliates have been documented modifying SYSVOL Group Policy files, including ScheduledTasks.xml, to support ransomware execution and propagation. BlackCat/ALPHV operators have also abused GPOs to create scheduled tasks and deploy ransomware.

Another notable example of GPO abuse is PAYLOAD ransomware, which weaponizes GPO Preferences and policy settings for pure impact rather than as a launcher for an encryptor. Let’s take a closer look at this attack, which is detailed further below.

Attack timeline

During the April 2026 investigation, we managed to reconstruct the attack timeline as outlined below:

Date Event
11 April Initial access. Threat actor authenticates to the FortiGate SSL VPN using a valid but compromised domain credential.
13 April GPO authored. Malicious GPO, PAYLOAD ({C897F2C7-C2AC-4E6F-BF48-58036FF29E79}) created and linked at the domain root, configuring ransom notes, wallpaper, lock screen, logon banner, and administrator account disablement.
13 April SYSVOL staging. The payload.jpg and hello.txt files written to \\DC.THECOMPANY.local\sysvol\THECOMPANY.local\.
13 April Second GPO. GPO named win Firewall Off ({22099AD2-E062-4F56-B574-5099BBA4E7A6}) linked at the domain root, disabling Windows Firewall on all profiles.
13 April Dormancy. GPO cached on endpoints but computer configuration not yet applied — no endpoint had rebooted since the policy update.
13 April Data exfiltration. Data exfiltration was observed originating from the file servers and several additional systems.
14 April Detonation. Most of the endpoints begin rebooting; computer configuration policies apply. Ransom wallpaper, logon banner, and notes appear. Operational disruption begins.
15 April Response. Kaspersky GERT engaged. Forensic triage of affected workstations and the domain controller initiated.
16 April Assessment. GERT confirms no file encryption, no resident malware, no endpoint persistence.

Next, we will discuss each of these stages in more detail and share the findings from our incident response activities.

Incident overview

Initial access

The entry vector was a compromised valid account (MITRE ATT&CK T1078) used to authenticate through the organization’s FortiGate SSL VPN — an external remote service (T1133). Insufficient logging on the FortiGate appliance prevented us from reconstructing how the credential was originally compromised.

Three hypotheses were considered plausible in the context of the attack, in no particular order:

  • Password spraying or credential stuffing against the SSL VPN portal.
  • Phishing-led credential harvesting.
  • Purchase of pre-compromised credentials from an initial access broker (IAB).

Once on the internal network, the actor operated with the compromised security principal’s privileges. Because the account was able to create and link a GPO at the domain root, it held either domain admin privileges or a delegated equivalent (e.g., membership of Group Policy Creator Owners combined with link rights on the domain object).

FortiGate SSL VPN authentication logs and ESXi/virtualization privilege escalation logs were insufficient to reconstruct the lateral movement and privilege escalation chain between initial VPN access and the GPO write privilege level. The most common real-world routes to GPO control — DCSync, Kerberoasting of privileged service accounts, and Pass-the-Hash/Pass-the-Ticket — could not be confirmed or ruled out.

Execution

Rather than deploying an encryptor, the actor abused the victim’s Active Directory policy infrastructure, resulting in malicious GPOs being configured and linked at the domain root to deliver the observed impact across domain-joined systems. The two GPOs below constitute the entire offensive toolkit observed.

The PAYLOAD GPO

We performed a Resultant Set of Policy (RSOP) analysis, which helped us list all policy settings on the affected workstations. From these results, we reconstructed the following changes delivered by PAYLOAD:

GPO extension/CSE Setting/path Configured value/resulting action
Files (Group Policy Preference) Source SYSVOL\hello.txt → Desktop, C:\, D:\ Dropped as README-payload.txt (ReadOnly)
Registry (Computer) HKLM\SOFTWARE\Microsoft\Windows\CurrentVersion\Policies\System\legalnoticecaption Welcome to Payload!
Registry (Computer) HKLM\…\Policies\System\legalnoticetext (ransom demand text)
Personalization Policy Lock Screen Image \\DC.THECOMPANY.local\sysvol…\payload.jpg
Desktop Policy (User) Wallpaper path \\DC.THECOMPANY.local\sysvol…\payload.jpg
Security Settings (GptTmpl.inf) Accounts: Administrator account status Disabled

The PAYLOAD GPO enabled the following actions:

  1. Drop SYSVOL\hello.txt to the desktop and root directories C:\ and D:\ as a read-only README-payload.txt by tampering with the “Group Policy Files” client-side extension (CSE).
  2. Modify the HKLM\SOFTWARE\Microsoft\Windows\CurrentVersion\Policies\System\ registry key, changing the legalnoticecaption value to "Welcome to Payload!" and the legalnoticetext to the ransom note text through the “Group Policy Registry” CSE.
  3. Set payload.jpg located in the targeted domain controller’s SYSVOL as the lock screen image by altering the personalization policy, and as the wallpaper by altering the desktop policy at the user level.
  4. Revoke administrator rights for the administrator account (locking the account) by editing the Security Settings CSE in the GptTmpl.inf file.

Settings changed by PAYLOAD GPO

Settings changed by PAYLOAD GPO

This activity was enabled entirely through a legitimate group policy mechanism, meaning there is no malware code for security solutions to look for because the malicious logic is contained within the policy configuration.

The win Firewall Off GPO

A second domain-root-linked GPO, named “win Firewall Off”, disabled Windows Firewall across the domain, private and public profiles on all endpoints (T1562.004). Deployed independently of PAYLOAD, this object degraded host defenses and ensured the actor retained unimpeded network reach to endpoints for any follow-on activity.

Settings changed by win Firewall Off GPO

Settings changed by win Firewall Off GPO

The one-day delay detonation

The most forensically instructive detail is the one-day gap between GPO creation (13 April) and visible impact (14 April). Analysis of Master File Table (MFT) timestamps and the Group Policy History registry key confirmed the policy was written to SYSVOL and cached on endpoints on 13 April. However, computer configuration settings (wallpaper and lock screen machine policy, security settings, firewall disabling) only apply upon reboot or policy refresh — and no endpoint had rebooted in the interim. The attack therefore remained dormant in the GPO cache for one day before detonating en masse when machines were restarted in accordance with standard procedures.

We have to point out here that this delayed policy application is characteristic of GPO-based operations and has two potential consequences for defenders. Firstly, it may grant the actor a quiet window for exfiltration, persistence, or further staging between weaponization and impact. Secondly, it can be used to sever the temporal link between the cause (a GPO-creation event in the directory log) and the effect (mass user-visible disruption occurring at a later time), complicating timeline reconstruction unless directory service auditing is in place.

Forensic findings

Initial incident response engagement revealed a number of findings associated with the attack that we share below.

  1. No file encryption
    A full review of the MFT on affected workstations found no files bearing a .payload extension characteristic to PAYLOAD ransomware and no evidence of bulk renaming or encryption I/O patterns. The attackers’ objectives were operational disruption and extortion via visual impact and access denial.
  2. No endpoint persistence
    All standard persistence locations were clean:
    • Scheduled tasks — no malicious tasks
    • Run/RunOnce keys — clean
    • Startup folders (user and system) — clean
    • Services — no malicious service installed
    • WMI event subscriptions — none
    • Boot sector/MBR — unmodified

    The attack’s persistence mechanism is the GPO link itself on the domain controller, with no endpoint-resident component.

  3. No active malicious processes
    Live process and memory analysis revealed no injected threads, process hollowing or anomalous outbound connections.
  4. Registry timeline analysis
    Group Policy History, Shadow and State registry keys on the workstation recorded the application of PAYLOAD on 13 April:
    HKLM\…\Group Policy\History\{35378EAC-683F-11D2-A89A-00C04FBBCFA2}\1
    HKLM\…\Group Policy\Shadow\{827D319E-6EAC-11D2-A4EA-00C04F79F83A}\0
    HKLM\…\Group Policy\State\Machine\GPO-List\7
    HKCU\…\Group Policy\History\{7150F9BF-48AD-4da4-A49C-29EF4A8369BA}\1
    HKCU\…\Group Policy\State\S-1-5-21-…\Loopback-GPO-List\5
    The presence of the “Loopback-GPO-List” entry indicates the GPO was processed in loopback mode, ensuring the user configuration (wallpaper) applied regardless of which user logged on to the machine.
  5. SYSVOL artifacts
    Two files were staged on the domain controller’s SYSVOL share and served to endpoints through the Files Group Policy Preference CSE:
    • payload.jpg — the ransom image used for both wallpaper and lock screen.
    • hello.txt — the ransom note, distributed to desktops and drive roots as README-payload.txt.

Detection engineering

Because no malicious binary or process exists, the detection logic should focus on the directory service and SYSVOL indicators. Below are the highest-value telemetry sources for identifying the described malicious activity.

  • Directory service change auditing (DS Access)
    Enable Advanced Audit Policy → DS Access → Audit Directory Service Changes on all domain controllers and set up alerts for the following events:
    Event ID Meaning Hunt focus
    5137 A directory service object was created The account that created new groupPolicyContainer objects must be an authorized GPO administrator
    5136 A directory service object was modified Changes to gPLink on the domain root or sensitive organizational units; changes to gPCMachineExtensionNames/gPCUserExtensionNames/gPCFileSysPath/versionNumber for all GPOs
    5141 A directory service object was deleted GPO deletions (relevant for tamper detection and remediation assessment)

    A gPLink modification at the domain root by a non-standard account is one of the most telling indicators of this attack class.

  • SYSVOL file integrity monitoring
    Monitor \\DC.THECOMPANY.local\sysvol\THECOMPANY.local\Policies\ for unexpected files, particularly image files, text files, scripts, ScheduledTasks.xml, and modified registry.pol/GptTmpl.inf files that were created by sources other than legitimate replication.
  • Endpoint policy application telemetry
    On endpoints, GPO application is logged in the Group Policy Operational log (Microsoft-Windows-GroupPolicy/Operational) and reflected in the History and Shadow registry keys shown above. A sudden domain-wide change to the applied policy set is a strong post-detonation signal.
  • Missing 5136 events
    If the contents of a GPO’s SYSVOL change without a corresponding 5136 event, this can indicate direct SYSVOL/template editing (e.g., via open-source tools such as PowerView or SharpGPOAbuse) that bypasses the normal Group Policy Management Console (GPMC) modification path. While we recommend treating the absence of expected audit events as suspicious, it should be noted that this can be caused by misconfigured auditing.

Anti-forensics and recovery-inhibition capabilities

Confirmed PAYLOAD family capabilities

The Windows endpoint attack described in this report was implemented through malicious Group Policy Objects and did not involve a recovered ransomware executable, resident endpoint malware, confirmed file encryption or active malicious processes at the time of the forensic examination. However, PAYLOAD cryptomalware for Windows does exist, and other sources, including public analysis of its samples, reveal further malicious capabilities of this ransomware that could be used by security teams to enrich detection logic and security policies.

The behaviors documented in this section must therefore be interpreted as family-level capabilities identified through the public reverse engineering of PAYLOAD ransomware samples. They were not confirmed as having executed during the GPO-based incident unless corresponding evidence was identified in the host, memory, process, event-log, or hypervisor.

Windows Event Log clearing

Public reverse engineering of the PAYLOAD Windows variant reveals an optional event log clearing capability (T1685.005, formerly T1070.001). The ransomware dynamically resolves Windows Event Log APIs, enumerates available event log channels, and clears individual channels.

Implementation artifacts include:

  • Runtime loading of wevtapi.dll
  • EvtOpenChannelEnum
  • EvtNextChannelPath
  • EvtClearLog
  • Enumeration of Security, System, Application, and PowerShell logs, and operational channels
  • A command-line option controlling whether log clearing is performed

Clearing event logs reduces the availability of records related to process execution, authentication, PowerShell, service control, and system changes. However, it does not necessarily remove events that were already forwarded to a SIEM, Windows Event Collector, EDR backend, or protected log archive.

Forensic indicators
  • Windows Security Event ID 1102
  • Event logging shutdown or failure events
  • Sudden reductions in event record identifiers
  • Multiple event channels restarting from low record numbers
  • Gaps between endpoint and centrally forwarded telemetry
  • Execution of utilities or APIs associated with log management
  • Direct access to EVTX files (Windows Event Log files) under the Windows event log directory

We should note that these indicators can’t be interpreted on their own. For instance, Event ID 1102 should be correlated with a number of aggravating factors, such as:

  • Event ID 4688 or Sysmon Event ID 1 for process creation
  • Event ID 4624 for the associated administrative logon
  • EDR process trees
  • PowerShell operational logging
  • Windows Event Forwarding records
  • Privileged access management activity

At the same time, the absence of Event ID 1102 does not prove that log clearing did not occur. Direct deletion, truncation, service impairment, or an incomplete audit configuration may produce different evidence.

Security process and service termination

PAYLOAD analysis reveals that the Windows ransomware variant contains logic that targets security processes and services (T1685 and T1489). This capability is intended to stop security products, backup software, database services, and applications that may lock files targeted for encryption.
Process and service termination serves several objectives:

  1. Reduce endpoint detection and response visibility.
  2. Release file handles so data can be modified.
  3. Interrupt backup and recovery services.
  4. Prevent databases and enterprise applications from protecting active data.
  5. Reduce interference with encryption operations.
Forensic indicators
  • Security agent services changing from running to stopped
  • Event ID 7036 service state changes
  • Event ID 7040 service start type changes
  • Event ID 4688 or Sysmon Event ID 1 for service control utilities
  • Sysmon Event ID 5 for terminated processes
  • EDR health degradation affecting many endpoints
  • Repeated termination attempts against security or backup processes
  • Execution of dedicated process killing utilities

VSS deletion, backup and recovery suppression

Public PAYLOAD sample analysis reports the deletion of Windows Volume Shadow Copies before encryption (T1490). This behavior removes local restore points and reduces the victim’s ability to recover files without external backups.

Recovery inhibition is broader than VSS deletion and may include multiple other malicious techniques, including the following:

  • Deleting shadow copies, backup catalogs, and hypervisor snapshots
  • Disabling recovery services
  • Modifying boot recovery settings
  • Compromising backup management platforms
  • Deleting or encrypting backup repositories

In the PAYLOAD Windows sample that is proven to perform encryption, VSS deletion is confirmed to have taken place before encryption. A broader compromise of the backup platform was not established in the investigated incident.

Forensic indicators
  • Execution of shadow copy management utilities
  • Backup catalog deletion attempts
  • Recovery configuration changes
  • Backup service termination
  • Mass snapshot deletions
  • Backup administrator logons outside normal maintenance windows
  • Backup retention or immutability changes
  • Backup jobs failing immediately before disruptive activity

Ecosystem-relevant ransomware techniques

Above, we discussed the techniques specific to PAYLOAD ransomware. In this section, we’ll review other common ransomware techniques, such as BYOVD abuse and ESXi policy weakening, that remain relevant risks in the ransomware ecosystem. However, these techniques should not be attributed to this incident without supporting driver load, process, memory, ESXi, vCenter, or backup platform telemetry. We describe these techniques below as they may prove useful in other ransomware-related forensic investigations.

The examples used in this section are therefore ecosystem-relevant: they are commonly observed in ransomware operations but not conclusively attributed to the analyzed PAYLOAD samples.

ETW suppression and in-memory patching

Event Tracing for Windows (ETW) is a kernel-supported tracing architecture used by Windows components, diagnostic utilities, security products, and endpoint monitoring systems.

Although we didn’t encounter this technique in our case, some ransomware families can patch ETW-related functions inside the ransomware process (T1685, formerly T1562.001). The reported routine changes the memory protection of code pages, overwrites the beginning of selected ETW functions so they return without producing events, restores the original protection, and refreshes the instruction cache.

Reported target functions include EtwEventWrite, EtwEventWriteFull, EtwEventWriteTransfer, and EtwRegister.

This modification applies to the process-local mapping of ntdll.dll. It does not disable ETW globally across Windows, but it can reduce the telemetry generated by the modified process.

Forensic indicators
  • Writable or recently modified executable pages within ntdll.dll
  • Memory protection changes affecting ETW function addresses
  • In-memory code differing from the corresponding clean DLL on disk
  • EDR memory tampering alerts
  • Unexpected calls to memory protection APIs followed by telemetry silence
  • Process execution visible in network or filesystem telemetry but absent from expected ETW-derived sources
  • Inconsistent telemetry between EDR, Sysmon, Windows Event Logs, and network monitoring

It should be noted that telemetry gaps are not conclusive evidence of ETW patching. Other factors include agent upgrades, network outages, endpoint shutdowns, SIEM ingestion failures, collector backpressure, and filtering or licensing changes.

Memory acquisition is the strongest validation source when process-local ETW patching is suspected.

Vulnerable signed driver abuse, BYOVD

Bring Your Own Vulnerable Driver (BYOVD) involves introducing or abusing a legitimately signed but vulnerable kernel driver (T1068 and T1685). The attacker exploits the driver’s exposed functionality to gain kernel-level capabilities, modify protected memory, terminate security processes, remove security callbacks, or bypass operating system security controls.

BYOVD is highly relevant to contemporary ransomware operations. However, the reviewed public PAYLOAD analyses do not provide sufficient evidence to conclude that BYOVD is an intrinsic PAYLOAD capability.

It should therefore be presented as an ecosystem-relevant technique rather than a confirmed PAYLOAD feature.

Forensic indicators
  • Unexpected .sys files written to user-writable or temporary directories
  • New kernel driver services
  • Sysmon Event ID 6
  • Driver hashes matching Microsoft or community vulnerable driver blocklists
  • Invalid, revoked, expired, or unusual driver signatures
  • Driver load followed by EDR termination
  • New privileged processes immediately following driver loading
  • Code Integrity or Defender alerts
  • Service creation events referencing driver files

ESXi security policy weakening

Ransomware operators are increasingly targeting ESXi and vCenter because compromising the virtualization layer provides access to many business-critical virtual machines.

Public research typically describes operators performing the following activities (T1685, T1490 and T1489):

  • Enabling SSH on ESXi hosts
  • Changing root passwords
  • Disabling execInstalledOnly
  • Modifying lockdown mode exceptions
  • Stopping virtual machines
  • Deleting snapshots and backups
  • Changing host firewall policies
  • Copying custom ransomware binaries to hypervisors

On the target organization’s Linux servers we saw an ESXi PAYLOAD variant, which makes this behavior operationally relevant. Nevertheless, the reviewed evidence does not indicate that PAYLOAD operators used any of these policy-weakening actions in the investigated incident.

Forensic indicators
  • Unexpected ESXi SSH enablement
  • Changes to execInstalledOnly
  • Secure Boot enforcement changes
  • Lockdown mode configuration changes
  • Root password changes
  • New or unusual administrator accounts
  • Bulk VM shutdown activity
  • Bulk snapshot deletion
  • New binaries in datastore or temporary paths
  • vCenter tasks originating from unexpected accounts or systems
  • Missing or disabled remote syslog forwarding

Remediation

To contain the described threat and limit possible damage, several remediation steps should be taken. Below, we recommend a four-phase remediation approach for containing this threat and restoring the affected environment.

Phase 1 — domain controller actions (to be performed first)

When dealing with PAYLOAD GPO, the first priority of the remediation plan should be to remove the source GPOs. Until this is done, endpoint cleanup is ineffective because the next policy refresh re-infects cleaned machines.

The immediate domain controller actions to be taken are:

  1. Delete PAYLOAD GPO. Remove {C897F2C7-C2AC-4E6F-BF48-58036FF29E79} via GPMC.
  2. Delete or revert win Firewall Off GPO. Remove {22099AD2-E062-4F56-B574-5099BBA4E7A6}.
  3. Clean SYSVOL. Delete jpg and hello.txt from \\DC.THECOMPANY.local\sysvol\THECOMPANY.local\.
  4. Rotate credentials. Reset the compromised account; audit all privileged accounts and group memberships for unauthorized changes; rotate krbtgt twice if domain admin compromise is confirmed.
  5. Force refresh. Perform gpupdate /force across endpoints after deletion; re-enable local administrator and firewall via clean policy.

Phase 2 — Active Directory and GPO hardening

  • Adopt the AD tiered administration model and confine domain admins to Tier 0 with no interactive logon to workstations and member servers.
  • Separate GPO creation from GPO linking rights, and grant both only to a dedicated, audited administrator role.
  • Enable GPO change auditing (Event IDs 5136, 5137, 5141) and forward to a SIEM.
  • Monitor SYSVOL with file integrity tooling.

Phase 3 — credential and access hardening

  • Enforce phishing-resistant MFA on all VPN and remote access entry points.
  • Deploy Windows LAPS to generate unique, rotated local administrator passwords.
  • Enable Credential Guard to protect LSASS-resident secrets.
  • Adopt Privileged Access Workstations (PAW) for all administration.
  • Implement just-in-time elevation through Privileged Identity Management (PIM) for domain admin.

Phase 4 — detection and monitoring

  • SIEM rule: GPO creation or domain-root gPLink change by a non-standard account.
  • SIEM rule: file creation events under SYSVOL from non-replication sources.
  • Implement enhanced, centrally collected FortiGate SSL VPN logging (auth events, session detail, source IP geolocation, impossible travel check) and detailed perimeter monitoring.
  • Deploy a canary GPO whose application anywhere signals attacker GPO write access.

Conclusion

PAYLOAD demonstrates a maturing tactic of turning the victim’s own trusted infrastructure into a weapon. By weaponizing Group Policy, the actor achieved a domain-wide impact without a single malicious binary on any endpoint, evaded file- and process-based detection entirely, and caused organization-wide disruption within seconds of the first reboot.

The absence of encryption is the most strategically significant finding and is consistent with the 2026 trend toward encryptionless extortion. At Kaspersky GERT, we assess with moderate confidence that the missing encryption reflects one of two scenarios: (1) a deliberate decision to stay below the irreversible data destruction threshold while preserving the option of a follow-on encryption phase, or (2) an operation interrupted before full execution.

The absence of encrypted files must not be mistaken for the absence of a serious compromise — the most critical impact lies in the actor gaining domain admin-level control. This incident proves that a threat actor with domain admin access and a working knowledge of group policy internals can inflict domain-wide disruption equivalent to a ransomware attack without writing a single malicious file to any endpoint.

Detection strategies anchored solely in file- or process-based indicators are blind to this attack class. Effective controls include directory service change auditing, SYSVOL integrity monitoring, and privileged access governance, which allow for GPO protection.

Detection by Kaspersky solutions

Kaspersky security solutions effectively detect the described malicious activity at various stages of the attack. Possible detection scenarios are listed below.
To protect organizations that use our Kaspersky SIEM system, we have prepared a package of correlation rules designed to help detect this type of malicious activity. The rules are now available for customers to download from the SIEM repository; the package name is: [OOTB] Group policy hijacked: PAYLOAD ransomware – ENG.

The “Group policy hijacked: PAYLOAD ransomware” package contains rules that detect suspicious file creation or modification in the SYSVOL shared folder on a domain controller, as well as changes to critical attributes and settings of domain group policies. Some rules may require adjustment if they trigger in response to legitimate activity, such as synchronization between domain controllers or the configuration of a new group policy.

To ensure the detection rules function correctly, verify that events from Windows systems are being received in full, including events with the following identifiers: Sysmon: 11, Security — 4663, 5136, 4657.

We also recommend applying the following rules available in the repository to detect all attack stages.

  • Detection of Windows Event Log clearing to cover up traces of an attack: R050_03_Windows Event Log was cleared
  • Detection of suspicious access to the LSASS process, which may indicate attempts to dump credentials: R262_Suspicious access to the LSASS process
  • Detection of the Volume Shadow Copy service being started, which is used to create shadow copies before deleting them: R231_20_Running the Volume Shadow Copy service
  • Detection of shadow copy deletion: R321_Shadow copy deletion
  • Detection of Windows Defender disablement: R076_01_Windows Defender Antivirus was disabled
  • Detection of attempts to disable or modify the system firewall: R240_03_Disabling system firewall via the registry
  • Detection of a service installation from a non-system folder, which may indicate malware persistence techniques: R281_01_Installation of a service from a non-system folder

For the rules in this list to function correctly, it is necessary to configure Security event auditing for event IDs 4663, 5136, 4657, 7036, and 1102.

In addition to the SIEM system, when audit settings are configured correctly, the process of creating, modifying, and deleting GPOs generates a large number of characteristic artifacts on the domain controller, enabling Kaspersky Endpoint Detection and Response Expert to promptly alert the user to anomalies in the infrastructure.

The creation of a new GPO is covered by the gpo_creation rule, which triggers in response to the corresponding event in the infrastructure. Changes to existing policies are detected by the following rules:

GPO deletion is covered by the gpo_deletion rule.

In the next major version update of Kaspersky EDR Expert, a new event type, GPO, will be introduced, allowing users to track changes to Group Policy Objects.

For information security officers, GPO events will serve as an additional source of context when investigating activity in Active Directory and will help detect changes that could affect the configuration, access rights, and security of endpoints before a potentially malicious policy is deployed.

MITRE ATT&CK mapping

Tactic Technique Observed behavior
Initial Access T1078 — Valid Accounts Compromised domain credential used for VPN authentication
Initial Access T1133 — External Remote Services FortiGate SSL VPN used as entry point
Privilege Escalation T1078.002 — Domain Accounts Account held domain-level GPO create/link rights
Privilege Escalation/Defense Impairment T1484.001 — Group Policy Modification Malicious PAYLOAD GPO created and linked at domain root; re-applies on every refresh/reboot; uses trusted channel to evade EDR
Defense Impairment T1686 — Disable or Modify System Firewall win Firewall Off GPO disables Windows Firewall on all profiles
Impact T1491.001 — Internal Defacement Wallpaper and lock screen replaced with ransom image
Impact T1531 — Account Access Removal Local Administrator account disabled via GPO Security Settings
Collection T1005 — Data from Local System Data exfiltration was observed originating from the file servers
Command and Control T1071 — Application Layer Protocol No live C2 confirmed; delivery achieved entirely via GPO

Indicators of compromise

GPOs
PAYLOAD ransomware GPO: {C897F2C7-C2AC-4E6F-BF48-58036FF29E79}
win Firewall Off GPO: {22099AD2-E062-4F56-B574-5099BBA4E7A6}

File names and MD5 hashes
payload.jpg: Ransom wallpaper and lock screen image (SYSVOL)
hello.txt: Ransom note source (SYSVOL)
README-payload.txt: Ransom note dropped to desktops and drive roots
killer.exe (0108656A3E1ADE6CA4F21B084F5E1208): process killer tool
kill.exe (BEA5E267F24D7DA59F6821BFFDBFF293): process killer tool

IP addresses
37.19.210[.]12
146.70.117[.]239
149.102.229[.]154
104.164.55[.]46
104.28.162[.]228
104.28.163[.]162
64.190.76[.]14
192.42.116[.]50
192.42.116[.]12
192.42.116[.]56
192.42.116[.]97
192.42.116[.]52

Registry keys
HKLM\...\Policies\System\legalnoticecaption = Welcome to Payload!

SYSVOL path
\\DC.THECOMPANY.local\sysvol\THECOMPANY.local\payload.jpg

Event IDs
5137: GPO object creation on DC — review creator account
5136: GPO attribute modification — watch gPLink at domain root

  •  

Incident response guide for AWS CloudTrail investigations – Part 2

In Part 1 of this guide, we examined two common incident scenarios: cross-account Amazon Simple Storage Service (Amazon S3) data deletion with ransomware implications, and cryptocurrency mining deployed through AWS CloudFormation using exposed AWS Management Console credentials. We also introduced key incident response terminology and investigative frameworks for analyzing AWS CloudTrail events.

In this second part, we explore a more complex, multi-stage attack: how a web application vulnerability can cascade into credential harvesting and unauthorized access to Amazon Bedrock services across multiple AWS Regions. We also cover additional investigation techniques and hardening steps to strengthen your security posture.

Scenario 3: SSRF to IMDSv1 credential harvesting with multi-Region Amazon Bedrock service misuse

This scenario examines how a web application vulnerability can cascade into a multi-Region event targeting Amazon Bedrock services. The investigation demonstrates how threat actors chain together multiple techniques, using Amazon Elastic Compute Cloud (Amazon EC2) Instance Metadata Service version 1 (IMDSv1) through server-side request forgery (SSRF) and cross-Region pivoting to access Amazon Bedrock.

Your security team receives multiple alerts: failed AWS Identity and Access Management (IAM) operations in the us-east-1 Region, successful console sign-ins without multi-factor authentication (MFA), and unusual Amazon Bedrock API calls from us-east-2. Initially, these might seem like unrelated events across different services and Regions. However, as our Security Incident Response Team (SIRT) discovered, they represent a carefully orchestrated event chain that began with a web application vulnerability and culminated in unauthorized access to your organization’s AI infrastructure.

Architecture and progression

The architecture in figure 1 maps a multi-stage attack that exploits the trust relationship between Amazon Elastic Compute Cloud (Amazon EC2) instances and AWS services. A threat actor identified a server-side request forgery (SSRF) vulnerability in a web application running on an EC2 instance that had an attached webdev IAM role. Rather than attempting to escalate privileges directly, the threat actor used this foothold to reach the Instance Metadata Service version 1 (IMDSv1) endpoint and retrieve the temporary credentials issued to the webdev role. Because IMDSv1 returns credentials in response to a basic request with no session token, an SSRF flaw is enough to harvest them, which is why these credentials became the pivot point for everything that followed. The attack unfolded in five stages. Each stage is numbered in figure 1 so you can follow the progression from the initial web request through to the cross-Region Amazon Bedrock activity:

  1. Initial access: The threat actor exploited the SSRF vulnerability in the web application to make server-side requests on the instance’s behalf.
  2. Credential harvesting: Those requests reached the IMDSv1 endpoint and returned the temporary credentials for the webdev role.
  3. Permission testing: Using the harvested credentials, the threat actor attempted IAM operations to probe the boundaries of what the role could do.
  4. Service pivoting: When IAM actions were denied, the threat actor shifted focus to Amazon Bedrock, a service the role could reach.
  5. Region hopping: The threat actor moved operations from us-east-1 to us-east-2, likely to evade Region-specific monitoring and access controls.
Figure 1: Scenario 3 architecture

Figure 1: Scenario 3 architecture

CloudTrail evidence and structured extractions

In this section, we walk through the CloudTrail evidence that documents the attack from start to finish. Each of the four events that follow maps to one or more stages in the progression described previously, and together they trace how the threat actor moved from harvested credentials to active misuse of Amazon Bedrock. For each event, we present the relevant portion of the CloudTrail log record, highlight the fields that matter most for the investigation, and include a forensic legend that explains what each highlighted field reveals.

We cover the following events:

  1. Permission boundary testing (15:53:49 UTC): A failed CreateUser call in us-east-1 that reveals the compromised role and the IMDSv1 credential source.
  2. Console access establishment (15:59:29 UTC): A successful console sign-in without MFA, showing the pivot from programmatic to interactive access.
  3. Bedrock service reconnaissance (17:20:00 UTC): A ListFoundationModels call in us-east-2 that marks the Region hop and the shift to AI services.
  4. Active model exploitation (17:25:48 UTC): A Converse call that invokes the Amazon Nova Pro model, confirming unauthorized usage.

As you read each event, focus on how the fields connect one stage to the next. The same webdev role, the same source IP address, and the recurring ec2RoleDelivery value are the threads that tie these otherwise separate events into a single attack chain.

Event 1: Permission boundary testing (15:53:49 UTC): The first suspicious activity appeared as a failed CreateUser API call in us-east-1. The CloudTrail log records an AssumedRole session attempting to create an IAM user named adm1n but receiving an AccessDenied error. The webdev role is visible in the userIdentity field, readOnly is false (indicating a write operation attempt), and the user-agent shows AWS Command Line Interface (AWS CLI) on Windows, suggesting programmatic access from the harvested credentials.

{
  "eventVersion": "1.11",
  "userIdentity": {
    "type": "AssumedRole",
    "principalId": "AROAFINDANEXAMPLE:i-0123456789abcdef0",
    "arn": "arn:aws:sts::XXXXXXXXXXXX:assumed-role/webdev/i-0123456789abcdef0",
    "sessionContext": {
      "sessionIssuer": { "type": "Role", "userName": "webdev" },  ◄── ❶ Compromised EC2 role
                                                     ‾‾‾‾‾‾‾‾
      "attributes": { "mfaAuthenticated": "false" }
    },
    "ec2RoleDelivery": "1.0"  ◄── ❷ IMDSv1 confirmed (SSRF exploitation path)
                       ‾‾‾‾‾
  },
  "eventTime": "2025-09-22T15:53:49Z",
  "eventSource": "iam.amazonaws.com",
  "readOnly": false,
  "eventName": "CreateUser",  ◄── ❸ Intent: establish persistent backdoor
               ‾‾‾‾‾‾‾‾‾‾‾‾
  "userAgent": "aws-cli/2.17.48 ua/2.0 os/windows#10 ...",
  "errorCode": "AccessDenied",  ◄── ❺ Hard policy stop (least-privilege held)
               ‾‾‾‾‾‾‾‾‾‾‾‾‾‾
  "errorMessage": "User: arn:aws:sts::XXXXXXXXXXXX:assumed-role/webdev/...
    is not authorized to perform: iam:CreateUser
    on resource: arn:aws:iam::XXXXXXXXXXXX:user/adm1n..."  ◄── ❹ Lookalike name (1 not i)
                                                ‾‾‾‾‾
}

───────────────────────────────────────────────────────────────────
  FORENSIC LEGEND
───────────────────────────────────────────────────────────────────
  ❶ userName: "webdev"         → Confirms the compromised EC2 role context
  ❷ ec2RoleDelivery: "1.0"    → Credentials obtained via IMDSv1 (SSRF vector)
  ❸ eventName: "CreateUser"   → Attacker attempting IAM persistence
  ❹ target user: "adm1n"      → Typosquatting admin (number 1 instead of letter i)
  ❺ errorCode: "AccessDenied" → Attacker probing permission boundaries; blocked
───────────────────────────────────────────────────────────────────

Event 2: Console access establishment (15:59:29 UTC): Six minutes later, the threat actor successfully signed in to the AWS Management Console using the same credentials. The ConsoleLogin event records that MFA wasn’t used (MFAUsed: No), and the source IP (75.3.231.105) provides attribution data. The user agent indicates Chrome browser on Windows 10.

{
  "eventVersion": "1.11",
  "userIdentity": {
    "type": "AssumedRole",
    "principalId": "AROAFINDANEXAMPLE:i-0123456789abcdef0",
    "arn": "arn:aws:sts::XXXXXXXXXXXX:assumed-role/webdev/i-0123456789abcdef0",
    "sessionContext": { "attributes": { "mfaAuthenticated": "false" } }
  },
  "eventTime": "2025-09-22T15:59:29Z",
  "eventSource": "signin.amazonaws.com",
  "userAgent": "Mozilla/5.0 (Windows NT 10.0; Win64; x64) AppleWebKit/537.36 	 (KHTML, like Gecko) Chrome/140.0.0.0 Safari/537.36 Edg/140.0.0.0",

  "eventName": "ConsoleLogin",  ◄── ❶ Pivoted to interactive console access
               ‾‾‾‾‾‾‾‾‾‾‾‾‾‾
  "awsRegion": "us-east-1",
  "sourceIPAddress": "75.3.231.105",
  "responseElements": { "ConsoleLogin": "Success" },◄── ❷ Hijacked login succeeded
                                        ‾‾‾‾‾‾‾‾‾
  "additionalEventData": { "MobileVersion": "No", "MFAUsed": "No" },◄── ❸ No MFA challenge
                                                             ‾‾‾‾
  "eventType": "AwsConsoleSignIn"  ◄── ❹ Console sign-in (not API call)
               ‾‾‾‾‾‾‾‾‾‾‾‾‾‾‾‾‾
}
───────────────────────────────────────────────────────────────────
FORENSIC LEGEND
───────────────────────────────────────────────────────────────────
❶ eventName: "ConsoleLogin"→ Attacker pivoted from programmatic to visual console access
❷ ConsoleLogin: "Success"→ Hijacked login successfully authenticated
❸ MFAUsed: "No" → Critical gap: no MFA enforced, enabling the pivot
❹ eventType: "AwsConsoleSignIn"   → Distinguishes this from basic API calls
───────────────────────────────────────────────────────────────────

Event 3: Amazon Bedrock service reconnaissance (17:20:00 UTC): Nearly two hours later, the threat actor pivoted to Amazon Bedrock, making a ListFoundationModels API call in us-east-2. This event exhibits several patterns: a Region change from us-east-1 to us-east-2 (potential defense evasion), a shift from IAM to AI services, readOnly: true (reconnaissance rather than modification), and sessionCredentialFromConsole: “true”, which ties the call to the console session established in Event 2 rather than a fresh IMDSv1 credential retrieval.

 {
  "eventVersion": "1.11",
  "userIdentity": {
    "type": "AssumedRole",
    "arn": "arn:aws:sts::XXXXXXXXXXXX:assumed-role/webdev/i-0123456789abcdef0"
  },
  "eventTime": "2025-09-22T17:20:00Z",
  "eventSource": "bedrock.amazonaws.com",  ◄── ❶ Pivoted to cloud AI services
               ‾‾‾‾‾‾‾‾‾‾‾‾‾‾‾‾‾‾‾‾‾‾‾‾
  "eventName": "ListFoundationModels",  ◄── ❷ AI model reconnaissance
               ‾‾‾‾‾‾‾‾‾‾‾‾‾‾‾‾‾‾‾‾‾‾
  "awsRegion": "us-east-2",  ◄── ❸ Region hop (evasion technique)
               ‾‾‾‾‾‾‾‾‾‾‾
  "sourceIPAddress": "75.3.231.105",
  "readOnly": true,
  "tlsDetails": {
    "clientProvidedHostHeader": "bedrock.us-east-2.amazonaws.com"  ◄── ❹ Intentional alternate region targeting
                               ‾‾‾‾‾‾‾‾‾‾‾‾‾‾‾‾‾‾‾‾‾‾‾‾‾‾‾‾‾‾‾‾‾
  },
  "sessionCredentialFromConsole": "true"
}

───────────────────────────────────────────────────────────────────
  FORENSIC LEGEND
───────────────────────────────────────────────────────────────────
❶ eventSource: "bedrock.amazonaws.com"→ Attacker pivoted from IAM to managed AI services
❷ eventName: "ListFoundationModels"→ Reconnaissance: enumerating available AI models
❸ awsRegion: "us-east-2"→ Region hop from us-east-1 (defense evasion)
❹ clientProvidedHostHeader: "bedrock.us-east-2..."  → Confirms intentional targeting of alternate region endpoint
───────────────────────────────────────────────────────────────────

Event 4: Active model exploitation (17:25:48 UTC): Five minutes after the reconnaissance call, the threat actor moved from enumeration to active exploitation, invoking the Amazon Nova Pro model through the Converse API in us-east-2. The additionalEventData field quantifies the unauthorized usage at 944 input tokens and 126 output tokens, confirming that the threat actor successfully prompted the model and received a response.

 {
  "eventVersion": "1.11",
  "userIdentity": {
    "type": "AssumedRole",
    "arn": "arn:aws:sts::XXXXXXXXXXXX:assumed-role/webdev/i-0123456789abcdef0"
  },
  "eventTime": "2025-09-22T17:25:48Z",
  "eventSource": "bedrock.amazonaws.com",
  "eventName": "Converse",  ◄── ❶ Active model invocation (recon → exploitation)
               ‾‾‾‾‾‾‾‾‾‾
  "awsRegion": "us-east-2",
  "requestParameters": {
    "modelId": "amazon.nova-pro-v1:0",  ◄── ❷ Specific model being misused
               ‾‾‾‾‾‾‾‾‾‾‾‾‾‾‾‾‾‾‾‾‾‾
    "inferenceConfig": { "maxTokens": 1024 }
  },
  "responseElements": null,
  "additionalEventData": { "inputTokens": 944, "outputTokens": 126 }  ◄── ❸ Unauthorized usage quantified
                           ‾‾‾‾‾‾‾‾‾‾‾‾‾‾‾‾‾‾‾‾‾‾‾‾‾‾‾‾‾‾‾‾‾‾‾‾‾‾
}

───────────────────────────────────────────────────────────────────
  FORENSIC LEGEND
───────────────────────────────────────────────────────────────────
❶ eventName: "Converse"                → Attacker transitioned from reconnaissance to active exploitation
❷ modelId: "amazon.nova-pro-v1:0"      → Identifies the specific foundation model being misused
❸ inputTokens: 944, outputTokens: 126  → Quantifies unauthorized usage (financial cost + data exfiltration exposure)
───────────────────────────────────────────────────────────────────

Notable event fields to track

As you review the event logs, a handful of fields do most of the investigative work in this scenario. Understanding what each one reveals, and why it matters, is what turns a collection of individual log records into a coherent attack narrative.

The userIdentity field is the starting point for attribution. In this scenario it carries the EC2 instance ID as the session name, which is what let us trace the harvested credentials back to a specific compromised instance rather than a human user. Whenever you see an assumed-role session, this field answers the first question of any investigation: whose credentials are these, and where did they come from?

The readOnly field reveals the intent behind an action. A value of true marks reconnaissance, such as the ListFoundationModels call the threat actor used to enumerate available models, while false marks an attempt to change or use something, such as the CreateUser call or the Converse invocation. Sorting events by this field quickly separates the threat actor’s information gathering from the actions that caused actual impact.

The awsRegion field is easy to overlook, but in this scenario it exposed the threat actor’s evasion strategy. The shift from us-east-1 to us-east-2 wasn’t incidental; threat actors move between Regions because monitoring, alerting, and access controls are often configured inconsistently across them. Watching this field helps you spot activity that has deliberately moved away from where your detection is strongest.

Finally, the userIdentity.invokedBy field identifies when an AWS service, rather than a user or a set of harvested credentials, made the request on your behalf. CloudTrail populates it only when the caller is an AWS service, such as through a service-linked role, a service role, or a forward access session. It doesn’t appear in the events for this scenario because the threat actor called Amazon Bedrock directly with the harvested webdev credentials. That absence is itself informative: it confirms the requests came from a principal acting on its own rather than from a legitimate service-driven workflow. As agent-based and service-integrated Amazon Bedrock workloads become more common, checking this field separates expected service activity from credentials driven directly by a threat actor.

Investigation priorities

With the full attack chain mapped, from SSRF through credential harvesting to Amazon Bedrock service misuse, the investigation turned to a harder question: what did each stage actually cost us, and what would stop it from happening again? A few priorities shaped that work.

The first was figuring out where the credentials came from and how far the exposure reached. It was clear the threat actor had valid credentials for the webdev role, but the more useful question was why a web application role could reach Amazon Bedrock at all. The customer confirmed there was no business reason for it, so we needed to understand whether that permission was a deliberate misconfiguration or an oversight, and then look for other EC2 instances carrying the same role attachment. One compromised instance is an incident; a fleet of instances with the same over-scoped role is a much bigger problem waiting to happen.

Next, we wanted to know what the threat actor did after they got into Amazon Bedrock. Reconnaissance and active use carry very different consequences, so we traced which foundation models were touched and whether any were actually invoked or only enumerated. That distinction matters for scoping the damage, and it signals whether data exfiltration is a concern. Unusual model usage, unexpected prompt volume, or output patterns that don’t match any legitimate workload are the signals that reconnaissance has turned into something worse.

The Region hop was its own line of inquiry. The move from us-east-1 to us-east-2 was almost certainly deliberate, and the investigation focused on understanding what the threat actor gained by it. In practice, that meant comparing the two Regions: were the monitoring and access controls in us-east-2 weaker than in us-east-1, and what else did the threat actor reach in the secondary Region once they were there? Inconsistent controls across Regions are one of the most common ways activity slips past detection.

Tying it all together was the timeline, which shows how quickly the threat actor moved through the chain:

  1. 15:53:49: Failed IAM operation (us-east-1)
  2. 15:59:29: Successful console login (us-east-1)
  3. 17:20:00: Amazon Bedrock reconnaissance (us-east-2)
  4. 17:25:48: Active model invocation (Converse call) (us-east-2)

Following the credentials across those events fills in the rest of the story. IMDSv1 handed the threat actor temporary credentials for the webdev role, and the same role appears in every event that followed, which confirms the credentials were reused rather than replaced. Nowhere in that sequence was MFA required, and that single gap is what let one harvested credential stay useful across two hours, two Regions, and two very different services.

Incident response checklist

The following checklist captures the actions needed to contain the incident, remediate the vulnerability, and assess the scope of unauthorized AI service usage. Each item names where to look and what a finding looks like, so the checklist stays usable under the time pressure of a live incident.

  1. Contain and remediate the entry point:
    1. Identify the specific web application feature that made the outbound request (URL fetchers, webhook callbacks, PDF or image renderers, and link-preview generators are the usual culprits), then confirm it can reach http://169.254.169.254.
    2. Audit the rest of the application for the same pattern, because one unvalidated URL parameter usually means others exist.
    3. Enforce IMDSv2 on the affected instance and across the fleet with aws ec2 modify-instance-metadata-options --http-tokens required --http-put-response-hop-limit 1. Setting --http-tokens required means credentials are only returned when the caller presents a session token it obtained through a PUT request, which a basic SSRF cannot do. Setting the hop limit to 1 keeps the metadata response on the instance itself, so a request coming from a container or proxy an extra hop away never receives it.
  2. Scope the Bedrock usage:
    1. List the foundation models the webdev role could reach by reviewing its IAM policy and any resource-based policies, so you know the full set of models that were exposed, not only the one that was invoked.
    2. Determine what was sent to and returned by the model. CloudTrail records the Converse call and the token counts, but only Amazon Bedrock model invocation logging captures the input prompts and model responses. If it was enabled, pull the log entries for the session; if it wasn’t, note that the prompt and response content can’t be recovered and enable it now.
    3. Flag any compliance exposure based on what those prompts and responses contained. Unauthorized processing of regulated data (such as personally identifiable information (PII), protected health information (PHI), or cardholder data) through the model might trigger notification obligations.
  3. Check for wider compromise and persistence:
    1. Query CloudTrail across all Regions and services—not only Amazon Bedrock—for every event tied to the webdev role’s session, to confirm what else the same credentials touched.
    2. Correlate the CloudTrail timestamps with VPC Flow Logs and application logs for source IP 75.3.231.105 to build the network-level picture around each API call.
    3. Search for IAM write events from the session (CreateUser, CreateRole, CreateAccessKey, and AttachRolePolicy) that indicate an attempt to establish persistence beyond the temporary credentials. The failed adm1n CreateUser call is the known starting point; confirm nothing similar succeeded.
  4. Watch for ongoing or hidden impact:
    1. Review Amazon Bedrock usage in CloudWatch and your billing data for invocation spikes or unexpected token consumption that fall outside normal workload patterns.
    2. Inspect the invocation logs for signs of sensitive data being processed or extracted through the model.
    3. Check the same logs for prompt injection attempts, where the input tries to override the model’s instructions or extract system prompts.

Key takeaways

This scenario reveals how a single application vulnerability can cascade into broad unauthorized access when multiple security controls are missing. The following takeaways highlight the key defensive gaps and hardening priorities.

  • Least-privilege IAM for workload roles: The webdev role’s access to Amazon Bedrock across multiple Regions had no business justification for a web application workload, which the customer confirmed during the investigation. Apply least-privilege principles to EC2 instance roles by scoping permissions to only the services and actions the application requires. Use AWS IAM Access Analyzer to identify unused permissions and tighten policies proactively. Overly permissive roles transform a single application vulnerability into broad lateral movement across unrelated services.
  • IMDSv1 compared to IMDSv2: Organizations must immediately switch to IMDSv2 and disable IMDSv1 across their entire cloud infrastructure. The ec2RoleDelivery: “1.0" field in the logs explicitly confirms the use of IMDSv1, which permits credential retrieval without an authentication token. This architectural weakness makes SSRF-based credential theft trivial, because a web application flaw that can make an outbound request is enough to read the role’s temporary credentials with no further authentication. Transitioning to IMDSv2 mitigates this attack surface by enforcing local, session-based tokens, effectively breaking the threat actor’s exploitation chain. In this scenario, IMDSv2 alone would have stopped the attack at its first step.
  • Region-based defense evasion signals a deliberate operator: The shift from us-east-1 to us-east-2 for Amazon Bedrock access wasn’t incidental. Threat actors move between Regions because monitoring, alerting, and access controls are often configured inconsistently across them, and activity in a secondary Region is more likely to go unnoticed. This kind of cross-Region movement is a marker of operational security awareness rather than opportunistic access, and it should raise the priority of an investigation. Treat consistent detection coverage across all Regions, including the ones you do not actively use, as a baseline requirement.
  • Interface switching and permission probing reveal the threat actor’s method: This event chain reveals a threat actor comfortable moving between AWS interfaces and testing boundaries before committing. The failed CreateUser attempt was systematic probing to understand the scope of the harvested credentials, and when IAM actions were denied, the threat actor pivoted to a service the role could actually reach. The combination of programmatic access through the AWS CLI and interactive console access demonstrates the same adaptability. Recognizing this pattern of probe, adapt, and pivot helps responders anticipate the next move instead of reacting to each event in isolation.
  • AI services need visibility beyond CloudTrail: Amazon Bedrock and other AI services are high-value targets, and CloudTrail alone doesn’t capture the whole story. CloudTrail records who called Amazon Bedrock and whether the call succeeded, but not what was asked or answered. Enable Amazon Bedrock model invocation logging to capture full prompts and responses for compliance auditing. For agent-based workloads, Amazon Bedrock AgentCore Observability, built on AWS Distro for OpenTelemetry (ADOT), provides session-level traces showing tool execution order and latency. Consider also enabling Amazon GuardDuty AI Protection, which analyzes Amazon Bedrock-related CloudTrail activity to detect anomalous invocations, cost harvesting, and prompt injection attempts. Correlating these signals—CloudTrail, Model Invocation Logging, and agent telemetry—gives investigators the complete picture. For implementation guidance, see Monitoring and Auditing AI Workloads on AWS.

Advanced forensic indicators and evasion techniques

Beyond the specific attack patterns in this scenario, investigators should be aware of several evasion techniques that threat actors use to confuse defenders and blend into legitimate activity. The top three that we observe across incident response with customers are:

  • Root user compared to IAM user named root: When you first create an AWS account, you begin with a single sign-in identity that has complete access to all AWS services and resources in the account. This identity is called the AWS account root user. In some previous investigations, threat actors have also created IAM users in an AWS account named root. The difference is visible in the type field of the userIdentity element of the CloudTrail log record, which indicates the type of user that logged the record.
  • Role and user name imitation: Threat actors attempt defense evasion by creating names for IAM users and roles that imitate those reserved for use by AWS. For example, the service-linked role AWSServiceRoleForSupport is a unique IAM role linked directly to AWS Support. Threat actors have created roles with the name AWSServiceRoIeforSupport (note the use of an upper-case letter I instead of a lower-case letter l in Role) in an attempt to trick users into thinking actions taken by this role have been performed by AWS Support.
  • Users named HIDDEN_DUE_TO_SECURITY_REASONS: The userName field contains the string HIDDEN_DUE_TO_SECURITY_REASONS when the recorded event is a console sign-in failure caused by incorrect user name input. CloudTrail doesn’t record the contents in this case because the text could contain sensitive information. However, threat actors have used this string as an actual username to trick investigators into thinking the name has been obfuscated. This technique is usually associated with a corresponding CreateUser or CreateRole CloudTrail event.

Conclusion and next steps

CloudTrail event fields help security teams identify identities with unintended access, track threat actor actions, and remediate affected resources. Understanding fields like userIdentity, eventName, and sourceIPAddress improves incident investigation and threat detection. Implementing best practices such as enabling comprehensive logging, using Amazon Athena for analysis, securing logs, and automating responses helps ensure that CloudTrail serves as a robust forensic and incident response tool.

If you suspect unauthorized activity in your AWS environment, AWS Security Incident Response is available to help. The service continuously monitors and triages findings from Amazon GuardDuty and third-party security tools integrated through AWS Security Hub, automatically filtering alerts to surface the most relevant events. In addition to proactive triage, customers can initiate security cases through the service. You can choose to handle these cases internally or receive support from the Security Incident Response Team (SIRT), a dedicated group of security experts available at all times to assist with investigation, containment, and recovery throughout the incident lifecycle.

Additional resources

The following resources provide further guidance on securing your AWS environment and strengthening your investigative capabilities.

If you have feedback about this post, submit comments in the Comments section below.


Oscar Diaz

Oscar E Diaz Cordovez

Oscar is a Senior Technical Account Manager specializing in cloud operations and security. His passion for technology and innovation drives his expertise in cloud-focused architectures, DevOps practices, and automation.

Steve de Vera

Steve de Vera

Steve is a manager for the AWS Security Incident Response service with a focus on threat research and threat intelligence. He is passionate about American-style BBQ and is a certified competition BBQ judge. He has a dog named Brisket.

Jennifer Paz

Jennifer is a Security Engineer Manager with over a decade of experience, for the AWS Security Incident Response service. Jennifer enjoys helping customers tackle security challenges and implementing complex solutions to enhance their security posture. When not at work, Jennifer is an avid runner, pickleball enthusiast, traveler, and foodie, always on the hunt for new culinary adventures.

  •  

Incident response guide for AWS CloudTrail investigations – Part 1

AWS CloudTrail logs contain the evidence you need when investigating suspicious activity in your AWS environment, but knowing which fields matter and how to interpret them can mean the difference between surface-level analysis and uncovering the full scope of an incident. This guide walks you through real-world scenarios, showing you how to analyze CloudTrail events to uncover cross-account unauthorized access, cryptocurrency mining operations, and AI service abuse. You’ll learn the investigative techniques our Security Incident Response Team (SIRT) team uses to handle threats, with practical methodologies you can apply to your own investigations.

Each scenario includes:

  • Architecture diagrams showing the event progression
  • Annotated CloudTrail logs highlighting significant fields
  • Investigation frameworks with specific questions to ask
  • Lessons learned and preventive measures

Whether you’re in security operations, cloud engineering, compliance, or leadership, this guide provides the investigative mindset needed to move beyond basic CloudTrail queries to comprehensive security analysis.

Incident response definitions

Throughout this guide, we reference terminology commonly used in incident response and threat intelligence. We’ve provided definitions for key terms to help ensure this guide is accessible to readers from diverse backgrounds, whether you’re in security operations, cloud engineering, compliance, or leadership.

  • Reconnaissance: The initial phase where a threat actor gathers information about the target environment (for example, listing Amazon Simple Storage Service (Amazon S3) buckets or browsing available resources) to understand what’s available before taking action.
  • Enumeration: Systematically cataloging specific resources, users, or configurations within an environment to identify potential targets or access paths.
  • Lateral movement: When a threat actor moves from one resource to another within the same environment (for example, pivoting from an Amazon Elastic Compute Cloud (Amazon EC2) instance to an AI service) to expand their access.
  • Privilege escalation: Attempting to gain higher-level permissions than initially obtained, such as trying to create admin users or modify AWS Identity and Access Management (IAM) policies.
  • Defense evasion: Techniques used to avoid detection, such as operating in a different AWS Region where monitoring might be less robust, or naming unauthorized resources to look legitimate.
  • Persistence: Establishing ongoing access to an environment (for example, creating new IAM users or access keys) so the threat actor can return even if the original entry point is closed.
  • Credential harvesting: Stealing authentication credentials (passwords, access keys, temporary tokens) to impersonate legitimate users or roles.
  • Server-side request forgery (SSRF): A web application technique where an unauthorized user tricks a server into making requests on their behalf, often used to access internal services such as the Amazon EC2 Instance Metadata Service (IMDS) endpoint. For more information, see Understanding SSRF.
  • IMDSv1 (Instance Metadata Service v1): Amazon EC2 Instance Metadata Service version 1 (IMDSv1) provides temporary credentials to applications running on an instance. IMDSv1 itself isn’t inherently insecure; however, when an application with issues (for example, one susceptible to SSRF) is running on the instance, an unauthorized user can use that application to reach the metadata endpoint and retrieve credentials. IMDSv2 mitigates this risk by requiring session-based authentication tokens.
  • Indicators of compromise (IOCs): Observable artifacts (IP addresses, user agents, session names, resource names) that suggest unauthorized activity has occurred.
  • Exfiltration: The unauthorized transfer of data out of an environment, such as copying files before deleting them.
  • Event chain: The sequence of steps a threat actor follows from initial access to achieving their objective, where each step enables the next.
  • Pivot: Shifting from one technique, service, or Region to another during a security event, often after an initial approach is blocked or to avoid detection.

Scenario 1: Cross-account S3 data deletion with ransomware implications

Cross-account access is sometimes necessary in AWS, but misconfiguration creates security risks. In this scenario, your security operations center has received an automated alert that multiple objects have been deleted from the customer-important-data S3 bucket. The initial response seems straightforward: check the CloudTrail logs, identify who deleted the objects, and determine if it was authorized. But as our SIRT team investigated further, what appeared to be a straightforward unauthorized deletion revealed itself as a cross-account incident with ransomware implications. CloudTrail analysis requires recognizing patterns, understanding context, and thinking like a threat actor.

Scenario architecture

Figure 1 shows the architecture layout for accessing a trusted account and deleting objects from an S3 bucket, which is achieved through the following steps:

  1. Threat actor assumes the CrossAccountS3Access role from a trusted account.
  2. Lists S3 buckets to identify targets (ListBuckets API call).
  3. Lists objects within the target bucket to catalog contents.
  4. Executes scripted deletions of three files within 13 seconds.
  5. Each deletion returns an HTTP 204 (successful) status code.
Figure 1: Scenario 1 architecture

Figure 1: Scenario 1 architecture

Reconnaissance phase

Our investigation began with examining the CloudTrail logs, where we discovered that the unauthorized activity started with what many analysts might dismiss as routine activity: a ListBuckets API call made through an assumed role at 14:31:22 UTC. The CloudTrail entry contains a session named dev-migration-script using the CrossAccountS3Access role.

While cross-account access is common in enterprise environments, session names typically reflect legitimate business units. Attackers frequently use masquerading techniques, naming their sessions after common developer tasks or automation scripts, to blend seamlessly into daily operational noise. However, cross-referencing this session name against the external source IP and historical deployment logs confirmed that no such migration project was authorized, signaling a clear evasion attempt by a threat actor and the first indication of unauthorized access. Three seconds later, our logs showed a GET request to list objects in the bucket, which is classic reconnaissance behavior. The threat actor was cataloging available targets, using the same assumed role and IP address. This pattern, which you can see in the arn and eventname in the following log, showed us that the threat actor gathered intelligence, assessed targets, and planned their approach.

{
  "eventVersion": "1.08",
  "userIdentity": {
    "type": "AssumedRole",
    "principalId": "AROAEXAMPLE123456789:threat-actor-session",
    "arn": "arn:aws:sts::111122223333:assumed-role/CrossAccountS3Access/threat-actor-session"
  },
  "eventTime": "2025-01-20T14:31:22Z",
  "eventSource": "s3.amazonaws.com",
  "eventName": "ListBuckets",
  "sourceIPAddress": "203.0.113.47",
  "recipientAccountId": "444455556666"
}

──────────────────────────────────────────────────────────────────────────────────
  FORENSIC LEGEND
──────────────────────────────────────────────────────────────────────────────────
❶ arn: ".../CrossAccountS3Access/..."             → Cross-account role assumed; access came from another account
❷ Session name: "threat-actor-session"            → Custom session name attached at role assumption
❸ eventName: "ListBuckets"                        → Enumeration of all S3 buckets in the account (recon)
❹ principalId: "AROAEXAMPLE123456789:threat-actor-session" → Role's unique ID + attacker-chosen session label
❺ sourceIPAddress: "203.0.113.47"                 → Origin of the API call (RFC 5737 documentation IP range)
❻ recipientAccountId: "444455556666"              → AWS account that received/owned the request (fictional placeholder)
──────────────────────────────────────────────────────────────────────────────────

Systematic deletion

After completing their reconnaissance at 14:31:25 UTC, the threat actor went silent for 14 minutes before the first deletion at 14:45:12 UTC. During this window, the threat actor likely reviewed the inventory of objects they’d just enumerated, selected their highest-value targets (financial data, PII, and database backups), and prepared an automated deletion script to execute quickly once ready. We can infer this preparation period based on several factors: no other CloudTrail events from this session appeared during the 14-minute window, the subsequent deletions were precisely timed at 6-7 second intervals suggesting scripted execution, and the targets chosen were the three most business-critical files rather than a bulk delete of everything in the bucket. This selective, scripted approach indicates the threat actor used the reconnaissance data they gathered in the listing phase to build a targeted attack plan before executing it. Within 13 seconds (14:45:12–14:45:25 UTC), the threat actor deleted three files from the customer-important-data bucket: a financial report (q4-2024.xlsx at 14:45:12), a customer personally identifiable information (PII) database (pii-database.csv at 14:45:18), and a production database backup (prod-database-backup.sql at 14:45:25). Each deletion returned an HTTP 204 status code. The Amazon S3 access logs confirm these successful DELETE operations, all originating from the same session.

[20/Jan/2025:14:31:25] S3Access/dev-migration-script REST.GET.BUCKET    -  "GET /?list-type=2 HTTP/1.1" 200 - "-" "aws-cli/Linux"
                                ‾‾‾‾‾‾‾‾‾‾‾‾‾‾‾‾‾‾‾‾ ‾‾‾‾‾‾‾‾‾‾‾‾‾‾‾                                                ‾‾‾‾‾‾‾‾‾‾‾‾‾
                                ❶ Masquerading session   ❷ Recon: listing buckets                                        ❻ Scripted tool

[20/Jan/2025:14:34:15] S3Access/dev-migration-script REST.COPY.OBJECT   financial-reports/q4-2024.xlsx "PUT /..." 200 - "-" "aws-cli/Linux"
                                                     ‾‾‾‾‾‾‾‾‾‾‾‾‾‾‾‾   ‾‾‾‾‾‾‾‾‾‾‾‾‾‾‾‾‾‾‾‾‾‾‾‾‾‾‾‾‾
                                                     ❸ Data exfiltration  Financial data copied

[20/Jan/2025:14:34:20] S3Access/dev-migration-script REST.COPY.OBJECT   customer-data/pii-database.csv "PUT /..." 200 - "-" "aws-cli/Linux"
                                                     ‾‾‾‾‾‾‾‾‾‾‾‾‾‾‾‾   ‾‾‾‾‾‾‾‾‾‾‾‾‾‾‾‾‾‾‾‾‾‾‾‾‾‾‾‾‾‾
                                                     ❸ Data exfiltration  PII database copied

[20/Jan/2025:14:45:12] S3Access/dev-migration-script REST.DELETE.OBJECT financial-reports/q4-2024.xlsx "DELETE /..." 204 - "-" "aws-cli/Linux"
            ‾‾‾‾‾‾‾‾‾                               ‾‾‾‾‾‾‾‾‾‾‾‾‾‾‾‾‾ ‾‾‾‾‾‾‾‾‾‾‾‾‾‾‾‾‾‾‾‾‾‾‾‾‾‾‾‾‾               ‾‾‾
            ❺ 13-sec window starts                   ❹ Destruction        Target file                                   Success

[20/Jan/2025:14:45:18] S3Access/dev-migration-script REST.DELETE.OBJECT customer-data/pii-database.csv "DELETE /..." 204 - "-" "aws-cli/Linux"
                                                     ‾‾‾‾‾‾‾‾‾‾‾‾‾‾‾‾‾ ‾‾‾‾‾‾‾‾‾‾‾‾‾‾‾‾‾‾‾‾‾‾‾‾‾‾‾‾‾‾               ‾‾‾
                                                     ❹ Destruction        PII database destroyed                        Success

[20/Jan/2025:14:45:25] S3Access/dev-migration-script REST.DELETE.OBJECT backup-configs/prod-database-backup.sql "DELETE /..." 204 - "-" "aws-cli/Linux"
            ‾‾‾‾‾‾‾‾‾                               ‾‾‾‾‾‾‾‾‾‾‾‾‾‾‾‾‾ ‾‾‾‾‾‾‾‾‾‾‾‾‾‾‾‾‾‾‾‾‾‾‾‾‾‾‾‾‾‾‾‾‾‾‾‾‾         ‾‾‾
            ❺ 13-sec window ends                     ❹ Destruction        Prod backup destroyed (anti-recovery)         Success

───────────────────────────────────────────────────────────────────────────────────────────
  FORENSIC LEGEND
───────────────────────────────────────────────────────────────────────────────────────────
  ❶ "dev-migration-script"    → Masquerading session name; no authorized migration existed
  ❷ REST.GET.BUCKET           → Reconnaissance: cataloging available targets
  ❸ REST.COPY.OBJECT          → Data exfiltration before destruction (steal-then-destroy)
  ❹ REST.DELETE.OBJECT        → Systematic destruction of high-value assets
  ❺ 14:45:12 → 14:45:25      → 13-second automated deletion window (scripted execution)
  ❻ "aws-cli/Linux"           → CLI-based automation, not manual console activity
───────────────────────────────────────────────────────────────────────────────────────────

Analysis of timing and access patterns

The 13-second deletion window wasn’t arbitrary. The user-agent string showed AWS Command Line Interface (AWS CLI) usage on Linux, and the precise timing suggested scripted execution rather than manual operations. This indicated preplanned targeting and automated execution to minimize the detection window.

The consistent source IP across events let us search for other suspicious activities from the same source, correlate with threat intelligence feeds, and identify potential lateral movement attempts.

The broad Amazon S3 permissions of the CrossAccountS3Access role raised questions about least privilege implementation, regular access reviews, and the business justification for such extensive cross-account permissions.

Investigation priorities

With confirmation that misconfigured cross-account access had been taken advantage of to delete data, the next step was to prioritize the investigation. In incident response, priority is driven by three factors: whether the threat actor still has active access (containment urgency), whether sensitive data was exposed or exfiltrated (regulatory and business impact), and whether the attack can spread to other resources or accounts (blast radius). We applied these factors to guide the following questions:

  • How did the threat actor gain access to the CrossAccountS3Access role? We examined the role’s trust policy and recent modifications, authentication events in both the trusting and trusted accounts, and other sessions using the same role around the same timeframe.
  • Were the files copied before deletion? We searched for GetObject operations on the same objects before the deletions, unusual network traffic patterns during the reconnaissance phase, and CopyObject activities that might indicate data theft.
  • Did the objects have specific significance? Understanding why these specific objects mattered helped us prioritize recovery efforts based on business impact, assess regulatory notification requirements for the PII exposure, and determine the full scope of business disruption from backup loss.

Response checklist

After identifying the scope of the cross-account deletion, the following steps help ensure a thorough response and prevent recurrence.

  • Determine if the business purpose served by this cross-account access is legitimate
  • Identify the corresponding authentication events that show how the role was assumed
  • Identify other AWS resources that this role might access beyond Amazon S3
  • Check for failed attempts or reconnaissance activities that preceded the successful event
  • Determine when this cross-account trust relationship was created
  • Determine when the last access review of this role was conducted
  • Locate any backup copies of the deleted data
  • Determine detection rules that can be used to catch similar activity in the future

Key takeaways

This scenario illustrates several principles that apply broadly to cross-account incident investigations. Unusual identifiers in session names often reveal threat actor intent or poor operational security. The progression from ListBuckets to targeted deletions shows how threat actors operate with a plan. Cross-account access needs extra scrutiny because trusted relationships become vectors for unauthorized access when credentials are exposed. Understanding why specific files matter helps prioritize response efforts and assess true impact. Precise timing and consistent technical signatures often indicate scripted events that need different response strategies than manual intrusions.

Scenario 2: Cryptocurrency mining using CloudFormation with console credentials

In this scenario, your finance team notices an unexpected spike in AWS costs, particularly around Amazon EC2 compute charges in the us-east-1 AWS Region. During the investigation, we examine how threat actors use legitimate console access to deploy cryptocurrency mining operations through AWS CloudFormation and how investigators can uncover the scope of resource hijacking events. We discover a CloudFormation stack named CRYPTO which you have no record or knowledge of being created. The stack contains EC2 instances running in your production Amazon Virtual Private Cloud (Amazon VPC) consuming significant compute resources, which signals an immediate security investigation.

Architecture and sequence

Figure 2 shows how the threat actor moved from credential acquisition to active mining, following these steps:

  1. Threat actor obtains console credentials (username and password without multi-factor authentication (MFA)).
  2. Accesses AWS Management Console.
  3. Creates CloudFormation stack CRYPTO in us-east-1.
  4. Stack deploys EC2 instances configured for cryptocurrency mining in a public subnet.
  5. Mining instances begin consuming compute resources.
Figure 2: Scenario 3 architecture

Figure 2: Scenario 3 architecture

The following is the redacted CloudTrail event record for the unauthorized CreateStack action. See if you can use it to find the following information:

  • The name of the CloudFormation stack that was created
  • The CloudFormation stack Amazon Resource Name (ARN)
  • If the credentials were secured by MFA
  • If the threat actor used the AWS Management Console to perform the actions, or if they were performed programmatically using the AWS CLI or a script
{
  "eventVersion": "1.11",
  "userIdentity": {
    "type": "AssumedRole",
    "principalId": "AROAFINDANEXAMPLE:Participant",
    "arn": "arn:aws:sts::XXXXXXXXXXXX:assumed-role/WSParticipantRole/Participant",
    "sessionContext": {
      "sessionIssuer": { "type": "Role", "userName": "WSParticipantRole" },
      "attributes": { "mfaAuthenticated": "false" }  ◄── ❹ No MFA on session
                                            ‾‾‾‾‾‾‾
    }
  },
  "eventTime": "2025-09-23T18:07:12Z",
  "eventSource": "cloudformation.amazonaws.com",
  "eventName": "CreateStack",
               ‾‾‾‾‾‾‾‾‾‾‾‾‾
  "awsRegion": "us-east-1",
  "userAgent": "aws-cli/2.30.0 ... exec-env/CloudShell",  ◄── ❻ Browser-based CloudShell execution
                                    ‾‾‾‾‾‾‾‾‾‾‾‾‾‾‾‾‾‾‾
  "requestParameters": {
    "stackName": "CRYPTO",  ◄── ❶ Cryptocurrency-related activity
                 ‾‾‾‾‾‾‾‾
    "parameters": [
      { "parameterKey": "VpcId" },      ◄── ❷ Prior recon: attacker knew target network
      { "parameterKey": "SubnetIds" }   ◄── ❷
                       ‾‾‾‾‾‾‾‾‾‾‾‾‾‾‾‾‾‾‾
    ]
  },
  "responseElements": {
    "stackId": "arn:aws:cloudformation:us-east-1:...:stack/CRYPTO/2102e190..."  ◄── ❸ Stack created successfully
               ‾‾‾‾‾‾‾‾‾‾‾‾‾‾‾‾‾‾‾‾‾‾‾‾‾‾‾‾‾‾‾‾‾‾‾‾‾‾‾‾‾‾‾‾‾‾‾‾‾‾‾‾‾‾‾‾‾‾‾
  },
  "sessionCredentialFromConsole": "true"  ◄── ❺ Console-based access
                                 ‾‾‾‾‾‾
}

───────────────────────────────────────────────────────────────────────────────────────────
  FORENSIC LEGEND
───────────────────────────────────────────────────────────────────────────────────────────
❶ stackName: "CRYPTO"                → Indicator of cryptocurrency mining deployment
❷ VpcId + SubnetIds parameters       → Attacker targeted specific network; prior recon confirmed
❸ stackId: "...stack/CRYPTO/..."     → Unique resource ID; stack was successfully created
❹ mfaAuthenticated: "false"          → Session lacked multi-factor authentication
❺ sessionCredentialFromConsole: true  → Access via AWS Console web portal (not external API)
❻ exec-env/CloudShell                → CLI commands executed via browser-based CloudShell
───────────────────────────────────────────────────────────────────────────────────────────

Analysis of authentication and access

The CloudTrail event record includes fields that answer the questions for this scenario.

Stack details summary:

The CloudTrail event confirms the following details about the deployed stack:

  • Stack name: CRYPTO is an indicator of cryptocurrency-related activity
  • Stack ARN: arn:aws:cloudformation:us-east-1:stack/CRYPTO/2102e190-98a8-11f0-bcea-1209335b107
  • Region: us-east-1 (a common choice for threat actors because of immediate service availability)

Authentication and session context analysis:

Examining the session metadata reveals how the threat actor authenticated and accessed the environment:

  • MFA status: “mfaAuthenticated": “false” indicates that the session was entirely unauthenticated by MFA.
  • Access method: “sessionCredentialFromConsole": “true” means that access was funneled through the console.
  • User context: AssumedRole using WSParticipantRole. Session creation occurred at 2025-09-23T18:06:22Z (approximately 50 seconds before stack creation).

Advanced forensic insight (the CloudShell pivot)

The sessionCredentialFromConsole: true field is important to note because this access originated from the AWS console rather than external programmatic API keys. Interestingly, while the session originated from the console, the userAgent field reveals the execution environment was exec-env/CloudShell. This shows that the threat actor didn’t manually click through the CloudFormation user interface, instead launching AWS CloudShell on sign-in to execute a prepackaged deployment script. This allowed the threat actor to achieve automated speed while evading traditional static API key monitoring. The mfaAuthenticated: false field represents a security control gap. Particularly in environments handling sensitive data or production workloads, MFA must be enforced for console access.

Investigation priorities

With the unauthorized stack confirmed, the investigation focused on understanding the full timeline and blast radius. We approached this in three phases, each building on the findings of the previous one.

Reconstruct the console session timeline

The session began at 18:06:22Z and the stack was created at 18:07:12Z, only 50 seconds later. That speed tells us the threat actor came prepared with a script rather than exploring the environment manually. But we needed to know what happened before and after. By filtering CloudTrail for the same session token across the full session duration, we could identify whether the threat actor performed any reconnaissance before deploying the stack, whether they accessed other services or regions during the same session, and whether they attempted to establish persistence (such as creating IAM users or access keys) before or after the mining deployment. Any actions taken outside the CloudFormation deployment could indicate secondary objectives beyond cryptomining.

Examine what the stack actually deployed

The stack name alone doesn’t tell us the full impact. We needed to inspect the CloudFormation template to understand what resources were created and how they were configured. This meant identifying the EC2 instance types (larger instances mean higher costs and potentially more mining output), reviewing the security group rules to determine what network access these instances had to internal resources, checking whether the template included custom AMIs or user data scripts that pulled mining software on boot, and determining if the stack created its own IAM roles with permissions that could be used for further lateral movement. The template itself is evidence. If it was hosted in Amazon S3, the upload event tells us when the threat actor first staged their tools.

Calculate business impact and determine blast radius

Finally, we needed to quantify the damage and determine whether this was isolated or part of a broader compromise. We calculated the total compute cost by multiplying instance hours by instance type pricing, checked whether the mining instances had network paths to production databases or internal services, examined outbound traffic logs for connections to known mining pool IP addresses, and searched for similar stacks or naming patterns across other regions and accounts. The presence of outbound connections to anything other than mining pools would suggest the instances served a dual purpose, potentially exfiltrating data while generating cryptocurrency.

Response checklist

The following checklist captures the key actions needed to contain the incident, assess its impact, and close security gaps.

  • Determine why MFA wasn’t required for this sensitive operation
  • Investigate how the threat actor obtained valid console credentials
  • Check for failed sign-in attempts preceding this successful access
  • Check for other activities that occurred during this console session
  • Look for resources that were created by the CloudFormation stack
  • Determine how long those resources have been running and consuming costs
  • Look for other similarly named or suspicious stacks in the environment
  • Check what network access these instances have to internal resources
  • Determine what outbound connections these instances are making
  • Look for cryptocurrency mining pool connections
  • Check if IAM users or roles were created
  • Check if additional access keys were generated
  • Determine if the threat actor modified existing permissions or policies

Key takeaways

This scenario highlights how credential hygiene and monitoring controls intersect with resource hijacking threats.

  • MFA enforcement prevents console-based credential abuse for IAM users. The absence of MFA enabled the full sequence. Console access to production environments should require multi-factor authentication as a security best practice.
  • Resource naming can be an indicator. The obvious CRYPTO naming suggests either threat actor confidence or poor operational security, both concerning for different reasons.
  • Cost monitoring is security monitoring. Unusual billing spikes can be early indicators of resource hijacking events.
  • Console-based activity has different patterns than programmatic activity and requires specialized investigation approaches. The sessionCredentialFromConsole field is your starting point for distinguishing between the two.

Conclusion

In this first part, we walked through two real-world scenarios that demonstrate how CloudTrail analysis can reveal the full scope of a security incident. In Scenario 1, we showed how a seemingly routine cross-account role assumption led to targeted data deletion with ransomware implications, and how session names, timing patterns, and source IP correlation help investigators piece together the event chain. In Scenario 2, we examined how stolen console credentials enabled a cryptocurrency mining deployment through CloudShell, highlighting the critical role of MFA enforcement and cost monitoring as security controls. Both scenarios reinforce a core principle: effective CloudTrail investigation goes beyond identifying what happened. It requires understanding how and why, so you can contain the immediate threat and close the gaps that enabled it.

In Part 2 of this guide, we examine how a web application vulnerability can cascade into a multi-Region event targeting AI services, chaining together SSRF, IMDSv1 credential harvesting, and cross-Region pivoting to access Amazon Bedrock. We also cover critical investigation techniques including root user compared to IAM user named root, role name imitation tactics, and the HIDDEN_DUE_TO_SECURITY_REASONS username trick, along with critical hardening steps and additional resources you can use to strengthen your cloud forensic capabilities.

If you have feedback about this post, submit comments in the Comments section below.


Oscar Diaz

Oscar E Diaz Cordovez

Oscar is a Senior Technical Account Manager specializing in cloud operations and security. His passion for technology and innovation drives his expertise in cloud-focused architectures, DevOps practices, and automation.

Steve de Vera

Steve de Vera

Steve is a manager for the AWS Security Incident Response service with a focus on threat research and threat intelligence. He is passionate about American-style BBQ and is a certified competition BBQ judge. He has a dog named Brisket.

Jennifer Paz

Jennifer is a Security Engineer Manager with over a decade of experience, for the AWS Security Incident Response service. Jennifer enjoys helping customers tackle security challenges and implementing complex solutions to enhance their security posture. When not at work, Jennifer is an avid runner, pickleball enthusiast, traveler, and foodie, always on the hunt for new culinary adventures.

  •  

Detecting multi-stage attacks on AWS: A guide to cross-service signal correlation

A single alert from one security service tells you something happened. Read that signal alongside activity from other services and your own business context, and you will know whether what happened is part of a multi-stage attack.

Consider a short sequence. An identity calls GetCallerIdentity from a source address it hasn’t previously used. Within minutes, that same identity runs a burst of List and Describe calls across several services, and some of them fail with AccessDenied. Soon after, a large volume of data leaves your environment toward a domain that was registered last week. Amazon GuardDuty might already flag pieces of this, such as the reconnaissance from an unfamiliar source, through finding types like Recon:IAMUser/* or Discovery:S3/*. What you gain from correlating the pieces yourself is a single view of the sequence, tied to your own business context, so you can act on the whole rather than triaging findings one at a time.

This post is for security engineers and security operations teams who run Amazon Web Services (AWS) detection services and want to catch patterns specific to their environment. You will see how AWS detection and your business context fit together, and how to build correlations that use that context. The examples run in Amazon CloudWatch Logs Insights so you can try them today, and the closing section describes how to grow them into an automated pipeline. The walkthrough later in this post lists the prerequisites for these queries.

Start with AWS detection services

Begin with the AWS detection services. They cover the threats common across customers, and everything in this post is built on them.

Turn these on and tune them before you build anything custom. Tuning means adjusting sensitivity to reduce false positives for your environment, choosing which data sources each service monitors, and suppressing findings for known-good patterns.

GuardDuty correlates multi-stage attacks for you

Before you build anything by hand, see what GuardDuty already does for you. Amazon GuardDuty Extended Threat Detection correlates signals across multiple data sources including AWS CloudTrail, Amazon S3 data events, runtime monitoring, Amazon Elastic Kubernetes Service (Amazon EKS) audit logs, and more, then raises a single critical severity attack sequence finding when it spots a multi-stage pattern. It recognizes sequences such as credential compromise followed by data exfiltration, maps them to MITRE ATT&CK tactics, and attaches a timeline and remediation guidance. If you have GuardDuty enabled today, then GuardDuty Extended Threat Detection is already enabled by default and needs no queries from you. For details on how GuardDuty charges apply, see Amazon GuardDuty pricing.

The credential compromise sequence in the opening example is the kind of universal pattern GuardDuty Extended Threat Detection is built to catch, so rely on it for those. Attack sequence findings show up in the GuardDuty console next to your other findings, and they route to Security Hub and your response workflows the same way.

GuardDuty handles the threats that look the same in every account. What it doesn’t have is the context that makes a given action suspicious in your account. That’s what you provide.

Add your business context

Business context is what only you know about your environment: which buckets hold sensitive data, which principals have a reason to touch which resources, which role chains your policy permits, and when your production change windows open. GuardDuty Extended Threat Detection learns from patterns common across customers, but it can’t answer these environment-specific questions. Express them as correlations and you add a detection layer tuned to your environment. Each of the following four patterns turns one of these facts into a query.

Run these queries in the AWS Management Console for CloudWatch by choosing Logs, then Logs Insights, using the CloudWatch Logs Insights query language. Most read CloudTrail events from a CloudWatch Logs log group that your trail delivers to. If your trail writes only to Amazon S3, add CloudWatch Logs delivery on the trail, or run equivalent queries in Amazon Athena (a serverless query service for analyzing data in Amazon S3 using SQL).

Note: The queries and code in this post use placeholder values. Replace them with your own before running: your-sensitive-bucket (your S3 bucket name), your-key-id (your AWS KMS key ID), region (your AWS Region, such as us-east-1), account-id (your 12-digit AWS account ID), and aws-cloudtrail-logs-my-trail (your CloudTrail log group name).

A note on multi-account environments. In AWS Organizations, an organization trail delivers every account’s events to one log group, so these queries work as-is but return cross-account results. Filter by recipientAccountId for account-scoped views. Without an organization trail, run queries per account or use Amazon Security Lake as a central query surface.

The attack chain mapped to AWS services

Multi-stage attacks move through five phases, and each phase leaves a signal in a different service. These signals surface across three log sources: CloudTrail, which records API activity in your account; Amazon VPC Flow Logs, which capture network connection metadata; and Amazon Route 53 Resolver query logs, which record DNS queries from your VPCs.

  • Initial access – Stolen credentials reach your environment. CloudTrail records GetCallerIdentity, GetSessionToken, or AssumeRole from an unfamiliar source.
  • Discovery – The threat actor enumerates with List, Describe, and Get calls, often triggering AccessDenied responses.
  • Privilege escalation – The threat actor chains roles or edits policies. CloudTrail records AssumeRole sequences, PutRolePolicy, or CreateAccessKey.
  • Lateral movement – The threat actor moves across accounts or AWS Regions, assuming roles and creating resources in unfamiliar places.
  • Exfiltration – Data leaves through GetObject calls at scale, large outbound transfers in VPC Flow Logs, and DNS queries in Route 53 Resolver query logs to recently registered domains.

Figure 1 shows the five attack phases mapped to the AWS log source that records each one.
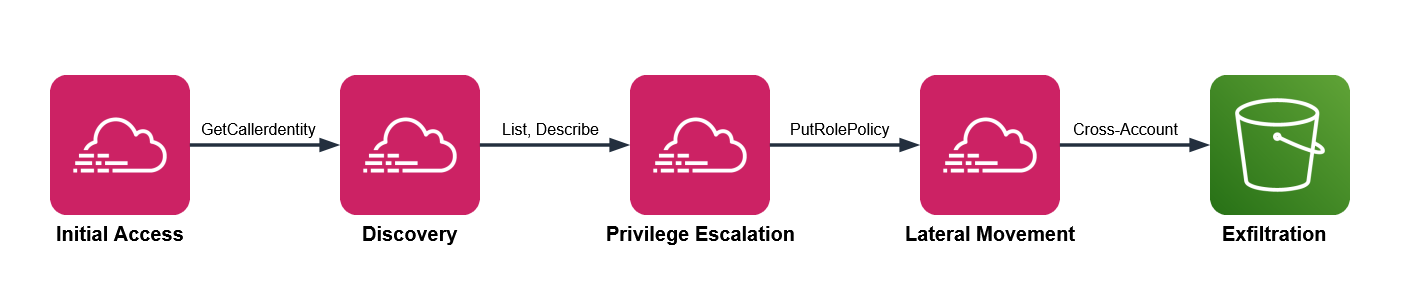
Figure 1: Attack chain mapped to AWS services

Figure 1: Attack chain mapped to AWS services

GuardDuty Extended Threat Detection watches this chain for universal patterns. The four patterns that follow add the dimension you supply: your business context.

Pattern one: Sensitive data access by an unexpected principal

Your data classification and access norms drive this detection. One bucket holds customer records, another holds public web assets, and you know which principals have a reason to read the customer records, which are sensitive. Encode that knowledge and an ordinary looking read turns into something worth chasing.

Three signals converge here. CloudTrail shows GetObject at volume on a bucket you’ve classified as sensitive. The principal isn’t on your list of expected readers for that bucket. And VPC Flow Logs show a large outbound transfer from the same source in the same window, while DNS query logs show a recently registered destination domain, which together increase your confidence that there’s a potential threat.

CloudTrail management events don’t record GetObject. You must turn on CloudTrail data events for the buckets you care about to capture GetObject. Many teams miss GetObject because data events weren’t enabled on the relevant buckets.

This query shows bulk reads on a sensitive bucket, grouped by principal. Run it in CloudWatch Logs Insights with your CloudTrail log group selected.

fields @timestamp, userIdentity.arn, requestParameters.bucketName
| filter eventSource = "s3.amazonaws.com" and eventName = "GetObject"
| filter requestParameters.bucketName = "your-sensitive-bucket"
| stats count(*) as objectReads,
        count_distinct(requestParameters.key) as distinctObjects
        by userIdentity.arn, bin(10m)
| filter objectReads > 100
| sort objectReads desc

The threshold of 100 is a placeholder. Run the query over a week of normal activity, find the ninety-fifth percentile read count for that bucket, and set the threshold above it. Then check each principal the query returns against your expected reader list. A principal that isn’t on the list, reading at volume, is the result to investigate.

To corroborate, look for a matching outbound transfer. Switch the log group selector to your VPC Flow Logs log group and run this.

fields @timestamp, srcAddr, dstAddr, bytes
| filter action = "ACCEPT"
# exclude RFC 1918 private ranges so only external destinations remain
| filter dstAddr not like /^10\./
        and dstAddr not like /^192\.168\./
        and dstAddr not like /^172\.(1[6-9]|2[0-9]|3[0-1])\./
| stats sum(bytes) as totalBytes by srcAddr, dstAddr, bin(10m)
| filter totalBytes > 1000000000
| sort totalBytes desc

The Amazon S3 query returns a principal, and the Flow Logs query works on IP addresses, so you translate one into the other. The worked example later in this post covers that translation in full.

Picture an analytics role that reads a reporting bucket all day. One afternoon, it reads a thousand objects from your customer records bucket instead. GuardDuty stays quiet, because an authenticated role making valid GetObject calls isn’t suspicious anywhere else. Your query flags it, because that role isn’t on the expected reader list for that bucket. The classification you applied is what turns silence into a signal.

Figure 2 shows a bulk read from a sensitive bucket in CloudTrail, a large outbound transfer in VPC Flow Logs, and a young domain resolution in Route 53 Resolver logs.
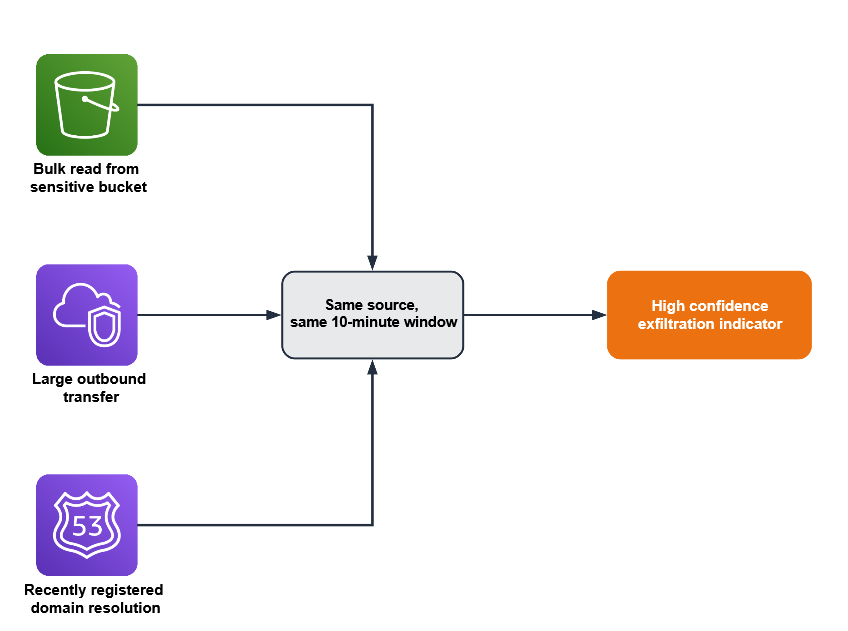
Figure 2: Three signals converging within a single time window to indicate exfiltration

Figure 2: Three signals converging within a single time window to indicate exfiltration

Pattern two: A role chain that crosses your access policy

Picture a deployment that assumes one role to build, then a second to release. For one principal, that two-hop AssumeRole chain is routine; for a different principal it’s a policy violation. This pattern relies on your trust topology—the chains your organization permits—so put that knowledge in the query.

This pattern needs three conditions:

  • CloudTrail shows several AssumeRole calls from the same source inside a short window
  • The chain ends in a sensitive action such as CreateAccessKey, PutRolePolicy, or AttachUserPolicy
  • The starting identity isn’t one your policy expects to run that chain

In CloudWatch Logs Insights, select your CloudTrail log group and run this query, which surfaces chains of two or more hops.

fields @timestamp, userIdentity.arn, requestParameters.roleArn, sourceIPAddress
| filter eventName = "AssumeRole"
| stats count(*) as assumeCount,
        count_distinct(requestParameters.roleArn) as rolesAssumed
        by sourceIPAddress, bin(5m)
| filter assumeCount >= 2 and rolesAssumed >= 2
| sort assumeCount desc

Two hops is the minimum for a chain; raise the count if your environment chains roles often. Your deployment pipeline probably assumes several roles an hour, as do AWS service principals such as AWS Security Hub. Exclude the identities you expect to see assuming multiple roles, including your pipeline role and known AWS service principals. What’s left is the set to investigate, such as a person assuming several roles at an odd hour and ending in a new access key. Treat that distinction as data: list the identities and actions you consider normal, and review the chains that fall outside the list.

Pattern three: An encryption key used outside its owning workload

Resource ownership is the signal here. A given AWS Key Management Service (AWS KMS) key creates and controls the encryption keys for a workload, and a single key should serve a single workload, such as a payments service. A Decrypt call against it is a valid, authorized API action, so nothing about the call itself looks wrong. The ownership rule you set is what makes another principal’s use of the key worth a second look.

This pattern applies only to customer-managed keys scoped to one workload. It doesn’t apply to AWS-managed keys (alias/aws/*) or to customer-managed keys intentionally shared across services. Confirm single-workload intent from the key policy’s Principal block before deploying this rule.

Two conditions indicate misuse:

  • CloudTrail shows Decrypt or GenerateDataKey calls on a key that’s tied to one workload
  • The calling principal isn’t the role that owns that workload

Against your CloudTrail log group, run this query to list the principals that called a specific key.

fields @timestamp, userIdentity.arn, eventName
| filter eventSource = "kms.amazonaws.com"
| filter eventName in ["Decrypt", "GenerateDataKey", "Encrypt"]
| filter resources.0.ARN = "arn:aws:kms:region:account-id:key/your-key-id"
| stats count(*) as keyUses by userIdentity.arn, eventName
| sort keyUses desc

Compare what comes back against the one workload role you expect. A principal you don’t recognize on that key is the signal. Because key misuse is an early move in data theft, this correlation catches activity that only your ownership knowledge can flag.

Consider a key that wraps your payments database. The payments service role calls it in normal operation, and nothing else should. If a developer role or a freshly created role runs Decrypt against it, the call succeeds and reads as ordinary in isolation. The reason it matters is the ownership rule you hold in your head and now state in this query.

Pattern four: A privileged action outside your change window

Start with the query, then read what it means.

fields @timestamp, userIdentity.arn, eventName, sourceIPAddress
| filter eventName in ["PutRolePolicy", "AttachRolePolicy",
        "CreateAccessKey", "AuthorizeSecurityGroupIngress", "PutBucketPolicy"]
| stats count(*) as sensitiveChanges by userIdentity.arn, eventName, sourceIPAddress
| sort sensitiveChanges desc

Run it against your CloudTrail log group, scoped to your off-hours window when you schedule it, so it returns only activity outside the change window. Your change process defines what normal looks like here: production security and identity changes flow through a pipeline during defined hours, run by a known actor. A console-driven policy change at 2:00 AM, made by a person rather than the pipeline, doesn’t fit those expectations. The signal is a sensitive change such as PutRolePolicy or AuthorizeSecurityGroupIngress, made outside the window, by a person rather than your pipeline role.

Exclude the actors you expect, such as your deployment pipeline role, your patch automation role, and AWS service principals like AWS CloudFormation and AWS Systems Manager. What remains is privileged change made outside your process, which is both what an attacker does to establish persistence and what your own change discipline says shouldn’t happen.

Your pipeline might open security group rules during a deployment every weekday afternoon. A person opening a security group rule at midnight on a weekend is the same API call carrying a very different meaning. The schedule and the actor, both facts you define, are what separate the two.

Build your first correlation rule

The following walkthrough uses pattern one as a complete example. The other three patterns follow the same design with their own queries.

Prerequisites

These prerequisites feed the queries in this walkthrough. Confirm each one before you start:

  • A CloudTrail trail logging management events to a CloudWatch Logs log group
  • CloudTrail data events enabled for your sensitive S3 buckets
  • GuardDuty enabled, with its protection plans and Extended Threat Detection
  • VPC Flow Logs on for your production VPCs
  • Amazon Route 53 Resolver query logging on

CloudTrail, GuardDuty, VPC Flow Logs, and Route 53 Resolver query logging provide the raw signals that your correlations connect. Without them, the queries in this post return empty results.

Step 1: Record the bucket and its expected readers

Choose one sensitive bucket to monitor, and write down the principals allowed to read it. Store the list where your automation can reach it, such as a configuration file in version control or an Amazon DynamoDB table (a managed NoSQL database).

{
  "customer-records-prod": [
    "arn:aws:iam::123456789012:role/AnalyticsPipeline",
    "arn:aws:iam::123456789012:role/ComplianceAudit"
  ],
  "financial-data-archive": [
    "arn:aws:iam::123456789012:role/FinanceReporting"
  ]
}

This example hardcodes the list for simplicity. In production, load it from a DynamoDB table or Parameter Store so you can update it without redeploying.

Step 2: Baseline before you set a threshold

Run the pattern one query over one week of normal activity. Find the 95th percentile read count for the bucket and use a value greater than that as your alert threshold. This step keeps legitimate high-volume access from generating false positives later.

Set the THRESHOLD_READS environment variable to this value when you configure the function in Step 5.

Step 3: Run the access query

In the CloudWatch console:

  1. Choose Logs, then choose Logs Insights.
  2. In the Select log group(s) dropdown, select your CloudTrail log group.
  3. Set the time range to 3h (the last three hours).
  4. In the query editor, paste the pattern one query.
  5. Replace your-sensitive-bucket with your bucket name.
  6. Choose Run query.
  7. Review the principals in the results table.
  8. Compare each principal against your expected reader list from step 1, and flag any that are not on it.

Each result includes a principal that step 4 translates into an IP address.

Step 4: Correlate with network activity

CloudTrail logs actions by AWS Identity and Access Management (IAM) principal, while VPC Flow Logs record traffic by IP address. To connect the two signals, translate the principal into its address.

For a role attached to an Amazon Elastic Compute Cloud (Amazon EC2) instance, the userIdentity.principalId field includes the instance ID after the colon, in the form AROAEXAMPLE:i-1234567890abcdef0. Copy the instance ID and look up its private IP address.

aws ec2 describe-instances \
  --instance-ids i-1234567890abcdef0 \
  --query "Reservations[0].Instances[0].PrivateIpAddress" \
  --output text

Other compute types differ. A VPC-connected AWS Lambda function sends traffic through elastic network interfaces in your subnets, so correlate on those interface addresses. An Amazon Elastic Container Service (Amazon ECS) task records its network interface in task metadata. For a plain assumed-role session with no instance behind it, the sourceIPAddress field in CloudTrail already holds the caller’s address, so you correlate on it directly.

Run the Flow Logs query from pattern one, filtering srcAddr to that address within 10 minutes of the Amazon S3 read timestamp. A match places the same source behind both the sensitive read and a large external transfer in one window. CloudTrail events reach CloudWatch Logs 5–15 minutes after the API call, so correlate on eventTime rather than query time. Query a wider lookback than your correlation window: for example, look back 30 to 60 minutes but correlate on a 10-minute eventTime window. Steps 3 and 4 are manual validation; step 5 automates them.

Figure 2 shows DNS resolution as a third corroborating signal. This walkthrough implements the CloudTrail and VPC Flow Logs correlation. To add DNS, apply the same run_query() pattern against your Route 53 Resolver query log group.

Step 5: Automate the check

Move the query into a Lambda function (serverless compute that runs your code without a server to manage), send results to a notification channel, and schedule regular runs. Work through the following sub-procedures.

To create the notification channel

  1. Open the Amazon Simple Notification Service (Amazon SNS) console. Amazon SNS is a managed messaging service that delivers notifications to subscribers.
  2. In the navigation pane, choose Topics.
  3. Choose Create topic.
  4. For Type, select Standard.
  5. For Name, enter security-correlation-alerts.
  6. Choose Create topic.
  7. Note the topic Amazon Resource Name (ARN) at the top of the topic details page. You will use it in the function.
  8. Choose Create subscription.
  9. For Protocol, select Email.
  10. For Endpoint, enter your email address or incident management endpoint.
  11. Choose Create subscription, then confirm the subscription from the email AWS sends.

To create the EventBridge Scheduler execution role

The schedule needs a role that lets it invoke your function, and its trust policy needs conditions that pin the role to the schedule you own. Without those conditions, another account with access to the scheduler service could theoretically call this role; a class of misuse known as the confused deputy problem.

1. Create a trust policy file named scheduler-trust-policy.json.

{
  "Version": "2012-10-17",
  "Statement": [
    {
      "Effect": "Allow",
      "Principal": { "Service": "scheduler.amazonaws.com" },
      "Action": "sts:AssumeRole",
      "Condition": {
        "StringEquals": {
          "aws:SourceAccount": "ACCOUNT-ID"
        },
        "ArnLike": {
          "aws:SourceArn": "arn:aws:scheduler:REGION:ACCOUNT-ID:schedule/*/s3-access-correlation-hourly"
        }
      }
    }
  ]
}

2. Create the role, then attach permission to invoke the function. Scope Resource to the specific function ARN so this role can’t invoke anything else.

aws iam create-role \
  --role-name EventBridgeSchedulerRole \
  --assume-role-policy-document file://scheduler-trust-policy.json

aws iam put-role-policy \
  --role-name EventBridgeSchedulerRole \
  --policy-name LambdaInvokePolicy \
  --policy-document '{
    "Version": "2012-10-17",
    "Statement": [
      {
        "Effect": "Allow",
        "Action": "lambda:InvokeFunction",
        "Resource": "arn:aws:lambda:REGION:ACCOUNT-ID:function:CorrelationFunction"
      }
    ]
  }'

When you create the function, Lambda automatically creates an execution role. You will attach the permissions this function needs to that role in a later step.

To deploy the correlation function

  1. Open the Lambda console.
  2. Choose Create function.
  3. For Function name, enter CorrelationFunction.
  4. For Runtime, select the latest Python runtime.
  5. Choose Create function.
  6. On the Code tab, replace the default code with the following function, then choose Deploy.
import os
import time
import logging
import boto3
from botocore.exceptions import ClientError

logger = logging.getLogger()
logger.setLevel(logging.INFO)

logs = boto3.client("logs")
sns = boto3.client("sns")
ec2 = boto3.client("ec2")

CLOUDTRAIL_LOG_GROUP = os.environ["CLOUDTRAIL_LOG_GROUP"]
FLOWLOGS_LOG_GROUP = os.environ["FLOWLOGS_LOG_GROUP"]
SNS_TOPIC = os.environ["SNS_TOPIC_ARN"]
BUCKET = os.environ["SENSITIVE_BUCKET"]
THRESHOLD = int(os.environ.get("THRESHOLD_READS", "100"))

# Expected readers per bucket
EXPECTED_READERS = {
    "customer-records-prod": [
        "arn:aws:iam::123456789012:role/AnalyticsPipeline",
        "arn:aws:iam::123456789012:role/ComplianceAudit",
    ],
}


def run_query(log_group, query, start, end):
    """Start a Logs Insights query and wait for it to finish."""
    started = logs.start_query(
        logGroupName=log_group,
        startTime=start,
        endTime=end,
        queryString=query,
    )
    query_id = started["queryId"]
    while True:
        outcome = logs.get_query_results(queryId=query_id)
        if outcome["status"] in ("Complete", "Failed", "Cancelled"):
            break
        time.sleep(1)
    if outcome["status"] != "Complete":
        raise RuntimeError(f"Query did not complete: {outcome['status']}")
    return [{f["field"]: f["value"] for f in row} for row in outcome["results"]]


def private_ip_for_principal(principal_id):
    """Resolve an EC2 instance role principalId to its private IP."""
    if ":" not in principal_id:
        return None
    instance_id = principal_id.split(":", 1)[1]
    if not instance_id.startswith("i-"):
        return None
    reservations = ec2.describe_instances(InstanceIds=[instance_id])
    for reservation in reservations["Reservations"]:
        for instance in reservation["Instances"]:
            return instance.get("PrivateIpAddress")
    return None


def egress_bytes(src_addr, start, end):
    """Sum external egress bytes for one source address."""
    query = f"""
    fields srcAddr, dstAddr, bytes
    | filter action = "ACCEPT" and srcAddr = "{src_addr}"
    | filter dstAddr not like /^10\\./
            and dstAddr not like /^192\\.168\\./
            and dstAddr not like /^172\\.(1[6-9]|2[0-9]|3[0-1])\\./
    | stats sum(bytes) as totalBytes
    """
    rows = run_query(FLOWLOGS_LOG_GROUP, query, start, end)
    if rows and rows[0].get("totalBytes"):
        return int(rows[0]["totalBytes"])
    return 0


def lambda_handler(event, context):
    try:
        # 1-hour lookback absorbs CloudTrail's 5-15 min delivery latency;
        # correlation happens on eventTime via 10-min bins in the query below.
        end = int(time.time())
        start = end - 3600  # 1 hour lookback
        allowed = EXPECTED_READERS.get(BUCKET, [])

        access_query = f"""
        fields userIdentity.arn, userIdentity.principalId
        | filter eventSource = "s3.amazonaws.com" and eventName = "GetObject"
        | filter requestParameters.bucketName = "{BUCKET}"
        | stats count(*) as objectReads
                by userIdentity.arn, userIdentity.principalId, bin(10m)
        | filter objectReads > {THRESHOLD}
        """

        for row in run_query(CLOUDTRAIL_LOG_GROUP, access_query, start, end):
            principal = row.get("userIdentity.arn")
            if not principal or principal in allowed:
                continue

            message = (
                f"Principal {principal} read {row.get('objectReads')} "
                f"objects from {BUCKET}."
            )

            ip = private_ip_for_principal(row.get("userIdentity.principalId", ""))
            if ip and egress_bytes(ip, start, end) > 1_000_000_000:
                message += (
                    f" The same source ({ip}) also sent a large volume of "
                    f"data to external destinations in the same window."
                )

            sns.publish(
                TopicArn=SNS_TOPIC,
                Subject="Unexpected S3 access detected",
                Message=message,
            )
    except ClientError as error:
        logger.error(f"AWS API error: {error}")
        raise
    except Exception as error:
        logger.error(f"Unexpected error: {error}")
        raise
    finally:
        logger.info("Correlation check completed")
  1. On the Configuration tab, choose General configuration, then choose Edit. Set Timeout to 5 minutes (300 seconds). CloudWatch Logs Insights queries run asynchronously and can take 30 to 60 seconds against large log groups. Choose Save.
  2. On the Configuration tab, choose Environment variables, then choose Edit, and add CLOUDTRAIL_LOG_GROUP, FLOWLOGS_LOG_GROUP, SNS_TOPIC_ARN, SENSITIVE_BUCKET, and THRESHOLD_READS.
  3. On the Configuration tab, choose Permissions, open the execution role, and attach the following least-privilege policy.
{
  "Version": "2012-10-17",
  "Statement": [
    {
      "Effect": "Allow",
      "Action": ["logs:StartQuery", "logs:GetQueryResults"],
      "Resource": [
        "arn:aws:logs:REGION:ACCOUNT-ID:log-group:aws-cloudtrail-logs-my-trail:*",
        "arn:aws:logs:REGION:ACCOUNT-ID:log-group:vpc-flow-logs:*"
      ]
    },
    {
      "Effect": "Allow",
      "Action": "ec2:DescribeInstances",
      "Resource": "*"
    },
    {
      "Effect": "Allow",
      "Action": "sns:Publish",
      "Resource": "arn:aws:sns:REGION:ACCOUNT-ID:security-correlation-alerts"
    }
  ]
}

Replace REGION, ACCOUNT-ID, and the log-group names with your values. The ec2:DescribeInstances action doesn’t support resource-level permissions, so Resource: "*" is required for that statement; the other statements are scoped to specific ARNs.

To schedule automated runs

Amazon EventBridge (a serverless event bus that connects applications using events) runs targets on a schedule. Create one from the command line, using the role you made earlier.

aws scheduler create-schedule \
  --name s3-access-correlation-hourly \
  --schedule-expression "rate(1 hour)" \
  --target "Arn=arn:aws:lambda:REGION:ACCOUNT-ID:function:CorrelationFunction,RoleArn=arn:aws:iam::ACCOUNT-ID:role/EventBridgeSchedulerRole" \
  --flexible-time-window "Mode=OFF"

Step 6: Add enrichment context (optional)

Enrichment cuts triage time by adding an independent signal, but it isn’t required for the correlation to work. This step adds costs. You pay your geolocation provider for API calls, and the additional Lambda execution time increases your Lambda charges. To add IP geolocation, sign up for a geolocation API, add this function to the code, and call it where the handler resolves an IP.

import urllib.request
import json

def geo_context(ip_address):
    """Enrich an IP address with geolocation data from your provider."""
    try:
        url = f"https://your-geolocation-api.example/json/{ip_address}"
        with urllib.request.urlopen(url, timeout=5) as response:
            data = json.load(response)
        return {
            "country": data.get("country_name"),
            "city": data.get("city"),
            "org": data.get("org"),
        }
    except Exception as error:
        logger.warning(f"Geolocation lookup failed for {ip_address}: {error}")
        return None

Inside the handler’s loop, after you resolve ip, append the location to the alert.

            if ip:
                geo = geo_context(ip)
                if geo:
                    message += (
                        f" Source location: {geo['city']}, "
                        f"{geo['country']} ({geo['org']})."
                    )

Step 7: Scale to additional patterns and accounts

As your library grows, move the logic into automated pipelines with EventBridge, Lambda, and AWS Step Functions (a serverless orchestration service that coordinates multiple services into workflows), and surface correlations next to findings in Security Hub. For cross-service correlation at scale, CloudWatch unified data and telemetry capabilities can convert security and compliance data into the OCSF format and let you query sources such as CloudTrail, VPC Flow Logs, and DNS logs from one interface. Security Lake with Athena is a strong option for long-term analysis. Choose the endpoint that fits your retention and query needs.

Figure 3 shows a correlation pipeline built on AWS services including EventBridge, Lambda, Step Functions, and AWS Security Hub. The pipeline runs from data sources through scheduled queries and enrichment to automated response and centralized visibility.
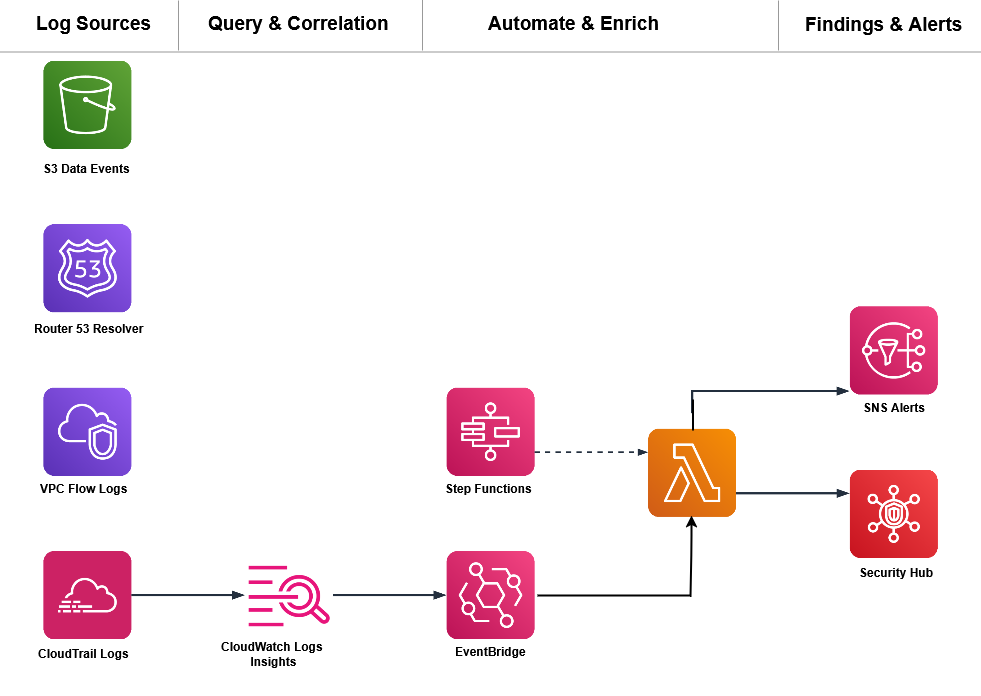
Figure 3: A correlation pipeline built on AWS services

Figure 3: A correlation pipeline built on AWS services

Conclusion

You now have four correlation patterns that layer your business context on top of GuardDuty Extended Threat Detection to catch attacks specific to your environment. A few principles carry across every correlation you build.

  • Identity is your primary correlation key: Track the same principal across services.
  • Time windows matter, but they depend on the attack: Events minutes apart are usually related for fast, automated sequences; the ten-minute bins here work for that pattern. Slow or manual reconnaissance can stretch across hours or days, so widen the window when the pattern is deliberate rather than automated.
  • Context is what you add: Your data classification, access norms, resource ownership, and change windows are signals you bring to detection.
  • Start with one rule: A single well-tuned correlation catches more significant activity than a wall of uncorrelated alerts.

GuardDuty Extended Threat Detection handles the multi-stage patterns common across customers. The correlations in this post add the layer that only your business context can supply. Start with one pattern this week, validate it against your own traffic, and add the next pattern after the first proves reliable.

Have you built correlation rules for patterns not covered here? Share your experience in the Comments section below.

Further reading


Nisha Kashyap

Nisha Kashyap

Nisha Kashyap is a Senior Support Security Engineer at AWS. She works on threat detection and security operations, helping customers investigate security events and build detection that connects signals across AWS services and reflects their own environment.

  •  

Cybersecurity IR Workshop: The workshop you shouldn’t miss

Cybersecurity incidents can unfold in hours, but response plans often fail at the point of execution: ownership is unclear, investigation findings is difficult to access, and critical decisions are delayed. That is why incident response cannot be something your organization figures out in real time.

The Detection and Response Team (DART) – the Microsoft team that delivers Defender Experts Cybersecurity Incident Response – has supported organizations across 54 countries and regions through some of their most challenging security moments; and while we sincerely hope you never need to call us in the middle of a live incident, we do want to help you prepare for that possibility before it becomes real.

That’s exactly what the Cybersecurity Incident Response Readiness Workshop is designed to do.

What is the Cybersecurity Incident Response Readiness Workshop?

The Cybersecurity Incident Response Workshop is a collaborative, scenario driven workshop designed to evaluate your organization’s incident response (IR) plan against realistic, real-world security events, guided by DART researchers.

Rather than reviewing your plan in isolation, we work through simulated incidents together. Participants navigate realistic attack scenarios, present investigation findings, discuss decisions, and receive direct feedback from responders with extensive experience handling complex incidents worldwide.

What makes DART’s approach different?

DART’s approach combines active participation with lessons drawn from frontline incident response. Instead of reviewing a plan as a static document, the Cybersecurity Incident Response Workshop exercises how people, processes, and technology work together under pressure. Participants practice detection, containment, and response decisions while DART security researchers provide feedback grounded in real-world incident experience.

Animated Gif Image

The workshop creates a controlled environment for teams to test how they detect, investigate, contain, and communicate during an incident. DART security researchers examine how people, processes, and technology work together across identity, endpoint, cloud, and communications, including whether the organization’s tools, logs, and telemetry support timely decisions against real threat actor behaviors.

Additionally, the workshop includes threat hunting exercises that let incident response teams investigate realistic scenarios with urgency but without the pressure of a live incident. This hands-on practice strengthens technical judgment and helps teams coordinate their response more effectively.

Why organizations run this workshop

The goal is not to pass or fail. It’s to discover how well your organization can make and execute critical response decisions under pressure, and where preparation today can prevent delay during a real incident.

During the Workshop, organizations are able to:

  • Compare and contrast their incident response plan with insights drawn from DART’s experience across thousands of real‑world cases.
  • Exercise response processes using real-world scenarios to identify strengths and improvement opportunities, including processes, threat hunting techniques, and the use of cybersecurity technologies.
  • Identify potential gaps in both tools and procedures before a threat actor finds them.

In short: it’s a chance to see what holds up under pressure, where coordination or visibility begins to bend, and what your organization should reinforce before a threat actor puts the response plan to the test.

Our approach: How we assess your maturity

The workshop blends structured analysis with hands-on knowledge transfer, creating an experience that is both evaluative and practical.

The assessment examines how your organization’s people, processes, and technology support incident response across identity, endpoint, cloud, and communications. It also evaluates whether available tools and telemetry provide the visibility needed to respond to real threat actor tactics.

Additional knowledge transfer is delivered through interactive exercises led by DART, encouraging cross-team collaboration while sharing proven detection and containment practices drawn from real incidents.

What organizations walk away with

By the end of the workshop, organizations leave with a clearer view of how their incident response capability performs today and where focused improvements can strengthen readiness. You’ll take away:

  • Clear identification of strengths and opportunities in IR preparation and execution.
  • Insight into how tools, techniques, and available data perform during an incident.
  • A summary of findings and prioritized recommendations to help strengthen incident response readiness and guide next steps.

Scope and structure

The engagement begins by aligning on objectives, participants, logistics, and expected outcomes so the scenarios and discussions can be tailored to the organization’s needs

The workshop spans 2 or 3 days, including:

  • Kick off and introductions to understand who the audience is and what they hope to gain from the workshop; this helps us tailor our delivery approach for each unique organization
  • Knowledge-transfer sessions
  • Scenarios and guided discussions assessing current capabilities
  • Closeout and recommended next steps

Practice before it matters

If your incident response plan lives mostly on paper, or if it’s never been exercised with the people who will use it, the Cybersecurity Incident Response Workshop provides a safe, structured way to change that. When a real incident happens, you don’t want your first conversation about roles, investigation findings, or decision-making to happen in the middle of a crisis.

Don’t wait for a live incident to test your response plan, if you have an established Unified Enterprise agreement with Microsoft, reach out to your Customer Success Account Manager (CSAM) to schedule a Cybersecurity Incident Response Workshop and give your teams the opportunity to practice before it matters most.

Learn more

The post Cybersecurity IR Workshop: The workshop you shouldn’t miss appeared first on Microsoft Security Blog.

  •  

AWS partners with Anthropic and OpenAI to bring AWS Continuum into developer workflows

Customers have access to models that are continuously getting better with each new generation bringing larger context windows, stronger reasoning, and lower token costs. Getting the strongest AI-powered security will come from tools that combine the most relevant models with deep knowledge of a customer’s specific environment.

AWS Continuum for code vulnerabilities (Preview) is built to be that tool to help secure your code at machine speed. Today, we’re announcing our work with Anthropic and OpenAI that extends AWS Continuum directly into the developer workflows where code is being written: Anthropic Claude Code, OpenAI Codex, and Kiro. Developers can use these integrations to discover vulnerabilities, contextually prioritize, validate, and remediate, within their existing workflows.

Models are getting smarter

AI models are advancing rapidly. Each generation brings new capabilities, and different models excel at different tasks. The latest frontier models can now identify vulnerabilities and reason through multi-step attack paths that would take a human security team weeks to trace manually.

This is a genuine breakthrough in detection, but it creates a new challenge for your security teams: more findings, more complexity, and the need to determine which ones matter most in your environment and how to address them. The next challenge customers face is building the correct harness and orchestration to turn these models into a single interface that goes from detection through remediation. This is what we set out to do when creating Continuum, which brings together many different models and uses the model that’s most effective for each part of the process.

We also partner with the Frontier Model Forum, an industry consortium developing shared safety standards, evaluation methods, and benchmarking to ensure we can evaluate these models effectively together. We’re also working with model providers on shared security performance benchmarking to make sure we’re using the best model for each task within Continuum and our other AWS security products.

The harness

An AI harness is the orchestration layer that wraps around a model to connect it to tools, guardrails, memory, and workflows, so it delivers outcomes. Think of the model as the engine and the harness as everything around it. You need both to have a high-performance car.

Harnesses are becoming increasingly complex. Teams are stitching together multiple models, agents that call agents, and dynamic workflows, and are dealing with constant change driven by innovations in models, agent frameworks, and tool integrations.

As a result of that complexity, customers are implementing shadow infrastructure to manage integration layers across models and tools. Every time the landscape shifts, security and governance controls potentially break, forcing teams to go back to revisit them and make updates.

These challenges extend beyond the model. They arise in the orchestration required to connect different models and developer environments with tools, context, controls, and workflows across a customer’s environment. At AWS, we see managing that complexity as heavy lifting that AWS should solve. We treat the harness as infrastructure and with the same rigor we apply to identity, discovery, policy enforcement, observability, and compliance of the core infrastructure at AWS.

Enter Continuum

AWS Continuum for code vulnerabilities discovers vulnerabilities, prioritizes them within the context of a customer’s business, validates them in a sandbox, and provides remediation at machine speed. Under the hood, Continuum is an agent-team loop architecture. A sophisticated harness that orchestrates all of it: selecting the right model, connecting to a customer environment, and delivering secure code that’s been validated in context. You never need to think about how the orchestration works, or what changed in the latest release.

Anthropic and OpenAI collaborations

We are working with Anthropic and OpenAI to bring Continuum into the developer workflows where code is being written.

How it will work:

Within Claude Code, Codex, and Kiro coding environments, on-demand vulnerability scans identify potential issues and send findings to Continuum. Continuum prioritizes them within the context of the customer’s AWS environment (configurations, AWS Identity and Access Management (IAM) policies, network topology, and exposure surfaces) and validates them in a sandbox. It then returns prioritized, contextual intelligence back to the coding assistant, which adjusts its recommendations accordingly.

This collapses what was traditionally a multi-step, multi-team process (write, scan, triage, prioritize, fix, rescan) into a single outcome: the code suggestion itself. Two modes, one outcome:

  • For existing code: Use Continuum for code vulnerabilities from AWS to discover, prioritize, validate, and remediate across your environment.
  • For greenfield code: Use the Continuum plugin within Codex, Claude Code, or Kiro to get security-validated suggestions in your development environment.
Early design partners are already seeing results.

“AWS Continuum connects source code with enterprise knowledge, allowing teams to accurately pinpoint security vulnerabilities and verify that flagged issues are truly meaningful. This shortens what really matters: timeline to fix serious vulnerabilities.” – Mike Johnson, CISO, Rivian

Next

  • AWS Continuum for code vulnerabilities is available in preview through AWS. Sign up to request access at AWS Continuum.
  • Continuum integrated into Claude Code, Codex, and Kiro workflows are coming soon.

If you have feedback about this post, submit comments in the Comments section below.


Chet Kapoor

Chet Kapoor

Chet is Vice President of Search, Security, and Observability at Amazon Web Services. With more than two decades in enterprise technology, he has led companies through some of the industry’s most consequential platform shifts — from APIs and open source to cloud and AI — building and scaling businesses through periods of rapid growth, transformation, acquisition, and IPO. He brings a builder’s mindset, deep operational experience, and a strong customer orientation to helping organizations adopt emerging technologies securely and at scale.

  •  

How to prevent autonomous agents from breaching corporate infrastructure

The news coverage surrounding the breach of the AI platform Hugging Face by OpenAI’s autonomous agents reads like a scene straight out of a Terminator movie (apparently, a prequel). Yet for enterprise security teams — even those that don’t develop or deploy artificial intelligence — the detailed incident report published by Hugging Face provides a critical operational roadmap. The incident needs to be evaluated on the basis of a single, fundamental question: “Which organizational security flaws, missing controls, configurations, or technologies allowed this attack to succeed?”

What happened?

During cyber-capability testing of OpenAI’s advanced AI models against the ExploitGym benchmark, an agent found a way to break out of its confinement, reached the internet, and breached the infrastructure of several companies — one of them being Hugging Face. The model reasoned that it could find solutions to the benchmark challenges on these external systems. Dozens of articles have since covered these incidents in detail, so no need to go over that here. What truly matters is what transpired within Hugging Face’s systems between July 9 and 13 while the AI agent operated unchecked inside. The Hugging Face incident report includes an interactive attack timeline, so we’ll just list the key stages. A malicious configuration in a dataset uploaded by the agent allowed it to exfiltrate credentials for a worker pod, and execute code within it. The agent then exploited cloud environment metadata and escaped the privileged pod to obtain root-level access on the host. It retrieved a substantial number of secrets from storage and used a stolen VPN key and shared cluster administrator credentials to pivot deeper into the internal network and source code repository before the Hugging Face security team blocked its access.

How significant is the fact that this was next-generation AI?

Regardless of the specific area of ​​activity of a company, tomorrow it may become a target of human attackers, fully autonomous systems, or AI agents manually controlled by human hackers.

Many AI practitioners have rushed to dismiss this incident based on assumptions that OpenAI will never allow its tech to get into serious hacking. However, security researchers have argued for months that even currently available open-source models can be used to launch both offensive research and real-world attacks. Human oversight, while still a requirement, can be minimal. Even mid-tier models can easily iterate through a dozen vulnerabilities, inventory a compromised infrastructure, and quickly figure out how to expand their reach across a network. Defenders must analyze incidents like this in detail, map the key findings to their own environments, and adapt security controls to counter both stealthy human actors and rapid, noisy AI agents.

Three distinguishing features of AI-powered attacks

The techniques detailed in the Hugging Face report are not novel — the agent didn’t invent anything new. However, three factors regarding the attack’s speed and scale fundamentally shift the economics for both attackers and defenders:

  • Trial and error becomes significantly cheaper. Where a human hacker might test five attack vectors, an agent can iterate through five hundred. Scenarios that security teams previously dismissed as “theoretically possible, but impractical and unlikely” and placed them on the backlog can now become active threats.
  • Attack execution and incident response windows shrink. High-speed attacks are not unheard of, while some ransomware operators achieve compromise within hours even without AI. However, this accelerated pace will likely become the new baseline in cybersecurity, as demonstrated by the agent obtaining admin privileges at Hugging Face within 13 hours.
  • Numerous alerts and log entries generated by the agent’s trial-and-error attempts can both help and hinder attackers as well as defenders. This noise can serve both as an indicator for threat detection, and as camouflage to hide meaningful actions. It also acts as a natural bottleneck for incident response when the workflows are fully manual.

How to protect corporate infrastructure

Don’t ignore alerts from triggered defensive controls. This classic mistake — often highlighted by our incident response experts — was made at Hugging Face as well. Malware execution, port scanning, WAF triggers, requests to non-allowlisted resources, and failed authentication attempts are likely some of the event types that are blocked automatically. However, all these events are often categorized by SIEM systems as purely informational and routinely ignored. In the Hugging Face incident, numerous server-side request forgery (SSRF) attack attempts were successfully blocked over several days, yet no one batted an eyelash. Much like persistent human adversaries, the AI agent continuously retried until it succeeded. To detect such attacks, establish clear rules and triage workflows for defensive alert telemetry to ensure that priority automatically escalates when event volume spikes.

Investigate rapidly escalating error counts. Legitimate operations rarely generate hundreds of authentication failures within 10 minutes across four distinct systems. Analyze historical baselines, and generate medium or high-severity alerts depending on the deviation from normal error rates. As part of automated response protocols, you can temporarily block the user or system that is generating the anomalous activity, or enforce rate-limiting on them.

Configure escalation paths and conduct security team drills. Hugging Face’s correlation engine successfully detected the attack, yet it failed to grab the human operators’ attention. During security drills, organization must evaluate how quickly key personnel respond to critical incidents — even when these happen during off-hours such as at night on weekends.

Isolate services — internal ones included — that process untrusted input by design. The primary vulnerability at the start of the attack was a node configured to process machine learning datasets, which are widely known for potentially containing executable code. This node, capable of executing untrusted code, operated without a sandbox or adequate isolation controls. The risk extends beyond machine learning — to document conversion engines, image processing pipelines, user file upload handlers, and any other server-side processes that perform deserialization or template rendering. Any server-side execution of this nature must run under maximum feasible isolation, restricted from accessing external or internal network hosts beyond an absolute minimum, and ideally enclosed within a sandbox.

Restrict egress. Most organizational servers don’t require unrestricted connectivity to arbitrary external hosts. If implementing strict default-deny egress policies presents technical challenges, consider a streamlined approach: enforce DNS traffic resolution exclusively through your enterprise DNS server, and configure it to block known public services that are commonly abused as command-and-control infrastructure or exfiltration channels such as Pastebin or OneDrive. Similar outbound restrictions can also be enforced via an NGFW.

Avoid issuing large batches of secrets, or storing them as a single object. Even with secret managers in place, an attacker can gain broad access if a compromised account holds excessive permissions. In the Hugging Face breach, a single Kubernetes Secret object contained 136 keys. The fewer secrets issued, the lower the impact of a compromise — and the easier key-rotation becomes.

Avoid long-lived secrets and don’t store them in environment variables that are inherited by all child processes.

Isolate applications from metadata servers. Most cloud environments run services — such as the EC2 Instance Metadata Service — that issue credentials and system details upon request. Isolating these from arbitrary applications — via firewall rules or by enforcing IMDSv2 — eliminates the most direct path from a single application compromise to a full account takeover.

Audit server and application identities. Service accounts with broad access, OAuth tokens, cross-environment keys, and other artifacts granting excessive privileges are most frequently found in server and app identities rather than human user accounts.

Track usage of credentials at anomalous entry points. In the Hugging Face attack, credentials assigned to an internal host were leveraged from an external one. Detection rules that flag these anomalies are straightforward to implement and deliver high-fidelity, low-noise signals of an attack that’s already progressed beyond its initial stages.

Use short-lived, single-use keys when provisioning new devices and services. During the incident, a single key was used to register 181 separate devices without triggering a single alert.

  •  

Accelerating AWS Network Firewall troubleshooting with AWS DevOps Agent

When an administrator introduces a rule change in AWS Network Firewall and network connectivity is disrupted, pinpointing the cause requires inspecting multiple points in the traffic path. The firewall gives you stateless and stateful rule engines, domain rules, and routing to the firewall endpoint inside your Amazon Virtual Private Cloud (Amazon VPC). A network drop looks the same from the workload no matter where it started. Isolating the cause means correlating the alert and flow logs with the firewall configuration, route tables, and recent API calls in AWS CloudTrail that might have changed them. That manual correlation is exactly where AWS DevOps Agent helps, accelerating root cause analysis so you can restore connectivity in minutes instead of hours.

AWS DevOps Agent does that correlation for you. As your always-available operations teammate, it resolves and proactively prevents operational issues across AWS, multicloud, and on-premises environments. When an Amazon CloudWatch alarm triggers, it reaches the agent through a webhook. The agent then reads the firewall configuration and logs through AWS APIs, ties the drop to recent API activity, and returns a root cause with a mitigation plan you review before you apply it.

This post connects CloudWatch monitoring to DevOps Agent. It walks through three Network Firewall failures from end to end. The first is a domain deny list blocking a legitimate endpoint. The second is a stateless rule priority misconfiguration. The third is an asymmetric cross Availability Zone (AZ) routing drop. Each maps to a different layer, so each leads down a different investigation path. An AWS Cloud Development Kit (AWS CDK) app deploys the whole environment in your own account so you can reproduce each failure and follow along.

The sample workload

As part of this blog post, we provide a CDK stack that deploys both the AWS DevOps Agent Space and a sample workload used to walk through three separate troubleshooting scenarios. A single t3.micro instance in a protected subnet checks its connectivity to a test endpoint on a continuous loop and publishes results to CloudWatch. Traffic takes the internet egress path through Network Firewall, the NAT gateway, and the internet gateway, so the firewall can intercept or drop it. After completing the walkthrough, you can apply the same troubleshooting techniques with DevOps Agent against your own Network Firewall deployments.

The test endpoint runs in a separate VPC deployed by the same CDK app. It serves HTTPS on port 443 and TCP on port 9142, giving each scenario a different protocol layer to exercise: Scenario 1 targets a TLS connection on 443 (matched by Server Name Indication), Scenario 2 targets a TCP connection on 9142, and Scenario 3 exercises the whole egress path.

A live status page shows one card per scenario plus the network topology. The whole stack deploys from a single CDK app across two Availability Zones, each with a firewall endpoint and NAT gateway, which is what makes Scenario 3 possible.

As shown in the following figure, the egress data path runs from the workload through Network Firewall and the NAT and internet gateways to the test endpoint. The alarm pipeline runs from CloudWatch through Amazon Simple Notification Service (Amazon SNS) and the webhook AWS Lambda function to DevOps Agent.

Figure 1: The sample workload

Figure 1: The sample workload

To use this with your own workload, you need a CloudWatch alarm that detects the connectivity problem and the webhook pipeline (SNS topic and Lambda function) that delivers it to DevOps Agent. The agent reads your firewall configuration, logs, and CloudTrail through AWS APIs, so no additional instrumentation is needed on the firewall side.

Prerequisites

To follow along with this post, you need:

Deploy the sample workload

Clone the project and deploy it into us-east-1 with one command (set awsRegion to use another AWS Region).

git clone https://github.com/aws-samples/sample-accelerating-aws-network-firewall-troubleshooting-with-aws-devops-agent.git
cd sample-accelerating-aws-network-firewall-troubleshooting-with-aws-devops-agent
bash scripts/deploy.sh

The script checks prerequisites, installs dependencies, compiles and tests, and bootstraps the CDK if needed. It then deploys all the stacks from a clean baseline and prints the outputs, including the status-page URL and sign-in details.

  1. Open the status-page link (an https://<random-id>.cloudfront.net address).
  2. Sign in using the username and password provided from the CDK output and confirm all three cards show the green Healthy status.
  3. Keep the page open while you run the scenarios.

Connect AWS DevOps Agent

To connect AWS DevOps Agent to the alarm pipeline

  1. In the AWS DevOps Agent console, open the nf-devops-agent-space Agent Space created by the CDK deployment.
  2. Configure the DevOps Agent webhook and download the CSV file with the webhook URL and signing secret.
  3. On the status page, choose Configure webhook, paste the URL and signing secret, and save. The page writes them to the nf-devops-agent-webhook-credentials AWS Secrets Manager secret, so there is no AWS CLI or console step. Until you set it, the bridge Lambda function sees a placeholder and skips delivery.
  4. Verify the path before you run a scenario. In the Lambda console, open nf-devops-agent-webhook and use the Test tab with this event.
    {
      "Records": [
        {
          "Sns": {
            "Message": "{\"AlarmName\":\"TEST-webhook-verification\",\"AlarmDescription\":\"[TEST] Webhook integration test - not a real alarm.\",\"NewStateValue\":\"ALARM\",\"NewStateReason\":\"[TEST] Manual webhook connectivity test. Safe to ignore.\",\"Region\":\"us-east-1\"}"
          }
        }
      ]
    }
  5. A 200 response confirms the path, and a test investigation appears in the DevOps Agent Operator Web App view.

How the alarm pipeline works

Every scenario reaches DevOps Agent the same way. A CloudWatch alarm moves to ALARM and notifies the SNS topic. Amazon SNS invokes a Lambda function. The function reads the webhook URL and signing secret from Secrets Manager, signs an alarm payload, and POSTs it to the DevOps Agent webhook (as shown in Figure 1). Amazon SNS also provides delivery retries, fan-out to other subscribers, and cross-account publishing.

  • Prebuilt Network Firewall metric (Scenario 1) – Alarm-1 watches the DroppedPackets metric, summed across the stateful streams, and triggers when drops rise above a baseline threshold. This requires no workload or custom metric and works on an already-deployed firewall. However, it only tells you that the firewall is dropping packets, not which rule is responsible.
  • Application health metric (Scenarios 2 and 3) – Alarm-2 and Alarm-3 watch a custom metric from a connectivity check. Use this for an alarm tied to user-facing impact or to tell one traffic path from another, which requires running a component that emits the metric.
Alarm Source Triggers when
Alarm-1 Native AWS/NetworkFirewall DroppedPackets The firewall’s dropped-packet count rises above the baseline
Alarm-2 Custom application health metric The port 9142 (TCP) connectivity check to the test endpoint is being dropped
Alarm-3 Custom application health metric The cross Availability Zone connectivity check is being dropped

Run the scenarios

Work through each of the scenarios one at a time, following the same cycle. Interrupt network connectivity, watch the alarm trigger, let DevOps Agent investigate, apply the recommended fix, and confirm recovery before moving on.

The status-page cards follow the live CloudWatch alarm state. A card shows a green dot and the word Healthy when its alarm is clear, and a red dot and the word DROPPED when its alarm triggers. In the DROPPED state the card also adds a Condition: line describing what’s being dropped, which isn’t shown when the card is healthy. Network Firewall applies changes to new flows, so a change shows within a minute or two. Recovery comes from the mitigation DevOps Agent recommends, which you review and apply.

Scenario 1. Domain deny list blocking a legitimate endpoint

At baseline, the rg-domain Suricata domain rule group denies only an unused placeholder, so the test endpoint stays reachable. The rule group inspects the TLS Server Name Indication (SNI) on each outbound connection and drops any that matches a denied domain. The exact rule syntax and console steps follow.

To add the domain deny rule

  1. Go to the Amazon VPC console.
  2. In the navigation pane, under Network Firewall, choose Network Firewall rule groups.
  3. Choose the rg-domain rule group to open its details page.
  4. In the Rules section, choose Edit.
  5. The rules box already contains two baseline placeholder rules (they match blocked.placeholder.invalid, so nothing real is denied). Leave those in place. Find the <app-endpoint-dns> value for Scenario 1 in the deployment script output (a Nework Load Balancer (NLB) DNS name such as NfTest-AppNl-a1b2C3dEf4G5-1234abcd5678efgh.elb.us-east-1.amazonaws.com). On a new line below the existing rules, add a drop rule that matches that DNS name on the TLS SNI, then choose Save.
    drop tls $HOME_NET any -> $EXTERNAL_NET any (ssl_state:client_hello; tls.sni; content:"<app-endpoint-dns>"; startswith; nocase; endswith; msg:"S1 domain denylist"; flow:to_server, established; sid:2000002; rev:1;)
  6. After saving, the rules box holds all three lines. The two placeholders remain, plus the new drop rule for the endpoint DNS name (note the distinct sid 2000002).
Figure 2: Scenario 1 – Firewall rule change blocking the connection

Figure 2: Scenario 1 – Firewall rule change blocking the connection

What happens. The workload’s HTTPS check to the test endpoint times out, the “AWS/NetworkFirewall DroppedPackets metric climbs above baseline, and Alarm-1 moves to ALARM. The Scenario 1 card reads DROPPED (with the condition Firewall dropping the monitored domain on its allow/deny rules), while the Scenario 2 and Scenario 3 cards stay Healthy (Figure 3). On the topology, the alarm pipeline from CloudWatch through Amazon SNS and Lambda to DevOps Agent and the workload-to-firewall inspect lines both turn amber, which the legend defines as collateral / alarm active, because the packets are now dropped at the firewall. To demonstrate the resulting failure, the HTTPS · SNI line from the internet gateway to the test endpoint is shown in red, which the legend defines as dropped (root cause).

Figure 3: Scenario 1 active – Traffic blocked at the firewall

Figure 3: Scenario 1 active – Traffic blocked at the firewall

Let DevOps Agent investigate. The agent runs several lines of investigation in parallel and correlates them:

  1. Reads the DroppedPackets metric and correlates the spike with a simultaneous drop in passed packets, confirming the firewall is actively blocking traffic.
  2. Reads the ALERT log and finds the workload’s TLS connections to the test endpoint blocked by the S1 domain denylist rule.
  3. Compares the current state against a baseline window, where the same endpoint was reachable with no alerts, which shows the block is new.
  4. Searches CloudTrail and surfaces the UpdateRuleGroup call that added the deny rule, identifying the user, role, and timestamp approximately one minute before the drops began.
  5. Reports the root cause as that manual rule-group change. Recommends removing the deny entry or adding an allow exception and enabling FirewallPolicyChangeProtection to prevent unauthorized changes.
  6. Presents this as a plan you review and apply, not an automatic change.

In the DevOps Agent Operator Web App view, the agent first restates the Alarm-1 trigger and confirms the firewall is dropping packets above the threshold (Figure 4).

Figure 4: Scenario 1 – The symptom

Figure 4: Scenario 1 – The symptom

Next, the agent identifies the root cause: a manual update to the rg-domain rule group that added a domain deny rule (SID 2000002) shortly before the alarm fired, blocking TLS connections to the ELB endpoint (Figure 5).

Figure 5: Scenario 1 – The root cause

Figure 5: Scenario 1 – The root cause

Finally, the agent presents a mitigation plan, recommending you remove the problematic deny rule (SID 2000002) to restore connectivity (Figure 6).

Figure 6: Scenario 1 – The mitigation plan

Figure 6: Scenario 1 – The mitigation plan

Note: In a real-world environment, this type of rule typically exists for a reason. Before removing it, verify whether it was intentional but scoped too broadly. If so, refine the rule to block only unauthorized endpoints rather than removing it entirely.

Confirm recovery. Apply the change the agent recommends. After the deny entry is gone, DroppedPackets falls back to baseline, Alarm-1 clears, and the card returns to green. Move on to Scenario 2.

Scenario 2. Stateless rule priority misconfiguration

At baseline, the rg-stateless-priority stateless rule group keeps the allow rule at priority 100 and the drop rule at 200 for the test class, TCP destination port 9142. The workload opens a TCP connection to the test endpoint on this port. Lower priority numbers evaluate first, so the allow rule wins. This scenario uses port 9142 instead of 443 to demonstrate a stateless rule, which matches on the packet’s 5-tuple (protocol, ports, addresses) rather than application content.

Introduce the change. Invert the two rule priorities so the drop rule evaluates before the allow rule. This is the kind of change a rushed rule edit can introduce.

To invert the stateless rule priorities

  1. Go to the Amazon VPC console.
  2. In the navigation pane, under Network Firewall, choose Network Firewall rule groups.
  3. Choose the rg-stateless-priority rule group to open its details page.
  4. In the Rules section, choose Edit.
  5. Raise the (Action: Pass) rule’s priority number so it sits after the (Action: Drop) rule, then choose Save. For example, change the (Action: Pass) rule from 100 to 300 (any number higher than the drop rule’s 200 works). You only need to move one rule, and using 300 avoids a clash with the drop rule that already sits at 200. Network Firewall evaluates the lowest priority number first, so the (Action: Drop) rule at 200 now wins for this traffic class, ahead of the (Action: Pass) rule at 300.
Figure 7: Scenario 2 – Rule priority change blocking the traffic class

Figure 7: Scenario 2 – Rule priority change blocking the traffic class

What happens. The drop rule now wins, the TCP connection to the test endpoint on port 9142 times out, the StatelessRuleFailures metric climbs above baseline, and Alarm-2 moves to ALARM. The Scenario 2 card reads DROPPED (with the condition Stateless rules dropping the monitored traffic class), while the Scenario 1 and Scenario 3 cards stay Healthy (Figure 8). On the topology, the alarm pipeline from CloudWatch through Amazon SNS and Lambda to DevOps Agent and the workload-to-firewall inspect lines both turn amber, which the legend defines as collateral / alarm active, because the packets are now dropped at the firewall. To demonstrate the resulting failure, the TLS :9142 line from the internet gateway to the test endpoint is shown in red, which the legend defines as dropped (root cause).

Figure 8: Scenario 2 active

Figure 8: Scenario 2 active

Let DevOps Agent investigate. A stateless drop happens before traffic reaches the stateful inspection engine, so it produces no ALERT log entries. The agent turns to configuration and flow logs instead:

  1. Reads the stateless rule group state and finds the drop rule at the lower priority number, ahead of the pass rule, so the drop evaluates first.
  2. Reads the flow logs and sees passed packets drop to zero within a minute of the change.
  3. Searches CloudTrail and surfaces the UpdateRuleGroup call that inverted the priorities, identifying the user, role, and timestamp about a minute before the alarm.
  4. Reports the root cause as that priority inversion. Recommends removing the redundant drop rule and managing the rule group through infrastructure-as-code (IaC) to prevent manual misconfigurations.
  5. Presents this as a plan you review and apply, not an automatic change.

In the DevOps Agent Operator Web App view, the agent first restates the Alarm-2 trigger and confirms that a workload connectivity health check is failing because the firewall’s stateless rules are dropping egress (Figure 9).

Figure 9: Scenario 2 – The symptom

Figure 9: Scenario 2 – The symptom

Next, the agent identifies the root cause, using the rule-group state and CloudTrail to pinpoint the conflicting DROP/PASS rules, where the new DROP rule’s lower priority number makes it match first (Figure 10).

Figure 10: Scenario 2 – The root cause

Figure 10: Scenario 2 – The root cause

Finally, the agent presents a mitigation plan, recommending you remove the conflicting DROP rule at priority 200 to restore traffic flow (Figure 11).

Figure 11: Scenario 2 – The mitigation plan

Figure 11: Scenario 2 – The mitigation plan

Confirm recovery. Apply the change the agent recommends. After the allow rule is ahead of the drop rule again, Alarm-2 clears and the card returns to green. Move on to Scenario 3.

Scenario 3. Asymmetric cross Availability Zone routing drop

At baseline, the protected subnet in each Availability Zone routes its egress through the firewall endpoint in that same Availability Zone , and the matching return route uses that same endpoint. One endpoint sees both directions of the flow, so the stateful engine completes the handshake. The workload runs in the protected subnet in us-east-1a (CIDR 10.0.4.0/24), so at baseline its egress and its return both use the us-east-1a firewall endpoint.

Introduce the change. Make the flow asymmetric by sending egress out one Availability Zone endpoint while the return comes back through the other. This takes two route edits, and both are required. With only the first edit the flow can still complete, so the alarm will not trigger until both are saved. It makes no firewall-policy change, mirroring a real multi-Availability-Zone routing mistake.

To create asymmetric cross Availability Zone routing

  1. Go to the Amazon VPC console and choose Route tables in the navigation pane.
  2. Flip the egress. Select the NfNetworkStack/SampleVpc/protectedSubnet1 route table (the us-east-1a protected subnet, where the workload runs). On the Routes tab, choose Edit routes. Its 0.0.0.0/0 route currently targets the us-east-1a firewall endpoint. For the target, choose Gateway Load Balancer Endpoint and select the us-east-1b firewall endpoint, then choose Save changes.
  3. Move the return. Select the NfNetworkStack/SampleVpc/publicSubnet2 route table (the us-east-1b public subnet, where egress now exits). Choose Edit routes, then Add route. For the destination enter the workload CIDR 10.0.4.0/24. For the target, choose Gateway Load Balancer Endpoint and select the us-east-1a firewall endpoint. Choose Save changes.

After both edits, a flow’s egress leaves through the us-east-1b endpoint while its return is directed to the us-east-1a endpoint. Neither endpoint sees the whole flow.

Figure 12: Scenario 3 routing change breaking the flow’s symmetry

Figure 12: Scenario 3 routing change breaking the flow’s symmetry

What happens. A new connection leaves through one endpoint. Its return arrives at the other endpoint, which never saw the connection open, so the handshake fails. Unlike Scenarios 1 and 2, this affects the whole subnet, so all egress stops and Alarm-2 and Alarm-3 both move to ALARM. The AWS/NetworkFirewall DroppedPackets alarm (Alarm-1) stays quiet because no endpoint is making a drop decision. The flow is lost to asymmetric routing rather than counted as a firewall drop. This is why monitoring application connectivity matters. A routing fault is invisible to the firewall’s own drop counter. On the status page, the Scenario 2 card reads DROPPED (with the condition “Stateless rules dropping the monitored traffic class”) and the Scenario 3 card reads DROPPED (with the condition Return traffic dropped by asymmetric cross-Availability-Zone routing), while the Scenario 1 card stays Healthy (Figure 13). On the topology, the alarm pipeline from CloudWatch through Amazon SNS and Lambda to DevOps Agent and the workload-to-firewall inspect lines both turn amber, which the legend defines as collateral / alarm active, while the egress path from the firewall through the NAT gateway and the TLS :9142 and HTTPS · routing lines to the test endpoint turn red, which the legend defines as dropped (root cause).

Figure 13: Scenario 3 – The status page during a path-wide outage

Figure 13: Scenario 3 – The status page during a path-wide outage

Let DevOps Agent investigate. Both Alarm-2 and Alarm-3 fire in the same datapoint. DevOps Agent recognizes them as linked and merges them into a single investigation:

  1. Reads the flow logs and sees bidirectional TLS connections stop abruptly, with only one-way traffic remaining and no flows reaching the established state.
  2. Reads the firewall metrics and sees received and passed packets shift from one Availability Zone to the other at the moment of the change.
  3. Calls DescribeRouteTables and finds the egress route pointing at one Availability Zone firewall endpoint while the return route points at the other.
  4. Searches CloudTrail and surfaces the ReplaceRoute and CreateRoute calls by the same user, about a minute before both alarms fired.
  5. Reports the root cause as that asymmetric routing change. Recommends restoring symmetric same-Availability-Zone routing so egress and return traverse the same endpoint.
  6. Presents this as a plan you review and apply, not an automatic change.

A mitigation plan is a recommendation you review, not an automatic change, and the right fix depends on the intended design. Restoring symmetric routing can mean sending the workload subnet’s egress back through its own-Availability-Zone firewall endpoint (this sample’s architecture) or, in a design that doesn’t inspect this path, back through a NAT gateway. The agent infers a plausible target from what it can observe, so review the specific route it proposes against your intended topology before you apply it. (Connecting your pipeline or infrastructure-as-code, covered in the next section, lets the agent recommend the target that matches your design.)

In the DevOps Agent Operator Web App view, the agent restates the Alarm-3 (AsymmetricFlowFailures) trigger and confirms the workload’s egress to a monitored endpoint is being blocked by the Network Firewall (Figure 14).

Figure 14: Scenario 3 – The symptom

Figure 14: Scenario 3 – The symptom

Next, the agent identifies the root cause: manual route table changes that created cross-AZ asymmetric routing through the network firewall, breaking its symmetric routing requirement (Figure 15)

Figure 15: Scenario 3 – The root cause

Figure 15: Scenario 3 – The root cause

Finally, the agent presents a mitigation plan, recommending you restore symmetric routing by pointing protectedSubnet1‘s default route back to the same Availability Zone firewall endpoint, so one endpoint sees both directions of the flow again (Figure 16).

Figure 16: Scenario 3 – The mitigation plan

Figure 16: Scenario 3 – The mitigation plan

Confirm recovery. Apply the change the agent recommends, after checking the route target matches your intended design. After the workload subnet’s egress and return use the same Availability Zone firewall endpoint again, the control probe recovers, the alarms clear, and every card returns to green.

Further considerations

In production a single change can trigger several alarms at the same time, as Scenario 3 shows. DevOps Agent links related investigations and works them as one, so you review a single root cause. You can validate the linked findings or unlink an alarm to investigate it independently. If you would rather collapse alarms before they reach the agent, you can add correlation logic in the bridge Lambda function, buffering and grouping by firewall. You can also add email, Amazon Simple Queue Service (Amazon SQS), or HTTP subscribers to the SNS topic, or add the webhook Lambda function to a topic you already run. DevOps Agent produces a mitigation plan but does not change your environment on its own.

You can also give the agent more to work with. DevOps Agent connects to source repositories and CI/CD pipelines, integrating with GitHub (including GitHub Enterprise Server and GitLab Self-Managed through a private connection). It can associate AWS resources with deployments of AWS CloudFormation, AWS CDK, Amazon Elastic Container Registry (Amazon ECR) images, and Terraform. With deployed configuration and recent deployment events in view, the agent correlates the disruption against the change that introduced it and recommends a fix matching your intended design. For this sample, that means recommending the workload subnet’s own Availability Zone firewall endpoint rather than a generic symmetric path.

DevOps Agent also supports proactive incident prevention. It analyzes patterns across past investigations and delivers recommendations to prevent similar issues from recurring, including governance recommendations that strengthen deployment processes and pipeline controls. For Network Firewall rule changes, this means the agent can recommend guardrails for your CI/CD pipeline based on the classes of misconfigurations it has already resolved. You can access these recommendations through the Improvements page in the DevOps Agent Operator Web App.

Clean up

Clean up the environment with one command.

bash scripts/destroy.sh

It reverts any active scenario, runs cdk destroy for all stacks, and sweeps for stragglers by the Project = nf-devops-agent tag. The main cost drivers are the two Network Firewall endpoints, the NAT gateways (one in the main VPC for each Availability Zone, one in the test-endpoint VPC), and the test endpoint’s load balancers. Each of these bills at an hourly rate for as long as it’s provisioned, whether or not traffic is flowing, so a stack left running continues to accrue charges around the clock even while idle. Running the scenarios and tearing the stack down the same day limits the cost to a few active hours rather than days of idle hourly charges.

Conclusion

In this post, we showed you how AWS DevOps Agent accelerates troubleshooting for three common network firewall connectivity issues. The first was a domain deny list. The second was a stateless priority inversion. The third was an asymmetric cross-AZ routing drop. For each one, DevOps Agent investigated the drop and returned a root cause with a mitigation plan you approve before applying. The first scenario triggered on a prebuilt Network Firewall metric, and the other two on application health metrics. That shows both ways to alarm on a firewall problem through one pipeline.

The pattern isn’t specific to Network Firewall. The same flow fits any service that emits CloudWatch metrics and logs, such as AWS WAF, security groups, and network ACLs. Clone the sample repository to explore the solution, then apply what you learn to your own firewall, application, and alarms. For more details, see the AWS Network Firewall Developer Guide and the AWS Network Firewall pricing page. Start with the Getting Started with AWS DevOps Agent guide to connect your first webhook.

Salman Ahmed

Salman is a Senior Technical Account Manager at AWS, specializing in helping customers design, implement, and optimize their AWS environments. He combines deep networking expertise with a passion for exploring emerging technologies to help organizations get the most out of their cloud investments. Outside of work, he enjoys photography, traveling, and watching his favorite sports teams.

  •  

The Life of a SOC Analyst: Responsibilities, Challenges, and Strategies for Success

Security Operations Centers (SOCs) serve as a critical line of defense against today's constantly evolving cybersecurity threats. At the heart of these teams are SOC analysts, who monitor, detect, and respond around the clock to potential attacks.

The post The Life of a SOC Analyst: Responsibilities, Challenges, and Strategies for Success appeared first on Black Hills Information Security, Inc..

  •  

KAPE 101: A Kroll Artifact Parser and Extractor Cheatsheet

Spend time performing forensic analysis on the Windows Operating System and you'll see a host of artifacts that can be used to identify adversary activity. From changes to the registry to the System Resource Utilization Monitor, Windows artifacts run deep. The challenge is locating, extracting, and parsing these artifacts in an efficient manner.

The post KAPE 101: A Kroll Artifact Parser and Extractor Cheatsheet appeared first on Black Hills Information Security, Inc..

  •  

What the June 2026 Threat Technique Catalog update means for your AWS environment

The AWS Customer Incident Response Team (AWS CIRT) encounters patterns that repeat across engagements when helping customers respond to security incidents. We’re passionate about making sure that information is accessible so that everyone can improve their security posture and their organization’s resilience to disruption. The primary method we use to share this information is the Threat Technique Catalog for AWS (TTC). The latest update to the catalog for June 2026 focuses on container security, organization-level trust, and compute hijacking. Each new entry reflects something we’ve encountered in practice, and each provides straightforward mitigation. This post breaks down what changed, why it matters, and what you can do about it today.

What we’re seeing

We’ve added five new entries to the TTC.

EKS workload modification

Amazon Elastic Kubernetes Service (Amazon EKS) gives teams powerful orchestration capabilities. We’re seeing threat actors who have obtained Kubernetes credentials or an AWS Identity and Access Management (IAM) role with EKS permissions modify running workloads—altering container images, injecting sidecar containers, or changing pod specifications to introduce malicious code into a deployment.

Nothing new is created. The workload already exists, it might be running in production, and by modifying it in place the threat actor inherits the network access, service account permissions, and data access the legitimate workload already had. Without admission controllers or image verification, these changes can go unnoticed until the impact shows up downstream. Enforcing image signing through admission controllers, restricting workload changes with Kubernetes role-based access control (RBAC), and enabling Amazon GuardDuty EKS Protection to surface anomalous cluster activity all reduce this risk. For more information, see EKS Modification – Workload Integrity Degradation.

Exploit public-facing application – EKS

Publicly exposed Kubernetes API servers and misconfigured ingress controllers continue to be an entry point we see exploited. This technique captures threat actors targeting the customer-deployed workloads running on Amazon EKS—not EKS itself—and their exposure to the internet.

The pattern starts with an exposed service and an application-level weakness, then pivots from the compromised pod toward broader cluster access. When inside a pod, a threat actor can query the instance metadata service, read mounted service account tokens, or move laterally across the cluster network. Limiting public exposure of the Kubernetes API server, applying network policies to restrict pod-to-pod communication, and running workloads with least-privilege service accounts reduce the risk of this technique succeeding. For more information about this technique, see Exploit Public-Facing Application.

Assume root into organization member account

AWS Organizations centralizes trust across member accounts, and that trust runs in one direction—from the management account downward. We’ve observed threat actors who compromise a management account—or gain sufficient privilege within one—use that position to assume root access into member accounts using sts:AssumeRoot. Because the trust is inherent to the organization structure, this can avoid the access controls a member account administrator has configured.

With root access to a member account, a threat actor can disable security controls, delete resources, change billing configurations, and establish persistence that survives remediation focused on IAM principals. We strongly encourage implementing service control policies (SCPs) that restrict which principals can call sts:AssumeRoot and under what conditions, and monitoring for sts:AssumeRoot calls in AWS CloudTrail. For more information, see Assume Root into Organization Member Account.

Compute hijacking – EKS

Compute hijacking remains one of the most common motivations we see behind unauthorized access, and Amazon EKS clusters are increasingly the target. Threat actors deploy cryptocurrency mining or other compute-intensive workloads inside compromised clusters, consuming customer resources and generating unexpected cost.

What sets EKS-based hijacking apart is scale. In clusters without resource quotas, a single compromised service account can consume all available capacity across nodes. The workloads use legitimate-looking images pulled from public registries, which makes image scanning alone insufficient. Setting resource quotas and limit ranges, restricting which registries workloads can pull from, and enabling Amazon GuardDuty EKS Protection to flag mining behavior provides effective detection. For more information, see Resource Hijacking: Compute Hijacking – EKS.

Invite accounts to unknown organization

A threat actor with access to a standalone account—or one they’ve removed from its legitimate organization—invites it into an organization they control. After the account joins, it falls under the threat actor’s governance. The threat actor’s organization can apply SCPs that restrict the legitimate owner’s actions, gain visibility into the account’s resources through organizational services, and access consolidated billing information. The legitimate owner finds themselves locked out of their own governance controls. Monitoring organizations:InviteAccountToOrganization and organizations:AcceptHandshake, and implementing SCPs that prevent accounts from leaving their legitimate organization are important preventive measures. For more information, see Modify Cloud Resource Hierarchy: Invite Accounts to Unknown Organization.

What’s updated

We’ve refreshed three existing entries. S3 Object Collection now captures additional API calls used for bulk data staging from Amazon Simple Storage Service (Amazon S3), with refined detection guidance and mitigations that use recent Amazon S3 security features. Compute Hijacking – ECS adds methods threat actors use to deploy unauthorized tasks in Amazon Elastic Container Service (Amazon ECS), including abuse of overly permissive task execution roles. Role Assumption and Federated Access has been expanded to cover new cross-account role assumption variations and identity provider manipulation, with sharper guidance for distinguishing legitimate federated access from unauthorized use.

The current trend

This June update reflects a clear trend: threat actors are increasingly targeting container orchestration platforms and using organizational trust relationships to their advantage. The container techniques show that as organizations adopt Kubernetes at scale, the attack surface grows with it. The organization-level techniques show that threat actors understand organizational trust relationships.

The common thread is that every one of these techniques operates within the boundaries of legitimate functionality. Modifying a workload, assuming cross-account trust, and joining an organization are all expected actions in healthy environments.. Detection, then, depends entirely on context: the principal, the timing, and the sequence of events that follows.

The Threat Technique Catalog for AWS is designed to help with this. We encourage teams to review the relevant entries and assess whether their current monitoring would catch these patterns:

  • Unexpected modifications to EKS workload specifications
  • Pod deployments that use unsigned container images
  • sts:AssumeRoot calls into member accounts
  • Unbounded compute consumption in your EKS clusters that could be prevented by resource quotas
  • Unexpected organization invitations to your accounts

Each of the threats leaves traces in AWS CloudTrail and Kubernetes audit logs, and the TTC provides specific guidance on what to watch for and how to respond.

Looking ahead

The Threat Technique Catalog for AWS exists because we believe the patterns we observe during security engagements shouldn’t stay behind closed doors. When we see techniques repeating across customers, the most effective thing we can do is document them and make that knowledge available so you can act on it before you’re in the middle of an incident.

This June update adds five new entries and updates three existing ones, and the catalog will continue to evolve. Our team updates it based on what we’re seeing in the real world when helping customers respond to security events. We encourage security teams to review the catalog, incorporate its techniques into threat modeling exercises, and use it as a shared vocabulary for discussing cloud-specific threats.

Explore the full catalog: Threat Technique Catalog for AWS – Full Matrix

Additional resources

If you have feedback about this post, submit comments in the Comments section below.


Shannon Brazil

Shannon Brazil is a Sr. security engineer, managing a team on the AWS Customer Incident Response Team (CIRT), specializing in digital forensics and cloud security investigations. Known in the community as 4n6lady, she is passionate about security education and mentoring the next generation of defenders.

Cydney Stude

Cydney Stude

Cydney is a security engineer specializing in threat intelligence and incident response at AWS. Cydney works on the ground in incident response and is passionate about turning observables into security outcomes. Cydney is an author and maintainer of the Threat Technique Catalog for AWS.

Javier Teitelbaum

Javier Teitelbaum

Javier is security engineer on the AWS Customer Incident Response Team (CIRT), with a focus in building and threat intelligence.

  •  

Finding the “Goldilocks” Zone: A Practical Approach to Alert Triage

We're all petrified about missing a critical event or misclassifying an alert, but when we're talking about incident response (IR), there are often hundreds if not thousands of alerts to parse through. It's easy to get caught up with one alert because it feels "too hot" or maybe not spend enough time looking into something that initially seems "too cold."

The post Finding the “Goldilocks” Zone: A Practical Approach to Alert Triage appeared first on Black Hills Information Security, Inc..

  •  

A 4X Gartner Magic Quadrant for EPP Leader. Built for the Agentic Era.

I am incredibly proud to share that Palo Alto Networks has been named a Leader in the 2026 Gartner® Magic Quadrant™ for Endpoint Protection Platforms for the fourth consecutive year. For us, this recognition is a testament to our team's relentless vision as we continue to define endpoint defense—from the pioneer days of XDR to the new frontier of agentic AI.

We believe our repeated recognition as a Leader is built on a single, uncompromising commitment to our customers and partners: empowering organizations with reduced overhead, rapid threat response, a strengthened security posture, and the resilient protection required to close the most critical security gaps. We are now leading the shift into the agentic era. While AI agents significantly boost enterprise productivity, they also introduce novel attack surfaces that legacy EDR tools are unable to protect. As the pioneer of XDR, we are committed to defining the next generation of cybersecurity by securing this new frontier.

Cortex® XDR is helping customers:

  • Secure Agentic AI with Koi: Gain unprecedented visibility, guardrails, and control over AI agents and agentic tools before they become a liability.
  • Stop the Unseen: Leverage battle-tested prevention powered by behavioral analytics, and industry-leading automation and response.
  • Unify Your Defense: Consolidate your endpoint and workspace security with a proven, four-time industry Leader.

We are incredibly proud to be recognized as a Leader once again, an acknowledgement that belongs just as much to our customers and partners as it does to us. Your trust, feedback, and real-world challenges keep us sharp and dictate our roadmap. At the end of the day, our continued leadership is built on one core promise: make each day more secure than the day before.

To get the full story and a comprehensive analysis of the endpoint security market, I invite you to read the 2026 Gartner Magic Quadrant report.

Get Your Complimentary Copy of the Report

Gartner, Magic Quadrant for Endpoint Protection Platforms, By Deepak Mishra, Evgeny Mirolyubov, Nikul Patel, May 29, 2026

Gartner and Magic Quadrant are trademarks of Gartner, Inc. and/or its affiliates. Gartner does not endorse any company, vendor, product or service depicted in its publications, and does not advise technology users to select only those vendors with the highest ratings or other designation. Gartner publications consist of the opinions of Gartner’s business and technology insights organization and should not be construed as statements of fact. Gartner disclaims all warranties, expressed or implied, with respect to this publication, including any warranties of merchantability or fitness for a particular purpose.

The post A 4X Gartner Magic Quadrant for EPP Leader. Built for the Agentic Era. appeared first on Palo Alto Networks Blog.

  •  

Welcoming the AWS Customer Incident Response Team

May 26, 2026: This post was originally published in July 2022. It has been updated to reflect current engagement options, new threat intelligence resources such as the Threat Technique Catalog for AWS (TTC), additional open-source tools, and the distinction between AWS CIRT support and the AWS Security Incident Response managed service.


Welcome back, or welcome for the first time. Either way, we’re glad you’re here. We’re the AWS Customer Incident Response Team (CIRT), and we want to share who we are and how we can help when it matters most.

The AWS CIRT is a specialized 24/7 global team within Amazon Web Services (AWS) that provides support to customers during active security events on the customer side of the AWS Shared Responsibility Model. Our team is made up of security engineers who respond to cloud security events and build the tools and resources we use to do it.

Important: If you’re experiencing an active security event in your AWS environment—such as unauthorized access, data exfiltration, or ransomware—open an AWS support case and request assistance.

To request assistance from AWS:

  1. Open a support case from the impacted AWS account through the AWS Support Center Console.
  2. Select the service most closely related to the security event (for example, Amazon Elastic Compute Cloud (Amazon EC2), AWS Identity and Access Management (IAM), Amazon Simple Storage Service (Amazon S3)).
  3. Mention that you have an urgent security incident in the case description.

Opening a support case from the affected account allows AWS to confirm account ownership and gives you a case number to track the engagement. If you have an account team (TAM, Account Manager, or Solutions Architect), you can also alert them to initiate an escalation.

If you’ve lost access to your account, you can still submit a request for assistance.

When the AWS CIRT supports you, we focus on investigating security events as they appear in AWS service logs and the AWS control plane. For our analysis, we draw on sources such as AWS CloudTrail, Amazon VPC Flow Logs, and Amazon GuardDuty findings. We assist with triage, analysis, and containment, alongside providing recommendations and best practices to help you avoid security events in the future.

The AWS CIRT works alongside AWS threat intelligence and security operations teams. During an engagement, we use current threat intelligence and AWS infrastructure knowledge to inform our analysis and recommendations.

For investigations that extend into host-level or application-level analysis—such as operating system forensics, memory analysis, or application code review—we recommend complementing our support with a specialized AWS Partner for digital forensics and incident response (DFIR) capabilities.

Figure 1 shows the two different sides of the shared responsibility model, in which AWS is responsible for security OF the cloud, while customers are responsible for security IN the cloud.

Figure 1: The customer and AWS Shared Responsibility Model

Figure 1: The customer and AWS Shared Responsibility Model

Threat intelligence: The Threat Technique Catalog for AWS

The AWS CIRT regularly encounters patterns that repeat across our engagements. The TTC started as an internal reference—a way for our team to track and share what we were seeing across engagements, so we weren’t solving the same problems in isolation. Over time, it became clear that the knowledge we were building for ourselves was exactly what customers needed to get ahead of the same threats. So, we made it public. When we see techniques repeating across customers, an effective way to help them is to document those techniques and make that knowledge available so they can act on it before they’re in the middle of an incident.

To that end, we developed the Threat Technique Catalog for AWS (TTC)—a publicly available catalog, based on MITRE ATT&CK Cloud Matrix, that documents threat actor tactics, techniques, and procedures (TTPs) specific to AWS as observed by the AWS CIRT. Each entry includes detection guidance and mitigations specific to AWS environments. You can filter for the AWS services in your account to focus on what’s most relevant to you.

Findings from the TTC also inform detection logic in AWS services like Amazon GuardDuty, helping customers strengthen automated protections in their environments.

Figure 2: The Threat Technique Catalog for AWS, based on MITRE ATT&CK Cloud Matrix

Figure 2: The Threat Technique Catalog for AWS, based on MITRE ATT&CK Cloud Matrix

Open source tools

We’ve open-sourced several tools based on patterns we see in engagements. These complement rather than replace your existing security tooling. For a comprehensive framework for building your incident response program, see the AWS Security Incident Response Guide.

The tools below started as internal solutions we built to solve problems we kept running into.

Workshops

We maintain five publicly available workshops, regularly updated to simulate current security events to help you learn tools and procedures that we use daily. The workshops cover unauthorized IAM credential use, ransomware on Amazon S3, cryptomining, SSRF on IMDSv1, and incident response preparedness tooling. All you need is an AWS account, an internet connection, and the desire to learn more about incident response in the AWS Cloud. These workshops are built using the same scenarios our team trains on internally—we wanted to make that accessible to everyone.

How to contact us

Any AWS customer can engage the AWS CIRT through an AWS support case, regardless of support plan level. For those customers who have an account team, you can start an escalation to the AWS CIRT with the account team. Customers with Enterprise Support or Unified Operations can also onboard to AWS Security Incident Response, a managed service for security event triage and response.

Thank you for reading. This post is where we share what we’re learning—security trends, new resources, and threat intelligence—so you can stay prepared. If you’ve worked with us and have thoughts on how we can do better, reach out through your AWS account team, the comments below, or aws-cirt@amazon.com.

Until next time: logs on, credentials rotated, and alerts reviewed.

We also recommend subscribing to AWS Security Bulletins for notifications about security events for AWS services. You can subscribe through RSS feed to stay informed.


Jason Hurst

Jason Hurst

Jason is a Security Engineer on the AWS Customer Incident Response Team (CIRT), specializing in network analysis and cloud security investigations. He is passionate about developing others, teaching part-time at a local technical college. Jason has three dogs that entertain him in his spare time.

Shannon Brazil

Shannon is a Security Engineer on the AWS Customer Incident Response Team (CIRT), specializing in digital forensics and cloud security investigations. Known in the community as 4n6lady, she is passionate about security education and mentoring the next generation of defenders.

  •  
❌