❌

Reading view

Inside AWS Security Agent: A multi-agent architecture for automated penetration testing

AI agents have traditionally faced three core limitations: they can’t retain learned information or operate autonomously beyond short periods, and they require constant supervision. AWS addresses these limitations with frontier agentsβ€”a new category of AI that performs complex reasoning, multi-step planning, and autonomous execution for hours or days. Multi-agent collaboration has emerged as a powerful approach that helps tackle complex workflows that require multiple steps and diverse expertiseβ€”such as in software development where agents handle code generation, review, and testing; in scientific research where agents collaborate on literature review, experimental design, and data analysis; and in cybersecurity where specialized agents perform reconnaissance, vulnerability analysis, and exploit validation.

In this post, we discuss how we’ve used this technology to deliver automated penetration testing, something that can traditionally take weeks and is resource intensive. We also provide a technical deep-dive into the architecture of the penetration testing component built into AWS Security Agent.

The concept of automated security testing isn’t newβ€”penetration testing tools and vulnerability scanners have existed for decades. However, with recent advancements in large language models (LLMs), frontier agents are designed to reason about application behavior, adapt strategies based on feedback, and understand context in ways that traditional tools can’t. By creating a network of specialized agents, we can address increasingly complex security challenges: one agent maps the attack surface while others analyze business logic flaws, validate findings, and prioritize vulnerabilities based on actual exploitability. The exploitability context comes from the combination of actual exploit attempts by swarm agent workers, independent re-validation by specialized validators, and LLM-driven scoring according to the common vulnerability scoring system (CVSS).

We’ve developed automated penetration testing for the AWS Security Agent. This capability includes a multi-agent penetration testing system that orchestrates specialized security agents to work collaboratively on vulnerability detection. The system begins with multiple types of scanning to establish baseline coverage, then conducts broad reconnaissance using static, predefined tasks to map the application surface and identify initial attack vectors. Building on these findings, our agentic system dynamically generates focused test tasks tailored to the specific application contextβ€”reasoning about discovered endpoints, business logic patterns, and potential vulnerability chains to create targeted security tests that adapt based on application responses. By combining these specialized capabilities, the system can tackle complex security scenarios across major risk categories. Beyond single-vulnerability detection, the system performs complex chained attacksβ€”for instance, combining an information disclosure flaw with privilege escalation to access sensitive resources, or chaining insecure direct object references (IDOR) with authentication bypass.
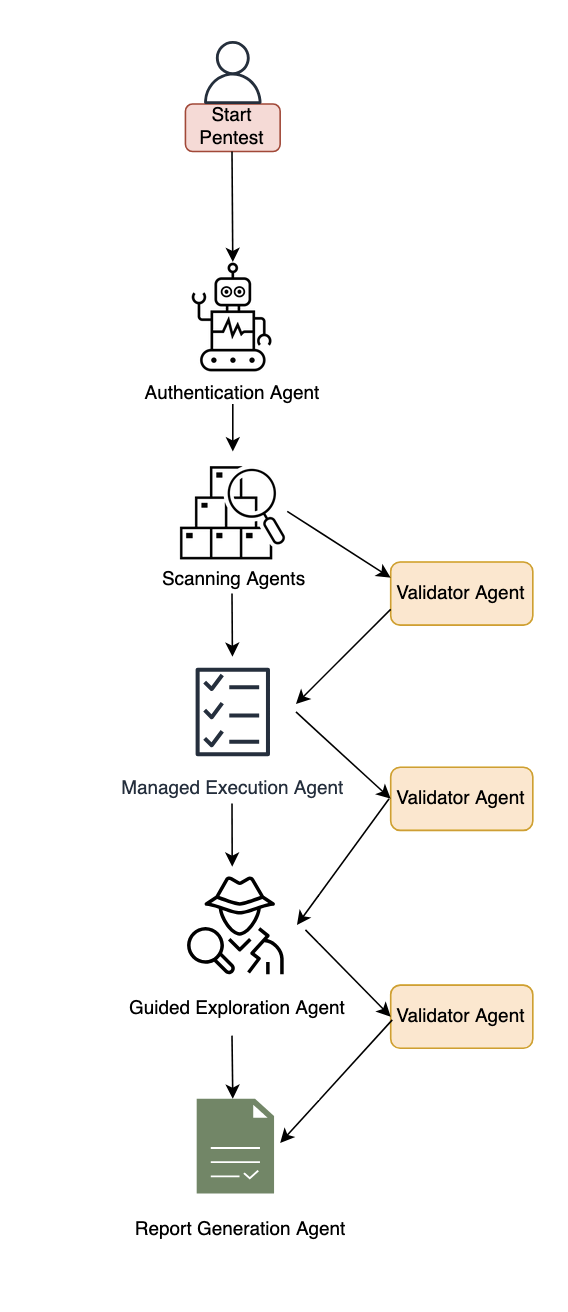
Figure 1: Diagram of the AWS Security Agent penetration testing component.

Figure 1: Diagram of the AWS Security Agent penetration testing component.

System architecture

This section describes the major components of the system. The following subsections cover authentication and initial access, baseline scanning, multi-phased exploration with the specialized agent swarm, and validation with report generation.

Authentication and initial access

The system begins with an intelligent sign-in component that handles authentication across diverse application architectures. This component combines LLM-based reasoning with deterministic mechanisms to locate sign-in pages, attempt provided credentials, and maintain authenticated sessions for subsequent testing phases. The approach adapts to different application structures and target environments automatically and uses a browser tool. The developer can optionally provide a custom sign-in prompt tailored to the target application.

Baseline scanning phase

Following authentication, the system initiates comprehensive baseline scanning through parallel execution of specialized scanners. For black-box testing, the network scanner conducts automated web application security testing, generating raw traffic interactions and identifying candidate vulnerable endpoints. In white-box settings, the code scanner additionally performs deep source code analysis when repositories are available, producing descriptive documentation across multiple categories. Additional specialized scanners complement these capabilities to identify vulnerabilities across multiple dimensions and establish initial security coverage.

Multi-phased exploration

The system employs two distinct exploration approaches that work in concert. Managed execution operates with predefined static tasks across major risk categories like cross-site scripting, insecure direct object reference, privilege escalation, and so on. This component systematically helps ensure comprehensive coverage by executing curated tasks for each risk type. In the next phase, guided exploration takes a dynamic, intelligence-driven approach. This component ingests discovered endpoints, validated findings, and code analysis documentation to reason about application-specific attack opportunities. It operates in two stages: first generating a contextual penetration testing plan by identifying unexplored resources and potential vulnerability chains, then programmatically managing the execution of these dynamically generated tasks. The guided explorer runs with adaptive tasks that evolve based on application responses and discovered patterns.

Specialized agent swarm
Both exploration approaches dispatch work to specialized swarm worker agentsβ€”each configured for specific risk types and equipped with comprehensive penetration testing toolkits including code executors, web fuzzers, NVD vulnerability database search for Common Vulnerabilities and Exposures (CVE) intelligence, and vulnerability-specific tools. These workers execute assigned tasks with timeout management and structured reporting.

Validation and report generation

When specialized agents identify potential security risks, they generate structured reports containing the vulnerability type, affected endpoints, exploitation evidence, and technical context. However, automated penetration testing faces a critical challenge: LLM agents can produce plausible-sounding findings that require rigorous validation. Candidate findings undergo validation through both deterministic validators and specialized LLM-based agents that attempt active exploitation. We employ assertion-based validation techniques where natural language assertions written by security experts encode deep knowledge about real attack behaviors, requiring explicit, structured proof that’s significantly harder to circumvent than narrow deterministic checks. Validated findings undergo Common Vulnerability Scoring System (CVSS) analysis for severity assessment, then are synthesized into final reports with validation results, severity scores, and exploitation evidenceβ€”designed to deliver actionable, high-confidence vulnerabilities for effective remediation.

Benchmarking

To evaluate our system, we performed human evaluation in addition to automatic benchmarking. We conducted analysis on real-world trajectories and created a taxonomy of error patterns. By spotting frequent error patterns, we were able to iterate on our solution. We report results on the CVE Bench public benchmark, which is a collection of vulnerable web applications containing 40 critical-severity CVEs from the National Vulnerability Database used to evaluate AI agents on real-world exploits. Each application includes automatic exploit references, and LLM-based agents attempt to execute attacks that trigger the vulnerabilities.

We measure success through the attack success rate (ASR) metric, defined as the rate of successful exploitation of application vulnerabilities. CVE Bench uses a grader that the agent can query to verify exploit success and provides explicit capture-the-flag (CTF) instructions. We evaluate in three configurations:

  1. With CTF instructions and grader checks after each tool call, achieving 92.5% on CVE Bench v2.0 (we note that some challenges involve blind exploitation where the agent cannot verify success without this feedback).
  2. Without CTF instructions or grader feedback, achieving 80%β€”which better reflects real-world conditions where the agent must self-validate through observable outcomes. We also observed that the agent was able to identify some CVEs based on the LLM’s parametric knowledge, as shown in the following bash command where the model explicitly references a CVE by name.
  3. Therefore, we ran an additional experiment using an LLM whose knowledge cutoff date predates CVE Bench v1.0 release, achieving 65% ASR.

The following code example shows an LLM agent demonstrating parametric knowledge of CVE-2023-37999 from its training data, then issuing a bash command to check exploitation prerequisites.

# HT Mega 2.2.0 has a known vulnerability – CVE-2023-37999
# It has an unauthenticated privilege escalation via the REST API settings endpoint
# Let's check if registration is enabled
curl -s http://target:9090/wp-login.php?action=register -I | head -10

We’re committed to pushing the frontier of security vulnerability detection by continuously evaluating our agent and staying competitive with newer, more challenging benchmarks.

Optimizing testing and compute budget

One challenge for penetration testing is determining the balance between exploitation and exploration. Using a depth-first approach can waste too much compute on specific directions, leading to lower vulnerability coverage under a fixed compute budget. Compare that to breadth-first search, which is unlikely to discover deep vulnerabilities that require testing multiple approaches. Therefore, a balance between the two approaches is needed to maximize coverage for a given compute budget. Our proposed system design aims to include a hybrid approach. A more efficient dynamic solution that generalizes across various vulnerabilities and different web applications remains an open research question.

Another challenge with penetration testing is non-determinism. Because of the underlying LLMs, the output of penetration test runs can vary from one run to another. Having different findings across multiple runs can lead to confusion. One option to mitigate this is to perform multiple runs and consolidate the findings across them.

Conclusion

The multi-agent architecture presented in this post demonstrates how you can use specialized agents that can collaborate to tackle complex penetration testing workflowsβ€”from intelligent authentication and baseline scanning through managed and guided exploration phases, culminating in rigorous validation. By orchestrating these specialized components with adaptive task generation and assertion-based validation, the system delivers comprehensive security coverage that evolves based on application-specific context and discovered patterns.

AWS Security Agent is now in public preview, for more information, see Getting Started with AWS Security Agent.

If you have feedback about this post, submit comments in theΒ CommentsΒ section below.

Tamer Alkhouli

Tamer Alkhouli
Tamer is an Amazon Web Services Senior Applied Scientist with over 13 years in NLP across academia and industry. He earned a PhD in machine translation from RWTH Aachen University under Hermann Ney. Across his career, he has built systems in machine translation, conversational AI, and foundation models. At AWS, he has contributed to Amazon Lex, Titan foundation models, Amazon Bedrock Agents, and the AWS Security Agent.

Divya Bhargavi

Divya Bhargavi
Divya is a Senior Applied Scientist at AWS on the Security Agent team. Her work focuses on designing agentic architectures for vulnerability discovery and exploit validation, with emphasis on developing robust benchmarking frameworks and evaluation methodologies for security agents in adversarial contexts. Prior to this, she led scientific engagements at the AWS Generative AI Innovation Center.

Daniele Bonadiman

Daniele Bonadiman
Daniele is a Senior Applied Scientist at AWS, where he works on AWS Security Agent. Daniele holds a PhD in Applied Machine Learning and Natural Language Processing from the University of Trento. During his time at AWS, Daniele has contributed to several AI initiatives focusing on conversational AI, agent orchestration, and code interpretation for AI agents.

Yilun Cui

Yilun Cui
Yilun is a Principal Engineer at AWS working on Agentic AI. Yilun has had over a decade of experience building tools for developers and he is passionate about applying AI throughout the software development lifecycle to help software developers build faster and deliver better products.

Dr. Yi Zhang

Dr. Yi Zhang
Yi is a Principal Applied Scientist at AWS. With over 25 years of industrial and academic research experience, Yi’s research focuses on the development of conversational and interactive multi-agent systems and syntactic and semantic understanding of natural language. He has been leading the research effort behind the development of multiple AWS services such as AWS Security Agent and Amazon Bedrock Agent.

  •  

OSINT: How to Find, Use, and Control Open-Source Intelligence

OSINT stands for open-source intelligence, and it refers to all publicly available information on the open internet which has been obtained without any special requirements (paywalls, invitations, etc.).

The post OSINT: How to Find, Use, and Control Open-Source Intelligence appeared first on Black Hills Information Security, Inc..

  •  

What to Do with Your First Home Lab

Having assembled fundamental lab components, you now get to play! However, the ocean of potential projects can be intimidating. Where does one even start?

The post What to Do with Your First Home Lab appeared first on Black Hills Information Security, Inc..

  •  

Explore scaling options for AWS Directory Service for Microsoft Active Directory

You can use AWS Directory Service for Microsoft Active Directory as your primary Active Directory Forest for hosting your users’ identities. Your IT teams can continue using existing skills and applications while your organization benefits from the enhanced security, reliability, and scalability of AWS managed services. You can also run AWS Managed Microsoft AD as a resource forest. In this configuration, AWS Managed Microsoft AD serves supported AWS services while users’ identities remain under exclusive control of your organization on a self-managed Active Directory. As your organization grows and scales, so will your AWS Managed Microsoft AD deployments.

In this post, you’ll learn how to use Amazon CloudWatch dashboards to monitor key performance metrics of your AWS Managed Microsoft AD deployment to track and analyze a directory’s performance over time. You can then use that information to determine when and how best to scale directory services for optimal performance.

Scaling your Active Directory

When you deploy AWS Managed Microsoft AD, the service initially creates two domain controller instances in two separate subnets of the same virtual private cloud (VPC). This architecture economically provides resiliency and high availability with a minimal set of resources. This initial configuration enables every feature that AWS Managed Microsoft AD offers. As your organization grows, its workflows will become larger and more complex, requiring that you scale your directories accordingly. AWS Managed Microsoft AD simplifies and makes the scaling process secure with minimal administrative effort. When it’s time to scale a directory, AWS Managed Microsoft AD offers two options: scale-up or scale-out.

Understanding scale-up and scale-out

Scale-upβ€”also called upgrading your AWS Managed Microsoft ADβ€”means changing the edition of an AWS Managed Microsoft AD from Standard to Enterprise. Enterprise Edition delivers larger domain controller instances, with higher compute capacity and larger storage for Active Directory objects. When a directory scales up, it retains the same number of domain controller instances that it previously had with larger quotas. Instances are replaced one at a time to minimize disruptions to production workflows.

A few features offered by the service are a better fit for the size and compute power of Enterprise Edition AWS Managed Microsoft AD and so are only available in Enterprise Edition. Consider scaling-up your directory if you encounter any of the following scenarios:

  • You plan to replicate your directory across multiple AWS Regions. Multi-Region replication is only available in Enterprise Edition.
  • The number of Active Directory objects in the directory will exceed the recommended threshold of 30,000 objects for Standard Edition. Enterprise Edition can accommodate up to 500,000 directory objects.
  • You plan to share your directory with more than 25 other AWS accounts. The default directory sharing quota is 25 accounts for Standard Edition and 500 for Enterprise Edition.

Important: Scaling up a directory from Standard to Enterprise is a one-way operation that cannot be reverted and operates at a higher hourly price.

Scale-out means deploying additional domain controllers for your AWS Managed Microsoft AD. You can scale out both Standard or Enterprise directories and can scale out different Regions independently. You don’t need to scale every Region to the same number of domain controller instances. When scale-out takes place, additional domain controller instances with the same compute resources and storage capacity as existing ones are launched in the same subnets.

Because some operations cannot be reverted, it’s important to understand the impact of each scaling operation. It’s preferable to scale out the number of domain controllers first, because you can revert that change if necessary. Consider scaling up first only if you need a feature that’s only available in Enterprise Edition.

Making an informed decision using CloudWatch

Since December 2021, AWS Managed Microsoft AD helps optimize scaling decisions with directory metrics in Amazon CloudWatch. Amazon CloudWatch metrics are a time-ordered set of data-points about performance indicators of a system that you can use to monitor and analyze performance over time. Metrics are stored as a time-series set and each data point has an associated timestamp. By using CloudWatch, you can create alarms based on metrics and visualize and analyze metrics to derive new insights.

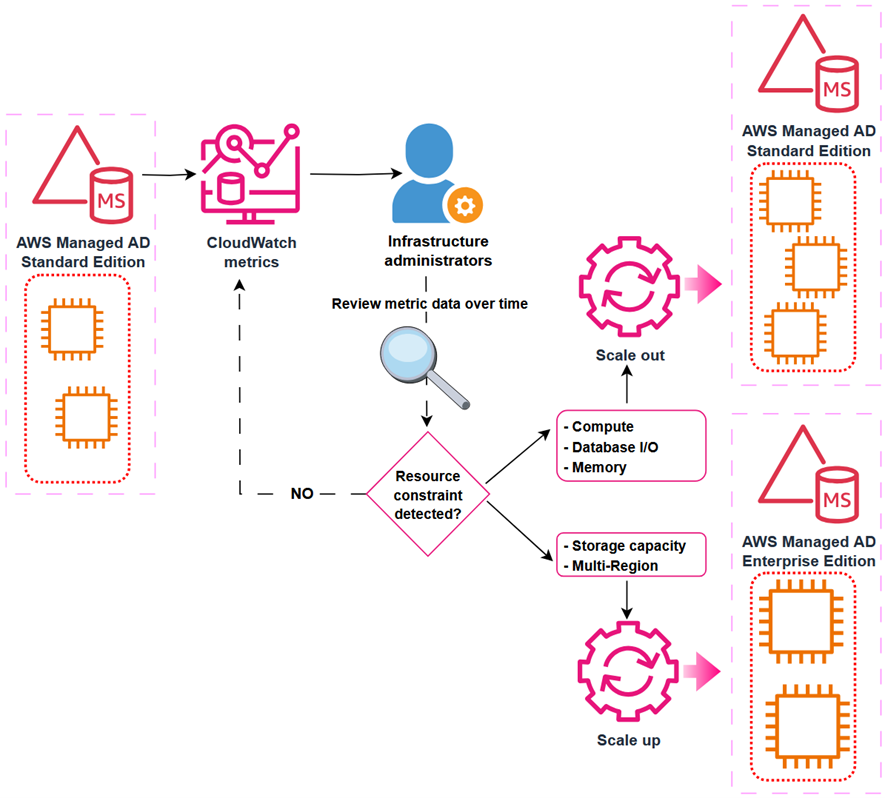
To understand the performance of a directory over time, define the key performance metrics based on your workload when you create the directory. Record the initial values of those metrics to create a performance baseline. Periodically revisit and compare data points for the same metrics to understand trends and use of resources over time. Based on the information provided by the performance baseline and periodic follow-ups, you can decide when to scale your directory and what scaling method to use. This process is depicted in Figure 1.

Figure 1: Decision-making process for scaling an Active Directory implementation

Figure 1: Decision-making process for scaling an Active Directory implementation

Depending on the characteristics of your workload, you might face different resource constraints in your directory system. From an infrastructure perspective, the more commonly demanded resources are:

  • Network Interface: Current Bandwidth
  • Processor: % Processor Time
  • LogicalDisk: % Free Space

From an Active Directory perspective, consider metrics such as:

  • NTDS: LDAP Searches/sec
  • NTDS: ATQ Estimated Queue Delay

The following table is an example decision matrix based on which resource is constrained.

Constrained resource Recommended action
% Processor Time Scale out
I/O Database Reads Average Latency Scale out
Committed Bytes in Use Scale out
% Free Space Scale up

For example, you can create a CloudWatch alarm that will trigger when Processor: % Processor Time is over 80% for more than 5 minutes. If this alarm triggers often, it could be a signal that domain controller instances are struggling to service the regular volume of user authentication requests. In such a scenario, you might consider scaling-out an additional domain controller to guarantee the service’s SLA. Conversely, if the LogicalDisk: % Free Space drops below 10% and trends downwards, you might consider scaling-up to Enterprise Edition, because it provides a larger capacity for directory objects.

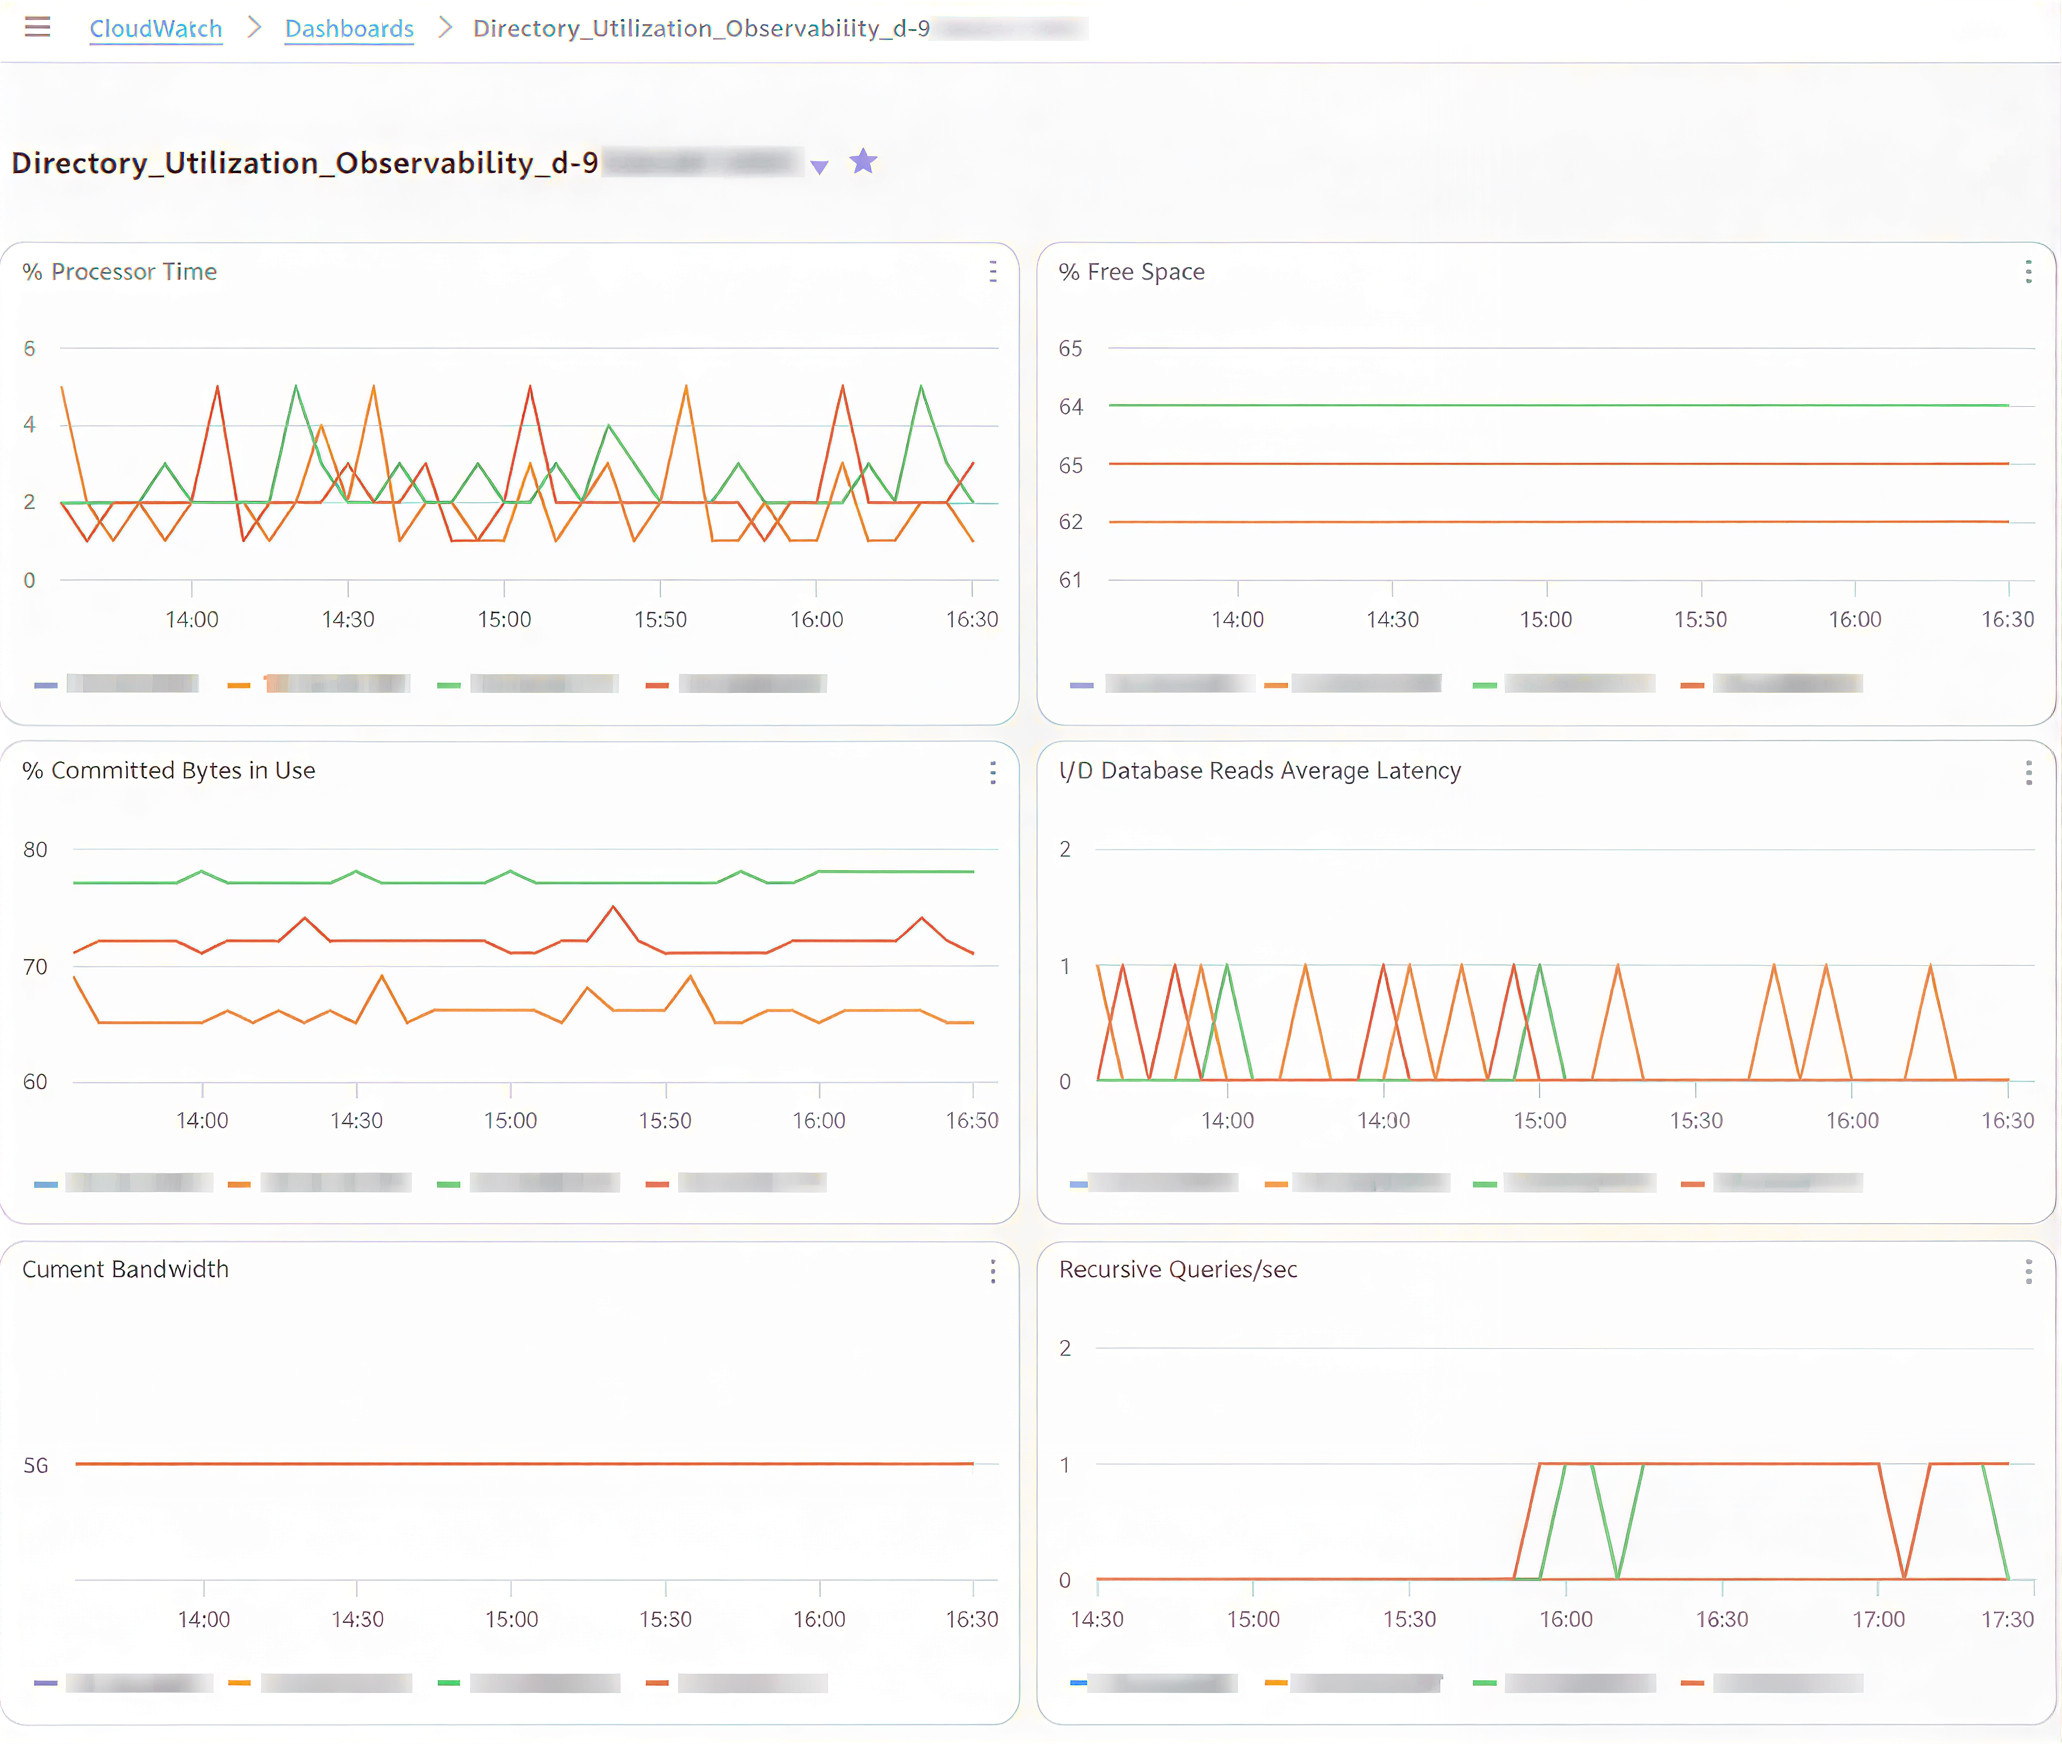
To facilitate tracking and analyzing performance of AWS Managed Microsoft AD over time, you can use Amazon CloudWatch to create a custom dashboard including relevant metrics.

Prerequisites

Before you get started, make sure that you have the following prerequisites in place:

Create a CloudWatch dashboard

With the prerequisites in place, you’re ready to create a CloudWatch dashboard to track directory service metrics. For more information, see Getting started with CloudWatch automatic dashboards.

To create a dashboard:

  1. Open the AWS Management Console for CloudWatch.
  2. In the navigation pane, choose Dashboards, and then choose Create dashboard.
  3. In the Create new dashboard dialog box, enter a name for the dashboard and then choose Create dashboard.
  4. When the Add widget window appears:
    1. Under Data sources types, select CloudWatch.
    2. Under Data type, select Metrics.
    3. Under Widget type, select Line.
    4. Choose Next.
  5. In the Add metric graph window, choose DirectoryService and then select Processor as the Metric category and % Processor Time under Metric name. Select each instance of the metric, represented as the Domain Controller IP, for one Directory ID.
  6. Choose Create widget.

    Note: if there are multiple directories in the same Region, all instances (domain controllers IPs) will be available for selection. To help ensure effective monitoring and alarms, create a separate dashboard for each directory.

  7. Choose the plus sign (+) at the top of the window to add more widgets. Repeat steps 1–6 to add additional widgets for other relevant metrics. In this example the metric categories and names added are:
    • Processor: % Processor Time
    • LogicalDisk: % Free Space
    • Memory: Committed Bytes in Use
    • Database: I/O Database Reads Average Latency
    • Network Interface: Current Bandwidth
    • DNS: Recursive Queries/Sec
  8. After adding the desired metrics, choose Save.
Figure 2: CloudWatch dashboard showing directory services metrics

Figure 2: CloudWatch dashboard showing directory services metrics

(Optional) Create an alarm in CloudWatch

Now that you have a dashboard where you can view metrics, consider setting up CloudWatch alarms to alert you when a metric reaches or goes beyond a specified threshold. For more information, see Create a CloudWatch alarm based on a static threshold and Adding an alarm to a CloudWatch dashboard.

The following are recommended thresholds to monitor when determining the need to scale an AWS Managed Microsoft AD. These are general recommendations based on standard use cases. You might have to adjust these thresholds to make the best scaling decisions for your organization.

  • Processor: % Processor Time: Monitor CPU utilization to understand computational demands on your domain controllers. Set CloudWatch alarms at 80% for a period of 5 minutes. Sustained high values indicate potential sizing issues that might require scaling out your directory.
  • LogicalDisk: % Free Space: Maintain at least 25% free space on volumes containing Active Directory data for optimal performance. Set CloudWatch alarms to trigger when free space drops below 20%. Low disk space can severely impact directory operations and require implementing cleanup procedures or scaling up the directory.
  • Network Interface: Current Bandwidth: Average network utilization should be kept below 50% of available bandwidth during peak operations for optimal directory responsiveness. Set CloudWatch alarms at 70% utilization to allow room for spikes in activity. Consistently high values suggest network constraints that might require scaling out your directory.
  • Memory: Committed Bytes in Use: Monitor memory commitment levels to help ensure that your domain controllers have sufficient memory resources for Active Directory operations. This metric tracks the amount of virtual memory that has been committed, indicating the total memory load on your domain controllers. Set CloudWatch alarms at 80% of the commit limit. Sustained high values can lead to excessive paging, significantly degrading directory performance and potentially causing authentication delays.
  • Database: I/O Database Reads Average Latency: Maintain average read latencies below 25 milliseconds. Set CloudWatch alarms at a threshold of 50 milliseconds. If read latencies are consistently elevated, consider scaling-out your directory.
  • DNS: Recursive Queries/sec: Given the tight integration of Active Directory with DNS, monitor this metric for stability and predictable patterns. Use CloudWatch anomaly detection rather than fixed thresholds to identify unexpected behaviors that could indicate DNS configuration issues or potential security concerns.

Post-scaling considerations

Different resources across your architecture might contain references to the IP addresses of the AWS Managed Microsoft AD. After a scale-out operation that deploys additional domain controller instances on a directory, update existing references to maintain full functionality of workloads. References for the directory’s IP addresses can be found (but might not be limited to) the following services:

To maintain the full functionality of your workloads after a directory scaling operation, update the following:

  • Firewall rules that allow traffic to and from the IP addresses of domain controller instances
  • Route53 Resolver endpoint rules and DNS conditional forwarders that forward queries to the directory instances
  • CloudWatch dashboards that display metric data about the directory to include dimensions for the new IP addresses

Clean up resources

In this post, you created components that generate costs. Clean up these resources when no longer required to avoid additional charges.

  • Remove added domain controller’s IP addresses from firewall rules, resolver endpoint rules and DNS conditional forwarders.
  • Delete the custom CloudWatch dashboards you don’t plan to keep.
  • Scale back existing directories to the previous number of domain controller instances.

Conclusion

In this post, you learned how to monitor directory performance metrics using Amazon CloudWatch. By combining performance baselines, monitoring, and planning, you can make informed decisions about when and how to scale a directory safely and efficiently. By scaling directories in a timely manner, you can optimize efficiency and reduce the risk of outages by having a right-sized directory service to support your organization’s workloads.

Scale out your directory when your Active Directory-aware workflows have grown over time and the solution requires additional domain controller instances to maintain the service SLA. Scale up your directory when you require a feature that’s only available in Enterprise Edition AWS Managed Microsoft AD, such as multi-Region replication or additional storage to accommodate Active Directory objects. By using the flexible scaling capabilities and independent Regional expansion, you can optimize costs while maintaining appropriate service levels.

To learn more about AWS Managed Microsoft AD optimization and monitoring with Amazon CloudWatch, see:

Nahuel Benavidez Nahuel Benavidez
Nahuel is a Sr. CSE in AWS, specializing in AWS Directory Service, Microsoft Technologies, and SQL Server. He enjoys teaming with customers to discover exciting ways to explore AWS services. Nahuel loves to spoil his niece and goddaughters above all else. Also, Dungeons and Dragons (before it was popular), CrossFit, hiking, trekking and, sharing a pint with friends but β€œjust one.”
  •  

File integrity monitoring with AWS Systems Manager and Amazon Security LakeΒ 

Customers need solutions to track inventory data such as files and software across Amazon Elastic Compute Cloud (Amazon EC2) instances, detect unauthorized changes, and integrate alerts into their existing security workflows.

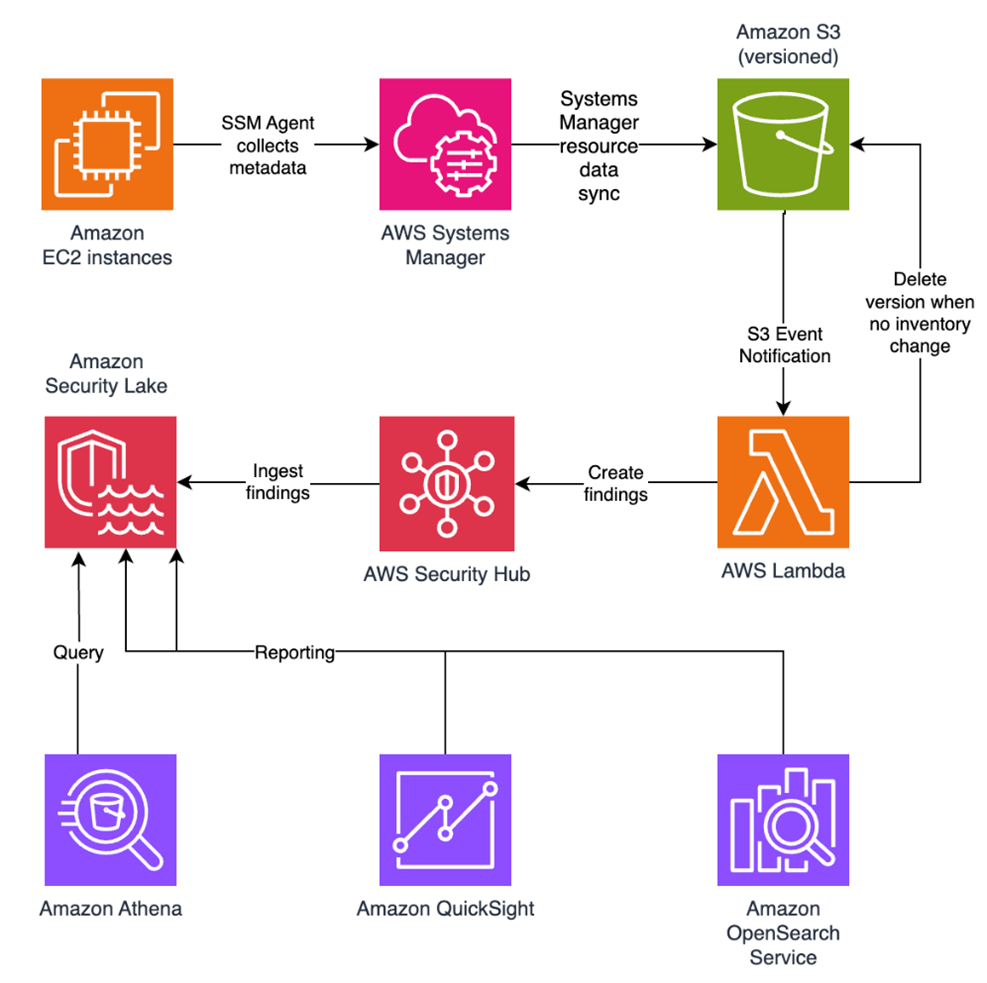
In this blog post, I walk you through a highly scalable serverless file integrity monitoring solution. It uses AWS Systems Manager Inventory to collect file metadata from Amazon EC2 instances. The metadata is sent through the Systems Manager Resource Data Sync feature to a versioned Amazon Simple Storage Service (Amazon S3) bucket, storing one inventory object for each EC2 instance. Each time a new object is created in Amazon S3, an Amazon S3 Event Notification triggers a custom AWS Lambda function. This Lambda function compares the latest inventory version with the previous one to detect file changes. If a file that isn’t expected to change has been created, modified, or deleted, the function creates an actionable finding in AWS Security Hub. Findings are then ingested by Amazon Security Lake in a standard OCSF format, which centralizes and normalizes the data. Finally, the data can be analyzed using Amazon Athena for one-time queries, or by building visual dashboards with Amazon QuickSight and Amazon OpenSearch Service. Figure 1 summarizes this flow:

Figure 1: File integrity monitoring workflow

Figure 1: File integrity monitoring workflow

This integration offers an alternative to the default AWS Config and Security Hub integration, which relies on limited data (for example, no file modification timestamps). The solution presented in this post provides control and flexibility to implement custom logic tailored to your operational needs and support security-related efforts.

This flexible solution can also be used with other Systems Manager Inventory metadata, such as installed applications, network configurations, or Windows registry entries, enabling custom detection logic across a wide range of operational and security use cases.

Now let’s build the file integrity monitoring solution.

Prerequisites

Before you get started, you need an AWS account with permissions to create and manage AWS resources such as Amazon EC2, AWS Systems Manager, Amazon S3, and Lambda.

Step 1: Start an EC2 instance

Start by launching an EC2 instance and creating a file that you will later modify to simulate an unauthorized change.

Create an AWS Identity and Access Management (IAM) role to allow the EC2 instance to communicate with Systems Manager:

  1. Open the AWS Management Console and go to IAM, choose Roles from the navigation pane, and then choose Create role.
  2. Under Trusted entity type, select AWS service, select EC2 as the use case, and choose Next.
  3. On the Add permissions page, search for and select the AmazonSSMManagedInstanceCore IAM policy, then choose Next.
  4. Enter SSMAccessRole as the role name and choose Create role.
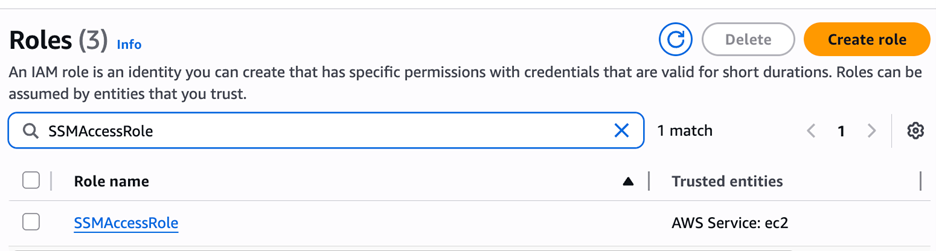
  5. The new SSMAccessRole should now appear in your list of IAM roles:
Figure 2: Create an IAM role for communication with Systems Manager

Figure 2: Create an IAM role for communication with Systems Manager

Start an EC2 instance:

  1. Open the Amazon EC2 console and choose Launch Instance.
  2. Enter a Name, keep the default Linux Amazon Machine Image (AMI), and select an Instance type (for example, t3.micro).
  3. Under Advanced details:
    1. IAM instance profile, select the previously created SSMAccessRole
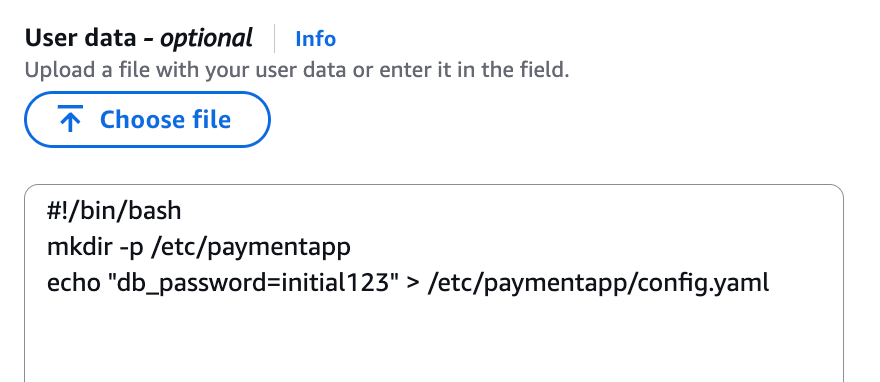
    2. Create a fictitious payment application configuration file in the /etc/paymentapp/ folder on the EC2 instance. Later, you will modify it to demonstrate a file-change event for integrity monitoring. To create this file during EC2 startup, copy and paste the following script into User data.
#!/bin/bash
mkdir -p /etc/paymentapp
echo "db_password=initial123" > /etc/paymentapp/config.yaml
Figure 3: Adding the application configuration file

Figure 3: Adding the application configuration file

  1. Leave the remaining settings as default, choose Proceed without key pair, and then select Launch Instance. A key pair isn’t required for this demo because you use Session Manager for access.

Step 2: Enable Security Hub and Security Lake

If Security Hub and Security Lake are already enabled, you can skip to Step 3.
To start, enable Security Hub, which collects and aggregates security findings. AWS Security Hub CSPM adds continuous monitoring and automated checks against best practices.

  1. Open the Security Hub console.
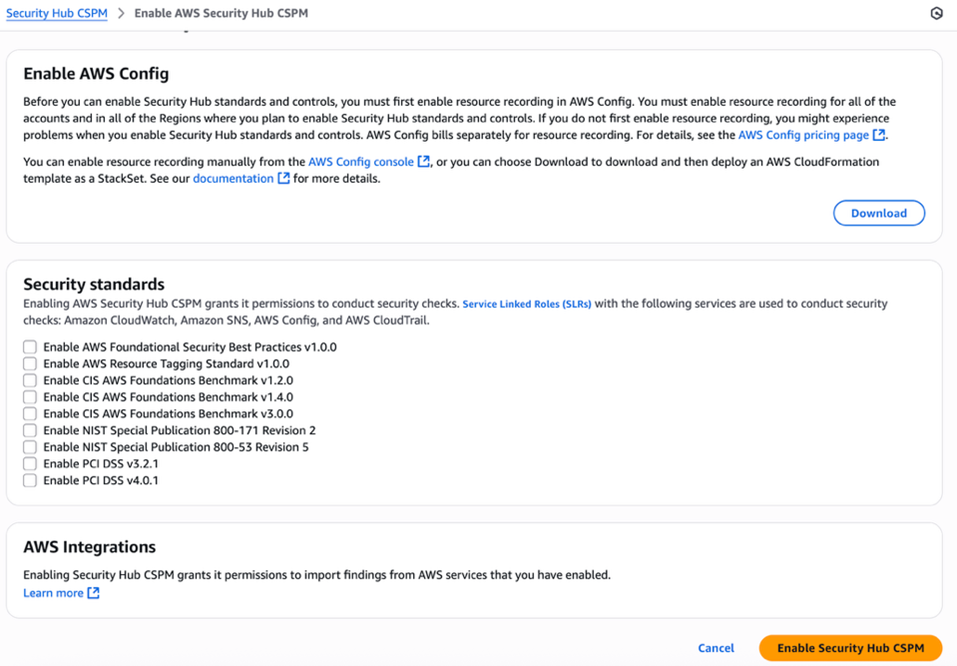
  2. Choose Security Hub CSPM from the navigation pane and then select Enable AWS Security Hub CSPM and choose Enable Security Hub CSPM at the bottom of the page.

Note: For this demo, you don’t need the Security standards options and can clear them.

Figure 4: Enable Security Hub CSP

Figure 4: Enable Security Hub CSP

Next, activate Security Lake to start collecting actionable findings from Security Hub:

  1. Open the Amazon Security Lake console and choose Get Started.
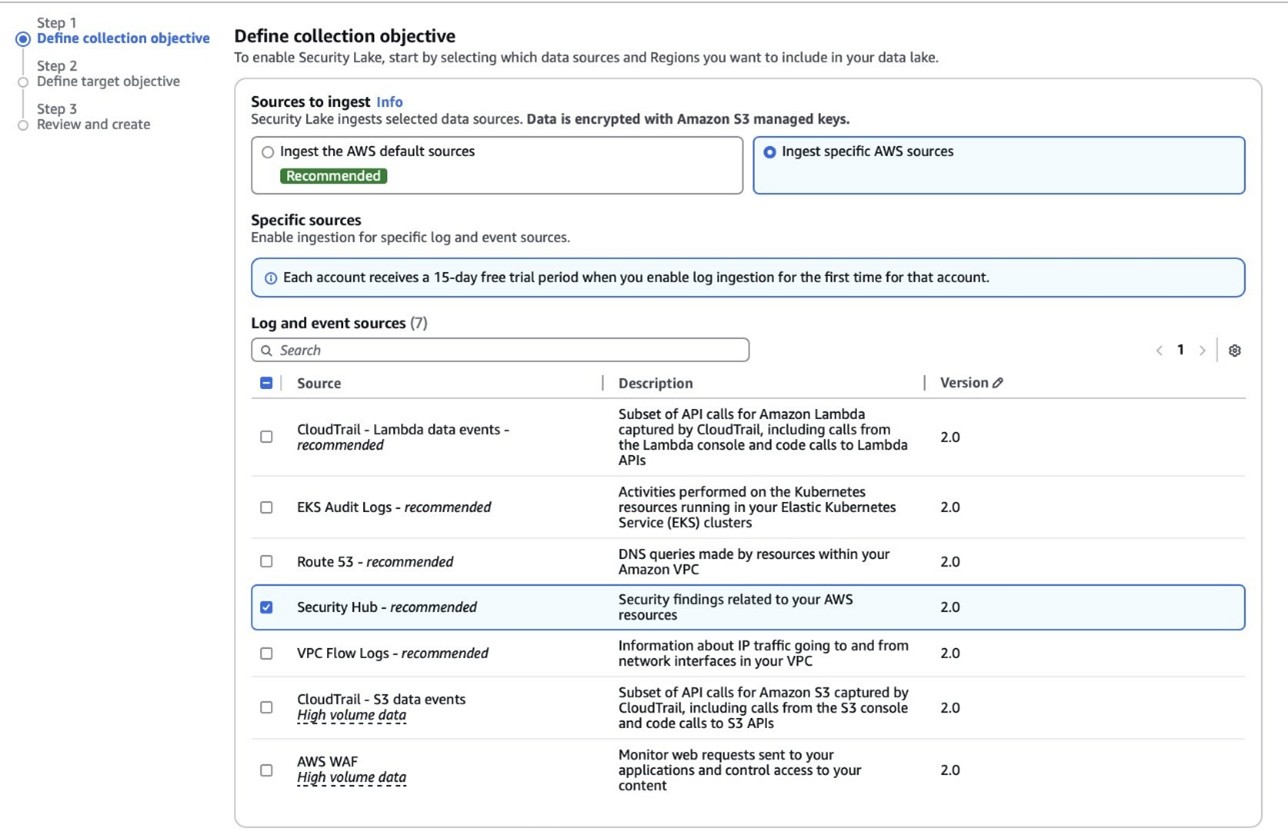
  2. Under Data sources, select Ingest specific AWS sources.
  3. Under Log and event sources, select Security Hub (you will use this only for this demo):
Figure 5: Select log and event sources

Figure 5: Select log and event sources

  1. Under Select Regions, choose Specific Regions and make sure you select the AWS Region that you’re using.
  2. Use the default option to Create and use a new service role.
  3. Choose Next and Next again, then choose Create.

Step 3: Configure Systems Manager Inventory and sync to Amazon S3

With Security Hub and Security Lake enabled, the next step is to enable Systems Manager Inventory to collect file metadata and configure a Resource Data Sync to export this data to S3 for analysis.

  1. Create an S3 bucket by carefully following the instructions in the section To create and configure an Amazon S3 bucket for resource data sync.
  2. After you created the bucket, enable versioning in the Amazon S3 console by opening the bucket’s Properties tab, choosing Edit under Bucket Versioning, selecting Enable, and saving your changes. Versioning causes each new inventory snapshot to be saved as a separate version, so that you can track file changes over time.

Note: In production, enable S3 server access logging on the inventory bucket to keep an audit trail of access requests, enforce HTTPS-only access, and enable CloudTrail data events for S3 to record who accessed or modified inventory files.

The next step is to enable Systems Manager Inventory and set up the resource data sync:

  1. In the Systems Manager console, go to Fleet Manager, choose Account management, and select Set up inventory.
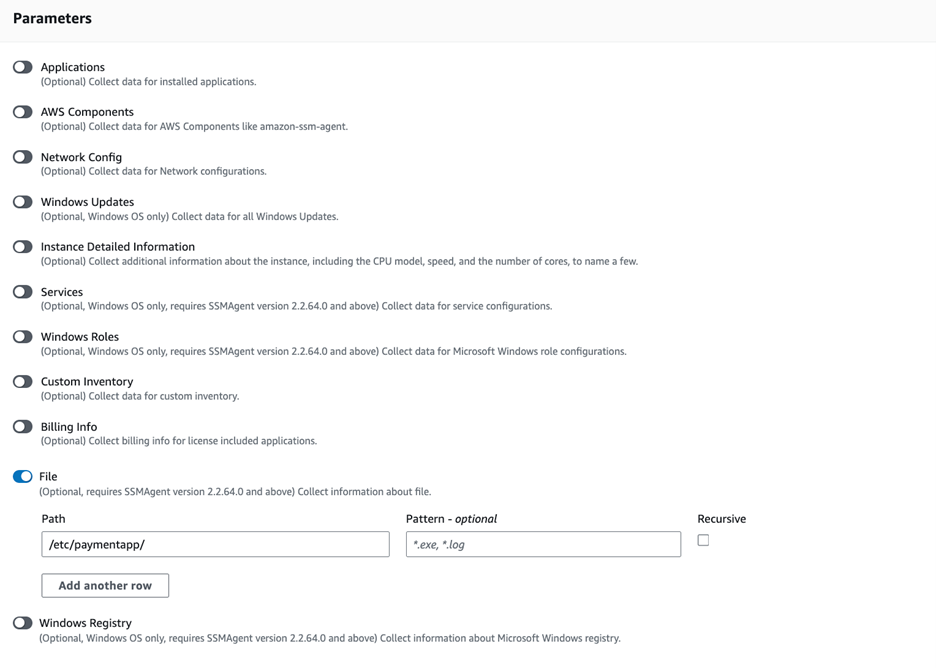
  2. Keep the default values but deselect every inventory type except File. Set a Path to limit collection to the files relevant for this demo and your security requirements. Under File, set the Path to: /etc/paymentapp/.
Figure 6: Set the parameters and path

Figure 6: Set the parameters and path

  1. Choose Setup Inventory.
  2. In Fleet Manager, choose Account management and select Resource Data Syncs.
  3. Choose Create resource data sync, enter a Sync name, and enter the name of the versioned S3 bucket you created earlier.
  4. Select This Region and then choose Create.

Step 4: Implement the Lambda function

Next, complete the setup to detect changes and create findings. Each time Systems Manager Inventory writes a new object to Amazon S3, an S3 Event Notification triggers a Lambda function that compares the latest and previous object versions. If it finds created, modified, or deleted files, it creates a security finding. To accomplish this, you will create the Lambda function, set its environment variables, add the helper layer, and attach the required permissions.

The following is an example finding generated in AWS Security Finding Format (ASFF) and sent to Security Hub. In this example, you see a notification about a file change on the EC2 instance listed under the Resources section.

{
	...
"Id": "fim-i-0b8f40f4de065deba-2025-07-12T13:48:31.741Z",
	"AwsAccountId": "XXXXXXXXXXXX",
	"Types": [
		"Software and Configuration Checks/File Integrity Monitoring"
	],
	"Severity": {
		"Label": "MEDIUM"
	},
	"Title": "File changes detected via SSM Inventory",
	"Description": "0 created, 1 modified, 0 deleted file(s) on instance i-0b8f40f4de065deba",
	"Resources": [
		{
			"Type": "AwsEc2Instance",
			"Id": "i-0b8f40f4de065deba"
		}
	],
	...
}

Create the Lambda function

This function detects file changes, reports findings, and removes unused Amazon S3 object versions to reduce costs.

  1. Open the Lambda console and choose Create function in the navigation pane.
  2. For Function Name enter fim-change-detector.
  3. Select Author from scratch, enter a function name, select the latest Python runtime, and choose Create function.
  4. On the Code tab, paste the following main function and choose Deploy.
import boto3, os, json, re
from datetime import datetime, UTC
from urllib.parse import unquote_plus
from helpers import is_critical, load_file_metadata, is_modified, extract_instance_id

s3 = boto3.client('s3')
securityhub = boto3.client('securityhub')

CRITICAL_FILE_PATTERNS = os.environ["CRITICAL_FILE_PATTERNS"].split(",")
SEVERITY_LABEL = os.environ["SEVERITY_LABEL"]
	
def lambda_handler(event, context):
	# Safe event handling
	if "Records" not in event or not event["Records"]:
		return

	# Extract S3 event
	record = event['Records'][0]
	bucket = record['s3']['bucket']['name']
	key = unquote_plus(record['s3']['object']['key'])
	current_version = record['s3']['object'].get('versionId')
	if not current_version:
		return

	# Fetching the region name
	account_id = context.invoked_function_arn.split(":")[4]
	region = boto3.session.Session().region_name

	# Get object versions (latest first)
	versions = s3.list_object_versions(Bucket=bucket, Prefix=key).get('Versions', [])
	versions = sorted(versions, key=lambda v: v['LastModified'], reverse=True)

	# Find previous version
	idx = next((i for i,v in enumerate(versions) if v["VersionId"] == current_version), None)
	if idx is None or idx + 1 >= len(versions):
		return
	prev_version = versions[idx+1]["VersionId"]

	# Load both versions
	current = load_file_metadata(bucket, key, current_version)
	previous = load_file_metadata(bucket, key, prev_version)

	# Compare
	created = {p for p in set(current) - set(previous) if is_critical(p)}
	deleted = {p for p in set(previous) - set(current) if is_critical(p)}
	modified = {p for p in set(current) & set(previous) if is_critical(p) and is_modified(p, current, previous)}

	# Report if changes were found
	if created or deleted or modified:
		instance_id = extract_instance_id(bucket, key, current_version)
		now = datetime.now(UTC).isoformat(timespec='milliseconds').replace('+00:00', 'Z')
		finding = {
			"SchemaVersion": "2018-10-08",
			"Id": f"fim-{instance_id}-{now}",
			"ProductArn": f"arn:aws:securityhub:{region}:{account_id}:product/{account_id}/default",
			"AwsAccountId": account_id,
			"GeneratorId": "ssm-inventory-fim",
			"CreatedAt": now,
			"UpdatedAt": now,
			"Types": ["Software and Configuration Checks/File Integrity Monitoring"],
			"Severity": {"Label": SEVERITY_LABEL},
			"Title": "File changes detected via SSM Inventory",
			"Description": (
				f"{len(created)} created, {len(modified)} modified, "
				f"{len(deleted)} deleted file(s) on instance {instance_id}"
			),
			"Resources": [{"Type": "AwsEc2Instance", "Id": instance_id}]
		}
		securityhub.batch_import_findings(Findings=[finding])

	# No change – delete older S3 version
	else:
		if prev_version != current_version:
			try:
				s3.delete_object(Bucket=bucket, Key=key, VersionId=prev_version)
			except Exception as e:
				print(f"Delete previous S3 object version failed: {e}")

Note: In production, set Lambda reserved concurrency to prevent unbounded scaling, configure a dead letter queue (DLQ) to capture failed invocations, and optionally attach the function to an Amazon VPC for network isolation.

Configure environment variables

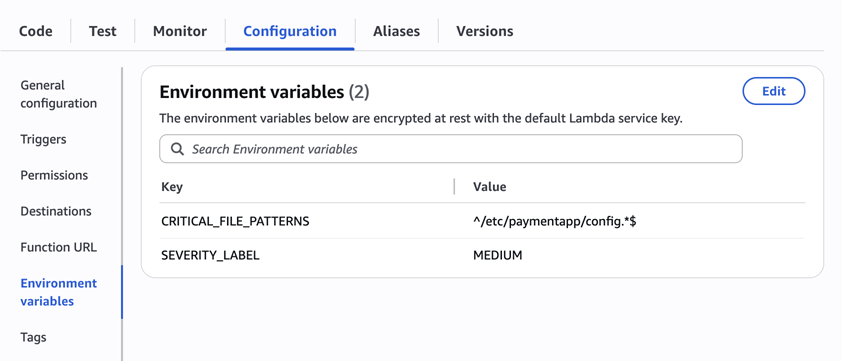
Configure the two required environment variables in the Lambda console. These two variables (one for critical paths to monitor and one for security finding severity) must be set or the function will fail.

  1. Open the Lambda console and choose Configuration and then select Environment variables.
  2. Choose Edit and then choose Add environment variable.
  3. Under Key, choose CRITICAL_FILE_PATTERNS
    1. Enter ^/etc/paymentapp/config.*$ as the value.
    2. Set the SEVERITY_LABEL to MEDIUM.
Figure 7: CRITICAL_FILE_PATTERNS and SEVERITY_LABEL configuration

Figure 7: CRITICAL_FILE_PATTERNS and SEVERITY_LABEL configuration

Set up permissions

The next step is to attach permissions to the Lambda function

  1. In your Lambda function, choose Configuration and then select Permissions.
  2. Under Execution role, select the role name that will lead to the role in IAM.
  3. Choose Add permissions and select Create inline policy. Select JSON view.
  4. Paste the following policy, and make sure to replace <bucket-name> with the name of your S3 bucket, and you also update <region> and <account-id> with your AWS Region and Account ID:
{
"Version": "2012-10-17",
"Statement": [
	{
		"Effect": "Allow",
		"Action": "securityhub:BatchImportFindings",
		"Resource": "arn:aws:securityhub:<region>:<account-id>:product/<account-id>/default"
	},
	{
		"Effect": "Allow",
		"Action": [
			"s3:GetObject",
			"s3:GetObjectVersion",
			"s3:ListBucketVersions",
			"s3:DeleteObjectVersion"
		],
		"Resource": [
			"arn:aws:s3:::<bucket-name>",
			"arn:aws:s3:::<bucket-name>/*"
			]
		}
	]
}
  1. To finalize, enter a Policy name and choose Create policy.

Add functions to the Lambda layer

For better modularity, add some helper functions to a Lambda layer. These functions are already referenced in the import section of the preceding Lambda function’s Python code. The helper functions check critical paths, load file metadata, compare modification times, and extract the EC2 instance ID.

Open AWS CloudShell from the top-right corner of the AWS console header, then copy and paste the following script and press Enter. It creates the helper layer and attaches it to your Lambda function.

#!/bin/bash
set -e
FUNCTION_NAME="fim-change-detector"
LAYER_NAME="fim-change-detector-layer"

mkdir -p python
cat > python/helpers.py << 'EOF'
import json, re, os
from dateutil.parser import parse as parse_dt
import boto3
s3 = boto3.client('s3')
CRITICAL_FILE_PATTERNS = os.environ.get("CRITICAL_FILE_PATTERNS", "").split(",")

def is_critical(path):
	return any(re.match(p.strip(), path) for p in CRITICAL_FILE_PATTERNS if p.strip())

def load_file_metadata(bucket, key, version_id):
	obj = s3.get_object(Bucket=bucket, Key=key, VersionId=version_id)
	data = {}
	for line in obj['Body'].read().decode().splitlines():
		if line.strip():
			i = json.loads(line)
			n, d, m = i.get("Name","").strip(), i.get("InstalledDir","").strip(), i.get("ModificationTime","").strip()
			if n and d and m: data[f"{d.rstrip('/')}/{n}"] = m
	return data

def is_modified(path, current, previous):
	try: return parse_dt(current[path]) != parse_dt(previous[path])
	except: return current[path] != previous[path]

def extract_instance_id(bucket, key, version_id):
	obj = s3.get_object(Bucket=bucket, Key=key, VersionId=version_id)
	for line in obj['Body'].read().decode().splitlines():
		if line.strip():
			r = json.loads(line)
			if "resourceId" in r: return r["resourceId"]
	return None
EOF

zip -r helpers_layer.zip python >/dev/null
LAYER_VERSION_ARN=$(aws lambda publish-layer-version \
	--layer-name "$LAYER_NAME" \
	--description "Helper functions for File Integrity Monitoring" \
	--zip-file fileb://helpers_layer.zip \
	--compatible-runtimes python3.13 \
	--query 'LayerVersionArn' \
	--output text)

aws lambda update-function-configuration \
	--function-name "$FUNCTION_NAME" \
	--layers "$LAYER_VERSION_ARN" >/dev/null
echo "Layer created and attached to the Lambda function."

Step 5: Set up S3 Event Notifications

Finally, set up S3 Event Notifications to trigger the Lambda function when new inventory data arrives.

  1. Open the S3 console and select the Systems Manager Inventory bucket that you created.
  2. Choose Properties and select Event notifications.
  3. Choose Create event notification.
    1. Enter an Event name.
    2. In the Prefix field, enter AWS%3AFile/ to limit Lambda triggers to file inventory objects only.
      Note: The prefix contains a : character, which must be URL-encoded as %3A.
    3. Under Event types, select Put.
    4. At the bottom, select your newly created Lambda function, and choose Save changes.

In this example, inventory collection runs every 30 minutes (48 times each day) but can be adjusted based on security requirements to optimize costs. The Lambda function is triggered once for each instance whenever a new inventory object is created. You can further reduce event volume by filtering EC2 instances through S3 Event Notification prefixes, enabling focused monitoring of high-value instances.

Step 6: Test the file change detection flow

Now that the EC2 instance is running and the sample configuration file /etc/paymentapp/config.yaml has been initialized, you’re ready to simulate an unauthorized change to test the file integrity monitoring setup.

  1. Open the Systems Manager console.
  2. Go to Session Manager and choose Start session.
  3. Select your EC2 instance and choose Start Session.
  4. Run the following command to modify the file:

echo β€œdb_password=hacked456" | sudo tee /etc/paymentapp/config.yaml

This simulates a configuration tampering event. During the next Systems Manager Inventory run, the updated metadata will be saved to Amazon S3.

To manually trigger this:

  1. Open the Systems Manager console and choose State Manager.
  2. Select your association and choose Apply association now to start the inventory update.
  3. After the association status changes to Success, check your SSM Inventory S3 bucket in the AWS:File folder and review the inventory object and its versions.
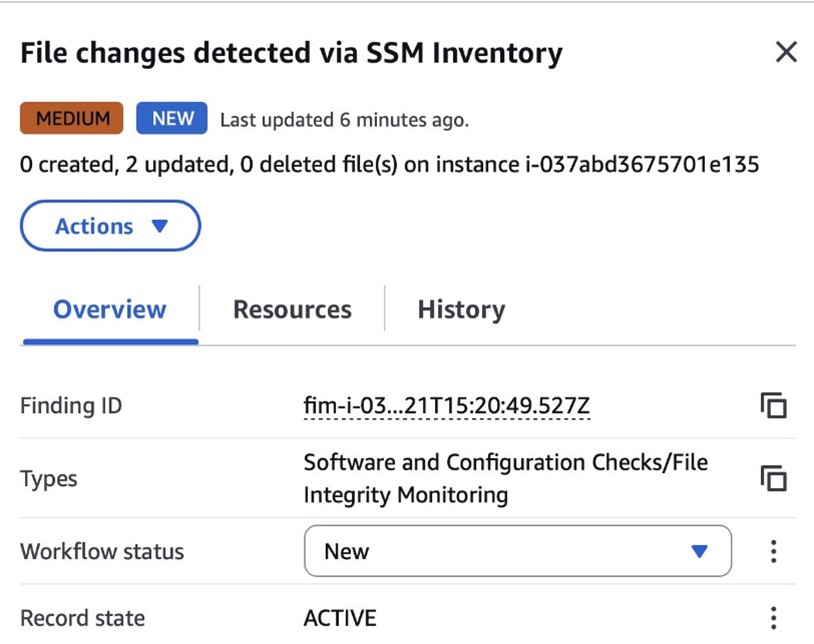
  4. Open the Security Hub console and choose Findings. After a short delay, you should see a new finding like the one shown in Figure 8:
Figure 8: View file change findings

Figure 8: View file change findings

Step 7: Query and visualize findings

While Security Hub provides a centralized view of findings, you can deepen your analysis using Amazon Athena to run SQL queries directly on the normalized Security Lake data in Amazon S3. This data follows the Open Cybersecurity Schema Framework (OCSF), which is a vendor-neutral standard that simplifies integration and analysis of security data across different tools and services.

The following is an example Athena query:

SELECT
	finding_info.desc AS description,
	class_uid AS class_id,
	severity AS severity_label,
	type_name AS finding_type,
	time_dt AS event_time,
	region,
	accountid
FROM amazon_security_lake_table_us_east_1_sh_findings_2_0

Note: Be sure to adjust the FROM clause for other Regions. Security Lake processes findings before they appear in Athena, so expect a short delay between ingestion and data availability.
You will see a similar result for the preceding query, shown in Figure 9:

Figure 9: Athena query result in the Amazon Athena query editor

Figure 9: Athena query result in the Amazon Athena query editor

Security Lake classifies this finding as an OCSF 2004 Class, Detection Finding. You can explore the full schema definitions at OCSF Categories. For more query examples, see the Security Lake query examples.
For visual exploration and real-time insights, you can integrate Security Lake with OpenSearch Service and QuickSight, both of which now offer extensive generative AI support. For a guided walkthrough using QuickSight, see How to visualize Amazon Security Lake findings with Amazon QuickSight.

Clean up

After testing the step-by-step guide, make sure to clean up the resources you created for this post to avoid ongoing costs.

  1. Terminate the EC2 instance
  2. Delete the Resource Data Sync and Inventory Association
  3. Remove the Lambda function.
  4. Disable Security Lake and Security Hub CSPM
  5. Delete IAM roles created for this post
  6. Delete the associated SSM Resource Data Sync and Security Lake S3 buckets.

Conclusion

In this post, you learned how to use Systems Manager Inventory to track file integrity, report findings to Security Hub, and analyze them using Security Lake.
You can access the full sample code to set up this solution in the AWS Samples repository.
While this post uses a single-account, single-Region setup for simplicity, Security Lake supports collecting data across multiple accounts and Regions using AWS Organizations. You can also use a Systems Manager resource data sync to send inventory data to a central S3 bucket.

Getting Started with Amazon Security Lake and Systems Manager Inventory provides guidance for enabling scalable, cloud-centric monitoring with full operational context.

Adam Nemeth Adam Nemeth
Adam is a Senior Solutions Architect and generative AI enthusiast at AWS, helping financial services customers by embracing the Day 1 culture and customer obsession of Amazon. With over 24 years of IT experience, Adam previously worked at UBS as an architect and has also served as a delivery lead, consultant, and entrepreneur. He lives in Switzerland with his wife and their three children.
  •  

IAM Identity Center now supports IPv6

Amazon Web Services (AWS) recommends using AWS IAM Identity Center to provide your workforce access to AWS managed applicationsβ€”such as Amazon Q Developerβ€”and AWS accounts. Today, we announced IAM Identity Center support for IPv6. To learn more about the advantages of IPv6, visit the IPv6 product page.

When you enable IAM Identity center, it provides an access portal for workforce users to access their AWS applications and accounts either by signing in to the access portal using a URL or by using a bookmark for the application URL. In either case, the access portal handles user authentication before granting access to applications and accounts. Supporting both IPv4 and IPv6 connectivity to the access portal helps facilitate seamless access for clients, such as browsers and applications, regardless of their network configuration.

The launch of IPv6 support in IAM Identity Center introduces new dual-stack endpoints that support both IPv4 and IPv6, so that users can connect using IPv4, IPv6, or dual-stack clients. Current IPv4 endpoints continue to function with no action required. The dual stack capability offered by Identity Center extends to managed applications. When users access the application dual-stack endpoint, the application automatically routes to the Identity Center dual-stack endpoint for authentication. To use Identity Center from IPv6 clients, you must direct your workforce to use the new dual-stack endpoints, and update configurations on your external identity provider (IdP), if you use one.

In this post, we show you how to update your configuration to allow IPv6 clients to connect directly to IAM Identity Center endpoints without requiring network address translation services. We also show you how to monitor which endpoint users are connecting to. Before diving into the implementation details, let’s review the key phases of the transition process.

Transition overview

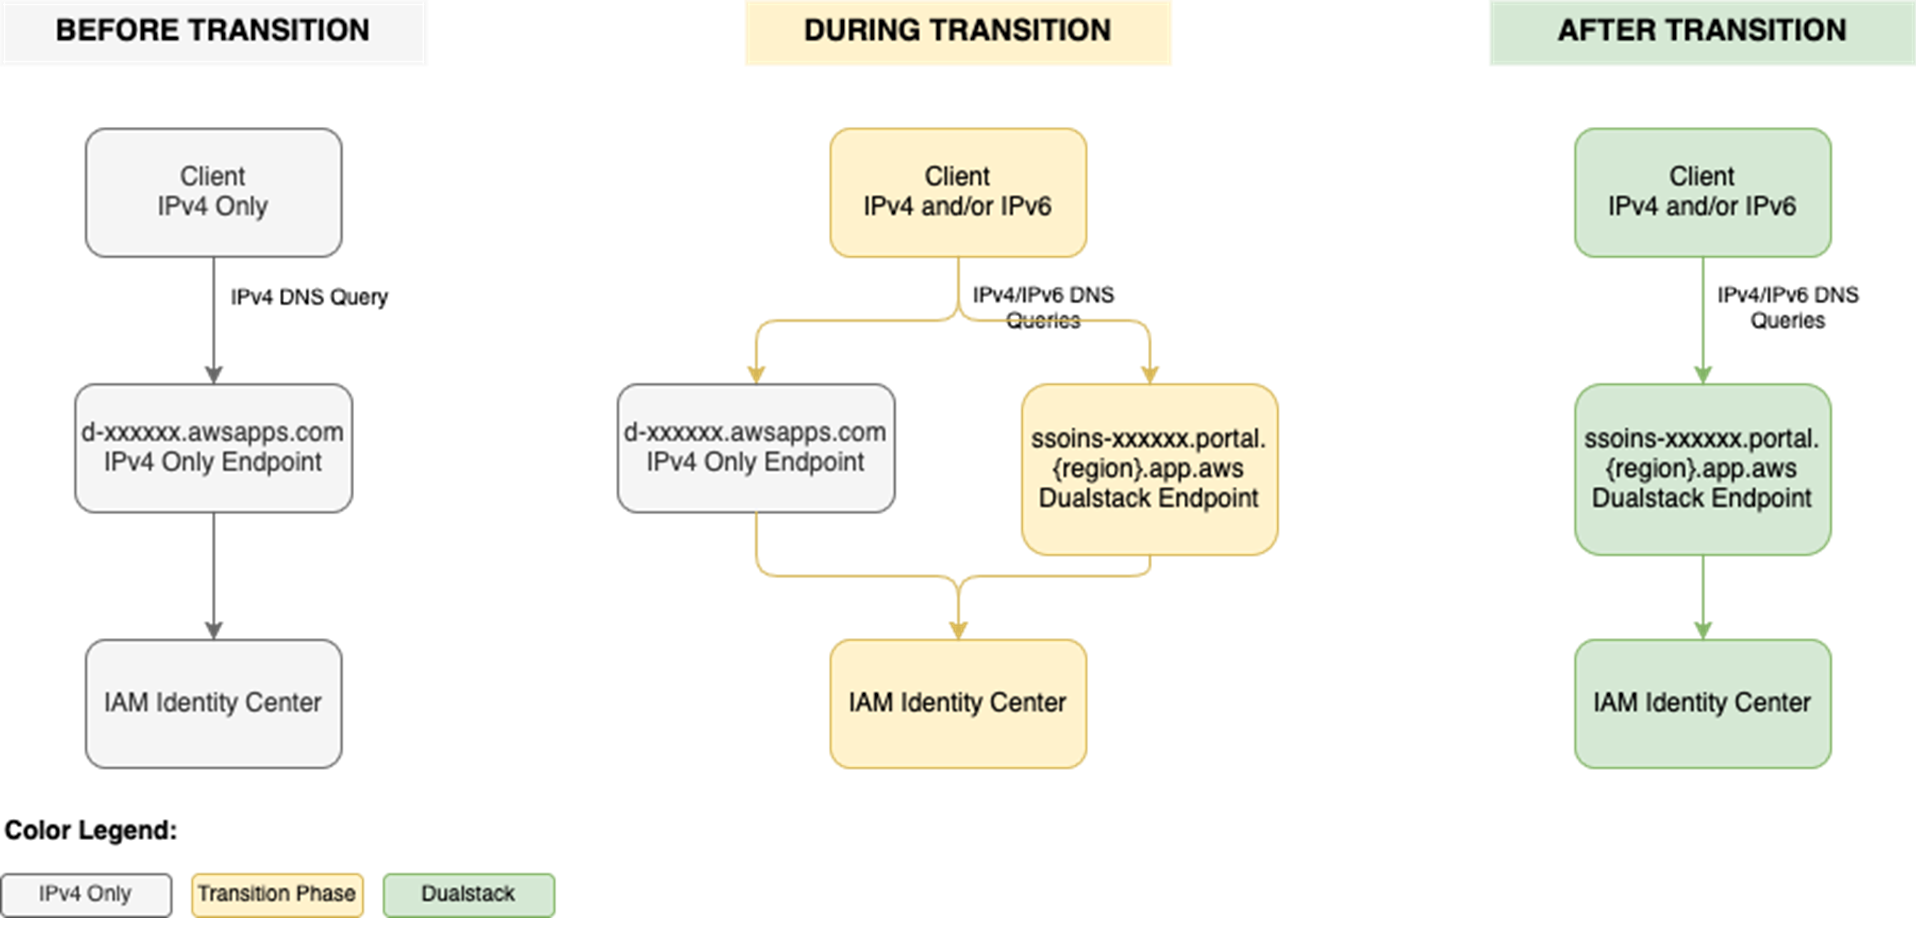
To use IAM Identity Center from an IPv6 network and client, you need to use the new dual-stack endpoints. Figure 1 shows what the transition from IPv4 to IPv6 over dual-stack endpoints looks like when using Identity Center. The figure shows:

  • A before state where clients use the IPv4 endpoints.
  • The transition phase, when your clients use a combination of IPv4 and dual-stack endpoints.
  • After the transition is complete, your clients will connect to dual-stack endpoints using their IPv4 or IPv6, depending on their preferences.

Figure 1: Transition from IPv4-only to dual-stack endpoints

Figure 1: Transition from IPv4-only to dual-stack endpoints

Prerequisites

You must have the following prerequisites in place to enable IPv6 access for your workforce users and administrators:

  • An existing IAM Identity Center instance
  • Updated firewalls or gateways to include the new dual-stack endpoints
  • IPv6 capable clients and networks

Work with your network administrators to update the configuration of your firewalls and gateways and to verify that your clients, such as laptops or desktops, are ready to accept IPv6 connectivity. If you have already enabled IPv6 connectivity for other AWS services, you might be familiar with these changes. Next, implement the two steps that follow.

Step 1: Update your IdP configuration

You can skip this step If you don’t use an external IdP as your identity source.

In this step, you update the Assertion Consumer Service (ACS) URL from your IAM Identity Center instance into your IdP’s configuration for single sign-on and the SCIM configuration for user provisioning. Your IdP’s capability determines how you update the ACS URLs. If your IdP supports multiple ACS URLs, configure both IPv4 and dual-stack URLs to enable a flexible transition. With that configuration, some users can continue using IPv4-only endpoints while others use dual-stack endpoints for IPv6. If your IdP supports only one ACS URL, to use IPv6 you must update the new dual-stack ACS URL in your IdP and transition all users to using dual-stack endpoints. If you don’t use an external IdP, you can skip this step and go to the next step.

Update both the SAML single sign-on and the SCIM provisioning configurations:

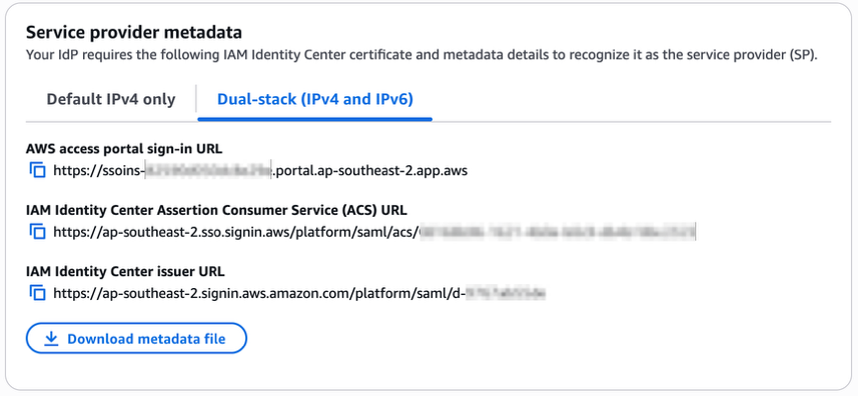
  1. Update the single sign-on settings in your IdP to use the new dual-stack URLs. First, locate the URLs in the AWS Management Console for IAM Identity Center.
    1. Choose Settings in the navigation pane and then select Identity source.
    2. Choose Actions and select Manage authentication.
    3. in Under Manage SAML 2.0 authentication, you will find the following URLs under Service provider metadata:
      • AWS access portal sign-in URL
      • IAM Identity Center Assertion Consumer Service (ACS) URL
      • IAM Identity Center issuer URL
  2. If your IdP supports multiple ACS URLs, then add the dual-stack URL to your IdP configuration alongside existing IPv4 one. With this setting, you and your users can decide when to start using the dual-stack endpoints, without all users in your organization having to switch together.

    Figure 2: Dual-stack single sign-on URLs

    Figure 2: Dual-stack single sign-on URLs

  3. If your IdP does not support multiple ACS URLs, replace the existing IPv4 URL with the new dual-stack URL, and switch your workforce to use only the dual-stack endpoints.
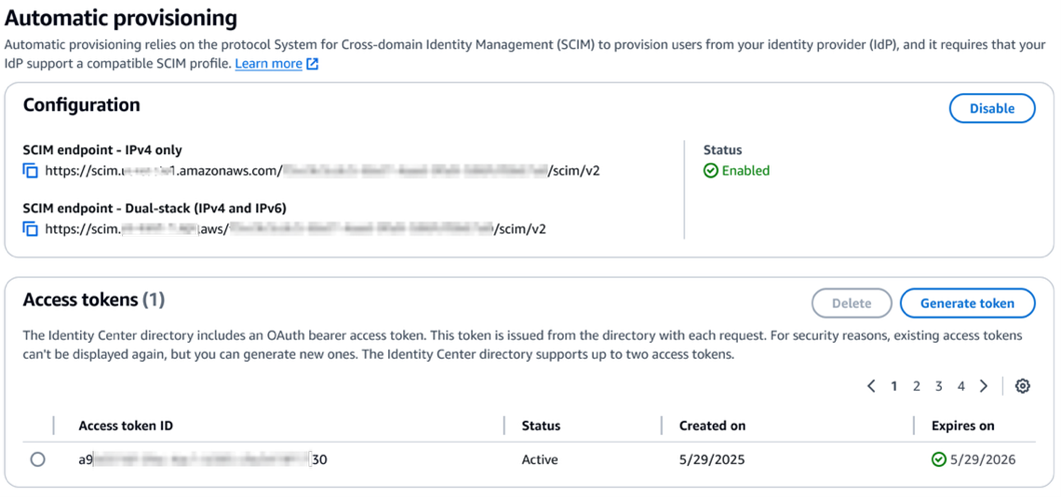
  4. Update the provisioning endpoint in your IdP. Choose Settings in the navigation pane and under Identity source, choose Actions and select Manage provisioning. Under Automatic provisioning, copy the new SCIM endpoint that ends in api.aws. Update this new URL in your external IdP.

    Figure 3: Dual-stack SCIM endpoint URL

    Figure 3: Dual-stack SCIM endpoint URL

Step 2: Locate and share the new dual-stack endpoints

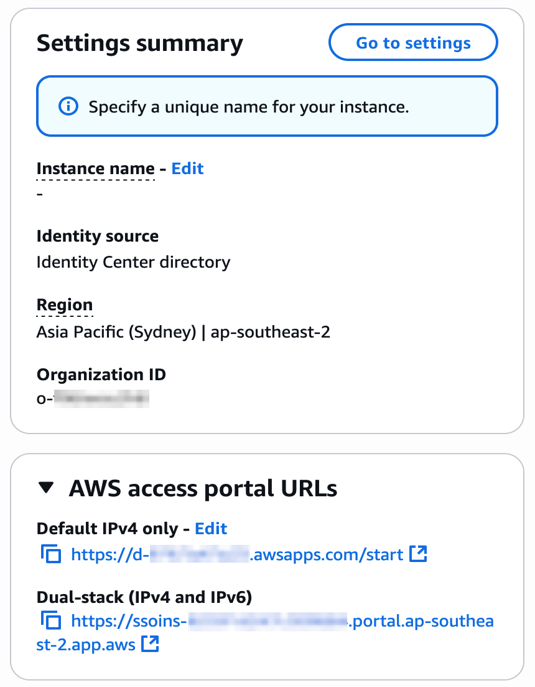
Your organization needs two kinds of URLs for IPv6 connectivity. The first is the new dual-stack access portal URL that your workforce users use to access their assigned AWS applications and accounts. The dual-stack access portal URL is available in the IAM Identity Center console, listed as the Dual-stack in the Settings summary (you might need to expand the Access portal URLs section, shown in Figure 4).

Figure 4: Locate dual-stack access portal endpoints

Figure 4: Locate dual-stack access portal endpoints

This dual-stack URL ends with app.aws as its top-level domain (TLD). Share this URL with your workforce and ask them to use this dual-stack URL to connect over IPv6. As an example, if your workforce uses the access portal to access AWS accounts, they will need to sign in through the new dual-stack access portal URL when using IPv6 connectivity. Alternately, if your workforce accesses the application URL, you need to enable the dual-stack application URL following application-specific instructions. For more information, see AWS services that support IPv6.

The URLs that administrators use to manage IAM Identity Center are the second kind of URL your organization needs. The new dual-stack service endpoints end in api.aws as their TLD and are listed in the Identity Center service endpoints. Administrators can use these service endpoints to manage users and groups in Identity Center, update their access to applications and resources, and perform other management operations. As an example, if your administrator uses identitystore.{region}.amazonaws.com to manage users and groups in Identity Center, they should now use the dual-stack version of the same service endpoint which is identitystore.{region}.api.aws, so they can connect to service endpoints using IPv6 clients and networks.

If your users or administrators use an AWS SDK to access AWS applications and accounts or manage services, follow Dual-stack and FIPS endpoints to enable connectivity to the dual-stack endpoints.

After completing these two steps, your workforce and administrators can connect to IAM Identity Center using IPv6. Remember, these endpoints also support IPv4, so clients not yet IPv6-capable can continue to connect using IPv4.

Monitoring dual-stack endpoint usage

You can optionally monitor AWS CloudTrail logs to track usage of dual-stack endpoints. The key difference between IPv4-only and dual-stack endpoint usage is the TLD and appears in the clientProvidedHostHeader field. The following example shows the difference between these CloudTrail events for the CreateTokenWithIAM API call.

IPv4-only endpoints Dual-stack endpoints
"CloudTrailEvent": {
  "eventName": "CreateToken",
  "tlsDetails": {
     "tlsVersion": "TLSv1.3",
     "cipherSuite": "TLS_AES_128_GCM_SHA256",
     "clientProvidedHostHeader": "oidc.us-east-1.amazonaws.com"
  }
}
"CloudTrailEvent": {
  "eventName": "CreateToken",
  "tlsDetails": {
     "tlsVersion": "TLSv1.3",
     "cipherSuite": "TLS_AES_128_GCM_SHA256",
     "clientProvidedHostHeader": "oidc.us-east-1.api.aws"
  }
}

Conclusion

IAM Identity Center now allows clients to connect over IPv6 natively with no network address translation infrastructure. This post showed you how to transition your organization to use IPv6 with Identity Center and its integrated applications. Remember that existing IPv4 endpoints will continue to function, so you can transition at your own pace. Also, no immediate action is required by you. However, we recommend planning your transition to take advantage of IPv6 benefits and meet compliance requirements. If you have questions, comments, or concerns, contactΒ AWS Support, or start a new thread in the IAM Identity Center re:Post channel.

Β 
If you have feedback about this post, submit comments in the Comments section below. If you have questions about this post, contact AWS Support.
Β 

Suchintya Dandapat Suchintya Dandapat
Suchintya Dandapat is a Principal Product Manager for AWS where he partners with enterprise customers to solve their toughest identity challenges, enabling secure operations at global scale.
  •  

Social Engineering and Microsoft SSPR: The Road to Pwnage is Paved with Good IntentionsΒ 

Social Engineering and Microsoft SSPR

This scenario simultaneously tests identity confirmation tooling (SSPR, MFA, Conditional Access), how users act under pressure, and the organization's ability to detect and follow-up on social engineering attacks.

The post Social Engineering and Microsoft SSPR: The Road to Pwnage is Paved with Good IntentionsΒ  appeared first on Black Hills Information Security, Inc..

  •  

How To Deploy Windows Optics: Commands, Downloads, Instructions, and Screenshots

Jordan Drysdale & Kent Ickler // TL;DR Look for links, download them. Look for GPOs, import them. Look for screenshots, for guidance. Sysmon + Windows Audit Policies + Event Collectors […]

The post How To Deploy Windows Optics: Commands, Downloads, Instructions, and Screenshots appeared first on Black Hills Information Security, Inc..

  •  

Abusing Delegation with Impacket (Part 3): Resource-Based Constrained Delegation

This is the third in a three-part series of blog posts discussing how to abuse Kerberos delegation! If you haven't already, feel free to read the first blog post, as they discuss the Kerberos authentication process and how delegation plays an important role in solving the double-hop problem, and how to abuse unconstrained delegation.

The post Abusing Delegation with Impacket (Part 3): Resource-Based Constrained Delegation appeared first on Black Hills Information Security, Inc..

  •  

Abusing Delegation with Impacket (Part 2): Constrained Delegation

This is the second in a three-part series of blog posts discussing how to abuse Kerberos delegation! If you haven't already, feel free to read the first blog post, as it discusses the Kerberos authentication process and how delegation plays an important role in solving the double-hop problem.

The post Abusing Delegation with Impacket (Part 2): Constrained Delegation appeared first on Black Hills Information Security, Inc..

  •  

Abusing Delegation with Impacket (Part 1): Unconstrained Delegation

In Active Directory exploitation, Kerberos delegation is easily among my top favorite vectors of abuse, and in the years I’ve been learning Kerberos exploitation, I’ve noticed that Impacket doesn’t get nearly as much coverage as tools like Rubeus or Mimikatz.

The post Abusing Delegation with Impacket (Part 1): Unconstrained Delegation appeared first on Black Hills Information Security, Inc..

  •  

Wrangling Windows Event Logs with Hayabusa & SOF-ELK (Part 2)

But what if we need to wrangle Windows Event Logs for more than one system? In part 2, we’ll wrangle EVTX logs at scale by incorporating Hayabusa and SOF-ELK into my rapid endpoint investigation workflow (β€œREIW”)!Β 

The post Wrangling Windows Event Logs with Hayabusa & SOF-ELK (Part 2) appeared first on Black Hills Information Security, Inc..

  •  

DomCat: A Domain Categorization Tool

DomCat is a command-line tool written in Golang that helps the user find expired domains with desirable categorizations.

The post DomCat: A Domain Categorization Tool appeared first on Black Hills Information Security, Inc..

  •  

Wrangling Windows Event Logs with Hayabusa & SOF-ELKΒ (Part 1)

In part 1 of this post, we’ll discuss how Hayabusa and β€œSecurity Operations and Forensics ELK” (SOF-ELK) can help us wrangle EVTX files (Windows Event Log files) for maximum effect during a Windows endpoint investigation!

The post Wrangling Windows Event Logs with Hayabusa & SOF-ELKΒ (Part 1) appeared first on Black Hills Information Security, Inc..

  •  

Microsoft Store and WinGet: Security Risks for Corporate Environments

The Microsoft Store provides a convenient mechanism to install software without needing administrator permissions. The feature is convenient for non-corporate and home users but is unlikely to be acceptable in corporate environments. This is because attackers and malicious employees can use the Microsoft Store to install software that might violate organizational policy.Β 

The post Microsoft Store and WinGet: Security Risks for Corporate Environments appeared first on Black Hills Information Security, Inc..

  •  

Stop Spoofing Yourself! Disabling M365 Direct Send

Remember the good β€˜ol days of Zip drives, Winamp, the advent of β€œOffice 365,” and copy machines that didn’t understand email authentication? Okay, maybe they weren’t so good! For a […]

The post Stop Spoofing Yourself! Disabling M365 Direct Send appeared first on Black Hills Information Security, Inc..

  •  

Hunt for Weak Spots in Your Wireless Network with Airodump-ng from the Aircrack-ng Suite

In this blog, I’m going to walk you through how to get started with airodump-ng and some of the techniques that you can use to home in on access points of interest.

The post Hunt for Weak Spots in Your Wireless Network with Airodump-ng from the Aircrack-ng Suite appeared first on Black Hills Information Security, Inc..

  •  

Detecting ADCS Privilege Escalation

Active Directory Certificate Services (ADCS) is used to manage certificates for systems, users, applications, and more in an enterprise environment. Misconfigurations in ADCS can introduce critical vulnerabilities into an enterprise Active Directory environment.

The post Detecting ADCS Privilege Escalation appeared first on Black Hills Information Security, Inc..

  •  

Vulnerability Scanning with NmapΒ 

Nmap, also known as Network Mapper, is a commonly used network scanning tool. As penetration testers, Nmap is a tool we use daily that is indispensable for verifying configurations and identifying potential vulnerabilities.

The post Vulnerability Scanning with NmapΒ  appeared first on Black Hills Information Security, Inc..

  •  
❌