Reading view

Operationalizing AWS security: A maturity roadmap

Enabling security tooling is the starting point. Making it operational—where findings drive decisions, response times are measurable, and your security posture improves week over week—is where most organizations struggle.

This blog post provides a phased maturity roadmap for organizations that have already enabled AWS Security Hub and Amazon GuardDuty. These two services form the foundation of a cloud-centered security operations capability on AWS. Security Hub provides centralized security posture management and aggregates findings from multiple AWS security services, while GuardDuty provides intelligent threat detection by continuously monitoring for malicious activity and unauthorized behavior. For any production or enterprise AWS environment, having both services enabled across all accounts and AWS Regions is a baseline expectation; not because they’re optional add-ons, but because effective security operations require both the ability to detect threats and the ability to understand your overall security posture. If you haven’t yet enabled them, the Security Hub documentation and GuardDuty documentation provide setup guidance, including multi-account deployment with AWS Organizations.

Customers consistently tell us that while individual AWS security service documentation is thorough, what’s missing is a consolidated operational playbook—one resource that ties the services together into a working security operations practice with clear phases, progression criteria, and an operational cadence. That’s the gap this post fills. Rather than covering how each feature works (the documentation does that well), this post focuses on when and why to use each capability, and how to build the organizational habits that make them effective.

What follows is a six-phase roadmap for moving from these services are active to these services are driving our security operations. Each phase builds on the previous one, and each is designed to deliver tangible, measurable improvement.

Phase 0: Assess your current state

Goal: Understand what’s working before changing anything.

Estimated timeline: 1–2 weeks

Move to Phase 1 when: You have a documented current-state assessment covering all the following items.

Before introducing new processes or automation, establish a clear picture of the current environment. This assessment informs every decision that follows.

Actions:

  • Findings inventory: Review existing active GuardDuty findings to determine how many there are, the severity distribution, and how old the oldest findings are. A large backlog of untouched HIGH or CRITICAL findings that have been sitting for weeks is a strong signal about where to focus first.
  • Security Hub score baseline: Determine your current compliance score against AWS Foundational Security Best Practices (FSBP) and The CIS AWS Foundations Benchmark. Check to see which standards are enabled; if multiple standards are enabled, review for overlapping standards (creating noise) or unused standards.
  • Multi-account and multi-Region check: Look to see if GuardDuty is enabled in every account and every Region, or only in Regions with active workloads. Threat actors frequently operate in Regions that organizations don’t actively monitor. Also check to see if Security Hub aggregation is configured with a delegated administrator account or if each account is being managed independently.
  • Integration check: Determine if GuardDuty findings are flowing into Security Hub and if Amazon Inspector and Amazon Macie are enabled and feeding findings in. Without integration, Security Hub might be only surfacing its own compliance checks.
  • Notification check: See if there’s an Amazon EventBridge rule configured for notifications and if so, how findings are being routed and to whom. Know if notifications are being sent using an Amazon Simple Notification Service (Amazon SNS) topic or a chat channel integration. Without a clear notification and response workflow, findings can accumulate silently in the console with no one looking at them.

Deliverable: A one-page current state assessment that identifies what’s enabled, what’s flowing where, who’s looking at it, and what’s in the existing backlog.

Phase 1: Reduce the noise

Goal: Make the signal meaningful before asking anyone to act on it.

Estimated timeline: 2–3 weeks

Move to Phase 2 when: Remaining findings represent items requiring real decisions, compliance scores reflect actual posture, and you can articulate why every suppression rule and disabled control exists.

This is the single most important phase. If this step is skipped in favor of jumping straight to automation, the result is automated chaos. Alert fatigue is the primary reason security tooling is ignored, and addressing it first is what makes everything that follows sustainable.

GuardDuty tuning:

  • Create suppression rules for known-benign findings. The goal is to suppress activity you’ve already evaluated and accepted—such as expected traffic from corporate egress IPs (based on trusted IP lists), internal tools that trigger DNS-based findings, or internet-facing resources that naturally receive port scanning. The principle: if you’ve investigated a finding and it’s expected, suppress it so your team can focus on what matters.
  • Triage every active HIGH and CRITICAL finding into three categories: needs immediate investigation (real threat, not yet reviewed), true positive, already addressed (archive using workflow status), or false positive or expected behavior (create a suppression rule). Every finding must be categorized into one of these three states.
  • Review GuardDuty protection plans and enable any that are relevant but not yet active. Organizations that enabled GuardDuty years ago might not have activated protection plans released since then (such as Runtime Monitoring, Malware Protection, RDS Protection, and Lambda Protection). Evaluate each against your workload profile and enable what applies.

Security Hub tuning:

  • Disable controls that aren’t relevant to the environment. This is the highest-value quick win. If a service isn’t in use, disable its controls. If a control is addressed by an alternative solution, disable it. A 47% compliance score where half the failures are irrelevant trains teams to ignore the dashboard entirely. See the Security Hub controls reference for the full list.
  • Choose a primary standard. AWS Foundational Security Best Practices is a strong default. The CIS AWS Foundations Benchmark adds value when there’s a specific compliance mandate. Avoid enabling PCI DSS or NIST 800-53 standards unless there’s a reporting requirement—they add significant volume without proportional signal for most organizations.
  • Configure cross-Region aggregation to the delegated administrator account if not already in place. A single aggregated view eliminates the need to check findings across multiple Regional consoles.
  • Use the workflow status field operationally. Findings should progress from NEW to NOTIFIED to RESOLVED or SUPPRESSED. If everything remains in NEW indefinitely, the system carries no operational meaning.

Deliverable: A tuned environment where remaining findings represent items that require real decisions. Compliance scores should now reflect your organization’s actual security posture rather than noise.

Phase 2: Build the notification and routing layer

Goal: Get the right findings to the right people at the right time.

Estimated timeline: 2–3 weeks

Move to Phase 3 when: CRITICAL and HIGH findings reach the security team within minutes, MEDIUM findings create tracked tickets, and notifications include enriched context. No action is taken until a person or an automation is informed that something needs attention.

Architecture: Security Hub to EventBridge rule to routing logic to destination

Tiered notification strategy:

CRITICAL Page on-call immediately PagerDuty or Opsgenie 15 minutes
HIGH Alert security team channel Slack or Teams channel and ticket creation 4 hours
MEDIUM Create ticket for review Jira or ServiceNow 48 hours
LOW or INFORMATIONAL Batch digest Weekly email summary or dashboard review Next review cycle

Key design decisions:

  • Route from Security Hub, not individual services. Because findings from GuardDuty, Inspector, Macie, and Security Hub compliance checks all aggregate in Security Hub, build your EventBridge rules there for centralized management.
  • Create a fast path for the most dangerous finding types. Certain GuardDuty findings, particularly those involving credential exfiltration, cryptocurrency activity, trojans, and active compromises, warrant a separate, faster routing path that bypasses normal triage. Identify these based on your threat model and the GuardDuty finding types reference.
  • Enrich notifications before delivery. A raw JSON finding in a chat channel provides little actionable context. Use an AWS Lambda function to format notifications with the information responders need: account alias, Region, Amazon Resource Name (ARN), finding type, severity, a console deep link, and a plain-language description. The Security Hub CloudWatch Events integration guide describes the event format.

Deliverable: A working notification pipeline where CRITICAL and HIGH findings reach the security team within minutes, MEDIUM findings create tracked work items, and LOW and INFORMATIONAL findings are batched for periodic review.

Phase 3: Build automated remediation for high-confidence findings

Goal: For findings where the correct response is deterministic, remove the human from the loop.

Estimated timeline: 3–4 weeks

Move to Phase 4 when: At least 3–5 high-confidence finding types have automated responses deployed with audit trails, and the team has established a process for evaluating new auto-remediation candidates.

The guiding principle: Only auto-remediate when all three conditions are met: the finding is high-confidence, the response is deterministic, and the blast radius of the automated action is limited. Automated remediation must not create the risk of a production outage.

Decision framework:

Confidence level High – no false positive risk Medium – context-dependent Low – requires investigation
Response complexity Single, well-defined action Multiple steps or judgment calls Requires forensic analysis
Blast radius Limited to one resource Could affect dependent services Production-wide impact
Rollback difficulty Straightforward to reverse Moderate effort to reverse Difficult or impossible to reverse

Common auto-remediation categories:

  • Instance isolation for confirmed compromise findings (cryptocurrency mining, malware, and trojans): Replace the security group, snapshot volumes for forensics, and notify.
  • Credential revocation for confirmed credential compromise: Attach deny-all policies, revoke sessions, and deactivate access keys as appropriate to the credential type.
  • Compliance drift correction for deterministic misconfigurations: Re-enable Amazon Simple Storage Service (Amazon S3) Block Public Access, revoke overly permissive security group rules, and re-enable AWS CloudTrail logging.
  • Notification-only escalation for findings that require human judgment before action: Amazon Elastic Block Store (Amazon EBS) encryption gaps (require migration) and access key rotation (requires coordination with the key owner).

For implementation, AWS provides Security Hub Automated Response and Remediation (SHARR), a solution that includes pre-built remediation playbooks deployed as AWS Step Functions workflows triggered by EventBridge. This is a strong starting point—evaluate the provided playbooks, enable the ones that fit, and extend with custom remediations as needed.

Note: For findings that recur because the environment lacks preventive guardrails, the best long-term response is often a service control policy (SCP) that prevents the misconfiguration from occurring in the first place. Phase 5 covers this preventive controls layer.

Deliverable: A library of automated and semi-automated remediation runbooks with full audit trails, and a documented decision framework the team uses to evaluate new auto-remediation candidates.

Phase 4: Build the operational rhythm

Goal: Turn security findings management into a sustained organizational practice, not a one-time cleanup.

Estimated timeline: 4–6 weeks to establish, then ongoing

Move to Phase 5 when: The weekly cadence has been running consistently for at least 8 weeks, monthly metrics show positive trends, and the first quarterly review has been completed.

This is where many organizations stall, and it’s the most important phase in the entire roadmap. The technology is working, the notifications are flowing, automated remediations are firing, but there’s no organizational habit built around it. Without this phase, everything you’ve built in Phases 0–3 will gradually decay. Suppression rules will go stale, new team members won’t know the system exists, and findings will start accumulating again. The operational rhythm is what converts a security tooling deployment into a security operations practice.

Weekly security review (30 minutes)

Attendees: Security team lead, cloud platform team representative, rotating engineering lead from an application team

Why the rotating engineering lead matters: Security findings don’t exist in a vacuum; they’re generated by workloads that engineering teams own. Rotating an engineering representative through this meeting accomplishes three things: it builds security awareness across the organization, ensures findings are routed to people with the context to resolve them, and creates organizational accountability beyond the security team.

Agenda template:

5 minutes Compliance score trend – Review Security Hub scores by account and standard. Is the trend improving, declining, or flat? If declining, why? Security lead Identified regression areas
5 minutes Critical and high findings review – Walk through new HIGH and CRITICAL GuardDuty findings from the past week. Are there any that need immediate escalation? Security lead Escalation actions assigned
10 minutes Top five failing controls – Identify the five Security Hub controls with the most failures. Assign an owner and a target date for each. Platform lead Owners and dates documented
5 minutes Automation review – Did any auto-remediations fire this week? Did they work correctly? Were there any false triggers? Security lead Automation adjustments queued
5 minutes Tuning decisions – Are new suppression rules needed based on this week’s findings? Are any new finding types candidates for auto-remediation? All Tuning backlog updated

Running the meeting effectively:

  • Keep a running document (such as a wiki page or shared document) that captures decisions and action items week over week. This becomes your institutional memory.
  • If the compliance score hasn’t moved in over 3 weeks, that’s a signal. Either the assigned work isn’t happening, or the remaining findings are genuinely difficult to address. Both need to be discussed.
  • Track action items from previous weeks. A review that generates action items but never follows up on them will lose credibility and attendance quickly.

Escalation procedures

Define clear escalation paths before they’re needed:

CRITICAL finding not acknowledged within the SLA Auto-escalate to security team manager 15 minutes after SLA breach
HIGH finding not resolved within the SLA Escalate to finding owner’s manager 4 hours after SLA breach
Compliance score drops more than 5 points in a week Escalate to cloud platform team lead for investigation Next business day
Auto-remediation failure Page security on-call Immediate
New finding type not covered by existing runbooks Add to weekly review agenda for triage and runbook development Next weekly review

Monthly metrics report

Compile these metrics monthly and review them with security and engineering leadership. The goal is to tell a story about whether the organization’s security posture is improving, stable, or degrading, and why.

Mean time to acknowledge (MTTA) for CRITICAL findings Are findings being seen promptly? Decreasing month over month
Mean time to resolve (MTTR) for CRITICAL and HIGH findings Are findings being acted on? Decreasing month over month
Security Hub compliance score by standard, by account What is the posture trend over time? Increasing month over month
Number of active GuardDuty findings by severity Is the backlog growing or shrinking? Decreasing for HIGH and CRITICAL
Findings auto-remediated compared to manually resolved Is automation delivering value? Auto-remediation ratio increasing
Number of suppressed findings (with quarterly justification review) Is noise being managed, or are problems being hidden? Stable or decreasing
New findings introduced compared to resolved this month Is the organization getting ahead or falling behind? More finding resolved than introduced
SLA adherence rate by severity Are response commitments being met? More than 95% for CRITICAL, and more than 90% for HIGH

Building the dashboard: Use Amazon CloudWatch dashboards for real-time operational visibility or Amazon QuickSight connected to Security Hub findings through Amazon Security Lake for historical trend analysis and executive reporting. The dashboard should be visible to—and regularly viewed by—everyone in the weekly review, not locked in a security team tool.

Quarterly reviews

The quarterly review is a deeper inspection of the system itself; not just the findings, but the machinery processing them.

Quarterly review checklist:

  • Suppression rules audit: Review every active suppression rule to determine if the underlying condition is still present and the suppression is still justified. Document the review outcome for each rule.
  • Disabled controls audit: Review every disabled Security Hub control. Check that the justification is still valid and if the environment changed (for example, a service that wasn’t in use is now in use).
  • Automation audit: Review AWS Identity and Access Management (IAM) roles used by remediation functions and verify least privilege. Review execution logs for any anomalies or failures that weren’t caught.
  • New capabilities review: Evaluate newly released GuardDuty protection plans and Security Hub controls from that quarter. AWS releases new detection and compliance capabilities regularly. If you’re not reviewing them quarterly, you’re accumulating blind spots.
  • Process effectiveness review: Determine if the weekly meeting is well-attended and if action items are being completed. Make sure SLAs are being met. If attendance, action item completion, and SLA compliance aren’t where they should be, explore structural changes to address the gaps.

Operational maturity scoring

Use this rubric to assess the maturity of your operational rhythm itself. Score each dimension 1–3 and use the total to track progress over time.

Review cadence One time reviews when someone remembers Weekly review happens, but attendance is inconsistent Weekly review is consistently attended with documented outcomes
Metrics tracking No metrics captured Metrics are collected monthly but not acted on Metrics drive decisions and declining trends trigger specific actions
Finding ownership Findings sit in queue with no owner Findings are assigned to teams but SLAs aren’t tracked Every finding has an owner, SLAs are tracked, and breaches are escalated
Automation management Set-and-forget automations Automation logs are reviewed periodically Automation is reviewed weekly, and new candidates are evaluated continuously
Tuning lifecycle Suppression rules created but never reviewed Annual review of suppressions and disabled controls Quarterly reviews with documented justification for every rule
Cross-team engagement Security team works in isolation Platform team participates Engineering teams actively participate and own remediation

Scoring (revisit quarterly):

  • Beginning: 6–9
  • Established: 10–14
  • Optimized: 15–18

Deliverable: A documented operational cadence with clear ownership (consider a RACI matrix), metrics dashboards, escalation procedures, and a continuous improvement loop. The cadence should survive team member turnover—if it depends on one person remembering to run it, it’s not yet operational.

Phase 5: Mature the architecture

Goal: Fill remaining gaps and build toward a comprehensive security operations capability. Estimated timeline: Ongoing. Prioritize based on organizational risk profile and compliance requirements.

  • Amazon Inspector integration: Enable Amazon Inspector for Amazon Elastic Compute Cloud (Amazon EC2) instances, Lambda functions, and Amazon Elastic Container Registry (Amazon ECR) container images. Findings flow into Security Hub automatically, adding vulnerability management alongside threat detection and posture management. Prioritize this if you have Amazon EC2 or container workloads without an existing vulnerability scanning solution.
  • Amazon Macie: Enable Amazon Macie for S3 buckets containing potentially sensitive data. Particularly important for organizations with compliance requirements around personally identifiable information (PII), protected health information (PHI), or Payment Card Industry (PCI) data. Configure automated sensitive data discovery and route findings to Security Hub.
  • Amazon Security Lake: Amazon Security Lake centralizes security-relevant logs in OCSF format for long-term retention, forensic investigation, and threat hunting. This is valuable when you need historical analysis beyond the Security Hub retention window, or when feeding a third-party Security Information and Event Management (SIEM) tool.
  • Preventive controls layer: Convert recurring detective findings into preventive policies. Use SCPs to prevent disabling GuardDuty, Security Hub, and CloudTrail, IAM permission boundaries on developer roles, AWS WAF on public endpoints, and AWS Network Firewall for VPC traffic inspection. The pattern is to make recurring misconfigurations impossible to introduce.
  • Detective controls expansion: Use AWS IAM Access Analyzer for external access and unused access findings, AWS CloudTrail Lake for long-term queryable audit logs, and AWS Config custom rules for organization-specific compliance checks.
  • Incident response readiness: Have incident response playbooks referencing specific GuardDuty finding types, pre-built forensics infrastructure (isolated VPC, forensic AMIs, and pre-configured IAM roles), regular tabletop exercises, and AWS CloudFormation templates to deploy isolation infrastructure on demand. See the AWS Security Incident Response Guide for a comprehensive framework.

Conclusion

In this post, I provided a six-phase roadmap for operationalizing Security Hub and GuardDuty and showed that it isn’t a single project, but a progression. Phase 0 and Phase 1 can typically be completed in 3–5 weeks and deliver immediate clarity. Phases 2 and 3 build the response infrastructure that turns findings into action over the following 5–7 weeks. Phase 4 is what makes everything sustainable and is where you should invest the most attention. And Phase 5 expands the aperture from Security Hub and GuardDuty into a comprehensive security operations capability.

If you walked away from this post and did one thing, run the Phase 0 assessment this week. That single deliverable tells you exactly where to focus next. Use the following self-assessment checklist to identify your current phase, then focus on the next one. A tuned environment with working notifications and a weekly review cadence is dramatically more effective than a fully featured but neglected deployment. Start where you are, reduce the noise, build the habits, and iterate. To learn more, explore the AWS Security Hub User Guide, the Amazon GuardDuty User Guide, and the AWS Security Incident Response Guide. If you’ve implemented a similar operational cadence, or have questions about any phase, share your experience in the comments.

Self-assessment checklist

Phase 0 We know how many active GuardDuty findings exist across all accounts
We know our current Security Hub compliance score
We know whether GuardDuty is enabled in every account and region
We know who (if anyone) is reviewing findings today
Phase 1 GuardDuty suppression rules exist for known-benign activity
Irrelevant Security Hub controls have been disabled with documented justification
All active HIGH and CRITICAL findings have been triaged
Security Hub compliance scores reflect actual posture, not noise
Phase 2 HIGH and CRITICAL findings generate real-time notifications to the security team
MEDIUM findings automatically create tracked work items
Notifications include enriched context (account alias, resource ARN, and console link)
Phase 3 At least three high-confidence finding types trigger automated remediation
Auto-remediation actions have full audit trails
Remediation runbooks are documented and version-controlled
Phase 4 A weekly security review meeting occurs with defined attendees and agenda
MTTA and MTTR are tracked monthly for CRITICAL and HIGH findings
Suppression rules and disabled controls are reviewed quarterly
Security metrics trend positively over the past 3 months
Phase 5 Amazon Inspector, Macie, or Security Lake are integrated
Preventive controls (SCPs, permission boundaries) address recurring findings
Incident response playbooks exist and are tested through tabletop exercises

If you have feedback about this post, submit comments in the Comments section below.

Joseph Sadler

Joseph Sadler

Joseph is a Senior Solutions Architect on the Worldwide Public Sector team at AWS, specializing in cybersecurity and machine learning. With public and private sector experience, he has expertise in cloud security, artificial intelligence, threat detection, and incident response. His diverse background helps him architect robust, secure solutions that use cutting-edge technologies to safeguard mission-critical systems

  •  

May 2026 CVE Landscape

In May 2026, Insikt Group® identified 41 high-impact vulnerabilities that should be prioritized for remediation, all of which had a Very Critical Recorded Future Risk Score. This represents an 11% increase from last month.

These vulnerabilities affected products from 20 vendors. 21 of the 41 vulnerabilities were included in the US Cybersecurity and Infrastructure Security Agency (CISA)’s Known Exploited Vulnerabilities (KEV) catalog, 19 were surfaced through honeypot data, and one was reported by a cybersecurity vendor.

The 41 vulnerabilities in this report affected products from 20 vendors. Vercel accounted for approximately 27% of the vulnerabilities, driven by honeypot-sourced Next.js activity. The remaining exposure was concentrated across a range of enterprise software, security, networking, developer tooling, and cloud-related products.

Quick Reference: May 2026 Vulnerability Table

All 22 vulnerabilities below were actively exploited in May 2026. This table does not include the 19 CVEs associated with honeypot activity, which are available to Recorded Future customers via the CVE Monthly Report. The table below also provides examples of public PoCs identified by Insikt Group®. These PoCs were not tested for accuracy or efficacy. Vulnerability management teams should exercise caution and verify the validity of PoCs before testing.

#
Vulnerability
Risk
Score
Vendor/Product
KEV
Malware Analysis
RCE
PoC
1
CVE-2008-4250
99
Microsoft Windows
2
CVE-2009-1537
99
Microsoft DirectX
3
CVE-2009-3459
99
Adobe Acrobat and Reader
4
CVE-2010-0249
99
Microsoft Internet Explorer
5
CVE-2010-0806
99
Microsoft Internet Explorer

(available to Recorded Future Customers)

6
CVE-2025-34291
99
Langflow
7
CVE-2026-0257
99
Palo Alto Networks PAN-OS, Cloud NGFW, and Prisma Access
8
CVE-2026-0300
99
Palo Alto Networks PAN-OS, Cloud NGFW, Prisma Access
9
CVE-2026-20182
99
Cisco Catalyst SD-WAN and SD-WAN Manager
10
CVE-2026-31431
99
Linux Kernel

(available to Recorded Future Customers)

11
CVE-2026-34926
99
Trend Micro Apex One (On-Premise)
12
CVE-2026-41091
99
Microsoft Defender
13
CVE-2026-42208
99
BerriAI LiteLLM
14
CVE-2026-42897
99
Microsoft Exchange Server
15
CVE-2026-45321
99
TanStack (Multiple Packages)
16
CVE-2026-45498
99
Microsoft Defender
17
CVE-2026-48027
99
Nx Console
18
CVE-2026-48172
99
LiteSpeed cPanel Plugin
19
CVE-2026-6973
99
Ivanti Endpoint Manager Mobile (EPMM)
20
CVE-2026-8398
99
Daemon Tools Lite
21
CVE-2026-9082
99
Drupal Core
22
CVE-2026-26980
99
Ghost CMS

(available to Recorded Future Customers)

Table 1: List of vulnerabilities that were actively exploited in May, 2026 based on Recorded Future data (excluding honeypot-sourced CVEs).

Key Trends: May 2026

  • In May 2026, threat actors exploited a Ghost CMS vulnerability in large-scale ClickFix and FakeCaptcha poisoning campaigns.
    • The campaigns used compromised Ghost CMS websites to inject malicious JavaScript, redirect victims through social engineering lures, and stage dropper and loader payloads from attacker-controlled infrastructure.
  • 12 of the 41 vulnerabilities enabled remote code execution (RCE), affecting products from 8 vendors: Microsoft, Adobe, Langflow, Palo Alto Networks, Apache, openDCIM, Fortinet, and Ivanti.
  • Insikt Group identified public proof-of-concept (PoC) exploits for 32 of the 41 vulnerabilities reported this month.
  • The most commonly observed flaws this month were CWE-79 (Cross-site Scripting), CWE-506 (Embedded Malicious Code), and CWE-89 (SQL Injection), with three CVEs each.
  • 5 of the 41 vulnerabilities in this month’s prominent vulnerabilities table were first disclosed between 2008 and 2010, making them at least 15 years old, with the oldest vulnerability being approximately 18 years old.
    • This reinforces our finding that attackers continue to exploit long-known weaknesses in environments where patching has lagged.
    • Additionally, the fastest observed time from a vulnerability’s public disclosure to exploitation was less than one day.

Exploitation Analysis

This section highlights some of the highest-impact, actively exploited vulnerabilities this month, specifically those linked to known threat actor campaigns or that have public PoC exploits available. Vulnerabilities with no meaningful public technical detail are summarized in the quick reference table above only.

Threat Actors Exploit CVE-2026-26980 in Ghost CMS To Conduct Large-Scale ClickFix Poisoning Campaigns, Sample Available From Recorded Future Malware Intelligence

On May 21, 2026, cybersecurity firm XLab published a technical analysis detailing large-scale ClickFix poisoning campaigns targeting vulnerable Ghost Content Management System (CMS) instances by exploiting CVE-2026-26980. Ghost CMS allows users to create, manage, and publish content for blogs, media sites, newsletters, and subscription-based websites through a node.js-based publishing platform.

CVE-2026-26980 is a critical SQL injection vulnerability in Ghost CMS that allows unauthenticated threat actors to extract Ghost Admin API Keys and modify website content through the Ghost Admin API.

As previously reported by Insikt Group®, at least two threat groups exploited CVE-2026-26980 to inject malicious JavaScript into more than 700 compromised Ghost CMS websites across industries, including blockchain, artificial intelligence (AI), and financial technology (fintech). According to XLab, the threat actors used the compromised websites to deliver ClickFix and FakeCaptcha social engineering attacks that tricked victims into executing malicious commands and malware payloads on their systems.

Insikt Group® obtained one of the malicious samples, UtilifySetup.exe, from Recorded Future Malware Intelligence. The sample matched the sandbox YARA rule for detecting Inno Setup packaging. Based on sandbox and static code analysis, the sample performs the following actions on a victim’s machine:

  • Conducts DLL injection
  • Retrieves the system language and geolocation using the Windows registry
  • Drops files named UtilifySetup.tmp (SHA256: 7790fd1035266000ed6d6cc35822f7683f5271663af8a5b5effadff85316df6d) and Grape.exe
  • Enumerates files and directories
  • Retrieves system information
  • Delays execution using the Sleep API function for evasion
  • Detects debuggers using the GetTickCount API function to compare the timing and the IsDebuggerPresent API function
  • Creates a file inside the C:\Users\user\AppData\Local\SuperMaxionQuickMaxlite directory, corroborating XLab’s analysis
  • Terminates running processes

Sandbox analysis categorized UtilifySetup.tmp as malicious due to the sample exhibiting discovery capabilities. Based on sandbox and static code analysis, the sample performs the following actions on a victim’s machine:

  • Conducts DLL injection
  • Retrieves the system language and geolocation using the Windows registry
  • Executes UtilifySetup.exe installer from the %Temp% directory using internal Inno Setup /SL5 launch parameters
  • Executes a file named Grape.exe inside the C:\Users\user\AppData\Local\SuperMaxionQuickMaxlite directory

Once executed, Grape.exe performs the following actions on a victim’s machine:

  • Adds a Windows registry Run key entry named electron.app.Grape set to execute itself when the victim logs in
  • Enumerates running processes
  • Sends DNS request to web-telegram[.]ug

Further technical details associated with this activity, including sample analysis, MITRE ATT&CK techniques, and IoCs, are available to Recorded Future customers via Insikt Group® reporting.

Recorded Future customers can also access Malware Intelligence queries that surface samples communicating with campaign-associated URLs, domains, and IP addresses.

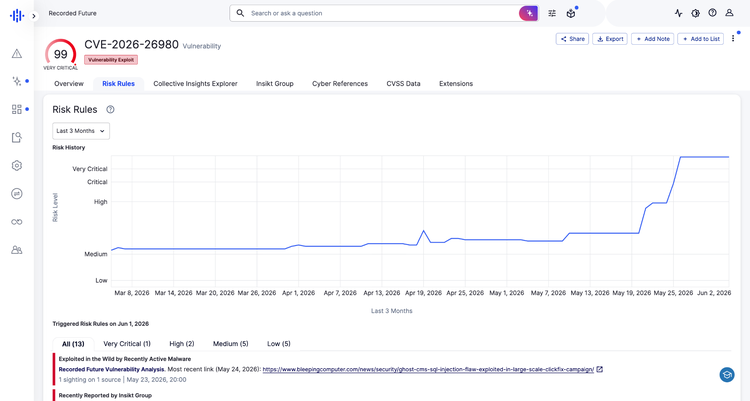
Figure 1: Risk Rules History from Vulnerability Intelligence Card® for CVE-2026-26980 in Recorded Future (Source: Recorded Future)

  •  

Building secure B2C applications with fine-grained access control using Amazon Cognito and Amazon Verified Permissions

Modern web applications require robust security controls to protect user data and application resources. Authentication and authorization are two fundamental pillars of application security that answer critical questions: Who are you? and What are you allowed to do? Implementing these controls correctly can be challenging for developers, especially when building data-intensive applications with frameworks like Streamlit (an open-source Python framework for building interactive web applications) or when requiring fine-grained access control. Key challenges include protecting access to application resources, implementing application identity with multi-factor authentication (MFA), and implementing usage-based controls.

In this post, you will learn how to build fine-grained access controls for a sample Streamlit application using Amazon Cognito for authentication and Amazon Verified Permissions with Cedar policies for authorization. This architecture provides enterprise-grade security with minimal development effort, so you can focus on your application’s core functionality. You will learn how to reduce development time for secure applications, implement enterprise-grade authentication, through proper access management, and scale security with growing user bases.

Security architecture overview

The reference architecture follows a layered security design with four key components; separating identity verification, authorization evaluation, application logic, and enforcement boundaries. By assigning clear responsibilities to each layer, the architecture limits blast radius and ensures that a failure in any single control does not compromise the overall system.

  • Authentication layer: Amazon Cognito handles user authentication with secure credential validation and JSON web tokens (JWTs). It provides built-in password policies, account lockout protection, and session management.
  • Authorization layer: Verified Permissions uses the Cedar policy engine to evaluate fine-grained access requests based on centrally stored policies.
  • Application layer: The Streamlit frontend integrates with both services, managing user sessions and enforcing access controls in the user interface.
  • Security boundaries: Multiple layers of security controls protect against unauthorized access, privilege escalation, authentication verification, authorization checks, and input validation.

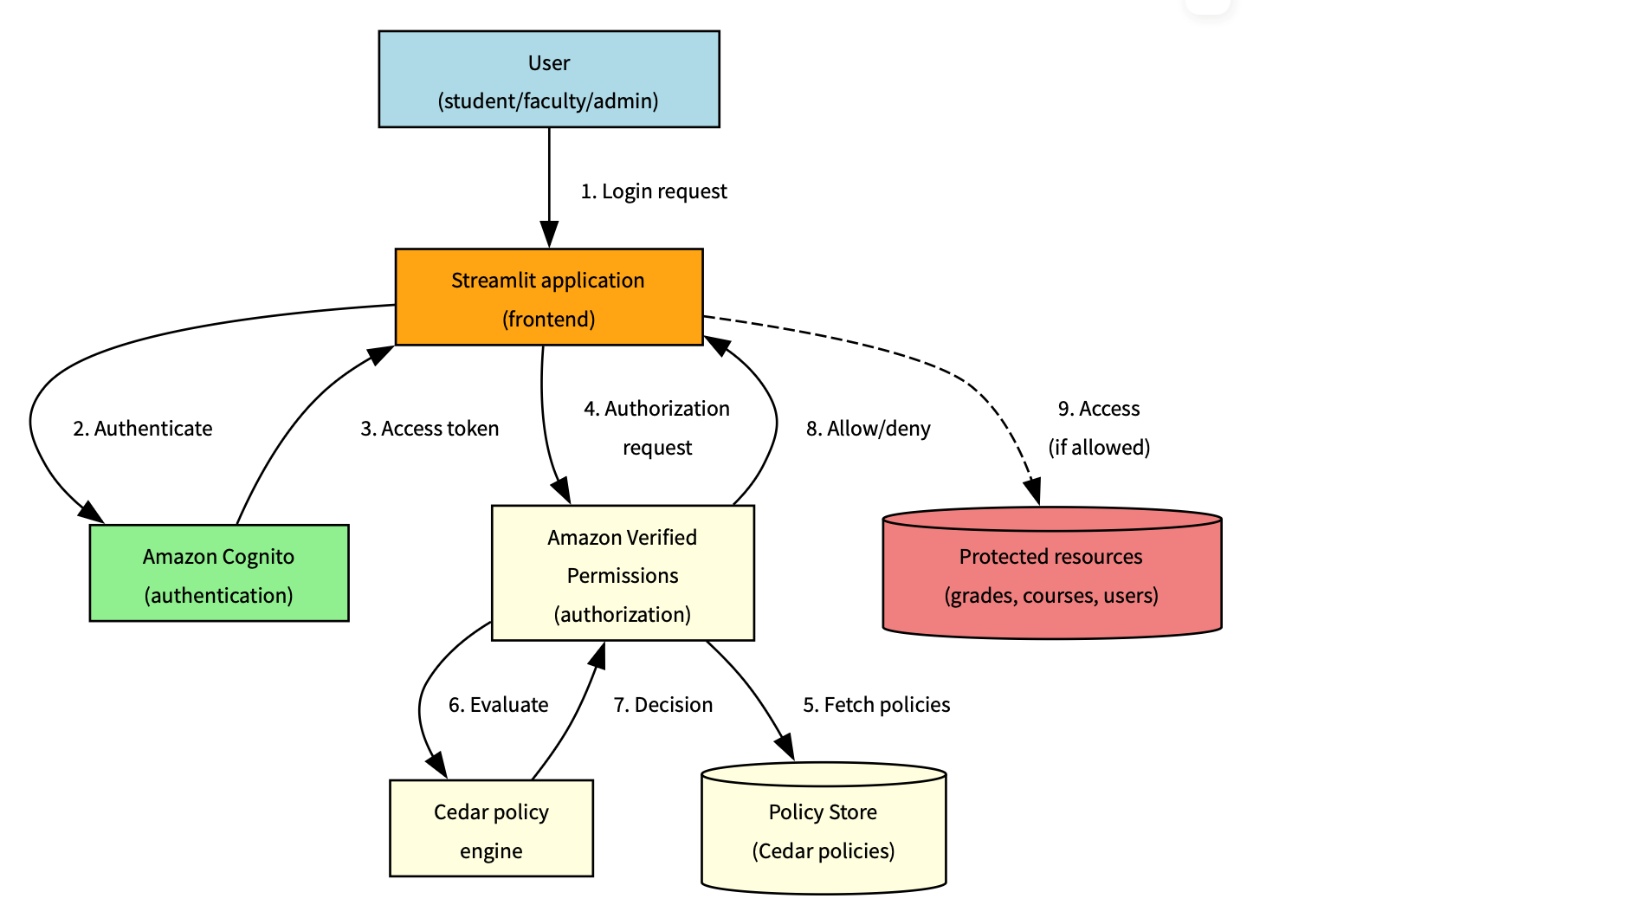
This separation of concerns enables authentication and authorization to function as complementary security controls, following defense-in-depth principles. Figure 1 illustrates the end-to-end authentication and authorization workflow, showing how a user’s sign-in request flows through Amazon Cognito for identity verification, then through Verified Permissions for Cedar policy-based access decisions, before the application enforces the result.

Figure 1: Solution architecture and workflow

Figure 1: Solution architecture and workflow

The following workflow demonstrates how the three architecture layers work together: the authentication layer (steps 1–3) handles identity verification using Amazon Cognito, the authorization layer (steps 4–6) evaluates Cedar policies using Verified Permissions, and the application layer (steps 7–8) enforces the decision in Streamlit.

  1. The user sends a sign-in request, which is submitted through Streamlit
  2. The request is authenticated by Amazon Cognito
  3. An access token is sent back to Streamlit
  4. An authorization request is sent to Verified Permissions
  5. The Cedar policy engine evaluates the request
  6. A decision is sent back by the policy engine
  7. The instruction to allow or deny is sent back to Streamlit
  8. If the instruction is to allow, access is provided

Understanding authorization with Cedar

While authentication establishes user identity, authorization determines what actions users can perform. Verified Permissions provides a scalable authorization service based on Cedar, a policy language specifically designed for fine-grained access control.

Cedar policies follow a structured format that defines who can perform which actions on what resources. Let’s examine the anatomy of a Cedar policy:

permit(
    principal == ?principal,
    action == application::Action::"ViewGrade",
    resource == ?resource
) when {
    principal has role == "Student" &&
    resource.student == principal.entityId
};

Policy components

  • Effectpermitor forbid determines whether the policy allows or denies access
  • Principal: The entity (user) making the request, represented by ?principal as a variable
  • Action: The operation being performed, scoped to your application namespace
  • Resource: The target of the action, also represented as a variable
  • Conditions: The when clause contains logical expressions that must evaluate to true

Advanced Cedar policy patterns

This section describes commonly used Cedar policy patterns for implementing fine-grained authorization with Amazon Verified Permissions. The examples illustrate how to model ownership, role-based access, hierarchical permissions, and administrative controls in real-world applications

Resource ownership control

This pattern helps ensure that users can only access resources they own:

permit(
    principal == ?principal,
    action == application::Action::"ViewGrade",
    resource == ?resource
) when {
    principal has role == "Student" &&
    resource.student == principal.entityId
};

What it does – This policy allows students to view only their own grades by:

  • Checking that the user has the Student role
  • Verifying that the grade resource’s student attribute matches the student’s entityId
  • Preventing students from accessing other students’ grades while allowing access to their own academic performance

Role-based access with resource type

This pattern grants access based on role and resource type:

permit(
    principal == ?principal,
    action == application::Action::"EditCourse",
    resource == ?resource
) when {
    principal has role == "Faculty" &&
    resource has resourceType == "Course" &&
    resource.instructor == principal.entityId
};

What it does – This policy allows faculty members to edit courses they teach by:

  • Verifying the user has the Faculty role
  • Confirming the resource is of type Course
  • Verifying that the course’s instructor attribute matches the faculty member’s entityId
  • Restricting faculty to modify only their own courses, not courses taught by other instructors

Hierarchical authorization

This pattern allows department heads to manage faculty in their department:

permit(
    principal == ?principal,
    action == application::Action::"ManageFaculty",
    resource == ?resource
) when {
    principal has role == "DepartmentHead" &&
    resource has role == "Faculty" &&
    resource.department == principal.department
};

What it does – This policy implements departmental hierarchy controls by:

  • Requiring the user to be a DepartmentHead
  • Verifying the resource is a faculty member
  • Matching the faculty member’s department with the department head’s department
  • Preventing department heads from managing faculty in other departments

Administrative override

This pattern provides emergency access with proper justification:

permit(
    principal == ?principal,
    action == ?action,
    resource == ?resource
) when {
    principal has role == "Administrator" &&
    context has emergencyAccess == true &&
    context has justification
};

What it does – This policy provides emergency access capabilities by:

  • Allowing administrators to perform any action on any resource
  • Requiring an emergency access flag to be set to true
  • Requiring a justification for emergency access
  • Supporting accountability through required documentation while enabling emergency operations

Cedar policy evaluation flow

Understanding how policies are evaluated helps design effective authorization systems. Figure 2 shows a common evaluation pattern for an academic scenario

Note: A policy match evaluates to the policy’s effect (permit or forbid). Forbid policies take precedence: if any forbid policy matches, access is denied regardless of permit policies.

Figure 2: Policy evaluation process

Figure 2: Policy evaluation process

The policy evaluation process follows these steps:

  1. User attempts to access a protected resource
  2. Application sends an authorization request to Verified Permissions
  3. Verified Permissions retrieves applicable Cedar policies from the policy store
  4. The Cedar policy engine evaluates each policy against the request
  5. If any forbid policy matches, access is denied immediately
  6. If any permit policy matches and no forbid policies match, access is allowed
  7. If no policies match, access is denied by default
  8. The evaluation result (ALLOW or DENY) is returned to the application
  9. Application enforces the authorization decision

Cedar policy language

Cedar is an Amazon open source policy language designed for fine-grained authorization. Every policy defines who (principal) can perform what action on which resource under what conditions, as shown in Figure 3.

Figure 3: Cedar policy definitions

Figure 3: Cedar policy definitions

Policy interaction

The following table shows how different policies interact in complex scenarios where multiple policies could apply:

Scenario Student policy Faculty policy Department head policy Admin policy
Student accessing own grade Permit N/A N/A Override
Faculty editing course N/A Permit N/A Override
Department head managing faculty N/A N/A Permit Override
Emergency admin access N/A N/A N/A Permit

Legend:

  • Permit – Policy allows access
  • N/A – Policy doesn’t apply
  • Override – Emergency admin access

The preceding table shows how each role’s policy applies to different scenarios, with admin access having override capabilities across most situations except for emergency admin access where it’s the primary permit authority. The Override column specifically indicates that the administrator’s emergency access policy can supersede other role-specific policies, but only when the emergencyAccess context flag is explicitly set and a justification is provided. This is not an automatic override.

Policy optimization tips:

  • Order conditions by likelihood of success – Place the most frequently true conditions first in your when clause to enable short-circuit evaluation. For example, check role before resource ownership, because role mismatches are caught earlier. See Cedar best practices.
  • Use indexed attributes for faster lookups – Use entity attributes that Verified Permissions indexes natively (entityId, role, resource type) as primary conditions. Best practices for designing an authorization model
  • Cache policy evaluations when appropriate
  • Monitor evaluation metrics and performance

Real-world application: Academic system

Consider an academic system with different user roles and their corresponding permissions:

Student: View own grades

  • Policy helps ensure students can only access grade resources where they are listed as the student
  • The policy verifies the student’s role and matches the resource owner to the principal’s entity ID

Faculty: Edit course content, manage grades

  • Policy allows faculty to edit courses they teach
  • Faculty can view and modify grades for students in their courses

Teaching assistant (TA): Grade management and course support

  • Policy permits TAs to manage grades for courses they assist with
  • Access is limited to specific courses assigned to the TA

Department head: Manage faculty assignments

  • Policy allows department heads to manage faculty in their department
  • Access is scoped to the department hierarchy

Administrator: System-wide access

  • Policy provides emergency access with proper justification
  • Administrative actions are logged and audited

Prerequisites

To implement the preceding Academic system application, you need an active AWS account, Python 3.8 or later, basic Streamlit knowledge, and AWS Identity and Access Management (IAM) permissions for Amazon Cognito and Verified Permissions.

Run the sample and extend the solution

  1. Download the code base: Start by downloading the code base from the avp streamlit samples repository
  2. Set up your development environment: Install the AWS SDK for Python (boto3) and configure your AWS credentials.
    • Install the AWS SDK for Python:
      pip install boto3
      
    • Log in to your AWS account:
      aws login --region $REGION
    • Verify that your AWS Command Line Interface (AWS CLI), Python, and dependencies are correctly configured.
      ./verify-setup.sh
  3. Create your AWS resources: Use the AWS Management Console or infrastructure as code (IaC) tools to provision your Amazon Cognito user pool and Verified Permissions policy store.
    ./deploy-demo-environment.sh
    Do you want to start the demo now? (Y/N): Y

    This provisions an Amazon Cognito user pool, a Verified Permissions policy store, and any sample resources needed for the demo.

  4. Verify the login screen:
    Figure 4: Verify login credentials

    Figure 4: Verify login credentials

  5. Demo walkthrough and shut down: Interact with the demo and test the policies and features. When you’re ready to exit, press Ctrl+C to shut down and stop.
  6. Define your Cedar policies: Start with basic policies and gradually add complexity as you understand the evaluation model.
  7. Implement authentication: Integrate Amazon Cognito authentication into your application with proper error handling.
  8. Add authorization checks: Implement authorization checks at critical access points in your application. For authentication, implement proper error handling for expired tokens, failed MFA challenges, and account lockouts. Use the Amazon Cognito built-in token refresh flow. For authorization, place Verified Permissions checks at every API endpoint and UI component that accesses protected resources.
  9. Test thoroughly: Create test scenarios for each user role and permission combination.
  10. Monitor and iterate: Set up AWS CloudTrail logging and Amazon CloudWatch alarms to monitor your security controls and refine them based on real-world usage.

Security best practices

When implementing this architecture, follow these best practices to support security:

  • Layer your security controls: Use both authentication and authorization as complementary controls rather than relying on a single mechanism.
  • Follow least privilege principles: Grant only the permissions needed for specific user roles. Start with minimal permissions and add more as needed.
  • Implement proper session management: Set appropriate token expiration and refresh policies. Amazon Cognito handles much of this automatically, but you should configure timeouts based on your security requirements.
  • Validate all inputs: Sanitize user inputs to prevent injection attacks. Don’t rely on client-side validation alone.
  • Monitor authentication events: Set up logging and alerts for suspicious activities such as repeated failed login attempts or unusual access patterns.
  • Conduct regular security reviews: Periodically audit your policies and security configurations to verify they still meet your requirements and follow current best practices.
  • Implement secure error handling: Avoid information disclosure through error messages. Provide helpful feedback to users without revealing system details that could aid attackers.

Conclusion

Implementing proper authentication and authorization is critical for application security. By using Amazon Cognito and Amazon Verified Permissions, you can build robust security controls without complex custom code. Through this approach, you can implement enterprise-grade authentication with minimal effort, define and enforce fine-grained authorization policies, scale your security controls as your application grows, and centrally manage and audit security policies.

To get started with your implementation, create your AWS resources including an Amazon Cognito user pool and Verified Permissions policy store. Define your Cedar policies based on your application’s access requirements. Integrate authentication and authorization checks into your application flow. Test thoroughly with different user roles and access scenarios. Finally, monitor and refine your security controls based on usage patterns.

For additional resources, check out the Amazon Cognito documentation and Amazon Verified Permissions documentation.

If you have feedback about this post, submit comments in the Comments section below.


Sowmya Vemuri

Sowmya Vemuri

Sowmya is a Senior Technical Customer Solutions Manager at AWS, where she partners with AWS’s largest customers to drive agentic AI transformation, cloud security strategy, and compute modernization at scale. She has 14+ years of engineering, product, and technical leadership experience building and scaling distributed systems across the stack: bare-metal servers, data platforms, enterprise and consumer applications, and autonomous cloud architectures with zero human operator access.

  •  

Why Holistic Sourcing Wins: The Numbers Behind the Recorded Future Advantage

Threats don't operate in silos, and neither should your intelligence. This post, the first in a three-part series, breaks down why comprehensive sourcing is the foundation of effective threat intelligence -- and how Recorded Future's Intelligence Graph® monitors over one million sources across technical, criminal, collective, and open-source domains to surface what narrow or siloed solutions miss. From nation-state TTPs to criminal infrastructure to credential leaks, complete coverage is what separates awareness from action.

  •  

Amazon Cognito unlocks advanced capabilities with next-generation infrastructure

Amazon Cognito recently introduced high-throughput performance for demanding workloads, customer-managed keys for full control over data encryption at rest, and multi- Region replication for business continuity improvement. These capabilities were made possible through a next-generation storage infrastructure designed for extensibility and scale. To deliver this, we migrated hundreds of millions of user profiles, and you probably didn’t even notice. In this post, we walk through what’s new, the architecture behind it, and how we got here with a zero-downtime migration that kept your applications running.

New capabilities now available on Cognito

The migration to the new infrastructure wasn’t just about maintaining existing functionality—it created the foundation for delivering capabilities that solve customer challenges while positioning Amazon Cognito for continuous improvements.

High-throughput performance: The new architecture supports the higher request volumes and scale requirements of modern applications while maintaining the low latency performance that your applications depend on—able to support tens of millions of users per user pool and thousands of transactions per second (TPS).

Customer-managed keys: Customers can now use their own encryption keys stored in AWS Key Management Service (AWS KMS) for encrypting data at rest. This provides enhanced security control and capabilities, giving customers full ownership over their encryption key lifecycle.

Multi-Region replication: Customers can now synchronize their entire user pool data, including user passwords, attributes, and configurations to another user pool in another Region of their choice. This means that customers can implement business continuity strategies and maintain authentication availability in case of a Regional failover, helping their applications remain accessible to users even during unexpected disruptions.

An architecture for innovation

The new architecture uses a purpose-built storage layer designed for extensibility and scale of identity operations. We anchored the new architecture around a set of design tenets:

  • Identity-first design: The storage layer understands user identities. There’s no client-specific business logic and no generalizations beyond identity management; keeping the system focused, portable, and optimized.
  • Avoid one-way doors: Deliver value incrementally while keeping architectural choices reversible, so we can evolve as new needs arise.
  • Backward compatible: Changes to the underlying infrastructure should never break customers’ applications.

These tenets shaped every architectural decision. The architecture separates into independently deployable domains. Previously, while using Amazon Cloud Directory, the service architecture relied on a single data store to persist all customer information. This provided straightforward data traversal mechanisms but required multi-service coordination to adjust database schema when new features were required. The new architecture uses different datasets, allowing them to evolve independently for faster feature iterations.

Migration with zero-downtime

Migrating users requires extreme precautions and a strategy designed to maintain zero downtime and ensure data integrity at every step. Our approach prioritizes both immediate stability and long-term flexibility through the following measures:

  1. Shadow mode validation: We ran customer API requests through both old and new infrastructures simultaneously, comparing response structures, status codes, and behavioral characteristics. The validation was designed so that sensitive information was never exposed in plaintext during comparison. We accounted for known variances—for example, timestamps could differ slightly between systems—so that only meaningful discrepancies surfaced as actionable alerts.
  2. Data backfill: Before switching a user pool to the new infrastructure, we performed a bulk backfill of all existing user records from the legacy system into the new storage. The backfill ran alongside live traffic with dual-write capturing any changes made during the backfill window, ensuring no data loss or stale data. Shadow mode served as the validation layer for the backfill; as we addressed more edge cases in data syncing, shadow mode match rates increased, confirming data completeness before we proceeded to the switchover.
  3. Dual-write architecture: We implemented a system where all identity operations were simultaneously written to both legacy and new services, with comprehensive validation to ensure consistency. Even when a dual-write to the new infrastructure failed, the operation still succeeded in the legacy system, preserving all customer-initiated requests. This means any dual-write failure was contained as an internal consistency issue and not customer-impacting.
  4. Antientropy validation: We implemented a data validation and correction system that continuously compared records across old and new infrastructures, detecting and resolving any data divergence. Anti-entropy scans compared user attributes, credential hashes, group memberships, and configurations, among other records. When true discrepancies were found, the system automatically reconciled them using the legacy system as the source of truth. This layer was able to catch edge cases that shadow mode and dual writes alone could not cover.
  5. Incremental rollout with rollback capability: We established controlled deployment phases with immediate rollback capabilities. After switching a user pool to the new infrastructure, we continued replicating all writes back to the legacy system, ensuring we can revert any user pool to the legacy infrastructure at any point without data loss. If a rollback was needed during migration, an orchestrator replayed entries in timestamp order, syncing user profiles back to the legacy system.

Lessons learned for infrastructure modernization

This modernization taught us valuable principles that apply to any large-scale infrastructure project, therefore we choose to share these learnings to help you perform similar migrations.

  • Customer access patterns drive architecture decisions: Analyzing actual customer access patterns revealed that identity workloads follow predictable patterns, which meant we could adopt a synchronous dual-write approach that balanced completeness with operational simplicity. This principle applies to any domain-specific migration: understand your workload’s actual access patterns before reaching for general-purpose solutions.
  • Behavioral preservation requires techniques beyond traditional testing: Ensuring equivalent functionality across old and new systems was straightforward. Preserving identical API behavior was not. Functional tests validate intended behaviors, but we identified scenarios where customers had built applications around specific API behaviors such that a change could have silently broken their applications. For example, concurrent writes to the same user could resolve to different final states between old and new systems where writes all succeed but outcome diverges slightly. Similarly, customers who write an attribute and immediately read it are affected by the consistency window. Subtle timing differences in when updates become visible could cause stale reads. These aren’t functional failures, but behavior under real traffic patterns can vary. Shadow mode verification surfaced edge cases that automated tests alone would have missed. Invest in these techniques early.
  • Gradual validation builds confidence that testing alone cannot: Layer multiple independent validation techniques, such as shadow mode, dual writes, and anti-entropy scans—each covering a different access pattern. No single approach will catch everything, and the gaps between them are where production issues hide. Incremental rollout with immediate rollback capability lets you validate each step while maintaining the ability to revert quickly.
  • Key principles for your own modernization projects: Invest in purpose-built solutions, design for extensibility, and implement gradual validation. Or use managed services so your infrastructure improves without effort on your part while your applications keep running; helping you focus on your business needs.

Conclusion

In this post, we shared the high-level approach and learnings from the Amazon Cognito infrastructure modernization that create a foundation for modern identity management capabilities. The new Cognito infrastructure is live, delivering capabilities such as customer-managed keys and multi-Region replication. As the migration continues, all Cognito customers will gain access to these capabilities on the same service they rely on today, with no action required.

Ready to modernize your authentication infrastructure? Visit Amazon Cognito to learn more.

If you have feedback about this post, submit comments in the Comments section below.
Howie Li

Howie Li

Howie is a Product Manager at Amazon Web Services, where he strives to make auth easy by default. Outside of work, Howie enjoys exploring cultures and food through travels and making new ice cream flavors inspired by them.

Georgi Baghdasaryan

Georgi Baghdasaryan

Georgi is a Principal Engineer at Amazon Web Services, where he builds identity systems that help organizations securely manage access and authentication at scale. His broader focus is on reliable, high-impact infrastructure that enables customers to operate confidently in the cloud. Outside of work, Georgi enjoys experimenting with new matcha latte recipes and going on long bike rides.

  •  

Gain visibility into DDoS attacks with flow logs in AWS Shield Advanced

Reconstructing distributed denial of service (DDoS) attack traffic used to mean combining data from multiple sources after the fact. AWS Shield Advanced attack flow logs change that—they capture traffic metadata during attacks so you can pinpoint sources, verify mitigations, and feed your existing analysis pipelines.

Shield publishes logs to Amazon Simple Storage Service (Amazon S3), Amazon CloudWatch Logs, or Amazon Data Firehose using the same CloudWatch Logs delivery infrastructure as other AWS flow logs, so they fit directly into the monitoring and analysis tools you already use.

In this post, you will learn how Shield Advanced attack flow logs capture metadata during DDoS events, what each field in a flow log entry means, and how to enable and configure flow logging for your protected resources.

How DDoS attacks affect your applications

A DDoS attack floods an application with traffic, making it unavailable to users. Infrastructure-layer attacks saturate bandwidth and exhaust connection tables—you see packet loss and timeouts.

Shield Advanced is a managed DDoS protection service that detects and mitigates attacks for Amazon CloudFront distributions, Elastic Load Balancing load balancers, Amazon Route 53 hosted zones, AWS Global Accelerator standard accelerators, and Elastic IP (EIP) addresses. See the AWS Shield Advanced documentation for full coverage details. Initially, Shield Advanced will provide infrastructure-layer attack flow logs for EIP protections, with support for additional resource types to follow.

Key benefits

Flow logs help you understand attacks in several ways:

  • Reconstruct traffic patterns – Query logs after an attack to analyze volume, source distribution, and protocol mix without relying only on aggregate CloudWatch metrics.
  • Identify attack origins – The srccountry and location fields show where traffic originated and which AWS edge location it entered.
  • Verify mitigation behavior – The action field records what Shield did with each flow.

Logs go to Amazon S3, CloudWatch Logs, or Data Firehose. You can then query them with Amazon Athena (a serverless query service for analyzing data in Amazon S3), route them to third-party Security Information and Event Management (SIEM) platforms or build CloudWatch Logs Insights queries (an interactive log analysis feature) without deploying new infrastructure.

What attack flow logs capture

Log records capture source and destination IP addresses and ports, protocol, packet and byte counts, the action Shield Advanced took, and TCP flags. They also include the AWS ingress location where traffic entered and a two-letter country code for the traffic source when available. Logs are written at 5-minute intervals and are available during an active attack and after it concludes.

The maximum file size is 75 MB. If a file reaches that limit within the 5-minute window, the file will be closed, published, and a new file will start. Flow logs support JSON, plain text, W3C, and Parquet output formats and contain the following fields:

Field Description
protection_arn Amazon Resource Name (ARN) of the Shield protection
event_timestamp Timestamp of log generation
version Flow log version number
srcaddr Source IP address
dstaddr Destination IP address
srcport Source port
dstport Destination port
protocol IP protocol number
packets Packet count within the aggregation window
bytes Byte count within the aggregation window
starttime Aggregation window start time
endtime Aggregation window end time
action Action taken by Shield
location AWS ingress location
sampling_rate Sampling rate used during packet processing
tcp_flags TCP flags from the packet
srccountry Two-letter country code for the traffic source

How to configure flow logs for Shield Advanced protected resources

The following steps walk you through creating the CloudWatch Logs delivery resources that connect a Shield Advanced protection to your preferred log destination.

Prerequisites

Before configuring flow logs, make sure you have:

Flow logs incur standard CloudWatch Logs vended log charges, and the destination resources (S3 bucket storage, CloudWatch Logs log group storage, or Firehose data processing) incur separate charges. Review the Vended Logs entry on the CloudWatch pricing page and the pricing for your chosen destination service before enabling flow logs on high-traffic resources.

How it works

Log delivery requires three objects:

  • DeliverySource – Represents the Shield Advanced protection that produces the logs
  • DeliveryDestination – Represents where logs should be sent (Amazon S3, CloudWatch Logs, or Amazon Data Firehose)
  • Delivery – Connects the source to the destination

This three-object model lets you reuse destinations across multiple sources and manage delivery pipelines independently. For example, you can send logs from multiple Shield protections to the same S3 bucket by creating multiple DeliverySource objects that reference the same DeliveryDestination.

Because Shield Advanced attack flow logs use the CloudWatch Logs delivery infrastructure, you can aggregate them across accounts and Regions just like other vended logs. Deliver directly to a centralized S3 bucket with a cross-account policy, replicate CloudWatch Logs log groups using cross-account cross-Region centralization rules, or stream to a shared Firehose stream using cross-account subscriptions. Explore these options to build a unified view of DDoS attack traffic across your multi-account, multi-Region footprint.

Step 1: Create your destination resource

Choose a destination:

Step 2: Configure the destination resource policy (if needed)

The destination resource needs a policy that grants the CloudWatch Logs delivery service write permissions. The policy varies by destination type. For more information, see Logs sent to Amazon S3, Logs sent to CloudWatch Logs, or Logs sent to Firehose.

For Amazon S3 destinations, you have two options:

  • Automatic policy creation: If your bucket has no existing resource policy and you have the s3:GetBucketPolicy and s3:PutBucketPolicy permissions, AWS automatically creates the required policy when you create the delivery in step 6. You can skip to step 3.
  • Manual policy update: If you need to customize the policy or your organization requires pre-approved policies, create the policy manually by following the instructions for Logs sent to Amazon S3.

Step 3: Get your protection ARN

Shield Advanced is a global service and uses the us-east-1 AWS Region for management. Run the following command to list your Shield Advanced protections.

aws shield list-protections \
  --region us-east-1

In the output, copy the ProtectionArn value for the protection you want to log.

Step 4: Create a delivery source

Run the following command to create the delivery source, replace <protection-arn> with the ProtectionArn value from step 3.

aws logs put-delivery-source \
  --name my-shield-delivery-source \
  --resource-arn <protection-arn> \
  --log-type FLOW_LOGS \
  --region us-east-1

The --resource-arn is the ARN of your Shield Advanced protection—not the protected resource itself. Shield Advanced creates a separate protection object that wraps your resource, and flow logs are generated by that protection layer rather than the underlying resource.

Step 5: Create a delivery destination

Run the following command to create the delivery destination, replace <resource-arn> with the ARN of the destination resource you created in step 1.

aws logs put-delivery-destination \
  --name my-shield-delivery-destination \
  --output-format plain \
  --delivery-destination-configuration '{"destinationResourceArn":"<resource-arn>"}' \
  --region us-east-1

The --delivery-destination-configuration parameter takes a JSON object with a destinationResourceArn key whose value is the ARN of your S3 bucket, log group, or Firehose stream.

In the output, copy the value of the top-level ARN field—this is the delivery destination ARN (different from the bucket ARN). You will use this in step 6.

Step 6: Create the delivery

Run the following command to connect the delivery source to the delivery destination, replace <delivery-destination-arn> with the delivery destination ARN from step 5.

aws logs create-delivery \
  --delivery-source-name my-shield-delivery-source \
  --delivery-destination-arn <delivery-destination-arn> \
  --region us-east-1

Step 7: Verify the delivery

Run the following command to confirm the delivery is active.

aws logs describe-deliveries \
  --region us-east-1

After delivery is active, Shield Advanced publishes flow log records to your destination during DDoS events.

Clean up

To avoid ongoing charges, delete the resources you created.

  1. Delete the delivery:
    aws logs delete-delivery \
      --id <delivery-id> \
      --region us-east-1
  2. Delete the delivery source:
    aws logs delete-delivery-source \
      --name my-shield-delivery-source \
      --region us-east-1
  3. Delete the delivery destination:
    aws logs delete-delivery-destination \
      --name my-shield-delivery-destination \
      --region us-east-1
  4. (Optional) Back up flow log data if you need to retain logs for compliance or analysis.
  5. Delete the destination resource. Warning: Deleting the destination resource will permanently delete all flow log data.

    For an S3 bucket:

    aws s3 rb s3://<bucket-name> \
      --force \
      --region <region>

    For a CloudWatch Logs log group:

    aws logs delete-log-group \
      --log-group-name <log-group-name> \
      --region <region>

    For a Firehose stream:

    aws firehose delete-delivery-stream \
      --delivery-stream-name <stream-name> \
      --region <region>

Conclusion

Shield Advanced attack flow logs provide the visibility you need to understand and respond to DDoS attacks effectively. By integrating with your existing observability infrastructure, they deliver actionable insights without requiring new tooling or complex setup. Enable flow logs on your Shield Advanced protections today to gain immediate visibility into attack patterns and strengthen your DDoS defense posture.

Next steps:

For the full reference about flow log configuration, see the AWS Shield Advanced documentation.

If you have feedback about this post, submit comments in the Comments section below.


Ken Kitts

Ken Kitts

Ken is a Technical Account Manager at Amazon Web Services (AWS) with over 20 years of experience in computer networking, including software-defined networking in the financial technology sector. Outside of work, Ken is an avid traveler who enjoys exploring archaeological sites and museums, with Teotihuacan in Mexico as a favorite.

  •  

Customize federated sign-in with new Amazon Cognito Lambda trigger

You can use Amazon Cognito user pools to add sign-up and sign-in functionality to your web and mobile applications. You can authenticate users directly with Amazon Cognito managed accounts using passwords, passwordless flows, or custom authentication flows, or let users federate in through external identity providers (IdP) using SAML, OpenID Connect, or social providers such as Google, Facebook, Sign in with Apple, or Login with Amazon. For consumers, identity federation means fewer passwords to remember and a smoother sign-in experience. For business-to-business (B2B) software as a service (SaaS) providers, it means your tenants’ organizations keep control of their own identities rather than managing credentials on their behalf. But federation can also introduce challenges for enterprises and application developers. What happens when your enterprise customer’s SAML provider sends hundreds of group memberships that exceed attribute size limits? Or when your ecommerce customer forgets they already have an account and tries to sign in with a different social provider, creating duplicate records?

In this blog post, I introduce the inbound federation Lambda trigger for Amazon Cognito, a new feature that gives you programmatic control over federated authentication flows. This AWS Lambda trigger intercepts the federated authentication response immediately after your external identity provider responds to Cognito, so you can transform, filter, and enrich user attributes before the user profile is created and user attributes are mapped in your user pool.

Understanding the inbound federation Lambda trigger

The inbound federation Lambda trigger is invoked after your Amazon Cognito user pool has received and verified the response from the external IdP. The request payload for the federated IdP response is then sent from Cognito to your Lambda function and you will receive the following information:

  • The common parameters of Amazon Cognito Lambda triggers (including userPoolId and clientId)
  • Which external IdP was used (for example, providerName)
  • The providerType (SAML, OIDC, Login with Amazon, and so on)
  • Attribute data from the external IdP specific to the user signing in

The specific format of this attribute data depends on the provider type, view the Inbound federation Lambda trigger parameters section in the docs to learn more. If the external IdP is a SAML provider, you will receive a JSON key-pair listing of the user’s attributes from the IdP assertion. If the external IdP is an OIDC provider (or social provider), you will receive the access token and attribute data from the /userinfo endpoint, along with an ID token if one was provided. See Figure 1 for a detailed flow of a federated sign-in with an Amazon Cognito user pool configured to use the inbound federation Lambda trigger.

Figure 1: Sequence flow of a federated login configured with the inbound federation Lambda trigger

Figure 1: Sequence flow of a federated login configured with the inbound federation Lambda trigger

  1. The user begins using the application but is required to sign in first.
  2. The managed login is rendered, and the user can select which IdP they want to sign in with. If identifiers are used with SAML or OIDC providers, the user enters their email address and Amazon Cognito looks up the domain of their provided email and routes them to the appropriate IdP.
  3. Alternatively, the managed login can be bypassed by the client providing the identity_provider request parameter.
  4. Amazon Cognito sends the authentication request to the appropriate IdP.
  5. The external IdP challenges the user to sign in.
  6. The user completes the sign-in process required by the external identity provider.
  7. The challenge response is sent to the external IdP.
  8. The IdP verifies that the sign-in is successful. If there are any subsequent challenges, such as multi-factor authentication (MFA), additional rounds of authentication challenges and responses take place. This is determined by the configuration and settings of the external IdP.
  9. The external IdP sends a response to the Amazon Cognito user pool, and Cognito validates the cryptographic signature and that it hasn’t been tampered with.
  10. Amazon Cognito sends attribute data from the IdP to the inbound federation Lambda function
  11. Attribute data for the authenticated user and the common parameters for Amazon Cognito are available for the Lambda function to add, modify, or suppress according to your requirements.
  12. Your added, modified, or suppressed attributes are returned to Amazon Cognito. These are attribute values that map to the user’s profile in Cognito—whether the user profile was just created or is being updated for a returning user.
  13. Continuing the OAuth 2.0 authorization code grant, Amazon Cognito sends an authorization code to the client.
  14. The client then calls the /token endpoint with the authorization code.
    Note: It’s a security best practice to use confidential clients and to use OAuth 2.0 Proof Key for Code Exchange (PKCE) extension whenever possible.
  15. An access, ID, and refresh token is returned to the client.
  16. The user has signed into the application. ID tokens can be used to identify who the user is (authentication), and access tokens can be used to determine what the user can do (authorization).

Common federation challenges and use cases

Federation introduces complexity that varies depending on your use case. For B2B and SaaS applications, you’re often not in control of your customers’ IdPs, including what attributes they send or how they format them. As an example, an enterprise customer will configure their SAML response to include every group a user belongs to. This could be hundreds of groups or long group identifiers, and if the group membership of the user is mapped to an Amazon Cognito attribute, this can lead to a scenario where the Cognito attribute size limit is exceeded, causing federated sign-ins to fail.

Challenges for business-to-customer (B2C) applications can differ from B2B use cases. For B2C applications, organizations shouldn’t be required to think about identity providers. The ability to sign-up and sign-in should be seamless for consumer-facing applications. Customers visiting a consumer-facing application might create an account with email and password, forget they created created it, and then later try signing in with Facebook (or other social provider). Without proper account linking in Amazon Cognito, you then have multiple user records for the same user, which could lead to fragmented purchase history and a frustrating customer experience.

Both B2B and B2C use cases might need to look up external data just prior to completing the sign-in process, such as additional roles and access for B2B users or looking up active orders for B2C users. Another example could be the need to normalize data just prior to storing it in the user profile within the Amazon Cognito user pool or even discarding personally identifiable information (PII) prior to storing it in your Cognito user pool.

With the inbound federation Lambda trigger, you can handle these B2B and B2C use cases programmatically, and do so without requiring modification of your applications or coordinating IdP-specific changes with external IdPs. In this section, I dive deeper into two common use cases: oversized group attributes, common with B2B customers, and automated account linking, common with B2C customers.

Use case 1: Filtering oversized group attributes

If you have B2B and SaaS use cases, it’s a common practice to use group membership from the IdP to determine the level of access you have within the SaaS service. This is a great way to still provide some access control back to the enterprise customers themselves. The groups can be used to represent the roles a user will have or for some form of coarse-grained authorization. However, your customers might inadvertently send a large number of groups a user is a member of, thus leading to an oversized attribute payload.

Another common scenario is where the syntax and format of group name a user belongs to can arrive in various formats across different IdPs; such as a canonical name (for example, example.com/groups/myApp-readOnly), a distinguished name (common with LDAP based systems and such as cn=myApp-readOnly,OU=groups,DC=example,DC=com), or a plain text string (such as myApp-readOnly). Instead of having downstream authorization logic to accommodate different variations of a group name, you can now normalize how groups are represented prior to storing the user’s attribute data using the inbound federation Lambda trigger.

To expand this, imagine your enterprise customer uses a SAML IdP, such as Active Directory Federation Services (AD FS), in front of Active Directory (AD). When their users authenticate, AD FS sends a groups attribute containing every AD group the user belongs to. For users in large organizations, this can be hundreds of groups, and the attribute is mapped to an Amazon Cognito attribute, this could result in a string that exceeds 2,048-character limit per attribute of Cognito. Authentication would fail in this scenario, ultimately leading to support tickets because enterprise customers would be unable to sign in. Even if certain users didn’t exceed this limit, because of a smaller number of group memberships, this would result in the collection and storing of unnecessary data in your Cognito user pool.

Previously, you would need to work with your customer’s IT department to modify their SAML configuration to filter groups at the source—a process that could take weeks and require multiple approval cycles because it involves a change to the federation configuration. Especially for SaaS customers, this isn’t a scalable approach because you could integrate with hundreds of external IdPs. With the inbound federation Lambda trigger, you can solve this by filtering the groups to only those relevant to your application and normalizing the nomenclature of these groups. The following Lambda function filters the groups attribute to include only groups relevant to your application and normalizes the names of groups.

// Configure the group prefix to filter on (e.g. "App1-", "myApp-", etc.)
// Change this to match the prefix your IdP uses for relevant group names.
const GROUP_PREFIX = process.env.GROUP_PREFIX || 'myApp-';

// The SAML attribute/claim name that contains group membership.
// Common values: "groups", "memberOf", "http://schemas.xmlsoap.org/claims/Group", etc.
const GROUP_ATTRIBUTE = process.env.GROUP_ATTRIBUTE || 'groups';

/**
 * Extracts the short group name from common IdP formats:
 *   - Plain text:       "myApp-readOnly"
 *   - Leading slash:    "/myApp-readOnly"
 *   - Canonical/URL:    "example.com/groups/myApp-readOnly"
 *   - Distinguished name (DN): "cn=myApp-readOnly,OU=groups,DC=example,DC=com"
 * Returns the last meaningful segment so all formats normalize to "myApp-readOnly".
 */

function extractGroupName(raw) {
  let name = raw.trim();

  // Some IdPs prefix group names with "/" to indicate a top level group — strip it before format detection
  if (name.startsWith('/')) {
    name = name.substring(1);
  }

  // DN format — extract the CN (common name) value
  if (/^cn=/i.test(name) || /,\s*(ou|dc)=/i.test(name)) {
    const cnMatch = name.match(/^cn=([^,]+)/i);
    return cnMatch ? cnMatch[1].trim() : name;
  }

  // URL / path format — take the last segment after the final "/"
  if (name.includes('/')) {
    const segments = name.split('/').filter(Boolean);
    return segments[segments.length - 1];
  }

  return name;
}
export const handler = async (event) => {
  try {
    console.log('Full event:', JSON.stringify(event, null, 2));
    console.log('Provider type:', event.request?.providerType);

    // Initialize the response structure
    event.response = event.response || {};

    if (event.request?.providerType?.toLowerCase() === "saml") {
      const samlResponse = event.request.attributes?.samlResponse;

      if (samlResponse) {
        console.log('Original SAML Attributes:', JSON.stringify(samlResponse, null, 2));

        // Build the attribute map — you MUST include every attribute you want Cognito to retain. Anything omitted from userAttributesToMap is dropped.
        const mappedAttributes = {};

        Object.keys(samlResponse).forEach(key => {
          if (key === GROUP_ATTRIBUTE) {
            // Parse the groups JSON string from the SAML assertion
            let groupsArray = [];
            try {
              groupsArray = JSON.parse(samlResponse[GROUP_ATTRIBUTE]);
            } catch (error) {
              console.error(`Error parsing ${GROUP_ATTRIBUTE}:`, error);
            }

            // Normalize each group name, then filter to the configured prefix
            const normalizedGroups = groupsArray.map(extractGroupName);
            const filteredGroups = normalizedGroups.filter(group =>
              group.startsWith(GROUP_PREFIX)
            );

            console.log(`Original ${GROUP_ATTRIBUTE}:`, groupsArray);
            console.log(`Normalized ${GROUP_ATTRIBUTE}:`, normalizedGroups);
            console.log(`Filtered ${GROUP_ATTRIBUTE}:`, filteredGroups);

            // Only include the groups attribute if there are matching groups
            if (filteredGroups.length > 0) {
              mappedAttributes[GROUP_ATTRIBUTE] = filteredGroups.map(group => `'${group}'`).join(', ');
            }
          } else {
            // Pass all other SAML attributes through unchanged
            mappedAttributes[key] = samlResponse[key];
          }
        });

        event.response.userAttributesToMap = mappedAttributes;
        console.log('Response to Cognito:', JSON.stringify(event.response, null, 2));
      }
    }

    // For any unhandled provider type (or missing samlResponse), this intentionally does NOT set userAttributesToMap and tells Cognito to keep all original IdP attributes unchanged (no-op).

    // To handle OIDC or social providers, add additional logic here using event.request.attributes.idToken, .userInfo, and/or .tokenResponse.

    return event;
  } catch (error) {
    console.error('Error in Lambda:', error);
    throw error;
  }
};

This approach reduces a large group list to only what is applicable to your application. Authentication succeeds, and you maintain control over your user pool’s data without depending on external configuration changes.

Use case 2: Automatic account linking

The second use case addresses a challenge that’s particularly common in B2C facing ecommerce or any consumer-facing applications; although it can also be applicable to B2B scenarios. Imagine you’re running an online retail store. A customer creates an account with their email and password to make a purchase. A few months later, they return to your site but forgot they already created an account and they see the Login with Amazon button and decide to sign in this way. Without account linking, Amazon Cognito creates a new federated user because these are technically distinct accounts, and now this customer has two separate accounts with different purchase histories and saved preferences.

This fragmentation creates a poor customer experience and complicates your business operations. You can’t see the customer’s complete purchase history, loyalty points are split across accounts, and your analytics show two distinct customers instead of one.

The inbound federation Lambda trigger can be used to solve this by automatically linking federated identities to existing local accounts based on email address. While account linking can also be implemented in a pre-sign-up Lambda trigger, the inbound federation trigger runs on every federated sign-in, not just the first, giving you access to the latest IdP attributes and the ability to apply linking logic continuously rather than only at initial account creation. If no local Amazon Cognito account exists, you can create one and then link the social provider account to it. The local account can serve as the primary identity, ensuring consistent JSON Web Tokens (JWTs) regardless of how the user signs in. The following is an example of an inbound federation Lambda trigger that can help address this use case.

import { 
  CognitoIdentityProviderClient, 
  ListUsersCommand,
  AdminCreateUserCommand,
  AdminLinkProviderForUserCommand
} from "@aws-sdk/client-cognito-identity-provider";

const client = new CognitoIdentityProviderClient();

export const handler = async (event) => {
  try {
    console.log('Full event:', JSON.stringify(event, null, 2));
    
    const { userPoolId, request, userName } = event;
    const { providerName, providerType, attributes } = request;
    
    // Extract email and profile attributes based on provider type
    const { email, givenName, surname } = extractAttributes(providerType, attributes);
    
    if (!email) {
      console.error('No email found in federated response');
      return event;
    }
    
    console.log(`Processing federated login for email: ${email}, provider: ${providerName} (${providerType})`);
    
    // Check if a local user exists with this email
    const existingUser = await findLocalUserByEmail(userPoolId, email);
    
    if (existingUser) {
      console.log(`Found existing local user: ${existingUser.Username}`);
      if (isAlreadyLinked(existingUser, providerName, userName)) {
        console.log(`Federated identity ${providerName}:${userName} is already linked to ${existingUser.Username}, skipping link`);
      } else {
        await linkFederatedUser(userPoolId, existingUser.Username, providerName, userName);
      }
    } else {
      console.log('No existing local user found, creating new one');
      const newUsername = await createLocalUser(userPoolId, email, givenName, surname);
      await linkFederatedUser(userPoolId, newUsername, providerName, userName);
    }
    
    return event;
    
  } catch (error) {
    console.error('Error in account linking Lambda:', error);
    throw error;
  }
};


/**
 * Check if the federated identity is already linked to the local user by inspecting the identities attribute from the ListUsers response.
 */
function isAlreadyLinked(user, providerName, federatedUsername) {
  const identities = user.Attributes?.find(a => a.Name === 'identities');
  if (!identities?.Value) return false;

  try {
    const parsed = JSON.parse(identities.Value);
    return parsed.some(id => id.providerName === providerName && id.userId === federatedUsername);
  } catch {
    return false;
  }
}

/**
 * Extract email and profile attributes based on provider type.
 * - SAML: attributes come from samlResponse
 * - OIDC/Social: attributes come from userInfo, falling back to idToken (if one exists)
 */
function extractAttributes(providerType, attributes) {
  if (providerType?.toLowerCase() === 'saml') {
    const saml = attributes?.samlResponse;
    return {
      email: saml?.email || null,
      givenName: saml?.givenName || '',
      surname: saml?.surname || ''
    };
  }

  // OIDC and social providers: prefer userInfo, fall back to idToken
  const userInfo = attributes?.userInfo;
  const idToken = attributes?.idToken;

  const source = userInfo?.email ? userInfo : idToken;

  return {
    email: source?.email || null,
    givenName: source?.given_name || '',
    surname: source?.family_name || ''
  };
}

/**
 * Find a local Cognito user (not EXTERNAL_PROVIDER) by email address.
 */
async function findLocalUserByEmail(userPoolId, email) {
  try {
    const command = new ListUsersCommand({
      UserPoolId: userPoolId,
      Filter: `email = "${email}"`
    });
    
    const response = await client.send(command);
    console.log('ListUsers response:', JSON.stringify(response, null, 2));
    
    if (!response.Users || response.Users.length === 0) {
      return null;
    }

    // Find the first user that is a true local account (not a federated-only profile)
    const localUser = response.Users.find(u => u.UserStatus !== 'EXTERNAL_PROVIDER');
    return localUser || null;
  } catch (error) {
    console.error('Error finding user by email:', error);
    throw error;
  }
}

/**
 * Create a new local Cognito user without a password.
 * With passwordless (email OTP) enabled on the user pool, the user is created with UserStatus=CONFIRMED and no FORCE_CHANGE_PASSWORD state.
 */
async function createLocalUser(userPoolId, email, givenName, surname) {
  try {
    const userAttributes = [
      { Name: 'email', Value: email }
    ];

    if (givenName) userAttributes.push({ Name: 'given_name', Value: givenName });
    if (surname) userAttributes.push({ Name: 'family_name', Value: surname });

    const command = new AdminCreateUserCommand({
      UserPoolId: userPoolId,
      Username: email,
      UserAttributes: userAttributes,
      MessageAction: 'SUPPRESS'
    });
    
    const response = await client.send(command);
    console.log(`Created local user: ${email}`, JSON.stringify(response, null, 2));
    
    return email;
  } catch (error) {
    console.error('Error creating local user:', error);
    throw error;
  }
}

/**
 * Link a federated user identity to a local Cognito user.
 * The local user becomes the primary profile — all future JWTs will represent this local user regardless of sign-in method.
 */
async function linkFederatedUser(userPoolId, localUsername, providerName, federatedUsername) {
  try {
    const command = new AdminLinkProviderForUserCommand({
      UserPoolId: userPoolId,
      DestinationUser: {
        ProviderName: 'Cognito',
        ProviderAttributeValue: localUsername
      },
      SourceUser: {
        ProviderName: providerName,
        ProviderAttributeName: 'Cognito_Subject',
        ProviderAttributeValue: federatedUsername
      }
    });
    
    const response = await client.send(command);
    console.log(`Linked federated user ${federatedUsername} to local user ${localUsername}`);
    console.log('Link response:', JSON.stringify(response, null, 2));
    
    return response;
  } catch (error) {
    if (error.name === 'AliasExistsException' || error.message?.includes('already linked')) {
      console.log(`User already linked: ${error.message}`);
      return;
    }
    console.error('Error linking federated user:', error);
    throw error;
  }
}

Every federated sign-in will invoke the inbound federation Lambda trigger, and the logic is straightforward. When a user authenticates with an external identity provider, the trigger extracts their email from the federated response and searches the user pool for a local Cognito account with that same email. If one exists—such as if the user originally signed up with email and password—the Lambda function links the federated identity to that existing local account. If no local account exists, the trigger creates one on the fly as a passwordless account (confirmed, suppressing any emails, and ready for passwordless email one-time passcode (OTP) sign-in), then links the federated identity to it. In both cases, the local account is set as the primary profile. This means the user’s JWTs always carry the same sub-claim regardless of how they sign in—directly, or through Google, Facebook, or SAML—your application sees one consistent identity. The preceding Lambda trigger is also smart enough to check whether a linked account already exists before making the call, so returning users who’ve already been linked don’t generate unnecessary API calls. And because the local account supports passwordless authentication, a user who first arrived through federation can later sign in directly with an emailed OTP—or even add a password later through your applications account settings. The local account is always the anchor.

Best practices

As you implement these patterns, keep a few best practices in mind. Your Lambda function must be completed within 5 seconds, so optimize for speed to help ensure the federated sign-in process is able to successfully complete. If you’re making external calls within the inbound federation Lambda function, like Amazon DynamoDB queries or API requests, implement caching where possible. Handle errors gracefully—if your Lambda function throws an exception or an error, authentication could fail for the user. Consider logging the error and returning the original event back to Amazon Cognito rather than failing authentication for a legitimate user attempting to sign in. Here are some additional best practices for working with Lambda functions.

For the account linking use case, automatic linking relies on matching the email from the federated identity to a local account. However, there are scenarios where this match won’t exist. For example, Apple’s Hide My Email feature generates a unique alias for each app, so the federated email won’t match any existing local account. This is an effective privacy feature but it also blocks the ability to automatically link accounts. In cases like these, your application will need to implement a user-initiated account linking flow, such as prompting the user to verify ownership of both email addresses before calling the AdminLinkProviderForUser API to complete the link.

Monitor your Lambda function performance using Amazon CloudWatch metrics. Set up alarms for errors, timeouts, and throttling so you can respond quickly if issues arise. I also recommend capturing sample event payloads from a CloudWatch log group during your initial development and deployment—these will be valuable for local testing and debugging which can lead to quicker resolution if issues arise in your production environment. This is especially important as different IdPs (namely SAML and OIDC providers) may respond with varying attribute and value syntaxes. Consider implementing CloudWatch alarms to alert your security and operational teams if authentication failures spike, which could indicate an attempted attack, misconfiguration, or provide insight into further optimization of your inbound federation Lambda trigger.

Conclusion

In this post, you learned about the new inbound federation Lambda trigger for Amazon Cognito and how it can solve various use cases. You walked through two common federation challenges and reviewed some sample code to help resolve those challenges. For B2B and SaaS applications, the inbound federation Lambda trigger gives you control when dealing with oversized attributes from external identity providers (such as group membership) without requiring coordination with enterprise IT teams. For B2C and consumer-facing applications, it enables seamless account linking across multiple authentication methods, creating a unified customer experience.

The new Lambda trigger works with SAML, OIDC, and supported social providers, and is available now in AWS Regions where Amazon Cognito is available. To learn more about the new Lambda trigger and others, see the Amazon Cognito Developer Guide.

What federation challenges are you facing in your applications? I’d love to hear about your use cases in the comments below and over at AWS re:Post.

Abrom-Douglas-author

Abrom Douglas

Abrom is a Senior Solutions Architect within AWS Identity with over 20 years of software engineering and security experience, specializing in the identity and access management space. He loves speaking with customers about how identity and access management can provide secure outcomes that enable both business and technology initiatives. In his free time, he enjoys cheering for Arsenal FC, photography, travel, volunteering, and competing in duathlons.

  •  

Remembering Sir Alex Younger

There are moments when you meet a person who you immediately know will have a formative influence on you — a person you will learn from, who you will respect, who you will follow anywhere, who you will listen to, who will be your friend. Sir Alex was just that.

I was lucky to meet Sir Alex just as he was leaving MI6 in 2020. I traveled to London, having to navigate a few Covid restrictions. I asked him if this would cause problems. He smiled: “It is always better to ask for forgiveness than seek permission,” he said. Immediately I knew that this was someone I would get along with very well.

The objective was straightforward: I was hoping to recruit him to the Recorded Future board of directors, which we eventually accomplished after significant complications got in the way, once again solved by the previous method.

Sir Alex joined a Recorded Future board meeting in New York. As I welcomed him, Alex — smiling characteristically — introduced himself as having run the world’s best intelligence agency, a pointed reminder that superb people, tradecraft, and pedigree can rival any scale. And we wanted to learn from the best.

My assumption, as much as one should not make them, was that Alex could teach us everything in intelligence, except for perhaps around the technical SIGINT-like apparatus that is at the core of Recorded Future. Yet, in our first discussion, talking about “connecting dots,” Alex said, “it is not about connecting dots, it is about connecting entire collections,” which became the very underpinning of how we build our Intelligence Graph®. I was humbled, having underestimated him, and it taught me a valuable lesson.

Yet, the confidence of having run the world’s best intelligence agency did not at all hold back Alex from asking even the most basic questions. Coming from public service, driving revenue was not a familiar concept. As opposed to most senior characters who would do anything to not seem to have all the answers, Alex, early in the first meeting, when hearing the terms ARR and revenue, raised his hand and said, “please explain annualized revenue.” That is the sign of somebody who always wanted to learn and would not let pride get in the way of gaining insights.

Sir Alex brought great moral clarity, yet not the kind that is based on anger, “you’re either with us or against us,” rather, the kind that leads to an alliance of peers sharing in values that can defeat any autocratic counterpart. Teamwork, he would say, is the unique strength of the West, as we can build on trust, whereas our adversaries fundamentally cannot.

Speaking at the Recorded Future 2023 Predict conference, our audience spellbound, Sir Alex paraphrased Milton Friedman: “No individual can make a pencil alone.” He was cheered by everyone, and we know that this was the answer to beat our adversaries.

Over the last few months, I asked Alex for some favors, and I now find myself wondering whether I asked too much of him. He gave a briefing to thousands of Recorded Future clients on Iran with an energy and intellect that would put anyone to shame. And more recently, I asked him for help with a personal endeavour, which in hindsight was too much to ask at the time, yet he did something amazing.

I can only hope that I can be such a friend to my friends as Alex was to me.

Six months ago, when Alex was in the midst of treatment, I asked him if I could take him for a special dinner. We enjoyed amazing food and, truth be told, even more amazing wine. I came early to the restaurant and suggested to them, “he may eat and drink a little, please do not make a fuss about that.” Yet, Alex went at the food and wine with a vengeance, claiming that his treatment left him very hungry. If there ever was a fighting spirit, it was his.

Sir Alex and Christoper sitting at a restaurant and a picture of the course menu on the left.

Please join my Recorded Future colleagues in our cheers for Sir Alex Younger and thoughts for Sarah and their family.

I’m certain that he would want us to take the fight to the bad guys and build even greater alliances with our friends.

  •  

Identify unused AWS KMS keys and prevent accidental key deletions

As you scale your use of Amazon Web Services (AWS), managing KMS keys becomes increasingly important. Whether you manage a handful of keys or thousands across multiple AWS accounts and AWS Regions, there’s often a need to audit key usage to help you meet compliance requirements, evaluate your risk posture, and optimize key management costs. However, determining which keys are actively in use and which have been sitting idle can be a time consuming and complex task.

To help with this, AWS Key Management Service (AWS KMS) has launched the GetKeyLastUsage API, a new feature that you can use to quickly determine when each key was last used for a cryptographic operation, significantly enhancing your audit capabilities and key lifecycle management. For more information, see Determine past usage of a KMS key.

Before this launch, the primary way to audit key usage was through AWS CloudTrail logs. CloudTrail captures every cryptographic operation by default, so the data is available. The difficulty is turning that data into actionable insight. You need to identify which keys to examine, query the right logs, and repeat that process frequently enough to maintain an accurate view. For the most recent 90 days, CloudTrail event history makes this manageable. Beyond that, you need to create a dedicated trail to deliver logs to Amazon Simple Storage Service (Amazon S3) for long-term retention, then query those logs using tools such as Amazon Athena to determine when a key was last used.

Determine when a key was last used

AWS KMS now provides a direct way to see when a key was last used for cryptographic operations. You can also see this information using the AWS Management Console for AWS KMS and the AWS Command Line Interface (AWS CLI).

The GetKeyLastUsage API returns the date and time of the most recent cryptographic operation performed with a KMS key, without requiring you to search through CloudTrail logs. The API returns the date and time of the last key operation, the type of operation performed, CloudTrail event ID, and KMS request ID. You can access this information for all customer-managed keys and AWS managed keys irrespective of key spec, key origin, key store, or key usage type.

In addition, you can restrict a key from being disabled or scheduled for deletion if it was recently used, by incorporating this usage information as a condition within the KMS key policy. See the Preventing accidental key deletion with policy controls section for implementation details.

About the tracking period

One of the important concepts you must understand before relying on the last usage information reported on a KMS key is the tracking period. The tracking period is the date from which AWS KMS began tracking cryptographic activity for the key. Tracking began on April 23, 2026, for most AWS Regions. Understanding the tracking period is critical because it determines whether the absence of usage information means a key has never been used or only hasn’t been used since tracking started.

For example, if you have a key created on January 1, 2026, and you check its usage, any cryptographic operations that occurred between January 1 and April 22 wouldn’t be captured in the usage information. Thus, you can’t conclude that it’s never been used, because it might have been used in the months before tracking began.

Getting started

There’s nothing to enable or additional configuration required to view usage information on last cryptographic operation performed on your KMS keys.

To view KMS key usage:

  1. Go to the AWS KMS console and choose Customer-managed keys in the navigation pane and select a key. Look for Last used on the general configuration.
    Figure 1: KMS key general configuration page

    Figure 1: KMS key general configuration page

  2. Choose the link under Last used to see additional details such as Timestamp, Operation, and the CloudTrail event ID.
    Figure 2: View last used details including timestamp, operation, and event ID

    Figure 2: View last used details including timestamp, operation, and event ID

  3. The Last used column is also shown when you attempt to schedule key deletion, so that you can make informed decisions.
    Figure 3: Scheduled key deletion warning

    Figure 3: Scheduled key deletion warning

API reference

See the following examples for ideas on how to use the GetKeyLastUsage API to better understand KMS key usage.

Use case 1: Cost optimization through unused key cleanup

If you manage thousands of AWS KMS keys distributed across multiple AWS accounts, you might have keys that have remained unused since creation or keys that are no longer needed. By cleaning up these keys, you can reduce operational costs and minimize your security footprint. However, without visibility into which keys are actively performing cryptographic operations, it can be difficult to distinguish between keys protecting critical workloads and those that can be safely decommissioned.

Note that there are some precautions that you should take before scheduling key deletion. While the last usage information can help identify unused keys, it shouldn’t be the only factor in deciding whether to delete or disable a key. The last usage information tells you when a key was last used, not whether it will be needed in the future. A key might be unused for months but still required to decrypt files, for compliance scenarios or disaster recovery as shown in figure 4.

When you identify a potentially unused key, first disable it using DisableKey and monitor your applications and services for any encryption or decryption failures.

Figure 4: A use case where GetKeyLastUsage doesn’t accurately reflect whether a KMS key is still required

Figure 4: A use case where GetKeyLastUsage doesn’t accurately reflect whether a KMS key is still required

As an example, Amazon EBS volumes only interact with KMS keys during specific lifecycle events like volume creation, attachment, and detachment. After a volume is attached to an Amazon Elastic Compute Cloud (Amazon EC2) instance, the plaintext data encryption key is cached in the Nitro Card hardware, and all subsequent read/write operations use this cached key without any further AWS KMS API calls. This means a production volume running continuously for months or years will show no KMS activity during that entire period. However, the volume remains completely dependent on that KMS key for any future operations like instance restarts, volume reattachments, or disaster recovery scenarios. If someone deletes the KMS key, the encrypted data key stored with the volume can never be decrypted again, making the volume’s data permanently and irreversibly inaccessible. Before deleting any KMS key, you must verify it has no associated EBS volumes or snapshots, regardless of how long ago the last KMS API call occurred.

AWS provides a mechanism where you can create a CloudWatch alarm that notifies you if a key pending deletion is being accessed, giving you an opportunity to cancel the deletion before data becomes inaccessible.

Solution with GetKeyLastUsage API

Here’s a sample script that scans all customer-managed keys in an account and retrieves each key’s last usage date through the GetKeyLastUsage API. It accepts two optional inputs: a threshold in days and an AWS Region. The script filters and displays only keys that haven’t been used within the specified period, presenting results in a table with the key name, AWS account ID, AWS Region, and last usage date. This can help you identify unused encryption keys.

The following is an example to scan all keys that haven’t been used in the last 180 days in the us-east-1 Region:

./script.sh 180 us-east-1
#!/bin/bash
DAYS=${1:-90}
REGION=${2:-$(aws configure get region)}
CUTOFF=$(date -v-${DAYS}d +%s 2>/dev/null || date -d "-${DAYS} days" +%s)
ACCOUNT_ID=$(aws sts get-caller-identity --query Account --output text)
printf "Showing keys not used in the last %s days (Region: %s)\n\n" "$DAYS" "$REGION"
printf "%-50s %-15s %-20s %-15s\n" "Key Name" "Account ID" "Region" "Last Usage Date"
printf "%.0s-" {1..100}
printf "\n"
for key_id in $(aws kms list-keys --region $REGION --query 'Keys[*].KeyId' --output text); do
key_manager=$(aws kms describe-key --region $REGION --key-id $key_id --query 'KeyMetadata.KeyManager' --output text)
if [ "$key_manager" = "CUSTOMER" ]; then
last_usage=$(aws kms get-key-last-usage --region $REGION --key-id $key_id)
timestamp=$(echo $last_usage | jq -r '.KeyLastUsage.TimeStamp // empty')
if [ -z "$timestamp" ]; then
last_epoch=0
else
last_epoch=$(date -jf "%Y-%m-%dT%H:%M:%S" "$(echo $timestamp | cut -d. -f1)" +%s 2>/dev/null || date -d "$timestamp" +%s)
fi
if [ "$last_epoch" -lt "$CUTOFF" ]; then
key_alias=$(aws kms list-aliases --region $REGION --key-id $key_id --query 'Aliases[0].AliasName' --output text)
key_name=${key_alias:-$key_id}
[ "$key_name" = "None" ] && key_name=$key_id
if [ -z "$timestamp" ]; then
tracking_date=$(echo $last_usage | jq -r '.TrackingStartDate' | cut -d'T' -f1)
last_used="${tracking_date}*"
else
last_used=$(echo $timestamp | cut -d'T' -f1)
fi
printf "%-50s %-15s %-20s %-15s\n" "$key_name" "$ACCOUNT_ID" "$REGION" "$last_used"
fi
fi
done
printf "\n* = No operations performed since tracking started\n"

Use case 2: Preventing accidental key deletion with policy controls

Organizations frequently face the risk of accidental key deletions, which can have severe operational consequences. Despite precautions and safety measures, accidents can happen. A key might be deleted because someone believes it’s no longer in use, only to discover that critical applications or workloads depend on it. This results in data access failures, application downtime, and emergency recovery procedures. Without visibility into recent key usage, teams lack the information needed to make safe disable decisions or implement effective safeguards.

Solution with policy based controls

To prevent KMS keys from being accidentally Disabled or Deleted use the kms:TrailingDaysWithoutKeyUsage condition key in key policies to automatically block deletion or disabling of recently used keys:

  1. Open the AWS KMS console and choose Customer managed keys in the navigation pane.
  2. Select the key you want to protect.
  3. In the Key policy tab, choose Edit.
  4. In the policy editor, add the following statement:
{
  "Sid": "PreventDeletionOfRecentlyUsedKeys",
  "Effect": "Deny",
  "Principal": "*",
  "Action": [
    "kms:ScheduleKeyDeletion",
    "kms:DisableKey"
  ],
  "Resource": "*",
  "Condition": {
    "NumericLessThanEquals": {
      "kms:TrailingDaysWithoutKeyUsage": "365"
    }
  }
}
  1. Choose Save changes.

The policy prevents deletion or disabling a key if it was used within the past 365 days. You can adjust the threshold to match your organization’s requirements. For more information about the condition key, see kms:TrailingDaysWithoutKeyUsage.

Important considerations

When reviewing key usage for possible deletion, consider the following:

  • Key deletion is irreversible and makes encrypted data unrecoverable. AWS enforces a 7–30 day waiting period. During this time, monitor usage attempts and cancel the deletion if necessary. Delete a key only if you’re certain that no data has been encrypted or will be encrypted with it. Consider disabling the key first to test the impact of unavailable keys.
  • CloudTrail remains authoritative because it provides the full audit trail. GetKeyLastUsage quickly tells you when and what operations occurred, but CloudTrail shows you who made the request and with what parameters. Learn more about logging KMS API calls with CloudTrail.

Conclusion

The GetKeyLastUsage API enhances your KMS key management capabilities by providing immediate access to usage data that was previously only present in CloudTrail logs. Start by opening the AWS KMS console and checking the Last used field for any customer-managed keys and AWS managed keys to see this information in action. For broader key auditing, integrate the API into your existing automation scripts using the AWS CLI examples provided.

If you have feedback about this post, submit comments in the Comments section below.
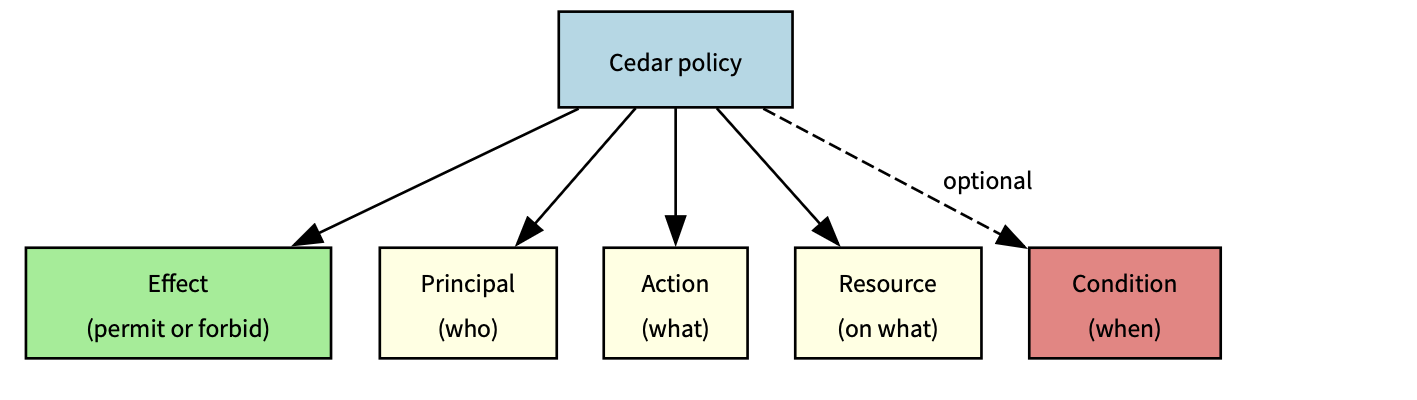

Andrea Rossi

Andrea Rossi

Andrea is the Solutions Architect who always asks “but is it secure?” one more time. Based in Milan, Italy, he works with customers to architect cloud solutions where security is foundational, not an afterthought, from network-level hardening to integrating Generative AI workloads into compliant environments.

Poojil Tripathi

Poojil Tripathi

Poojil is a Solutions Architect based in Austin, TX, who would like to remind you that you should never click on links. He works with customers to design secure-by-design cloud solutions on AWS, specializing in encryption and healthy paranoia.

  •  

Secure multi-tenant AI agents with Amazon Bedrock AgentCore resource-based policies

Software as a service (SaaS) providers building AI-powered applications on Amazon Bedrock AgentCore often need to serve multiple tenants with distinct security requirements from a shared infrastructure. Some tenants require cross-account access from their own Amazon Web Services (AWS) accounts, while others mandate that traffic stay within a private virtual private cloud (VPC) for regulatory compliance. Without centralized resource-level control, managing these diverse requirements can be complex.

AgentCore supports resource-based policies, giving you centralized, resource-level control over who can access your AgentCore Runtime and AgentCore Runtime endpoint resources and under what conditions.

In this post, you walk through a multi-tenant AI customer service platform where two tenants need different levels of access to the same agent. You learn how to use resource-based policies on AgentCore to grant cross-account access for one tenant while restricting another to VPC-only traffic—all while sharing the same underlying AgentCore Runtime and AgentCore Runtime endpoint.

The multi-tenant scenario

Imagine you’re an SaaS provider who builds and operates an AI-powered customer service platform. You use AgentCore to deploy intelligent agents that handle customer inquiries, answering product questions, processing returns, and escalating complex issues to human agents.

You serve multiple enterprise clients (tenants), each with their own AWS account and unique security requirements:

  • Tenant A: Example Corp is a large retailer operating in AWS account 111122223333. Their development team is building a customer-facing chat agent that calls your AI agent to answer product questions in real time, and their admin team needs access to test agent behavior and monitor responses. Both roles must invoke the agent directly from Example Corp’s own AWS account without you having to share credentials or create AWS Identity and Access Management (IAM) users on their behalf. Example Corp has no network restriction requirements—their teams can invoke the agent from any network path as long as they have valid AWS credentials.
  • Tenant B: AnyCompany is a healthcare company operating in AWS account 444455556666. Because of regulatory (HIPAA) requirements, AI agent traffic must originate only from their private VPC (vpc-health1234). Their internal support staff uses the AI agent to assist with patient billing inquiries, which might involve protected health information (PHI). Their compliance team mandates that no API call to the agent can be made from developer laptops, public endpoints, or any network outside the controlled VPC boundary.
  • Your platform (SaaS provider) runs in account 555555555555 in the us-west-2 AWS Region. You operate an AgentCore Runtime (support-agent-runtime) that handles the core customer service logic, and an AgentCore Runtime endpoint (DEFAULT) that routes requests to the latest version of the support agent. Both tenants share this same agent infrastructure.

You can use resource-based policies to define who can access your AgentCore Runtime and AgentCore Runtime endpoint directly on the resources themselves—centralizing access control on the resource side. For cross-account scenarios like Example Corp, both a resource-based policy on your resources and an identity-based policy in the tenant’s account are required. For VPC-restricted scenarios like AnyCompany, you can use specific IAM conditions to enforce that requests originate only from an approved VPC, adding a network-level security boundary on top of identity-based controls.

Solution architecture

The following diagram shows the architecture for the multi-tenant AI customer service platform with both access patterns.

Figure 1: Architecture for the multi-tenant AI customer service platform with both access patterns

Figure 1: Architecture for the multi-tenant AI customer service platform with both access patterns

  • Your account (555555555555) with AgentCore Runtime and AgentCore Runtime endpoint
  • Example Corp’s account (111122223333) with DeveloperRole and AdminRole
  • AnyCompany’s account (444455556666) with VPC boundary and ApplicationRole
  • Policy enforcement points on both resources
  • VPC endpoint in AnyCompany’s VPC connecting to AgentCore

The SaaS provider account (555555555555) hosts the AgentCore Runtime and AgentCore Runtime endpoint that both tenants share. Example Corp (111122223333) accesses the agent cross-account using IAM roles—DeveloperRole and AdminRole—authenticated with Signature Version 4 (SigV4), the standard AWS request signing protocol. AWS evaluates both the resource-based policy on your resources and the identity-based policy in Example Corp’s account before granting access.

AnyCompany (444455556666) also accesses the agent cross-account, but with an additional constraint: all requests must originate from within their private VPC (vpc-health1234) through a VPC endpoint for AgentCore. The resource-based policy on your resources includes an explicit Deny statement that blocks any request from AnyCompany’s ApplicationRole when it doesn’t originate from the approved VPC.

In both cases, resource-based policies must be applied to both the AgentCore Runtime and AgentCore Runtime endpoint. AWS evaluates policies on both resources for InvokeAgentRuntime operations—if either resource denies access or lacks an explicit Allow, the request is denied.

Prerequisites

Before you begin, ensure you have the following:

  • An AWS account with AgentCore access and permissions to call PutResourcePolicy, GetResourcePolicy, and DeleteResourcePolicy on AgentCore resources
  • AWS Command Line Interface (AWS CLI) v2 installed and configured with the bedrock-agentcore-control API available
  • An AgentCore Runtime with SigV4 authentication and a DEFAULT AgentCore Runtime endpoint pointing to the latest runtime version

For the VPC-restricted scenario, the tenant must have a VPC endpoint for AgentCore configured in their VPC. An interface VPC endpoint creates a private connection between the tenant’s VPC and the AgentCore service without requiring traffic to traverse the public internet. For more information, see Interface VPC endpoints for Amazon Bedrock AgentCore.

Implementation

Both Example Corp and AnyCompanyoperate in separate AWS accounts from your platform. For cross-account access to AgentCore Runtime, AWS requires that both of the following allow the action:

  • A resource-based policy in your platform account applied to both the AgentCore Runtime and its AgentCore Runtime endpoint. InvokeAgentRuntime operations require an explicit Allow on both resources—if either lacks one, the request is denied.
  • An identity-based policy attached to the caller’s IAM role in the tenant’s account.

If either side is missing or denies the action, the request is denied.

Step 1: Configure cross-account access for Example Corp (Tenant A)

Example Corp’s DeveloperRole and AdminRole in account 111122223333 need to invoke your AI customer service agent. Without resource-based policies, enabling this cross-account access would typically require Example Corp’s roles to assume a role in your platform account through IAM role chaining—adding operational complexity, introducing temporary credential management, and creating additional IAM roles that must be maintained in your account for each tenant. With resource-based policies, you grant Example Corp’s roles direct access to your AgentCore Runtime and AgentCore Runtime endpoint without role chaining. Example Corp’s roles can invoke the agent directly from their own account using their own credentials, while you maintain centralized control over access on the resource side.

AgentCore Runtime resource-based policy

The following policy grants Example Corp’s DeveloperRole and AdminRole permission to invoke the agent runtime. This is the first of two resource-based policies required—it controls access to the runtime resource itself. Save this as runtime-policy.json:

{
  "Version": "2012-10-17",
  "Statement": [
    {
      "Sid": "AllowExampleCorpCrossAccountAccess",
      "Effect": "Allow",
      "Principal": {
        "AWS": [
          "arn:aws:iam::111122223333:role/DeveloperRole",
          "arn:aws:iam::111122223333:role/AdminRole"
        ]
      },
      "Action": "bedrock-agentcore:InvokeAgentRuntime",
      "Resource": "arn:aws:bedrock-agentcore:us-west-2:555555555555:runtime/support-agent-runtime"
    }
  ]
}

AgentCore Runtime endpoint resource-based policy

The following policy grants the same roles permission to invoke the AgentCore Runtime endpoint. Without this second policy, requests are allowed at the runtime level but denied at the endpoint level, and the invocation fails. Save this as endpoint-policy.json:

{
    "Version": "2012-10-17",
    "Statement": [
        {
            "Sid": "AllowExampleCorpCrossAccountAccess",
            "Effect": "Allow",
            "Principal": {
                "AWS": [
                    "arn:aws:iam::111122223333:role/DeveloperRole",
                    "arn:aws:iam::111122223333:role/AdminRole"
                ]
            },
            "Action": "bedrock-agentcore:InvokeAgentRuntime",
            "Resource": "arn:aws:bedrock-agentcore:us-west-2:999999999999:runtime/support-agent-runtime/runtime-endpoint/DEFAULT"
        }
    ] 
}

To apply the resource-based policies

aws bedrock-agentcore-control put-resource-policy \--resource-arn arn:aws:bedrock-agentcore:us-west-2:555555555555:runtime/support-agent-runtime \--policy file://runtime-policy.json \--region us-west-2
aws bedrock-agentcore-control put-resource-policy \--resource-arn arn:aws:bedrock-agentcore:us-west-2:555555555555:runtime/support-agent-runtime/runtime-endpoint/DEFAULT \--policy file://endpoint-policy.json \--region us-west-2

To verify the resource-based policies

aws bedrock-agentcore-control get-resource-policy \--resource-arn arn:aws:bedrock-agentcore:us-west-2:555555555555:runtime/support-agent-runtime \--region us-west-2
aws bedrock-agentcore-control get-resource-policy \--resource-arn arn:aws:bedrock-agentcore:us-west-2:555555555555:runtime/support-agent-runtime/runtime-endpoint/DEFAULT \--region us-west-2

Configure an identity-based policy (Example Corp’s account)

Resource-based policies alone aren’t sufficient for cross-account access. Example Corp must also attach an identity-based policy to DeveloperRole and AdminRole in their account (111122223333) that allows the same action on your resources. Without this policy on the tenant side, IAM denies the cross-account request even though your resource-based policies allow it.

Example Corp attaches the following policy to both DeveloperRole and AdminRole:

{
    "Version": "2012-10-17",
    "Statement": [
        {
            "Sid": "AllowInvokeAgentRuntime",
            "Effect": "Allow",
            "Action": "bedrock-agentcore:InvokeAgentRuntime",
            "Resource": [
                "arn:aws:bedrock-agentcore:us-west-2:555555555555:runtime/support-agent-runtime",
                "arn:aws:bedrock-agentcore:us-west-2:555555555555:runtime/support-agent-runtime/runtime-endpoint/DEFAULT"
            ]
        }
    ] 
}

Attach this policy to both DeveloperRole and AdminRole in Example Corp’s account.

Step 2: Configure cross-account with VPC-restricted access for AnyCompany (Tenant B)

AnyCompany operates under HIPAA compliance requirements and mandates that all traffic to your agent stays within a private network path. Like Example Corp, AnyCompany needs cross-account access from account 444455556666—but with an additional constraint, requests must originate from their VPC vpc-health1234 through an interface VPC endpoint. Any request from outside this VPC is denied, even if it comes from AnyCompany’s ApplicationRole.

Resource-based policies (your platform account): To enforce this, you update the resource-based policies on both the AgentCore Runtime and AgentCore Runtime endpoint. Each policy includes an Allow statement that grants ApplicationRole permission to invoke the agent, paired with a Deny statement that blocks any request not originating from vpc-health1234. In the following policy, the Deny statement uses StringNotEquals on aws:SourceVpc . When a request arrives through an interface VPC endpoint, AWS populates this key with the VPC ID. If it doesn’t match vpc-health1234, or if the key is absent because no VPC endpoint was used, the Deny takes effect. Because an explicit Deny overrides any Allow from any policy, this pattern helps ensure that no other identity-based or resource-based policy can inadvertently grant AnyCompany access from outside the VPC. Add the following statements to runtime-policy-v2.json alongside the Example Corp statement from Step 1:

{
  "Sid": "AllowAnyCompanyCrossAccountAccess",
  "Effect": "Allow",
  "Principal": {
    "AWS": "arn:aws:iam::444455556666:role/ApplicationRole"
  },
  "Action": "bedrock-agentcore:InvokeAgentRuntime",
  "Resource": "arn:aws:bedrock-agentcore:us-west-2:555555555555:runtime/support-agent-runtime"
},
{
  "Sid": "DenyAnyCompanyOutsideVpc",
  "Effect": "Deny",
  "Principal": {
    "AWS": "arn:aws:iam::444455556666:role/ApplicationRole"
  },
  "Action": "bedrock-agentcore:InvokeAgentRuntime",
  "Resource": "arn:aws:bedrock-agentcore:us-west-2:555555555555:runtime/support-agent-runtime",
  "Condition": {
    "StringNotEquals": {
      "aws:SourceVpc": "vpc-health1234"
    }
  }
}

AgentCore Runtime endpoint resource-based policy

Add the equivalent statement to endpoint-policy-v2.json:

{
    "Sid": "AllowAnyCompanyCrossAccountAccess",
    "Effect": "Allow",
    "Principal": {
        "AWS": "arn:aws:iam::444455556666:role/ApplicationRole"
    },
    "Action": "bedrock-agentcore:InvokeAgentRuntime",
    "Resource": "arn:aws:bedrock-agentcore:us-west-2:555555555555:runtime/support-agent-runtime/runtime-endpoint/DEFAULT"
},
{
    "Sid": "DenyHealthFirstOutsideVpc",
    "Effect": "Deny",
    "Principal": {
        "AWS": "arn:aws:iam::444455556666:role/ApplicationRole"
    },
    "Action": "bedrock-agentcore:InvokeAgentRuntime",
    "Resource": "arn:aws:bedrock-agentcore:us-west-2:555555555555:runtime/support-agent-runtime/runtime-endpoint/DEFAULT",
    "Condition": {
        "StringNotEquals": {
            "aws:SourceVpc": "vpc-health1234"
        }
    }
}

Because put-resource-policy replaces the entire policy on a resource, your updated policy files must include both the preceding AnyCompany statments and the Example Corp statements from Step 1.

Apply the updated resource-based policies

aws bedrock-agentcore-control put-resource-policy \
	--resource-arn arn:aws:bedrock-agentcore:us-west-2:555555555555:runtime/support-agent-runtime \
	--policy file://runtime-policy-v2.json \
	--region us-west-2 

aws bedrock-agentcore-control put-resource-policy \
	--resource-arn arn:aws:bedrock-agentcore:us-west-2:555555555555:runtime/support-agent-runtime/runtime-endpoint/DEFAULT \
	--policy file://endpoint-policy-v2.json \
	--region us-west-2

Verify the updated policies

After applying the final policies, verify them using the get-resource-policy command:

# Verify Agent Runtime policy 
aws bedrock-agentcore-control get-resource-policy \
	--resource-arn arn:aws:bedrock-agentcore:us-west-2:555555555555:runtime/support-agent-runtime \
	--region us-west-2 

# Verify Agent Runtime Endpoint policy 
aws bedrock-agentcore-control get-resource-policy \
	--resource-arn arn:aws:bedrock-agentcore:us-west-2:555555555555:runtime/support-agent-runtime/runtime-endpoint/DEFAULT \
	--region us-west-2

Identity-based policy (AnyCompany’s account)

AnyCompany must attach an identity-based policy to ApplicationRole in their account 444455556666 that allows the same InvokeAgentRuntime on your resources in account 555555555555. Without this policy on the tenant side, IAM denies the cross-account request even though your resource-based policies allow it.

AnyCompany attaches the following policy to ApplicationRole:

{
    "Version": "2012-10-17",
    "Statement": [
        {
            "Sid": "AllowInvokeAgentRuntime",
            "Effect": "Allow",
            "Action": "bedrock-agentcore:InvokeAgentRuntime",
            "Resource": [
                "arn:aws:bedrock-agentcore:us-west-2:555555555555:runtime/support-agent-runtime",
                "arn:aws:bedrock-agentcore:us-west-2:555555555555:runtime/support-agent-runtime/runtime-endpoint/DEFAULT"
            ]
        }
    ] 
}

The VPC restriction is enforced entirely on resource account through the resource-based policy condition, AnyCompany’s identity-based policy doesn’t need VPC conditions. This keeps the tenant-side configuration straightforward while you maintain centralized network-level control.

OAuth authentication considerations

The policies in this post use SigV4 authentication with specific IAM role principals. If your AgentCore Runtime or AgentCore Gateway is configured with OAuth authentication instead, the principal structure changes. OAuth-authenticated resources require a wildcard principal (“Principal": "*") because the caller identity comes from a JSON Web Token (JWT) validated before policy evaluation. Anonymous or unauthenticated requests are rejected before the policy is evaluated, so the wildcard principal doesn’t grant open access. To restrict OAuth-authenticated requests to a specific VPC, combine the wildcard principal with a VPC condition in the resource-based policy. IAM principal-based condition keys such as aws:PrincipalAccount and aws:PrincipalOrgID aren’t populated in the OAuth authentication context—only supported network-level condition keys (such as aws:SourceVpc, aws:SourceVpce, aws:SourceIp) are available for use in resource-based policies with OAuth. For more details, see Resource-based policies for Amazon Bedrock AgentCore.

Understanding policy evaluation

To understand how AWS evaluates these policies when a request arrives, consider the following scenarios:

Caller or principal Network Identity-based policy (tenant side) Runtime resource-based policy Runtime endpoint resource-based policy Final policy evaluation result
Example Corp Any network Allows Allows Allows Allowed
AnyCompany From Allows Allows ( does not match) Allows ( does not match) Allowed
AnyCompany Outside VPC Allows matches matches Denied
Any other cross-account role Any network Allows No matching No matching Denied
Any other cross-account role Any network No policy Allows Allows Denied

Conclusion and next steps

In this post, you learned how to use resource-based policies on AgentCore to secure a multi-tenant AI platform with distinct access patterns for each tenant:

  • Example Corp gets seamless cross-account integration, their development and admin teams can invoke your AI agent directly from their own AWS account without credential management.
  • AnyCompany gets the strict network-level isolation their compliance team requires, the AI agent is accessible only from within their private VPC, ensuring that interactions involving potential PHI — stay within the controlled network boundary

Both tenants share the same underlying AgentCore Runtime and AgentCore Runtime endpoint, yet each has tailored security controls enforced at the resource level. his approach avoids per-tenant infrastructure duplication while satisfying each tenant’s security posture, a challenge you likely face when onboarding tenants with different compliance postures. Resource-based policies complement identity-based IAM policies, giving you layered control over which principals can invoke which agents, and from which network paths.

Next steps

If you have feedback about this post, submit comments in the Comments section below.
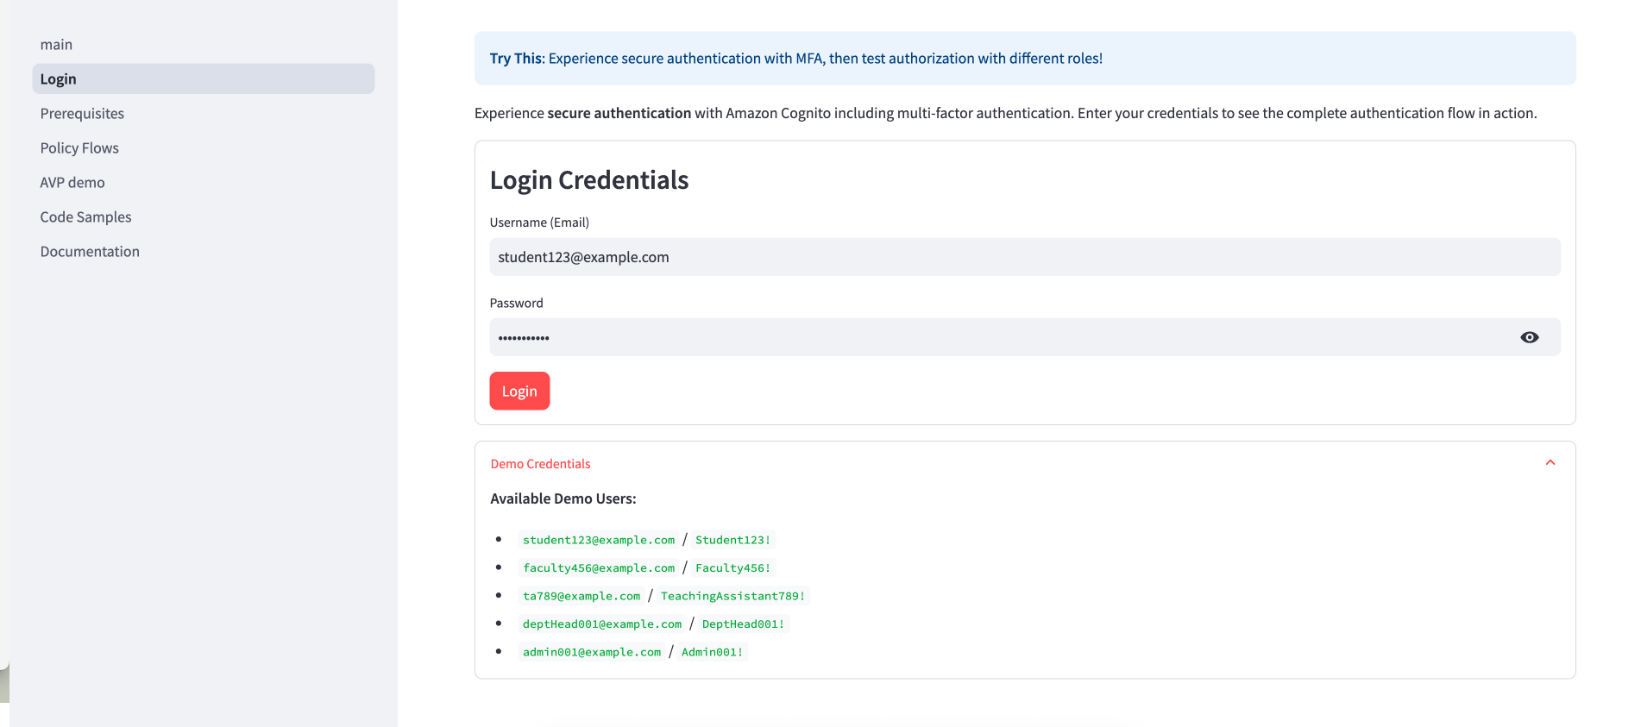

Satyen Verma

Satyen Verma

Satyen is a Software Engineer at AWS building secure and scalable runtime systems for Amazon Bedrock AgentCore. He focuses on enabling reliable, high-performance agentic AI applications for customers worldwide.

Zohreh Norouzi

Zohreh Norouzi

Zohreh is a Security Solutions Architect at AWS. She helps customers make good security choices and accelerate their journey to the AWS Cloud. She has been actively involved in generative AI security initiatives across APJ, using her expertise to help customers build secure generative AI solutions at scale.

Vijay Kumar Samanthapudi

Vijay Kumar Samanthapudi

Vijay is a Software Engineer at AWS building secure and scalable runtime systems for Amazon Bedrock AgentCore. He focuses on enabling reliable, high-performance agentic AI applications for customers worldwide.

Satveer Khurpa

Satveer Khurpa

Satveer is a Sr. WW Specialist Solutions Architect, Amazon Bedrock AgentCore at AWS, specializing in agentic AI security with a focus on AgentCore Identity and Security. He uses his expertise in cloud-based architectures to help clients design and deploy secure agentic AI systems across diverse industries.

Prajit Pabbati

Prajit Pabbati

Prajit is a Software Development Manager at AWS building secure and scalable runtime systems for Amazon Bedrock AgentCore.

  •  

Spring 2026 SOC 1, 2, and 3 reports are now available with 188 services in scope

Amazon Web Services (AWS) is pleased to announce that the Spring 2026 System and Organization Controls (SOC) 1, 2, and 3 reports are now available. The reports cover 188 services over the 12-month period from April 1, 2025–March 31, 2026, giving customers a full year of assurance. These reports demonstrate our continuous commitment to adhering to the heightened expectations of cloud service providers.

Customers can download the Spring 2026 SOC 1 and 2 reports through AWS Artifact, a self-service portal for on-demand access to AWS compliance reports. Sign in to AWS Artifact in the AWS Management Console, or learn more at Getting Started with AWS Artifact. The SOC 3 report can be found on the AWS SOC Compliance Page and AWS Artifact.

AWS strives to continuously bring services into the scope of its compliance programs to help customers meet their architectural and regulatory needs. You can view the current list of services in scope on our Services in Scope page. As an AWS customer, you can reach out to your AWS account team if you have any questions or feedback about SOC compliance.

To learn more about AWS compliance and security programs, see AWS Compliance Programs.

If you have feedback about this post, submit comments in the Comments section below.


Baj Bajwa

Baj Bajwa

Baj is a Security Assurance Manager at AWS, where he leads the Global Third-Party Assurance product portfolio within the Compliance and Security Assurance (CSA) organization. He has over 15 years of experience in information security, compliance, and risk management, and holds a master’s degree in cybersecurity. Baj maintains CISSP, CISA, PMP, CCSK, GISF, and ICAgile certifications.

Tushar-Jain

Tushar Jain

Tushar is a Compliance Program Manager at AWS where he leads multiple security and privacy initiatives Tushar holds a Master of Business Administration from Indian Institute of Management Shillong, India and a Bachelor of Technology in electronics and telecommunication engineering from Marathwada University, India. He has over 14 years of experience in information security and holds CISM, CCSK and CSXF certifications.

Michael Murphy

Michael is a Compliance Program Manager at AWS where he leads multiple security and privacy initiatives. Michael has over 14 years of experience in information security and holds a master’s degree and a bachelor’s degree in computer engineering from Stevens Institute of Technology. He also holds CISSP, CRISC, CISA, and CISM certifications.

Atulsing Patil

Atulsing is a Compliance Program Manager at AWS and has over 28 years of consulting experience in information technology and information security management. Atulsing holds a Master of Science in Electronics degree and professional certifications such as CCSP, CISSP, CISM, CDPSE, ISO 42001 Lead Auditor, ISO 27001 Lead Auditor, HITRUST CSF, Archer Certified Consultant, and AWS CCP.

Jeff Cheung

Jeff is a Compliance Program Manager at AWS where he leads multiple security and privacy initiatives across business lines. Jeff has Bachelors degrees in Information Systems, and Economics from SUNY Stony Brook, and has over 20 years of experience in information security and assurance. Jeff has held professional certifications such as CISA, CISM, and PCI-QSA.

Noah Miller

Noah is a Compliance Program Manager at AWS and leads multiple security and privacy initiatives. Noah has 7 years of experience in information security. He has a master’s degree in Cybersecurity Risk Management and a bachelor’s degree in Informatics from Indiana University.

Will Black

Will is a Compliance Program Manager at AWS where he leads multiple security and compliance initiatives. Will has 10 years of experience in compliance and security assurance and holds a degree in Management Information Systems from Temple University. Additionally, he is a PCI Internal Security Assessor (ISA) for AWS and holds the CCSK and ISO 27001 Lead Implementer certifications.

Allen Beam

Allen is a Compliance Program Manager at AWS supporting third-party security and privacy compliance initiatives. He has over 10 years of experience in external IT security audits, security control design and implementation, and audit readiness and control deficiency remediation. He has a Bachelor’s Degree in Economics and Finance from James Madison University.

Ziv Wand

Ziv is a Compliance Program Manager at AWS and leads multiple security and privacy initiatives. Ziv has over 6 years of experience in information security assurance, external IT security audits, security control design and implementation, and audit readiness. He holds a Bachelor of Science in Management Information Systems from Binghamton University.

Shalini Mishra

Shalini is a Compliance Program Manager at AWS. She has over 10 years of experience leading end-to-end compliance programs across ISO, SOC, and cloud security frameworks, with deep expertise in third-party risk management and enterprise governance. Shalini holds a Master of Science degree in Information Systems and CRISC certification.

  •  

Why and how to migrate to a Transit Gateway-attached AWS Network Firewall

AWS Network Firewall now supports native attachment to AWS Transit Gateway. Customers commonly use Transit Gateway to route traffic from Amazon Virtual Private Cloud (Amazon VPC) networks to a centralized inspection VPC (a VPC dedicated to hosting firewall endpoints for traffic inspection) where their network firewall endpoints are deployed. This centralized deployment model reduces the need to have Network Firewall endpoints in each VPC, optimizing costs and providing a centralized point of network security control.

Customers deploying Network Firewall in a centralized deployment model using Transit Gateway have traditionally set up a dedicated inspection VPC with firewall subnets and managed the associated routing to direct traffic through the firewall. With native attachment, Network Firewall attaches directly to Transit Gateway, eliminating the need for the inspection VPC and enabling capabilities such as flexible cost allocation through Transit Gateway metering policies.

In this post, we explain what a Transit Gateway-attached network firewall is, the technical capabilities it unlocks, reasons to migrate to it, and how to perform the migration. For detailed step-by-step guidance on how to perform the migration using Terraform, AWS CloudFormation, or manually in the AWS Management Console, see the accompanying migration guide repository.

What is a Transit Gateway-attached network firewall?

A Transit Gateway-attached network firewall simplifies your network architecture by eliminating the need for a dedicated inspection VPC. Instead of creating an inspection VPC with firewall subnets and configuring the associated routing, you create your network firewall and specify which Transit Gateway instance you want to attach it to. AWS deploys the firewall endpoints into an AWS-managed VPC on your behalf. You don’t own or manage that VPC. From your perspective, the firewall appears as a Transit Gateway network function attachment that you route traffic to, similar to other Transit Gateway attachments.

Why migrate to a Transit Gateway-attached network firewall?

You might want to migrate to a Transit Gateway-attached network firewall for the following reasons:

  • Access to flexible cost allocation: With native attachment, you can use Transit Gateway metering policies to charge back account owners for traffic they send through the centralized firewall. Flexible cost allocation for Network Firewall traffic over a Transit Gateway is only available with a Transit Gateway-attached firewall. Without native attachment, you can only allocate Transit Gateway data processing charges, not the Network Firewall charges.
  • Reduced architectural complexity: You can eliminate the inspection VPC, leaving one less VPC to manage along with its associated routing tables and subnets.

Preparing for the change

Before migrating to a Transit Gateway-attached network firewall, gather the following information and keep these key considerations in mind.

Prerequisites

When you create your new Transit Gateway-attached network firewall, you will need:

  • Transit Gateway ID: The ID of the Transit Gateway instance you will attach your network firewall to.
  • Logging configuration: Create a new logging configuration (such as new Amazon CloudWatch log groups) for the new firewall. During migration, you will be running both firewalls simultaneously. Keeping the logs separate simplifies monitoring and troubleshooting each firewall during the migration period. After migration is complete, you can point the new firewall to your existing logging destinations.
  • Firewall policy: Create a new firewall policy for the new firewall rather than reusing your existing one. During the migration period, a separate policy lets you make changes to the new firewall’s policy without affecting the existing firewall while both are running simultaneously. After migration is complete, you can attach your existing production policy to the new firewall.

Key considerations

There are some important considerations to address while planning for this change.

  • Transit Gateway encryption: Check if you’re using Transit Gateway encryption support. If encryption is enabled and required for your security posture, native attachment to Network Firewall doesn’t currently support this capability. You will need to continue using your current firewall configuration.
  • NAT gateway Elastic IPs: If you need to maintain the same public IPs (for example, for partner allowlisting), plan for this during migration. For more information, see the Preserving your NAT gateway Elastic IPs during migration section later in this post.
  • Maintenance window: Plan to perform this migration during a dedicated maintenance window. Brief network outages will occur during parts of the process, such as when swapping Transit Gateway route table associations and replacing NAT gateways.

Performing the migration

Leave your existing Network Firewall setup unchanged while setting up the new Transit Gateway-attached firewall. With this approach, you can minimize potential downtime and test the new configuration before migrating production traffic.

The migration process varies depending on your current architecture. The following sections walk through the two most common centralized Network Firewall architectures and the high-level migration process for each. For detailed step-by-step guidance on how to perform the migration using Terraform, CloudFormation, or manually in the console, see the migration guide repository.

Architecture 1: Dedicated inspection VPC with separate egress VPC

In this architecture, shown in the following diagram, you have a dedicated inspection VPC with your network firewall endpoints, and a separate dedicated egress VPC with your NAT gateways.

Figure 1: Centralized egress traffic inspection with Network Firewall and Transit Gateway, with inspection and egress separated into two VPCs.

Figure 1: Centralized egress traffic inspection with Network Firewall and Transit Gateway, with inspection and egress separated into two VPCs.

The high-level migration process for this architecture is:

  1. Deploy a new egress VPC with a temporary NAT gateway. Creating a new VPC lets you leave the existing deployment unchanged while working on the migration.
  2. Create your new network firewall with native attachment to your Transit Gateway.
  3. Configure three new Transit Gateway route tables to define the traffic path through the new firewall: an inspection route table (associated with the new firewall), an egress route table (associated with the new egress VPC), and a temporary migrated spoke route table (for testing individual spoke VPCs on the new path).
  4. Test the new firewall by moving a single spoke VPC to the new path. Verify connectivity and confirm the firewall is inspecting traffic by checking the alert logs for layer 7 (application layer) details. Layer 7 information in the alert logs indicates the firewall is seeing both directions of the traffic flow. If asymmetric routing were occurring, the firewall would only see one direction and would not be able to perform application-layer inspection, so the presence of layer 7 details confirms traffic is flowing symmetrically through the new firewall.
  5. Migrate the remaining spoke VPCs. You can migrate VPCs incrementally, or when you’re confident in the new firewall deployment, update the default route in your existing spoke route table to point to the new Network Firewall network function attachment, which moves all remaining spokes that share that route table at once.
  6. Optionally, preserve your original NAT gateway Elastic IPs by re-routing traffic back to your existing egress VPC (see Preserving your NAT gateway Elastic IPs during migration).
  7. Decommission old resources after you’ve verified that traffic is flowing correctly. Which VPCs you remove depends on whether you preserved your original EIPs (see Preserving your NAT gateway Elastic IPs during migration).
Figure 2: Post-migration architecture for Architecture 1, with the inspection VPC eliminated and traffic flowing through the Transit Gateway-attached Network Firewall to a dedicated egress VPC.

Figure 2: Post-migration architecture for Architecture 1, with the inspection VPC eliminated and traffic flowing through the Transit Gateway-attached Network Firewall to a dedicated egress VPC.

For the complete walkthrough of how to perform this migration:

Architecture 2: Combined inspection and egress VPC

In this architecture, shown in the following diagram, you have a single VPC that contains both your network firewall endpoints and your NAT gateways.

Figure 3: Centralized egress traffic inspection with Network Firewall and Transit Gateway, with inspection and egress combined in one VPC.

Figure 3: Centralized egress traffic inspection with Network Firewall and Transit Gateway, with inspection and egress combined in one VPC.

The migration process for this architecture follows the same high-level steps as Architecture 1.

  1. Deploy a new dedicated egress VPC with a temporary NAT gateway. Creating a new VPC lets you leave the existing deployment unchanged while working on the migration.
  2. Create your new network firewall with native attachment to your Transit Gateway.
  3. Configure three new Transit Gateway route tables to define the traffic path through the new firewall: an inspection route table, an egress route table, and a temporary migrated spoke route table.
  4. Test the new firewall by moving a single spoke VPC to the new path. Verify connectivity and confirm the firewall is inspecting traffic by checking the alert logs for layer 7 (application layer) details. Layer 7 information in the alert logs indicates the firewall is seeing both directions of the traffic flow. If asymmetric routing were occurring, the firewall would only see one direction and would not be able to perform application-layer inspection, so the presence of layer 7 details confirms traffic is flowing symmetrically through the new firewall.
  5. Migrate the remaining spoke VPCs. You can migrate VPCs incrementally, or once you are confident in the new firewall deployment, update the default route in your existing spoke route table to point to the new Network Firewall network function attachment, which moves all remaining spokes that share that route table at once.
  6. Optionally, preserve your original NAT gateway Elastic IPs by transferring them to the new egress VPC.
  7. Decommission the old combined VPC after you’ve verified that traffic is flowing correctly.
Figure 4: Post-migration architecture for Architecture 2, with the combined VPC eliminated and traffic flowing through the Transit Gateway-attached Network Firewall to a dedicated egress VPC.

Figure 4: Post-migration architecture for Architecture 2, with the combined VPC eliminated and traffic flowing through the Transit Gateway-attached Network Firewall to a dedicated egress VPC.

For the complete walkthrough of how to perform this migration, see:

Differences between the two migrations

Both architectures deploy the same new resources and use the same phased cutover approach. The differences are in the starting Transit Gateway routing structure (Architecture 1 has three route tables across two VPCs, Architecture 2 has two route tables in one VPC) and what you clean up at the end (two old VPCs instead of one). Both architectures converge to the same end state. For a detailed comparison, see the migration guide repository.

Minimizing downtime and testing your migration

Regardless of which architecture you’re migrating from, follow these best practices to minimize risk.

The migration guide repository includes starting architecture CloudFormation and Terraform templates for both architectures, so you can deploy the exact starting environment in a development or test account and run through the entire migration process before touching production.

Test before you migrate. Create your new Transit Gateway-attached firewall in parallel with your existing setup. Use a test VPC to validate the new configuration. Verify that logging is working correctly and that the firewall alert logs show layer 7 traffic details, which confirms there is no asymmetric routing. Test both allowed and blocked traffic scenarios before migrating production traffic.

Migrate in phases. Start with a single, non-critical workload VPC. Update only that VPC’s routes to use the new firewall attachment. Monitor and verify application behavior and performance with the application owner before proceeding. When planning your migration order, migrate spoke VPCs that have east-west traffic between each other at the same time. During the phased migration, spokes on different firewall paths will have their east-west traffic traverse two stateful firewalls. Because each stateful firewall independently tracks connection state, traffic that enters through one firewall and returns through another appears as untracked, causing the firewalls to drop or incorrectly handle the return traffic. When you’re confident in the new firewall deployment, you can update the default route in your existing spoke route table to point to the new firewall, which moves all remaining spokes that share that route table at once. Keep your old firewall configuration active until all traffic is migrated.

Prepare a rollback plan. Document your current route table configurations before making changes. Keep your existing firewall and inspection VPC active during migration. If issues arise, revert the route table changes to restore the previous configuration. Decommission old resources after you’ve verified applications are operating as expected.

Preserving your NAT gateway Elastic IPs during migration

An important consideration during migration is maintaining your existing NAT gateway Elastic IP addresses. Many organizations have these IPs allowlisted with external partners, third-party services, or in firewall rules. Changing these IPs would require coordination with multiple stakeholders and could disrupt business operations.

During migration, you need both your old and new deployments to operate simultaneously, so you can validate the new setup without impacting production traffic. This means creating temporary NAT gateways with temporary Elastic IPs in the new egress VPC.

After you’ve confirmed the new firewall deployment is stable and production traffic has been successfully migrated, you can restore your original Elastic IPs. The process differs depending on your architecture:

  • For Architecture 1 (separate inspection and egress VPCs), your existing egress VPC and its NAT gateways are independent of the inspection VPC being decommissioned. You can keep them by re-associating the existing egress VPC’s Transit Gateway attachment with the new egress route table and updating the inspection route table to route traffic there instead of the temporary egress VPC. This is a Transit Gateway routing change that takes seconds, doesn’t require deleting or creating any NAT gateways, and doesn’t increase in complexity with the number of Availability Zones. After the re-association, you delete the temporary egress VPC.
  • For Architecture 2 (combined inspection and egress VPC), the old VPC contains both the firewall endpoints and the NAT gateways. The simplest path is to decommission it and move the Elastic IPs to the new egress VPC. To do this, you delete the old NAT gateways to free the Elastic IPs, then create new NAT gateways in the new egress VPC with the original Elastic IPs. This requires a brief maintenance window while the new NAT gateways provision and must be repeated for each Availability Zone.

For the detailed step-by-step procedure, see the EIP preservation steps in the migration guide repository.

Conclusion

In this post, we explained what a Transit Gateway-attached network firewall is and how it differs from the traditional inspection VPC model, the reasons to migrate including reduced architectural complexity and flexible cost allocation, what to prepare before starting, and the high-level migration process for the two most common centralized inspection architectures. We also covered best practices for minimizing downtime, handling east-west traffic between spokes during phased migration, and preserving your existing NAT gateway Elastic IPs.

With a Transit Gateway-attached network firewall, AWS manages the firewall endpoints and the underlying VPC on your behalf, eliminating the inspection VPC from your architecture and enabling flexible cost allocation through Transit Gateway metering policies. The phased migration approach covered in this post lets you run both firewalls in parallel, validate the new path with a single spoke VPC, and cut over the rest of your traffic when you are ready.

For detailed step-by-step guidance using Terraform, CloudFormation, or the AWS Management Console for both architectures covered in this post, see the migration guide repository. The repository includes starting architecture templates so you can practice the full migration end-to-end in a test account before migrating your production environment.

If you have feedback about this post, submit comments in the Comments section below.
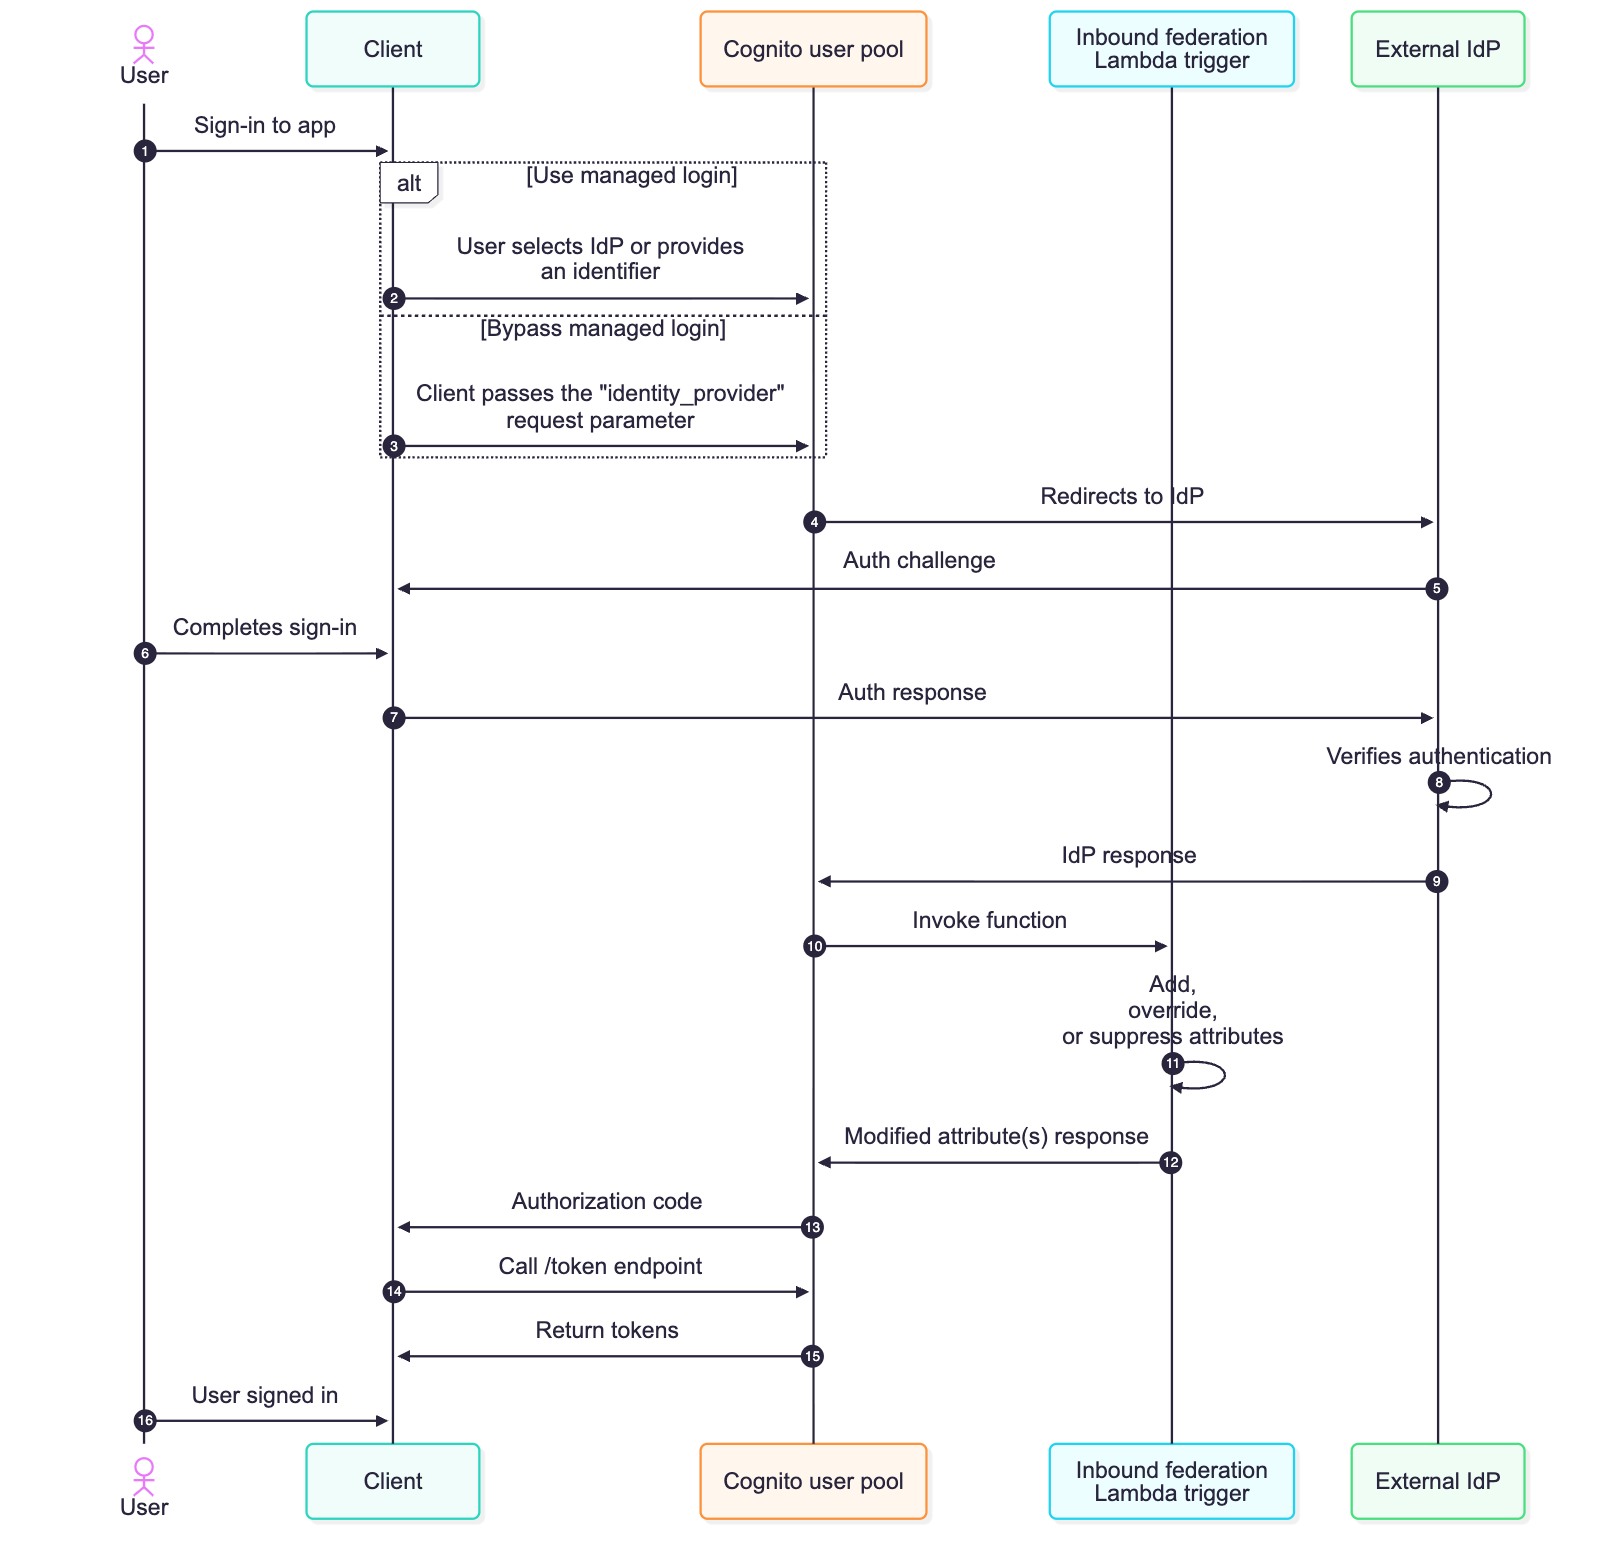

Frank Phillis

Frank Phillis

Frank is a Senior Solutions Architect (Security) at AWS. He enables customers to get their security architecture right. Frank specializes in cryptography, identity, and incident response. He’s the creator of the popular AWS Incident Response playbooks and regularly speaks at security events. When not thinking about tech, Frank can be found with his family, riding bikes, or making music.

Lawton Pittenger

Lawton Pittenger

Lawton is a Worldwide Security Specialist Solutions Architect at AWS, based in New York City. He specializes in helping customers design and implement effective network security controls. At AWS, he works with customers at scale and collaborates closely with service teams to drive continuous improvement in security services based on customer needs and feedback. Outside of work, his interests include skateboarding, snowboarding, and spending time in nature.

  •  

Simplifying policy management with URL and Domain Category filtering on AWS Network Firewall

Network administrators face a persistent challenge: maintaining domain blocklists and allowlists that keep pace with the internet. New websites and services emerge daily, and keeping these lists current requires constant manual updates that leave gaps in coverage. This challenge intensifies when managing access to rapidly evolving categories like AI services, where new tools launch on a regular basis.

AWS Network Firewall is a managed, stateful network firewall and intrusion detection and prevention service for fine-grained control of your virtual private cloud (VPC) network traffic. With URL and domain category filtering, security teams can use predefined categories to control access instead of managing individual domains. AWS-managed URL and domain categories stay current automatically as new domains are registered, removing the need for manual list maintenance.

This feature is especially useful for organizations navigating AI governance. Instead of manually tracking every new AI service, you can control access to the entire Artificial Intelligence and Machine Learning category while creating exceptions for approved services. The same approach works for social media, streaming sites, gambling, and dozens of other categories, all with built-in audit trails for compliance reporting.

In this post, we walk through URL and domain category filtering configurations for AWS Network Firewall, from basic rules to exception handling and monitoring strategies that give you visibility into how your workloads interact with external services.

Streamlined policy management with predefined categories

With URL and domain category filtering, you control website access using predefined categories instead of individually specifying sites in a domain list rule group. You can select from AWS-managed categories such as Social Networking, Gambling, or Artificial Intelligence and Machine Learning to implement and maintain filtering policies. AWS keeps these categories current automatically, so you don’t need to update firewall policies when new domains are registered.

Network Firewall offers two category filtering options. Domain category filters by domain name using the TLS Server Name Indication (SNI) field, with no decryption required. URL category filters by the full URL path, which requires TLS inspection for HTTPS traffic. To keep things straightforward, this post focuses on domain category filtering. To set up URL category filtering with TLS inspection, see Creating a TLS inspection configuration in Network Firewall.

Prerequisites

To follow the steps in this post, start by making sure that you have the following prerequisites in place:

  1. An existing Network Firewall deployment: This walkthrough assumes you have an existing Network Firewall deployment to filter egress traffic flows from your Amazon Virtual Private Cloud (Amazon VPC) in place. If you aren’t already using Network Firewall, see Getting started with AWS Network Firewall to set up your firewall before proceeding.
  2. The HOME_NET variable set correctly at the firewall policy level: The rules in this post use the $HOME_NET variable to scope traffic to your internal network. In the AWS Management Console for Amazon VPC, select your firewall policy under the Firewall policies tab, select the Details tab, and check the policy variables section under HOME_NET variable override values. We recommend setting this to all RFC 1918 private IP address ranges: 10.0.0.0/8, 172.16.0.0/12, and 192.168.0.0/16. When you set $HOME_NET at the policy level, all rule groups associated with that policy inherit the value automatically. Network Firewall automatically maps $EXTERNAL_NET to the inverse of $HOME_NET, so configuring HOME_NET correctly also configures $EXTERNAL_NET.
Figure 1: Firewall policy details tab showing the HOME_NET variable override values set to RFC 1918 private IP address ranges

Figure 1: Firewall policy details tab showing the HOME_NET variable override values set to RFC 1918 private IP address ranges

Create a category rule using the console rule builder

To get started quickly, you can create a domain category rule using the console’s built-in rule builder. In this example, we create a single alert rule for the Artificial Intelligence and Machine Learning category.

  1. Open the AWS Management Console, search for and open the Amazon VPC console.
  2. In the left navigation, scroll to Network Firewall and select Rule groups.
  3. Choose Create rule group.
  4. For Rule group type, select Stateful rule group.
  5. For Rule group format, select Standard stateful rules.
  6. For Rule evaluation order, select Strict order. Choose Next.
    Figure 2: Create Network Firewall rule group page showing Stateful rule group type, Standard stateful rules format, and Strict order evaluation selected

    Figure 2: Create Network Firewall rule group page showing Stateful rule group type, Standard stateful rules format, and Strict order evaluation selected

  7. Enter Domain-Category-Rules for the Name, Domain Category Rules for the Description, and 50 for the Capacity. Choose Next.
  8. In the rule group editor, select the Category Matching radio button.
  9. Under Category Matching, select Match all selected categories.
  10. Under AWS category type, select Domain Category from the dropdown.
  11. Under Categories, select Artificial Intelligence and Machine Learning.
  12. For Protocol, select TLS.
  13. For Source, select Custom, then enter $HOME_NET in the dialog box.
  14. Set the Destination IP to Any.
  15. For Action, select Alert.
  16. Choose Add rule to add this rule to the rule group. Choose Next.
    Figure 3: Completed category matching rule showing TLS protocol, $HOME_NET source, Any destination, and Alert action added to the rule group

    Figure 3: Completed category matching rule showing TLS protocol, $HOME_NET source, Any destination, and Alert action added to the rule group

  17. Under Customer managed key, leave the default setting (Customize encryption settings should remain unchecked).
  18. Under Add tags – optional, leave the default setting of no tags.
  19. Choose Next, then Create rule group.

This rule generates an alert log entry each time a connection matches a domain in the Artificial Intelligence and Machine Learning category. It doesn’t block traffic. To block traffic, change the action to Drop or Reject in step 15.

Creating the same rule using Suricata compatible rule strings

The console rule builder is a quick way to get started, but we recommend using Suricata compatible rule strings for production deployments. Suricata rules give you full control over rule options, make rules straightforward to copy, edit, share, and back up, and support the majority of the Suricata engine. For more information, see Limitations and caveats for stateful rules in AWS Network Firewall.

The following walkthrough creates the same alert rule you built with the console rule builder, this time using a Suricata rule string.

In the Amazon VPC console, navigate to Network Firewall, then select Network Firewall rule groups.

  1. Choose Create rule group.
  2. For Rule group type, select Stateful rule group.
  3. For Rule group format, select Suricata compatible rule string.
  4. For Rule evaluation order, select Strict order. Choose Next.
    Figure 4: Create Network Firewall rule group page showing Stateful rule group type, Suricata compatible rule string format, and Strict order evaluation selected

    Figure 4: Create Network Firewall rule group page showing Stateful rule group type, Suricata compatible rule string format, and Strict order evaluation selected

  5. Enter Suricata-Domain-Category-Rules for the Name, Suricata Domain Category Rules for the Description, and 50 for the Capacity. Choose Next.
  6. Leave the Rule variables section empty. The $HOME_NET variable is inherited from the firewall policy, as configured in the prerequisites.
  7. Leave IP set references empty.
  8. Paste the following rule into the Suricata compatible rule string editor:
    alert tls $HOME_NET any -> $EXTERNAL_NET any (msg:"Artificial Intelligence and Machine Learning Category"; aws_domain_category:Artificial Intelligence and Machine Learning; sid:1000001;)
  9. Choose Next.
    Figure 5: Suricata compatible rule string editor with the domain category alert rule pasted in and the rule variables section left empty

    Figure 5: Suricata compatible rule string editor with the domain category alert rule pasted in and the rule variables section left empty

  10. Under Customer managed key, leave the default setting (Customize encryption settings should remain unchecked).
  11. Under Add tags – optional, leave the default setting of no tags. Choose Next.
  12. Choose Create rule group.
  13. After creating the rule group, return to your firewall policy and add it under Stateful rule groups. We recommend associating new rule groups in a development or test environment first to validate behavior before deploying to production.

The following table explains each component of this rule:

alert Action: generate an alert log entry when the rule matches. Other actions include pass, drop, and reject.
tls Protocol: inspect TLS traffic, matching against the SNI field in the TLS Client Hello.
$HOME_NET any -> $EXTERNAL_NET any Source and destination: match traffic from any internal IP address (HOME_NET) and port to any external IP address (EXTERNAL_NET) and port. The HOME_NET variable defines your internal network ranges, and the EXTERNAL_NET variable is automatically set to the inverse.
msg:”Artificial Intelligence and Machine Learning Category” The message written to the alert log when this rule is triggered.
aws_domain_category:Artificial Intelligence and Machine Learning The AWS-managed domain category to match against. The firewall looks up the destination domain in the category database and matches if the domain belongs to this category.
sid:1000001 A unique signature ID for this rule. Each rule in a rule group must have a unique SID.

Managing exceptions for approved services

You can manage exceptions to keep business-critical websites accessible. For example, say you need to allow access to OpenAI while blocking all other AI and ML traffic. To do this, return to the Suricata-Domain-Category-Rules rule group you created earlier and replace the basic alert rule with the following ruleset. Select the Suricata-Domain-Category-Rules rule group, under the Rules section, choose Edit.

Figure 6: Selecting Suricata-Domain-Category-Rules rule group to edit with new rules

Figure 6: Selecting Suricata-Domain-Category-Rules rule group to edit with new rules

Paste in the following rules and choose Save rule group.

# Allow OpenAI (TLS)
pass tls $HOME_NET any -> $EXTERNAL_NET any (tls.sni; dotprefix; content:".openai.com"; nocase; endswith; flow:to_server; alert; msg:"Allow OpenAI over TLS"; sid:1000001;)

# Allow OpenAI (HTTP)
pass http $HOME_NET any -> $EXTERNAL_NET any (http.host; dotprefix; content:".openai.com"; nocase; endswith; flow:to_server; alert; msg:"Allow OpenAI over HTTP"; sid:1000002;)

# Block all other AI/ML category traffic (TLS)
reject tls $HOME_NET any -> $EXTERNAL_NET any (msg:"Block non-approved AI/ML sites over TLS"; aws_domain_category:Artificial Intelligence and Machine Learning; flow:to_server; alert; sid:1000003;)

# Block all other AI/ML category traffic (HTTP)
reject http $HOME_NET any -> $EXTERNAL_NET any (msg:"Block non-approved AI/ML sites over HTTP"; aws_url_category:Artificial Intelligence and Machine Learning; flow:to_server; alert; sid:1000004;)
Figure 7: Suricata compatible rule string editor with the exception-based ruleset containing pass rules for OpenAI and reject rules for the AI/ML category

Figure 7: Suricata compatible rule string editor with the exception-based ruleset containing pass rules for OpenAI and reject rules for the AI/ML category

With strict order evaluation, the firewall evaluates rules in the order you define them. The pass rules for OpenAI appear first, so matching traffic is allowed before the broader category block rules run.

To verify the rules are working as expected, test from a host that routes traffic through your network firewall. These commands suppress the response body and check the exit code of the curl request. If curl completes a TCP connection, it prints CONNECTION ALLOWED. If the firewall resets the connection, curl exits with a non-zero code and prints CONNECTION BLOCKED.

A request to openai.com should succeed because it matches the pass rule:

curl -s -o /dev/null https://openai.com && echo "CONNECTION ALLOWED" || echo "CONNECTION BLOCKED"

Result: CONNECTION ALLOWED

A request to chat.mistral.ai should be rejected because it matches the broader AI/ML category block rule:

curl -s -o /dev/null https://chat.mistral.ai && echo "CONNECTION ALLOWED" || echo "CONNECTION BLOCKED"

Result: CONNECTION BLOCKED

How to monitor category usage

When you add a domain category rule to your firewall policy, Network Firewall performs a category lookup for every connection that matches the rule’s protocol and IP specifications. The rules in this post match on $HOME_NET any -> $EXTERNAL_NET any, which means the firewall looks up the category for all outbound traffic originating from your internal network. This is why it’s important to have the $HOME_NET variable configured correctly at the firewall policy level. With this configuration, a single category rule is enough for category metadata to appear in your firewall logs across all matching connections, not just connections that match the specific category in your rule.

Each log entry includes an aws_category field containing a JSON array of all categories the destination domain belongs to. A single domain can map to multiple categories. For example, a request to chat.mistral.ai produces a log entry with “aws_category": "[\"Social Networking\",\"Artificial Intelligence and Machine Learning\"]” because that domain belongs to both categories.

You can access firewall logs through Amazon CloudWatch, Amazon Simple Storage Service (Amazon S3), and Amazon Data Firehose. These logs show which categorized websites your workloads access, helping you track usage patterns and enforce acceptable use policies.

The following sample log entry shows what a blocked request to chat.mistral.ai looks like using the exception-based rules from the previous section. The alert.signature field contains the rule’s msg value, and the aws_category field lists all categories the destination domain belongs to:

{ 

     "firewall_name": "egress-and-east-west-firewall", 

     "availability_zone": "us-east-1a", 

     "event_timestamp": "1775599146", 

     "event": { 

          "aws_category": "[\"Social Networking\",\"Artificial Intelligence and Machine Learning\"]", 

          "tx_id": 0, 

          "app_proto": "tls", 

          "src_ip": "10.1.1.100", 

          "src_port": 58664, 

          "event_type": "alert", 

          "alert": { 

                    "severity": 3, 

                    "signature_id": 1000003, 

                    "rev": 1, "signature": 

                    "Block non-approved AI/ML sites over TLS", 

                    "action": "blocked", 

                    "category": "" 

          }, 

          "flow_id": 763153567844057, 

          "dest_ip": "172.66.2.203", 

          "proto": "TCP", 

          "verdict": { 

                    "action": "drop", 

                    "reject-target": "to_client", 

                    "reject": [ 

                         "tcp-reset" 

                    ] 

          }, 

          "tls": { 

               "sni": "chat.mistral.ai", 

               "version": "UNDETERMINED" 

          }, 

          "dest_port": 443, 

          "pkt_src": "geneve encapsulation", 

          "timestamp": "2026-04-07T21:59:06.906761+0000", 

          "direction": "to_server" 

     } 

} 

The aws_category field shows the domain belongs to both the “Social Networking” and “Artificial Intelligence and Machine Learning” categories. The verdict field confirms the connection was dropped with a TCP reset sent to the client.

Traffic that matches a pass rule with the alert keyword also generates a log entry with the aws_category field populated. For example, a connection to chat.openai.com that matches the OpenAI exception rule from the earlier section produces a log entry with alert.action set to “allowed” and the same category metadata. This means your queries capture both blocked and allowed traffic.

Querying logs with CloudWatch Logs Insights

If you send your firewall logs to Amazon CloudWatch Logs, you can use CloudWatch Logs Insights to analyze category traffic patterns. A single connection can generate multiple log entries (for example, a reject rule log and a default action log for the same flow), so the following queries deduplicate by flow_id to count each connection only once. Because a single domain can belong to multiple categories, results are grouped by category combination. For example, traffic to a domain categorized as both “Social Networking” and “Artificial Intelligence and Machine Learning” appears as a single combined entry.

To get started, navigate to the CloudWatch console. In the left navigation pane under Logs, select Logs Insights. Under Query scope, leave Log group name selected, then select your AWS Network Firewall alert logs log group. For the time window, we recommend starting with the default of 1 hour to keep the queries light. Enter each of the following queries into the editor and choose Run query to review the results. Note that CloudWatch Logs Insights queries incur charges based on the amount of data scanned. See Amazon CloudWatch pricing for details.

Most accessed categories

This query shows which category combinations your workloads connect to most frequently:

fields @timestamp, event.aws_category, event.flow_id
| filter ispresent(event.aws_category) and event.aws_category != "[]"
| stats latest(event.aws_category) as categories by event.flow_id
| stats count(*) as connections by categories
| sort connections desc
| limit 20
Figure 8: CloudWatch Logs Insights query results showing the most frequently accessed category combinations sorted by connection count

Figure 8: CloudWatch Logs Insights query results showing the most frequently accessed category combinations sorted by connection count

Least accessed categories

This query reverses the sort order to surface category combinations with the fewest connections, helping you identify categories that might not be relevant to your environment or that warrant further investigation:

fields @timestamp, event.aws_category, event.flow_id
| filter ispresent(event.aws_category) and event.aws_category != "[]"
| stats latest(event.aws_category) as categories by event.flow_id
| stats count(*) as connections by categories
| sort connections asc
| limit 20
Figure 9: CloudWatch Logs Insights query results showing the least frequently accessed category combinations sorted by connection count ascending

Figure 9: CloudWatch Logs Insights query results showing the least frequently accessed category combinations sorted by connection count ascending

Most accessed categories, allowed traffic only

The event.verdict.action field indicates the actual outcome of each connection:drop for blocked traffic and alert for allowed traffic. This query shows which category combinations have the most allowed connections:

fields @timestamp, event.aws_category, event.flow_id, event.verdict.action
| filter ispresent(event.aws_category) and event.aws_category != "[]"
| stats latest(event.aws_category) as categories, latest(event.verdict.action) as verdict by event.flow_id
| filter verdict = "alert"
| stats count(*) as connections by categories
| sort connections desc
| limit 20
Figure 10: CloudWatch Logs Insights query results showing the most accessed category combinations filtered to allowed traffic only

Figure 10: CloudWatch Logs Insights query results showing the most accessed category combinations filtered to allowed traffic only

Most accessed categories, blocked traffic only

The same query filtered to blocked connections. Change the verdict filter to drop:

fields @timestamp, event.aws_category, event.flow_id, event.verdict.action
| filter ispresent(event.aws_category) and event.aws_category != "[]"
| stats latest(event.aws_category) as categories, latest(event.verdict.action) as verdict by event.flow_id
| filter verdict = "drop"
| stats count(*) as connections by categories
| sort connections desc
| limit 20
Figure 11: CloudWatch Logs Insights query results showing the most accessed category combinations filtered to blocked traffic only

Figure 11: CloudWatch Logs Insights query results showing the most accessed category combinations filtered to blocked traffic only

Drill down into a specific category

This query uses a like filter to find all traffic where the aws_category field contains a specific category, regardless of what other categories the domain also belongs to. In this example, the query returns all domains your workloads have connected to that map to the Artificial Intelligence and Machine Learning category, broken down by domain and verdict. Replace the category name in the like filter to investigate any category.

fields @timestamp, event.tls.sni, event.aws_category, event.verdict.action, event.flow_id
| filter ispresent(event.aws_category) and event.aws_category like /Artificial Intelligence and Machine Learning/
| stats latest(event.tls.sni) as sni, latest(event.verdict.action) as verdict by event.flow_id
| stats count(*) as connections by sni, verdict
| sort connections desc
| limit 20
Figure 12: CloudWatch Logs Insights query results showing a drill down into the Artificial Intelligence and Machine Learning category with connections broken down by domain and verdict

Figure 12: CloudWatch Logs Insights query results showing a drill down into the Artificial Intelligence and Machine Learning category with connections broken down by domain and verdict

Bandwidth consumption by category

This query shows which category combinations consume the most egress bandwidth. It correlates flow logs (which contain byte counts) with alert logs (which contain category data) using the shared flow_id field. To run this query, select both your alert log group and your flow log group in CloudWatch Logs Insights.

fields @timestamp
| filter ispresent(event.netflow.bytes) or ispresent(event.aws_category)
| stats sum(event.netflow.bytes) as flowBytes, latest(event.aws_category) as categories by event.flow_id
| filter ispresent(categories) and categories != "[]"
| stats sum(flowBytes) as totalBytes by categories
| sort totalBytes desc
| limit 20
Figure 13: CloudWatch Logs Insights query results showing bandwidth consumption by category combination sorted by total bytes descending

Figure 13: CloudWatch Logs Insights query results showing bandwidth consumption by category combination sorted by total bytes descending

These queries help you identify which categories your workloads access by volume, surface blocked and allowed traffic patterns, and pinpoint where the bulk of your egress bandwidth is going.

Conclusion

In this post, you walked through how to set up URL and domain category filtering on AWS Network Firewall, from creating your first category rule using both the console rule builder and Suricata compatible rule strings, to managing exceptions for approved services and monitoring category traffic patterns with CloudWatch Logs Insights. With AWS-managed categories that stay current automatically, you can control access to broad classes of websites without maintaining individual domain lists, and the built-in aws_category log field gives you the visibility to track how your workloads interact with external services.

This feature is available in all AWS commercial regions where AWS Network Firewall is supported.

To learn more, visit the AWS Network Firewall product page and the feature documentation.

Lawton Pittenger

Lawton Pittenger

Lawton is a Worldwide Security Specialist Solutions Architect at AWS, based in New York City. He specializes in helping customers design and implement effective network security controls. At AWS, he works with customers at scale and collaborates closely with service teams to drive continuous improvement in security services based on customer needs and feedback. Outside of work, his interests include skateboarding, snowboarding, and spending time in nature.

Sofia Aluma

Sofia Aluma-Santos

Sofía is a Sr. Security Specialist leading Network Security Go-To-Market and strategy. She helps customers build scalable, secure, resilient networks.

Eric Fortenbery

Eric Fortenbery

Eric is an AWS Solutions Architect based in Atlanta, GA who helps EdTech customers architect secure, scalable platforms.

Mostafa Elkhouly

Mostafa Elkhouly

With over a decade of experience in networking technologies and security, I’m your go-to tech enthusiast! When I’m not jet-setting or tinkering with the latest gadgets, I thrive on empowering customers to harness the full potential of AWS services.

  •  

Welcoming the AWS Customer Incident Response Team

May 26, 2026: This post was originally published in July 2022. It has been updated to reflect current engagement options, new threat intelligence resources such as the Threat Technique Catalog for AWS (TTC), additional open-source tools, and the distinction between AWS CIRT support and the AWS Security Incident Response managed service.


Welcome back, or welcome for the first time. Either way, we’re glad you’re here. We’re the AWS Customer Incident Response Team (CIRT), and we want to share who we are and how we can help when it matters most.

The AWS CIRT is a specialized 24/7 global team within Amazon Web Services (AWS) that provides support to customers during active security events on the customer side of the AWS Shared Responsibility Model. Our team is made up of security engineers who respond to cloud security events and build the tools and resources we use to do it.

Important: If you’re experiencing an active security event in your AWS environment—such as unauthorized access, data exfiltration, or ransomware—open an AWS support case and request assistance.

To request assistance from AWS:

  1. Open a support case from the impacted AWS account through the AWS Support Center Console.
  2. Select the service most closely related to the security event (for example, Amazon Elastic Compute Cloud (Amazon EC2), AWS Identity and Access Management (IAM), Amazon Simple Storage Service (Amazon S3)).
  3. Mention that you have an urgent security incident in the case description.

Opening a support case from the affected account allows AWS to confirm account ownership and gives you a case number to track the engagement. If you have an account team (TAM, Account Manager, or Solutions Architect), you can also alert them to initiate an escalation.

If you’ve lost access to your account, you can still submit a request for assistance.

When the AWS CIRT supports you, we focus on investigating security events as they appear in AWS service logs and the AWS control plane. For our analysis, we draw on sources such as AWS CloudTrail, Amazon VPC Flow Logs, and Amazon GuardDuty findings. We assist with triage, analysis, and containment, alongside providing recommendations and best practices to help you avoid security events in the future.

The AWS CIRT works alongside AWS threat intelligence and security operations teams. During an engagement, we use current threat intelligence and AWS infrastructure knowledge to inform our analysis and recommendations.

For investigations that extend into host-level or application-level analysis—such as operating system forensics, memory analysis, or application code review—we recommend complementing our support with a specialized AWS Partner for digital forensics and incident response (DFIR) capabilities.

Figure 1 shows the two different sides of the shared responsibility model, in which AWS is responsible for security OF the cloud, while customers are responsible for security IN the cloud.

Figure 1: The customer and AWS Shared Responsibility Model

Figure 1: The customer and AWS Shared Responsibility Model

Threat intelligence: The Threat Technique Catalog for AWS

The AWS CIRT regularly encounters patterns that repeat across our engagements. The TTC started as an internal reference—a way for our team to track and share what we were seeing across engagements, so we weren’t solving the same problems in isolation. Over time, it became clear that the knowledge we were building for ourselves was exactly what customers needed to get ahead of the same threats. So, we made it public. When we see techniques repeating across customers, an effective way to help them is to document those techniques and make that knowledge available so they can act on it before they’re in the middle of an incident.

To that end, we developed the Threat Technique Catalog for AWS (TTC)—a publicly available catalog, based on MITRE ATT&CK Cloud Matrix, that documents threat actor tactics, techniques, and procedures (TTPs) specific to AWS as observed by the AWS CIRT. Each entry includes detection guidance and mitigations specific to AWS environments. You can filter for the AWS services in your account to focus on what’s most relevant to you.

Findings from the TTC also inform detection logic in AWS services like Amazon GuardDuty, helping customers strengthen automated protections in their environments.

Figure 2: The Threat Technique Catalog for AWS, based on MITRE ATT&CK Cloud Matrix

Figure 2: The Threat Technique Catalog for AWS, based on MITRE ATT&CK Cloud Matrix

Open source tools

We’ve open-sourced several tools based on patterns we see in engagements. These complement rather than replace your existing security tooling. For a comprehensive framework for building your incident response program, see the AWS Security Incident Response Guide.

The tools below started as internal solutions we built to solve problems we kept running into.

Workshops

We maintain five publicly available workshops, regularly updated to simulate current security events to help you learn tools and procedures that we use daily. The workshops cover unauthorized IAM credential use, ransomware on Amazon S3, cryptomining, SSRF on IMDSv1, and incident response preparedness tooling. All you need is an AWS account, an internet connection, and the desire to learn more about incident response in the AWS Cloud. These workshops are built using the same scenarios our team trains on internally—we wanted to make that accessible to everyone.

How to contact us

Any AWS customer can engage the AWS CIRT through an AWS support case, regardless of support plan level. For those customers who have an account team, you can start an escalation to the AWS CIRT with the account team. Customers with Enterprise Support or Unified Operations can also onboard to AWS Security Incident Response, a managed service for security event triage and response.

Thank you for reading. This post is where we share what we’re learning—security trends, new resources, and threat intelligence—so you can stay prepared. If you’ve worked with us and have thoughts on how we can do better, reach out through your AWS account team, the comments below, or aws-cirt@amazon.com.

Until next time: logs on, credentials rotated, and alerts reviewed.

We also recommend subscribing to AWS Security Bulletins for notifications about security events for AWS services. You can subscribe through RSS feed to stay informed.


Jason Hurst

Jason Hurst

Jason is a Security Engineer on the AWS Customer Incident Response Team (CIRT), specializing in network analysis and cloud security investigations. He is passionate about developing others, teaching part-time at a local technical college. Jason has three dogs that entertain him in his spare time.

Shannon Brazil

Shannon is a Security Engineer on the AWS Customer Incident Response Team (CIRT), specializing in digital forensics and cloud security investigations. Known in the community as 4n6lady, she is passionate about security education and mentoring the next generation of defenders.

  •  

Well-architected best practices for software supply chain security

There have been multiple notable supply chain attacks using the npm Registry since September: Shai-Hulud, Chalk/Debug, one abusing tea.xyz tokens, and recently axios. Thanks to community efforts involving the Amazon Inspector team, the Open Source Security Foundation, and others, the affected packages were quickly flagged, which reduced the impact of these incidents.

Supply chain attacks like Shai-Hulud exploit vulnerabilities on two fronts: compromised maintainer accounts that publish malicious packages, and consumer environments that download and execute those packages. The Shai-Hulud attack, shown in Figure 1, succeeded because maintainer credentials were compromised through phishing, enabling threat actors to publish malicious versions of popular packages. Incidents like these highlight the need for strong security practices within the software supply chain, and effective defense requires addressing both sides. Package maintainers need protections that prevent account compromise and limit sprawl when credentials are stolen. Package consumers need layered defenses that detect malicious packages, prevent their deployment, and limit damage when compromise occurs.

In this post, we explore best practices for package consumers. These practices are aligned with the AWS Well-Architected Framework – Security Pillar and you can use them to reduce exposure to similar threats and limit their impact if they occur.

Figure 1: Architecture diagram showing Shai-Hulud attack flow

Figure 1: Architecture diagram showing Shai-Hulud attack flow

Use temporary credentials and grant least privilege

When Shai-Hulud executed in developer environments and continuous integration and delivery (CI/CD) pipelines, it scanned for secrets such as npm tokens, GitHub tokens, and AWS Identity and Access Management (IAM) access keys. Long-term credentials exposed in this way enabled threat actors to propagate the malware further and access cloud resources. Recent incidents have shown organizations discovering multiple leaked IAM credential pairs, with concerns about additional exposed credentials and potential compromise of CI/CD pipelines.

Removing long-lived credentials from your developer environments and CI/CD pipelines reduces the scope of exposure in the event a system is compromised. For developers working locally, the new AWS CLI login command (aws login) simplifies the process of acquiring short-lived CLI credentials and removes the need to store long-lived credentials in configuration files. AWS IAM Identity Center also provides a straightforward way to acquire temporary credentials that expire automatically. For CI/CD pipelines, OpenID Connect (OIDC) federation with GitHub Actions, GitLab CI, or other platforms provide temporary credentials for each job without storing long-lived tokens. IAM can also federate AWS Identities to external services, allowing your AWS workloads to securely access external services without using long-term credentials. Temporary credentials expire automatically, limiting the window of exposure if a pipeline is compromised.

If you’re interacting with a third-party service that doesn’t support temporary credentials, consider storing the credentials to centralized storage using AWS Secrets Manager. Limit access to these secrets, require the use of temporary credentials, and apply automatic rotation and audit logging to reduce the risk of exposure of these credentials.

To reduce risk from credential exposure:

In the event of a security incident where credentials might be exposed, immediately rotate all long-term credentials to limit the scope of impact. Use Amazon GuardDuty and AWS CloudTrail to detect abnormal IAM activity and identify which credentials might have been compromised.

Implement defense in depth

Even with temporary credentials and least privilege, a single compromised account can enable threat actors to publish malicious packages or access sensitive resources. Defense in depth creates multiple layers of protection that work together to prevent sprawl after initial compromise. While adding approval workflows to every operation would dramatically decrease deployment speed, implementing them strategically for sensitive workloads provides balanced security.

The key principle is to ensure that if one credential or account is compromised, additional controls prevent that compromise from spreading across your organization. This includes multi-factor authentication (MFA) for access combined with different IAM roles for sensitive workloads. For single-developer open source projects, MFA becomes even more critical because there’s no separation of duties through multiple maintainers.

For package maintainers working in team environments, requiring multiple approvers to release packages to production creates separation of duties. However, developers can still trigger merge requests that initiate deployment pipelines, so multi-party approval should be implemented within the pipeline itself for sensitive deployments. This ensures that even if a developer’s credentials are compromised and they trigger a deployment, the pipeline requires additional approval before releasing to production.

For package consumers, multi-approval workflows in deployment pipelines help ensure that if a malicious package passes initial scanning, human review can catch suspicious changes before production deployment. Artifact signing provides a complementary cryptographic layer that works alongside these process controls.

The Shai-Hulud attack succeeded because compromised maintainer credentials allowed threat actors to publish malicious packages directly to the public npm registry. For package consumers, the defense is ensuring that packages pulled from public registries cannot reach production without verification. Artifact signing is one concrete implementation of this layered approach. By cryptographically binding a package or container image to the identity that produced it, signing creates a verification layer that is independent of the credential used to trigger the build—meaning a compromised developer credential alone isn’t sufficient to introduce an unverified artifact into your deployment pipeline.

Artifact signing as part of defense in depth

AWS Signer provides cryptographic signing for packages, creating an additional verification layer within your defense in depth strategy. The signing authorization model separates concerns: developer credentials shouldn’t have signing permissions. Only CI/CD pipeline roles should have signing permissions through the signer:StartSigningJob API. Signer uses FIPS 140-3 Level 3 validated hardware security modules (HSMs) to store signing keys, providing strong cryptographic protection.

The container image signing workflow, shown in Figure 2, demonstrates how signing integrates seamlessly into existing processes:

Figure 2: Diagram showing Signer signing workflow

Figure 2: Diagram showing Signer signing workflow

The benefits of Signer compared to building custom signing infrastructure include:

  • Fully managed: No need to build custom signing infrastructure or manage certificate lifecycle
  • Automated: Amazon ECR managed signing happens automatically on image push without manual steps
  • Centralized governance: Single signing profile can be used across multiple accounts and pipelines
  • Native integration: Built-in integration with Notation and Kyverno for signature verification in Amazon EKS
  • FIPS 140-3 Level 3 compliance: Meets stringent regulatory requirements for cryptographic operations

Audit logging for all signing operations enables detection of unusual patterns such as signing from new IP addresses, unusual times, or rapid succession of signing jobs. For every credential in your system, consider who can access what, how they prove their identity, and what second layer prevents sprawl if that credential is compromised. Artifact signing, combined with centralized storage and Software Bills of Materials (SBOMs), provides layered protection against tampering and malicious packages.

Centralize dependency management

By centralizing package and dependency management, you can validate and approve dependencies before they’re used in applications and quickly audit dependencies in the event of a supply chain security incident. Recent incidents have shown organizations discovering compromised npm packages in their internal artifact repositories, requiring rapid assessment of which applications might be affected.

On AWS, you can use AWS CodeArtifact to host and manage your organization’s software packages. You can use the package group configuration to define an approved list of upstream sources and block access to all others—a direct control against typosquatting attacks, where malicious packages are published under names that closely resemble legitimate ones. Rather than relying on developers to identify suspicious package names at install time, package group configuration enforces the boundary at the repository level. Centralization also helps you pin versions of dependencies to prevent automatic updates from pulling in malicious versions and quickly remove compromised dependencies across your software portfolio when an incident occurs.

For container images, Amazon ECR provides centralized image storage with AWS Key Management Service (AWS KMS) encryption and lifecycle policies. Combine Amazon ECR with Amazon Inspector scanning to continuously validate image integrity.

For additional guidance see SEC11-BP05: Centralize services for packages and dependencies.

npm provenance attestation

For npm packages specifically, provenance attestations provide a complementary control on the consumer side. Available since npm 9.5, npm provenance links a published package to the specific source repository and CI/CD workflow that produced it, using Sigstore as the underlying signing infrastructure. When a package is installed, the npm CLI can verify that the published artifact matches the attested build provenance—providing confidence that the package wasn’t tampered with between build and publication. For organizations consuming open source npm packages, checking for provenance attestations before adding a new dependency is a low-friction signal of supply chain integrity. Package maintainers publishing to npm can enable provenance by running npm publish with the –provenance flag from a supported CI/CD environment such as GitHub Actions.

For additional guidance see SEC11-BP06: Deploy software programatically and, from the DevOps Lens of the AWS Well-Architected Framework, DL.CS.2: Sign code artifacts after each build

Scan dependencies throughout the software development lifecycle

AWS provides services to help you scan dependencies continuously, from development through deployment:

  • In development: Kiro can perform software composition analysis during code reviews to identify vulnerable third-party code.
  • In code repositories and pipelines: Amazon Inspector scans first-party code, third-party dependencies, and Infrastructure as Code for vulnerabilities.
  • For container images: Amazon Inspector provides continuous vulnerability scanning of Amazon ECR images. Amazon Inspector can also be integrated directly into CI/CD pipelines to scan images before they are pushed to Amazon ECR or deployed, helping you block compromised dependencies earlier in the release cycle.

Traditional vulnerability scanners focus on known CVEs—publicly disclosed vulnerabilities with assigned identifiers. Supply chain attacks like Shai-Hulud involve malicious packages that function as zero-days: they’re intentionally crafted by threat actors and actively exploited before a CVE is assigned. Traditional vulnerability scanners that rely on CVE databases won’t detect these packages until they’ve been formally identified and catalogued, which can take days or weeks.

Detecting these requires behavioral analysis at scale and community collaboration, not just static signature matching. The operational scale of AWS—with threat intelligence from sources like MadPot and incident response data across millions of customers—enables detection of suspicious package behavior across multiple environments simultaneously. When a newly published package exhibits credential-harvesting behavior in multiple customer accounts within hours of publication, that cross-account signal enables rapid identification. These findings are contributed to community-maintained databases like the OpenSSF Malicious Packages Repository (github.com/ossf/malicious-packages), which assigns a formal identifier (MAL-ID) and shares it across the security community. For the tea.xyz token farming campaign, the average time from submission to formal identification was approximately 30 minutes. AWS services like Amazon Inspector participate in this community loop, contributing findings and ingesting newly assigned MAL-IDs to surface threats in your environment.

A related threat model worth understanding is the sleeper package: a package that appears benign at publication and activates malicious behavior only after a delay or trigger condition. Static analysis alone is insufficient to catch these packages because the malicious payload isn’t present or active at install time. Amazon Inspector behavioral analysis is specifically designed to detect this class of threat, complementing static vulnerability scanning.

Software Bills of Materials (SBOMs) in SPDX or CycloneDX format enable you to quickly assess exposure during incidents. When responding to supply chain incidents, use SBOMs to identify which applications contain compromised packages, prioritize remediation, and assess blast radius. In the Shai-Hulud incident, the compromised packages (MAL-2025-46974 and CVE-2025-59144) were identified early, providing actionable findings that customers could remediate quickly. Organizations that had scanning enabled but experienced alert fatigue may have missed critical alerts, highlighting the importance of proper alert routing and prioritization.

Figure 3: Screenshot of Amazon Inspector console showing malicious package findings

Figure 3: Screenshot of Amazon Inspector console showing malicious package findings

For additional guidance see SEC11-BP02: Automate testing throughout the development and release lifecycle.

Configure logging and monitoring

Visibility into activity is essential to detect anomalous behavior early. Configure logging and centralize those logs for analysis:

  • Enable application and service logging
  • Centralize and monitor logs across accounts
  • Use GuardDuty to continuously monitor for malicious activity and anomalous API calls
  • Aggregate findings with AWS Security Hub and enforce configuration best practices with AWS Config

CloudTrail logging provides audit trails for credential access and API activity. When responding to supply chain incidents, review CloudTrail logs for specific events that indicate credential compromise or malicious activity: sts:AssumeRole calls from unexpected IP addresses or regions, secretsmanager:GetSecretValue or ssm:GetParameter calls from unfamiliar sources, ecr:PutImage from developer workstations bypassing CI/CD pipelines, lambda:UpdateFunctionCode outside normal deployment windows, iam:CreateAccessKey followed by immediate API activity, and codecommit:GitPush or codebuild:StartBuild from unusual IP addresses. When combined with Amazon EventBridge rules, you can trigger automated responses when Amazon Inspector detects malicious packages or when these unusual credential access patterns occur.

Organizations affected by recent supply chain attacks have used CloudTrail analysis to determine the scope of credential exposure and identify which resources might have been accessed by compromised credentials. This forensic capability is essential for understanding blast radius and ensuring complete remediation.

For additional guidance see the best practices in SEC04: Detection.

These components of a defense in depth strategy work together to prevent sprawl after initial compromise and help you to detect and respond to the event. Figure 4. shows how these fit together.

Figure 4: Architecture diagram showing defense architecture

Figure 4: Architecture diagram showing defense architecture

Additional best practices

The Security pillar of the Well-Architected Framework also provides organizational best practices that are applicable to improving security processes across all dimensions of your organization. Relevant best practices include SEC11-BP01: Train for application security; SEC11-BP08: Build a program that embeds security ownership in workload teams; and SEC10: Incident Response.

Conclusion

Recent incidents including Shai-Hulud, Chalk/Debug, and tea.xyz reflect ongoing efforts by threat actors to target the the package registries, CI/CD pipelines, and developer credentials for increased attack surface and propagation. A single compromised maintainer account or malicious package can propagate across thousands of consumer environments simultaneously. The controls described in this post are designed with that threat model in mind. Temporary credentials limit the value of stolen tokens, centralized dependency management and upstream blocking reduce the attack surface at the registry level, artifact signing ensures that even if a build pipeline is compromised, unsigned artifacts cannot reach production, and dependency scanning throughout your software lifecycle helps you identify compromised packages early, before they can impact you. Each layer narrows the window of opportunity for a threat actor.

Learn more

See the following blogs and workshops to dive deeper on this topic:

If you have feedback about this post, submit comments in the Comments section below.

Trevor Schiavone

Trevor Schiavone

Trevor is a Senior Solutions Architect with a background in application development and architecture. He brings a builder’s perspective to helping customers design secure, scalable, and innovative solutions on AWS. He is also an active part of the AWS security community with a focus on application security and identity.

Desiree Brunner

Desiree Brunner

Desiree is a Security Specialist Solutions Architect working with regulated customers as part of the AWS EMEA Security & Compliance team. She builds on her background in DevOps and platform engineering to support her customers in designing secure, compliant cloud environments. Passionate about mental health and knowledge sharing, she regularly speaks at AWS events and supports teams on their cloud security journey.

  •  

RemotePE: The Lazarus RAT that lives in memory

Authors: Yun Zheng Hu and Mick Koomen

Summary

Last year, we published research1 about a North Korean Lazarus subgroup targeting financial and cryptocurrency organizations, encountered during multiple incident response engagements. This Lazarus subgroup overlaps with activity linked to AppleJeus2, Citrine Sleet3, UNC47364, and Gleaming Pisces5. In one investigation, we observed that the actor had replaced ThemeForestRAT and PondRAT with a more sophisticated memory-only toolset. This follow-up post covers all three malware families from that toolset: DPAPILoader, RemotePELoader and RemotePE.

The three form a chain. DPAPILoader decrypts and loads RemotePELoader from disk using the Windows Data Protection API (DPAPI). RemotePELoader beacons to a C2 server and waits until it receives the next stage: RemotePE, a RAT executed entirely in memory and never written to disk, leaving no filesystem artifacts. At the time of writing, we have not found samples of RemotePELoader or RemotePE on VirusTotal.

The toolset’s environmental keying, memory-only execution, EDR evasion, and low forensic footprint suggest it is purpose-built for long-term observation campaigns. This allows the actor to quietly maintain access over an extended period before moving to a high-impact final objective such as data theft or a large-scale financial heist, consistent with this actor’s known history.
We are sharing samples with detection rules and indicators of compromise (IOCs) to help defenders identify and respond to this toolset in their environments.

Figure 1: The three-stage chain: DPAPILoader decrypts and loads RemotePELoader from disk, which retrieves and executes RemotePE in memory

DPAPILoader: First-stage, environmentally keyed loader

DPAPILoader is implemented as a DLL whose purpose is to decrypt and load an encrypted payload from disk using DPAPI. In the incident response case, it was found as C:\Windows\System32\Iassvc.dll, installed under the service name “Internet Authentication Service.” This service runs Iassvc.dll automatically on system startup, providing persistence for the toolset. The filename and service name are chosen to mimic the legitimate Windows Server Internet Authentication Service (IAS) and its accompanying DLL C:\Windows\System32\iassvcs.dll (note the extra ‘s’ in the filename).

In Listing 1, we list a Windows service record, extracted from the forensic image using Dissect6, that shows the masquerading in detail.

          name (string) = Ias
   displayname (string) = Internet Authentication Service
   description (string) = Internet Authentication Service (IAS) is a component of Windows Server operating systems that provides centralized user authentication, authorization and accounting.
      servicedll (path) = %SystemRoot%\system32\Iassvc.dll
       imagepath (path) = %systemroot%\system32\svchost.exe
imagepath_args (string) = -k netsvcs -p
    objectname (string) = LocalSystem
         start (string) = Auto Start (2)
          type (string) = Service - Own Process (0x10)
  errorcontrol (string) = Normal (1)

Listing 1: Service record from Dissect showing Windows service that runs DPAPILoader

The sample from our investigation first checks whether it is running under C:\Windows\System32\Svchost.exe. It then loops over all files matching the wildcard path C:\ProgramData\Microsoft\Windows\DeviceMetadataStore\en-US*.*. This directory normally contains Microsoft Cabinet files used for device metadata packages. DPAPILoader skips any file beginning with the Cabinet magic bytes (MSCF / 4D 53 43 46), filtering out legitimate metadata packages. Any file that passes this check and is larger than 51200 bytes (50 KiB) is decrypted using DPAPI and loaded into memory using libpeconv7 , an open-source reflective PE loading library.

Across the DPAPILoader samples we observed, the loading mechanism and host process differ, as documented in the Observed Samples section, but the core behaviour is consistent.

DPAPI Encryption

DPAPILoader uses the Windows Data Protection API (DPAPI) to decrypt its payload. DPAPI ties cryptographic keys to a specific user account, with key management handled entirely by the OS. The caller only invokes encrypt and decrypt functions.

This offers the actor two advantages. First, the encrypted payload on disk is never in plaintext: if a sample is uploaded to VirusTotal, it is useless without the victim’s DPAPI keys. Static analysis is effectively impossible without them. Second, each deployment produces a unique encrypted blob, meaning the payload hash differs across victims and evades hash-based detection. The only prerequisite is prior access to the target machine to encrypt and drop the payload, something the actor has at this stage of the intrusion.

After DPAPI decryption, the payload is additionally XORed with 0x8D before loading. This is consistent across all observed DPAPILoader samples. This approach is an instance of environmental keying8, where malware is bound to a specific victim environment and cannot be analysed or executed elsewhere.

Observed Samples

We identified three DPAPILoader samples spanning roughly nine months, with differences in loading mechanism, host process, and payload storage.

The first sample (Iassvc.dll) is loaded as a Windows service via Svchost.exe, the second (sspicli.dll) is sideloaded by ESET’s edp.exe, and the third (wmiclnt.dll) uses the WmiOpenBlock export with no identified host process.

PE timestampDLL nameExportString obfuscation
2023-11-14Iassvc.dllServiceMainXOR 0x8D
2024-02-21sspicli.dllInitSecurityInterfaceWXOR 0x8D
2024-08-21wmiclnt.dllWmiOpenBlockDPAPI + XOR 0x8D
Table 1: Observed DPAPILoader samples by PE timestamp

The first two samples load the DPAPI-encrypted payload from the DeviceMetadataStore path. The third embeds the encrypted payload directly in the DLL, removing the dependency on a separate file on disk.

The second and third samples were found on VirusTotal. Without the victims’ DPAPI keys, we are unable to decrypt them. Both are a practical demonstration of the environmental keying discussed earlier.

The first sample comes from our incident response case, where a full forensic image of the compromised machine gave us access to the victim’s DPAPI keys, allowing us to trivially decrypt the payload using a Dissect9 shell:

Figure 2: Decrypting the DPAPI-encrypted PE payload using Dissect

It turns out the decrypted payload is another loader, which we named RemotePELoader.

RemotePELoader: Second-stage, operator-controlled loader

RemotePELoader is decrypted from the DPAPI payload on disk and is responsible for retrieving the core module from a C2 server and loading it into memory. Both the loader and the core module share a configuration file stored on disk, and are designed to work as a pair, deployed together as part of the same installation. Upon execution, RemotePELoader spawns a thread that first applies evasion techniques, reads the configuration, and then enters a C2 polling loop. It has no RAT functionality of its own; its sole purpose is to load the next stage.

HellsGate & EDR Evasion

RemotePELoader applies two evasion techniques before performing any further actions. The first is HellsGate10 (specifically the TartarusGate11 variant), a technique that dynamically resolves Windows syscall numbers at runtime. It scans the loaded ntdll.dll for syscall stubs to obtain the numbers for NtOpenSection, NtMapViewOfSection, NtUnmapViewOfSection, NtProtectVirtualMemory, and NtClose. Using these direct syscalls, RemotePELoader iterates the Process Environment Block’s module list and remaps each DLL from its \KnownDlls section object, a kernel-maintained mapping of trusted system DLLs, replacing any hooked in-memory copies with clean ones and effectively unhooking all userland security product hooks.

The second is patching Event Tracing for Windows (ETW), a Windows mechanism used by security products to monitor process behaviour at runtime. RemotePELoader patches function EtwEventWrite() in the current process using a well-known technique, overwriting it with the following bytes.

48 33 c0          ; XOR    RAX, RAX
c3                ; RET

Listing 2: Bytes written to EtwEventWrite to disable ETW event generation

This causes EtwEventWrite to immediately return 0, suppressing all ETW event generation and preventing security tooling that relies on ETW telemetry from receiving events.

Together, these two techniques hinder detection by endpoint security products that rely on userland API hooking or ETW telemetry.

Configuration

After applying evasion techniques, RemotePELoader reads a configuration file using the same wildcard search as DPAPILoader:

\??\C:\ProgramData\Microsoft\Windows\DeviceMetadataStore\en-US*.*

The configuration file is smaller than the encrypted RemotePELoader payload, so it identifies it by looking for a file that does not begin with Cabinet magic bytes and is smaller than 20480 bytes (20 KiB). When found, it decrypts the contents using DPAPI and XORs all bytes with 0x8D.

Figure 3: Decrypting the DPAPI-encrypted config using Dissect

The configuration file structure is depicted in Listing 3.

struct RemotePEC2Config 	// sizeof=0xb38
{
  int dwReconnectMinutes;	// minutes to wait after C2 session ends
  int dwSleepUntilEpoch;    // UNIX epoch wake-up timestamp
  int dwSleepMin;		    // minimum sleep time between C2 polls
  int dwSleepMax;           // maximum sleep time between C2 polls
  wchar_t wsC2Url_1[260];   // C2 URL (up to three)
  wchar_t wsC2Url_2[260];
  wchar_t wsC2Url_3[260];
  wchar_t wsProxy[260];     // optional proxy address
  char sProxyUserName[128]; // optional proxy username
  char sProxyPassword[128]; // optional proxy password
  wchar_t wsUserAgent[260]; // configurable HTTP user-agent string
};

Listing 3: RemotePE C2 configuration structure on disk

Since both RemotePELoader and the configuration file reside in the same directory, a size check is used to distinguish between them, without it, the configuration file could be mistakenly loaded as a PE, or the PE read as a configuration file. This shared logic, combined with the identical cryptographic scheme, further ties the two loaders together as a coordinated toolset.

C2 Communication

After reading the configuration, RemotePELoader enters a loop until it receives a PE payload from the server. On the first run it sleeps until the configured wake-up timestamp and on subsequent iterations it sleeps for a random interval within the configured bounds. It then finds an active C2 server via a check-in request and keeps polling for a PE payload. If no payload is returned, it restarts the loop. Once a payload is received, it sends a confirmation request to the active C2, loads the retrieved PE payload using libpeconv, and exits the thread.

RemotePELoader communicates with the C2 server over HTTP, using POST requests. Host information is passed via the HTTP Cookie header, with a check-in request identified by the presence of at_check=true. The server responds with a JSON object where the odata.metadata key contains the C2 session ID. Once a session ID is obtained, subsequent requests replace the at_check cookie with ai_session, set to the session ID received from the server. The table below documents each cookie field used in the check-in request.

Cookie nameCookie value description
MSCCRandom buffer with regex [0-9a-z]{24} prepended to the string “-c1=2-c2=2-c3=2”
MicrosoftApplicationsTelemetryDeviceIdBot ID
MSFPCRandom numbers with format string “%08lx%08lx%08lx%08lx”
HASHRandom number with format string “%04x”
LVCurrent year and month in YYYYMM format
VConstant number
LUEpoch of current time
MS0Random numbers with format string “%08lx%08lx%08lx%08lx”, likely to indicate RemotePELoader request
at_checkIndicates a check-in request (no session yet)
ai_sessionSession ID from C2 after initial check-in
Table 2: RemotePELoader check-in request Cookie fields

Once a C2 session is established, RemotePELoader polls the server at random intervals between the configured minimum and maximum sleep times. In our tests, the server did not immediately return a payload, suggesting an actor-in-the-loop model where the operator manually decides when to deliver it. When the operator delivers the payload, the server returns a JSON object where the odata.metadata key contains the PE payload, AES-GCM encrypted and Base64-encoded.

Figure 4: RemotePELoader C2 session showing the server returning the encrypted PE payload

All messages exchanged with the C2 server are AES-encrypted, except for the initial check-in response containing the session ID. The AES key and nonce for each message are derived using SplitMix64, seeded with a random value generated by a Mersenne Twister PRNG. Each message is structured as follows, with the seed prepended to the AES-GCM tag and ciphertext:

struct C2Message {
    uint64_t aes_seed;          // SplitMix64 seed for AES key and nonce
    unsigned char aes_tag[16];  // AES authentication tag
    unsigned char ciphertext[]; // AES-GCM encrypted data
};

Listing 4: C2 message structure used by RemotePELoader and RemotePE

The decrypted payload is RemotePE, a fully-fledged RAT that runs entirely in memory, covered in the next section.

RemotePE: Final-stage, in-memory RAT

RemotePE is a fully-fledged RAT that we retrieved directly from a RemotePELoader C2 server by emulating its C2 protocol.

Written in C++ using object-oriented programming, RemotePE is a multithreaded program that appears to share a codebase with RemotePELoader. Both components share the same on-disk configuration file, this is by design: if an operator updates the configuration and the host reboots, both components need to read the same updated values to maintain access. Furthermore, C2 logic, including session handling, AES-GCM encryption, and the C2Message structure are equal. Also, in the samples from our investigation, RemotePELoader and RemotePE each verify they were loaded by the previous stage by checking that lpReserved == 0x1000 in DllMain, enforcing the integrity of the chain.

Control flow

RemotePE starts two threads at startup. The first, IChannelController, handles C2 communication. The second, IMiddleController, processes commands received from the C2 server. When the C2 server ends the current session, both threads stop and RemotePE either exits or sleeps until the configured wake-up time.

The IChannelController thread first locates an active C2 server and then polls it for commands. Between each polling iteration, the thread sleeps for a configured random interval, or wakes immediately if command output is available. In that case, the output is sent back to the C2 server without waiting for the next polling interval, allowing the operator to issue the next command promptly. Received commands are pushed to a queue consumed by IMiddleController.
The IMiddleController thread processes commands from the queue and pushes output back to a queue read by IChannelController. Each C2 message from the server consists of a list of entries delimited by $, where each entry is a bundle of commands (see the C2 Protocol section). Commands can optionally be executed in a separate thread, and all output is merged into a single reply sent back to the server.

While sleeping, RemotePE also checks for the existence of a Windows event named 554D5C1F-AABE-49E4-AB57-994D22ECED28. If present, it wakes immediately and restarts both controller threads. Neither RemotePE nor the loaders create this event, implying it is created externally as an out-of-band mechanism to wake RemotePE on demand.

Commands

RemotePE supports six categories of commands, identified by their C++ runtime type information (RTTI) class names. The table below lists each class along with the functionality it exposes. An operator invokes a function by specifying its class ID and function ID, along with any required parameters.

Table 3: RemotePE commands with their RTTI class names
Internal class name Class ID Function ID Description
IConfigProfile 0 0 Get the current C2 configuration
1 Set the C2 configuration
IConsole 1 0 Get the current working directory
1 Change the current working directory
2 Execute a command and return its output
3 Get loaded modules (DLLs)
4 Register a new module (DLL)
5 Invoke a registered module’s function pointer with arguments
6 Unload a module (DLL)
IFileExplorer 2 0 Get information on the drives of the system
1 List the files in a directory
2 Delete a file
3 Rename a file
4 Read from a file
5 Write to a file
6 ZIP a file or directory and return it as data
IProcess 3 0 Get process listing
1 Kill process by ID
2 Search for a file in the directories of a given environment variable
3 Create a process
4 Create a process as a user
ITimer 4 0 Sleep for X minutes, non-persistent
1 Sleep for X minutes, and persist this also in the C2 configuration on disk
2 Exit RemotePE
IPing 5 N/a A no-op command

Most commands provide standard RAT functionality. One notable exception is the file deletion command, which overwrites each file with constant bytes seven times before renaming and deleting it, a secure deletion pattern consistent with PondRAT and POOLRAT, two malware families previously associated with this actor. Unlike some implementations that overwrite with random bytes, RemotePE uses constant bytes, though the multi-pass overwrite and rename pattern is shared.

RemotePE also implements a plugin system that allows the operator to dynamically register DLL payloads at runtime. These payloads must be valid both as a Windows DLL and as reflective shellcode, with the DLL entry point re-executed to unload them: a dual-format requirement and unload behaviour that matches pe_to_shellcode12 , which refers to such payloads as “shellcodified DLLs”. RemotePE can hold multiple plugins simultaneously, which the operator can invoke via the IConsole commands described above.

C2 Protocol

Similar to RemotePELoader, the IChannelController thread begins by locating an active C2 server via a check-in request, then polls it in a loop. The request format is largely identical to that of RemotePELoader, with one exception: RemotePE uses the MUID cookie instead of MS0, which the C2 server likely uses to differentiate between the two families. Session handling is identical to RemotePELoader. For a full description of cookie fields, see the RemotePELoader C2 Communication section.

Though RemotePE communicates with the same C2 server as RemotePELoader, the protocol diverges after the initial check-in. The outer message structure is identical to RemotePELoader’s C2Message (seed, AES-GCM tag, and ciphertext). The decrypted ciphertext, however, contains a RemotePE-specific structure, see Listing 5.

struct C2Command {
    uint32_t payload_size;
    uint16_t class_id;    	 // class ID from the commands table
    uint16_t function_id; 	 // function ID from the commands table
    uint32_t request_id;  	 // used to match responses
    unsigned char payload[]; // variable length, payload_size bytes
};

struct C2CommandBatch {
    uint16_t command_count;
    C2Command commands[];	 // variable length, command_count entries
};

Listing 5: RemotePE C2 command structures

Command responses sent back to the server use the structures defined in Listing 6.

struct C2CommandResponse {
    uint32_t response_size;
    uint32_t error;	   	      // error code, if any
    uint32_t request_id;  	  // used to respond to a C2Command request
    unsigned char payload[];  // variable length, compressed, response_size bytes
};

struct C2CommandResponseBatch {
    uint16_t command_count;
    C2CommandResponse commands[];	 // variable length, command_count entries
};

Listing 6: RemotePE command output structures

When IChannelController receives a C2CommandBatch, it decrypts it and pushes the commands to the queue consumed by IMiddleController, as described in the Control Flow section. Command output is compressed using MSZIP via the Windows Cabinet compression API (cabinet.dll).

Figure 5: RemotePE command parsing

Figure 5 shows the C2 server command parsing of the IMiddleController thread. At first, command batches can be delimited by the “$”, where each command of a batch is traversed. After running the commands, all command outputs that were not run as a separate thread are merged into a C2 reply that is sent back to the server.

Command output is compressed, and the whole C2CommandResponseBatch structure is AES-GCM encrypted and Base64-encoded, before being sent back to the C2 server in the armAuthorization JSON key. An example of this is shown in Figure 6. The JSON keys and HTTP cookie names used within the C2 protocol, e.g., armAuthorization, odata.metadata, and MSFPC are also used within the Microsoft ecosystem.

Figure 6: RemotePE returning command output to the C2 server via the armAuthorization JSON key

A example Python script to decrypt C2 command responses can be found here:

Figure 7: Example of a decrypted C2 command response

Retrieved Samples

We obtained four RemotePE samples: three retrieved from active C2 servers and one recovered through forensic analysis. The C2 servers were identified during the incident response engagement or through fingerprinting. Ordering the samples by PE compile timestamp reveals incremental changes across versions, primarily in the config loading mechanism and bot identification method, suggesting active development between mid-2023 and mid-2024.

PE timestampConfig loadingBot ID
2023-07-04Find DPAPI encrypted config on diskSOFTWARE\Microsoft\SQMClient\MachineId
2023-10-17C2 URLs passed via lpThreadParameter, fixed User-AgentSOFTWARE\Microsoft\SQMClient\MachineId
2024-04-18Find DPAPI encrypted config on diskSOFTWARE\Microsoft\SQMClient\MachineId
2024-05-11DPAPI config path passed via lpThreadParameterSoftware\Microsoft\Cryptography\MachineGuid
Table 4: Observed RemotePE samples by PE timestamp

The 2023-10-17 sample does not use DPAPI and instead receives its C2 urls directly via lpThreadParameter, parsed using CommandLineToArgvW. Unlike the other samples, it also performs HellsGate syscall resolution and ETW patching itself, rather than relying on RemotePELoader to do so. This suggests that early versions of RemotePE were more standalone and not exclusively tied to the DPAPILoader/RemotePELoader chain, capable of being deployed by any loader passing the configuration as a thread parameter.

The table below shows the time between our initial check-in and RemotePE payload delivery across six successful retrieval sessions, along with the payload delivery time converted to Korea Standard Time (KST, UTC+9).

C2 session started (UTC)Payload returned (UTC)DeltaPayload returned (KST,UTC+9)
2024-02-07 00:212024-02-07 01:0948 min2024-02-07 10:09
2024-12-09 08:482024-12-09 09:0820 min2024-12-09 18:08
2024-12-10 23:572024-12-11 00:4649 min2024-12-11 09:46
2025-01-10 08:212025-01-10 08:210 min2025-01-10 17:21
2025-02-10 21:562025-02-10 23:0367 min2025-02-11 08:03
2025-07-09 11:572025-07-10 07:5020 hrs2025-07-10 16:50
Table 5: RemotePELoader C2 session and RemotePE payload delivery timestamps

Many other sessions yielded no payload. All six successful payload deliveries fall within daytime hours in the UTC+9 timezone (08:00–19:00 KST), as shown in Table 5.

Infrastructure

The RemotePE C2 infrastructure is hosted on Namecheap shared hosting, consistent with what we observed in earlier campaigns involving ThemeForestRAT and PondRAT. As with those campaigns, the use of shared hosting makes IP-based blocking ineffective, since the same server hosts legitimate domains.

Through fingerprinting of C2 server characteristics, we identified additional domains and servers beyond those found during the incident response engagement. These are listed in the IOCs section.

At the time of writing, several C2 servers we identified never returned a payload during our emulated sessions, though some remain live. Others that had previously delivered RemotePE appear to no longer do so. Whether this reflects the infrastructure going dormant, being abandoned, a change in C2 protocol, or the actor detecting unexpected connections is unclear.

Conclusion

The DPAPILoader, RemotePELoader, and RemotePE toolset represents a deliberate effort to minimise forensic footprint. A RemotePELoader sample from disk uploaded to VirusTotal is useless without the victim’s DPAPI keys. Furthermore, by combining environmental keying via DPAPI with fully in-memory execution of the final payload, the actor ensures that forensic imaging of the disk will not yield recoverable artifacts of RemotePE.

The actor-in-the-loop delivery model and the toolset’s low detection rate (neither RemotePELoader nor RemotePE appeared on VirusTotal prior to this publication) suggest this toolset may be reserved for high-value targets where long-term, stealthy access is the objective, consistent with this Lazarus subgroup’s known focus on financial and cryptocurrency organisations.

Defenders should focus on host-based detection. The most reliable indicators are DPAPI-encrypted blobs in unexpected directories, in our case this was the DeviceMetadataStore directory, though this can vary. Another indicator is to look for suspicious DLLs masquerading as legitimate Windows services or sideloaded DLLs.

For network-based detection, SNI fields and DNS queries for known C2 domains are the most actionable opportunities. Pivoting on Namecheap shared hosting infrastructure also proved effective in identifying additional malicious C2 servers during our investigation. Organisations with TLS inspection can detect the characteristic cookie fields and JSON keys, though care should be taken to avoid false positives given the traffic’s close resemblance to legitimate Microsoft traffic.

We are sharing the samples, including decrypted versions that would otherwise remain inaccessible due to environmental keying, both for preservation and to help defenders detect and respond to this toolset. YARA rules and IOCs are provided below.

Indicators of Compromise

If you have any questions or need assistance based on these findings, please contact Fox-IT CERT at cert@fox-it.com. For urgent matters, call 0800-FOXCERT (0800-3692378) within the Netherlands, or +31152847999 internationally to reach one of our incident responders.

Domains

DomainFirst seenLast seen
livedrivefiles[.].com2023-07-172025-07-27
aes-secure[.]net2023-09-18*
azureglobalaccelerator[.]com2023-09-18*
msdeliverycontent[.]com2024-02-192026-05-09
akamaicloud[.]com2024-02-192025-02-14
intelcloudinsights[.]com2024-04-132026-04-23
devicelinkintel[.]com2024-08-16*
Table 6: RemotePE(Loader) C2 domains. Entries marked with * in the “Last seen” column were still active at the time of writing.

Host based indicators

TypeIndicatorComment
file.nameIassvc.dllFilename used for DPAPILoader
event.name554D5C1F-AABE-49E4-AB57-994D22ECED28RemotePE specific event name
Table 7: RemotePE host-based indicators

Samples

digest.sha256Comment
4f6ae0110cf652264293df571d66955f7109e3424a070423b5e50edc3eb43874DPAPILoader (Iassvc.dll)
aa4a2d1215f864481994234f13ab485b95150161b4566c180419d93dda7ac039DPAPILoader (wmiclnt.dll)
159471e1abc9adf6733af9d24781fbf27a776b81d182901c2e04e28f3fe2e6f3DPAPILoader (sspicli.dll)
7a05188ab0129b0b4f38e2e7599c5c52149ce0131140db33feb251d926428d68RemotePELoader (decrypted from disk)
37f5afb9ed3761e73feb95daceb7a1fdbb13c8b5fc1a2ba22e0ef7994c7920efRemotePE (2023-07-04)
6b33d20196267b0d64bca815ca863558d26b17cee77caf62a6cce8eae555ac8dRemotePE (2023-10-17)
62e040a32aac2d2faa8d2bffa2cf7ab662228cebf9bb78eaa0a633c0b729d119RemotePE (2024-04-18)
710f15302859c7af1c1e25219d704841b3fdbc48f16a5a574d5ab6cf4f4842e8RemotePE (2024-05-11)
Table 8: Samples observed related to this activity

YARA Rules

rule Lazarus_DPAPILoader_Hunting {
  meta:
    description = "Hunting rule to detect DPAPILoader, a loader used to load RemotePE."
    author      = "Fox-IT / NCC Group"
 
  strings:
    $msg_1 = "[!] Could not allocate memory at the desired base!\n"
    $msg_2 = "[!] Virtual section size is out ouf bounds: "
    $msg_3 = "[!] Invalid relocDir pointer\n"
    $msg_4 = "[-] Not supported relocations format at %d: %d\n"
    $msg_5 = "[!] Cannot fill imports into 32 bit PE via 64 bit loader!\n"
 
  condition:
    any of them and pe.imports("Crypt32.dll", "CryptUnprotectData")
}
 
rule Lazarus_RemotePE_C2_strings {
  meta:
    description = "RemotePE strings used for C2."
    author      = "Fox-IT / NCC Group"
 
  strings:
    $a = "MicrosoftApplicationsTelemetryDeviceId" wide ascii xor
    $b = "armAuthorization" wide ascii xor
    $c = "ai_session" wide ascii xor
 
  condition:
    uint16(0) == 0x5A4D and all of them
}
 
rule Lazarus_RemotePE_class_strings {
  meta:
    description = "RemotePE class strings."
    author      = "Fox-IT / NCC Group"
 
  strings:
    $a = "IMiddleController" ascii wide xor
    $b = "IChannelController" ascii wide xor
    $c = "IConfigProfile" ascii wide xor
    $d = "IKernelModule" ascii wide xor
 
  condition:
    all of them
}

rule Lazarus_RemotePE_DPAPI_Encrypted_config {
  meta:
    description = "Detects RemotePE DPAPI-encrypted config on disk"
    author      = "Fox-IT Security Research Team"
  condition:
    filesize == 3094
    and uint32(0) == 0x00000001      // DPAPI blob version = 1
    and uint32(0x8E) == 0x00000B40   // dwDataLen = 0xB40 (padded config)
}

Listing 7: YARA rules for DPAPILoader, RemotePELoader and RemotePE

References

  1. https://blog.fox-it.com/2025/09/01/three-lazarus-rats-coming-for-your-cheese ↩
  2. https://securelist.com/operation-applejeus/87553/ ↩
  3. https://www.microsoft.com/en-us/security/blog/2024/08/30/north-korean-threat-actor-citrine-sleet-exploiting-chromium-zero-day/ ↩
  4. https://cloud.google.com/blog/topics/threat-intelligence/3cx-software-supply-chain-compromise ↩
  5. https://unit42.paloaltonetworks.com/threat-assessment-north-korean-threat-groups-2024/ ↩
  6. https://docs.dissect.tools/en/stable/ ↩
  7. https://github.com/hasherezade/libpeconv ↩
  8. https://attack.mitre.org/techniques/T1480/001/ ↩
  9. https://docs.dissect.tools/en/stable ↩
  10. https://github.com/am0nsec/HellsGate ↩
  11. https://github.com/trickster0/TartarusGate ↩
  12. https://github.com/hasherezade/pe_to_shellcode/releases/tag/v1.2 ↩

  •  

AWS KY3P report now available for third-party supplier due diligence

We’re excited to announce that Amazon Web Services (AWS) has completed the S&P Global Know Your Third Party (KY3P) assessment of its security posture. This assessment demonstrates our continued commitment to meet the heightened expectations of cloud service providers. Customers can now use the AWS KY3P assessment to reduce their supplier due diligence burden.

KY3P, also known as the S&P Global Comprehensive Assessment (formerly TruSight), is a validated, evidence-based assessment designed to support regulatory compliance and efficient, standardized risk data exchange between AWS and our clients. KY3P’s globally recognized methodology provides organizations with enhanced visibility into supply chain risks by validating the actual implementation and operation of controls – not just policies or attestations.

As cloud adoption accelerates across industries, AWS has become a critical component of customers’ third-party environments. Regulated customers, such as those in the financial services sector, are held to high standards by regulators and auditors when it comes to exercising effective due diligence on third parties.

To better manage risks from their evolving third-party environments and drive operational efficiencies, many customers rely on third-party risk management services such as KY3P. In support of these efforts, AWS has completed its annual KY3P security posture assessment, conducted by KY3P security assessors.

KY3P’s risk assessment methodology includes over 200 controls across 26 control categories and nine risk domains. These topics include Privacy, Network Management, Logical Access Management, and Physical and Environmental Security. The assessment criteria were developed by a consortium of leading financial institutions.

Customers can use the KY3P results to map AWS against commonly used industry frameworks and standards, such as NIST CSF v2, PCI DSS 4.0, and ISO 27001:2022 to instantly gain visibility into controls coverage.

For details on how to access the report, see our AWS KY3P assessment page.

If you have feedback about this post, submit comments in the Comments section below. To learn more about our other compliance and security programs, see AWS Compliance Programs.

Michael Murphy

Michael is a Compliance Program Manager at AWS where he leads multiple security and privacy initiatives. Michael has over 14 years of experience in information security and holds a master’s degree and a bachelor’s degree in computer engineering from Stevens Institute of Technology. He also holds CISSP, CRISC, CISA, and CISM certifications.

  •  

Automating identity lifecycle and security with AWS Directory Service APIs

Managing identities and access across complex environments has become more critical than ever. AWS Directory Service for Managed Microsoft Active Directory, also known as AWS Managed Microsoft AD, has added new capabilities to manage users and groups. Now, you can perform create, read, update, and delete (CRUD) operations on users and groups directly through AWS Command Line Interface (AWS CLI), APIs, and the AWS Management Console. You can use this powerful capability to automate identity lifecycle management and enhance security in your AWS environment. By using these APIs, collectively known as the Directory Service Data APIs, you can perform operations such as:

  • Listing users and groups
  • Retrieving user and group details
  • Disabling and enabling user accounts
  • Resetting user passwords
  • Managing group memberships

These APIs provide new possibilities for automating identity management tasks and integrating Active Directory management into your existing workflows and applications.

The introduction of these APIs brings several key benefits:

  • Automation of the identity lifecycle: You can now programmatically manage user accounts throughout their lifecycle—from creation to deletion—enabling streamlined onboarding and offboarding processes.
  • Enhanced security: By integrating these APIs with security services like Amazon GuardDuty, you can create automated responses to potential security threats, such as disabling accounts with inappropriate access.
  • Improved compliance: You can use automated user management to help enforce consistent policies and help maintain compliance with various regulatory requirements.
  • Operational efficiency: You can automate routine tasks such as user provisioning, deprovisioning, and group management, reducing manual effort and the potential for human error.
  • Integration capabilities: By using these APIs, you can seamlessly integrate with existing identity management systems, custom applications, and third-party tools.
  • Cost optimization: By automating processes and reducing manual intervention, you can potentially help your organization optimize operational costs associated with identity management.

In this post, we explore these new APIs and demonstrate how you can use them to create an automated solution for detecting and responding to unexpected behavior by Active Directory users. We walk through a practical example that combines GuardDuty, AWS Step Functions, Amazon EventBridge, and the new AWS Directory Service APIs to create a robust security automation workflow.

Solution overview

To demonstrate the power of these new APIs, let’s explore a practical solution that automates the detection and response to unexpected behavior by Active Directory users. This solution combines several AWS services to create a robust security automation workflow:

    1. GuardDuty continuously monitors for unexplained behavior of Active Directory users from AWS Managed Microsoft AD. For the example in this post, we’re using Backdoor:Runtime/C&CActivity.B!DNS
    2. An EventBridge rule detects GuardDuty findings related to these users and triggers a Step Functions workflow.
      {
        "detail-type": ["GuardDuty Finding"],
        "source": ["aws.guardduty"],
        "detail": {
          "type": ["Backdoor:Runtime/C&CActivity.B!DNS"]
        }
      }
    3. The Step Functions workflow will:
      1. Extract the Active Directory username from the instance using a run command.
      2. Start an automation that will disable the account using the DisableUser API.
Figure 1: Diagram of the Step Functions workflow showing the process of Systems Manager finding the username and starting the automation to disable the account

Figure 1: Diagram of the Step Functions workflow showing the process of Systems Manager finding the username and starting the automation to disable the account

  1. Finally, another EventBridge rule will monitor the DisableUser API call. It will send an email to the user using Amazon Simple Notification Service (Amazon SNS) notifications.
    {
      "detail-type": ["AWS API Call via CloudTrail"],
      "source": ["aws.ds"],
      "detail": {
        "eventSource": ["ds.amazonaws.com"],
        "eventName": ["DisableUser"]
      }
    }

This solution delivers automated, near real-time remediation of potential security threats — significantly reducing exposure windows and containing the impact of unauthorized account access.

The following figure shows a high-level architecture diagram of the solution.

Figure 2: Diagram showing the workflow of what happens when potentially damaging activity is detected

Figure 2: Diagram showing the workflow of what happens when potentially damaging activity is detected

Note: The solution must be deployed in the primary AWS Region of your directory.

Prerequisites

To complete the walkthrough in this post, you must have the following prerequisites in place.

GuardDuty

GuardDuty is an automated threat detection service that continuously monitors for unexpected activity and unauthorized behavior to protect your AWS accounts, workloads, and data stored in Amazon Simple Storage Service (Amazon S3).

To activate GuardDuty:

  1. Go to the GuardDuty console.
    1. If you’re activating GuardDuty for the first time, under Try threat detection with GuardDuty, select All Features and then choose Get Started.
    2. If you’ve used GuardDuty before, select Runtime Monitoring and then choose Enable under Runtime Monitoring.
Figure 3: Runtime Monitoring enabled

Figure 3: Runtime Monitoring enabled

AWS Managed Microsoft AD

AWS Managed Microsoft AD provides a fully managed service for Microsoft Active Directory (AD) in the AWS Cloud. When you create your directory, AWS deploys two domain controllers that are exclusively yours in separate Availability Zones for high availability. For use cases that require even higher resilience and performance in a specific AWS Region or during specific hours, you can scale AWS Managed Microsoft AD by deploying additional domain controllers to meet your needs. These domain controllers can help load balance, increase overall performance, or provide additional nodes to protect against temporary availability issues. Using AWS Managed Microsoft AD, you can define the correct number of domain controllers for your directory based on your use case.

To deploy a new AWS Managed Microsoft AD:

  1. Go to the Directory Service console.
  2. Choose Set up directory and select AWS Managed Microsoft AD.
  3. Select Standard Edition and enter a directory DNS name and password.
  4. Select a virtual private cloud (VPC). For this example, use the Default VPC.
  5. Choose Create directory.

Create a test Active Directory user

You will use this test user account to sign in to an EC2 instance and initiate a command that simulates unexplained activity that results in this account being disabled.

To create the test user, you can use AWS CloudShell or the AWS CLI from your local machine. Run the following commands, replacing the --directory-id value with your own:

# Create the test user
aws ds-data create-user \
 --directory-id "your-directory-id" \
 --sam-account-name "TestUser" \
 --given-name "Test" \
 --surname "User"

Then

# Set a password for the test user 
aws ds reset-user-password \
 --directory-id "your-directory-id" \
 --user-name "TestUser" \
 --new-password "YourSecurePassword123!"

In this example, the password is set to YourSecurePassword123!. If you need to replace it with a password that meets your organization’s requirements, see Resetting and enabling an AWS Managed Microsoft AD user’s password. For more information on creating users, see Creating an AWS Managed Microsoft AD user in the AWS Directory Service documentation.

Test EC2 instance

To generate alerts on GuardDuty, you need a domain joined Linux EC2 instance. If you don’t have a domain joined EC2 Linux instance, follow these instructions for joining a Linux instance to an Active Directory domain. This instance will be used to simulate suspicious activity that triggers a GuardDuty finding and initiates the automated remediation workflow.

Implement the solution

Let’s walk through the steps to implement this solution in your AWS environment.

Deploy the solution

  1. Download the CloudFormation template
  2. Navigate to the CloudFormation console in the AWS account.
  3. For Create Stack, choose with new resources (standard).
  4. For Template source, choose Upload a template file. Choose Choose file and select the template you downloaded in step 1.
  5. Choose Next.
  6. For Stack name, enter a stack name (such as CRUD-API-MAD).
  7. In the Parameters area, do the following:
    1. For DirectoryID, enter the AWS Active Directory ID.
    2. For NotificationEmail, enter the email address to send the notification to.
  8. On the Configure stack options page, choose Next.
  9. Select I acknowledge that AWS CloudFormation might create IAM resources with custom names, then choose Submit.

After the page is refreshed, the status of your stack should be CREATE_IN_PROGRESS. When the status changes to CREATE_COMPLETE, proceed to the next section.

Test

To simulate a threat, use a GuardDuty test domain that GuardDuty will recognize as a command and control server.

  1. Go to the Amazon EC2 console.
  2. Choose Instances from the navigation pane.
  3. Select the test EC2 instance that you created earlier.
  4. Choose Connect, select the Session Manager tab, and choose Connect.
  5. Authenticate with your test user by entering su followed by the test user with the domain name that you created earlier. For example su TestUser@example.com, then enter the password.
  6. Enter the command curl guarddutyc2activityb.com.
    You will receive an error because the page won’t resolve, but GuardDuty will have detected concerning events.
  7. Go to the GuardDuty console and select Findings from the navigation pane.
  8. Within 3–5 minutes, you should see a high severity finding for Backdoor:Runtime/C&CActivity.B!DNS.
  9. This will then trigger the automation to disable the account.
    Figure 4: Account successfully disabled

    Figure 4: Account successfully disabled

  10. After the account is disabled, an email notification will be sent notifying an administrator that the account was disabled (it might take up to 5 minutes to receive the notification).

    Figure 5: AWS notification message showing the username has been disabled

    Figure 5: AWS notification message showing the username has been disabled

Note: You must archive the GuardDuty finding before running this test again, because the EventBridge rule only runs once against a GuardDuty finding with the same details. To archive the finding, select the check box next to the Backdoor:Runtime/C&CActivity.B!DNS finding, choose Actions (top right), and select Archive.

Conclusion

The new AWS Directory Service APIs for AWS Managed Microsoft AD provide powerful capabilities for programmatically managing Active Directory users and groups. By using these APIs in conjunction with services such as Amazon GuardDuty and AWS Step Functions, you can create sophisticated automation workflows that enhance your security posture and streamline identity management processes.

The solution we’ve explored in this post demonstrates just one of many possible use cases for these new APIs. As you integrate these capabilities into your own environments, you will probably discover numerous opportunities to improve efficiency, security, and compliance in your identity management practices.

For a solution that uses PowerShell Active Directory cmdlets with AWS Systems Manager Run Command to disable users, see How to automatically disable users in AWS Managed Microsoft AD based on GuardDuty findings.

For more information about AWS Directory Service and its APIs, visit the AWS Directory Service documentation.

We’re excited to see how you’ll use these new APIs to innovate and improve your identity management workflows. If you have any questions or want to share your own use cases, leave a comment below or reach out to AWS Support.

Remember, the cloud journey is all about continuous improvement and innovation. Keep exploring, keep learning, and keep pushing the boundaries of what’s possible with AWS.

Ali Alzand

Ali Alzand

Ali is a Senior Infrastructure Migration & Modernization Specialist Solutions Architect at AWS who helps enterprise customers migrate, modernize, and operate their Microsoft workloads on AWS. He specializes in Infrastructure as Code, automating at scale with AWS Systems Manager, EC2 Image Builder, and CloudFormation. He also designs event-driven architectures building responsive, loosely coupled solutions with EventBridge and Lambda. Outside of work, Ali enjoys grilling with friends and discovering new cuisines around town.

Kevin Sookhan

Kevin Sookhan

Kevin is a Specialist Solutions Architect at Amazon Web Services with over 20 years of experience working with Microsoft technologies. He has expertise in running Microsoft workloads on AWS with specialization in helping customers with their migrations, cost optimization, and infrastructure architecture.

  •  

The Vulnerability Flood Is Now a Board Conversation. Here's How to Lead It.

I've had some version of the same conversation dozens of times since Mythos and Daybreak emerged. CISOs want to know how worried they should be. My honest answer: less than the headlines suggest, and more than most programs are currently prepared for.

Last year, roughly 50,000 software vulnerabilities were disclosed. Recorded Future tracked 446 that were actually weaponized by threat actors. That's less than 1%. The problem was never finding vulnerabilities. It was always knowing which ones adversaries will actually use.

AI makes that distinction harder. Discovery accelerates for everyone, the noise grows faster than any team can manually triage, and the window between a disclosed vulnerability and a working exploit keeps shrinking. Security leaders who've built intelligence-led programs are ready for what's coming. For them, Mythos isn't a crisis. It's the moment their program finally gets the attention it deserves, including in the boardroom.

The threat got faster. The fundamentals didn't.

The instinct to treat AI-assisted vulnerability discovery as a wholesale transformation of the threat landscape isn't quite right, and that imprecision will hurt you in a board conversation.

What's changed is speed. AI has compressed the time between a disclosed vulnerability and a working exploit from days to minutes. Your team has to match that tempo.

What hasn't changed is the fundamental prioritization problem. Disclosed vulnerabilities have more than doubled over the last five years, from roughly 21,000 in 2021 to approximately 50,000 in 2025. That growth happened before AI-assisted discovery became widely accessible. AI makes that challenge faster and more consequential. It doesn't make it new.

That distinction matters because it changes the conversation from "we need to completely rebuild our security program" to "we need to make sure our intelligence capability is operating at the speed the threat environment now demands." The first conversation is expensive and destabilizing. The second is actionable.

Most programs have a triage problem, not a discovery problem

When an AI model returns hundreds of new vulnerability findings, the bottleneck shifts immediately to prioritization. In most organizations, that process is still largely manual. Analysts research each finding, assess severity, cross-reference existing guidance, and attempt to sequence a response. At the volume and velocity these models produce, that workflow can’t keep pace.

The result is a backlog where genuinely critical exposures sit alongside noise, and triage decisions get made without the context needed to get them right. That's not a tooling problem. It's an intelligence problem.

The organizations handling this well have built a layer between discovery and action that automatically correlates every finding against real-world adversary activity, flags vulnerabilities tied to active campaigns, and tells the analyst what it means and what to do about it, not just what was found. Raw discovery tells you that you have a problem. Intelligence-led response tells you which one to solve first, then hunts it down autonomously at machine speed.

There's a second exposure worth naming, and it can produce an uncomfortable board conversation. Most enterprise security investment is concentrated on what enters the environment and what executes at the endpoint. AI-assisted discovery surfaces a different category of risk: exposures that already exist inside the environment, in software running on your infrastructure today, in third-party components that weren't fully inventoried, in vendor systems connected to yours in ways that aren't fully mapped.

Organizations that have concentrated their posture at the edge may find that some of their most consequential vulnerabilities sit somewhere else. That's a hard answer to give a board that just read about Mythos. It's better to surface it yourself than to have someone else surface it for you.

The programs that didn't panic had something in common

The CISOs I talk to who've been building intelligence-led programs for years have handled Mythos differently than organizations that haven't. They didn't need to rebuild anything from the ground up. They used the moment to sharpen programs they'd already been investing in.

But not every organization was already there when Mythos was announced, and that's the more important story for most security leaders reading this. The announcement was a forcing function. The organizations that treated it as one are already in a different position than the ones that didn't.

A financial services customer who came to us shortly after the Mythos announcement is a good example of what moving quickly actually produces. They rebuilt their vulnerability workflow around our automation capability and within two weeks their team had recovered over 20 hours a week that had previously gone to manual triage and research. Those aren't hours saved on busywork. They're hours now going toward work that actually reduces exposure. And when the next wave hits, they won't be caught flat-footed.

What made that possible wasn't just better tooling. It was an intelligence layer that automatically matches vulnerabilities to known threat actors, ties findings to active campaigns where relevant, and scores on real-world exploitation evidence rather than theoretical severity. Every finding arrives with the context an analyst needs to act, without hours of manual research standing between the signal and a response.

The practical outcome is coverage at scale without proportionally growing the team. That's what operating at machine speed means in practice, and it can hold up in a board conversation for a simple reason: it's not just a security answer, it's a business one.

What wins the board conversation

Boards are asking about AI-driven vulnerability discovery because it's broken into mainstream coverage in a way most threat developments haven't. That attention isn't going away. Security leaders who can walk into that conversation with a clear, specific answer about how they're managing the risk will come out with more credibility and more resource authority.

Mythos and Daybreak are the start of a longer trend. The right response isn't to treat each new model as a fresh crisis. It's to build the intelligence foundation that makes your program resilient regardless of what comes next. When you've done that, AI-assisted discovery stops being a source of anxiety and becomes what it should be: a faster path to finding and fixing what actually matters.

Ready to go deeper on the operational response? Recorded Future Chief Product Officer Jamie Zajac lays out the full playbook here.

  •  

Red Teaming in the age of EDR: Evasion of Endpoint Detection Through Malware Virtualisation

Authors: Boudewijn Meijer && Rick Veldhoven

Introduction

As defensive security products improve, attackers must refine their craft. Gone are the days of executing malicious binaries from disk, especially ones well known to antivirus and Endpoint Detection and Reponse (EDR) vendors. Now, attackers focus on in-memory payload execution for both native and managed applications to evade defensive products. Meanwhile, defensive technologies are becoming increasingly sophisticated, which is forcing attackers to further adapt. In times of such an arms race, how does an attacker stay ahead? And how can malware be future-proofed to evade the sophisticated EDR systems that currently exist and are actively being developed?

This blog post reviews the evolution of one of Fox-IT’s evasive tools, designed to aid in payload delivery during Red Teaming engagements. We will touch on the tool’s history and its future potential in the face of offensive and defensive progress.

Historical Perspective

The core of the arms race between malware and antimalware is as follows: antimalware must classify arbitrary programs, in memory or at-rest, as either benign or malicious while operating under a set of constraints. The products are constrained by the amount of performance a user or customer is prepared to surrender in terms of CPU time, memory or bandwidth while the classification takes place, and by how many false-positives the product generates. If the product is too resource intensive, a customer will complain it is slow. If it quarantines important documents, it potentially does more harm than good. These constraints shape and limit each step in the evolution of antimalware products. Not only AV vendors need to worry about performance when writing tools. Malware authors need to take execution speed, or other system changes, into account when deploying malware. Take for example the recently uncovered XZ1 backdoor that was spotted by a software engineer due to an increase in login time from 0.2 to 0.8 seconds. Had the authors of this piece of code not observably changed the behavior of the system, the backdoor would have likely been deployed successfully.

Since the early days of viruses circulating on floppy disks, writing undetected malware has been a cat-and-mouse game between attackers and defenders. Originally, antivirus software focused strictly on true-positive detection of viruses on the basis of signatures and patterns in a program’s instructions. Absent a mistake in the signature database, a unique signature match guarantees a true-positive match of a malicious sample after which the malicious file can be removed or quarantined. This method of detection strongly adheres to the constraints placed on antimalware products, because simple pattern matches are performant and true-positive detection is almost guaranteed.

For malware authors, the solution was simple: to evade detection, the virus must be made impossible to detect through a unique pattern. This may be achieved by changing the code, or by encrypting the code and decrypting it at runtime. If you automate this, you get what is called a packer: a tool that encrypts, compresses or otherwise changes a virus to evade detection. A packer changes the majority of the code in the virus and adds a stub to the code. This stub is often the first piece of code that is executed when the program is launched. Its job is to undo all changes previously made to the original code (e.g. compression or encryption). After all changes are reverted, execution will be passed to the original code. This stub can also make use of anti-reversing/anti-tampering code that attempts to protect the original code from prying eyes.

This reduces the amount of “attack surface” for signature creation for samples that are on the disk or otherwise stored at rest. This method is also used to compress binaries for distribution, allowing for smaller release packages. Therefore, not all compressed binaries can be marked as malicious.

However, even very small unpacker stubs may match a signature that can be uniquely tied to the packer itself. Combining this signature with some rules related to the amount of entropy in a file, a packer can still be detected with a high degree of accuracy. At this point, the antimalware solution has evolved to utilize metadata about a file, such as entropy, obtaining the ability to detect packed files but at the cost of a higher false-positive rate.

The next step in the arms race for malware authors is to eliminate the potential for a signature match in the unpacker stub. This means that the stub must consist of different instructions each time a new sample is created. An important insight is that “what the code does” and “how the code looks” are not 1:1 mappings. There are infinitely many ways to write down computer code to achieve a certain effect or result. There are therefore infinitely many ways in which a particular unpacking algorithm can be written. A packer that is designed to create the unpacking stub that looks different each time can be called polymorphic. The algorithm or code that performs the changes is called a polymorphic engine2.

Combining a packer with a polymorphic engine eliminates the “attack surface” for simple signature matches of malware at-rest. Fox-IT has written and maintained two polymorphic packers like this since 2015. Although they still produce good results against modern EDR, even these tools are getting more and more difficult to sneak past defenses. That’s because there’s a conceptual flaw in the polymorphic packer: the original malicious code is still decrypted at some point in order to execute. If antimalware products can time the moment to start scanning for malicious patterns when the packer has finished decoding the malicious code, then detecting malware becomes easy again.

Modern operating systems and processors try to ensure that not all data in a computer’s memory can be executed as code for safety reasons3. Particularly, systems are typically designed to prevent the execution of code from writable pages. Therefore, a virus or malware sample that wants to decrypt and/or decompress its own code must first make the changes in writable memory pages. After, the virus changes the page protection to readable and executable and transfers control to the newly modified executable memory. Antimalware products equipped to analyze the behavior of other programs at runtime make use of behavioral patterns like this to decide when to scan the memory of a process for malicious patterns. Because the memory, once decrypted, cannot be changed anymore due to the aforementioned limitations, scanning a process after making memory executable is the ideal time to spot malicious patterns.

Antimalware products that are equipped with rules that generate additional signals to determine if a program is malicious or not, are said to employ “heuristics”. Conceptually, antimalware products have achieved a comprehensive set of features to detect malware execution. The evolutions we’ve seen since the early days of these feature complete products can all be understood as attempts to loosen or lift the constraints set out above: “Cloud-based protection” runs resource intensive heuristics on someone else’s computer; adding human oversight, the “R” in “EDR” lowers the impact of a false-positive and brings humans into the detection and response loop.

How then, can a Red Team smuggle their malware past these new and advanced defenses? In the past, a virus writer might employ what is called a “metamorphic” engine4. This is an algorithm designed to re-write the entire virus each time it infects a new file, including the entire metamorphic engine itself. Using it ensures that there is never one ‘true’ virus sample that can be detected with a static signature; each copy of the virus is completely different. With a tool like this you would not need a packer, because there are no static patterns that can ever be uniquely tied to your virus. However, the explosion in modern software complexity and the requirement for malware to work on a variety of systems

Hiding From Analysis: Virtualisation

To hide from both static and dynamic analysis of payloads, the generated sample must be resilient to code inspection and code flow analysis. If the real instructions are not revealed to an observer, hardly any conclusions can be drawn from the outer shell. If this is achieved, defensive products would be met with the following limitations when inspecting the payload:

  • Difficult to observe instruction patterns;
  • Difficult to patch instructions;
  • Difficult to ignore instructions;
  • Difficult to predict behavior.

Hiding instructions is not something new. Products like VMProtect5 cloak parts of the code by embedding a virtual machine and generate unique instructions to be executed on this VM. Code that is to be virtualized must be identified either by a marker added to the source code or by the presence of a PDB file containing the symbols. This requirement is something that cannot always be met when using third-party tools. Additionally, this type of protection is aimed at protecting specific functions, like license key checking algorithms, limiting the use for an adversary. Lastly, using existing tools can have a negative impact on the detection ratio, as these products are heavily researched and can contain static signatures like hardcoded section names.

Considering the benefits of a virtualisation layer, however, it is clear that this technique is very powerful.

Creating a Custom Virtualisation Layer

It was decided that a virtualisation layer should be created. This layer consists of a virtual machine implementing opcodes6, and bytecode7 executing on the virtual machine. The virtualisation layer that was to be created must match the following requirements and limitations:

  1. Bytecode instructions are executed sequentially;
  2. Bytecode instructions are hidden before and after execution;
  3. The instruction set supports basic x86-64 instructions only;
  4. The virtual machine must provide an interface to the system API;
  5. The virtual machine implementation must be simple and position independent to support morphing;
  6. The virtualisation layer must work without access to source code or debug symbols.

Creating a virtualisation layer started with a design of the instructions to be executed, the virtual machine, and the supported instruction set. Additionally, the layout of the final payload was created where all data must be present in a position independent format and could be executed like shellcode. This allows the payload to be embedded in other executable formats (e.g. executables or DLLs), and allows for dynamic execution when staging malware.

For example, the following layout would allow for the above functionality. In this example, the virtual machine must start with a correcting stub that correctly sets the virtual machine argument registers to their respective values:

Example of a data structure containing all required building blocks within position independent code.

The Anatomy of an Instruction

To keep the virtual machine architecture simple, an instruction format was created to be consistent in length between instruction and operand types. This design decision allows the omission of a Length Disassembler Engine (LDE)8, and can simply use the instruction pointer as an index to the current instruction. All information present in normal, non-SSE9/AVX10 x86 instructions must be included.

At its core, an instruction identifies the operation that must be performed, and optionally what data is provided in the form of operands. An operand can be one of three types:

  1. Immediate value: a constant value embedded in the instruction;
  2. Memory location: a memory location pointed to by the instruction;
  3. Register: a register, or part of one, identified by the instruction.

In order to obtain data from an operand, a generic format must be created that encompasses the different operand types. It was decided that a single 64-bit field could be used to hold the different types of operands, as all of the necessary data of the aforementioned types can be embedded into 64 bits.

The structures below show the layout of each operand type:

This file contains hidden or bidirectional Unicode text that may be interpreted or compiled differently than what appears below. To review, open the file in an editor that reveals hidden Unicode characters. Learn more about bidirectional Unicode characters
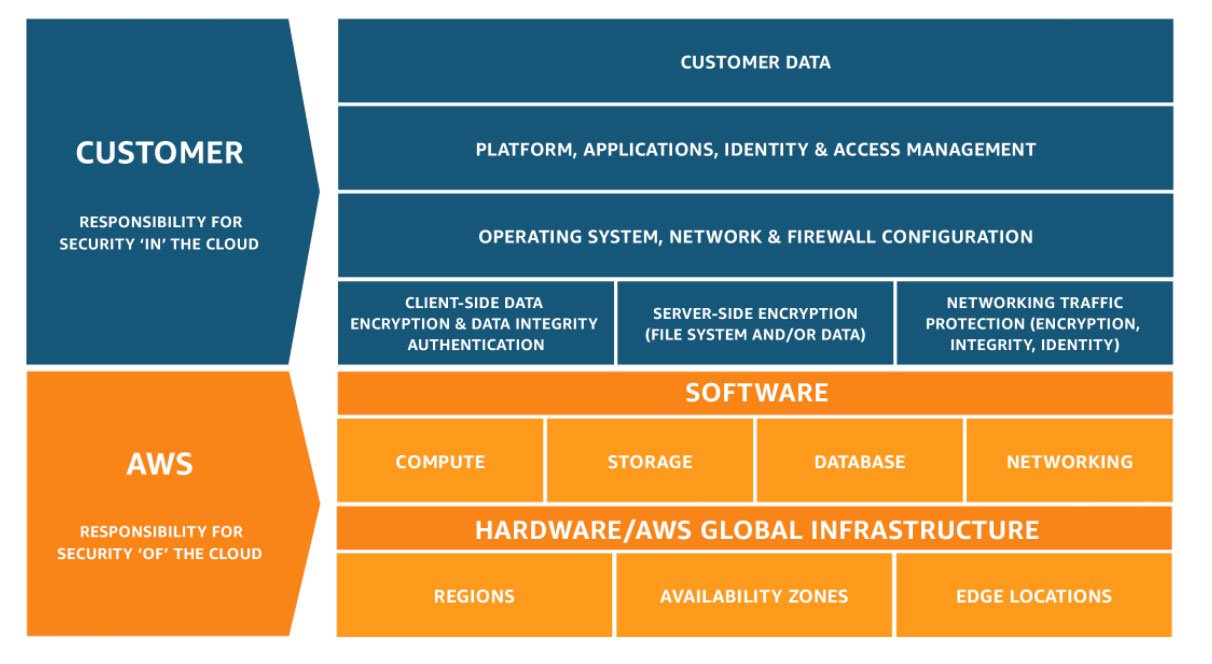
struct ImmediateOperand {
Value value; // A constant value
}; // size: 8 bytes
struct MemoryOperand {
uint8_t size; // The effective size of the operand (8, 16, 32, 64 bits)
uint8_t base; // A regiser holding a pointer value to the base address
uint8_t index; // A register holding the index of the array
uint8_t scale; // A constant multiplier of 1, 2, 4, or 8
int32_t displacement; // A value to be added to the calculated address
}; // size: 8 bytes
struct RegisterOperand {
uint8_t reg; // A base register of the x86-64 register set
uint8_t chunk; // The specific register chunk: low, high, word, dword, qword
uint16_t size; // The effective size of the operand (8, 16, 32, 64 bits)
uint32_t pad; // Padding to meet the 64 bit size requirement
}; // size: 8 bytes
union Operand {
ImmediateOperand imm; // View the data as an immediate operand
MemoryOperand mem; // View the data as a memory operand
RegisterOperand reg; // View the data as a register operand
}; // size: 8 bytes
view raw operand.h hosted with ❤ by GitHub

Note: The Value type of the immediate operand is a simple union with (u)int8_t to (u)int64_t members. This makes it trivial to index the correct data during implementation of opcodes.

To indicate the instruction’s opcode, a single 1-byte value can be used. This provides 256 unique opcodes, which should be enough to implement basic behavior. Lastly, the type of each operand must be embedded within the instruction format, as opcode implementations must be able to interrogate these types.

This file contains hidden or bidirectional Unicode text that may be interpreted or compiled differently than what appears below. To review, open the file in an editor that reveals hidden Unicode characters. Learn more about bidirectional Unicode characters
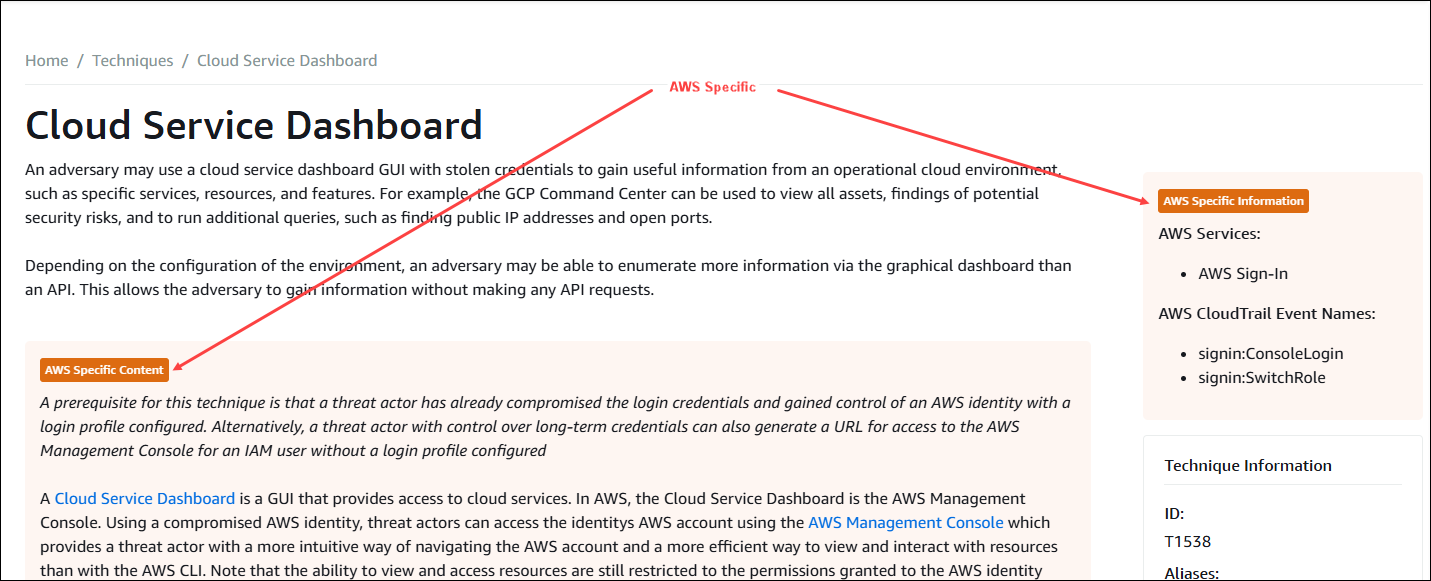
struct Instruction {
uint8_t opcode; // The opcode of the instruction
uint8_t lparam_type : 4; // The type of the first (left) operand
uint8_t rparam_type : 4; // The type of the second (right) operand
Operand lparam; // The first (left) operand
Operand rparam; // The second (right) operand
}; // size: 18 bytes
view raw instruction.h hosted with ❤ by GitHub

Protecting Instructions

To meet requirement two, “Instructions are hidden before and after execution”, instructions are protected using encryption. Many encryption algorithms can be used to hide instructions. However, it is required for the instruction size to remain the same, as the instruction will be decrypted and encrypted in-place and will not be moved to a temporary buffer. This removes the necessity for dynamic memory allocation from within the virtual machine. Additionally, the chosen encryption scheme must be trivial to implement, as the code will be located in the virtual machine and thus create an ‘attack surface’ for signature detection. Implementing complex algorithms is detrimental to the ability to effectively manipulate the code using a polymorphic engine.

The Anatomy of the Virtual Machine

The virtual machine resembles a virtual CPU, implementing all the available opcodes. Furthermore, the available registers, CPU flags, and stack are part of the virtual machine object. Lastly, the virtual machine holds a pointer to the bytecode buffer necessary for execution. An added benefit of implementing the virtual machine is that the real stack is also abstracted away. Heuristics that attempt to spot malicious behavior from the stack will not succeed.

This file contains hidden or bidirectional Unicode text that may be interpreted or compiled differently than what appears below. To review, open the file in an editor that reveals hidden Unicode characters. Learn more about bidirectional Unicode characters
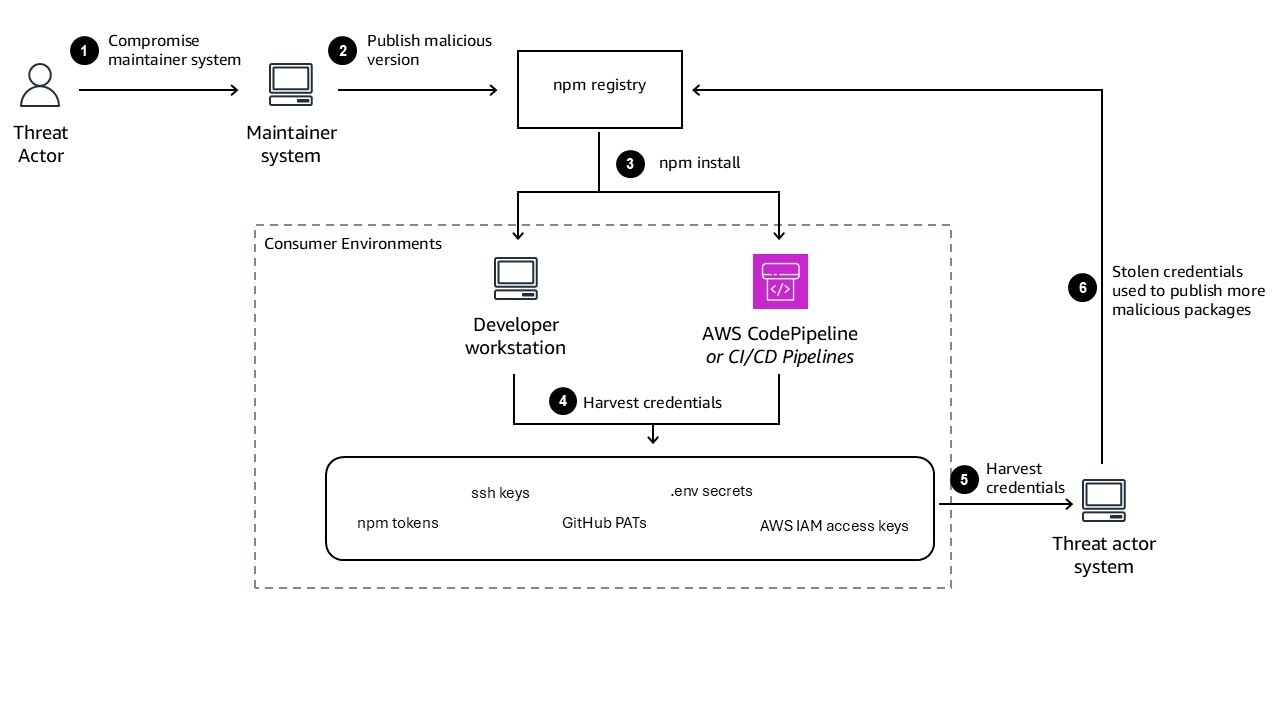
struct Context {
uint32_t ip; // Instruction pointer
uint8_t flags; // CPU flags to be manipulated by opcodes
Register registers[17]; // General Purpose Registers (rax, … r15 and gs)
Instruction* instructions; // A pointer to the start of the bytecode buffer
uint8_t stack[STACK_SIZE]; // The virtual machine stack
};
view raw context.h hosted with ❤ by GitHub

Functions to initialize the virtual machine context, to obtain the current instruction, and to load and store values based on the instruction operands were created to aid in the implementation of opcodes within the virtual machine.

Once initialized, the virtual machine can enter its dispatch loop. This loop consists of obtaining the current instruction and executing the opcode identified by the opcode field in the instruction object. The instruction is decrypted before execution and is encrypted after. A dispatch function could be implemented as follows:

This file contains hidden or bidirectional Unicode text that may be interpreted or compiled differently than what appears below. To review, open the file in an editor that reveals hidden Unicode characters. Learn more about bidirectional Unicode characters
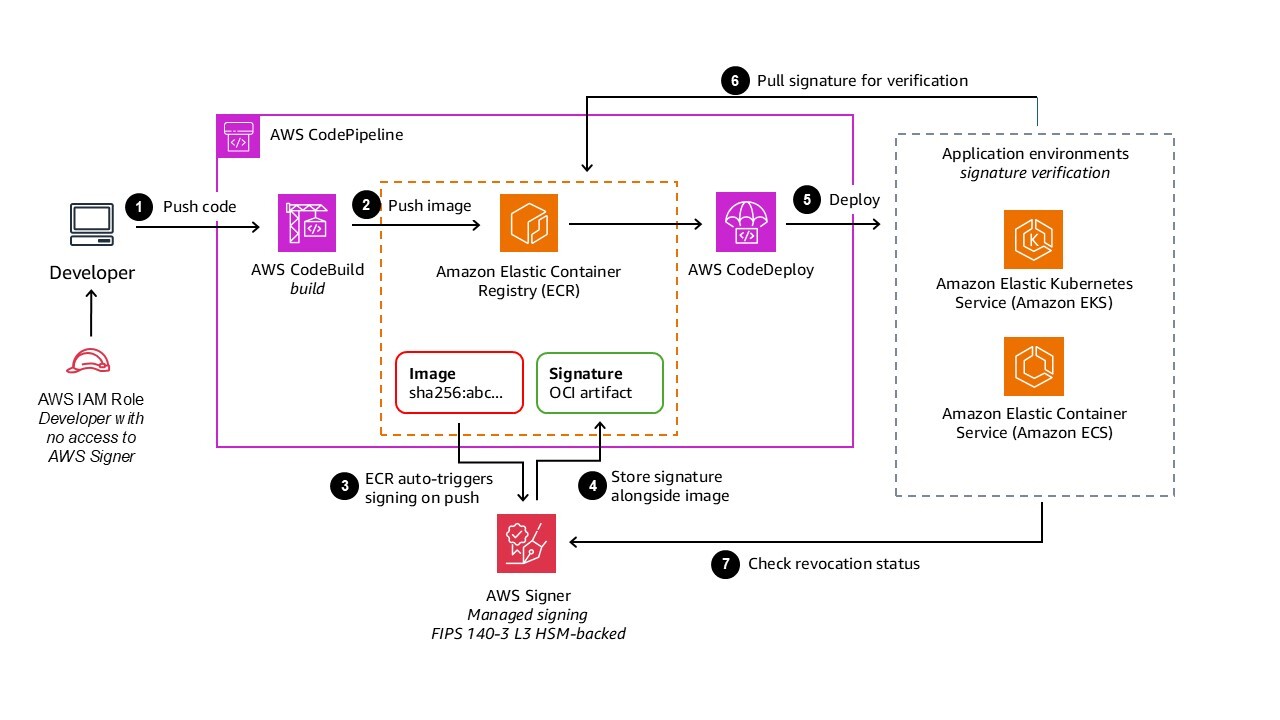
void dispatch_instruction(Context* vm) {
uint32_t ip = vm->ip;
decrypt_instruction(vm, ip);
switch (vm->instructions[ip].opcode) {
case Opcode::ADD: opcode_add(vm); next_instruction(vm); break;
case Opcode::AND: opcode_and(vm); next_instruction(vm); break;
case Opcode::BT: opcode_bt(vm); next_instruction(vm); break;
}
encrypt_instruction(vm, ip);
}
view raw dispatch.cpp hosted with ❤ by GitHub

An attentive reader may have noticed the construction of the temporary variable ip, which is used in further operations. This originates from the fact that any instructions modifying the instruction pointer, like jcc, call, and ret, will result in a modified instruction pointer when the opcode is finished. Therefore, the instruction pointer can no longer be used to re-encrypt the original instruction that was executed.

Implementation of a Basic Opcode

The following function implements the bit test (bt) opcode11:

Improving the Bytecode Process: Transpiling

Initially, all bytecode created to execute in the virtual environment was written in assembly by hand. This provided the control needed to make sure specific opcodes and operand types were used, and as a test a PE loader was implemented in bytecode. As this limitation came at a major cost in development time and flexibility, a new method of generating bytecode was used: compiling and transpiling of C/C++ programs. This was chosen over using output directly from the assembler, as parsing these text files proved to be cumbersome and error-prone. Instead, the resulting linked binary was fed to a disassembler.

The disassembling of a binary is performed using the iced-x86 library12. This library allows for the conversion of x86 instructions to the custom format -described in the earlier section: The Anatomy of an Instruction– by checking the opcode of the instruction, the types of operand(s) and its value(s). Eventually, once all the x86 instructions are converted, the now transpiled bytecode can be interpreted by the virtual machine.

The bytecode generation process from source code to eventual bytecode.

The implementation of the transpiler instantly enabled us to support a large amount of existing tools, and made writing new tools easier. Most Position-independent Code (PIC)13 tools that compile from C/C++, including some BOFs14, can also be ported to execute on the virtual machine with relative ease.

Limitations to Bytecode Implementation

One of the limitations of the virtual machine implementation is shared with that of the bytecode. PIC must be created in order to generate valid bytecode that executes on the VM. In practice, this means that everything is relative to the current instruction pointer, and no references to other libraries or parts of other sections can exist:

  • No static variables;
  • No global variables;
  • No strings;
  • No static dependencies on libraries.

Supporting Native API Calls

To allow interfacing with the OS layer, bytecode must be able to perform native API calls. A translation layer must exist between the bytecode and native environment. The call instruction is used by compilers to invoke APIs, requiring the virtual machine’s call implementation to support this translation. Unfortunately, once a call instruction is encountered, no information is known to the virtual machine related to the number of arguments that must be forwarded. To resolve this problem, the bytecode can prepend the number of arguments when calling an API, giving the virtual machine layer enough information to translate the call into native execution. To programmatically perform this task, variadic arguments in C++ templates can be used to automatically deduce the amount of arguments passed:

As specified in Microsoft’s x64 __stdcall15 calling convention, the first four integer or pointer arguments are passed using the registers rcx, rdx, r8 and r9, with the remaining arguments being passed on the stack. This means that at the time of executing the call instruction, rcx holds the number of arguments that must be passed to the API. The virtual machine can extract and inspect this value, and use it to correctly perform the call:

The real values of the arguments are stored in rdx, r8, r9 and on the stack. When extracting the arguments from the stack, one must remember to keep the shadow space16 in mind.

Visually, the process looks like this:

A virtualized call instruction invokes ntdll!NtAllocateVirtualMemory. This call is translated to a native call and the API is invoked. The resulting value is returned to the VM.

Supporting Bytecode Function Callbacks

Keeping in mind the porting of existing programs to the bytecode architecture, one cannot omit the support for function callbacks within code. Take for example a simple linked list implementation, with a list_search function taking a predicate callback:

However, a problem arises: how does the virtual machine differentiate between a normal bytecode function call, a native API call, and a function callback? The difference between the first two is clear: the bytecode function call is a call to an address within the bytecode and is known at compile time, where the API call is a dynamic call, meaning a call to a function pointer stored in a register or memory location. Given that a callback within bytecode is a dynamic call, too, the virtual machine must be provided with information about the type of call being made.

To load a function pointer as an argument, a lea17 instruction is generated with its right operand referencing a memory address. This referenced memory address uses the instruction pointer (rip) register as the base field of the memory operand. When transpiling, such cases can be identified. To store this information, a new type of operand can be added to the already existing three types -listed in “The Anatomy of an Instruction”– (e.g. Function). When the virtual machine executes the lea instruction, it can check for the type of operand. If this operand’s type is Function, a tag can be added to the high 32 bits of the value, for example 0xDEADBEEF.

Once the call instruction is invoked, the value of the operand can be interrogated. If this value contains the previously added tag, a callback is requested. To perform the call, the tag is stripped from the value and the instruction pointer can be set accordingly.

Supporting User-Defined Arguments

Depending on the type of program that is executing, user-defined arguments are required. Take for example a program that simply sleeps for a period of time. How long should this program sleep for? Hardcoding these values is not always an option. Early on in the development of the project, a simple data structure was defined which could be provided to the bytecode’s entry point:

Accompanying this, each bytecode project contained a script that packaged data in a way that could be understood by the bytecode. However, there was no consistency between these scripts and the method of extraction. For example, extracting two 4-byte integers is simpler than extracting two strings due to their variable size.

To standardize this process, and to include it into the building step itself instead of running a random script, a key-value solution was created in combination with an API that can interrogate the type and value of each argument. This is different from parameter packing that Cobalt Strike uses in its BOFs18, as default arguments, or arguments that are not strictly required are supported. Additionally, each argument is encrypted separately. This allows for a PE packer to extract domain-keying information before extracting the PE data.

The following API is defined:

The signature of the bytecode’s entry point is updated to incorporate this change:

Supporting DLLs

Executables and DLLs are very similar in the way they look and in the way they execute. Both have an entry point to which execution is passed, and both return a value. However, the execution flow of an executable starts at the entry point, and does not reach its function’s end until the program stops. DLLs often perform very limited initialization within their entry point, and return execution to the loader to not lock the loader threads. Additionally, the entry point of the DLL is called more than once: on process startup and shutdown, and on thread creation and destruction. The reason for calling the entry point is passed by the loader in the second, dwReason, argument. This allows the code inside of the DllMain function to differentiate between the reasons the entry point was invoked, and can act accordingly.

To allow our shellcode to be embedded within DLLs, both the virtual machine and its bytecode must be made aware of the reason for invocation. This requires the entry point of the virtual machine and bytecode to match that of a DLL, automatically receiving the reason by the OS loader. This does not interfere with the entry point used by a normal executable, as the default entry point of any executable does not take any arguments directly, but instead the arguments argc and argv are resolved by the C runtime, which is not linked against.

On initialization, the virtual machine sets the bytecode’s rdx register to the value of its reason argument, passing the value to the entry point as the second argument. The programmer must decide if this value is to be inspected within the bytecode and should not use the value when writing bytecode to be embedded in an executable.

Deceiving Behavioral Analysis: Multi-VM Execution

Earlier, the method of detection based on behavior was discussed. This dynamic form of inspecting an application’s execution flow regardless of static patens is difficult for attackers to rid their malware of. Opening Lsass.exe and reading its memory could be marked as malicious, even if the process looks like calc.exe. Often, defensive products receive events by kernel callbacks, such as PsSetCreateProcessNotifyRoutine19 or PsSetLoadImageNotifyRoutine20, API/syscall hooks in the local process or by using Event Tracing for Windows (ETW)21 consumers.

Patching hooks in the local process along with local ETW functions that provide events is trivial. This rids the process of intrusive monitoring by antivirus or EDR solutions, and stops the process from creating events. However, some events are still generated, mostly by the ETW providers present in the kernel, along with the kernel callbacks. Additionally, events created during patching could still be monitored. Lastly, blinding defensive products could have a negative effect, as failure to receiving check-ins could be considered an error and a signal of malicious behavior by itself.

As an attacker, generating arbitrary events along with ones that might cause detection could be a method of thwarting dynamic detection rules based on behavior. Adding code to generate events in between regular instructions would require manipulation of source code, and is not preferred. Creating a new thread that generates random events could be in vain, as events are registered per unique thread in the process.

The virtual machine was extended to support vmcalls. These types of call instructions made by the bytecode notify the virtual machine layer that a task needs to be performed. Among multiple different supported calls, most noteworthy are the following:

  • vminit: Initialize the virtual machine object with bytecode and arguments
  • vmexec: Execute N cycles on the virtual machine

The combination of these two calls allows bytecode to create a new virtual machine, and execute a predetermined number of instructions:

Because both sets of bytecode execute within the same virtual machine, and therefore on the same thread, no distinction can be made between the origin of each event. The OS, and any event consumers will observe a single thread generating multiple events, both benign and possibly malicious. Most importantly for an attacker, this could break patterns of behavior being monitored for.

As an additional benefit of these added instructions, bytecode can now be obtained and executed at runtime. This proved to be an extremely useful feature during payload development, as instead of staging shellcode during Command and Control, bytecode can be provided. This removes the necessity for allocating executable memory regions (or changing memory protection at a later stage) to execute shellcode in, in turn removing the opportunity for defensive products to inspect buffers used for dynamic code execution often leveraged by attackers.

For example, the following behavior could be implemented to create a simple polling implant, requesting bytecode every 10 seconds:

Protecting the Virtual Machine

At this point, we have defeated most detection measures that we are aware of, and set out to defeat. However, the VM shares a fundamental weakness with the original packers: static patterns in the native-code VM. Throughout its development, the VM was kept as simple as possible, adhering to constraints set out to enable support for a polymorphic engine to be executed on the VM’s binary code. This made the development significantly more cumbersome, but, given a sufficiently strong polymorphic engine, does close the detection loop fully. The polymorphic engine we developed has been battle tested over several years of use against modern EDR, and antimalware. Despite the fact that the code of the engine was designed years ago, and has not significantly changed since, it still manages to mutate malicious code to the extent that it becomes undetected at runtime and scan time.

Due to the way the universe works, the engine cannot support arbitrary programs. The largest constraint is that dynamic control flow is not supported. This means that indirect function calls, indirect jumps and the ret instruction could all potentially break the mutated code. Our engine assumes you know what you’re doing, and won’t complain when such instructions are encountered, but the resulting code will likely not work as intended.

The polymorphic engine supports several different mutation techniques, including:

  • Instruction substitution: replacing instructions with semantically equivalent ones. For example: mov eax, 0 can be replaced with xor eax, eax;
  • Basic block reordering: changing the order of basic blocks in the code;
  • Basic block creation: inserting new basic blocks into the code, through jumps and push rets;
  • NOP instruction insertion: inserting NOP instructions to change the code’s layout.

The most important feature is that the output of the engine can be fed back into the engine again. This allows for multiple iterations of mutation, which leads to virtually incomprehensible disassembly. This is especially useful when the input is a small piece of code, like a shellcode loader. Sufficient numbers of mutation will double, or quadruple the size of the output, further muddying the waters for defenders.

Conclusion

Due to the ever-changing security landscape, both attackers and defenders must stay on their toes. Defensive security products continue to improve over time, making it more difficult for attackers to remain undetected, or even execute malicious code at all. Detection of payloads has shifted from static analysis to a combination of heuristics and signatures, rendering some tools obsolete.

In this blog post, we have described a tool that was written to tackle both static and dynamic analysis by way of virtualisation. This technique, along with employing a custom polymorphic engine attempts to evade these types of analysis by layers of obfuscation. To bypass heuristic analysis, support for multiple virtual machines to run concurrently was added, disrupting patterns in created events. As an added bonus, reverse engineering a sample without prior knowledge could be a daunting task. Analysts would have to reverse not only the morphed virtual machine itself, but extract morphed bytecode for further analysis. This does not remediate the issue of reverse engineering payloads for an attacker, but does significantly slow down the process, providing the attacker with more time.

In practice, this project has allowed attacks to remain undetected during Red Teaming and TIBER exercises in some of the most heavily monitored environments, making use of state of the art EDR solutions. Moreover, due to the addition of a transpiler converting compiled binaries into custom bytecode, both the speed and ease of development of custom payloads was greatly improved.

The following is a non-exhaustive list of payloads that were created during a recent Red Teaming exercise, successfully evading detection:

  • Multiple persistence modules;
  • Multiple lateral movement modules;
  • Shellcode and bytecode executor;
  • Antivirus and EDR patchers;
  • HTTP(s) and DNS beacons;
  • Tools querying Active Directory information.

Porting of additional tools is taking place, and we expect to have virtualized versions of most tools used in a Red Team exercise in the near future.

Looking Forward

The motivations for this blog post are two-fold. Firstly, we wanted to share what we think is exciting research with the community. We learned what we did from openly shared blog post and articles, and want to give back to the community. We use all the knowledge we gained to improve the security of our customers through offensive security testing, and we hope that this blog post will help and inspire others to do the same.

Secondly, although security products have advanced tremendously, we want to show that there is still room for improvement. We have noticed a tendency to “slap an EDR on it and call it a day” in certain niches of the security industry. Although that might work for some time, because a modern EDR truly adds a strong layer of security, the door is still open for attackers to bypass these products. As the landscape evolves, and general cyber security knowledge increases, the skill and sophistication of cyber criminal elements will rise. Consider this blog post, and the technique explained within, as a warning and a call to action. We hope security vendors will think about how they can detect these types of payloads, and how they can improve their products to stay ahead of the curve, as they are right now.
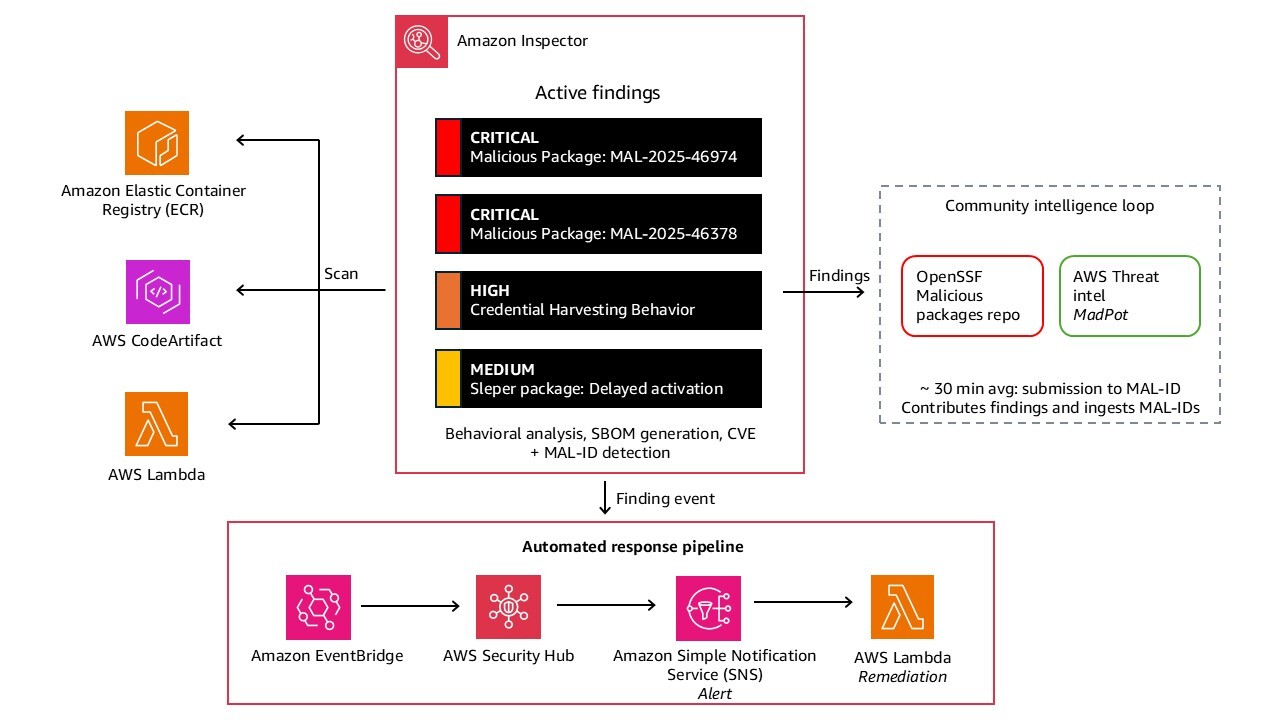
References

  •  
❌