Mexico is one of the host countries for the 2026 FIFA World Cup, with matches to be played in three major cities: Mexico City, Monterrey, and Guadalajara. These locations are expected to see a large influx of international visitors, increasing the potential security risks. Many of those risks arise from users connecting to public wireless networks.
To better understand the wireless environments that visitors may encounter, we at Kaspersky GReAT conducted a wardriving assessment in the three host cities. The aim of the study was to analyze characteristics, deployment patterns, security configurations and potential exposure risks of public Wi-Fi infrastructure in urban wireless environments.
The information collected during the assessment was used exclusively for passive observation and infrastructure analysis. No attempts were made to authenticate, intercept communications, exploit systems or interact with the detected wireless networks beyond the publicly broadcast management information.
During processing of the collected data, one step involved filtering out networks belonging to cars or cell phones categorized as mobile hotspots because they do not represent networks that can be considered part of the assessment.
Research scope
The cities included in the study have high population density and extensive wireless infrastructure deployments. We chose areas with the most prominent wireless network activity and highly concentrated public access points. We carried out wardriving research in Monterrey back in 2008, but the city’s hotspot landscape has changed since then.
We chose the following analysis areas for each of the cities:
Mexico City: México City Stadium, Mexico City International Airport, Zócalo, Paseo de la Reforma, Colonia Roma, La Condesa, Polanco, and Coyoacán.
Guadalajara: Guadalajara Stadium, Guadalajara International Airport, the city center, Zapopan, Providencia, Avenida Chapultepec, Colonia Americana, Tlaquepaque, and the area around Andares.
Monterrey: Monterrey Stadium, Monterrey International Airport, Fundidora Park, Cintermex Monterrey, the downtown area, Barrio Antiguo, MacroPlaza, and the San Pedro financial district.
The wireless information was collected using passive wireless reconnaissance techniques. The collected information included:
SSID analysis and information exposure, including BSSID-derived SSIDs
Default router configurations and ISP deployments
Frequency and signal characteristics
Channel congestion and spectrum usage
Wireless security configurations, including:
Open and insecure wireless networks
WPS-enabled networks
Secure networks (WPA2/WPA3) with WPS enabled
We performed a wireless infrastructure analysis in Mexico City, Guadalajara, and Monterrey. We drove through the areas surrounding the World Cup stadiums, tourist zones, and other places where fan concentrations are likely to be largest. Our goal was to evaluate the security status, deployment characteristics and operational exposure of detected wireless networks.
In total, we recorded 84,588 signals with 69,473 unique Service Set Identifiers (SSIDs) in busy locations and World Cup zones across the three cities. Mexico City accounted for 61.4% of the signals, Guadalajara for 23.6%, and Monterrey for 14.8%. Approximately 82% of the signals had a single SSID (81.9%, 81.34%, and 84% respectively). Notably, they all operate under the IEEE 802.11 standard protocol.
Particular attention was given to identifying standard deployment patterns, legacy configurations, default vendor settings and information disclosure through publicly broadcast wireless identifiers.
The following sections present the results that were obtained by analyzing wireless infrastructure across the three locations.
Our findings
SSID analysis and information exposure
SSID analysis was conducted to evaluate naming conventions, deployment standardization and potential information exposure.
Only a few networks (0.0047%) have an invisible SSID, meaning the names of these networks are not broadcast. Some users prefer to hide the SSID for various reasons, such as the network’s purpose, the profile of its users, internal policies, etc. In contrast, the rest of the networks maintained active SSID broadcasting.
SSID structures may unintentionally disclose operational details about internet service providers (ISPs), device manufacturers, deployment practices, organizational ownership or user identity. The repeated presence of default SSID naming patterns across the analyzed locations indicates a significant degree of infrastructure homogeneity and reuse of default wireless configurations. It may also facilitate passive infrastructure profiling by revealing standard characteristics in use.
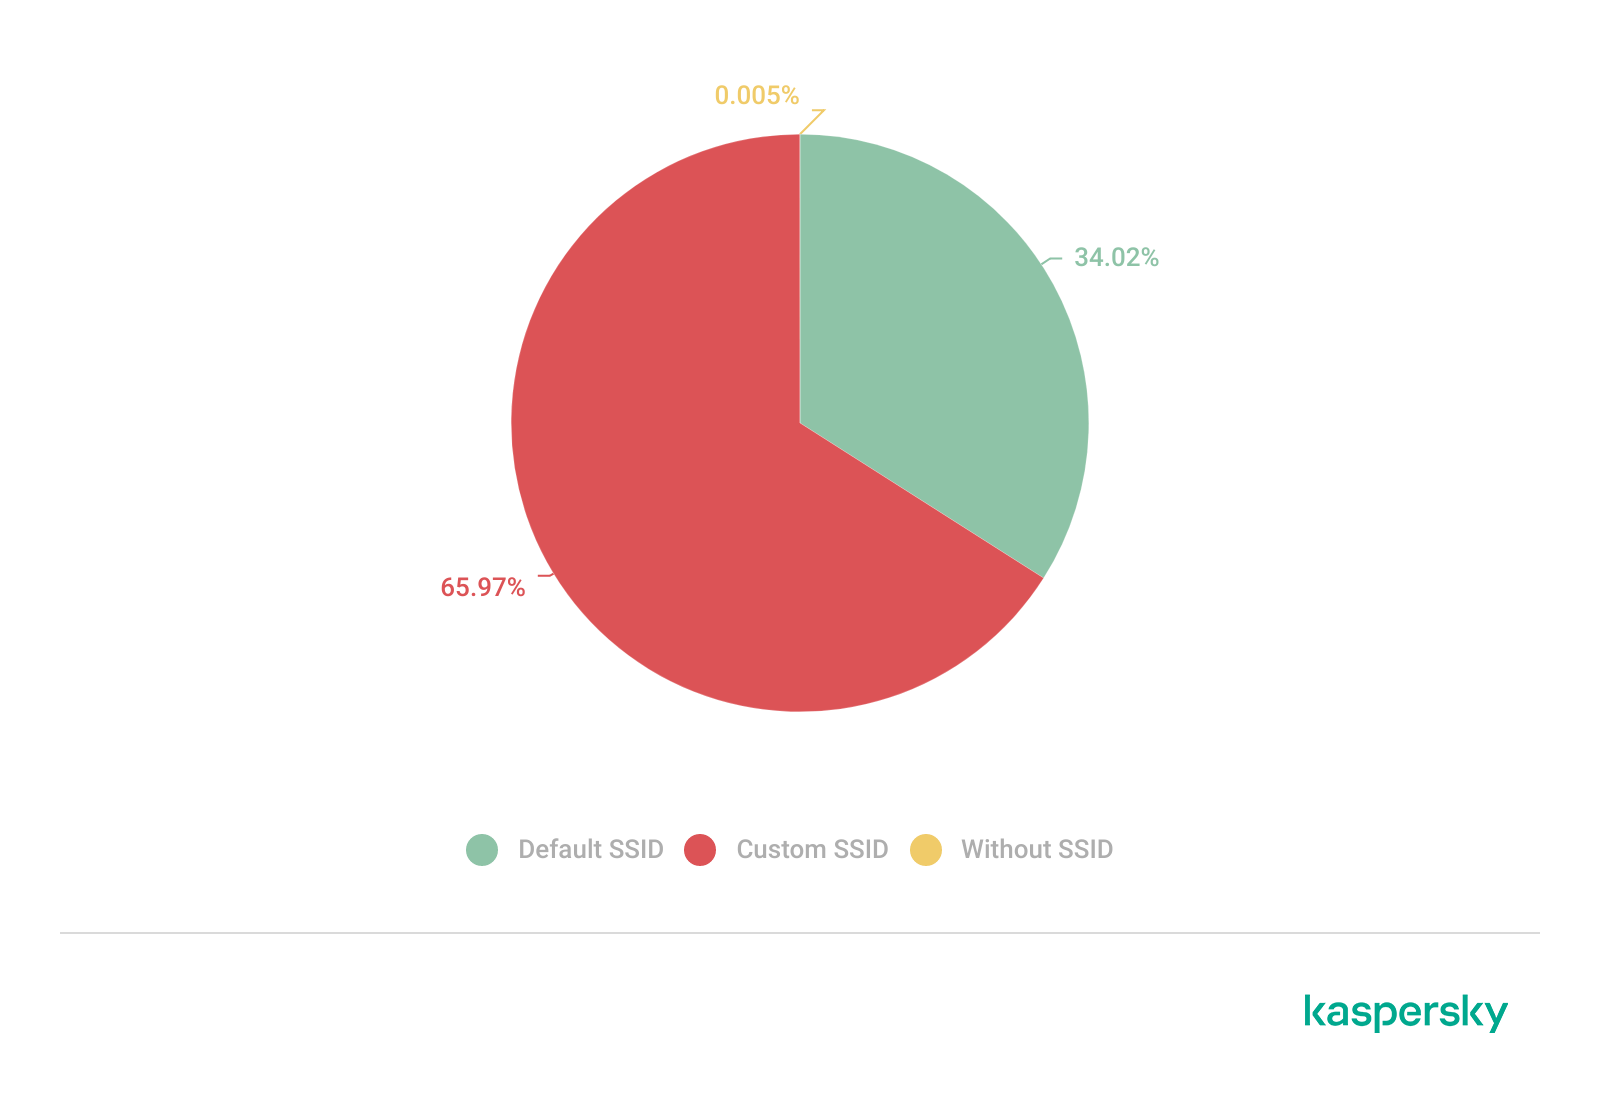
Approximately 34% of the detected networks retained the default SSID naming conventions provided by the manufacturer or ISP, while 66% used customized identifiers.
Distribution of SSID naming conventions (download)
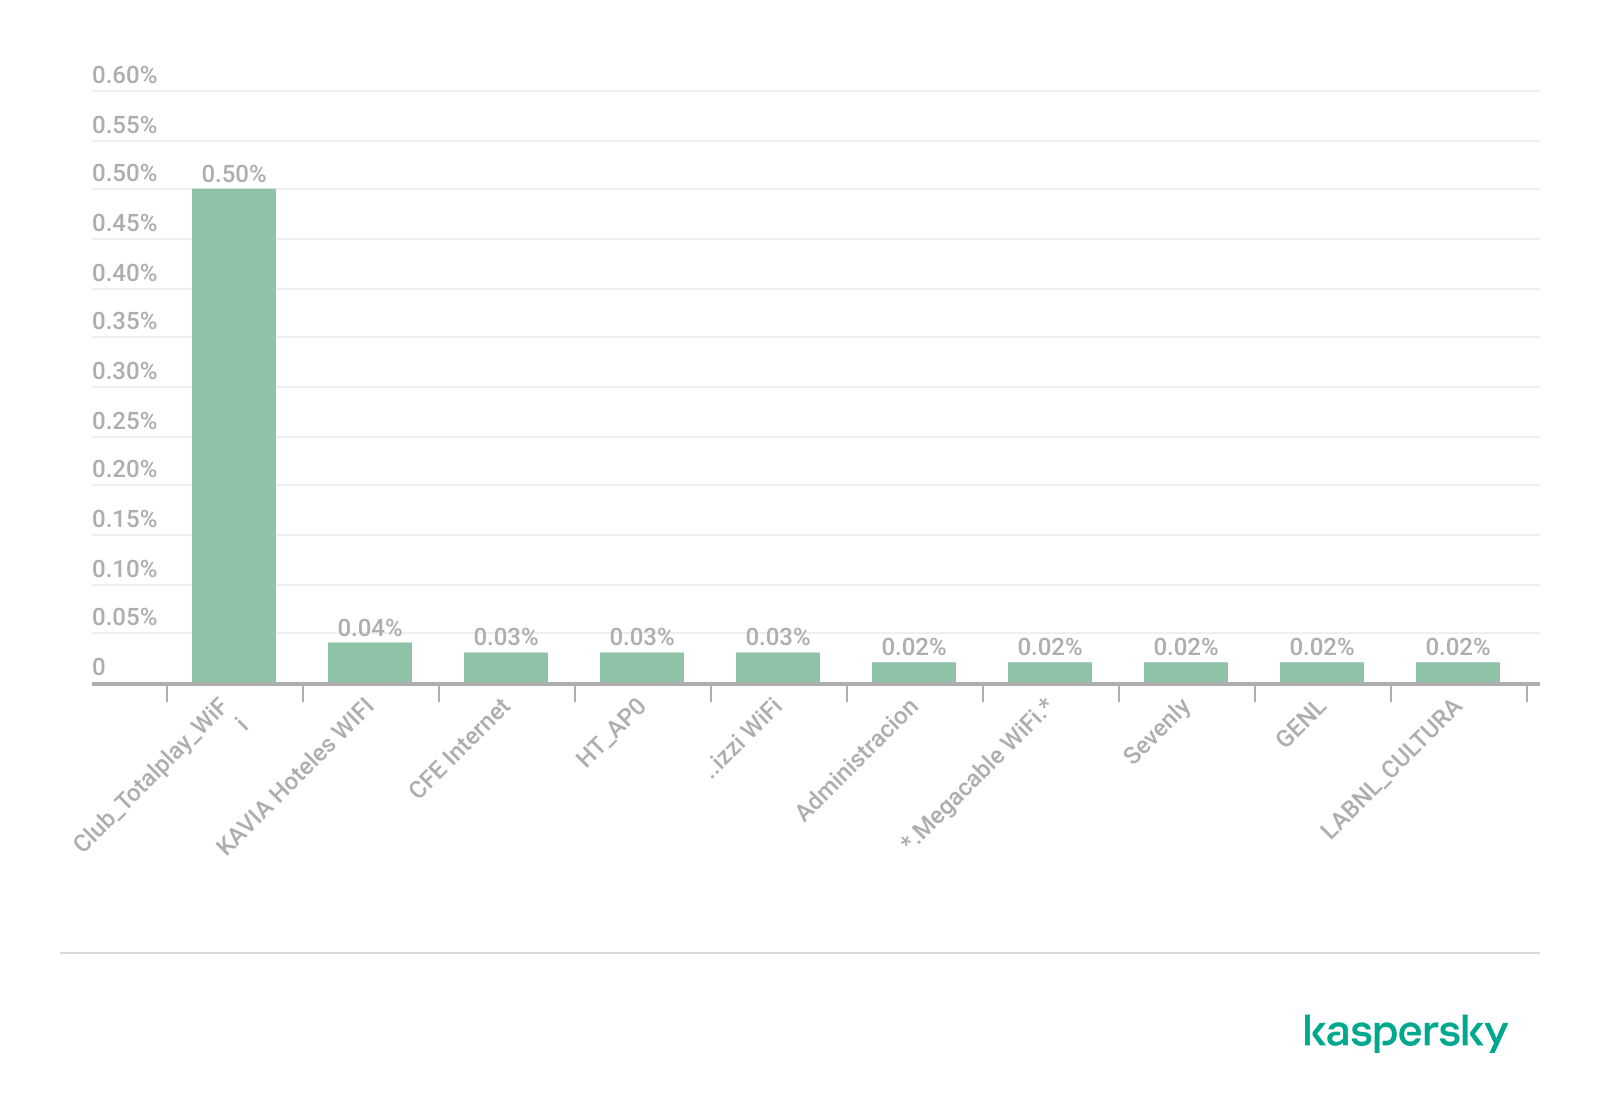
Several recurring SSID naming conventions associated with ISP-provided deployments were identified in the three cities. The most frequently observed patterns include identifiers such as “Club_Totalplay_WiFi”, “izzi WiFi”, and “Megacable WiFi”, which suggests extensive standardization of wireless infrastructure deployment. Additionally, we observed distinctive location-specific SSIDs in each area of analysis, such as “XXXX-Internet para Todos-CDMX” or “RED JALISCO”.
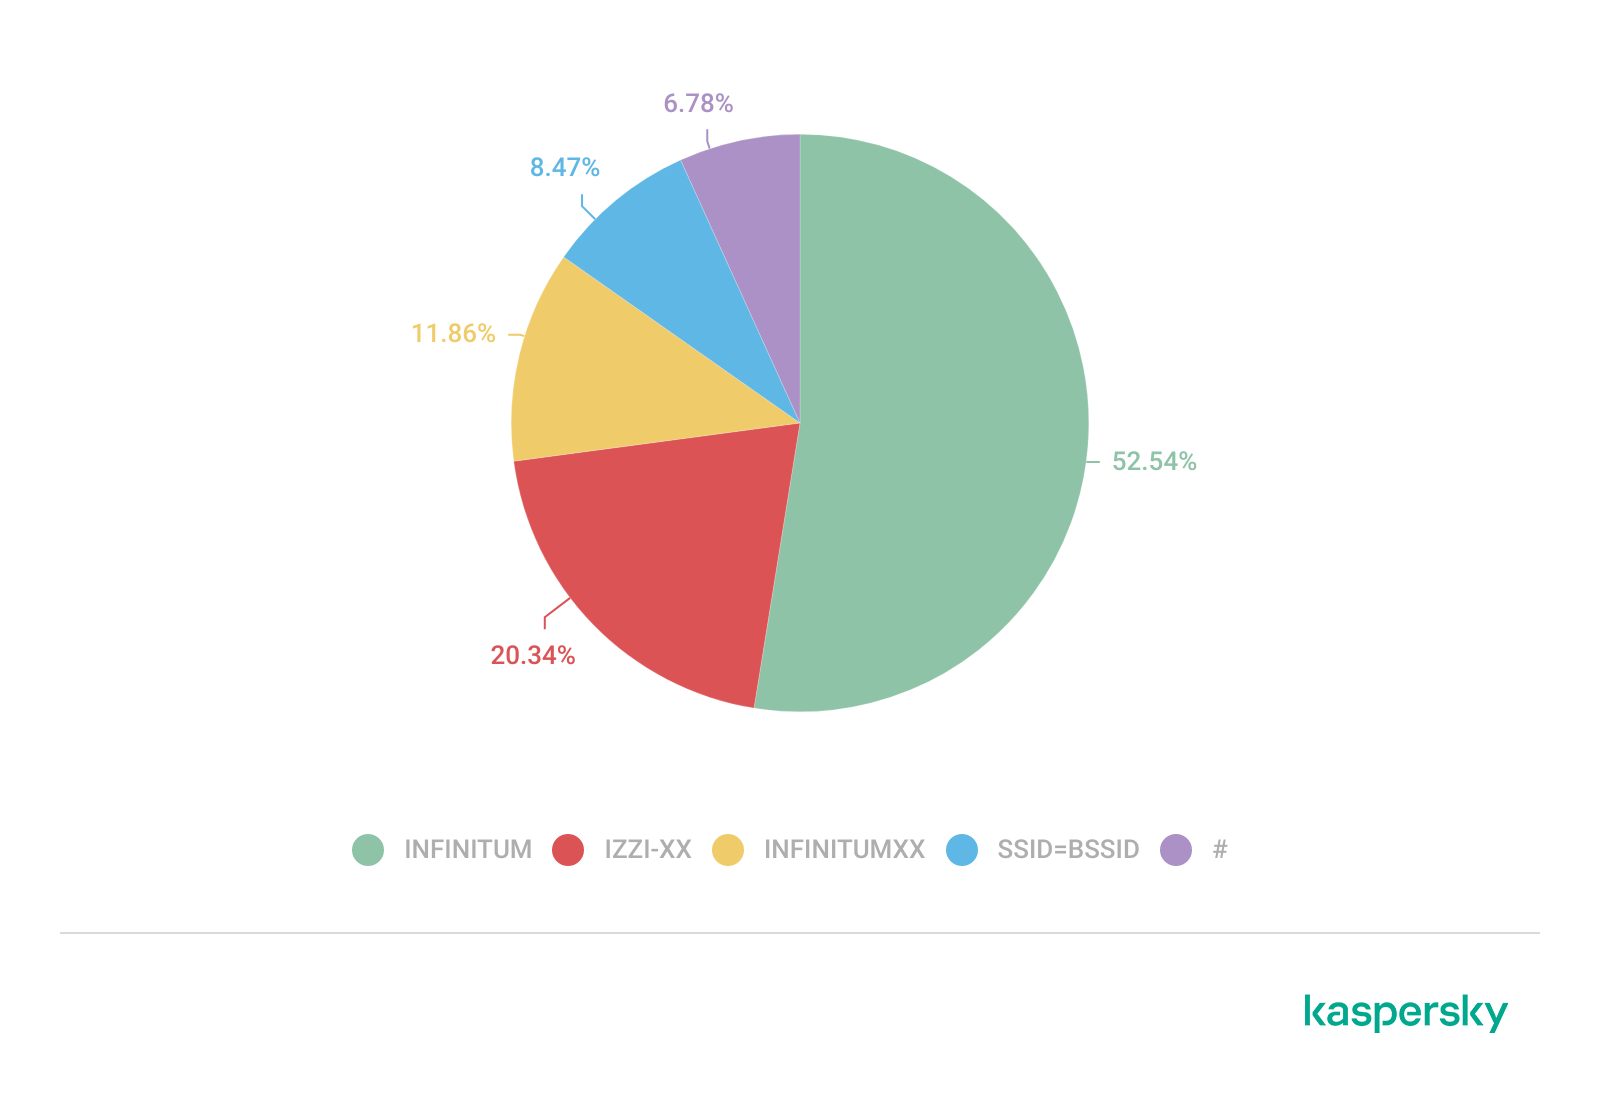
Sequential SSID naming structures were also identified during the analysis. Patterns such as “INFINITUMXX” and “IZZI-XX” suggest automated ISP deployment and large-scale deployment strategies.
We identified 33 unique sequential naming structures among the 137 sequential SSIDs in total, representing approximately 0.16% of the detected wireless networks.
The following graph shows the top five sequential SSID patterns found in the largest number of networks:
Five most frequently observed sequential patterns (download)
Several customized SSIDs contained personal or organizational identifiers, including family names, professions, addresses or internal department references. Although personalized SSIDs may simplify local network identification for users, they may also expose sensitive information that could be useful for social engineering, physical targeting, or organizational profiling.
BSSID-derived SSID
During the analysis, multiple networks were identified that used the physical MAC address of a Wi-Fi access point (BSSID) as the visible SSID. This practice exposes hardware-level information that could facilitate vendor fingerprinting and targeted reconnaissance activities.
The organizationally unique identifier (OUI) contained in the first bytes of the BSSID identifies the equipment manufacturer. Threat actors can correlate exposed manufacturers with device-specific vulnerabilities.
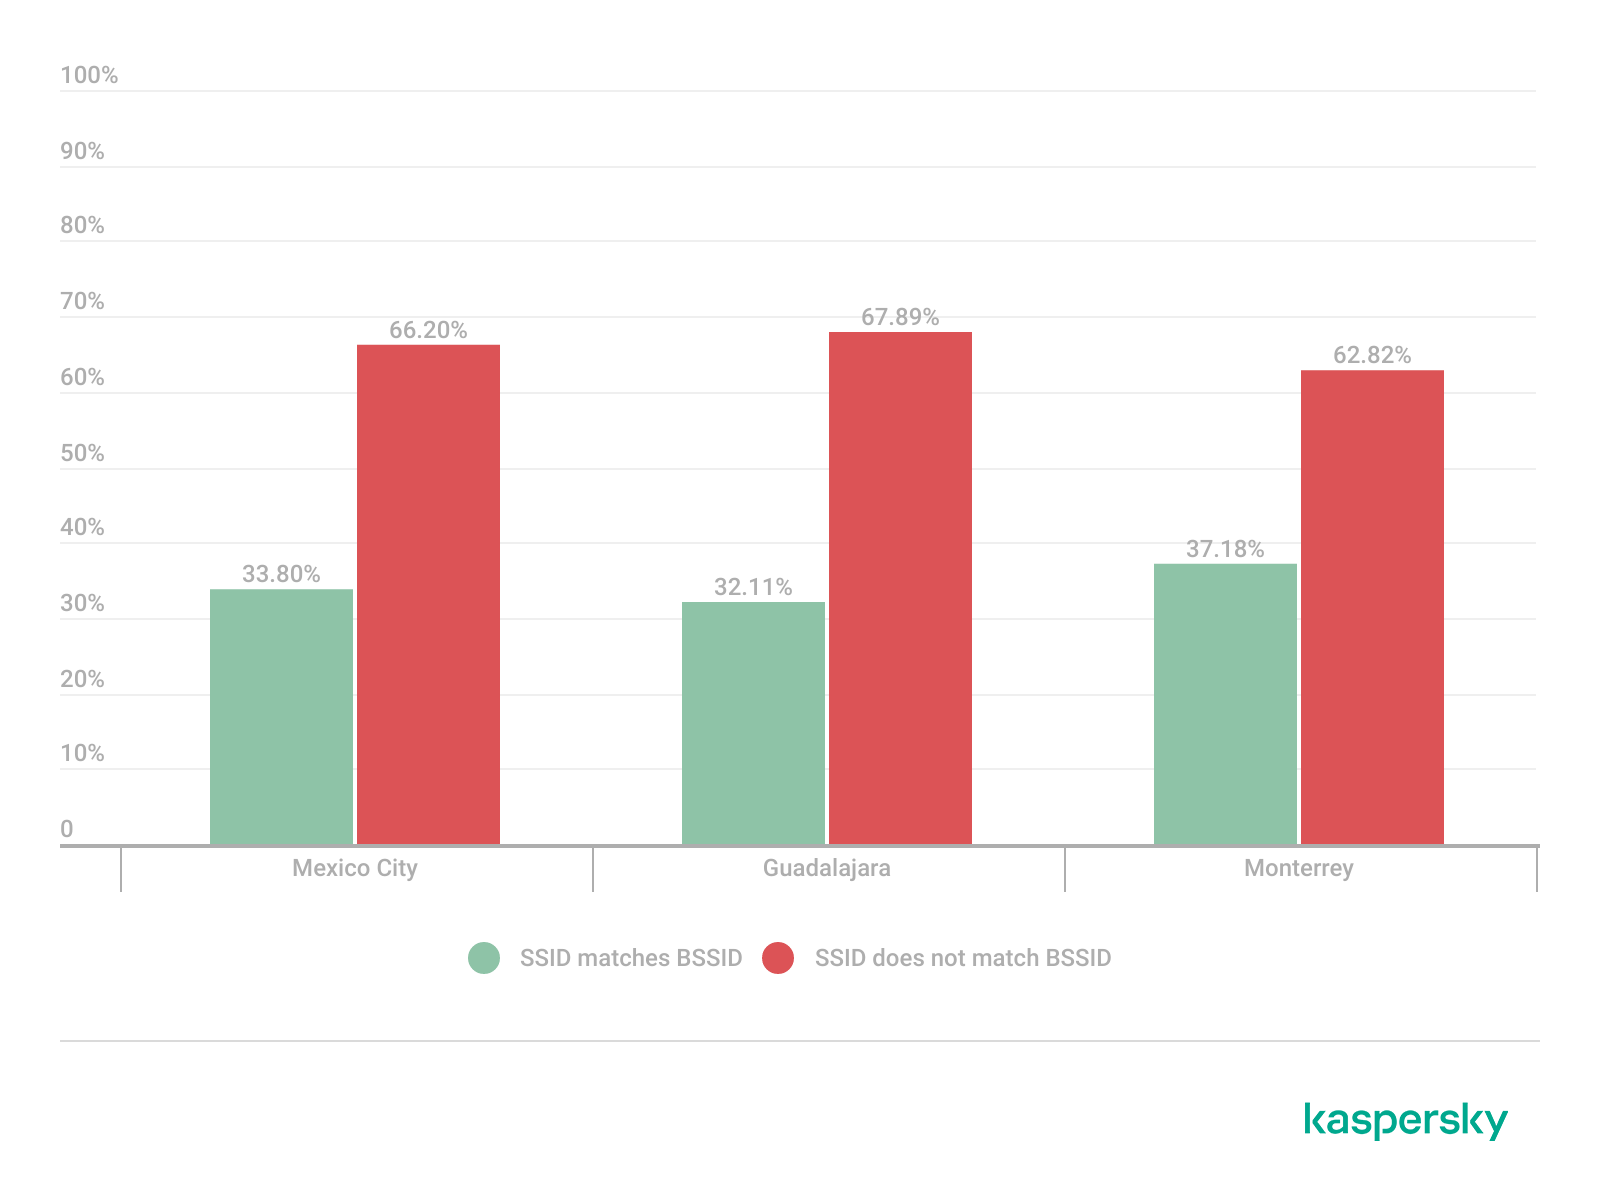
Notably, we found that more than 30% of networks in all three cities reuse the MAC address as the SSID.
Default router configurations and ISP deployments
We performed wireless infrastructure profiling to identify the most common wireless equipment manufacturers and ISP deployments across the three locations.
Large-scale ISP deployments frequently use standardized wireless configurations and vendor-specific hardware platforms. Identifying dominant manufacturers and ISP naming conventions can provide insight into infrastructure and deployment practices facilitating the mapping of standardized attack surfaces.
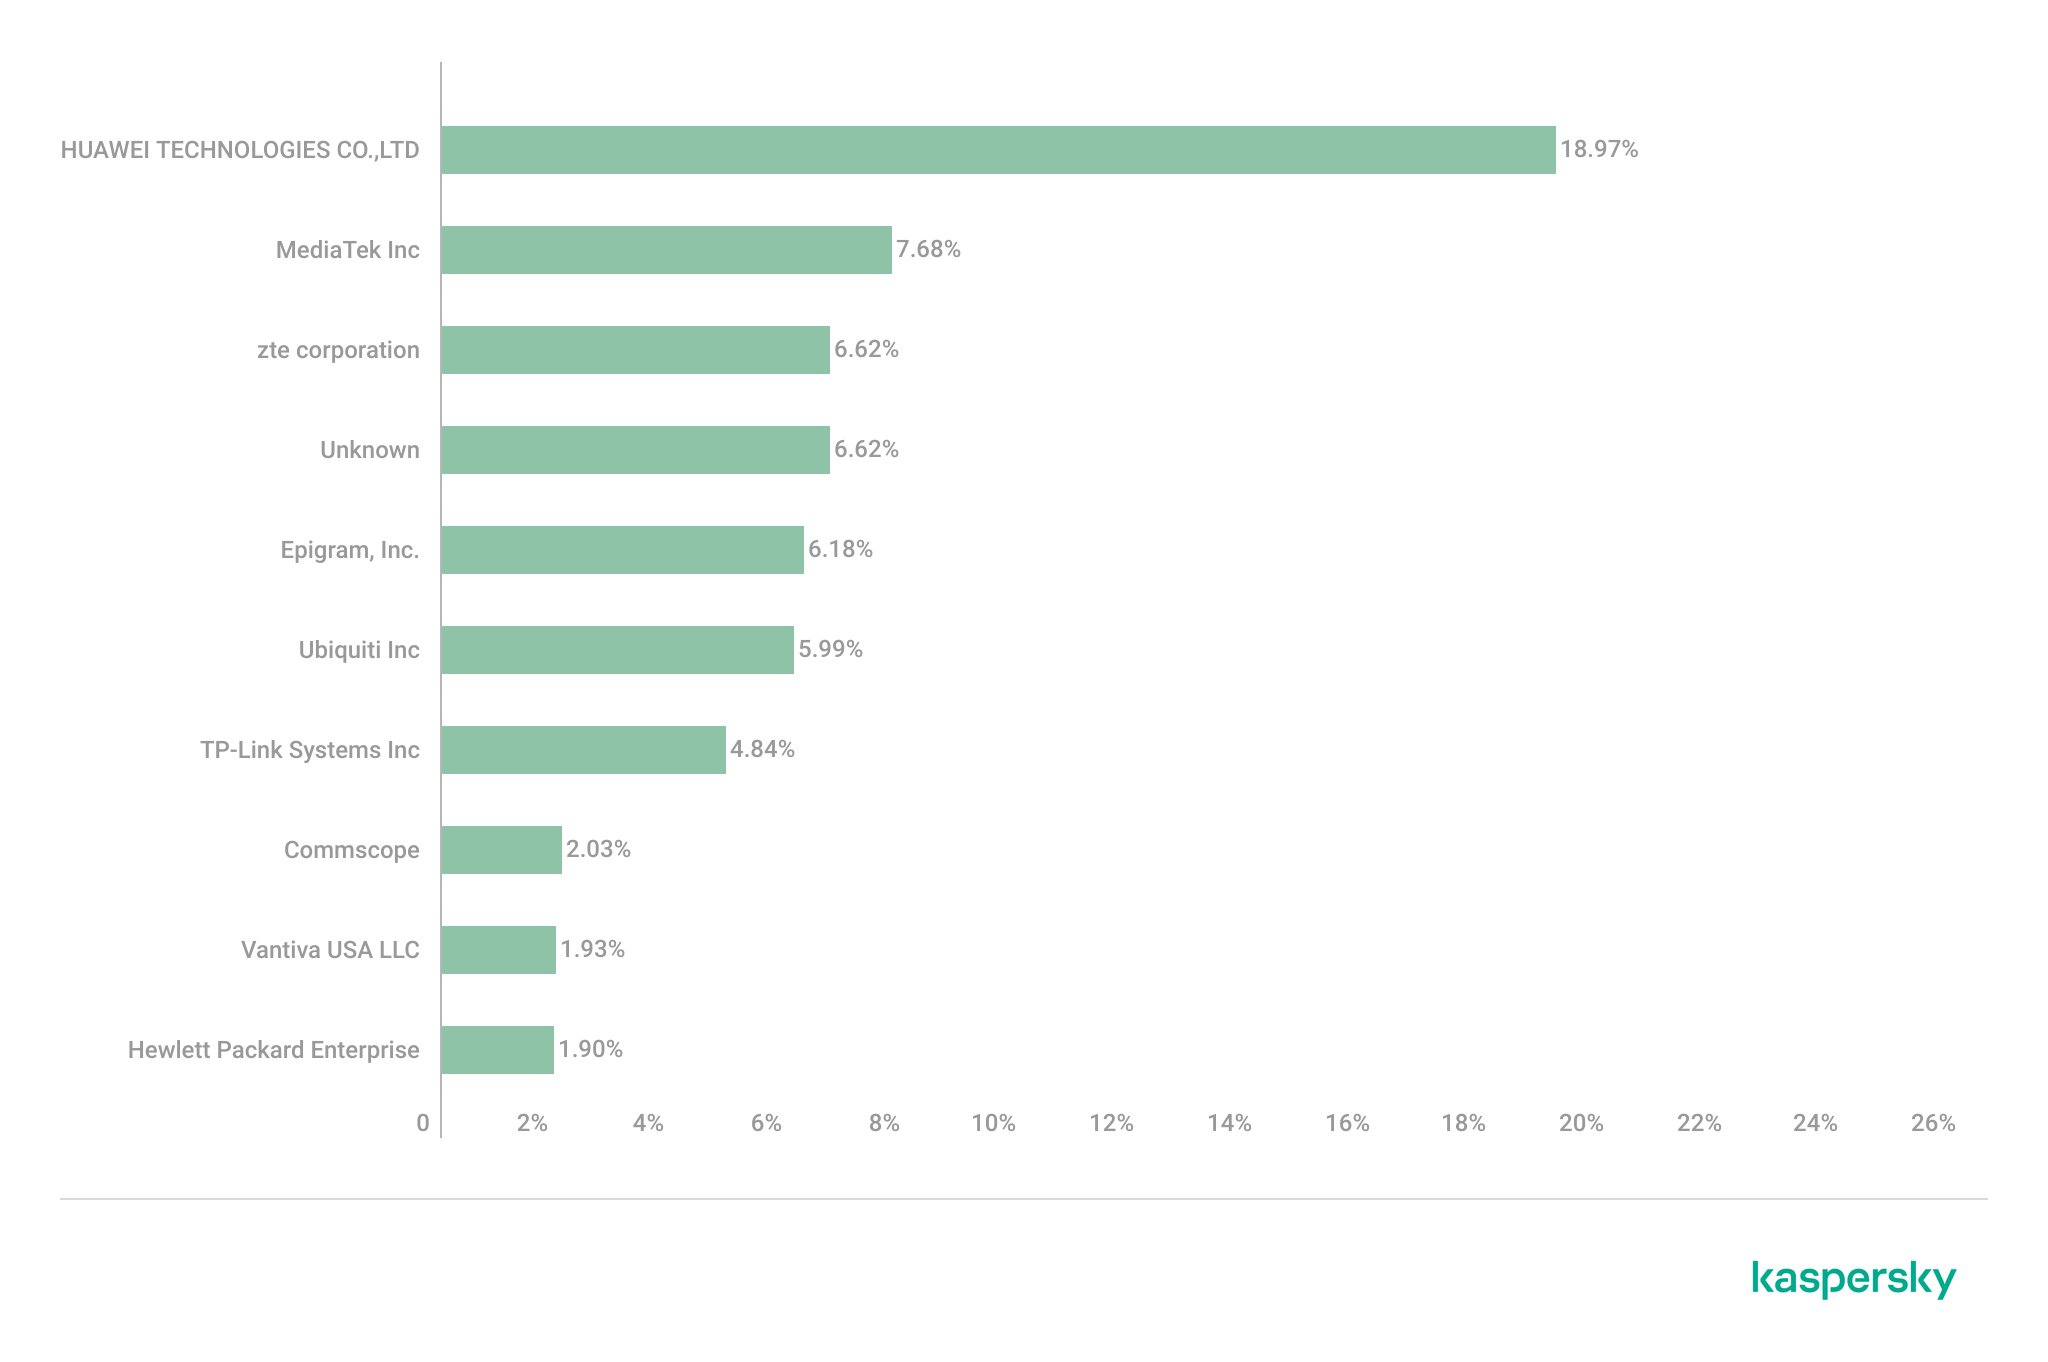
The following figure shows the distribution of the most commonly used manufacturers.
Most frequently observed wireless equipment manufacturers (download)
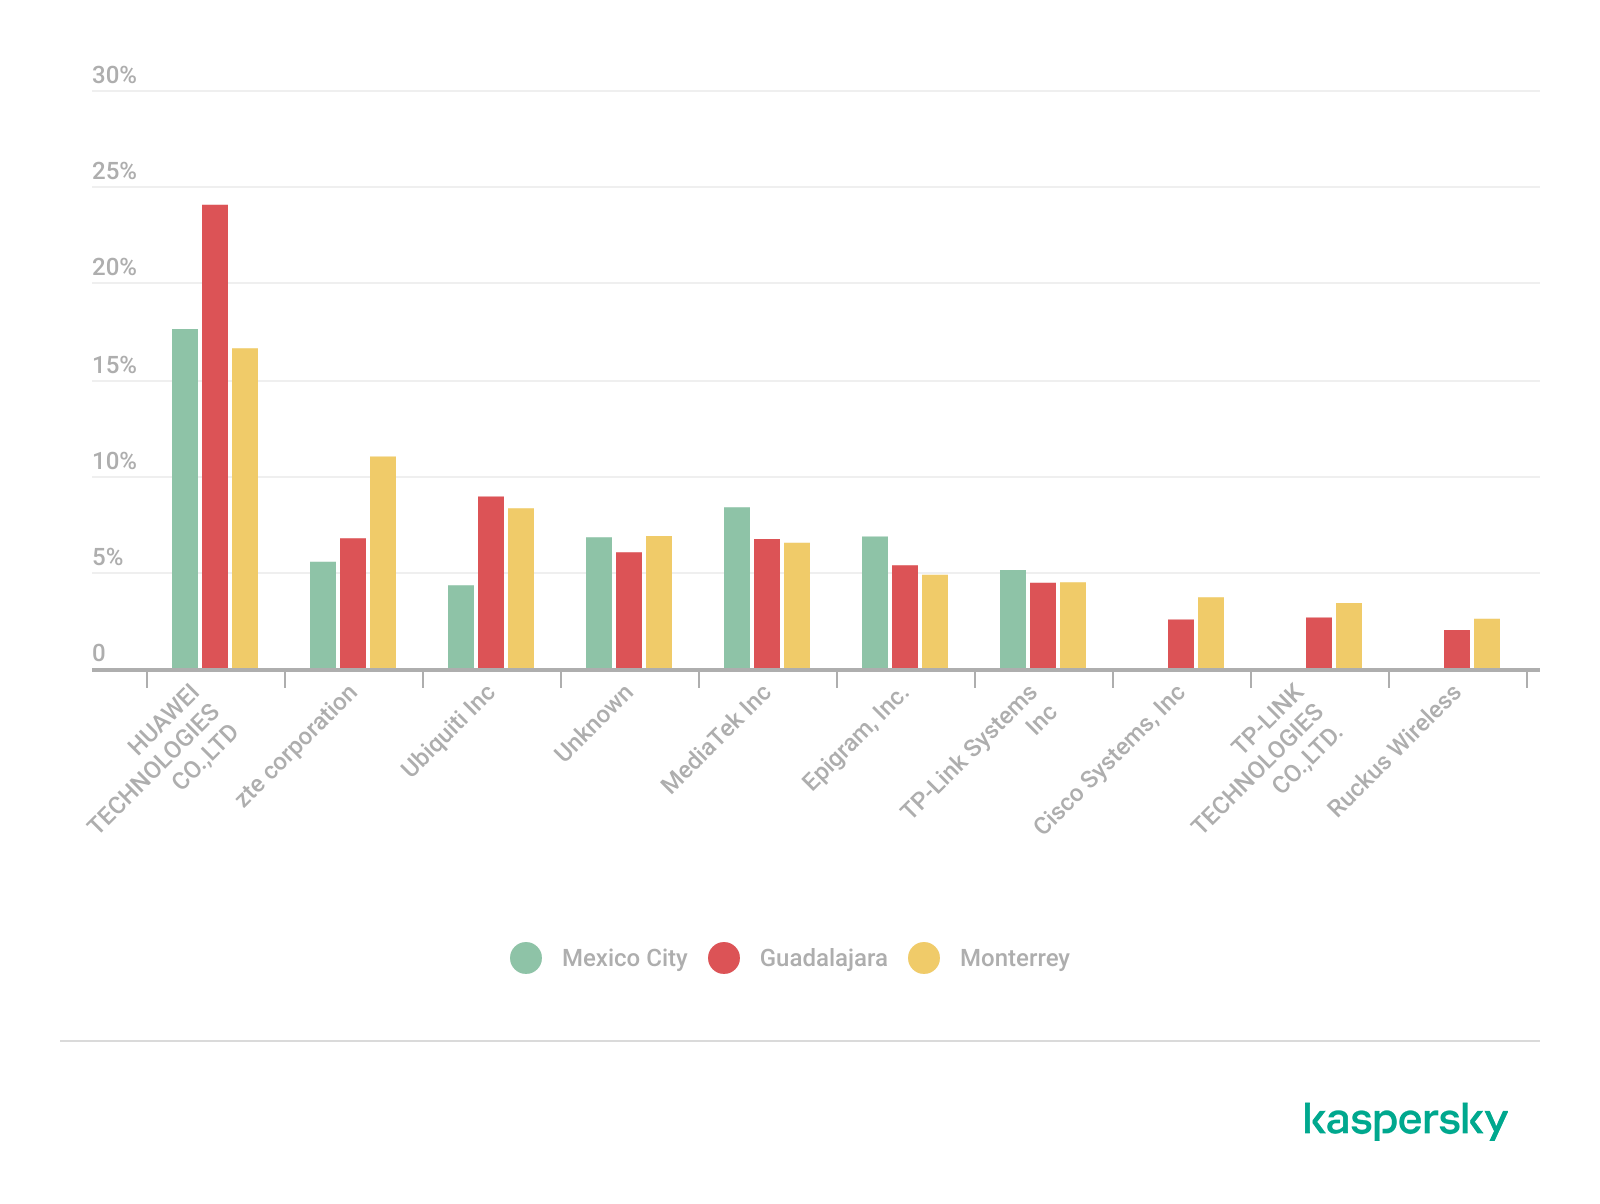
The manufacturer analysis revealed a strong concentration of wireless infrastructure among a limited number of vendors. Across the three locations, Huawei Technologies, MediaTek-based devices, and other manufacturers’ equipment that is distributed through ISP channels represented a significant portion of the detected deployments. Mexico City had the most diverse infrastructure, while Monterrey and Guadalajara had a greater concentration of wireless equipment known as SOHO (small office/home office) or residential-grade hardware. The widespread presence of standard vendor platforms may facilitate infrastructure fingerprinting and large-scale targeting of known device-specific vulnerabilities.
Most frequently observed wireless equipment manufacturers across the three cities (download)
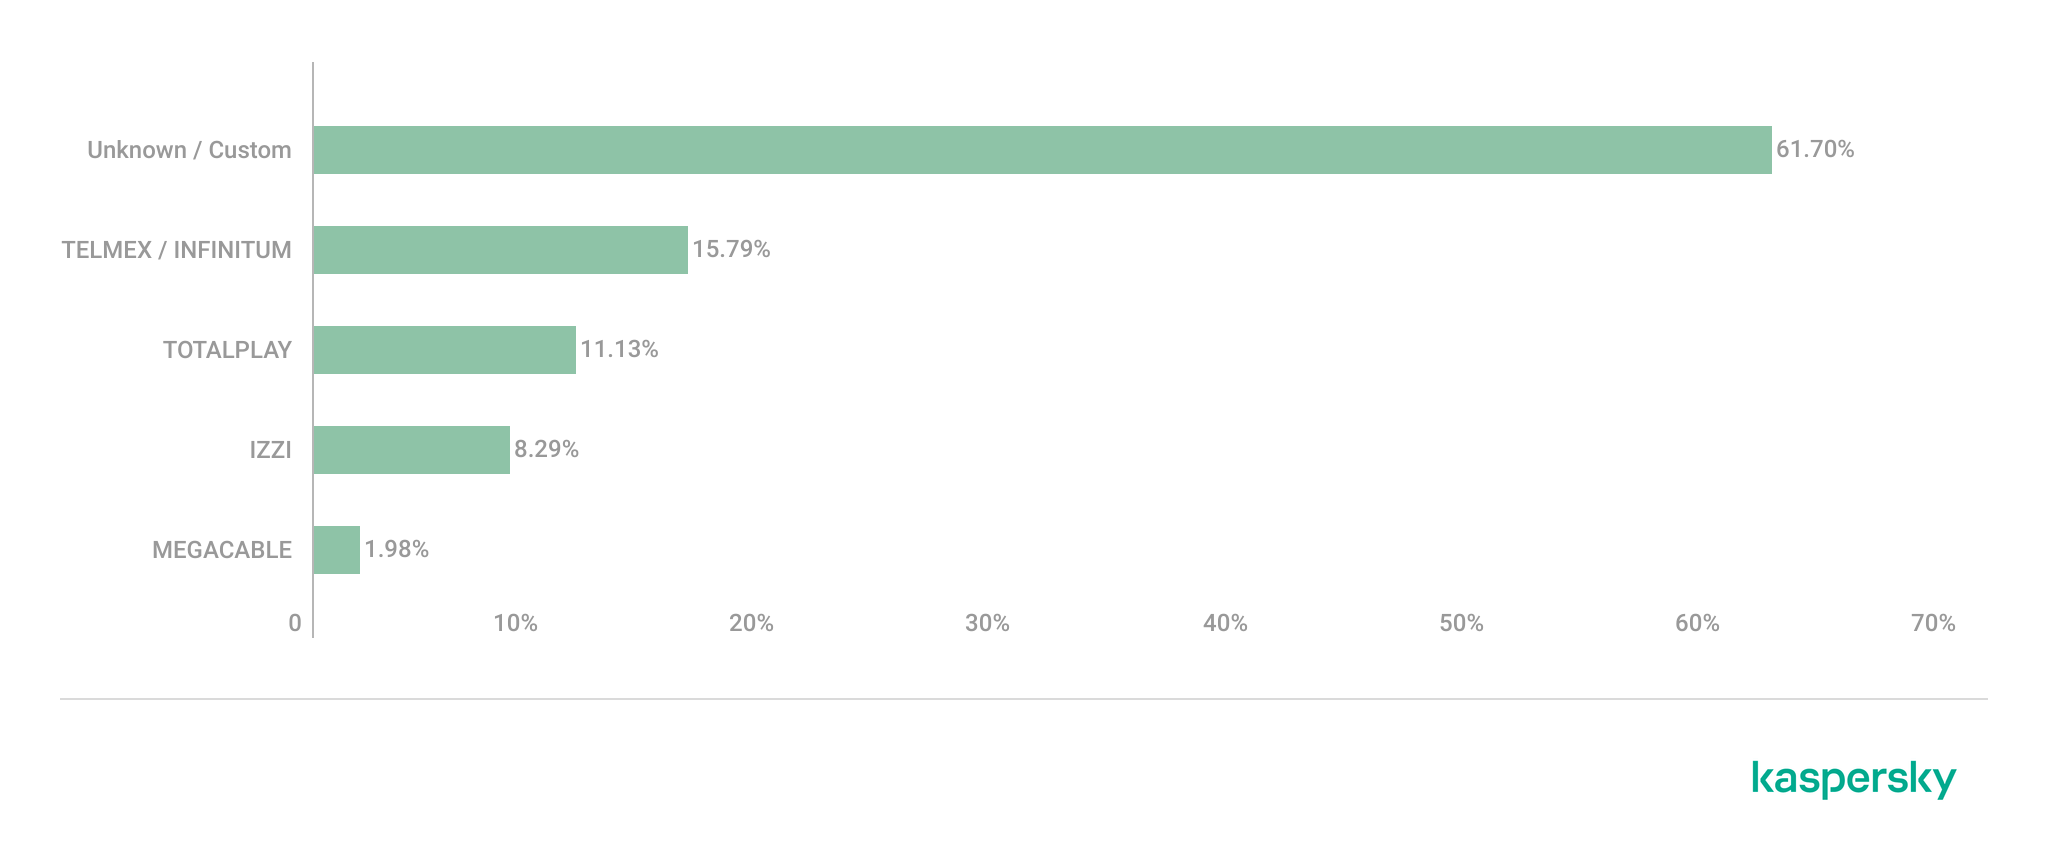
ISP deployments frequently exhibited standardized configuration patterns and recurring manufacturer identifiers. Our ISP deployment analysis revealed a high concentration of access points associated with major residential internet providers. Deployments associated with Infinitum, Totalplay and Izzi represented a substantial portion of the detected wireless infrastructure across all locations. These findings suggest a high degree of deployment standardization across networks associated with major residential internet providers. This observation was supported by the repeated presence of ISP-associated SSIDs such as “Infinitum”, “Totalplay”, and “Izzi”, combined with manufacturer identifiers frequently associated with consumer equipment, including Huawei, ZTE and other residential wireless equipment vendors.
It is important to note that, for this analysis, ISPs were primarily inferred from SSID naming conventions and manufacturer fingerprint data. A significant portion of the detected wireless networks fell into the “UNKNOWN/CUSTOM” category. This classification includes custom hotspots and networks whose naming conventions did not expose identifiable ISP-associated patterns. The findings suggest that many users and organizations (as we saw previously, approximately 66%) use custom network names, limiting direct provider attribution.
The following figure illustrates the distribution of ISP-associated wireless deployments in general.
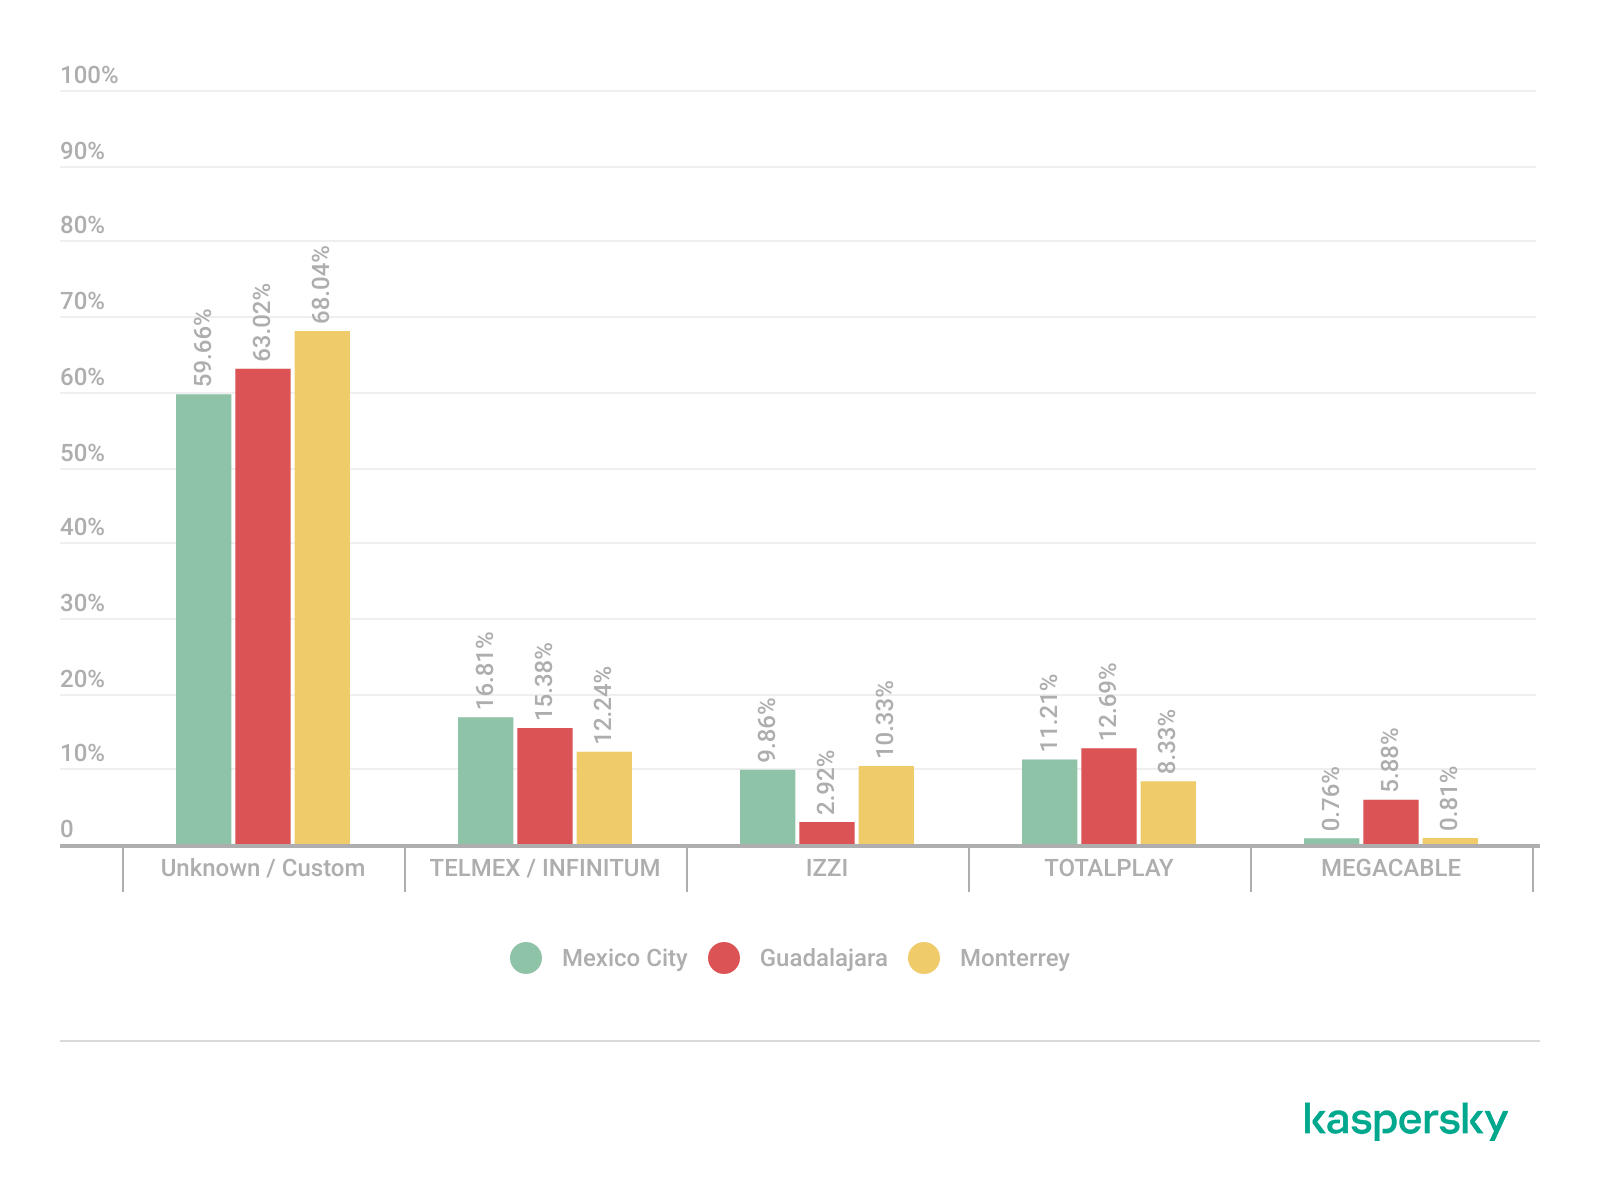
To better understand this distribution, we took the most frequently observed ISPs by city.
Most frequently observed ISPs across the three cities (download)
Frequency and signal characteristics
We also analyzed wireless signal characteristics to evaluate coverage quality, signal strength, and frequency band utilization in the three cities. In dense urban environments, signal quality and frequency spectrum distribution can affect wireless reliability, client connectivity, roaming performance, and overall network efficiency.
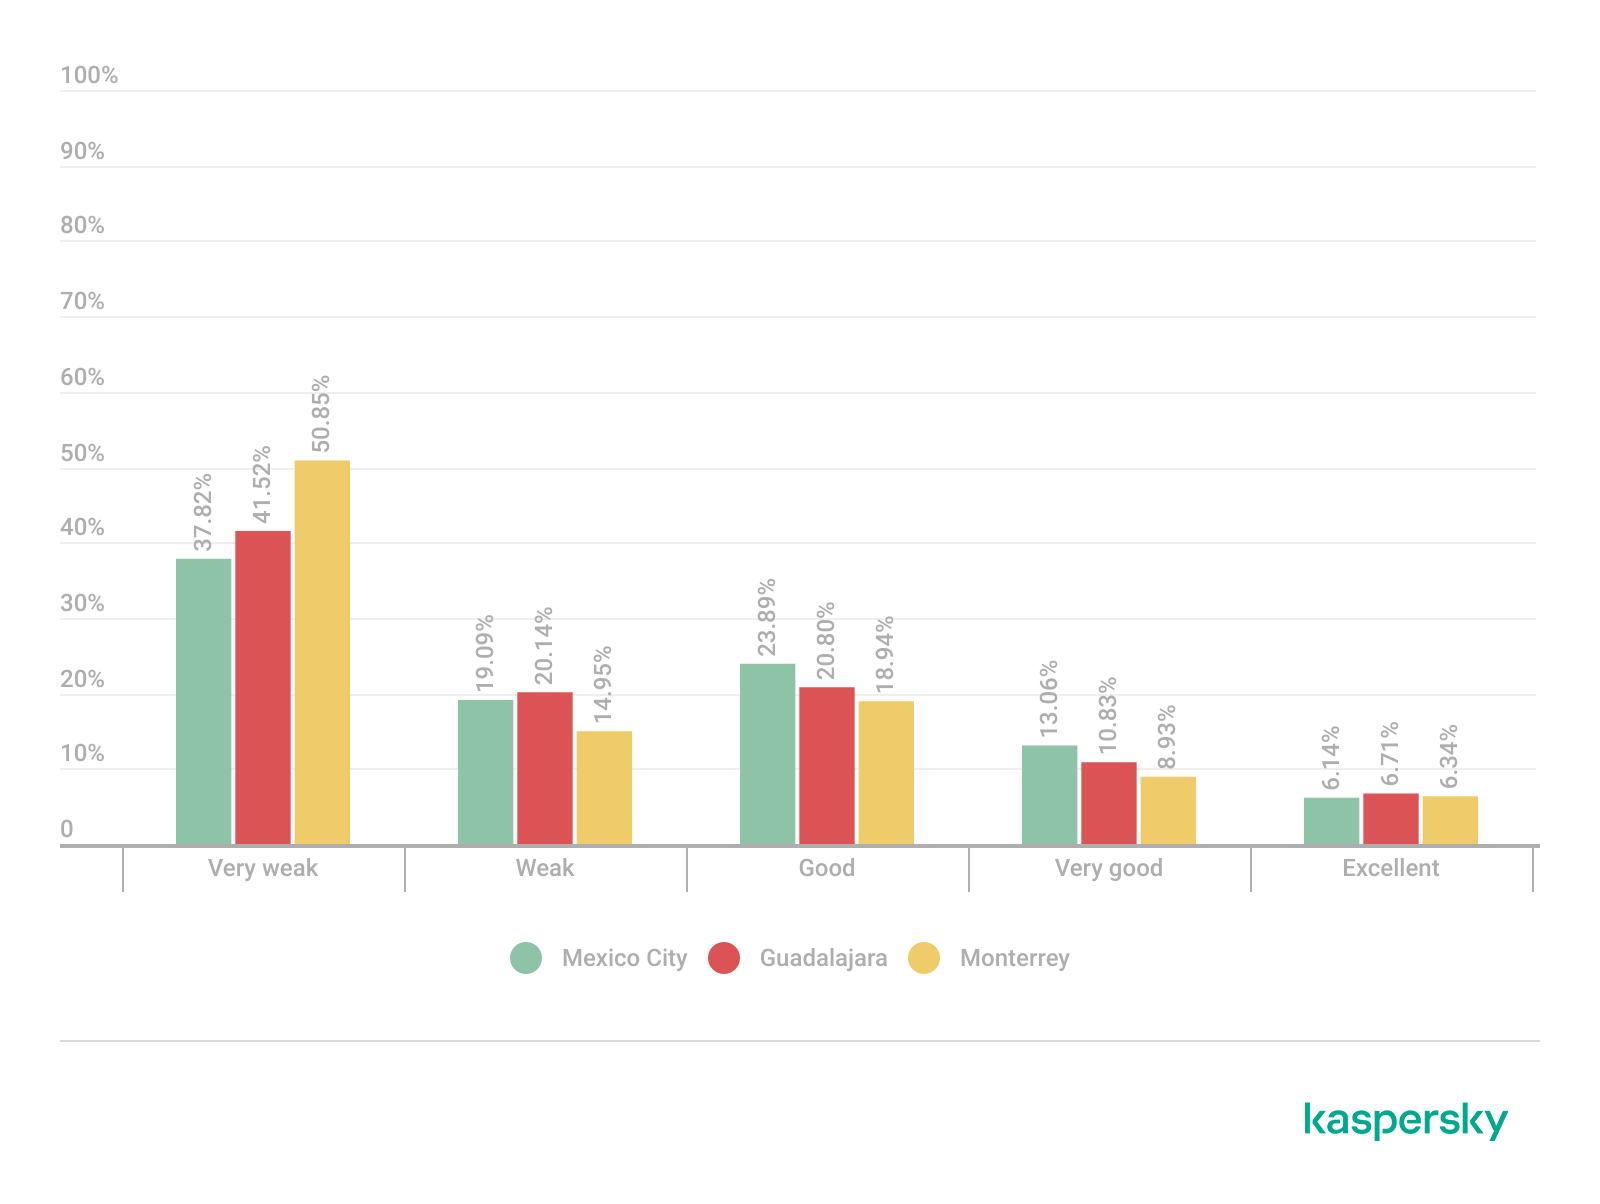
Signal quality analysis revealed that a substantial portion of the detected access points operated under weak or very weak signal conditions. Monterrey had the highest percentage of very weak signals, with approximately 50% of detected deployments. Similar patterns were observed in Guadalajara and Mexico City, suggesting high-density wireless environments with overlapping coverage areas. Only a limited percentage of networks were classified within the very good or excellent signal categories across the three locations.
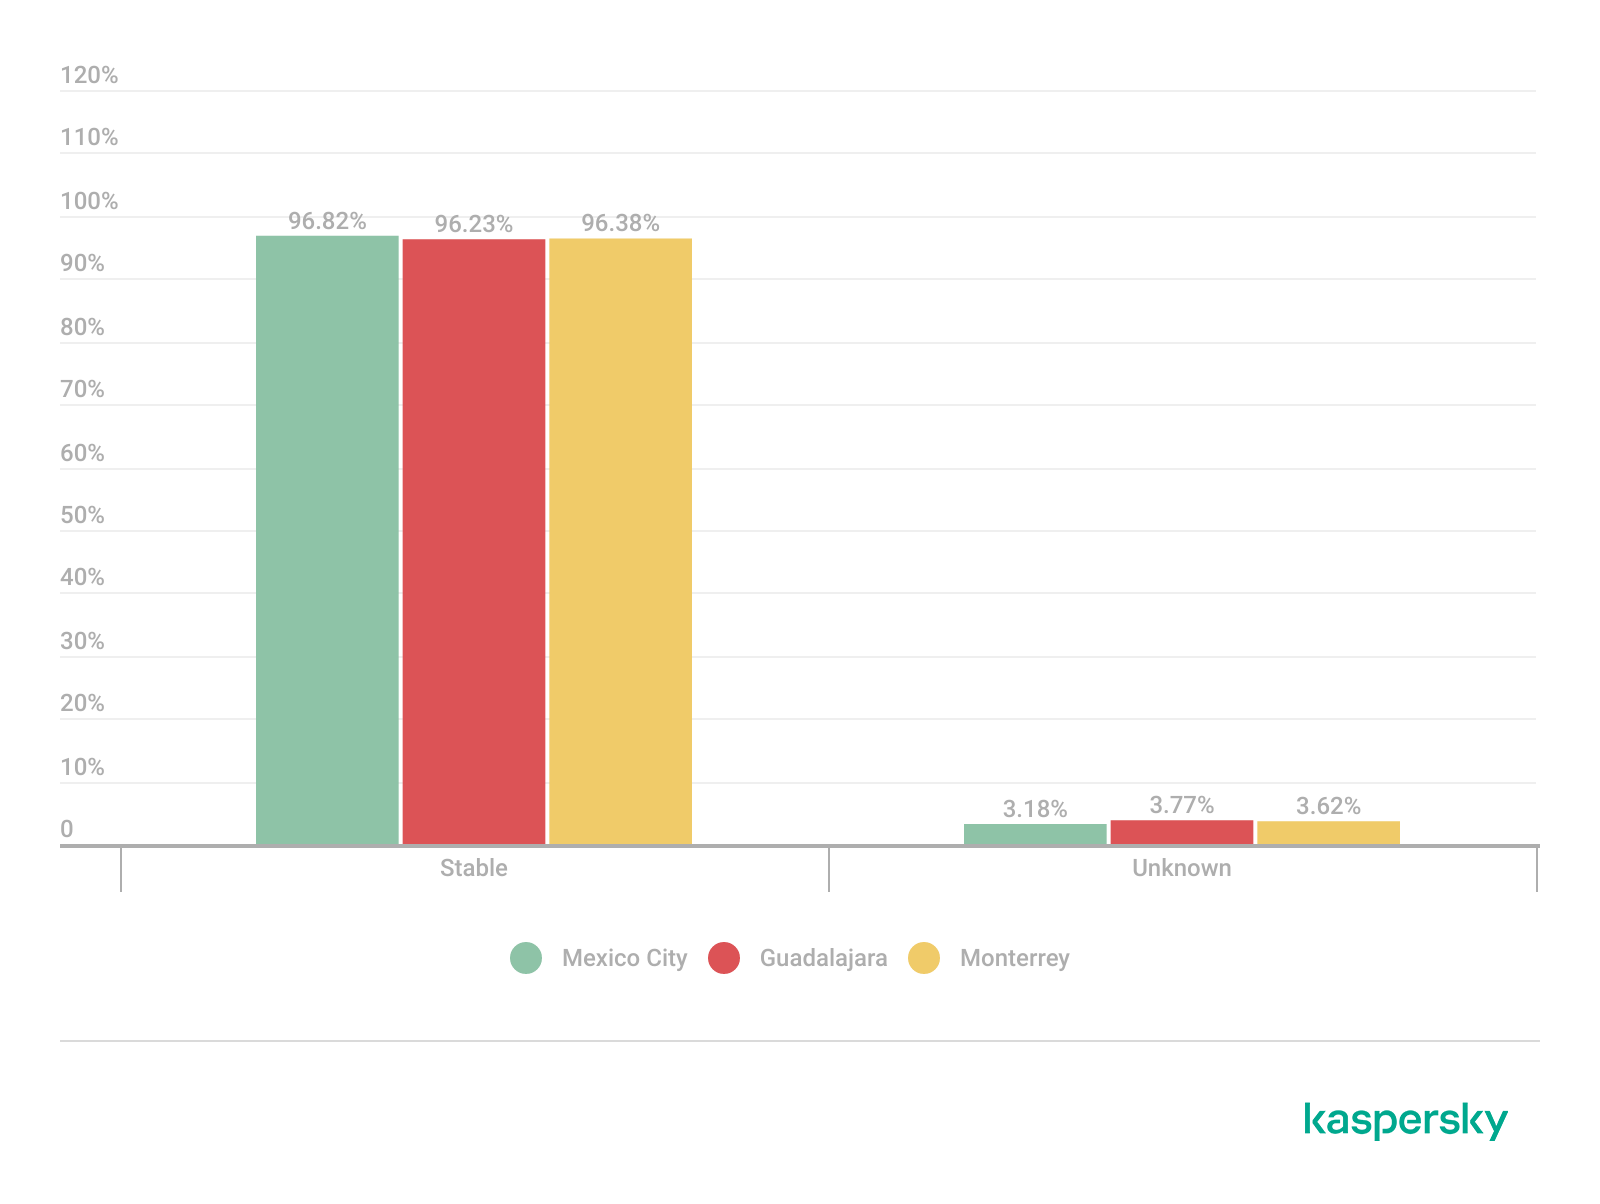
Signal stability analysis revealed that most detected wireless deployments exhibited stable beacon transmission behavior. More than 96% of the detected access points across all locations were classified as stable, while only a small percentage exhibited unstable or indeterminate signal behavior.
These findings imply that the majority of the wireless infrastructure observed during the assessment corresponded to permanently deployed access points rather than transient or intermittent wireless devices.
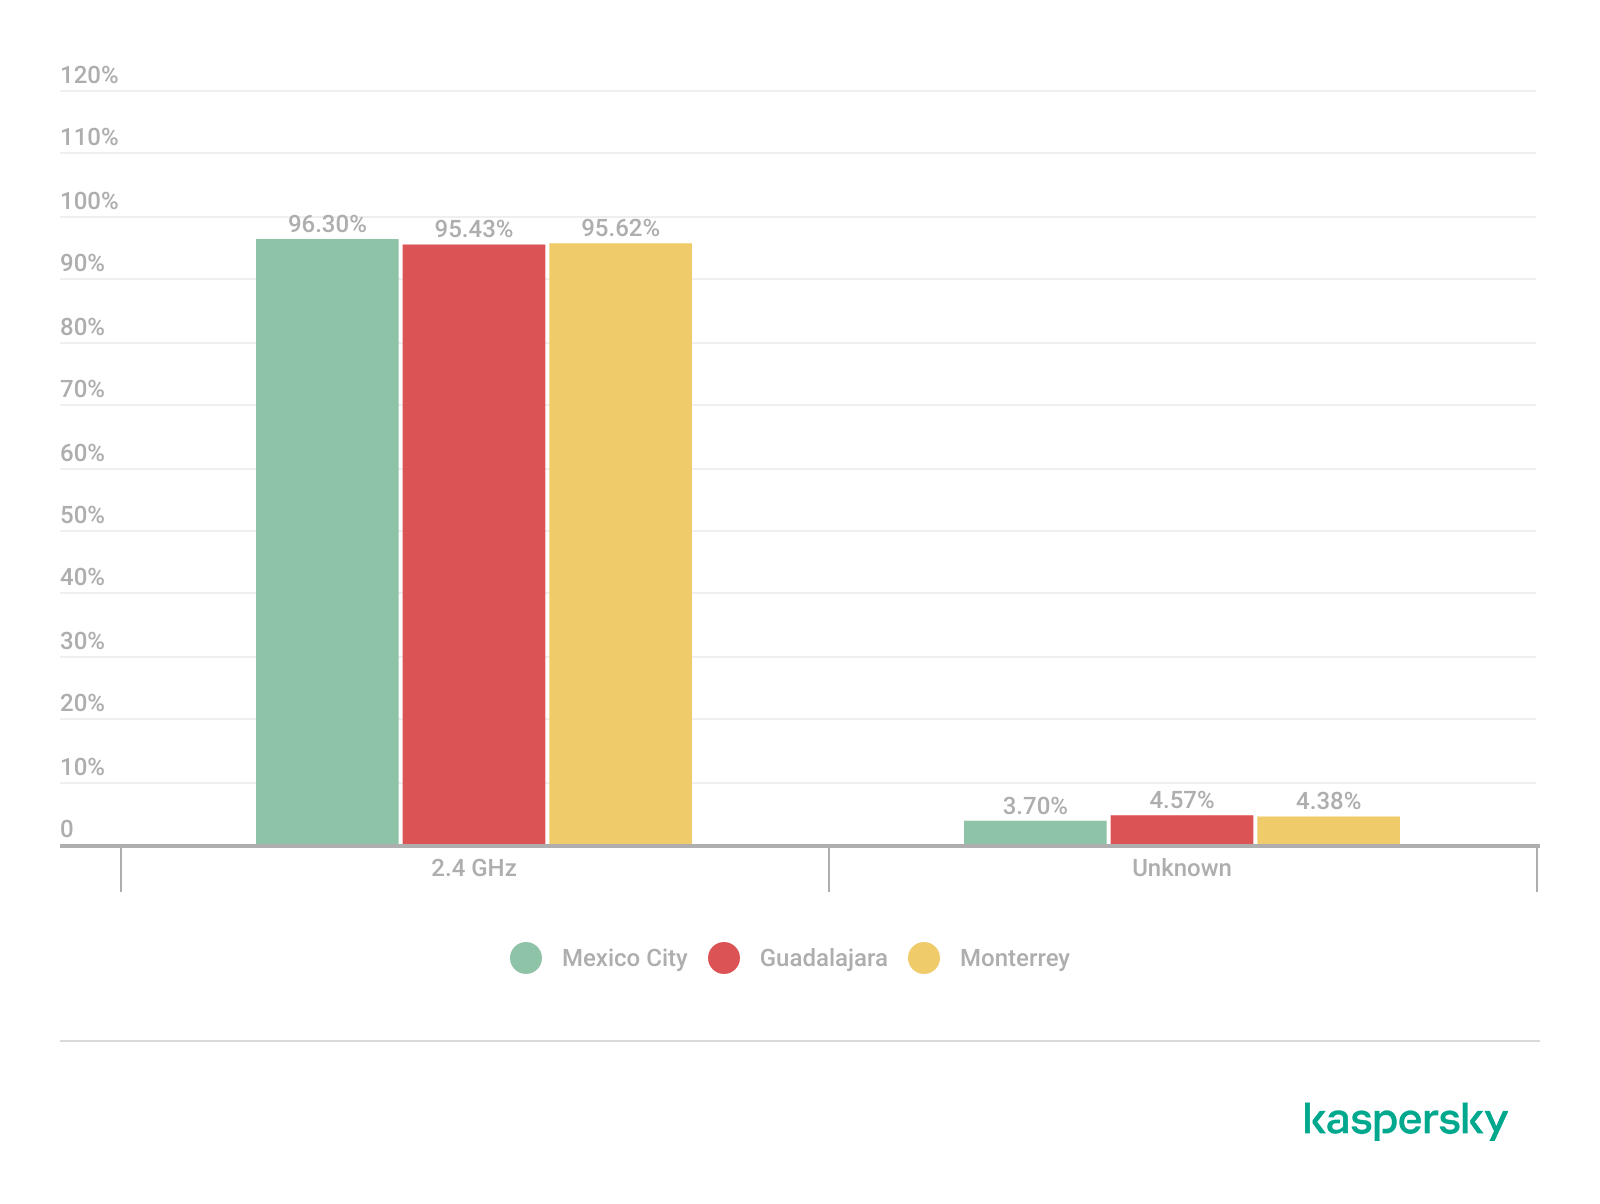
Frequency band analysis revealed the strong prevalence of 2.4 GHz wireless deployments across the three locations. More than 95% of the detected wireless networks operated within the 2.4 GHz spectrum, while only a small percentage of deployments were classified under the unknown or non-standard frequency categories. This uneven distribution reflects the continued prevalence of legacy-compatible wireless infrastructure and SOHO deployments.
These findings are consistent with dense urban wireless environments with large numbers of access points in restricted spectrum allocations.
Channel congestion and spectrum usage
Next, we analyzed wireless channel utilization to evaluate frequency spectrum congestion and channel allocation patterns across the three cities. Our analysis focused on the 2.4 GHz spectrum, where channel overlap and high access point density commonly produce interference and degraded wireless performance. In densely populated wireless environments, an excessive concentration of access points on a limited number of channels can lead to co-channel interference, packet collisions, reduced throughput, and degraded network stability.
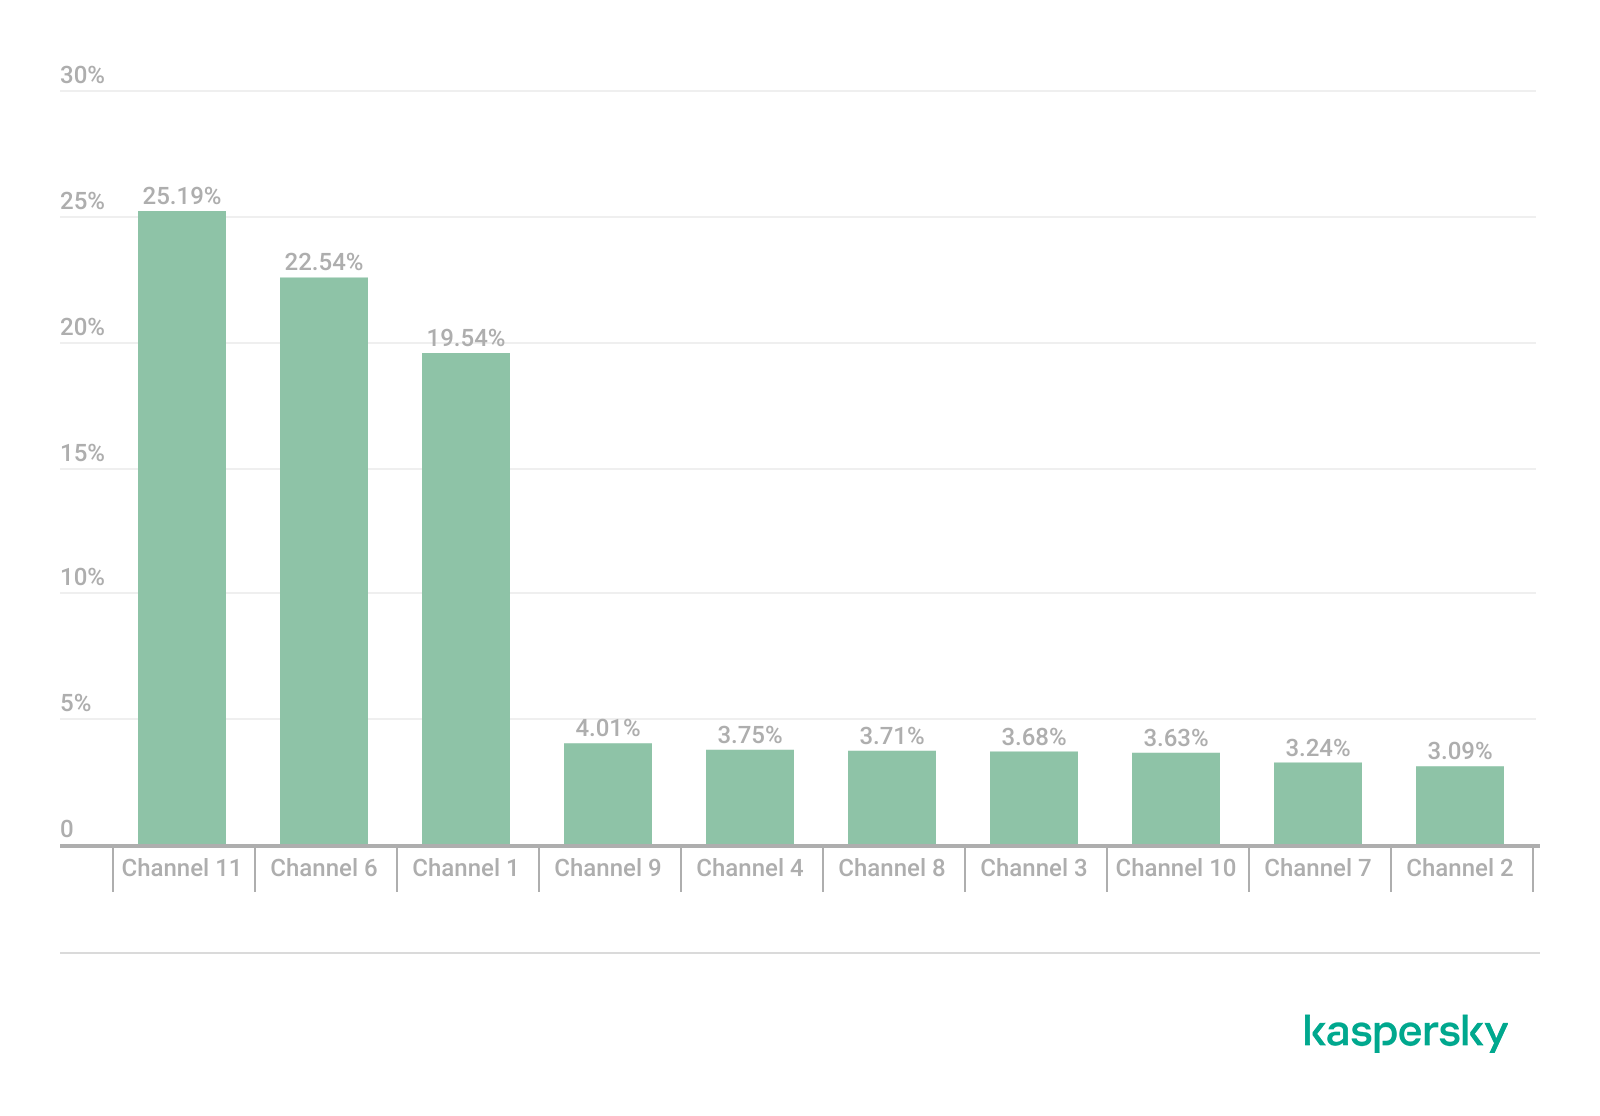
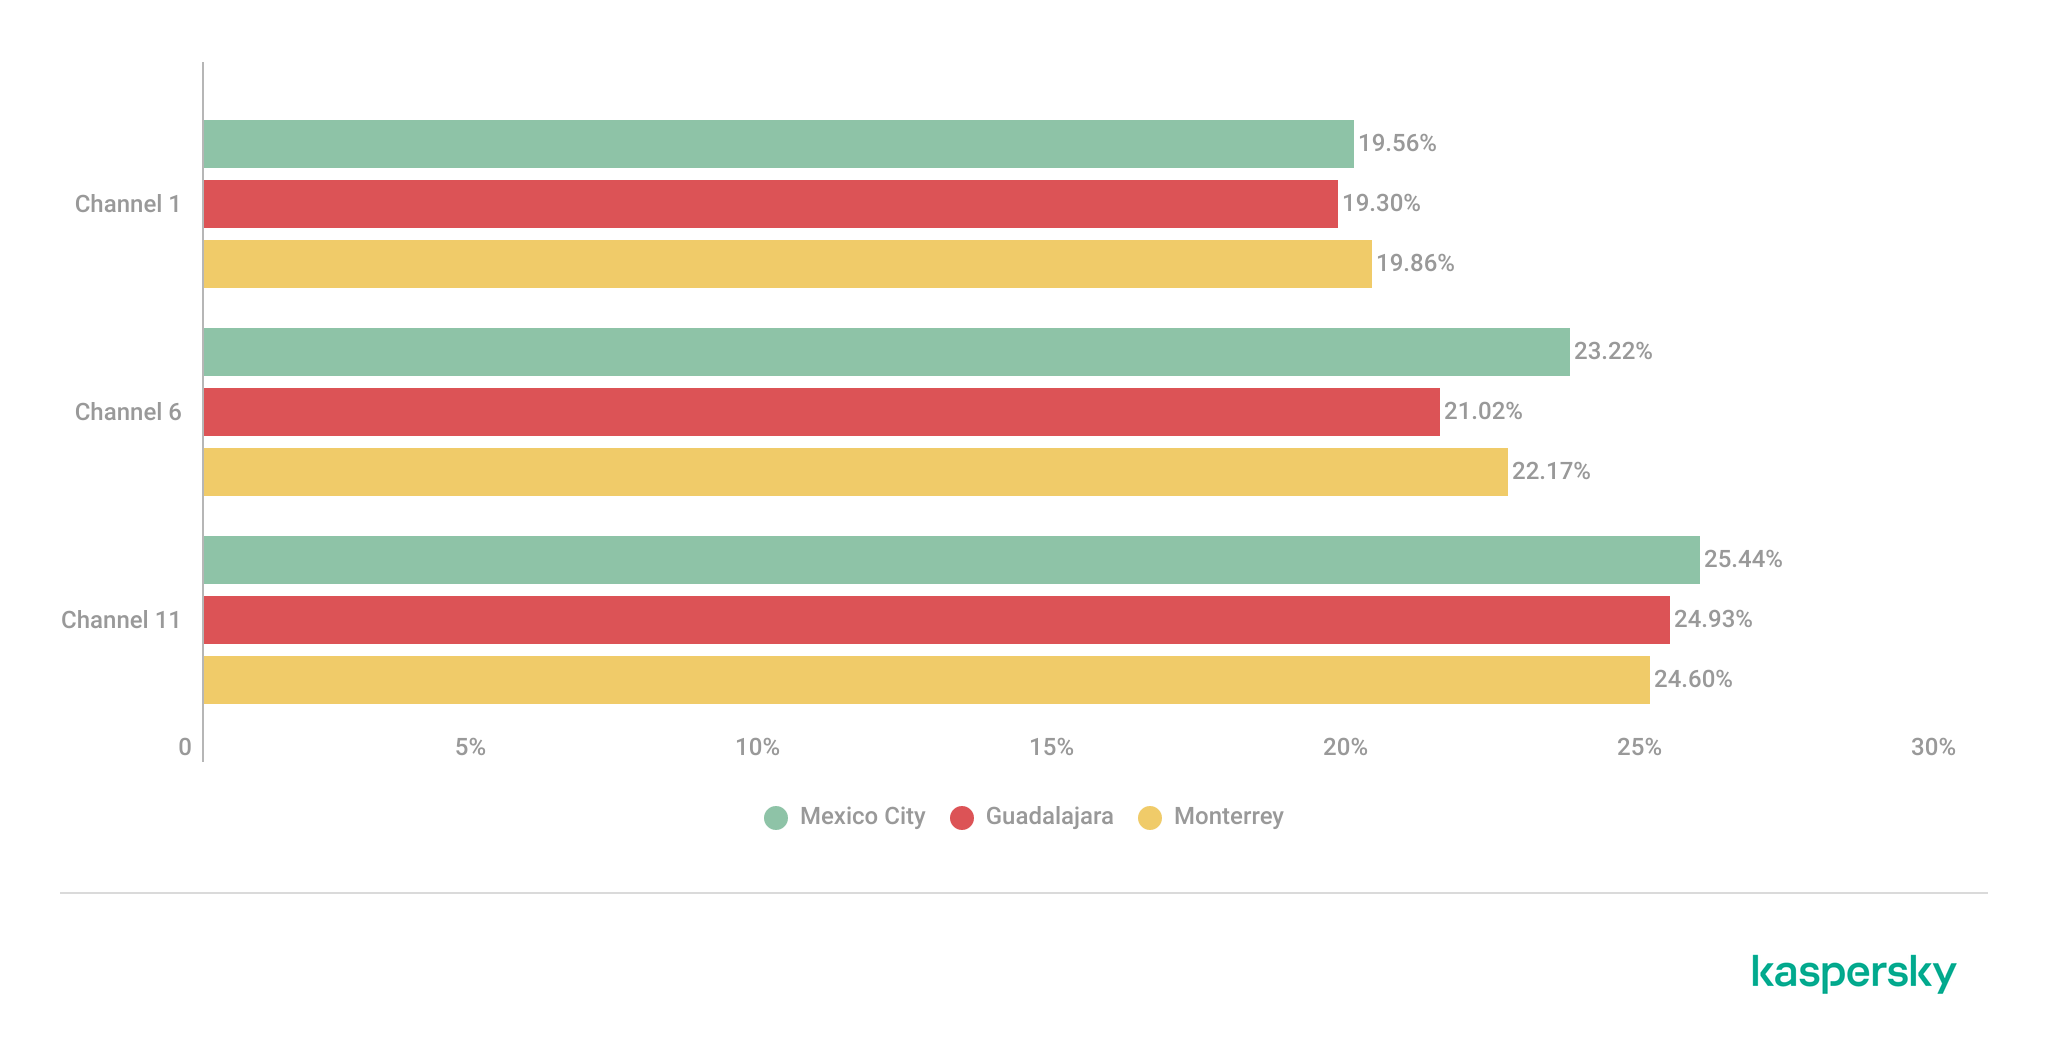
Spectrum congestion analysis revealed that the 2.4 GHz band consistently experienced elevated congestion levels across the three cities. The detailed results showed a strong concentration of deployments on channels 11, 6 and 1, which are traditionally recommended as non-overlapping channels within the 2.4 GHz spectrum. Channel 11 was the most utilized channel, accounting for 25.2% of the detected access points, followed by channel 6 with 22.5% and channel 1 with 19.5%. This distribution indicates that most wireless deployments adhere to standard channel allocation practices for 2.4 GHz Wi-Fi environments.
The following figure illustrates the overall distribution of the most frequently utilized wireless channels.
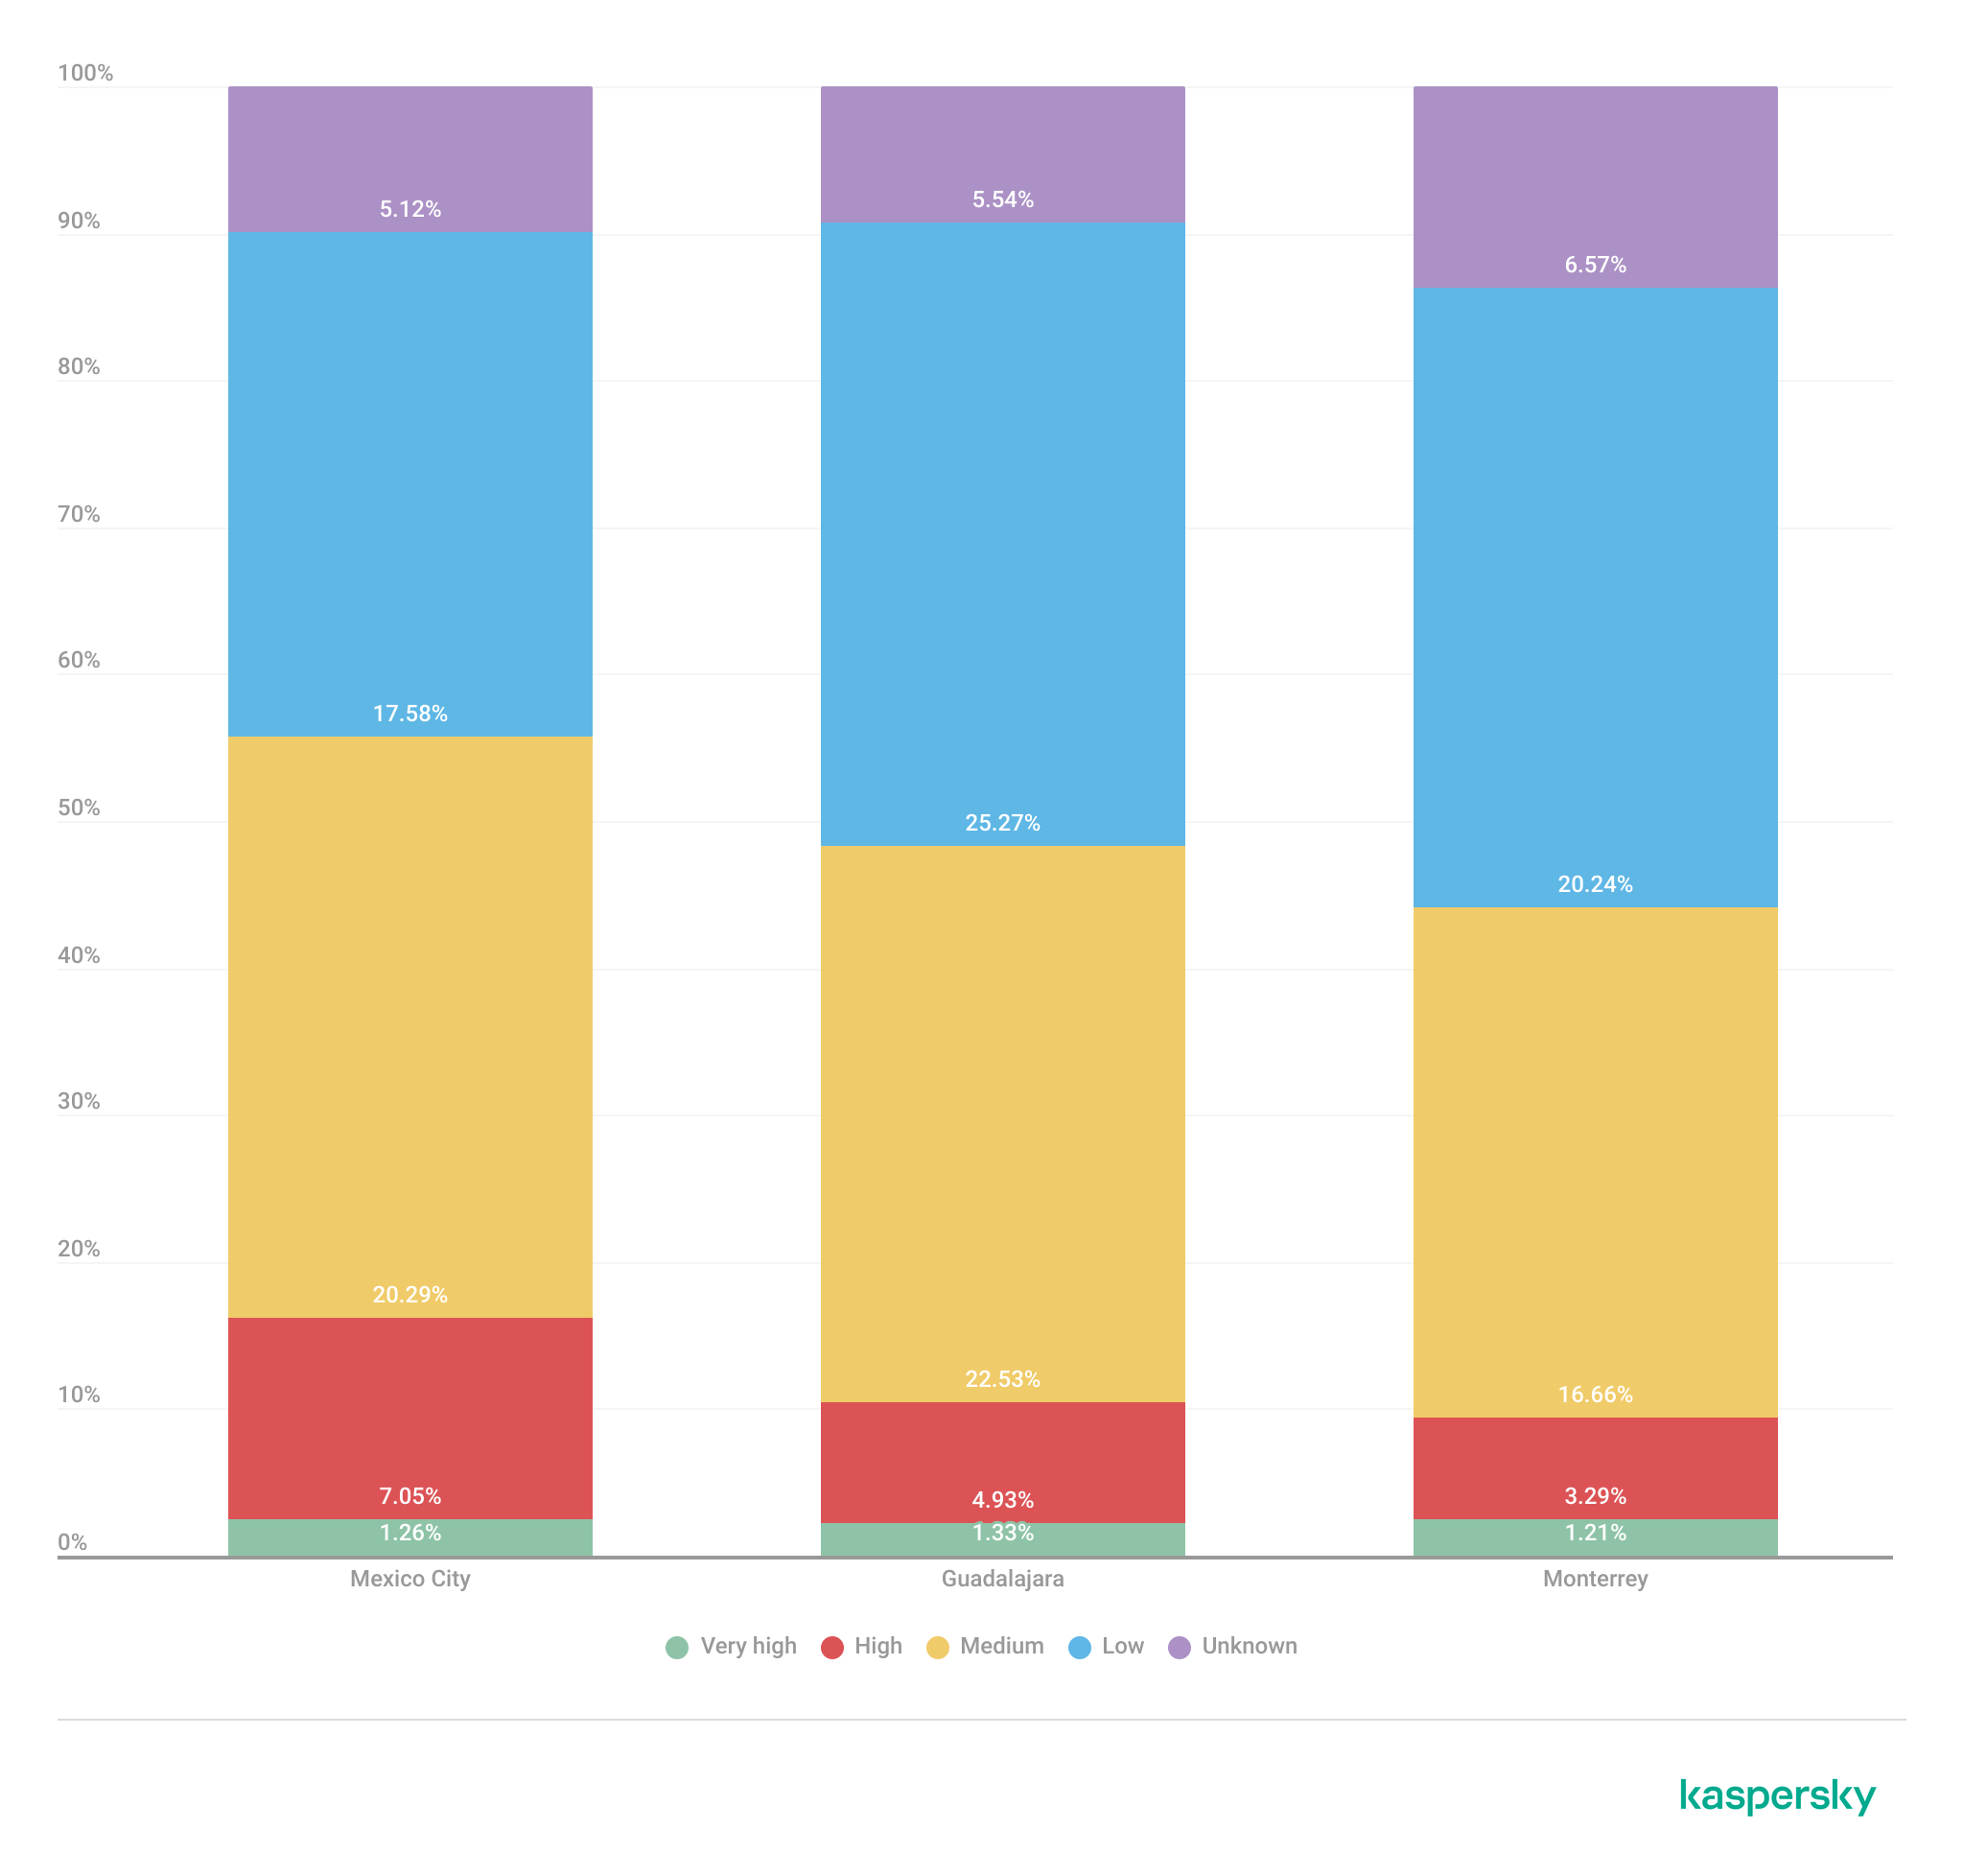
To further assess wireless spectrum saturation, the detected access points were grouped according to channel congestion levels: VERY_HIGH, HIGH, UNKNOWN, MEDIUM, LOW and NONE.
Mexico City had the highest proportion of heavily congested wireless channels, with approximately 7% of detected access points operating under HIGH congestion conditions. Guadalajara followed with nearly 5% of deployments categorized as HIGH congestion, while Monterrey had the lowest percentage at approximately 3.29%.
These findings suggest that wireless spectrum saturation increases proportionally with urban infrastructure density and access point concentration. Despite the presence of congested deployments, most detected access points were categorized as LOW or MEDIUM congestion, suggesting severe spectrum saturation was localized rather than uniformly distributed.
A thorough analysis of individual channel utilization revealed that channels 11, 6 and 1 consistently experienced the highest congestion levels across the three cities, which correlates with our previous findings. These channels accounted for the majority of VERY_HIGH congestion classifications, particularly within the 2.4 GHz band.
In Mexico City, channel 11 alone accounted for more than 25% of detected deployments and consistently exhibited VERY_HIGH congestion levels.
This behavior reflects the limited availability of non-overlapping channels within the 2.4 GHz spectrum and the widespread reliance on default wireless configurations.
Overall, the channel utilization analysis showed that wireless deployments are concentrated heavily within the traditional, non-overlapping 2.4 GHz channels. While this strategy reduces adjacent-channel interference, excessive access point density on the same channels can still produce significant co-channel contention and poor wireless performance in high-density urban environments.
Wireless security configurations
The next thing we evaluated was the security posture of the detected wireless networks. We analyzed the wireless security configurations advertised by access points in each of the locations.
Overall security configuration distribution
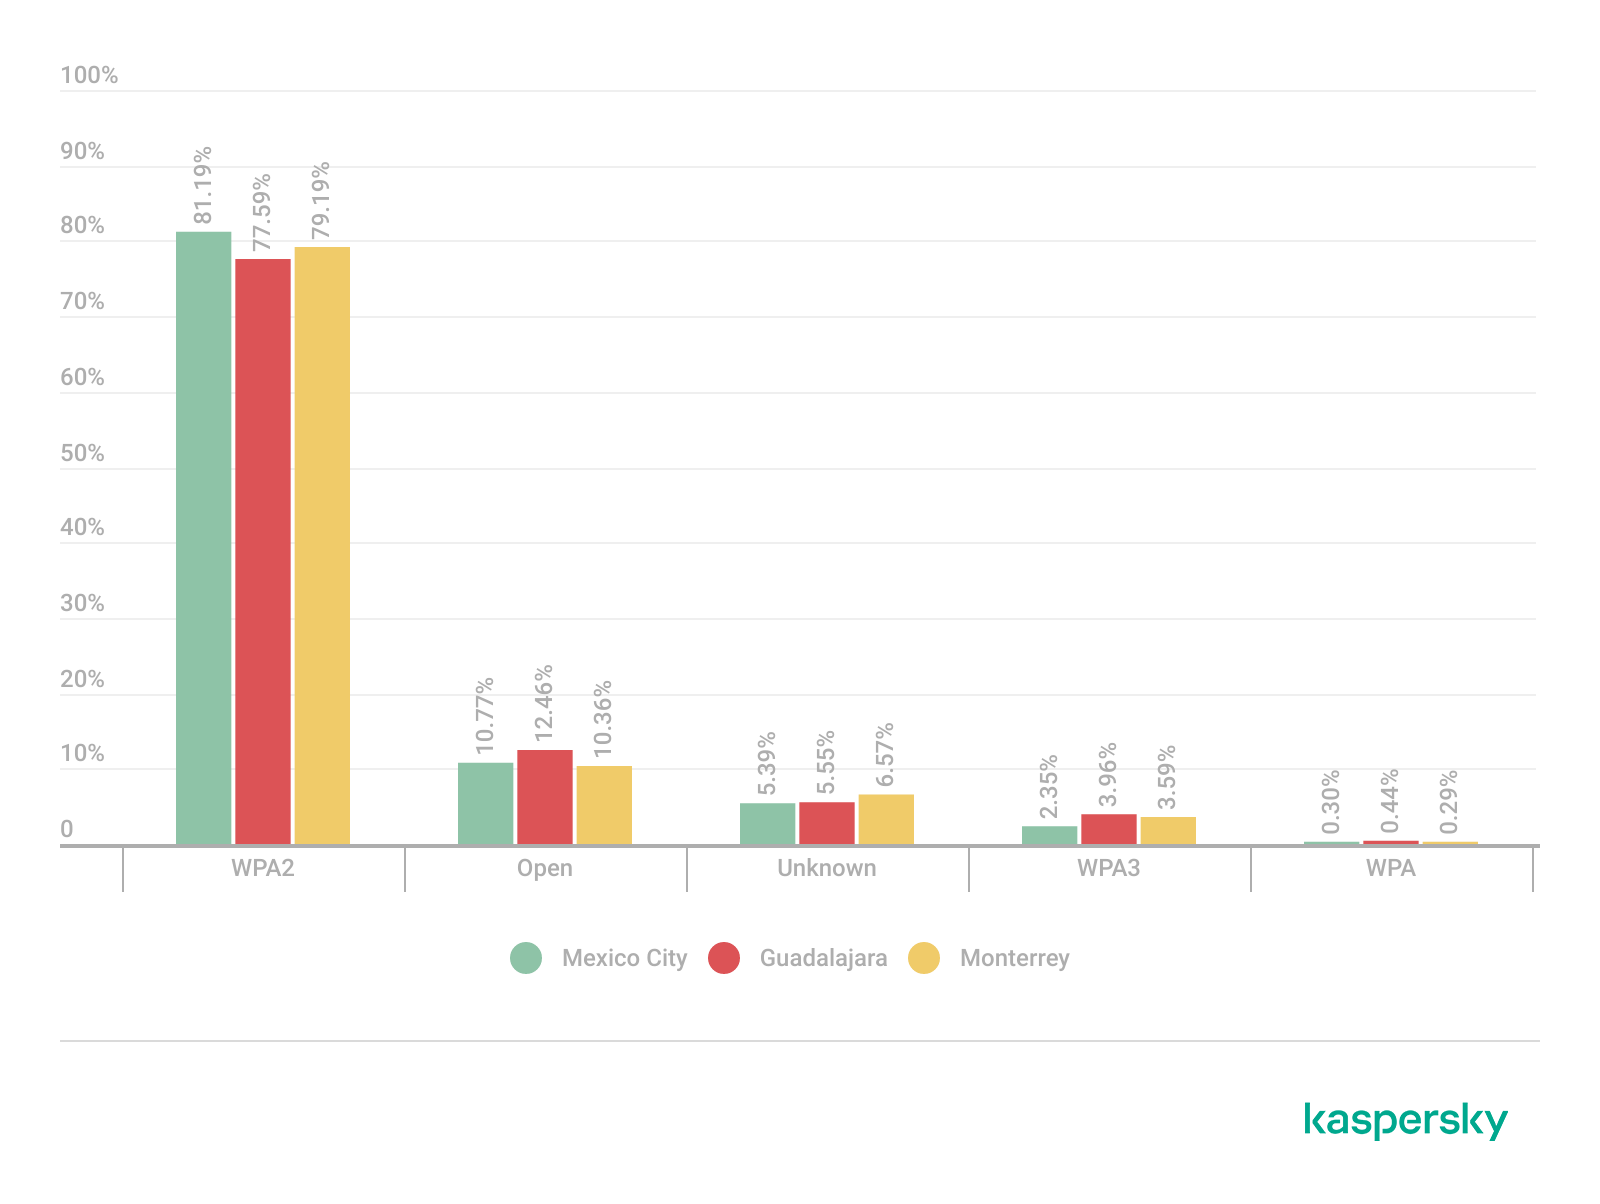
The analysis revealed that WPA2 was the dominant wireless authentication mechanism across the three cities. Mexico City had the highest WPA2 adoption rate at 81.19%, followed by Monterrey at 79.19% and Guadalajara at 77.59%.
The study found that every 6th open access point (17%) was unsafe, namely 16.5% in Mexico City, 18.5% in Guadalajara, and 17.2% in Monterrey. Open wireless deployments were consistently present across all locations, ranging between 10% and 12% of detected access points. These findings show that despite the widespread deployment of modern wireless security standards, encryption adoption remains incomplete.
Distribution of wireless authentication mechanisms across the three locations (download)
To simplify the interpretation of wireless security posture, we grouped detected networks into four categories:
Secure (WPA2/WPA3)
Insecure (Open/WEP)
Weak (WPA)
Unknown
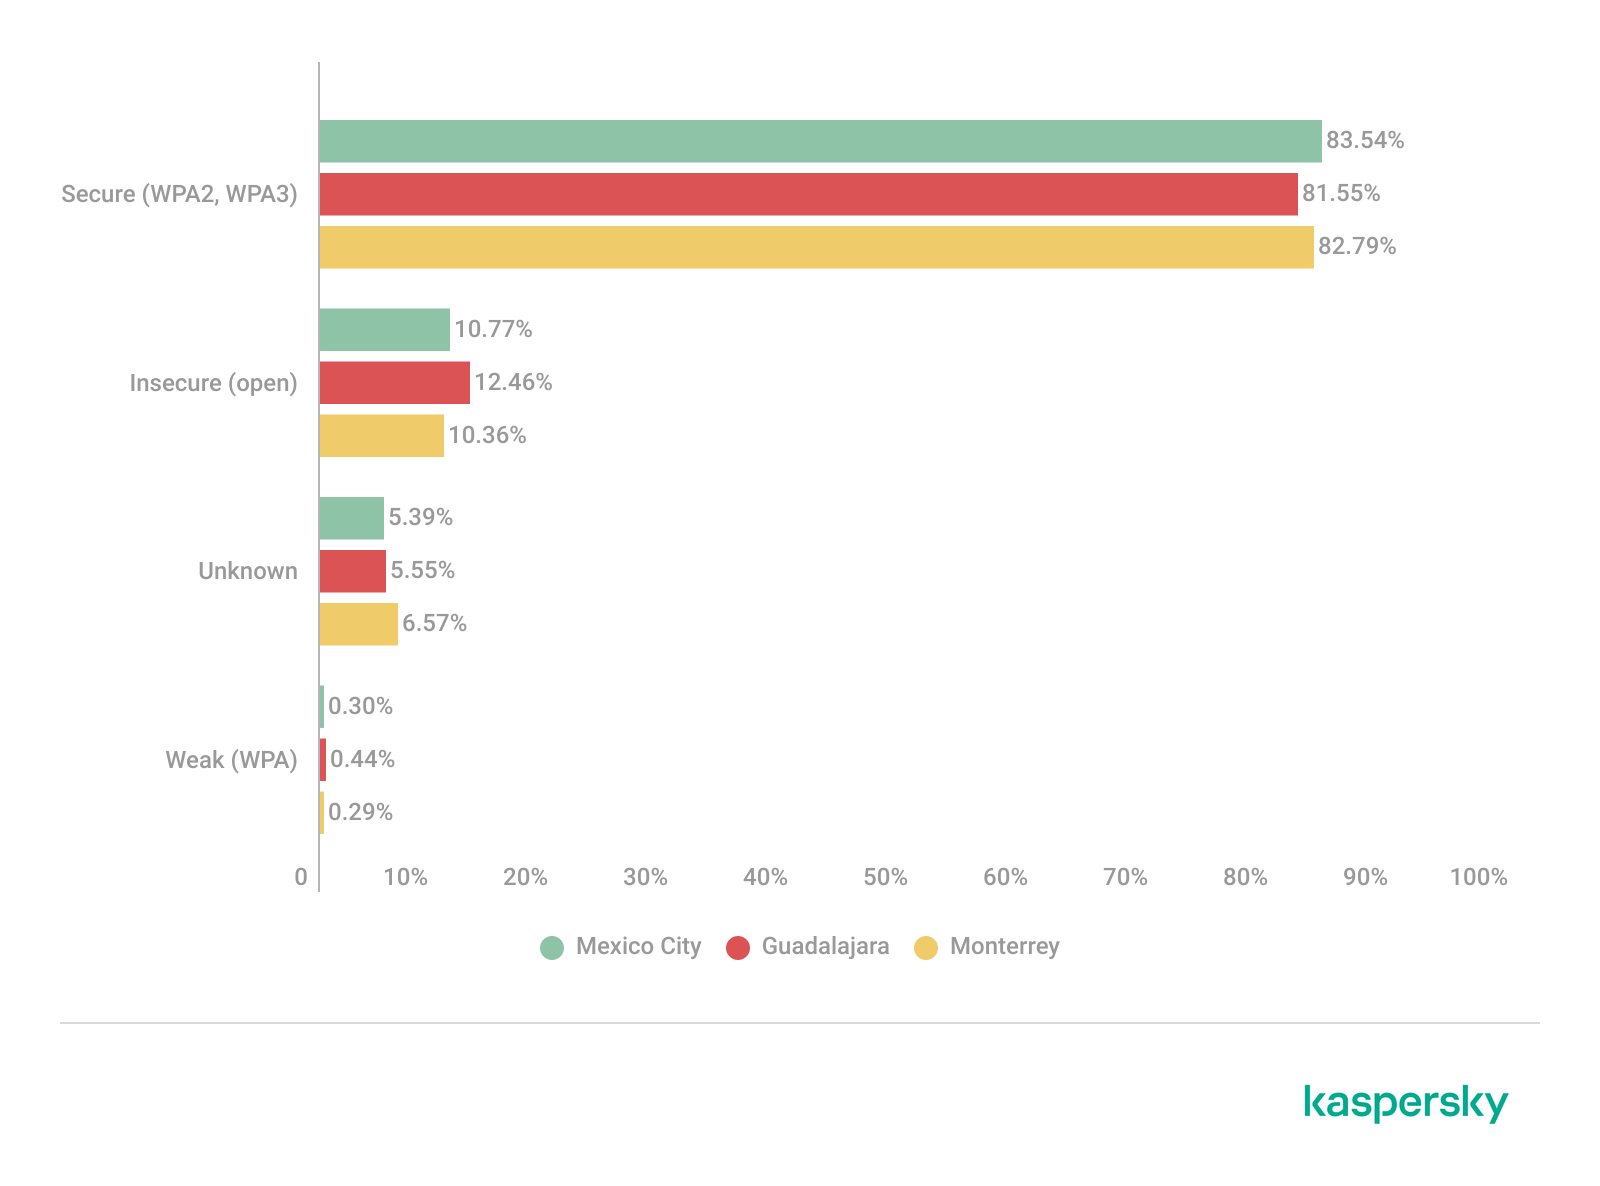
Across the three locations, secure networks comprised most of detected deployments, accounting for approximately 82% of all access points. However, insecure open networks still account for between 10% and 12% of detected wireless infrastructure, consistent with our previous findings. It is important to mention that networks within the unknown category are not considered secure.
Mexico City had the highest percentage of secure deployments at 83.54%, while Guadalajara had the highest percentage of insecure open networks at 12.46%. Although Monterrey had the lowest percentage of insecure networks, open deployments still accounted for more than 10% of the detected access points.
Wireless security posture grouping across the three locations (download)
Although modern WPA2/WPA3 encryption standards dominate current wireless deployments, the continued presence of open and legacy WPA deployments indicates that insecure wireless configurations remain relevant from an operational standpoint. These networks may expose users to passive traffic interception, unauthorized monitoring, rogue access point attacks, and credential harvesting techniques.
WPS-enabled networks
We also analyzed Wi-Fi Protected Setup (WPS) in all the locations to evaluate additional attack surfaces. WPS is a standard feature on wireless routers that enables devices such as printers, repeaters or mobile phones to connect to a secure Wi-Fi network without manually entering a long password, typically through a PIN-based enrolled mechanism. Although WPA2 and WPA3 provide strong encryption mechanisms, the presence of WPS can introduce security weaknesses due to inherently vulnerable PIN-based enrollment methods.
By combining detections from the three locations, we found that 55% of all detected access points did not advertise WPS capabilities, leaving 45% of deployments vulnerable to WPS-based abuse. These results suggest that, despite the adoption of modern encryption standards, a significant portion of wireless infrastructure continues to expose legacy convenience features.
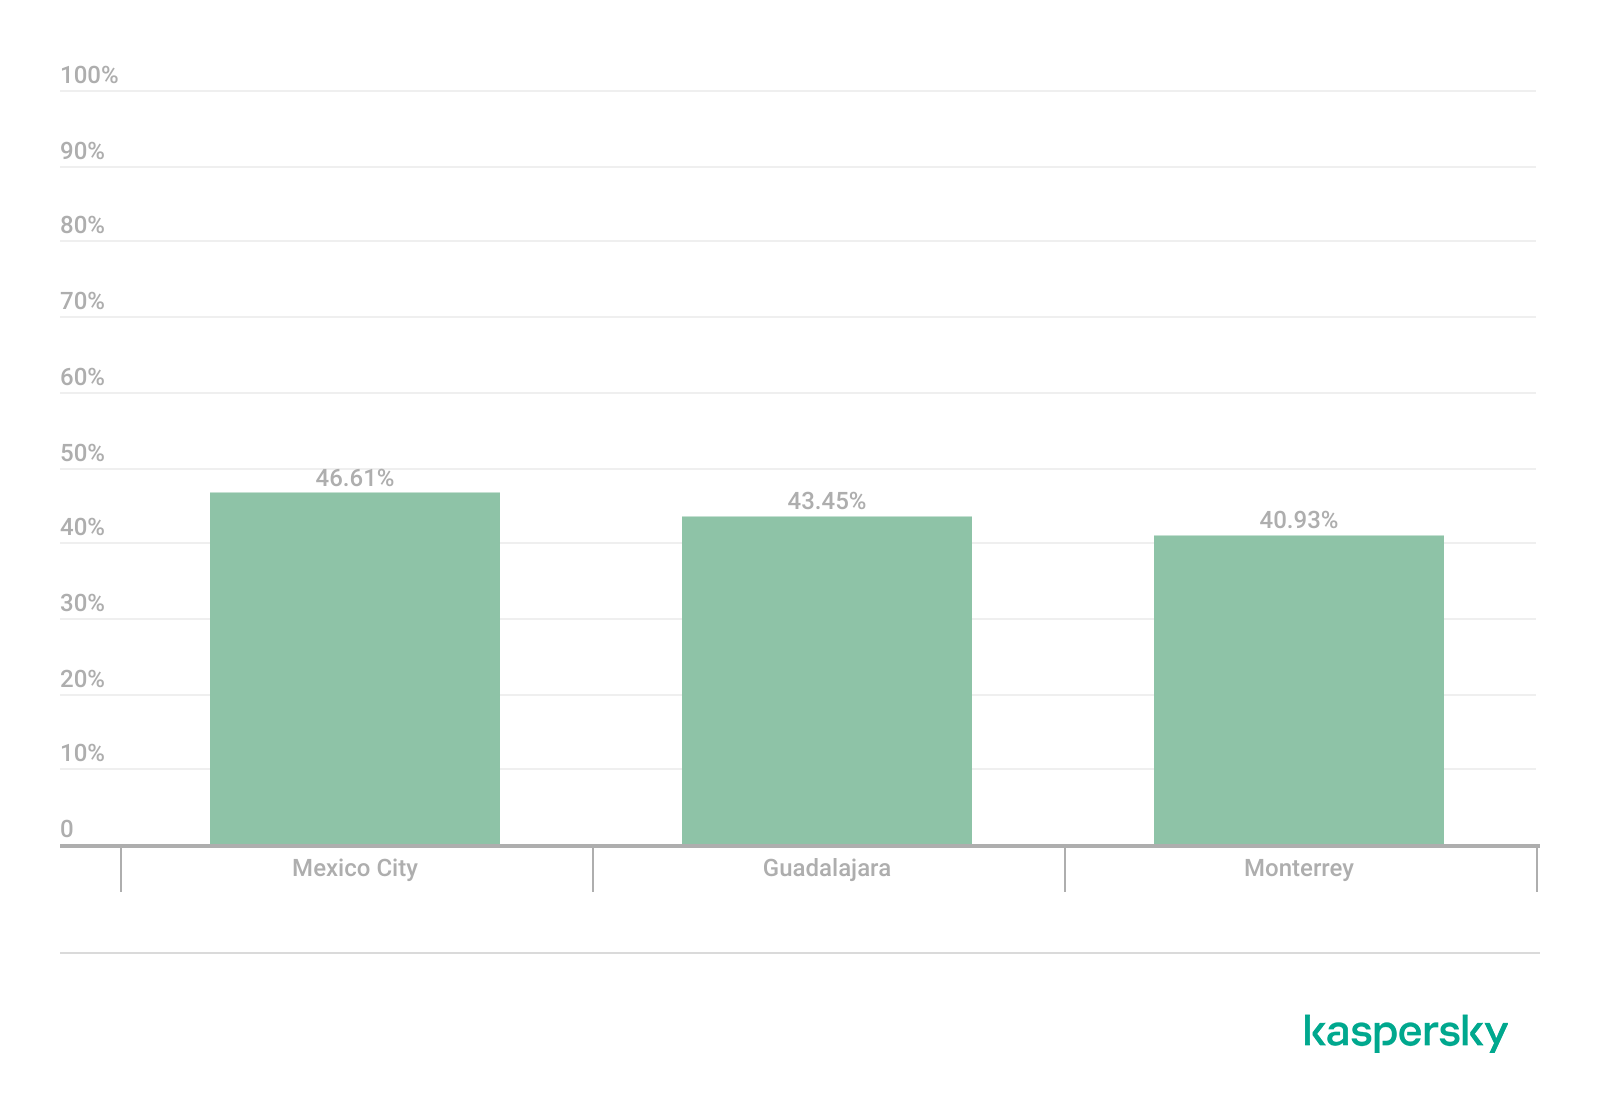
During the analysis, we found that Mexico City had the highest proportion of WPS-enabled networks, with 46.61% of the detected access points advertising WPS capabilities. Guadalajara was second with 43.45%, while Monterrey had the lowest proportion at 40.93%.
The percentage of detected access points advertising WPS capabilities across the three locations (download)
Almost half of the detected wireless networks in each city continued to advertise WPS, indicating that WPS prevalence is consistently high across the three cities.
Secure networks with WPS enabled
In many cases, networks classified as secure because of WPA2/WPA3 encryption still had WPS functionality enabled, which effectively increased the available attack surface.
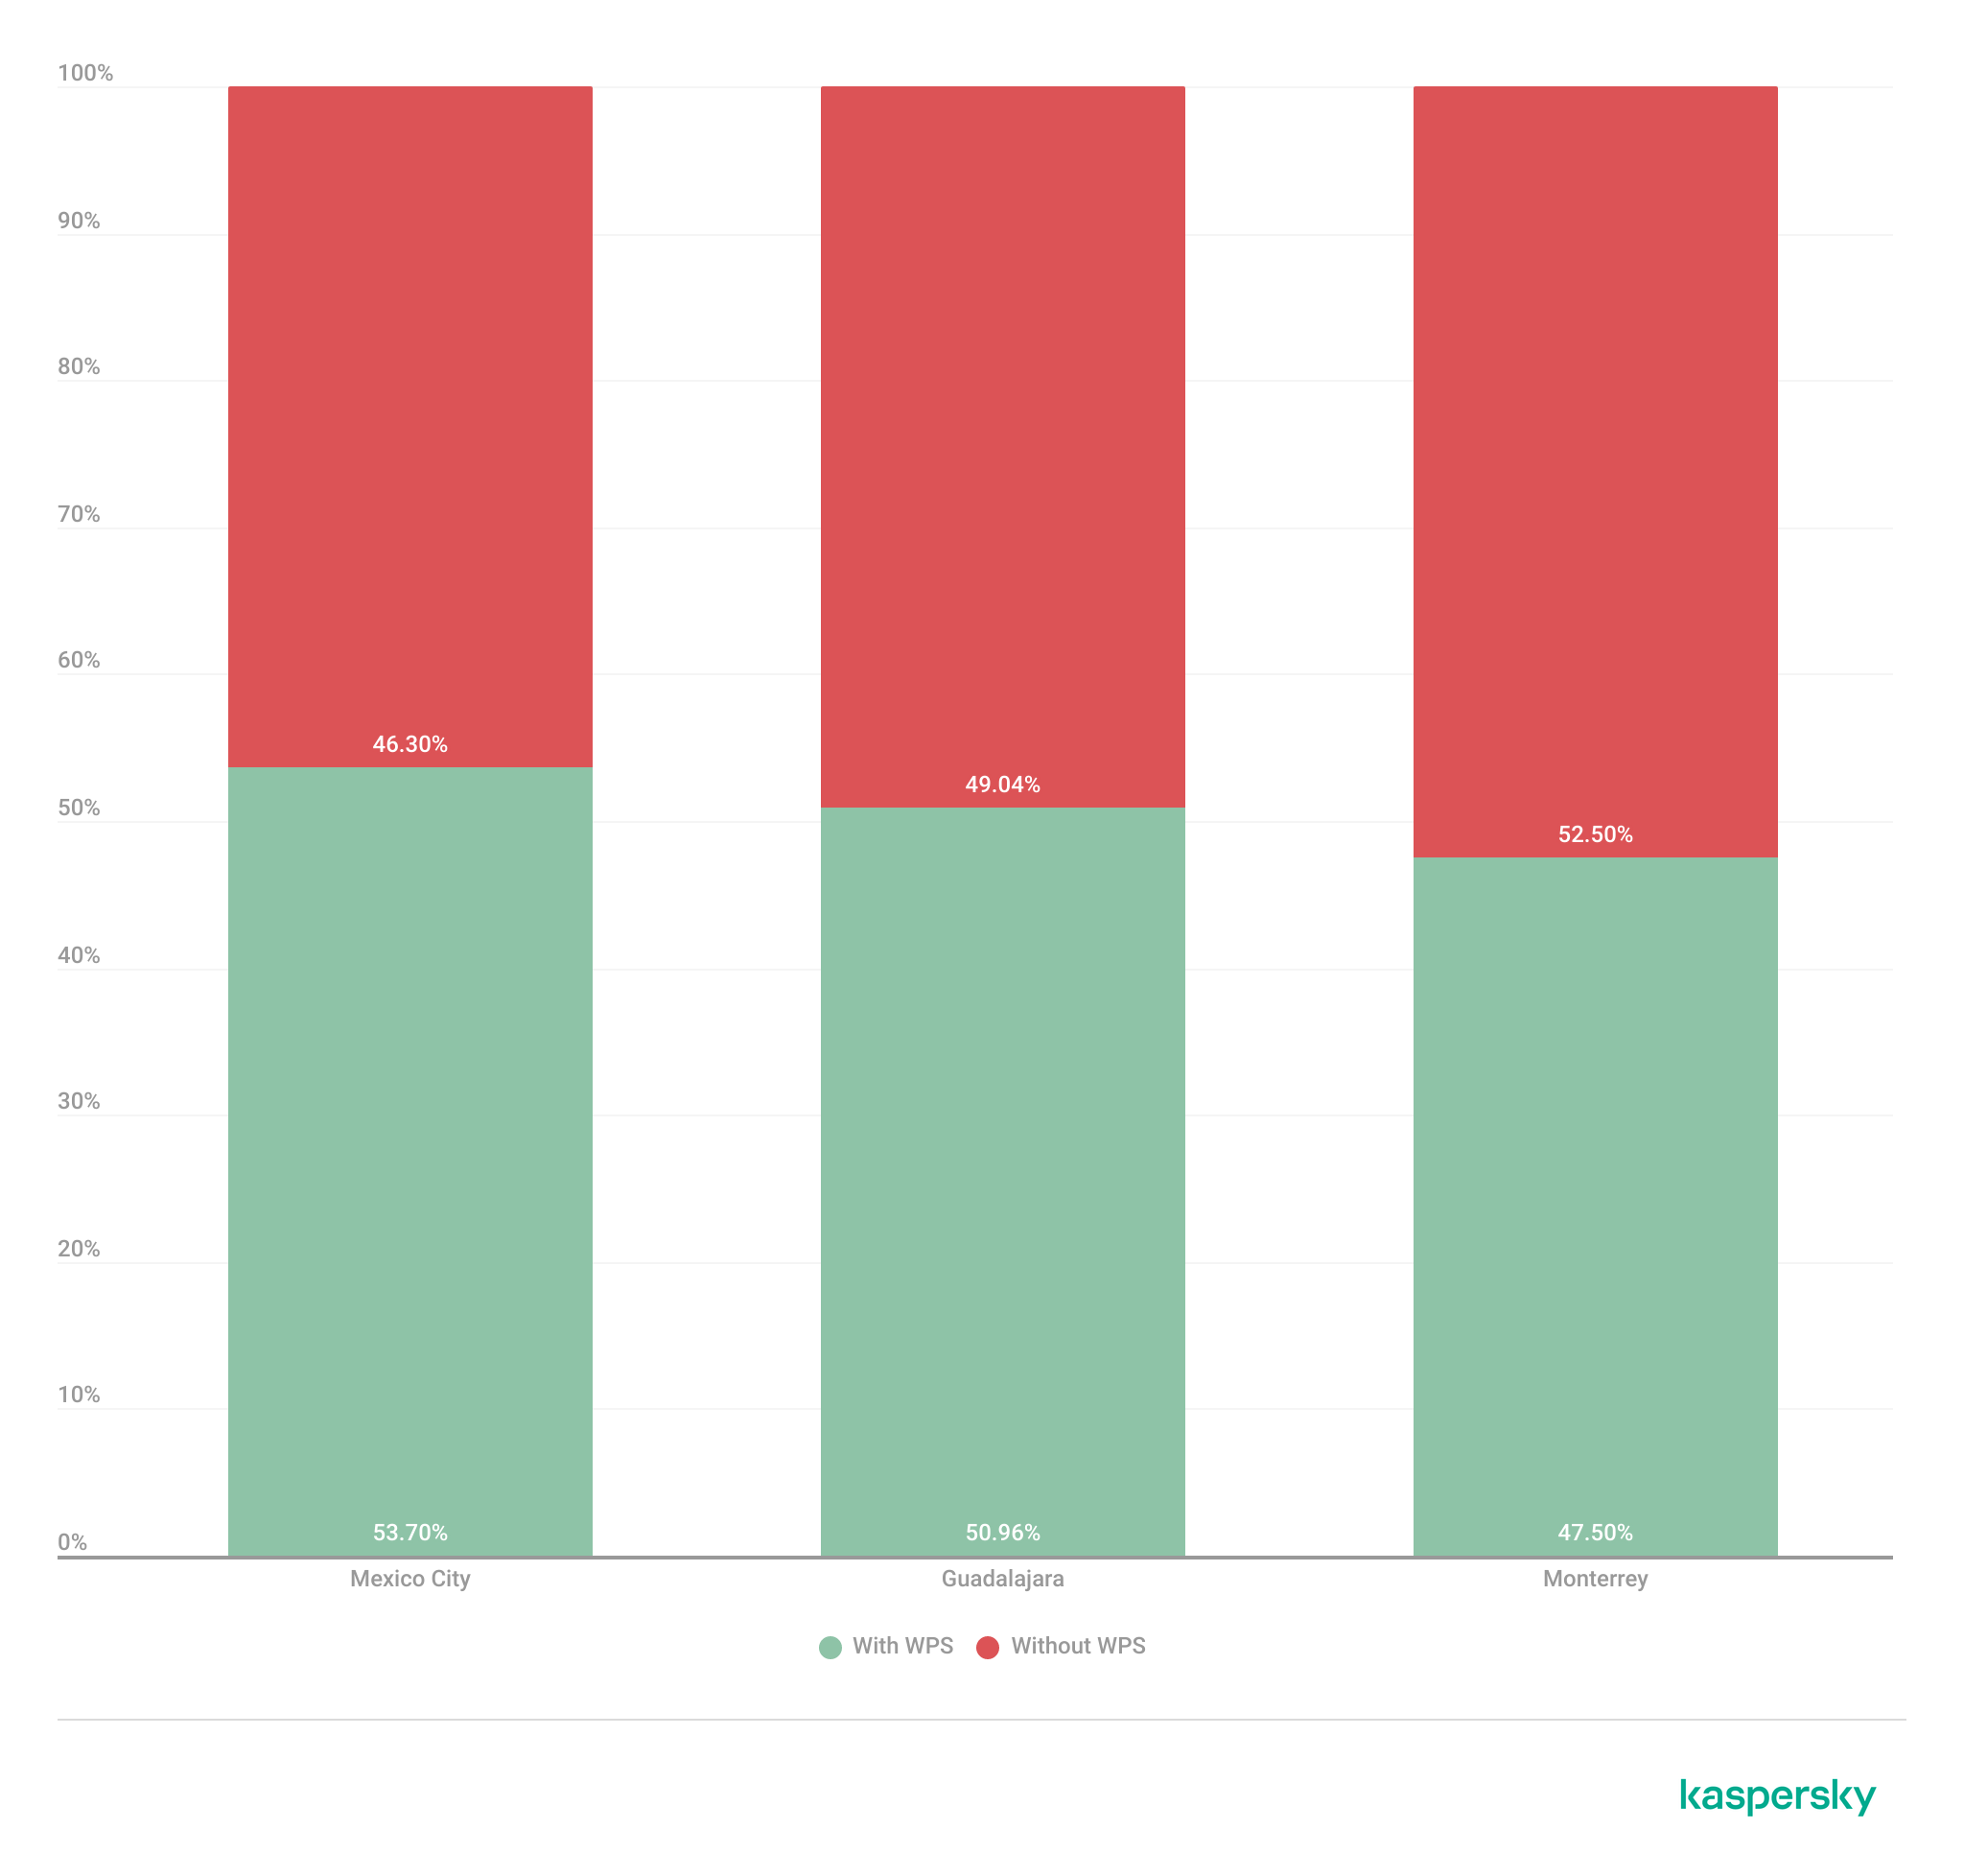
To further assess the relationship between encryption strength and WPS exposure, we conducted a secondary analysis of secure networks (WPA2/WPA3) only. The results showed that around half of all secure deployments still exposed WPS, with the following breakdown for each city:
Mexico City: 53.7%
Guadalajara: 50.9%
Monterrey: 47.5%
The proportion of secure networks with WPS enabled across the three locations (download)
These findings indicate that encryption strength alone is not enough to evaluate wireless security posture because additional protocol features, such as WPS, may still expose exploitable attack vectors.
Additional security considerations
Overall, travelers operating within dense public environments are exposed not only to insecure wireless infrastructure but also to various risks associated with digital interactions. These risks include many threats, from public USB charging systems and phishing QR codes to proximity-based protocols and exposure to shared public devices, such as interactive totems or kiosks. One particular point that should be taken into account in light of our research is the issue of rogue wireless deployments.
Rogue access points are not necessarily malicious; they may be set up accidentally by misconfiguring router settings. An entry point for potential compromise might be caused by various misconfigurations, from a weak password to an insecure protocol. However, attackers deploy such unauthorized hotspots with malicious intent to infiltrate a network. Threat actors may deploy rogue access points posing as legitimate public wireless networks in airports, hotels, cafés and tourist areas. These deployments are called “evil twins” and can trick users into connecting to attacker-controlled infrastructure capable of intercepting traffic, harvesting credentials, or performing man-in-the-middle attacks. Further risk lies in the potential compromise of local network devices or even malware distribution. Such threats complement our findings, underscoring the importance of implementing traffic encryption, using a security solution and exercising extreme caution while browsing via public networks.
Conclusion
The wardriving assessment conducted in Mexico City, Guadalajara, and Monterrey revealed that modern wireless infrastructure continues to present multiple forms of operational exposure despite the widespread adoption of WPA2 and WPA3 security standards. The analysis demonstrated that wireless environments are highly standardized in all the locations, with recurring ISP deployments, default SSID naming conventions, homogeneous manufacturer distribution, and predictable channel allocation practices observed in all three cities.
Although most of the detected networks were classified as secure under WPA2/WPA3 authentication mechanisms, a significant proportion were exposing additional attack surfaces through enabled WPS functionality, default configurations, sequential SSID structures, and infrastructure metadata disclosure. This demonstrates that encryption strength alone is insufficient for evaluating the overall security posture of wireless infrastructure. Additionally, the prevalence of open networks and legacy wireless configurations indicates that insecure deployments are still operationally relevant in all the locations.
The results also showed that wireless infrastructure is heavily concentrated within the 2.4 GHz spectrum, particularly around channels 11, 6, and 1. This leads to elevated congestion and increased co-channel interference in densely populated urban environments.
SSID analysis further revealed that publicly broadcast wireless identifiers frequently expose valuable operational information about ISPs, equipment manufacturers, deployment templates, organizational ownership, and user-defined naming practices. The identification of default ISP naming conventions, sequential SSID structures, and BSSID-derived SSIDs demonstrated that many deployments prioritize operational convenience and simplicity over exposure minimization and privacy.
The scope of the threats stemming from vulnerable wireless configurations poses serious digital exposure risks for users. The widespread presence of standard deployments, predictable SSID naming and publicly exposed infrastructure identifiers can facilitate passive reconnaissance, infrastructure fingerprinting and opportunistic targeting.
Recommendations
To minimize the risks of wireless-based exposure and the attack surface related to hotspot infrastructure, we recommend taking the following measures:
Disable WPS functionality on wireless routers whenever possible, particularly within WPA2/WPA3 deployments.
Avoid using default SSID naming conventions that disclose ISP providers, router manufacturers, or deployment templates.
Refrain from using personal, organizational, or location-based identifiers in wireless network names.
Avoid configuring SSID using BSSID or naming conventions derived from MAC addresses, as these may expose hardware fingerprinting information.
Promote migration toward modern WPA3-capable infrastructure while removing legacy wireless protocols when operationally feasible.
Reduce wireless congestion by optimizing channel allocation strategies and minimizing excessive dependence on the 2.4 GHz spectrum.
Encourage adoption of 5 GHz and newer wireless technologies to reduce interference and improve spectrum efficiency.
The findings presented in this assessment emphasize the importance of combining strong wireless encryption standards, secure deployment practices, exposure minimization strategies, and user awareness to enhance the overall security posture of wireless environments.
Mexico is one of the host countries for the 2026 FIFA World Cup, with matches to be played in three major cities: Mexico City, Monterrey, and Guadalajara. These locations are expected to see a large influx of international visitors, increasing the potential security risks. Many of those risks arise from users connecting to public wireless networks.
To better understand the wireless environments that visitors may encounter, we at Kaspersky GReAT conducted a wardriving assessment in the three host cities. The aim of the study was to analyze characteristics, deployment patterns, security configurations and potential exposure risks of public Wi-Fi infrastructure in urban wireless environments.
The information collected during the assessment was used exclusively for passive observation and infrastructure analysis. No attempts were made to authenticate, intercept communications, exploit systems or interact with the detected wireless networks beyond the publicly broadcast management information.
During processing of the collected data, one step involved filtering out networks belonging to cars or cell phones categorized as mobile hotspots because they do not represent networks that can be considered part of the assessment.
Research scope
The cities included in the study have high population density and extensive wireless infrastructure deployments. We chose areas with the most prominent wireless network activity and highly concentrated public access points. We carried out wardriving research in Monterrey back in 2008, but the city’s hotspot landscape has changed since then.
We chose the following analysis areas for each of the cities:
Mexico City: México City Stadium, Mexico City International Airport, Zócalo, Paseo de la Reforma, Colonia Roma, La Condesa, Polanco, and Coyoacán.
Guadalajara: Guadalajara Stadium, Guadalajara International Airport, the city center, Zapopan, Providencia, Avenida Chapultepec, Colonia Americana, Tlaquepaque, and the area around Andares.
Monterrey: Monterrey Stadium, Monterrey International Airport, Fundidora Park, Cintermex Monterrey, the downtown area, Barrio Antiguo, MacroPlaza, and the San Pedro financial district.
The wireless information was collected using passive wireless reconnaissance techniques. The collected information included:
SSID analysis and information exposure, including BSSID-derived SSIDs
Default router configurations and ISP deployments
Frequency and signal characteristics
Channel congestion and spectrum usage
Wireless security configurations, including:
Open and insecure wireless networks
WPS-enabled networks
Secure networks (WPA2/WPA3) with WPS enabled
We performed a wireless infrastructure analysis in Mexico City, Guadalajara, and Monterrey. We drove through the areas surrounding the World Cup stadiums, tourist zones, and other places where fan concentrations are likely to be largest. Our goal was to evaluate the security status, deployment characteristics and operational exposure of detected wireless networks.
In total, we recorded 84,588 signals with 69,473 unique Service Set Identifiers (SSIDs) in busy locations and World Cup zones across the three cities. Mexico City accounted for 61.4% of the signals, Guadalajara for 23.6%, and Monterrey for 14.8%. Approximately 82% of the signals had a single SSID (81.9%, 81.34%, and 84% respectively). Notably, they all operate under the IEEE 802.11 standard protocol.
Particular attention was given to identifying standard deployment patterns, legacy configurations, default vendor settings and information disclosure through publicly broadcast wireless identifiers.
The following sections present the results that were obtained by analyzing wireless infrastructure across the three locations.
Our findings
SSID analysis and information exposure
SSID analysis was conducted to evaluate naming conventions, deployment standardization and potential information exposure.
Only a few networks (0.0047%) have an invisible SSID, meaning the names of these networks are not broadcast. Some users prefer to hide the SSID for various reasons, such as the network’s purpose, the profile of its users, internal policies, etc. In contrast, the rest of the networks maintained active SSID broadcasting.
SSID structures may unintentionally disclose operational details about internet service providers (ISPs), device manufacturers, deployment practices, organizational ownership or user identity. The repeated presence of default SSID naming patterns across the analyzed locations indicates a significant degree of infrastructure homogeneity and reuse of default wireless configurations. It may also facilitate passive infrastructure profiling by revealing standard characteristics in use.
Approximately 34% of the detected networks retained the default SSID naming conventions provided by the manufacturer or ISP, while 66% used customized identifiers.
Distribution of SSID naming conventions (download)
Several recurring SSID naming conventions associated with ISP-provided deployments were identified in the three cities. The most frequently observed patterns include identifiers such as “Club_Totalplay_WiFi”, “izzi WiFi”, and “Megacable WiFi”, which suggests extensive standardization of wireless infrastructure deployment. Additionally, we observed distinctive location-specific SSIDs in each area of analysis, such as “XXXX-Internet para Todos-CDMX” or “RED JALISCO”.
Sequential SSID naming structures were also identified during the analysis. Patterns such as “INFINITUMXX” and “IZZI-XX” suggest automated ISP deployment and large-scale deployment strategies.
We identified 33 unique sequential naming structures among the 137 sequential SSIDs in total, representing approximately 0.16% of the detected wireless networks.
The following graph shows the top five sequential SSID patterns found in the largest number of networks:
Five most frequently observed sequential patterns (download)
Several customized SSIDs contained personal or organizational identifiers, including family names, professions, addresses or internal department references. Although personalized SSIDs may simplify local network identification for users, they may also expose sensitive information that could be useful for social engineering, physical targeting, or organizational profiling.
BSSID-derived SSID
During the analysis, multiple networks were identified that used the physical MAC address of a Wi-Fi access point (BSSID) as the visible SSID. This practice exposes hardware-level information that could facilitate vendor fingerprinting and targeted reconnaissance activities.
The organizationally unique identifier (OUI) contained in the first bytes of the BSSID identifies the equipment manufacturer. Threat actors can correlate exposed manufacturers with device-specific vulnerabilities.
Notably, we found that more than 30% of networks in all three cities reuse the MAC address as the SSID.
Default router configurations and ISP deployments
We performed wireless infrastructure profiling to identify the most common wireless equipment manufacturers and ISP deployments across the three locations.
Large-scale ISP deployments frequently use standardized wireless configurations and vendor-specific hardware platforms. Identifying dominant manufacturers and ISP naming conventions can provide insight into infrastructure and deployment practices facilitating the mapping of standardized attack surfaces.
The following figure shows the distribution of the most commonly used manufacturers.
Most frequently observed wireless equipment manufacturers (download)
The manufacturer analysis revealed a strong concentration of wireless infrastructure among a limited number of vendors. Across the three locations, Huawei Technologies, MediaTek-based devices, and other manufacturers’ equipment that is distributed through ISP channels represented a significant portion of the detected deployments. Mexico City had the most diverse infrastructure, while Monterrey and Guadalajara had a greater concentration of wireless equipment known as SOHO (small office/home office) or residential-grade hardware. The widespread presence of standard vendor platforms may facilitate infrastructure fingerprinting and large-scale targeting of known device-specific vulnerabilities.
Most frequently observed wireless equipment manufacturers across the three cities (download)
ISP deployments frequently exhibited standardized configuration patterns and recurring manufacturer identifiers. Our ISP deployment analysis revealed a high concentration of access points associated with major residential internet providers. Deployments associated with Infinitum, Totalplay and Izzi represented a substantial portion of the detected wireless infrastructure across all locations. These findings suggest a high degree of deployment standardization across networks associated with major residential internet providers. This observation was supported by the repeated presence of ISP-associated SSIDs such as “Infinitum”, “Totalplay”, and “Izzi”, combined with manufacturer identifiers frequently associated with consumer equipment, including Huawei, ZTE and other residential wireless equipment vendors.
It is important to note that, for this analysis, ISPs were primarily inferred from SSID naming conventions and manufacturer fingerprint data. A significant portion of the detected wireless networks fell into the “UNKNOWN/CUSTOM” category. This classification includes custom hotspots and networks whose naming conventions did not expose identifiable ISP-associated patterns. The findings suggest that many users and organizations (as we saw previously, approximately 66%) use custom network names, limiting direct provider attribution.
The following figure illustrates the distribution of ISP-associated wireless deployments in general.
To better understand this distribution, we took the most frequently observed ISPs by city.
Most frequently observed ISPs across the three cities (download)
Frequency and signal characteristics
We also analyzed wireless signal characteristics to evaluate coverage quality, signal strength, and frequency band utilization in the three cities. In dense urban environments, signal quality and frequency spectrum distribution can affect wireless reliability, client connectivity, roaming performance, and overall network efficiency.
Signal quality analysis revealed that a substantial portion of the detected access points operated under weak or very weak signal conditions. Monterrey had the highest percentage of very weak signals, with approximately 50% of detected deployments. Similar patterns were observed in Guadalajara and Mexico City, suggesting high-density wireless environments with overlapping coverage areas. Only a limited percentage of networks were classified within the very good or excellent signal categories across the three locations.
Signal stability analysis revealed that most detected wireless deployments exhibited stable beacon transmission behavior. More than 96% of the detected access points across all locations were classified as stable, while only a small percentage exhibited unstable or indeterminate signal behavior.
These findings imply that the majority of the wireless infrastructure observed during the assessment corresponded to permanently deployed access points rather than transient or intermittent wireless devices.
Frequency band analysis revealed the strong prevalence of 2.4 GHz wireless deployments across the three locations. More than 95% of the detected wireless networks operated within the 2.4 GHz spectrum, while only a small percentage of deployments were classified under the unknown or non-standard frequency categories. This uneven distribution reflects the continued prevalence of legacy-compatible wireless infrastructure and SOHO deployments.
These findings are consistent with dense urban wireless environments with large numbers of access points in restricted spectrum allocations.
Channel congestion and spectrum usage
Next, we analyzed wireless channel utilization to evaluate frequency spectrum congestion and channel allocation patterns across the three cities. Our analysis focused on the 2.4 GHz spectrum, where channel overlap and high access point density commonly produce interference and degraded wireless performance. In densely populated wireless environments, an excessive concentration of access points on a limited number of channels can lead to co-channel interference, packet collisions, reduced throughput, and degraded network stability.
Spectrum congestion analysis revealed that the 2.4 GHz band consistently experienced elevated congestion levels across the three cities. The detailed results showed a strong concentration of deployments on channels 11, 6 and 1, which are traditionally recommended as non-overlapping channels within the 2.4 GHz spectrum. Channel 11 was the most utilized channel, accounting for 25.2% of the detected access points, followed by channel 6 with 22.5% and channel 1 with 19.5%. This distribution indicates that most wireless deployments adhere to standard channel allocation practices for 2.4 GHz Wi-Fi environments.
The following figure illustrates the overall distribution of the most frequently utilized wireless channels.
To further assess wireless spectrum saturation, the detected access points were grouped according to channel congestion levels: VERY_HIGH, HIGH, UNKNOWN, MEDIUM, LOW and NONE.
Mexico City had the highest proportion of heavily congested wireless channels, with approximately 7% of detected access points operating under HIGH congestion conditions. Guadalajara followed with nearly 5% of deployments categorized as HIGH congestion, while Monterrey had the lowest percentage at approximately 3.29%.
These findings suggest that wireless spectrum saturation increases proportionally with urban infrastructure density and access point concentration. Despite the presence of congested deployments, most detected access points were categorized as LOW or MEDIUM congestion, suggesting severe spectrum saturation was localized rather than uniformly distributed.
A thorough analysis of individual channel utilization revealed that channels 11, 6 and 1 consistently experienced the highest congestion levels across the three cities, which correlates with our previous findings. These channels accounted for the majority of VERY_HIGH congestion classifications, particularly within the 2.4 GHz band.
In Mexico City, channel 11 alone accounted for more than 25% of detected deployments and consistently exhibited VERY_HIGH congestion levels.
This behavior reflects the limited availability of non-overlapping channels within the 2.4 GHz spectrum and the widespread reliance on default wireless configurations.
Overall, the channel utilization analysis showed that wireless deployments are concentrated heavily within the traditional, non-overlapping 2.4 GHz channels. While this strategy reduces adjacent-channel interference, excessive access point density on the same channels can still produce significant co-channel contention and poor wireless performance in high-density urban environments.
Wireless security configurations
The next thing we evaluated was the security posture of the detected wireless networks. We analyzed the wireless security configurations advertised by access points in each of the locations.
Overall security configuration distribution
The analysis revealed that WPA2 was the dominant wireless authentication mechanism across the three cities. Mexico City had the highest WPA2 adoption rate at 81.19%, followed by Monterrey at 79.19% and Guadalajara at 77.59%.
The study found that every 6th open access point (17%) was unsafe, namely 16.5% in Mexico City, 18.5% in Guadalajara, and 17.2% in Monterrey. Open wireless deployments were consistently present across all locations, ranging between 10% and 12% of detected access points. These findings show that despite the widespread deployment of modern wireless security standards, encryption adoption remains incomplete.
Distribution of wireless authentication mechanisms across the three locations (download)
To simplify the interpretation of wireless security posture, we grouped detected networks into four categories:
Secure (WPA2/WPA3)
Insecure (Open/WEP)
Weak (WPA)
Unknown
Across the three locations, secure networks comprised most of detected deployments, accounting for approximately 82% of all access points. However, insecure open networks still account for between 10% and 12% of detected wireless infrastructure, consistent with our previous findings. It is important to mention that networks within the unknown category are not considered secure.
Mexico City had the highest percentage of secure deployments at 83.54%, while Guadalajara had the highest percentage of insecure open networks at 12.46%. Although Monterrey had the lowest percentage of insecure networks, open deployments still accounted for more than 10% of the detected access points.
Wireless security posture grouping across the three locations (download)
Although modern WPA2/WPA3 encryption standards dominate current wireless deployments, the continued presence of open and legacy WPA deployments indicates that insecure wireless configurations remain relevant from an operational standpoint. These networks may expose users to passive traffic interception, unauthorized monitoring, rogue access point attacks, and credential harvesting techniques.
WPS-enabled networks
We also analyzed Wi-Fi Protected Setup (WPS) in all the locations to evaluate additional attack surfaces. WPS is a standard feature on wireless routers that enables devices such as printers, repeaters or mobile phones to connect to a secure Wi-Fi network without manually entering a long password, typically through a PIN-based enrolled mechanism. Although WPA2 and WPA3 provide strong encryption mechanisms, the presence of WPS can introduce security weaknesses due to inherently vulnerable PIN-based enrollment methods.
By combining detections from the three locations, we found that 55% of all detected access points did not advertise WPS capabilities, leaving 45% of deployments vulnerable to WPS-based abuse. These results suggest that, despite the adoption of modern encryption standards, a significant portion of wireless infrastructure continues to expose legacy convenience features.
During the analysis, we found that Mexico City had the highest proportion of WPS-enabled networks, with 46.61% of the detected access points advertising WPS capabilities. Guadalajara was second with 43.45%, while Monterrey had the lowest proportion at 40.93%.
The percentage of detected access points advertising WPS capabilities across the three locations (download)
Almost half of the detected wireless networks in each city continued to advertise WPS, indicating that WPS prevalence is consistently high across the three cities.
Secure networks with WPS enabled
In many cases, networks classified as secure because of WPA2/WPA3 encryption still had WPS functionality enabled, which effectively increased the available attack surface.
To further assess the relationship between encryption strength and WPS exposure, we conducted a secondary analysis of secure networks (WPA2/WPA3) only. The results showed that around half of all secure deployments still exposed WPS, with the following breakdown for each city:
Mexico City: 53.7%
Guadalajara: 50.9%
Monterrey: 47.5%
The proportion of secure networks with WPS enabled across the three locations (download)
These findings indicate that encryption strength alone is not enough to evaluate wireless security posture because additional protocol features, such as WPS, may still expose exploitable attack vectors.
Additional security considerations
Overall, travelers operating within dense public environments are exposed not only to insecure wireless infrastructure but also to various risks associated with digital interactions. These risks include many threats, from public USB charging systems and phishing QR codes to proximity-based protocols and exposure to shared public devices, such as interactive totems or kiosks. One particular point that should be taken into account in light of our research is the issue of rogue wireless deployments.
Rogue access points are not necessarily malicious; they may be set up accidentally by misconfiguring router settings. An entry point for potential compromise might be caused by various misconfigurations, from a weak password to an insecure protocol. However, attackers deploy such unauthorized hotspots with malicious intent to infiltrate a network. Threat actors may deploy rogue access points posing as legitimate public wireless networks in airports, hotels, cafés and tourist areas. These deployments are called “evil twins” and can trick users into connecting to attacker-controlled infrastructure capable of intercepting traffic, harvesting credentials, or performing man-in-the-middle attacks. Further risk lies in the potential compromise of local network devices or even malware distribution. Such threats complement our findings, underscoring the importance of implementing traffic encryption, using a security solution and exercising extreme caution while browsing via public networks.
Conclusion
The wardriving assessment conducted in Mexico City, Guadalajara, and Monterrey revealed that modern wireless infrastructure continues to present multiple forms of operational exposure despite the widespread adoption of WPA2 and WPA3 security standards. The analysis demonstrated that wireless environments are highly standardized in all the locations, with recurring ISP deployments, default SSID naming conventions, homogeneous manufacturer distribution, and predictable channel allocation practices observed in all three cities.
Although most of the detected networks were classified as secure under WPA2/WPA3 authentication mechanisms, a significant proportion were exposing additional attack surfaces through enabled WPS functionality, default configurations, sequential SSID structures, and infrastructure metadata disclosure. This demonstrates that encryption strength alone is insufficient for evaluating the overall security posture of wireless infrastructure. Additionally, the prevalence of open networks and legacy wireless configurations indicates that insecure deployments are still operationally relevant in all the locations.
The results also showed that wireless infrastructure is heavily concentrated within the 2.4 GHz spectrum, particularly around channels 11, 6, and 1. This leads to elevated congestion and increased co-channel interference in densely populated urban environments.
SSID analysis further revealed that publicly broadcast wireless identifiers frequently expose valuable operational information about ISPs, equipment manufacturers, deployment templates, organizational ownership, and user-defined naming practices. The identification of default ISP naming conventions, sequential SSID structures, and BSSID-derived SSIDs demonstrated that many deployments prioritize operational convenience and simplicity over exposure minimization and privacy.
The scope of the threats stemming from vulnerable wireless configurations poses serious digital exposure risks for users. The widespread presence of standard deployments, predictable SSID naming and publicly exposed infrastructure identifiers can facilitate passive reconnaissance, infrastructure fingerprinting and opportunistic targeting.
Recommendations
To minimize the risks of wireless-based exposure and the attack surface related to hotspot infrastructure, we recommend taking the following measures:
Disable WPS functionality on wireless routers whenever possible, particularly within WPA2/WPA3 deployments.
Avoid using default SSID naming conventions that disclose ISP providers, router manufacturers, or deployment templates.
Refrain from using personal, organizational, or location-based identifiers in wireless network names.
Avoid configuring SSID using BSSID or naming conventions derived from MAC addresses, as these may expose hardware fingerprinting information.
Promote migration toward modern WPA3-capable infrastructure while removing legacy wireless protocols when operationally feasible.
Reduce wireless congestion by optimizing channel allocation strategies and minimizing excessive dependence on the 2.4 GHz spectrum.
Encourage adoption of 5 GHz and newer wireless technologies to reduce interference and improve spectrum efficiency.
The findings presented in this assessment emphasize the importance of combining strong wireless encryption standards, secure deployment practices, exposure minimization strategies, and user awareness to enhance the overall security posture of wireless environments.
One of the biggest football (soccer) events of this summer is the World Cup 2026. The tournament is co-hosted by three countries: the U.S., Canada, and Mexico. Unfortunately, events of this scale attract not just fans, but also scammers from all over the globe. We’ve already covered how cybercriminals are prepping for the World Cup online, and today we’re talking about digital security for fans on the ground in Mexico.
The country will host 13 matches and welcome millions of tourists. They’ll be staying in hotels, heading to games, checking out restaurants, navigating airports, and visiting popular tourist spots — and everywhere they go, the temptation to connect to public Wi-Fi will be high.
We’ve surveyed more than 84 500 (!) public Wi-Fi access points in Mexico City, Guadalajara, and Monterrey — and we have a lot to share about their security. Spoiler alert: many networks are still using outdated security standards, so you really shouldn’t go on vacation without reliable protection and an eSIM.
What and how we tested
Walking across Mexico looking for public Wi-Fi access points would have been a bit tough, though that’s exactly what we did for a similar Wi-Fi security survey in Paris. You can check out the results of that in our post, How safe is Wi-Fi in Paris?
This time the mission was far more demanding: mapping the wireless landscape of three major metropolises. That’s why we went wardriving — scanning for and logging wireless networks from a moving vehicle while equipped with a smartphone or laptop. It’s similar to searching for Wi-Fi on your phone, where the device constantly listens for nearby networks. Except instead of connecting to them, we just collect data about them.
All information was used strictly for passive observation and infrastructure analysis. Beyond receiving publicly broadcast service information, the experts of Kaspersky’s Global Research and Analysis Team (GReAT) didn’t attempt to authenticate, intercept traffic, exploit systems, or otherwise interact with the wireless networks they discovered. Mobile access points deployed in cars and on mobile devices were excluded from the sample.
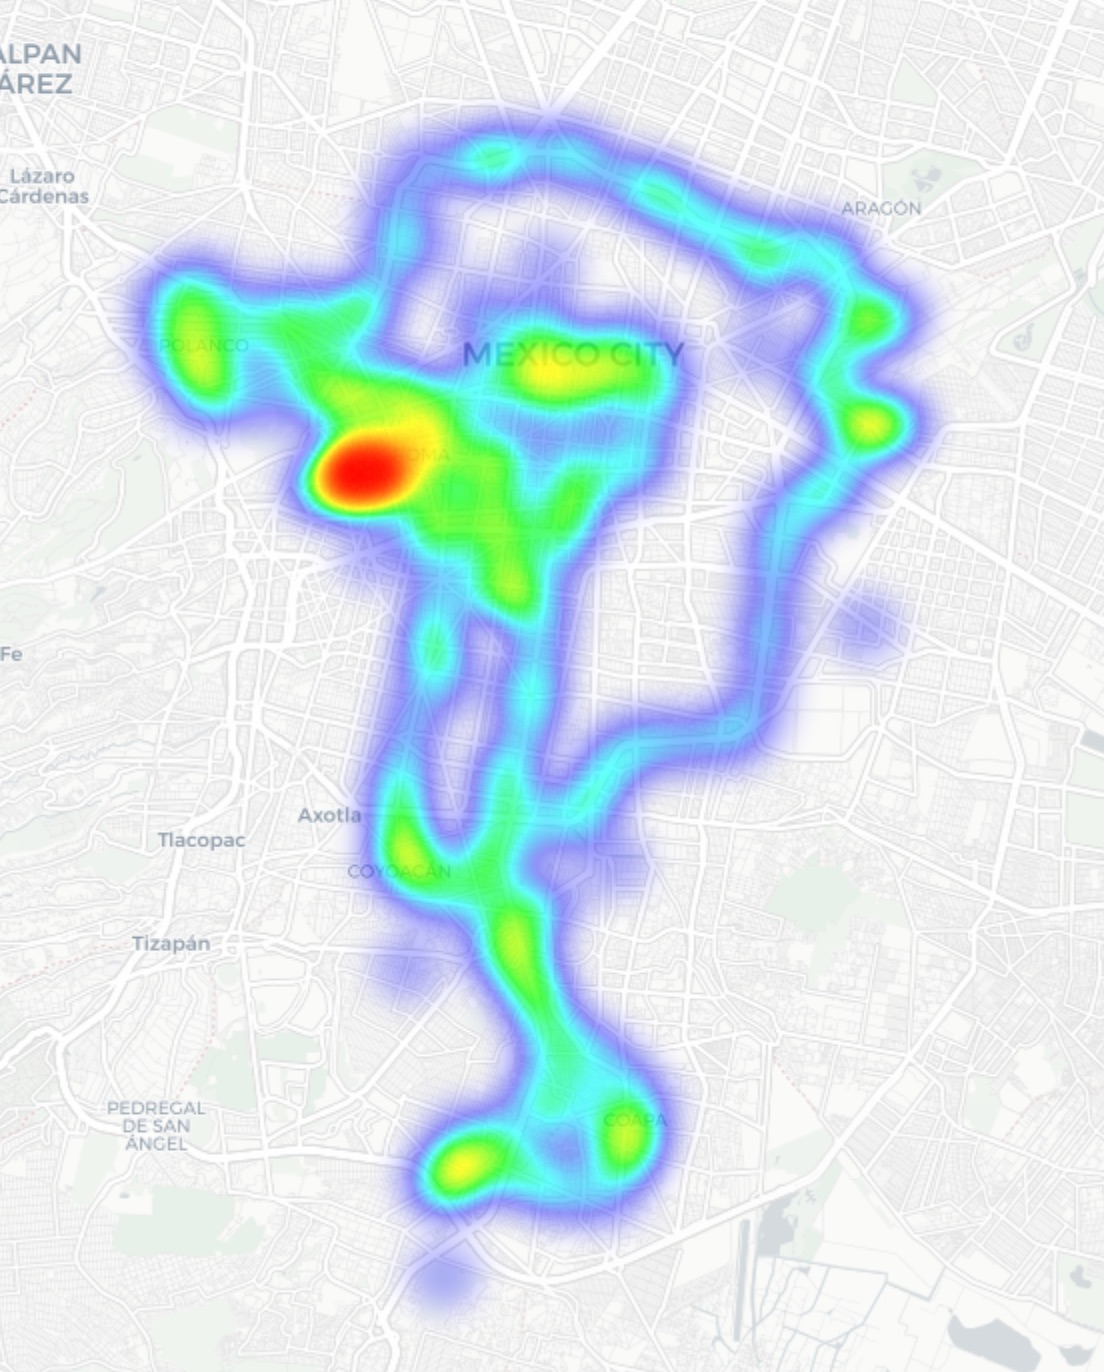
Our main target was Mexico City — the capital and one of the most densely populated cities in Latin America. We took a drive through popular tourist spots: Mexico City Stadium, Mexico City International Airport, Zócalo, Paseo de la Reforma, Colonia Roma, La Condesa, Polanco, Coyoacán.
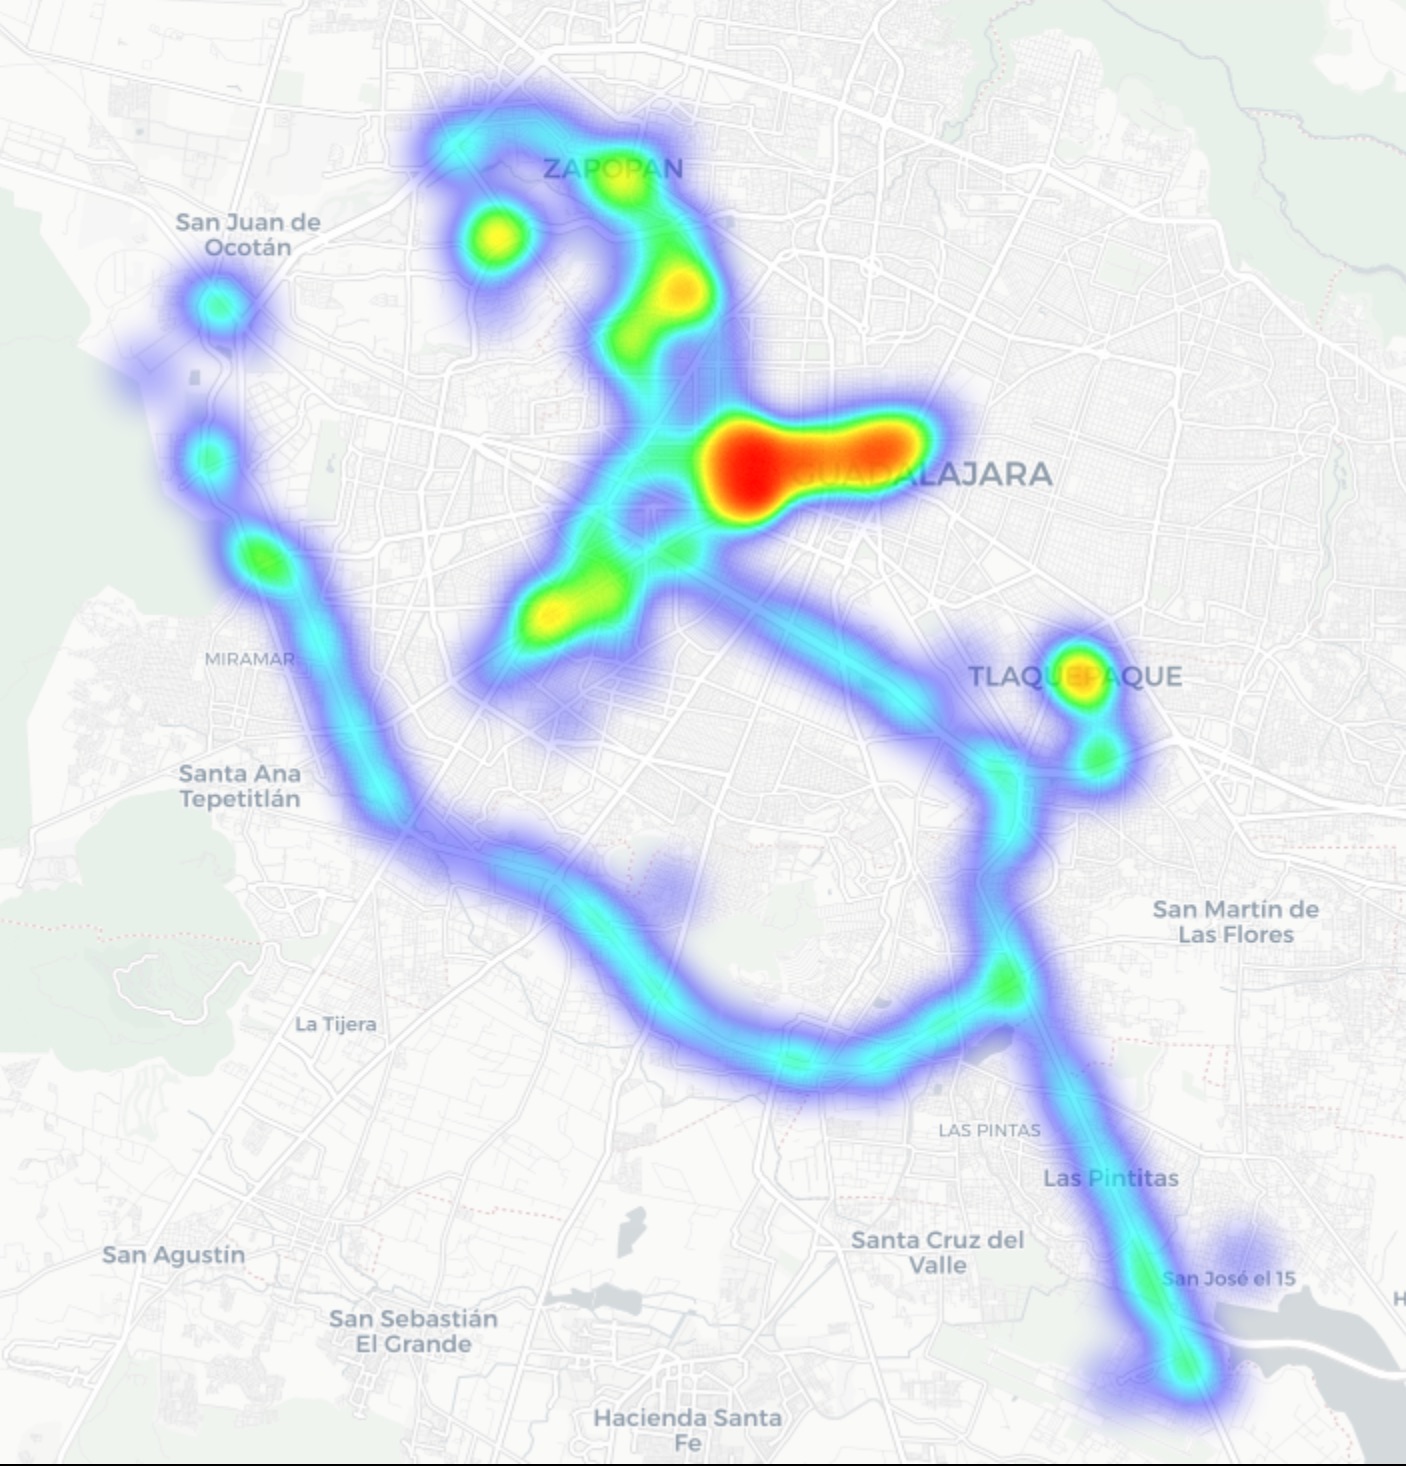
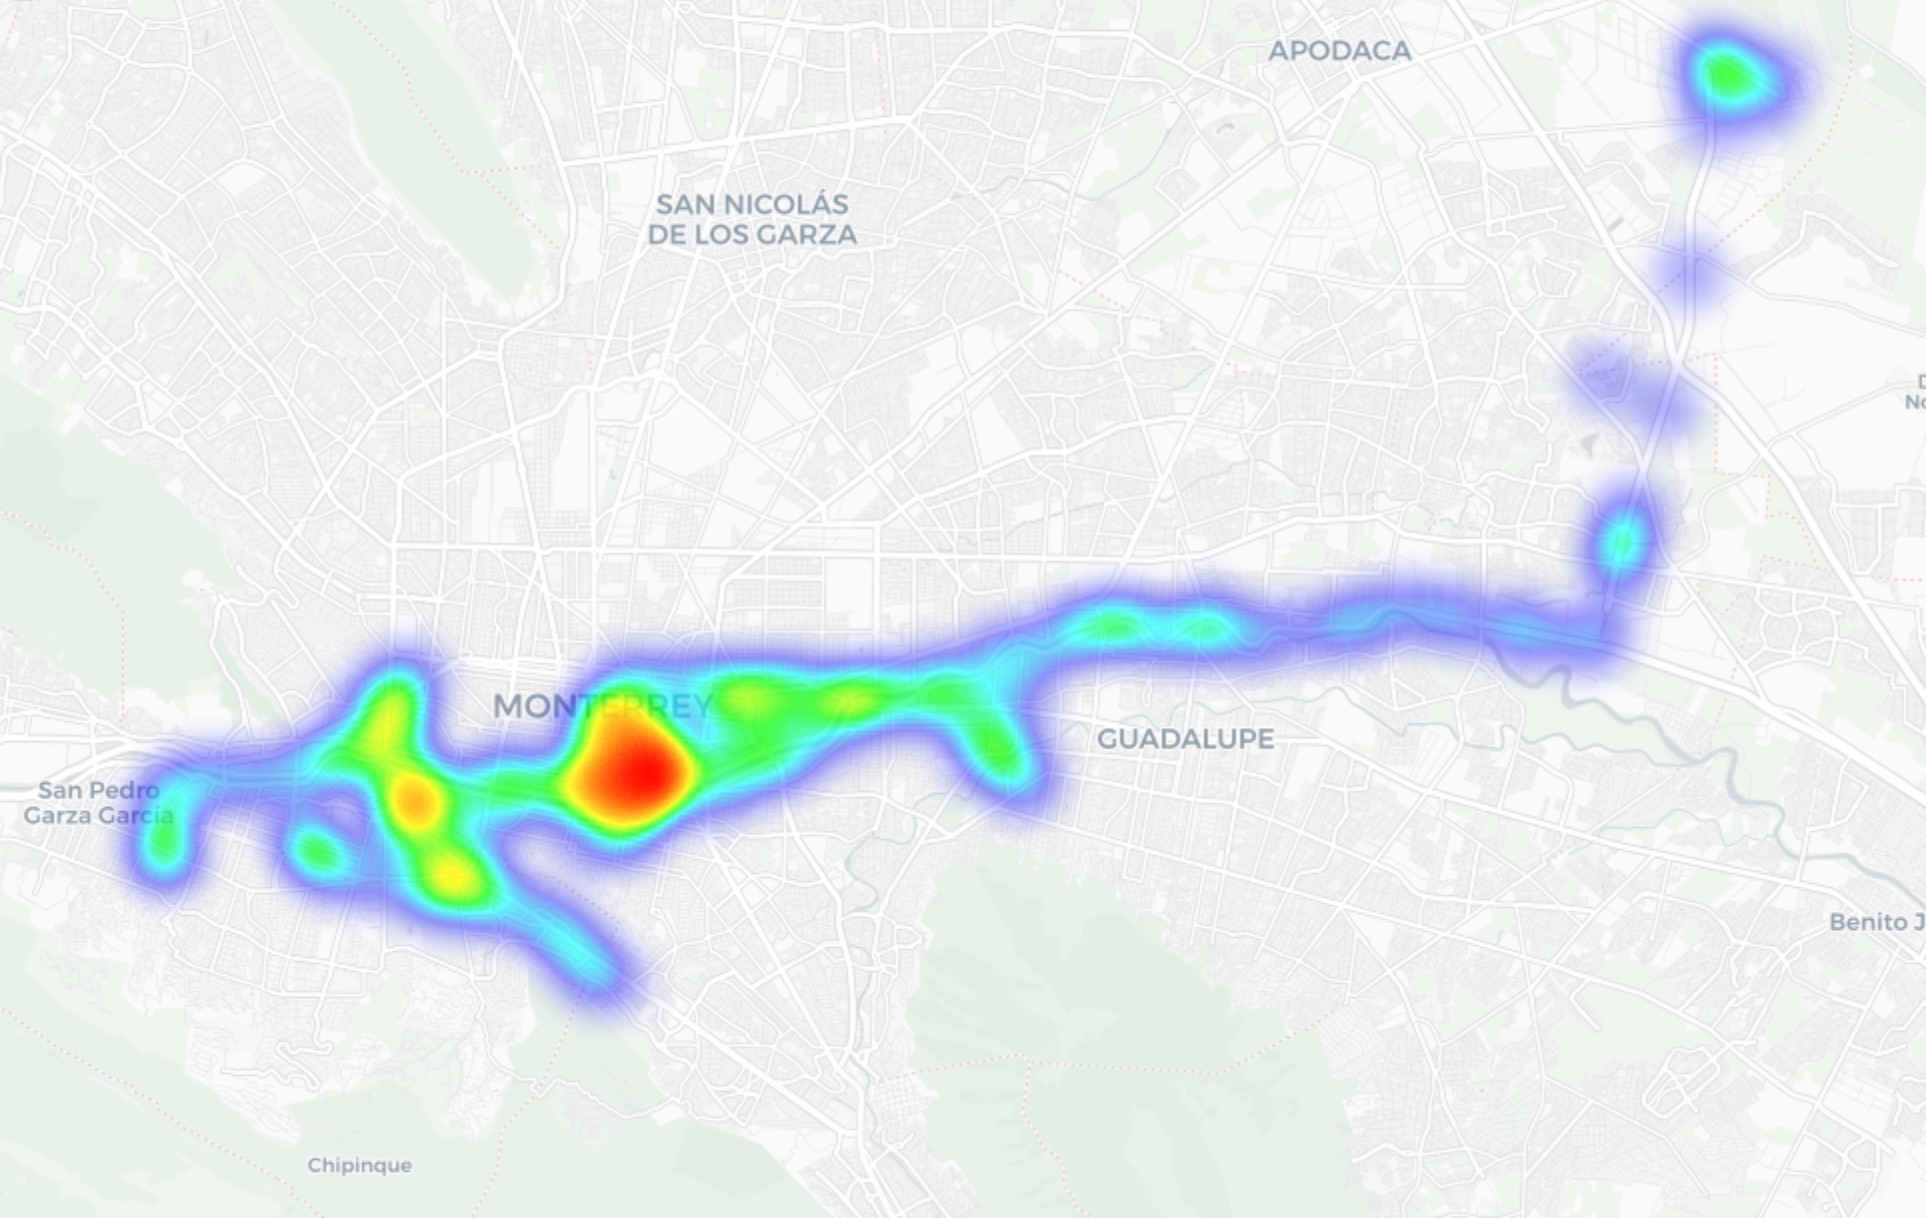
In Guadalajara and Monterrey, we drove similar routes: stadiums, main avenues, airports, and popular neighborhoods. Below you can see a heatmap of the areas we covered, ranging from red for areas with the highest density of public access points, through yellow and green, to blue for the lowest concentration.
Heatmap showing the locations of all Wi-Fi access points we covered in Mexico City
Heatmap showing the locations of all Wi-Fi access points we covered in Guadalajara
Heatmap showing the locations of all Wi-Fi access points we covered in Monterrey
We used passive radio reconnaissance to log 84 500 signals and 69 500 unique network identifiers across these three cities. The majority of the signals were caught in Mexico City (61.4%), followed by Guadalajara (23.6%) and Monterrey (14.8%).
What we analyzed:
Wireless network identifiers (SSIDs): the names that show up in your list of available Wi-Fi networks
Information that can be gleaned from these identifiers
Default router configurations and how ISPs deploy their networks
Frequencies used and signal characteristics
Channel load and radio frequency spectrum usage
Wireless network security configurations:
Open and insecure networks
Networks with WPS enabled
Secure networks (WPA2/WPA3) with WPS activated
You can find the full version of the study on the Securelist blog.
Telltale public Wi-Fi access point names
Network names (SSIDs) can tell you a lot by unintentionally revealing information about hardware manufacturers, ISPs, deployment methods, and whether an access point belongs to a business or a private user.
About 34% of the public Wi-Fi networks we logged didn’t bother changing their names at all, either sticking with the factory SSIDs from the router manufacturers or using standard naming conventions from their ISPs. For attackers, this can be a pretty solid hint, since this kind of network name lets them know which provider owns a given access point, what hardware is being used, and how it’s likely configured by default.
Another troubling nuance is the large number of Wi-Fi networks (over 30%) that use the access point’s MAC address (BSSID) as the visible network name. The first few bytes of a BSSID contain an Organizationally Unique Identifier (OUI), which gives away the router’s manufacturer. This is a useful lead for bad actors: they can find out who made the hardware and test for vulnerabilities specific to that brand’s models.
Is Mexican Wi-Fi well-protected?
An access point secured with WPA2/WPA3 can be considered more or less safe. All other authentication mechanisms yield much weaker results. We grouped the public Wi-Fi networks into four categories:
Secure (WPA2/WPA3)
Unsecured (open/WEP)
Weak (WPA)
Undetermined
The results are roughly the same across all three cities: about 82% of all analyzed access points are protected by secure standards. The outdated and insecure WPA protocol was practically nonexistent. However, more than 10% of the access points turned out to be completely unsecured. Connecting to these networks carries the risk of traffic interception and hidden surveillance.
But security isn’t evaluated by WPA protocols alone. We also checked for the presence of WPS, the infamous feature for quickly connecting to a network without entering a password, which is highly vulnerable to attacks. It turned out that WPS is enabled on nearly half (47%) of the access points in Mexico City, 43% in Guadalajara, and 41% in Monterrey. On average, 45% of the access points are potentially vulnerable to WPS-related attacks — sacrificing security for the sake of convenience.
What’s more, this feature frequently remained active even on seemingly secure WPA2/WPA3 networks — about half of them utilized WPS. This shows that having WPA2/WPA3 is still not enough to consider a Wi-Fi access point safe, as additional features like WPS can still leave the door open to attacks.
What else every tourist needs to know
Digital risks on a trip aren’t limited to public Wi-Fi alone, especially now that many are shifting away from public Wi-Fi to an eSIM. There are still plenty of threats in crowded places: public USB chargers, QR codes with swapped links, NFC and Bluetooth attacks, and, of course, social engineering tactics. Let’s break it all down.
Charging stations. Public USB chargers can also be dangerous: bad actors could potentially gain access to the data on your device or try to install malware. We covered these attacks in detail in our post, Data theft during smartphone charging.
Dangerous QR codes. Criminals can plant phishing QR codes in popular tourist spots. The pretexts can vary wildly; for instance, ads for team-specific fan “events”, or links supposedly offering discounts or restaurant menus. In reality, any QR code posted on the street can be considered insecure by default, and you shouldn’t scan them with your smartphone unless you have a QR code threat analyzer installed.
Fake broadcasts, tickets, and betting pools. Earlier, we described cases where bad actors were distributing malware via fake IPTV apps to capitalize on the WC26 hype. Remember, even if you plan to watch the tournament from home, you still need to stay alert and not trust the first sites that pop up advertising free broadcasts, offering betting pools, or promising unbelievably generous payouts.
Despite the prevalence of secure WPA2/WPA3 public Wi-Fi access points in Mexico City, Guadalajara, and Monterrey, our study shows that public Wi-Fi networks remain vulnerable. It’s also important to remember that attackers can create fake networks — so-called evil twins — disguised as legitimate public Wi-Fi in airports, hotels, cafés, and tourist spots.
For the average user, it’s practically impossible to tell how safe a specific access point is when trying to connect. That’s why the safest option is to use cellular data to access the internet — completely eliminating the need for Wi-Fi. Besides, there’s no need to research the nuances of local laws, rates, and other cellular details for every country you plan to visit; you can just buy a global eSIM online in two clicks. We explained how to make the entire process hassle-free in our post, Internet on the go with Kaspersky eSIM Store.
If you still plan on connecting to public Wi-Fi, always use a VPN to secure your device and data when connecting to unfamiliar — especially unsecured — Wi-Fi networks. This creates an encrypted tunnel between your device and the VPN server, making it impossible to intercept your data along the way. Haven’t picked a VPN yet? Try Kaspersky VPN Secure Connection, which is included with both Kaspersky Premium and Kaspersky Plus subscriptions.
Now, if you still plan to attend the World Cup without any cybersecurity solution, at least follow these basic rules of digital hygiene:
Don’t use public USB chargers
Don’t send sensitive information over connections that aren’t secure
Don’t log in to banking, email, or social media accounts over unsecured Wi-Fi
Turn off Bluetooth and NFC while walking around in crowded places
Don’t trust QR codes posted on the street
Connect to public Wi-Fi only when absolutely necessary
What else to read to make sure cheering for your favorite team isn’t only exciting, but also safe:
At the NDSS Symposium 2026 in San Diego in February, a group of respected researchers presented a study unveiling the AirSnitch attack, which bypasses the Wi-Fi client isolation feature — also commonly known as guest network or device isolation. This attack allows connecting to a single wireless network via an access point, and then gaining access to other connected devices, including those using entirely different service set identifiers (SSIDs) on that same hardware. Targeted devices could easily be running on wireless subnets protected by WPA2 or WPA3 protocols. The attack doesn’t actually break encryption; instead, it exploits the way access points handle group keys and packet routing.
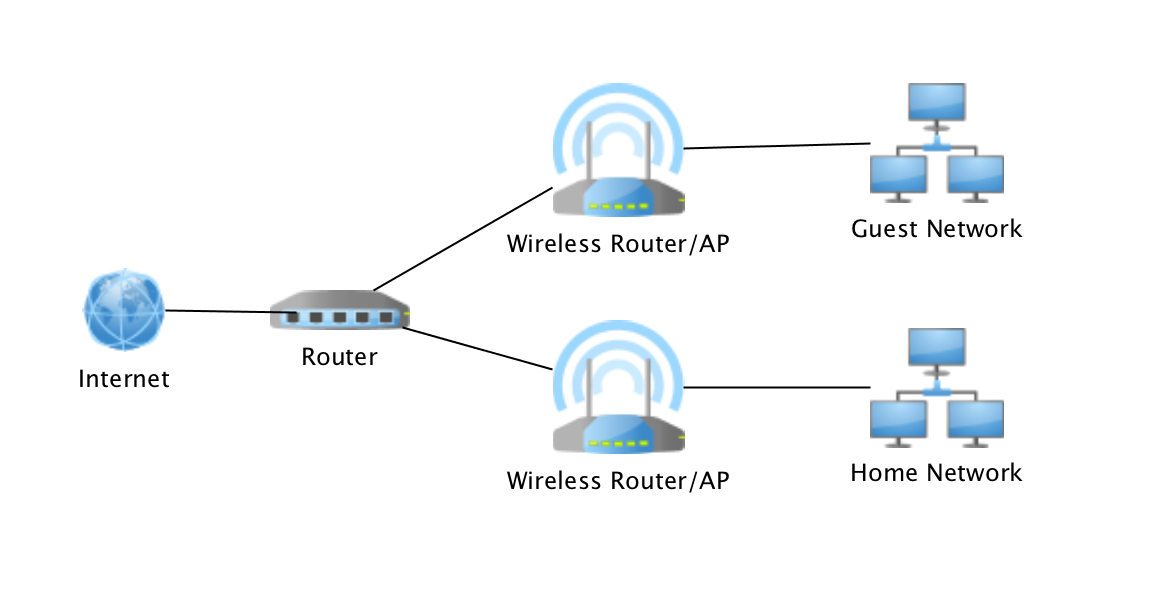
In practical terms, this means that a guest network provides very little in the way of real security. If your guest and employee networks are running on the same physical device, AirSnitch allows a connected attacker to inject malicious traffic into neighboring SSIDs. In some cases, they can even pull off a full-blown man-in-the-middle (MitM) attack.
Wi-Fi security and the role of isolation
Wi-Fi security is constantly evolving; every time a practical attack is made against the latest generation of protection, the industry shifts toward more complex algorithms and procedures. This cycle started with the FMS attacks used to crack WEP encryption keys, and continues to this day: recent examples include the KRACK attacks on WPA2, and the FragAttacks, which impacted every security protocol version from WEP all the way through WPA3.
Attacking modern Wi-Fi networks effectively (and quietly) is no small feat. Most professionals agree that using WPA2/WPA3 with complex keys and separating networks based on their purpose is usually enough for protection. However, only specialists really know that client isolation was never actually standardized within the IEEE 802.11 protocols. Different manufacturers implement isolation in completely different ways — using Layer 2 or Layer 3 of network architecture; in other words, handling it at either the router or the Wi-Fi controller level — meaning the behavior of isolated subnets varies wildly depending on your specific access point or router model.
While marketing claims that client isolation is perfect for keeping restaurant or hotel guests from attacking one another — or ensuring corporate visitors can’t access anything but the internet — in reality, isolation often relies on people not trying to hack it. This is exactly what the AirSnitch research highlights.
Types of AirSnitch attacks
The name AirSnitch doesn’t just refer to a single vulnerability, but a whole family of architectural flaws found in Wi-Fi access points. It’s also the name of an open-source tool used to test routers for these specific weaknesses. However, security professionals need to keep in mind that there’s only a very thin line between testing and attacking.
The model for all these attacks is the same: a malicious client is connected to an access point (AP) where isolation is active. Other users — the targets — are connected to the same SSID or even different SSIDs on that same AP. This is a very realistic scenario; for example, a guest network might be open and unencrypted, or an attacker could simply get the guest Wi-Fi password by posing as a legitimate visitor.
For certain AirSnitch attacks, the attacker needs to know the victim’s MAC or IP address beforehand. Ultimately, how effective each attack is depends on the specific hardware manufacturer (more on that below).
GTK attack
After the WPA2/WPA3 handshake, the access point and the clients agree on a Group Transient Key (GTK) to handle broadcast traffic. In this scenario, the attacker wraps packets destined for a specific victim inside a broadcast traffic envelope. They then send these directly to the victim while spoofing the access point’s MAC address. This attack only allows for traffic injection, meaning the attacker won’t receive a response. However, even that is enough to deliver malicious ICMPv6 routing advertisements, or DNS and ARP messages to the client — effectively bypassing isolation. This is the most universal version of the attack working on any WPA2/WPA3 network that uses a shared GTK. That said, some enterprise-grade access points support GTK randomization for each individual client, which renders this specific method ineffective.
Broadcast packet redirection
This version of the attack doesn’t even require the attacker to authenticate at the access point first. The attacker sends packets to the AP with a broadcast destination address (FF:FF:FF:FF:FF:FF) and the ToDS flag set to 1. As a result, many access points treat this packet as legitimate broadcast traffic; they encrypt it using the GTK, and blast it out to every client on the subnet, including the victim. Just like in the previous method, traffic specifically meant for a single victim can be pre-packaged inside.
Router redirection
This attack exploits an architectural gap between Layer 2 and Layer 3 security found in some manufacturers’ hardware. The attacker sends a packet to the access point, setting the victim’s IP address as the destination at the network layer (L3). However, at the wireless layer (L2), the destination is set to the access point’s own MAC address, so the isolation filter doesn’t trip. The routing subsystem (L3) then dutifully routes the packet back out to the victim, bypassing the L2 isolation entirely. Like the previous methods, this is another transmit-only attack where the attacker can’t see the reply.
Port stealing to intercept packets
The attacker connects to the network using a spoofed version of the victim’s MAC address, and floods the network with ARP responses claiming, “this MAC address is on my port and SSID”. The target network’s router updates its MAC tables, and starts sending the victim’s traffic to this new port instead. Consequently, traffic intended for the victim ends up with the attacker — even if the victim is connected to a completely different SSID.
In a scenario where the attacker connects via an open, unencrypted network, this means traffic meant for a client on a WPA2/WPA3-secured network is actually broadcast over the open air, where not only the attacker but anyone nearby can sniff it.
Port stealing to send packets
In this version, the attacker connects directly to the victim’s Wi-Fi adapter, and bombards it with ARP requests spoofing the access point’s MAC address. As a result, the victim’s computer starts sending its outgoing traffic to the attacker instead of the network. By running both stealing attacks simultaneously, an attacker can, in several scenarios, execute a full MitM attack.
Practical consequences of AirSnitch attacks
By combining several of the techniques described above, a hacker can pull off some pretty serious moves:
Complete bidirectional traffic interception for a MitM attack. This means they can snatch and modify data moving between the victim and the access point without the victim ever knowing.
Hopping between SSIDs. An attacker sitting on a guest network can reach hosts on a locked-down corporate network if both are running off the same physical access point.
Attacks on RADIUS. Since many companies use RADIUS authentication for their corporate Wi-Fi, an attacker can spoof the access point’s MAC address to intercept initial RADIUS authentication packets. From there, they can brute-force the shared secret. Once they have that, they can spin up a rogue RADIUS server and access point to hijack data from any device that connects to it.
Exposing unencrypted data from “secure” subnets: Traffic that’s supposed to be sent to a client under the protection of WPA2/WPA3 can be retransmitted onto an open guest network, where it’s essentially broadcast for anyone to hear.
To pull off these attacks effectively, a hacker needs a device capable of simultaneous data transmission and reception with both the victim’s adapter and the access point. In a real-world scenario, this usually means a laptop with two Wi-Fi adapters running specifically configured Linux drivers. It’s worth noting that the attack isn’t exactly silent: it requires a flood of ARP packets, it can cause brief Wi-Fi glitches when it starts, and network speeds might tank to around 10Mbps. Despite these red flags, it’s still very much a practical threat in many environments.
Vulnerable devices
As part of the study, several enterprise and home access points and routers were put to the test. The list included products from Cisco, Netgear, Ubiquiti, Tenda, D-Link, TP-Link, LANCOM, and ASUS, as well as routers running popular community firmware like DD-WRT and OpenWrt. Every single device tested was vulnerable to at least some of the attacks described here. Even more concerning, the D-Link DIR-3040 and LANCOM LX-6500 were susceptible to every single variation of AirSnitch.
Interestingly, some routers were equipped with protective mechanisms that blocked the attacks, even though the underlying architectural flaws were still present. For example, the Tenda RX2 Pro automatically disconnects any client whose MAC address appears on two BSSIDs simultaneously, which effectively shuts down port stealing.
The researchers emphasize that any network administrator or IT security team serious about defense should test their own specific configurations. That’s the only way to pinpoint exactly which threats are relevant to your organization’s setup.
How to protect your corporate network from AirSnitch
The threat is most immediate for organizations running guest and corporate Wi-Fi networks on the same access points without additional VLAN segmentation. There are also significant risks for companies using RADIUS with outdated settings or weak shared secrets for wireless authentication.
The bottom line is that we need to stop viewing client isolation on an access point as a real security measure, and start seeing it as just a convenience feature. Real security needs to be handled differently:
Segment the network using VLANs. Each SSID should have its own VLAN, with strict 802.1Q packet tagging maintained all the way from the access point to the firewall or router.
Implement stricter packet inspection at the routing level — depending on the hardware capabilities. Features like Dynamic ARP Inspection, DHCP snooping, and limiting the number of MAC addresses per port help defend against IP/MAC spoofing.
Enable individual GTK keys for each client, if your equipment supports it.
Use more resilient RADIUS and 802.1X settings, including modern cipher suites and robust shared secrets.
Log and analyze EAP/RADIUS authentication anomalies in your SIEM. This helps track many attack attempts beyond just AirSnitch. Other red flag events to watch for include the same MAC address appearing on different SSIDs, spikes in ARP requests, or clients rapidly jumping between BSSIDs or VLANs.
Apply security at higher levels of the network topology. Many of these attacks lose their punch if the organization has universally implemented TLS and HSTS for all business application traffic, requires an active VPN for all Wi-Fi connections, or has fully embraced a Zero Trust architecture.
Unlike previous Wi-Fi attacks, AirSnitch exploits core features in Layers 1 and 2 and the failure to bind and synchronize a client across these and higher layers, other nodes, and other network names such as SSIDs (Service Set Identifiers). This cross-layer identity desynchronization is the key driver of AirSnitch attacks.
The most powerful such attack is a full, bidirectional machine-in-the-middle (MitM) attack, meaning the attacker can view and modify data before it makes its way to the intended recipient. The attacker can be on the same SSID, a separate one, or even a separate network segment tied to the same AP. It works against small Wi-Fi networks in both homes and offices and large networks in enterprises.
With the ability to intercept all link-layer traffic (that is, the traffic as it passes between Layers 1 and 2), an attacker can perform other attacks on higher layers. The most dire consequence occurs when an Internet connection isn’t encrypted—something that Google recently estimated occurred when as much as 6 percent and 20 percent of pages loaded on Windows and Linux, respectively. In these cases, the attacker can view and modify all traffic in the clear and steal authentication cookies, passwords, payment card details, and any other sensitive data. Since many company intranets are sent in plaintext, traffic from them can also be intercepted.
Even when HTTPS is in place, an attacker can still intercept domain look-up traffic and use DNS cache poisoning to corrupt tables stored by the target’s operating system. The AirSnitch MitM also puts the attacker in the position to wage attacks against vulnerabilities that may not be patched. Attackers can also see the external IP addresses hosting webpages being visited and often correlate them with the precise URL.
In the world of cybersecurity, it’s important to understand what attack surfaces exist. The best way to understand something is by first doing it. Whether you’re an aspiring penetration tester, […]
Ethan Robish // In this series of posts, I’ll discuss how I segmented my home network using VLANs and how I moved away from using a risky consumer-grade router at […]
David Fletcher// My wife and I recently purchased a 2016 Ford Flex to replace an aging version of the same make and model that met an untimely fate. During the […]
Jordan Drysdale & Kent Ickler // Jordan and Kent demonstrate why there is only ONE correct way to configure your wireless networks. They also talk about the use of a […]

 Login
Login