Reading view

Predator spyware disables iOS camera and microphone indicators | Kaspersky official blog

Cybersecurity researchers have taken a close look at the inner workings of the Predator spyware, developed by the Cyprus-based company Intellexa. Rather than focusing on how the spyware initially infects a device, this latest research zooms in on how the malware behaves once a device has already been compromised.

The most fascinating discovery involves the mechanisms the Trojan uses to hide iOS camera and microphone indicators. By doing so, it can covertly spy on the infected user. In today’s post, we break down what Predator spyware actually is, how the iOS indicator system is designed to work, and how this malware manages to disable these indicators.

What Predator is, how it works, and what… Alien has to do with it

We previously took a deep dive into the most notorious commercial spyware out there in a dedicated feature — where we discussed the star of today’s post, Predator, among the others. You can check out that earlier post for a detailed review of this spyware, but for now, here’s a quick refresher on the essentials.

Predator was originally developed by a North Macedonian company named Cytrox. It was later acquired by the aforementioned Intellexa, a Cyprus-registered firm owned by a former Israeli intelligence officer — a truly international spy games collaboration.

Strictly speaking, Predator is the second half of a spyware duo designed to monitor iOS and Android users. The first component is named Alien; it’s responsible for compromising a device and installing Predator. As you might’ve guessed, these pieces of malware are named after the famous Alien vs. Predator franchise.

An attack using Intellexa’s software typically begins with a message containing a malicious link. When the victim clicks it, they’re directed to a site that leverages a chain of browser and OS vulnerabilities to infect the device. To keep things looking normal and avoid raising suspicion, the user is then redirected to a legitimate website.

Besides Alien, Intellexa offers several other delivery vehicles for landing Predator on a target’s device. These include the Mars and Jupiter systems, which are installed on the service provider’s side to infect devices through a man-in-the-middle attack.

Predator spyware for iOS comes packed with a wide array of surveillance tools. Most notably, it can record and transmit data from the device’s camera and microphone. Naturally, to keep the user from catching on to this suspicious activity, the system’s built-in recording indicators — the green and orange dots at the top of the screen — must be disabled. While it’s been known for some time that Predator could somehow hide these alerts, it’s only thanks to this research that we know how exactly it pulls it off.

How the iOS camera and microphone indicator system works

To understand how Predator disables these indicators, we first need to look at how iOS handles them. Since the release of iOS 14 in 2020, Apple devices have alerted users whenever the microphone or camera is active by displaying an orange or green dot at the top of the screen. If both are running simultaneously, only the green dot is shown.

Microphone usage indicator in iOS

In iOS 14 and later, an orange dot appears at the top of the screen when the microphone is in use. Source

Just like other iOS user interface elements, recording indicators are managed by a process called SpringBoard, which is responsible for the device’s system-wide UI. When an app starts using the camera or microphone, the system registers the change in that specific module’s state. This activity data is then gathered by an internal system component, which passes the information to SpringBoard for processing. Once SpringBoard receives word that the camera or microphone is active, it toggles the green or orange dot on or off based on that data.

Camera usage indicator in iOS

If the camera is in use (or both the camera and microphone are), a green dot appears. Source

From an app’s perspective, the process works like this: first, the app requests permission to access the camera or microphone through the standard iOS permission mechanism. When the app actually needs to use one or both of these modules, it calls the iOS system API. If the user has granted permission, iOS activates the requested module and automatically updates the status indicator. These indicators are strictly controlled by the operating system; third-party apps have no direct access to them.

How Predator interferes with the iOS camera and microphone indicators

Cybersecurity researchers analyzed a captured version of Predator and uncovered traces of multiple techniques used by the spyware’s creators to bypass built-in iOS mechanisms and disable recording indicators.

In the first approach — which appears to have been used during early development — the malware attempted to interfere with the indicators at the display stage right after SpringBoard received word that the camera or microphone was active. However, this method was likely deemed too complex and unreliable by the developers. As a result, this specific function remains in the Trojan as dead code — it’s never actually executed.

Ultimately, Predator settled on a simpler, more effective method that operates at the very level where the system receives data about the camera or microphone being turned on. To do this, Predator intercepts the communication between SpringBoard and the specific component responsible for collecting activity data from these modules.

By exploiting the specific characteristics of Objective-C — the programming language used to write the SpringBoard application — the malware completely blocks the signals indicating that the camera or microphone has been activated. As a result, SpringBoard never receives the signal that the module’s status has changed, so it never triggers the recording indicators.

How to lower your risk of spyware infection

Predator-grade spyware is quite expensive, and typically reserved for high-stakes industrial or state-sponsored espionage. On one hand, this means defending against such a high-tier threat is difficult — and achieving 100% protection is likely impossible. On the other hand, for these same reasons, the average user is statistically unlikely to be targeted.

However, if you’ve reason to believe you’re at risk from Predator or Pegasus-class spyware, here are a few steps you can take to make an attacker’s job much harder:

  • Don’t click suspicious links from unknown senders.
  • Regularly update your operating system, browsers, and messaging apps.
  • Reboot your device occasionally. A simple restart can often help “lose the tail”, forcing attackers to reinfect the device from scratch.
  • Install a reliable security solution on all the devices you use.

For a deeper dive into staying safe, check out security expert Costin Raiu’s post: Staying safe from Pegasus, Chrysaor and other APT mobile malware.

Curious about other ways your smartphone might be used to spy on you? Check out our related posts:


  •  

Threat landscape for industrial automation systems in Q3 2025

Statistics across all threats

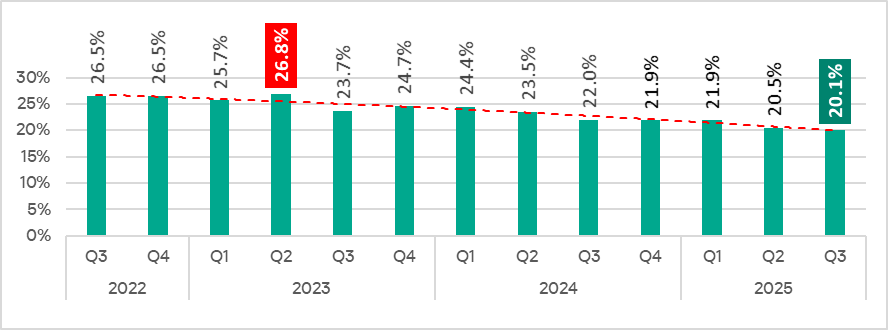
In Q3 2025, the percentage of ICS computers on which malicious objects were blocked decreased from the previous quarter by 0.4 pp to 20.1%. This is the lowest level for the observed period.

Percentage of ICS computers on which malicious objects were blocked, Q3 2022–Q3 2025

Percentage of ICS computers on which malicious objects were blocked, Q3 2022–Q3 2025

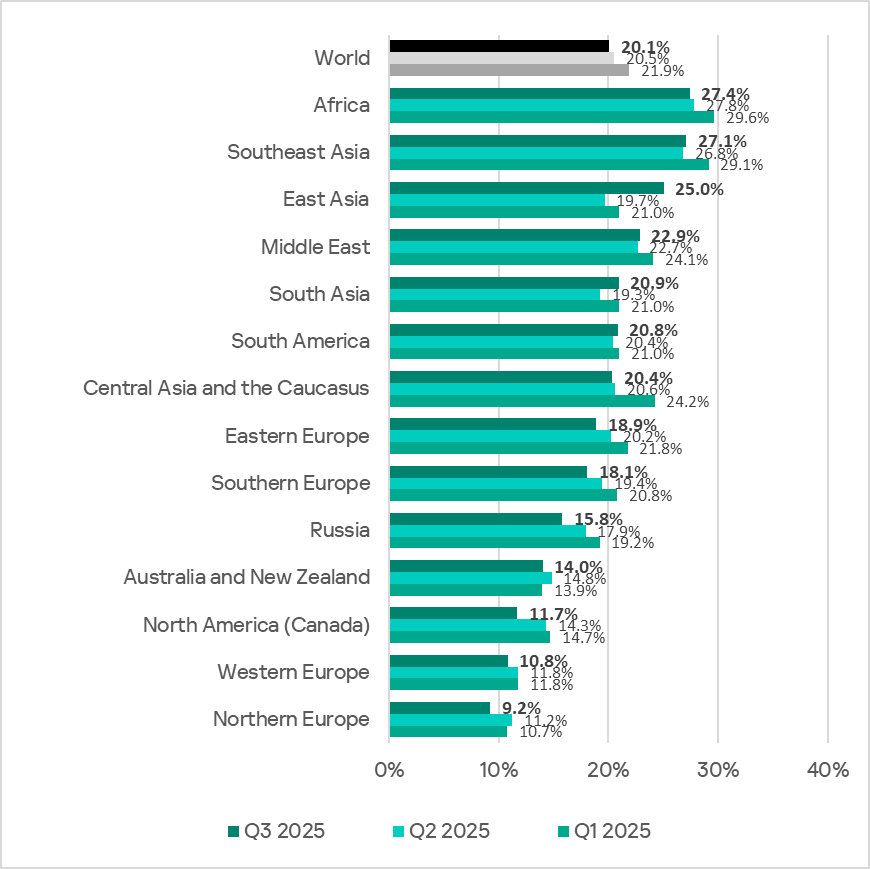
Regionally, the percentage of ICS computers on which malicious objects were blocked ranged from 9.2% in Northern Europe to 27.4% in Africa.

Regions ranked by percentage of ICS computers on which malicious objects were blocked

Regions ranked by percentage of ICS computers on which malicious objects were blocked

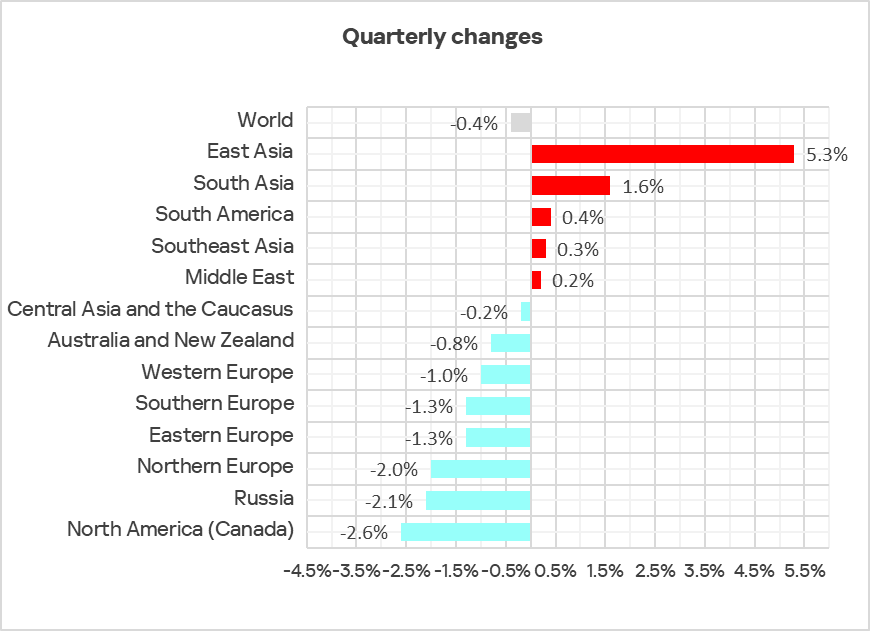
In Q3 2025, the percentage increased in five regions. The most notable increase occurred in East Asia, triggered by the local spread of malicious scripts in the OT infrastructure of engineering organizations and ICS integrators.

Changes in the percentage of ICS computers on which malicious objects were blocked, Q3 2025

Changes in the percentage of ICS computers on which malicious objects were blocked, Q3 2025

Selected industries

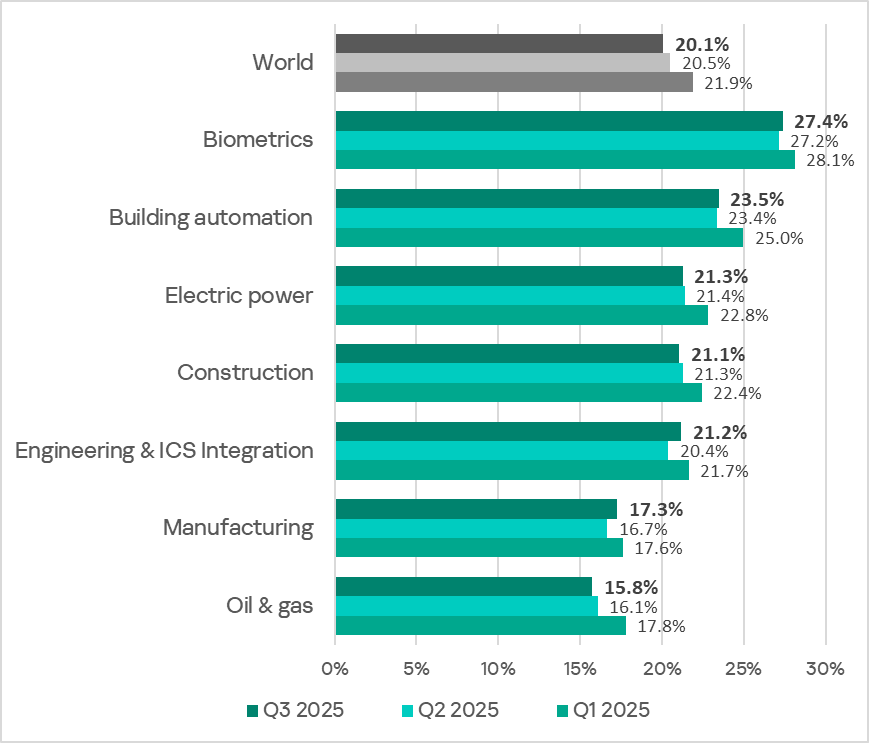
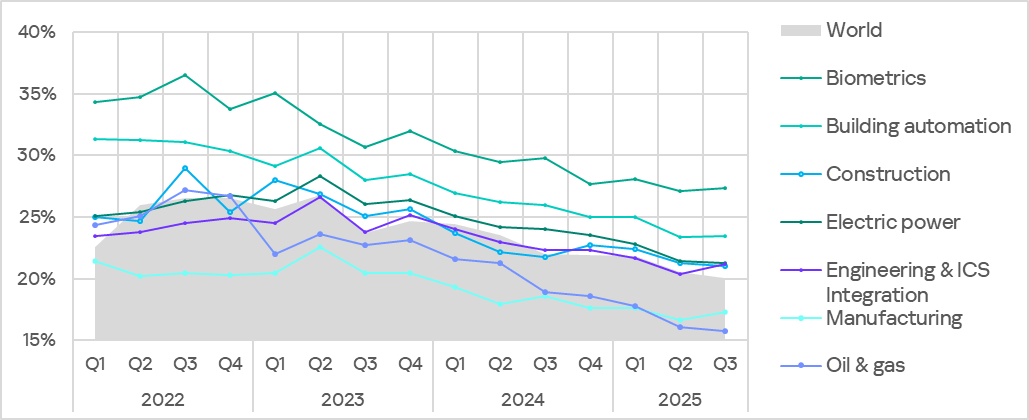
The biometrics sector traditionally led the rankings of the industries and OT infrastructures surveyed in this report in terms of the percentage of ICS computers on which malicious objects were blocked.

Rankings of industries and OT infrastructures by percentage of ICS computers on which malicious objects were blocked

Rankings of industries and OT infrastructures by percentage of ICS computers on which malicious objects were blocked

In Q3 2025, the percentage of ICS computers on which malicious objects were blocked increased in four of the seven surveyed industries. The most notable increases were in engineering and ICS integrators, and manufacturing.

Percentage of ICS computers on which malicious objects were blocked in selected industries

Percentage of ICS computers on which malicious objects were blocked in selected industries

Diversity of detected malicious objects

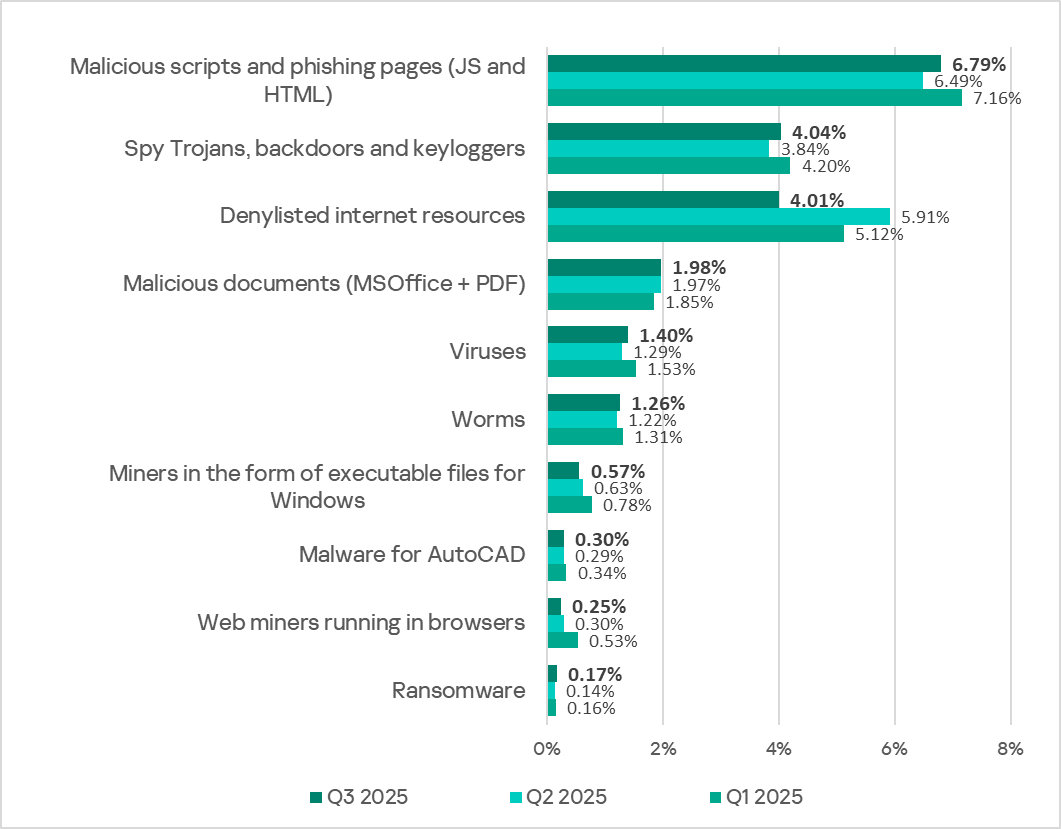
In Q3 2025, Kaspersky protection solutions blocked malware from 11,356 different malware families of various categories on industrial automation systems.

Percentage of ICS computers on which the activity of malicious objects of various categories was blocked

Percentage of ICS computers on which the activity of malicious objects of various categories was blocked

In Q3 2025, there was a decrease in the percentage of ICS computers on which denylisted internet resources and miners of both categories were blocked. These were the only categories that exhibited a decrease.

Main threat sources

Depending on the threat detection and blocking scenario, it is not always possible to reliably identify the source. The circumstantial evidence for a specific source can be the blocked threat’s type (category).

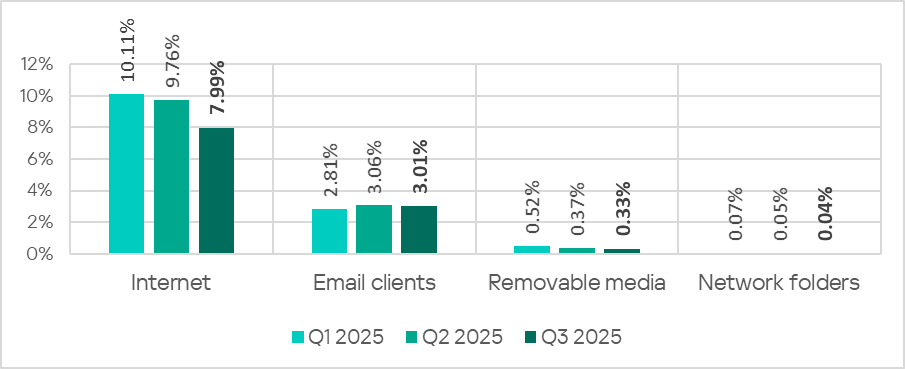
The internet (visiting malicious or compromised internet resources; malicious content distributed via messengers; cloud data storage and processing services and CDNs), email clients (phishing emails), and removable storage devices remain the primary sources of threats to computers in an organization’s technology infrastructure.

In Q3 2025, the percentage of ICS computers on which malicious objects from various sources were blocked decreased.

Percentage of ICS computers on which malicious objects from various sources were blocked

Percentage of ICS computers on which malicious objects from various sources were blocked

The same computer can be attacked by several categories of malware from the same source during a quarter. That computer is counted when calculating the percentage of attacked computers for each threat category, but is only counted once for the threat source (we count unique attacked computers). In addition, it is not always possible to accurately determine the initial infection attempt. Therefore, the total percentage of ICS computers on which various categories of threats from a certain source were blocked can exceed the percentage of threats from the source itself.

  • The main categories of threats from the internet blocked on ICS computers in Q3 2025 were malicious scripts and phishing pages, and denylisted internet resources. The percentage ranged from 4.57% in Northern Europe to 10.31% in Africa.
  • The main categories of threats from email clients blocked on ICS computers were malicious scripts and phishing pages, spyware, and malicious documents. Most of the spyware detected in phishing emails was delivered as a password-protected archive or a multi-layered script embedded in an office document. The percentage of ICS computers on which threats from email clients were blocked ranged from 0.78% in Russia to 6.85% in Southern Europe.
  • The main categories of threats that were blocked when removable media was connected to ICS computers were worms, viruses, and spyware. The percentage of ICS computers on which threats from this source were blocked ranged from 0.05% in Australia and New Zealand to 1.43% in Africa.
  • The main categories of threats that spread through network folders were viruses, AutoCAD malware, worms, and spyware. The percentages of ICS computers where threats from this source were blocked ranged from 0.006% in Northern Europe to 0.20% in East Asia.

Threat categories

Typical attacks blocked within an OT network are multi-step sequences of malicious activities, where each subsequent step of the attackers is aimed at increasing privileges and/or gaining access to other systems by exploiting the security problems of industrial enterprises, including technological infrastructures.

Malicious objects used for initial infection

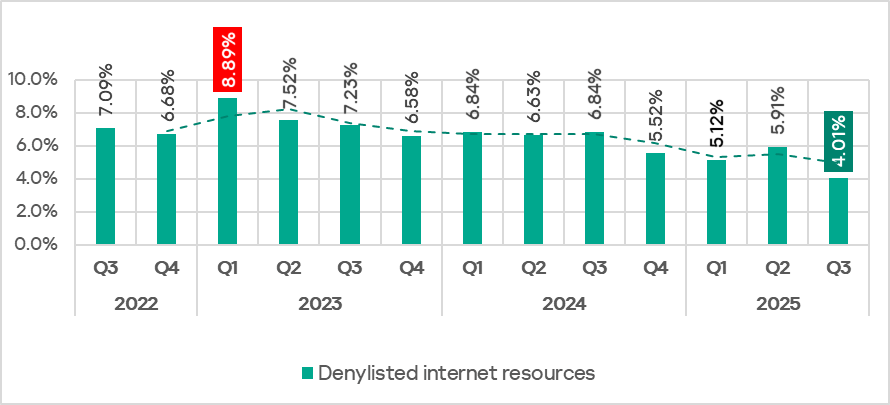
In Q3 2025, the percentage of ICS computers on which denylisted internet resources were blocked decreased to 4.01%. This is the lowest quarterly figure since the beginning of 2022.

Percentage of ICS computers on which denylisted internet resources were blocked, Q3 2022–Q3 2025

Percentage of ICS computers on which denylisted internet resources were blocked, Q3 2022–Q3 2025

Regionally, the percentage of ICS computers on which denylisted internet resources were blocked ranged from 2.35% in Australia and New Zealand to 4.96% in Africa. Southeast Asia and South Asia were also among the top three regions for this indicator.

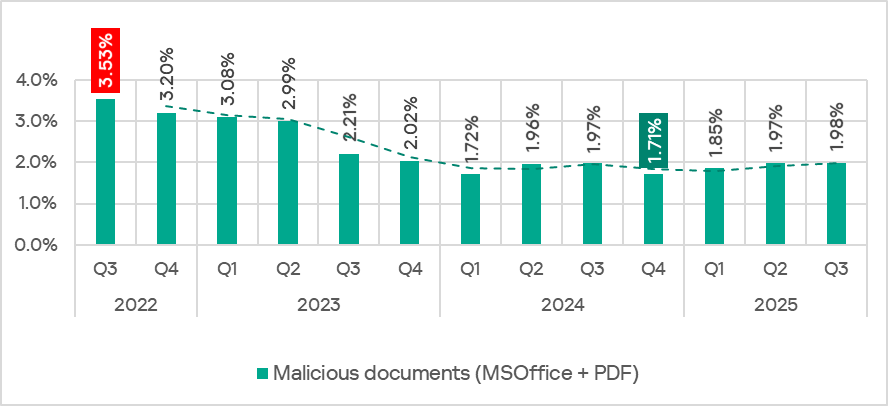
The percentage of ICS computers on which malicious documents were blocked has grown for three consecutive quarters, following a decline at the end of 2024. In Q3 2025, it reached 1,98%.

Percentage of ICS computers on which malicious documents were blocked, Q3 2022–Q3 2025

Percentage of ICS computers on which malicious documents were blocked, Q3 2022–Q3 2025

The indicator increased in four regions: South America, East Asia, Southeast Asia, and Australia and New Zealand. South America saw the largest increase as a result of a large-scale phishing campaign in which attackers used new exploits for an old vulnerability (CVE-2017-11882) in Microsoft Office Equation Editor to deliver various spyware to victims’ computers. It is noteworthy that the attackers in this phishing campaign used localized Spanish-language emails disguised as business correspondence.

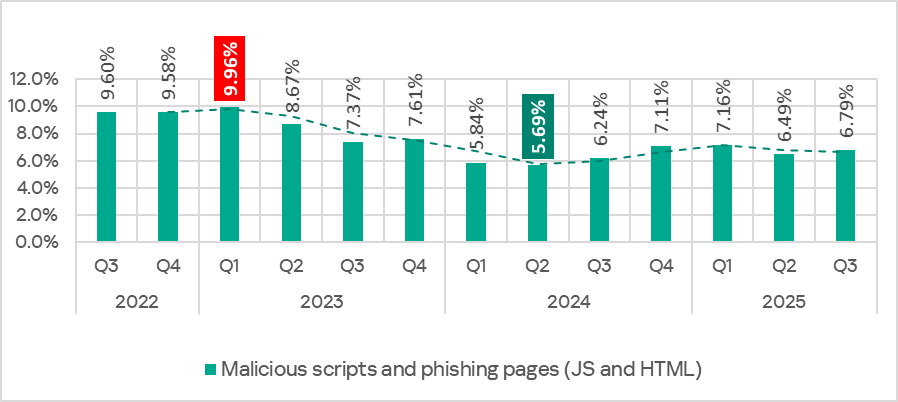
In Q3 2025, the percentage of ICS computers on which malicious scripts and phishing pages were blocked increased to 6.79%. This category led the rankings of threat categories in terms of the percentage of ICS computers on which they were blocked.

Percentage of ICS computers on which malicious scripts and phishing pages were blocked, Q3 2022–Q3 2025

Percentage of ICS computers on which malicious scripts and phishing pages were blocked, Q3 2022–Q3 2025

Regionally, the percentage of ICS computers on which malicious scripts and phishing pages were blocked ranged from 2.57% in Northern Europe to 9.41% in Africa. The top three regions for this indicator were Africa, East Asia, and South America. The indicator increased the most in East Asia (by a dramatic 5.23 pp) as a result of the local spread of malicious spyware scripts loaded into the memory of popular torrent clients including MediaGet.

Next-stage malware

Malicious objects used to initially infect computers deliver next-stage malware — spyware, ransomware, and miners — to victims’ computers. As a rule, the higher the percentage of ICS computers on which the initial infection malware is blocked, the higher the percentage for next-stage malware.
In Q3 2025, the percentage of ICS computers on which spyware and ransomware were blocked increased. The rates were:

  • spyware: 4.04% (up 0.20 pp);
  • ransomware: 0.17% (up 0.03 pp).

The percentage of ICS computers on which miners of both categories were blocked decreased. The rates were:

  • miners in the form of executable files for Windows: 0.57% (down 0.06 pp), it’s the lowest level since Q3 2022;
  • web miners: 0.25% (down 0.05 pp). This is the lowest level since Q3 2022.

Self-propagating malware

Self-propagating malware (worms and viruses) is a category unto itself. Worms and virus-infected files were originally used for initial infection, but as botnet functionality evolved, they took on next-stage characteristics.

To spread across ICS networks, viruses and worms rely on removable media and network folders in the form of infected files, such as archives with backups, office documents, pirated games and hacked applications. In rarer and more dangerous cases, web pages with network equipment settings, as well as files stored in internal document management systems, product lifecycle management (PLM) systems, resource management (ERP) systems and other web services are infected.

In Q3 2025, the percentage of ICS computers on which worms and viruses were blocked increased to 1.26% (by 0.04 pp) and 1.40% (by 0.11 pp), respectively.

AutoCAD malware

This category of malware can spread in a variety of ways, so it does not belong to a specific group.

In Q3 2025, the percentage of ICS computers on which AutoCAD malware was blocked slightly increased to 0.30% (by 0.01 pp).

For more information on industrial threats see the full version of the report.

  •  

Threat landscape for industrial automation systems in Q3 2025

Statistics across all threats

In Q3 2025, the percentage of ICS computers on which malicious objects were blocked decreased from the previous quarter by 0.4 pp to 20.1%. This is the lowest level for the observed period.

Percentage of ICS computers on which malicious objects were blocked, Q3 2022–Q3 2025

Percentage of ICS computers on which malicious objects were blocked, Q3 2022–Q3 2025

Regionally, the percentage of ICS computers on which malicious objects were blocked ranged from 9.2% in Northern Europe to 27.4% in Africa.

Regions ranked by percentage of ICS computers on which malicious objects were blocked

Regions ranked by percentage of ICS computers on which malicious objects were blocked

In Q3 2025, the percentage increased in five regions. The most notable increase occurred in East Asia, triggered by the local spread of malicious scripts in the OT infrastructure of engineering organizations and ICS integrators.

Changes in the percentage of ICS computers on which malicious objects were blocked, Q3 2025

Changes in the percentage of ICS computers on which malicious objects were blocked, Q3 2025

Selected industries

The biometrics sector traditionally led the rankings of the industries and OT infrastructures surveyed in this report in terms of the percentage of ICS computers on which malicious objects were blocked.

Rankings of industries and OT infrastructures by percentage of ICS computers on which malicious objects were blocked

Rankings of industries and OT infrastructures by percentage of ICS computers on which malicious objects were blocked

In Q3 2025, the percentage of ICS computers on which malicious objects were blocked increased in four of the seven surveyed industries. The most notable increases were in engineering and ICS integrators, and manufacturing.

Percentage of ICS computers on which malicious objects were blocked in selected industries

Percentage of ICS computers on which malicious objects were blocked in selected industries

Diversity of detected malicious objects

In Q3 2025, Kaspersky protection solutions blocked malware from 11,356 different malware families of various categories on industrial automation systems.

Percentage of ICS computers on which the activity of malicious objects of various categories was blocked

Percentage of ICS computers on which the activity of malicious objects of various categories was blocked

In Q3 2025, there was a decrease in the percentage of ICS computers on which denylisted internet resources and miners of both categories were blocked. These were the only categories that exhibited a decrease.

Main threat sources

Depending on the threat detection and blocking scenario, it is not always possible to reliably identify the source. The circumstantial evidence for a specific source can be the blocked threat’s type (category).

The internet (visiting malicious or compromised internet resources; malicious content distributed via messengers; cloud data storage and processing services and CDNs), email clients (phishing emails), and removable storage devices remain the primary sources of threats to computers in an organization’s technology infrastructure.

In Q3 2025, the percentage of ICS computers on which malicious objects from various sources were blocked decreased.

Percentage of ICS computers on which malicious objects from various sources were blocked

Percentage of ICS computers on which malicious objects from various sources were blocked

The same computer can be attacked by several categories of malware from the same source during a quarter. That computer is counted when calculating the percentage of attacked computers for each threat category, but is only counted once for the threat source (we count unique attacked computers). In addition, it is not always possible to accurately determine the initial infection attempt. Therefore, the total percentage of ICS computers on which various categories of threats from a certain source were blocked can exceed the percentage of threats from the source itself.

  • The main categories of threats from the internet blocked on ICS computers in Q3 2025 were malicious scripts and phishing pages, and denylisted internet resources. The percentage ranged from 4.57% in Northern Europe to 10.31% in Africa.
  • The main categories of threats from email clients blocked on ICS computers were malicious scripts and phishing pages, spyware, and malicious documents. Most of the spyware detected in phishing emails was delivered as a password-protected archive or a multi-layered script embedded in an office document. The percentage of ICS computers on which threats from email clients were blocked ranged from 0.78% in Russia to 6.85% in Southern Europe.
  • The main categories of threats that were blocked when removable media was connected to ICS computers were worms, viruses, and spyware. The percentage of ICS computers on which threats from this source were blocked ranged from 0.05% in Australia and New Zealand to 1.43% in Africa.
  • The main categories of threats that spread through network folders were viruses, AutoCAD malware, worms, and spyware. The percentages of ICS computers where threats from this source were blocked ranged from 0.006% in Northern Europe to 0.20% in East Asia.

Threat categories

Typical attacks blocked within an OT network are multi-step sequences of malicious activities, where each subsequent step of the attackers is aimed at increasing privileges and/or gaining access to other systems by exploiting the security problems of industrial enterprises, including technological infrastructures.

Malicious objects used for initial infection

In Q3 2025, the percentage of ICS computers on which denylisted internet resources were blocked decreased to 4.01%. This is the lowest quarterly figure since the beginning of 2022.

Percentage of ICS computers on which denylisted internet resources were blocked, Q3 2022–Q3 2025

Percentage of ICS computers on which denylisted internet resources were blocked, Q3 2022–Q3 2025

Regionally, the percentage of ICS computers on which denylisted internet resources were blocked ranged from 2.35% in Australia and New Zealand to 4.96% in Africa. Southeast Asia and South Asia were also among the top three regions for this indicator.

The percentage of ICS computers on which malicious documents were blocked has grown for three consecutive quarters, following a decline at the end of 2024. In Q3 2025, it reached 1,98%.

Percentage of ICS computers on which malicious documents were blocked, Q3 2022–Q3 2025

Percentage of ICS computers on which malicious documents were blocked, Q3 2022–Q3 2025

The indicator increased in four regions: South America, East Asia, Southeast Asia, and Australia and New Zealand. South America saw the largest increase as a result of a large-scale phishing campaign in which attackers used new exploits for an old vulnerability (CVE-2017-11882) in Microsoft Office Equation Editor to deliver various spyware to victims’ computers. It is noteworthy that the attackers in this phishing campaign used localized Spanish-language emails disguised as business correspondence.

In Q3 2025, the percentage of ICS computers on which malicious scripts and phishing pages were blocked increased to 6.79%. This category led the rankings of threat categories in terms of the percentage of ICS computers on which they were blocked.

Percentage of ICS computers on which malicious scripts and phishing pages were blocked, Q3 2022–Q3 2025

Percentage of ICS computers on which malicious scripts and phishing pages were blocked, Q3 2022–Q3 2025

Regionally, the percentage of ICS computers on which malicious scripts and phishing pages were blocked ranged from 2.57% in Northern Europe to 9.41% in Africa. The top three regions for this indicator were Africa, East Asia, and South America. The indicator increased the most in East Asia (by a dramatic 5.23 pp) as a result of the local spread of malicious spyware scripts loaded into the memory of popular torrent clients including MediaGet.

Next-stage malware

Malicious objects used to initially infect computers deliver next-stage malware — spyware, ransomware, and miners — to victims’ computers. As a rule, the higher the percentage of ICS computers on which the initial infection malware is blocked, the higher the percentage for next-stage malware.
In Q3 2025, the percentage of ICS computers on which spyware and ransomware were blocked increased. The rates were:

  • spyware: 4.04% (up 0.20 pp);
  • ransomware: 0.17% (up 0.03 pp).

The percentage of ICS computers on which miners of both categories were blocked decreased. The rates were:

  • miners in the form of executable files for Windows: 0.57% (down 0.06 pp), it’s the lowest level since Q3 2022;
  • web miners: 0.25% (down 0.05 pp). This is the lowest level since Q3 2022.

Self-propagating malware

Self-propagating malware (worms and viruses) is a category unto itself. Worms and virus-infected files were originally used for initial infection, but as botnet functionality evolved, they took on next-stage characteristics.

To spread across ICS networks, viruses and worms rely on removable media and network folders in the form of infected files, such as archives with backups, office documents, pirated games and hacked applications. In rarer and more dangerous cases, web pages with network equipment settings, as well as files stored in internal document management systems, product lifecycle management (PLM) systems, resource management (ERP) systems and other web services are infected.

In Q3 2025, the percentage of ICS computers on which worms and viruses were blocked increased to 1.26% (by 0.04 pp) and 1.40% (by 0.11 pp), respectively.

AutoCAD malware

This category of malware can spread in a variety of ways, so it does not belong to a specific group.

In Q3 2025, the percentage of ICS computers on which AutoCAD malware was blocked slightly increased to 0.30% (by 0.01 pp).

For more information on industrial threats see the full version of the report.

  •  

That One Time My Parents Were Hacked

Heather Doerges // My mom called the other day. It started out, “Honestly, your father.” Which, isn’t a strange way for her to start a conversation about my dad. “What […]

The post That One Time My Parents Were Hacked appeared first on Black Hills Information Security, Inc..

  •  
❌