Flashpoint was awarded U.S. Patent No. 12,705,360 for its Ransomware Risk model, which rates how closely new vulnerabilities match those used in ransomware attacks.
Vulnerability and exposure management (VM) teams need critical metadata and context that clearly show which issues pose an immediate risk to their organization. While traditional VM frameworks tell defenders how severe a vulnerability may be, they do not provide visibility into how likely threat actors are to exploit it. This leaves security teams overwhelmed in patch backlogs without a clear strategy for prioritization.
Nowhere is this prioritization gap more dangerous than with ransomware. Ransomware-as-a-Service (RaaS) groups no longer choose targets at random. They look for specific technical conditions that make vulnerability exploitation easy, fast, and repeatable. With RaaS attacks rising by 45% period-over-period in H1 2026, organizations need a way to identify the specific traits that make a vulnerability attractive to ransomware operators before an attack occurs.
Flashpoint built the Ransomware Risk score into Flashpoint Vulnerability Intelligence to solve exactly this problem. Since 2022, it has rated newly discovered vulnerabilities based on how closely they resemble those known to be used in ransomware attacks. With the grant of the U.S. Patent No. 12,705,360 on August 11, 2026, the methodology behind the score is now formally patented. This milestone formalizes Flashpoint’s ability to cut through the noise with a proven, threat-informed signal that gives defenders the clarity they need to act on Day Zero.
“As vulnerability disclosures surge, prioritization is more important than ever for security teams. A severity score alone can’t tell you which vulnerabilities pose the greatest real-world risk of exploitation by ransomware actors.
Our patented Ransomware Risk model applies years of threat intelligence to that problem, giving customers an earlier signal and helping them prioritize based on how attackers actually operate.”
josh lefkowitz, co-founder and ceo at flashpoint
Under the Hood: How Flashpoint’s Patented Ransomware Vulnerability Model Works
The patented system evaluates newly disclosed vulnerabilities against the patterns shared by vulnerabilities ransomware groups have exploited. Rather than trying to predict what threat actors will do next, the model learns what past ransomware-exploited vulnerabilities have in common and compares each new flaw against those patterns.
The Four Step Process
Multi-Factor Fingerprinting
Every vulnerability ingested into Flashpoint Vulnerability Intelligence is profiled against more than 60 distinct technical factors. This “fingerprinting” links the vulnerability to key inputs including whether the flaw is remotely exploitable without authentication, whether it affects SCADA or Operational Technology (OT) systems, and its potential impact on data availability, which is central to extortion schemes.
Coordinate Mapping
The model turns each multi-factor fingerprint into a set of values that place it as a single point on a map, so vulnerabilities with similar profiles land close together.
Identifying the Ransomware Neighborhood (Cluster Check)
Flashpoint overlays historical threat data onto the map to establish neighborhoods where vulnerabilities previously exploited in real-world ransomware attacks aggregate.
Similarity and Likelihood Rating
When a new vulnerability is ingested, its coordinates are checked against these neighborhoods. The scoring system calculates its spatial proximity to known ransomware vectors and assigns a clear rating: Low, Medium, High, or Critical.
This four-step method, developed by Flashpoint’s Ben Haynes and Jacob Kouns, is the basis of U.S. Patent No. 12,705,360.
What It Means for Vulnerability Management Teams
By translating complex structural attributes into a single risk score, the patented model delivers four key operational advantages:
Prioritize Beyond CVSS: Leveraging the Ransomware Risk model, security teams can confidently prioritize 1.0 to 6.9 CVSS issues if its structural profile lands it in a “High” or “Critical” ransomware cluster.
Act on Day Zero: Because the Flashpoint model rates all vulnerabilities on disclosure, security teams gain actionable guidance immediately, eliminating the need to wait weeks for external exploitation reports.
Effectively Communicate Risk: CISOs can present clear, business-centric risk statements rather than abstract numerical scores.
Adaptive Ratings: Scores update in near real time as vulnerability details change, and the model keeps adjusting as new vulnerabilities join the set it compares against.
Flashpoint’s Ransomware Risk model is built to enhance, not replace the vulnerability management frameworks organizations already rely on. In fact, it provides even greater value for security teams as our Ransomware Risk model provides clarity for every vulnerability detailed by Flashpoint Vulnerability Intelligence, including over 105,000 issues missed by CVE and NVD.
Within Flashpoint Ignite, security teams have a complete view of vulnerability risk, seeing the score alongside CVSS (v3 and v4), EPSS, Social Risk, and exploit maturity.
Patented Ransomware Risk Score sits beside CVSS and EPSS on every vulnerability record in Flashpoint Ignite
Protect Against Vulnerability and Ransomware Risk Using Flashpoint
Vulnerability management requires more than cataloging. It demands threat-informed prioritization that aligns security operations with real-world business risk. Flashpoint’s patented Ransomware Risk model eliminates guesswork by surfacing the flaws that match the profile of known ransomware targets, allowing security teams to patch what matters most, first.
By combining proprietary knowledge of vulnerability architecture and ransomware attacks, Flashpoint bridges the gap between theoretical and active exposure. Request a demo today to see how our Ransomware Risk model provides the definitive signal needed to stay ahead of extortion groups.
Ransomware Risk FAQs (Frequently Asked Questions)
What is the Ransomware Risk score?
The Ransomware Risk score is a rating in Flashpoint Vulnerability Intelligence that shows how closely a vulnerability resembles those known to be used in ransomware attacks. Each vulnerability is rated Low, Medium, High, or Critical, so security teams can see which ones to patch first to reduce their ransomware exposure.
How is Ransomware Risk different from CVSS and EPSS?
CVSS measures how severe a vulnerability could be, and EPSS estimates how likely it is to be exploited in general. Ransomware Risk adds a ransomware-specific signal that works alongside both, showing how closely a vulnerability matches those ransomware groups have used. In Flashpoint Ignite, all three scores appear together.
What does Flashpoint’s ransomware patent cover?
U.S. Patent No. 12,705,360, granted August 11, 2026, covers Flashpoint’s method for rating how likely a vulnerability is to be used in a ransomware event. Each vulnerability is profiled on more than 60 factors, compared with vulnerabilities used in past ransomware attacks, and rated by similarity. The patent formalizes the model behind the Ransomware Risk score, live since 2022.
How often are Ransomware Risk scores updated?
Ransomware Risk scores update in near real time, so new vulnerabilities are rated as soon as they’re disclosed. The model also keeps adjusting as new vulnerabilities join the body it compares against, so ratings reflect the ransomware landscape as it stands today.
Written by: Robin Grunewald, Supriya Mazumdar, Kelli Vanderlee
Introduction
Google Threat Intelligence Group (GTIG) examines vulnerability disclosure and exploitation statistics to evaluate the impact of artificial intelligence (AI) on the vulnerability threat landscape. We found that AI is measurably changing not just the pace of vulnerability discovery and exploitation, but also the types and typical risk profiles of vulnerabilities that are being discovered.
Key findings:
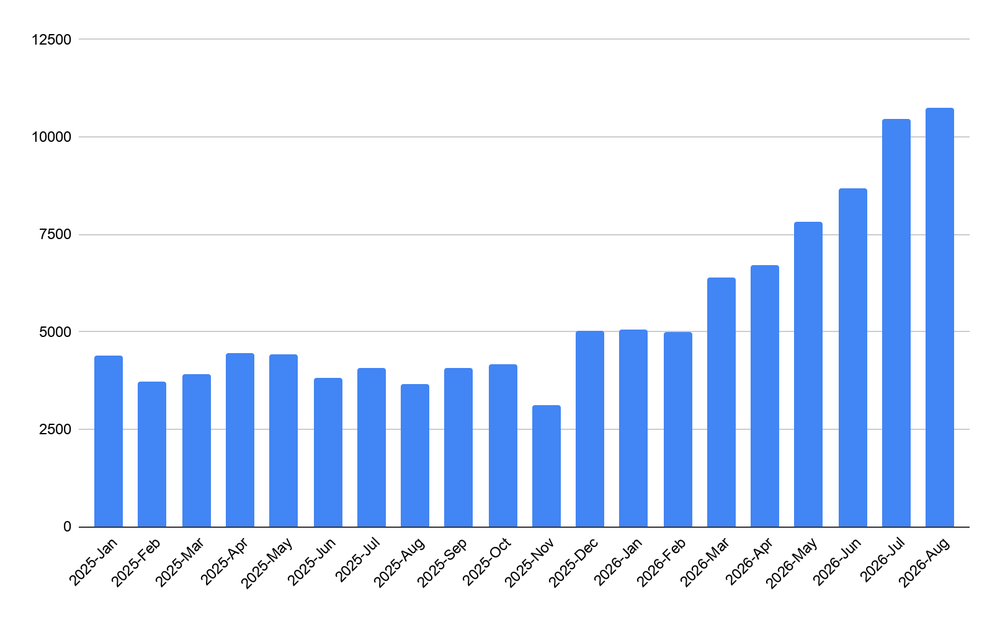
Vulnerability disclosures doubled: the number of vulnerabilities disclosed per month doubled, rising from 5,045 in January 2026 to 10,477 in July and continuing to climb to 10,740 in August 2026.
Vulnerability exploitation nearly doubled: the number of vulnerabilities exploited increased from an average of 10.5 per month in 2025 to an average of 18 per month from January 2026 to August 2026.
Zero-day exploitation increased marginally: zero-day vulnerability exploitation grew from an average of 8 per month in 2025 to an average of 11 per month from January 2026 to August 2026.
AI finds more consequential vulnerabilities: AI-assisted discovery found proportionally fewer Low-Risk vulnerabilities, more Moderate-Risk vulnerabilities, and more vulnerabilities leading to remote code execution (RCE).
GTIG expects that vulnerability discovery and exploitation will continue to grow in the short to medium term. To counter the increased risk from rapid vulnerability discovery and exploitation, organizations must transition from unprioritized mass-patching to threat-intelligence-driven triage, combining targeted edge-defense with automated, agentic remediation.
Scope & Methodology
This GTIG analysis examines trends in vulnerabilities disclosed from January 1, 2025 through August 31, 2026. The dataset tracks the vulnerabilities alongside critical operational dimensions, including exploitation consequences and GTIG Vulnerability Risk Ratings, and in-the-wild exploitation. When we refer to risk ratings in this blog, we are using GTIG vulnerability risk ratings, not CVSS severity.
While the baseline monitoring encompasses the full 20-month window (January 2025–August 2026), this report specifically focuses on growth velocity and emerging threat vectors.
The research seeks to evaluate the impact of AI across the cybersecurity landscape both in terms of rates of Common Vulnerabilities and Exposures (CVE) disclosure and rates of exploitation. We also examine vulnerabilities targeting the AI/large language model (LLM) operational stack.
CVE Disclosure Doubled in 2026
Vulnerability disclosures doubled from 5,045 in January 2026 to 10,477 in July, with the count of disclosed vulnerabilities reaching a peak of 10,740 in August (Figure 1).
Distinguishing Threat Risk from CVE Inflation
However, raw disclosure volume throughout 2026 can be misleading without threat intelligence context. Automated CVE Numbering Authority (CNA) assignment policies across open-source ecosystems can inflate baseline figures; for instance, vulnerabilities with a description containing “Linux Kernel” alone generated approximately 5,000 CVEs between January 2026 and August 2026 with zero observed exploited in-the-wild zero-days.
Figure 1: Count of vulnerabilities disclosed, January 2025 - August 2026 (Source: GTIG)
In terms of risk ratings, the most interesting increase occurred in High-Risk vulnerabilities, which surged from 131 disclosures in January 2026 to 350 in August 2026, a 167% growth (Figure 2). High-Risk vulnerabilities remain a small proportion (3% in August 2026) of all vulnerabilities disclosed.
Figure 2: Count of vulnerabilities disclosed by GTIG vulnerability risk rating, January 2025 - August 2026 (Source: GTIG)
The increase in High-Risk vulnerabilities throughout 2026 was driven by two compounding dynamics: a widening pool of affected vendors and concentrated vendor disclosure cycles. Across the broader software ecosystem, baseline High-Risk disclosures more than doubled over the past year, rising from ~65/month in mid-2025 to ~135/month in mid-2026 (Figure 3). On top of this elevated baseline, Figure 3 highlights two time frames in which particular vendors reported exceptionally high quantities of CVEs, pushing monthly volumes to historic peaks:
TOTOLINK: In April and May, mass research disclosures against consumer router firmware added 75 High-Risk flaws, driving the mid-year spike in Command Execution vulnerabilities.
Oracle & Linux: In June, July, and August Oracle’s quarterly Critical Patch Update (CPU) across middleware like WebLogic and Coherence combined with Linux kernel network driver advisories to contribute 128 High-Risk vulnerabilities in August alone (nearly 37% of all High-Risk disclosures), directly fueling growth in Remote Code Execution vulnerabilities.
Figure 3: Count of vulnerabilities High Risk disclosed by Vendor, January 2025 to August 2026 (Source: GTIG)
In-the-Wild Exploitation
From January 2026 to August 2026, GTIG recorded 141 distinct vulnerabilities disclosed and exploited, surpassing the total number of vulnerabilities exploited for the full year of 2025 (127). In-the-wild exploitation increased from an average of 10.5 per month in 2025 to 18 per month in 2026. However, it is important to note that the proportion of vulnerabilities exploited versus disclosed remains vanishingly small: only 0.23% of all disclosed vulnerabilities in 2026 (roughly 1 in 431) were ever observed in active exploitation, or on the order of tens versus thousands per month. This means that monthly exploitation counts can more easily be influenced by other factors such as vendor disclosure cycles and threat actor campaign spikes. Since May 2026, a shift has emerged, with the expansion of CVE exploitation (+127% indexed growth) closely mirroring disclosure growth (+128% indexed growth), scaling in tandem with the overall vulnerability landscape rather than outpacing it.
Figure 4: Count of all vulnerabilities exploited, by n-days and zero-days, January 2025 to August 2026 (Source: GTIG)
Zero-Day Exploitation Remains Stable
The count of zero-days exploited increased marginally from an average of 8 per month in 2025 to an average of 11 per month in 2026. While the number of zero-days identified per month remained near baseline levels (between 8 and 12) through mid-2026, in August, the count jumped to 22 (Figure 4). Zero-day exploitation also continues to represent a very small proportion of all vulnerabilities disclosed, though it still constitutes the majority (62%) of all observed exploited vulnerabilities from January 2026 to August 2026.
Are Threat Actors Finding More Success with Exploiting N-Days?
It is possible that threat actors are finding it more accessible or efficient to use LLMs and AI tools to automate analysis of differences between product versions, patches, vulnerability disclosure announcements, and Proof-of-Concept (POC) code to rapidly weaponize n-days, rather than to discover new zero-days.
With zero-day exploitation rates increasing only marginally, we suggest that the primary source of growth in vulnerability exploitation from January 2026 to August 2026 has been concentrated in the rapid weaponization of n-days. Significantly, exploitation of High-Risk vulnerabilities more than doubled from 28 in 2025 to 75 from January 2026 to August 2026.
Figure 5: Count of vulnerabilities exploited in the wild by GTIG vulnerability risk rating, January 2025 - August 2026 (Source: GTIG)
Exploitation by Attack Surface
Vulnerabilities affecting Edge and Security Appliances represented 14% of vulnerabilities exploited from January 2026 to August 2026, while 11% affected Enterprise Directory & Collaboration hubs. Edge gateways represent a premier initial-access vector: over 65% of edge flaws exploited from January 2026 to August 2026 met High/Critical Threat Risk ratings, with adversaries aggressively targeting unauthenticated public management interfaces to capitalize on enterprise EDR agent blind spots.
While CVE discovery volume metrics surge, adversary exploitation activity remains concentrated in perimeter appliances and exposed enterprise services.
Comparing Growth Rates For Specified Categories
Plotting raw monthly counts hides relative momentum due to the vast disparity between single-digit zero-day discoveries and more than 10,000 vulnerabilities disclosed in the month of August, for example. To enable a direct comparison of growth rates across vulnerability tiers, Figure 7 indexes four metrics to a baseline of 0 in January 2025 and provides a trendline of the three month rolling average growth rate:
Overall CVE Disclosure (128%): As previously stated, raw counts of CVE disclosures doubled from January 2026 to August 2026. The three month rolling average growth rate suggests that CVE disclosures have steadily accelerated in 2026.
High-Risk Vulnerabilities Disclosed (241%): Demonstrated the steepest growth across the dataset, climbing to almost a 3.5x its initial baseline (a +241% increase) by August 2026. Excluding Linux, Oracle, and Totolink, the rate of increase was just 128% from January 2025 to August 2026.
CVE Exploitation in the Wild (127%): From January to August 2026, CVE exploitation has increased at approximately the same rate as overall CVE disclosure, though the three month rolling average trendline suggests that growth in exploitation did not begin to pick up until the second quarter of 2026.
Zero-Days Exploited (59%): While remaining near baseline levels (between 8 and 12 zero-days per month) through mid-2026, in August, the count reached 22. This increase is reflected in the three month rolling average growth rate, which began to reveal an upward trend in the summer of 2026.
This clear visual divergence underscores that the moderate increase in vulnerability exploitation in 2026 is driven by the rapid, targeted weaponization of high-risk exploits in the wild vulnerabilities rather than a flood of new zero-days.
Figure 6: 3 Month Rolling Average of % Growth, Indexed to 0% at January 2025 (Source: GTIG)
AI as the Hunter: AI-Assisted Vulnerability Discovery
Detection Methodology & Attribution Realities
Current public data significantly undercount vulnerabilities discovered by AI due to two structural dynamics:
Absence of Standardized Metadata: Public CVE repositories do not yet feature uniform metadata tags for AI attribution, requiring manual heuristic tracking.
Silent First-Party & Cloud Patching: Major cloud and SaaS providers routinely remediate AI-surfaced vulnerabilities directly in production without requesting formal CVE IDs, as CVE assignments are typically reserved for on-premise or third-party software requiring customer patching coordination. Many findings also remain embargoed for a period during established Coordinated Vulnerability Disclosure (CVD) windows.
However, we can identify vulnerabilities likely surfaced by autonomous agents using a multi-tier verification process:
Verified Lab & Vendor Ledgers: Directly ingesting confirmed disclosures from frontier AI research programs.
Advisory & Release Parsing: Programmatically monitoring Cybersecurity and Infrastructure Security Agency (CISA) advisories, MITRE records, and vendor security bulletins for explicit acknowledgments attributing root-cause discovery or PoC synthesis to autonomous AI agents (e.g., Hacktron AI, AISLE).
Risk Profile Divergence: AI vs. Conventional Discovery
Analyzing disclosed vulnerabilities we were able to identify as likely AI discovered suggests a structural divergence from conventional human and scanner discoveries. AI agents have been used to surface proportionally fewer Low-Risk vulnerabilities, and proportionally more Medium- and High-Risk vulnerabilities.
GTIG CVE Risk Rating
CVE Not Discovered by AI
CVE DIscovered by AI
Low
69%
39%
Medium
28%
58%
High
3%
4%
Table 1: Share of vulnerabilities per risk rating - AI vs. Non AI discovery - Jan to August 2026 (Source: GTIG)
Conventional CVE disclosures are dominated by low-severity findings (69% Low Threat Risk, 28% Medium). In contrast, AI-discovered vulnerabilities invert this distribution: 58% qualify for Medium Threat Risk (more than double the baseline), while low-risk findings drop to 39%.
This distribution largely likely reflects how research programs scope and deploy these systems. Rather than running broad, automated scans for cosmetic flaws or compliance warnings, researchers deliberately prompt and task autonomous agents with auditing critical infrastructure and sensitive privilege boundaries, focusing on high-impact findings. Mandiant has described similar findings when using a specialized Agentic Vulnerability Discovery Harness (AVDH) in point-in-time assessments of client codebases.
Figure 7: Share of vulnerabilities per exploitation consequence - AI vs. Non AI discovery (Source: GTIG)
Divergence between AI-discovered vulnerabilities and vulnerabilities not discovered by AI is also apparent in terms of exploitation consequences. Exactly 50% of all AI-discovered vulnerabilities result in Remote Code Execution (RCE), compared to just 26% across the broader CVE ecosystem. Conversely, AI agents under-index in lower-impact categories, surfacing less than half the rate of Information Disclosure (8% vs. 18%) and Data Manipulation (5% vs. 9%) as vulnerabilities not identified as discovered by AI.
This concentration on code execution likely stems from how frontier agents operate. Autonomous systems are engineered to navigate complex, multi-step semantic code paths across core C/C++ libraries, runtimes, and hypervisors. By synthesizing fuzzing harnesses, modeling memory states, and chaining obscure edge-case logic, AI models excel at identifying memory corruption (buffer overflows, use-after-free) and logic bypasses that consistently elude traditional static analyzers.
While currently an early indicator rather than an established trend, confirmed exploitation of AI-discovered vulnerabilities demonstrates that increased risk from AI-discovered flaws is not purely theoretical.
A notable case is CVE-2026-1731, an unauthenticated OS command injection flaw in BeyondTrust Privileged Remote Access (PRA) and Remote Support that was discovered autonomously by a third-party research agent (Hacktron AI). Following public disclosure, GTIG observed threat actors weaponize this vulnerability in targeted initial-access campaigns to bypass enterprise perimeters. More specifically, within four days of public disclosure, GTIG observed a threat cluster exploiting this vulnerability, followed by five additional threat clusters within seven days of public disclosure. GTIG observed these threat actors collectively conduct a variety of post-exploitation activities, including privilege escalation, data exfiltration, and dropping secondary payloads including SNOWLIGHT, SPARKRAT, and cryptominers. This operational collision highlights that defensive AI agents are uncovering high-impact vulnerabilities that threat actors actively seek to exploit.
AI as the Hunted: Vulnerabilities Targeting the AI/LLM Operational Stack
Architectural Breakdown of AI Stack Vulnerabilities
As enterprise adoption of generative AI accelerates, security research and adversary interest have also focused on vulnerabilities in the underlying AI operational stack. Across the January 2025–August 2026 monitoring window, GTIG tracked 2,076 cumulative AI-related CVE disclosures, with over 1,500 vulnerabilities identified from January 2026 to August 2026 alone across eight core architectural layers:
Unauthenticated Administrative APIs, model checkpoint deserialization, memory corruption in tensor backends, and multi-tenant resource exhaustion.
212
Model Security Advisories
Foundation Model Weights, System Prompts, Guardrails, Evaluators (Garak, Lakera, Promptfoo)
Direct & Indirect Prompt Injection, system prompt exfiltration, guardrail bypasses, training data poisoning, and excessive agent autonomy.
106
ML Frameworks & Hubs
PyTorch, Hugging Face (Hub/Datasets), Transformers, ONNX Runtime, TensorFlow, Diffusers, DeepSpeed, Safetensors, Keras
Memory safety violations (heap overflows, out-of-bounds reads in C++ tensor operators) and arbitrary file overwrites via malicious model/dataset archive extraction.
99
Frontier Models
Anthropic, Gemini, OpenAI
Arbitrary Code Execution (RCE) and Command Injection via unvalidated CLI shell interpolation and implicit execution of untrusted workspace configs, Sandbox Escape via Git worktree directory confusion and memory tool symlink traversal; and Covert Data Exfiltration via indirect prompt injection-induced Markdown image rendering and permissive network fetch allowlists.
Unauthenticated collection manipulation, Remote Code Execution via clustering/indexing plugins, and metadata SQL/JSON query injection.
19
Table 2: Break down of vulnerabilities targeting AI systems (Source: GTIG)
Emerging Battlegrounds: Orchestration & Inference
From January 2026 through August 2026, disclosures of AI application vulnerabilities were heavily concentrated in three core areas: agent orchestration frameworks, backend serving infrastructure, and enterprise AI gateways:
Agent Orchestration as the Primary Chokepoint: Orchestration middleware accounts for 50% of all AI-related flaws, experiencing a +347% surge in disclosures in 2026. Visual workflow builders (e.g., Flowise, Langflow) and autonomous frameworks often deploy dynamic code execution nodes to facilitate environment interaction. Attackers exploit these nodes via prompt injection or crafted workflow JSONs to hijack execution loops, turning natural language prompts into unauthenticated Remote Code Execution.
Centralized AI Gateways and Lateral Cloud Movement: Enterprise AI gateways represent a catastrophic dual-threat vector. At the application layer, compromised gateways expose third-party application programming interface (API) keys and private prompt streams containing personally identifiable information (PII) or proprietary source code. At the infrastructure layer, they act as initial footholds for adversaries to harvest database credentials and pivot laterally into internal cloud environments.
Inference Gateways as the New Perimeter: Disclosures across backend serving infrastructure (e.g., vLLM, Triton, LiteLLM, Ollama) reached 212 vulnerabilities in 2026. Nearly a quarter (24%) of these flaws stem directly from unauthenticated API endpoints or Server-Side Request Forgery (SSRF), providing remote adversaries with direct entry points to bypass perimeter firewalls, exhaust expensive GPU compute resources, or extract proprietary model checkpoints.
Active In-the-Wild Exploitation of AI Middleware
While zero-day exploitation of AI infrastructure has not yet been observed, threat actors are actively weaponizing newly disclosed vulnerabilities in exposed middleware. However, out of 2,076 cumulative disclosures, only a handful of vulnerabilities have been confirmed as exploited in-the-wild. Among the examples, we identified several that we rated High Threat Risk and provide unauthenticated RCE, command injection, or arbitrary file writes:
CVE-2026-42271 (BerriAI LiteLLM): Command injection in Model Context Protocol (MCP) server preview endpoints (POST /mcp-rest/test/connection), resulting in host takeover and API credential theft.
CVE-2026-5027 (Langflow): Path traversal file write in the POST /api/v2/files upload handler, allowing remote threat actors to drop unauthorized files (e.g., cron jobs, Secure Shell (SSH) keys) onto the host.
CVE-2025-3248 (Langflow): Unauthenticated Python code injection via exec() in /api/v1/validate/code, permitting immediate RCE.
Outlook
GTIG expects that rates of vulnerability discovery and exploitation are likely to continue to increase in the short to medium term. In other research, such as our May AI Threat Tracker, we reported the first known case of a threat actor in possession of a zero-day exploit script developed with generative AI. While intercepted during operational planning before in-the-wild execution, analysis of the exploit's structural artifacts revealed high-confidence LLM generation markers. In our September AI Threat Tracker, we further noted threat actors sharing resources and prototyping agentic vulnerability discovery tooling.
We are still in the early days of publicly available data on both AI-augmented vulnerability discovery and vulnerabilities targeting AI infrastructure and technologies. Nonetheless, we can see emerging signals that AI is contributing to vulnerability discovery. When directed at critical attack surfaces, autonomous research agents demonstrate a formidable capacity to uncover high-severity flaws. By reasoning through complex semantic code paths and synthesizing dynamic proof harnesses, agentic workflows excel at identifying memory corruption and logic bypasses in core libraries and runtimes, surfacing the exact types of flaws that sophisticated adversaries actively seek to exploit.
As threat actors begin to exploit vulnerabilities in AI systems in the wild, organizations cannot afford to treat AI security as an afterthought. Securing this landscape demands immediate containment strategies, sandboxing autonomous agentic workloads, and implementing risk-based vulnerability management to defend the new perimeter.
At this moment, the cybersecurity community has a window of opportunity to bolster defenses on two fronts before threat actors are able to scale up zero-day and n-day exploitation. First, organizations must modernize how they triage and remediate disclosed vulnerabilities. In a separate blog post, Mandiant laid out a blueprint for implementing AI-Assisted Vulnerability Management to help defenders counter compressed adversary timelines. Second, organizations that provide software or services to other enterprises and consumers, should proactively run AI-enhanced code review internally to identify and fix flaws before they are shipped to production and become exploitable vulnerabilities. Leveraging agentic defensive capabilities, such as CodeMender, integrated into Google AI Threat Defense, to continuously audit and patch code across developer workflows will be vital. If pre-release AI code review becomes standard best practice, the rate of growth in public vulnerability disclosures could eventually slow.

 Login