Mexico is one of the host countries for the 2026 FIFA World Cup, with matches to be played in three major cities: Mexico City, Monterrey, and Guadalajara. These locations are expected to see a large influx of international visitors, increasing the potential security risks. Many of those risks arise from users connecting to public wireless networks.
To better understand the wireless environments that visitors may encounter, we at Kaspersky GReAT conducted a wardriving assessment in the three host cities. The aim of the study was to analyze characteristics, deployment patterns, security configurations and potential exposure risks of public Wi-Fi infrastructure in urban wireless environments.
The information collected during the assessment was used exclusively for passive observation and infrastructure analysis. No attempts were made to authenticate, intercept communications, exploit systems or interact with the detected wireless networks beyond the publicly broadcast management information.
During processing of the collected data, one step involved filtering out networks belonging to cars or cell phones categorized as mobile hotspots because they do not represent networks that can be considered part of the assessment.
Research scope
The cities included in the study have high population density and extensive wireless infrastructure deployments. We chose areas with the most prominent wireless network activity and highly concentrated public access points. We carried out wardriving research in Monterrey back in 2008, but the city’s hotspot landscape has changed since then.
We chose the following analysis areas for each of the cities:
Mexico City: México City Stadium, Mexico City International Airport, Zócalo, Paseo de la Reforma, Colonia Roma, La Condesa, Polanco, and Coyoacán.
Guadalajara: Guadalajara Stadium, Guadalajara International Airport, the city center, Zapopan, Providencia, Avenida Chapultepec, Colonia Americana, Tlaquepaque, and the area around Andares.
Monterrey: Monterrey Stadium, Monterrey International Airport, Fundidora Park, Cintermex Monterrey, the downtown area, Barrio Antiguo, MacroPlaza, and the San Pedro financial district.
The wireless information was collected using passive wireless reconnaissance techniques. The collected information included:
SSID analysis and information exposure, including BSSID-derived SSIDs
Default router configurations and ISP deployments
Frequency and signal characteristics
Channel congestion and spectrum usage
Wireless security configurations, including:
Open and insecure wireless networks
WPS-enabled networks
Secure networks (WPA2/WPA3) with WPS enabled
We performed a wireless infrastructure analysis in Mexico City, Guadalajara, and Monterrey. We drove through the areas surrounding the World Cup stadiums, tourist zones, and other places where fan concentrations are likely to be largest. Our goal was to evaluate the security status, deployment characteristics and operational exposure of detected wireless networks.
In total, we recorded 84,588 signals with 69,473 unique Service Set Identifiers (SSIDs) in busy locations and World Cup zones across the three cities. Mexico City accounted for 61.4% of the signals, Guadalajara for 23.6%, and Monterrey for 14.8%. Approximately 82% of the signals had a single SSID (81.9%, 81.34%, and 84% respectively). Notably, they all operate under the IEEE 802.11 standard protocol.
Particular attention was given to identifying standard deployment patterns, legacy configurations, default vendor settings and information disclosure through publicly broadcast wireless identifiers.
The following sections present the results that were obtained by analyzing wireless infrastructure across the three locations.
Our findings
SSID analysis and information exposure
SSID analysis was conducted to evaluate naming conventions, deployment standardization and potential information exposure.
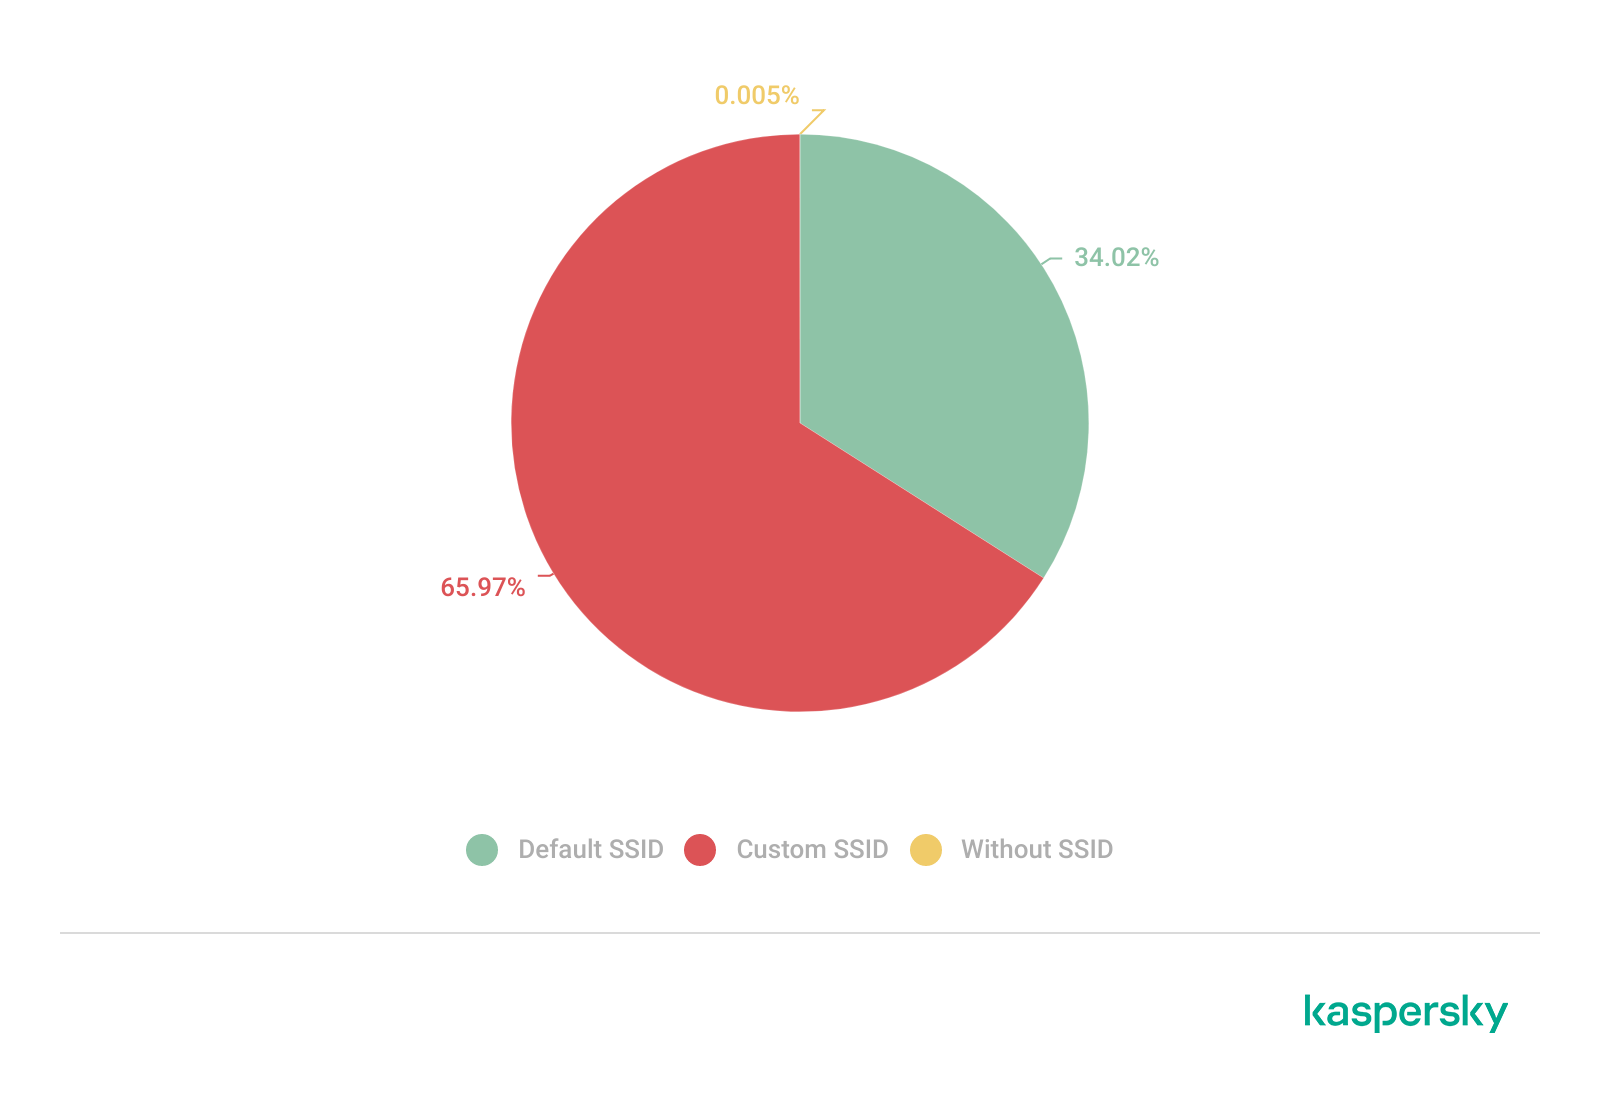
Only a few networks (0.0047%) have an invisible SSID, meaning the names of these networks are not broadcast. Some users prefer to hide the SSID for various reasons, such as the network’s purpose, the profile of its users, internal policies, etc. In contrast, the rest of the networks maintained active SSID broadcasting.
SSID structures may unintentionally disclose operational details about internet service providers (ISPs), device manufacturers, deployment practices, organizational ownership or user identity. The repeated presence of default SSID naming patterns across the analyzed locations indicates a significant degree of infrastructure homogeneity and reuse of default wireless configurations. It may also facilitate passive infrastructure profiling by revealing standard characteristics in use.
Approximately 34% of the detected networks retained the default SSID naming conventions provided by the manufacturer or ISP, while 66% used customized identifiers.
Distribution of SSID naming conventions (download)
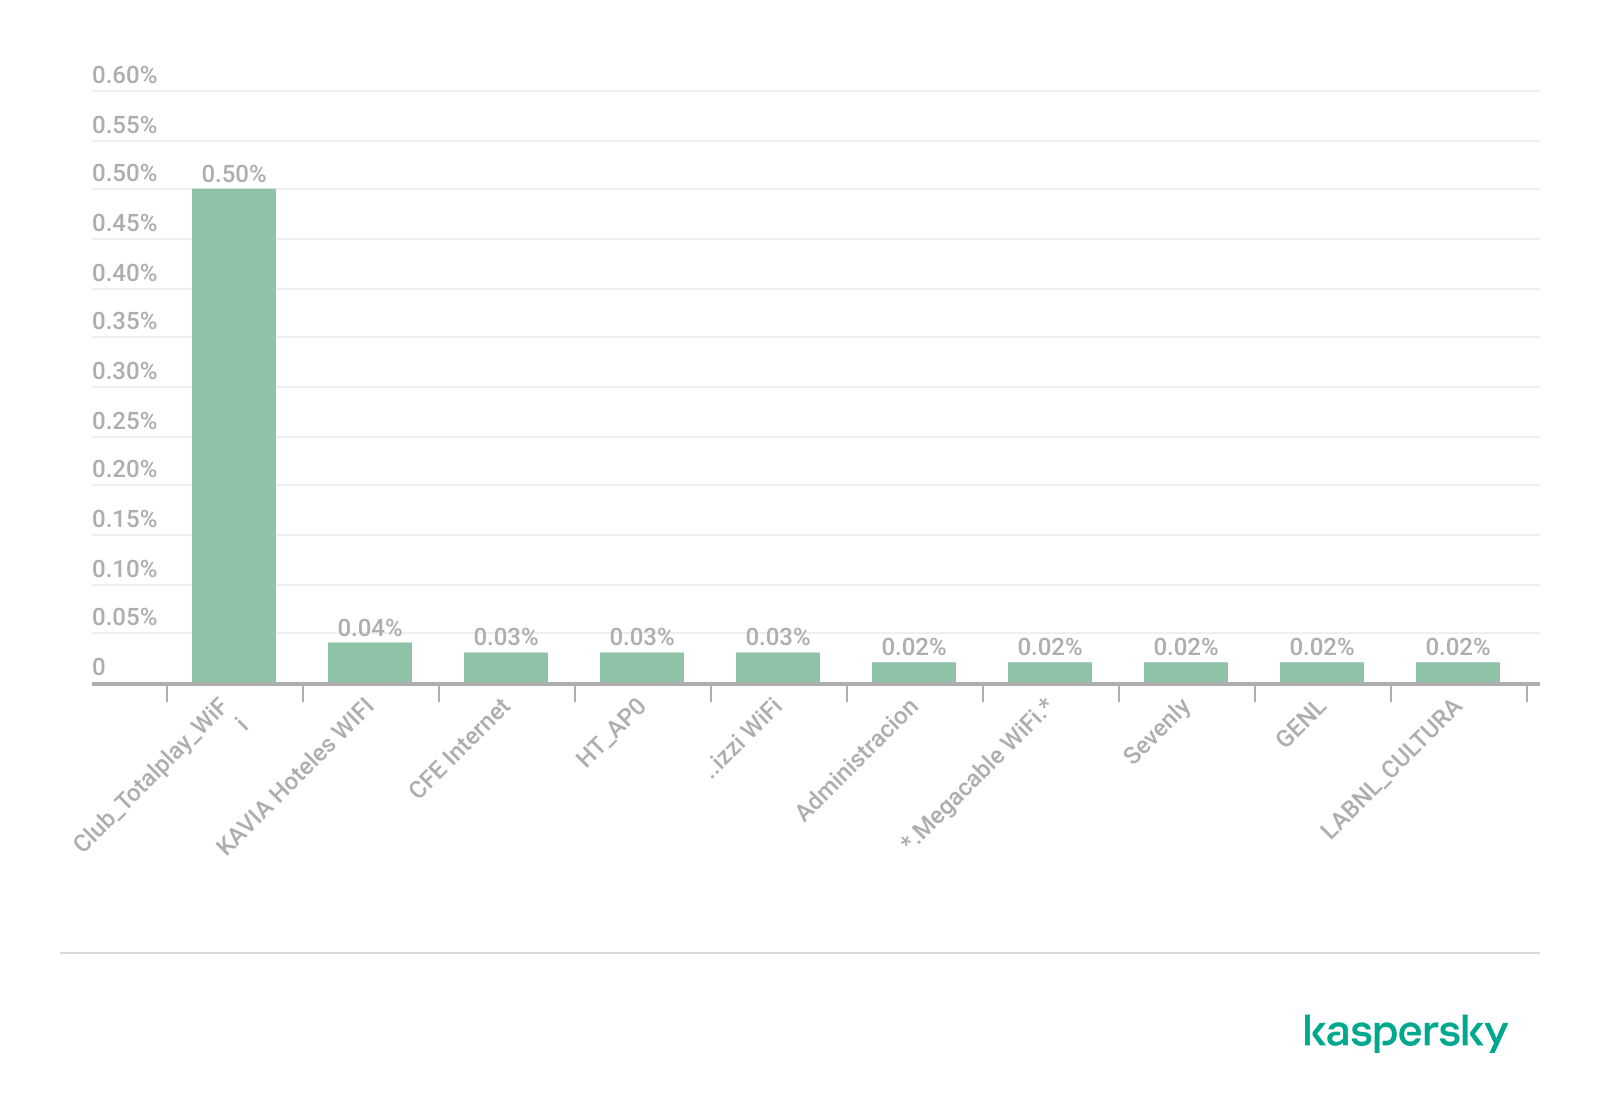
Several recurring SSID naming conventions associated with ISP-provided deployments were identified in the three cities. The most frequently observed patterns include identifiers such as “Club_Totalplay_WiFi”, “izzi WiFi”, and “Megacable WiFi”, which suggests extensive standardization of wireless infrastructure deployment. Additionally, we observed distinctive location-specific SSIDs in each area of analysis, such as “XXXX-Internet para Todos-CDMX” or “RED JALISCO”.
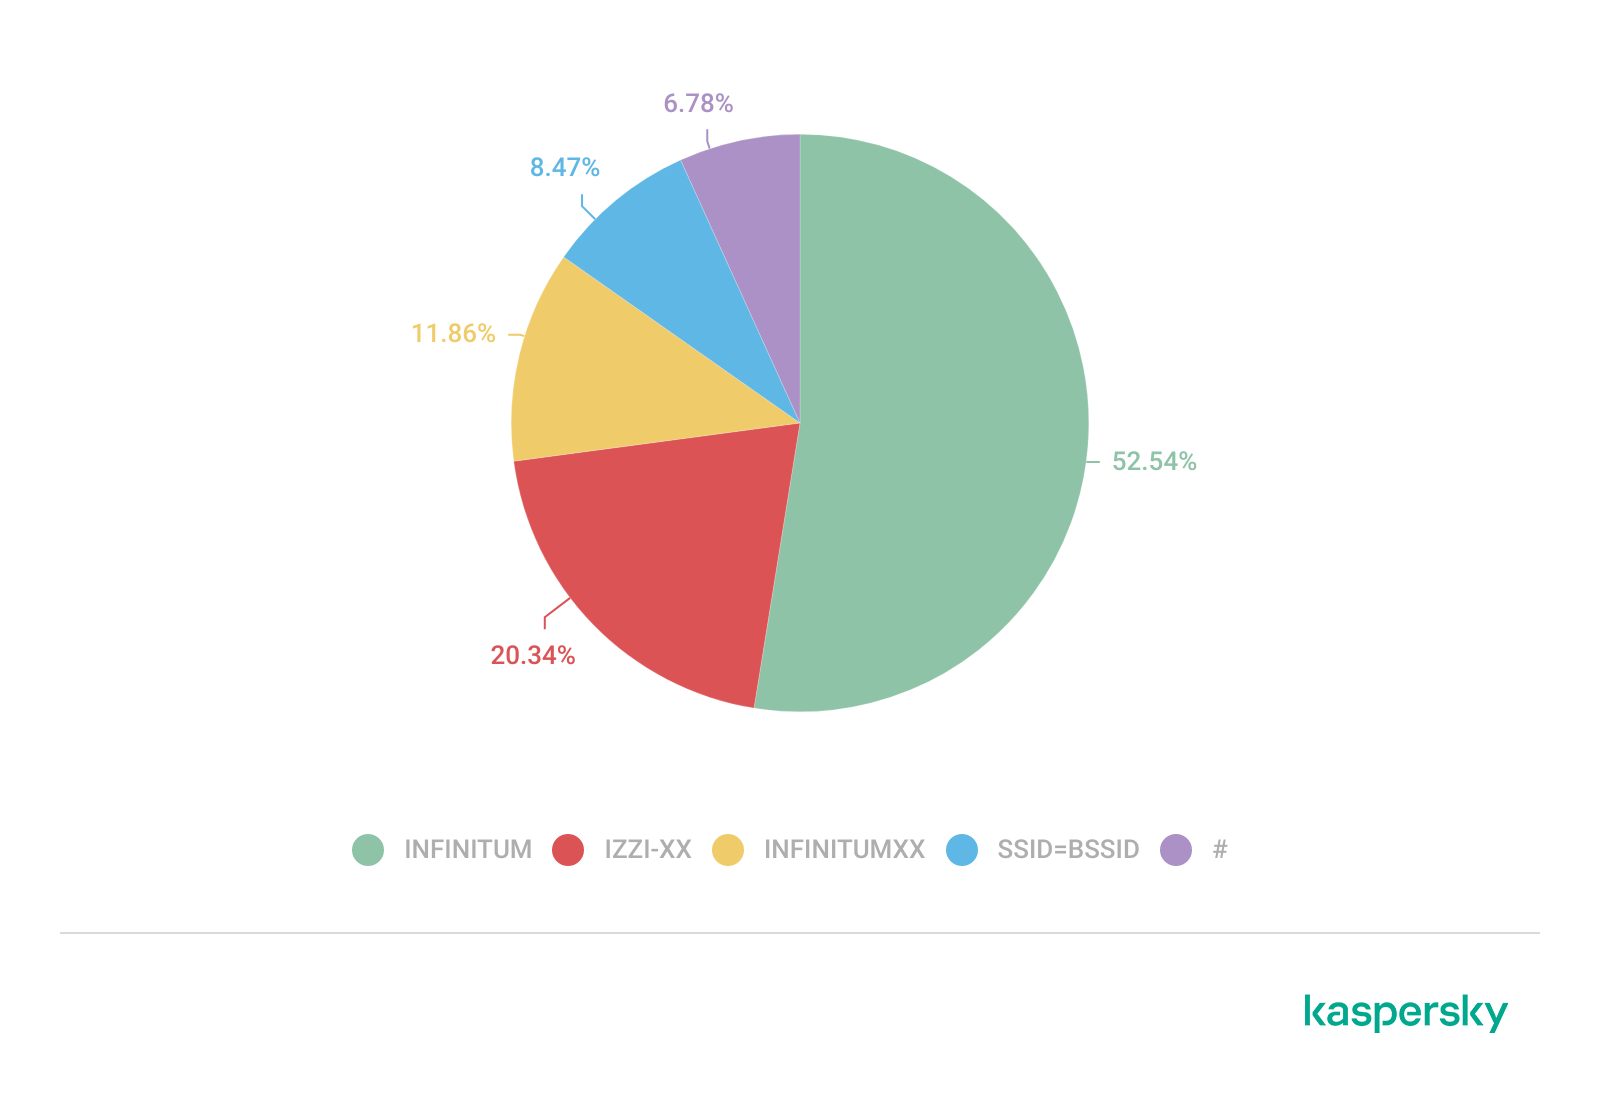
Sequential SSID naming structures were also identified during the analysis. Patterns such as “INFINITUMXX” and “IZZI-XX” suggest automated ISP deployment and large-scale deployment strategies.
We identified 33 unique sequential naming structures among the 137 sequential SSIDs in total, representing approximately 0.16% of the detected wireless networks.
The following graph shows the top five sequential SSID patterns found in the largest number of networks:
Five most frequently observed sequential patterns (download)
Several customized SSIDs contained personal or organizational identifiers, including family names, professions, addresses or internal department references. Although personalized SSIDs may simplify local network identification for users, they may also expose sensitive information that could be useful for social engineering, physical targeting, or organizational profiling.
BSSID-derived SSID
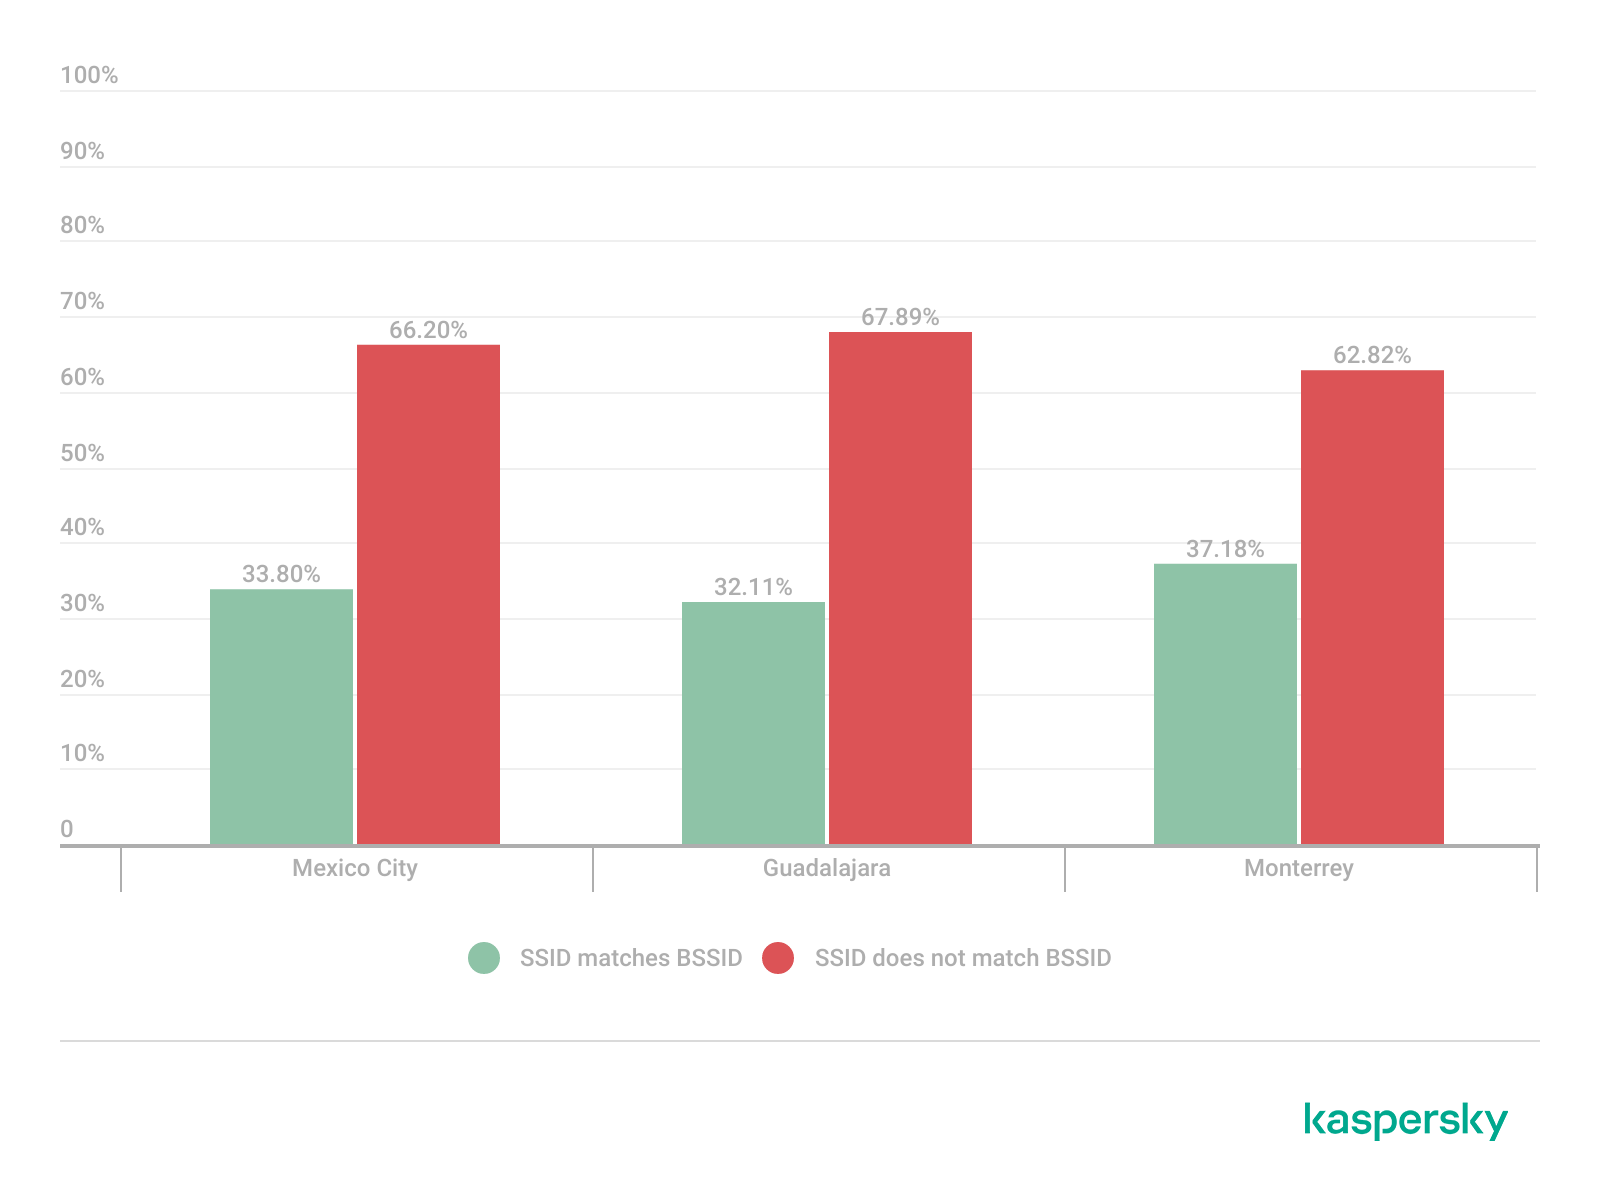
During the analysis, multiple networks were identified that used the physical MAC address of a Wi-Fi access point (BSSID) as the visible SSID. This practice exposes hardware-level information that could facilitate vendor fingerprinting and targeted reconnaissance activities.
The organizationally unique identifier (OUI) contained in the first bytes of the BSSID identifies the equipment manufacturer. Threat actors can correlate exposed manufacturers with device-specific vulnerabilities.
Notably, we found that more than 30% of networks in all three cities reuse the MAC address as the SSID.
Default router configurations and ISP deployments
We performed wireless infrastructure profiling to identify the most common wireless equipment manufacturers and ISP deployments across the three locations.
Large-scale ISP deployments frequently use standardized wireless configurations and vendor-specific hardware platforms. Identifying dominant manufacturers and ISP naming conventions can provide insight into infrastructure and deployment practices facilitating the mapping of standardized attack surfaces.
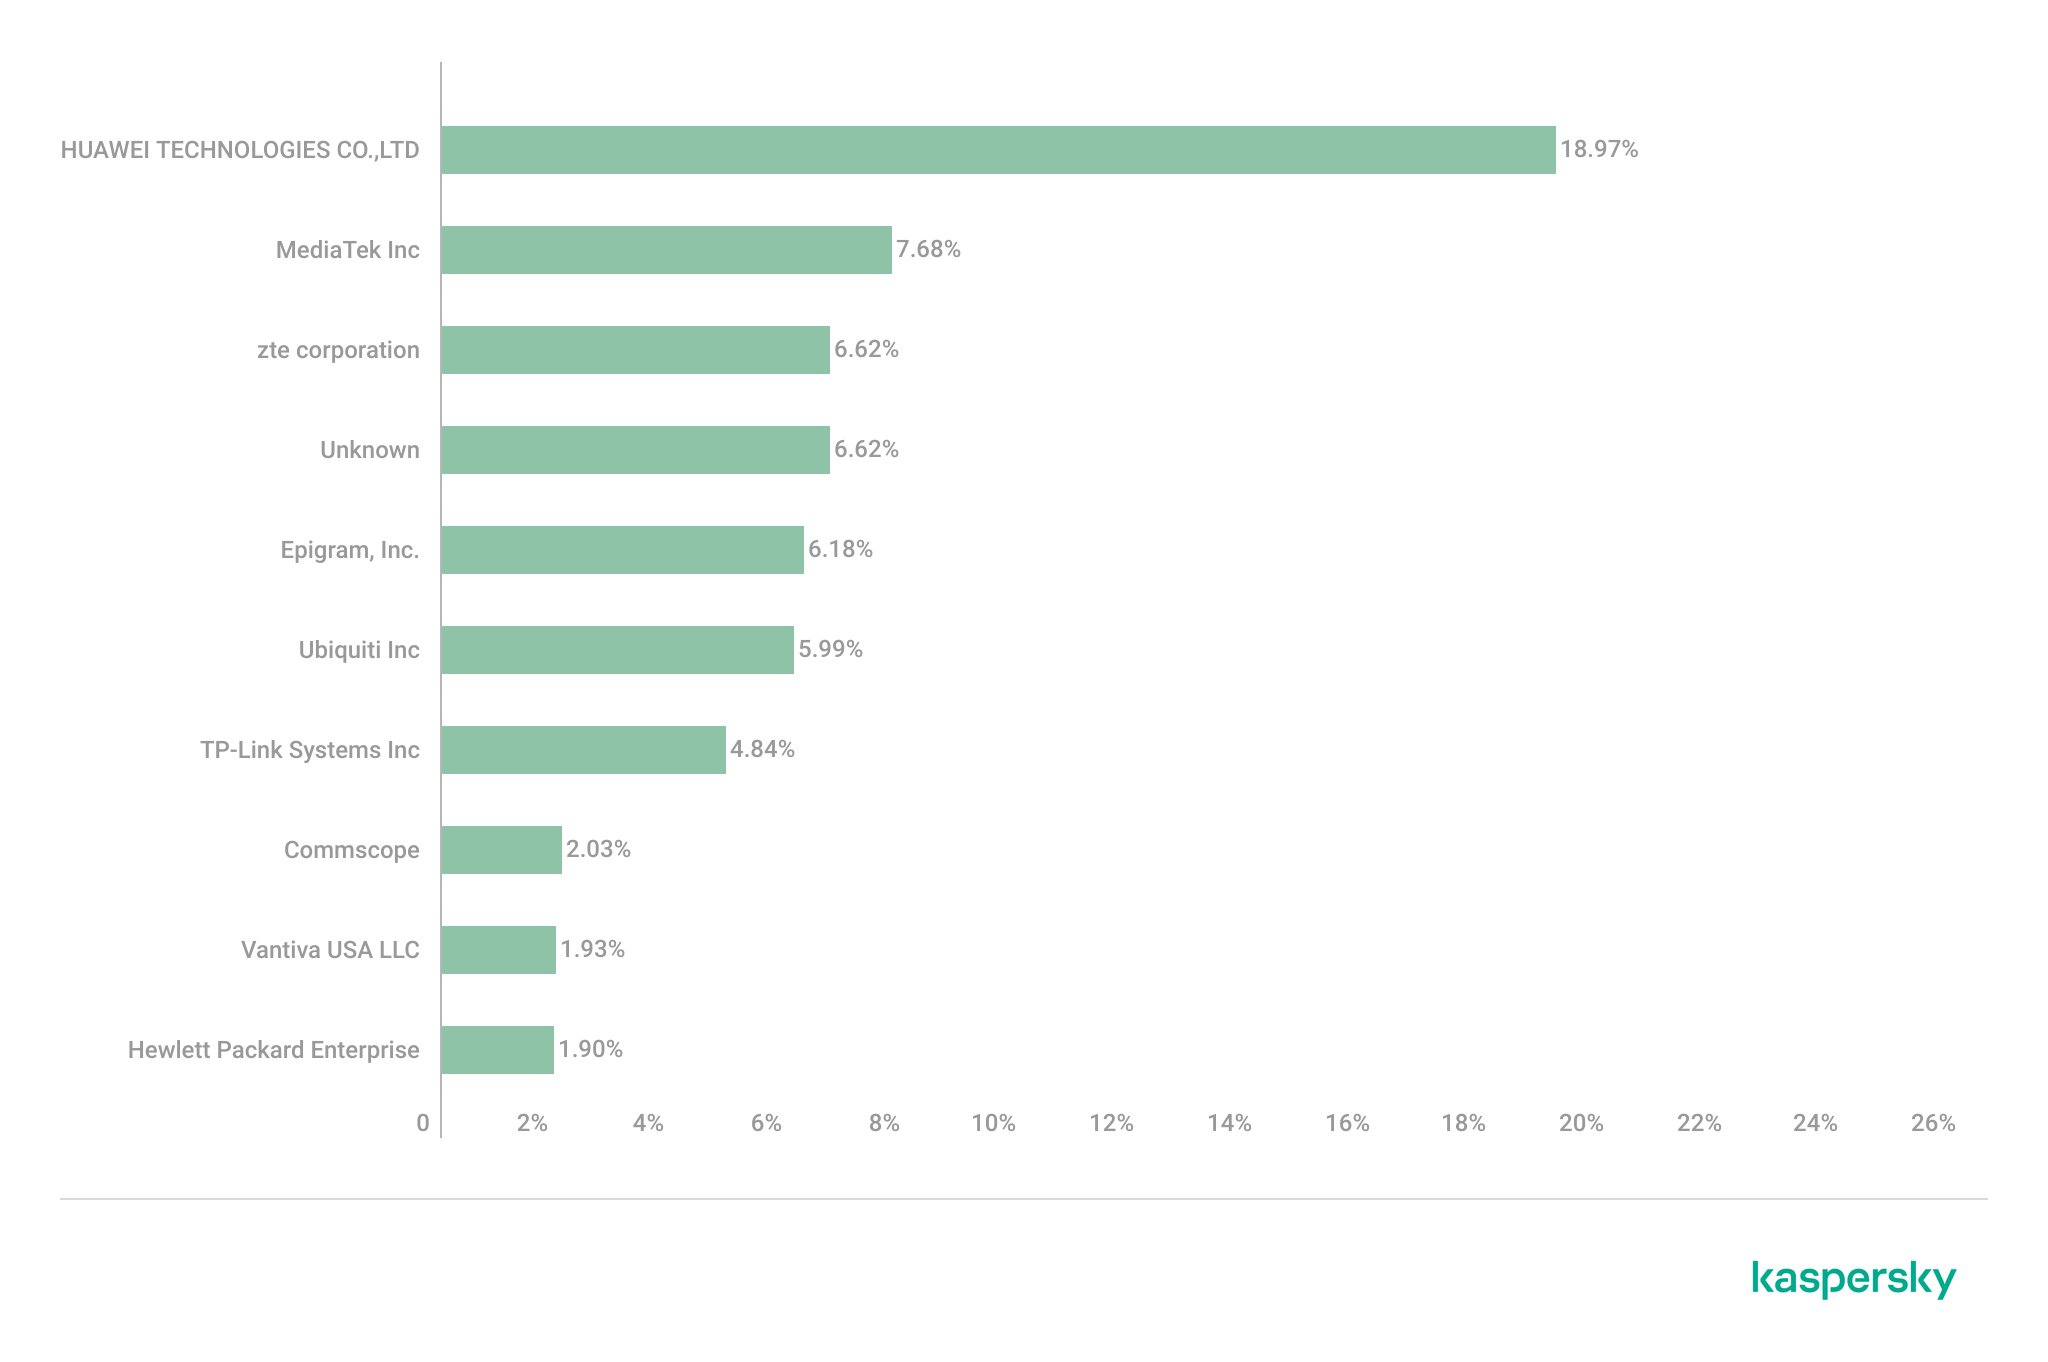
The following figure shows the distribution of the most commonly used manufacturers.
Most frequently observed wireless equipment manufacturers (download)
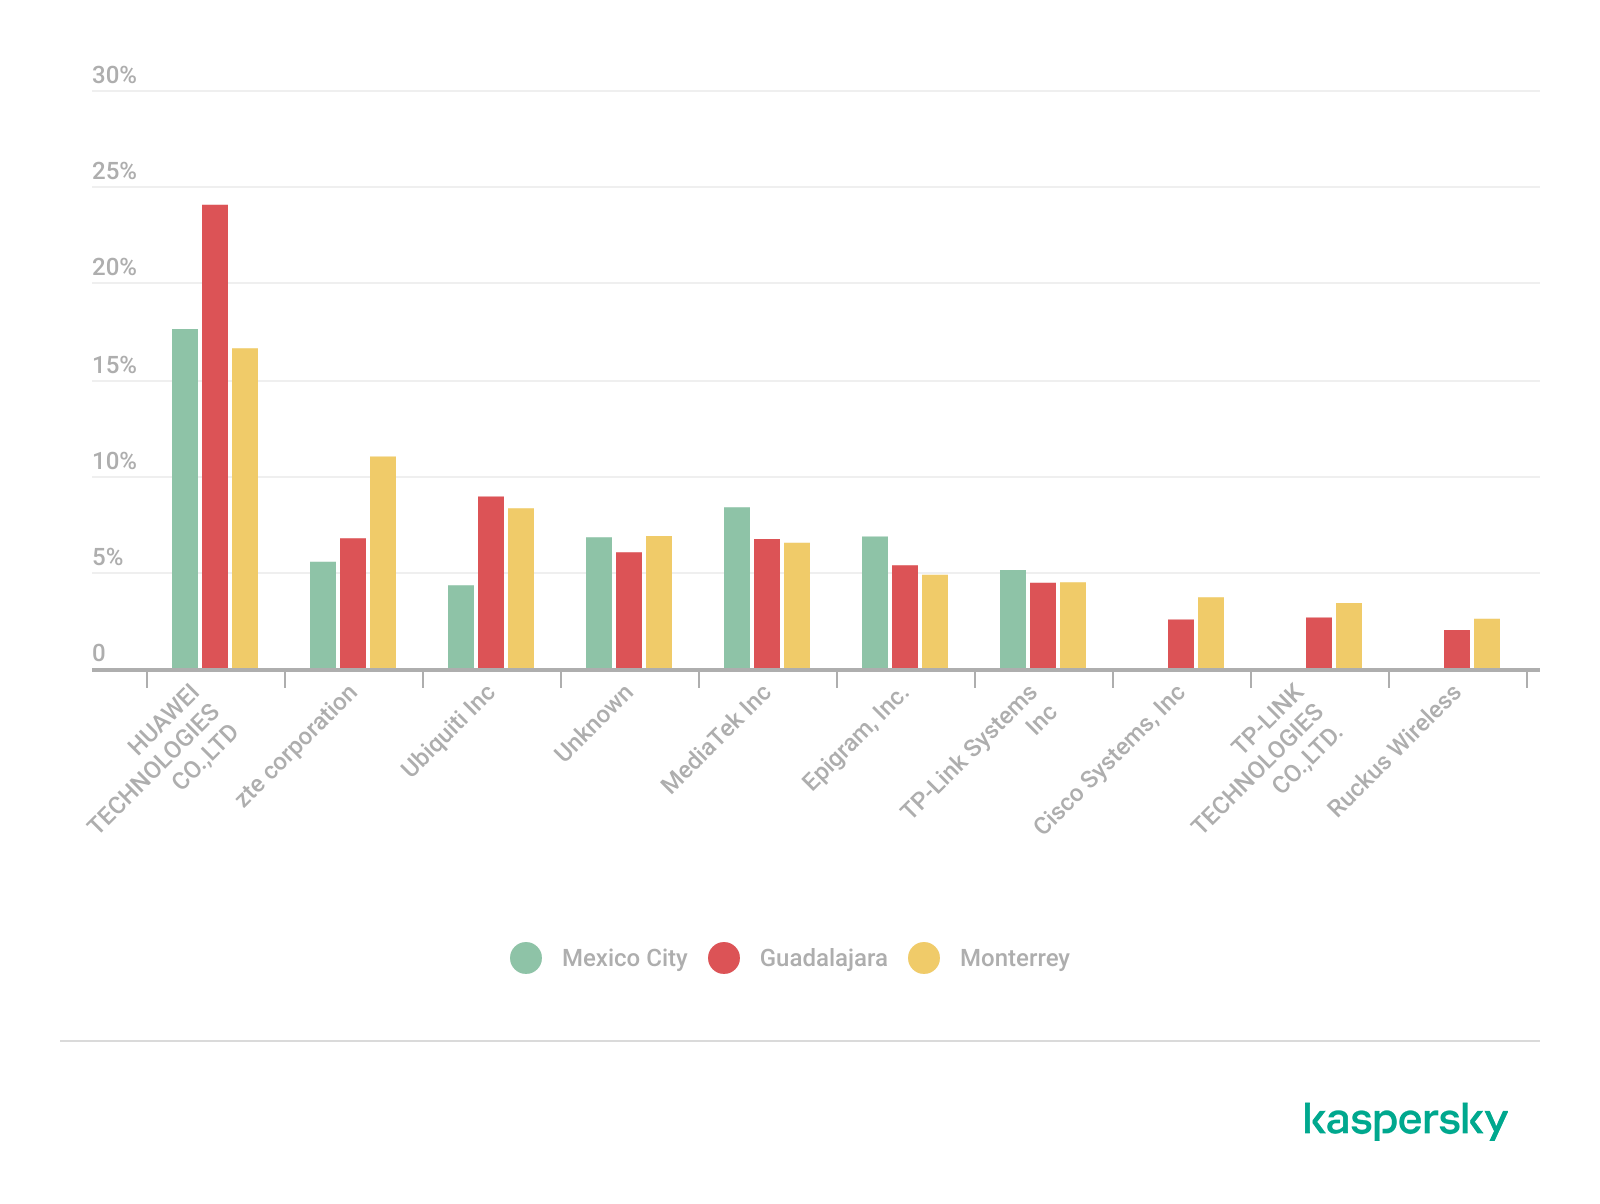
The manufacturer analysis revealed a strong concentration of wireless infrastructure among a limited number of vendors. Across the three locations, Huawei Technologies, MediaTek-based devices, and other manufacturers’ equipment that is distributed through ISP channels represented a significant portion of the detected deployments. Mexico City had the most diverse infrastructure, while Monterrey and Guadalajara had a greater concentration of wireless equipment known as SOHO (small office/home office) or residential-grade hardware. The widespread presence of standard vendor platforms may facilitate infrastructure fingerprinting and large-scale targeting of known device-specific vulnerabilities.
Most frequently observed wireless equipment manufacturers across the three cities (download)
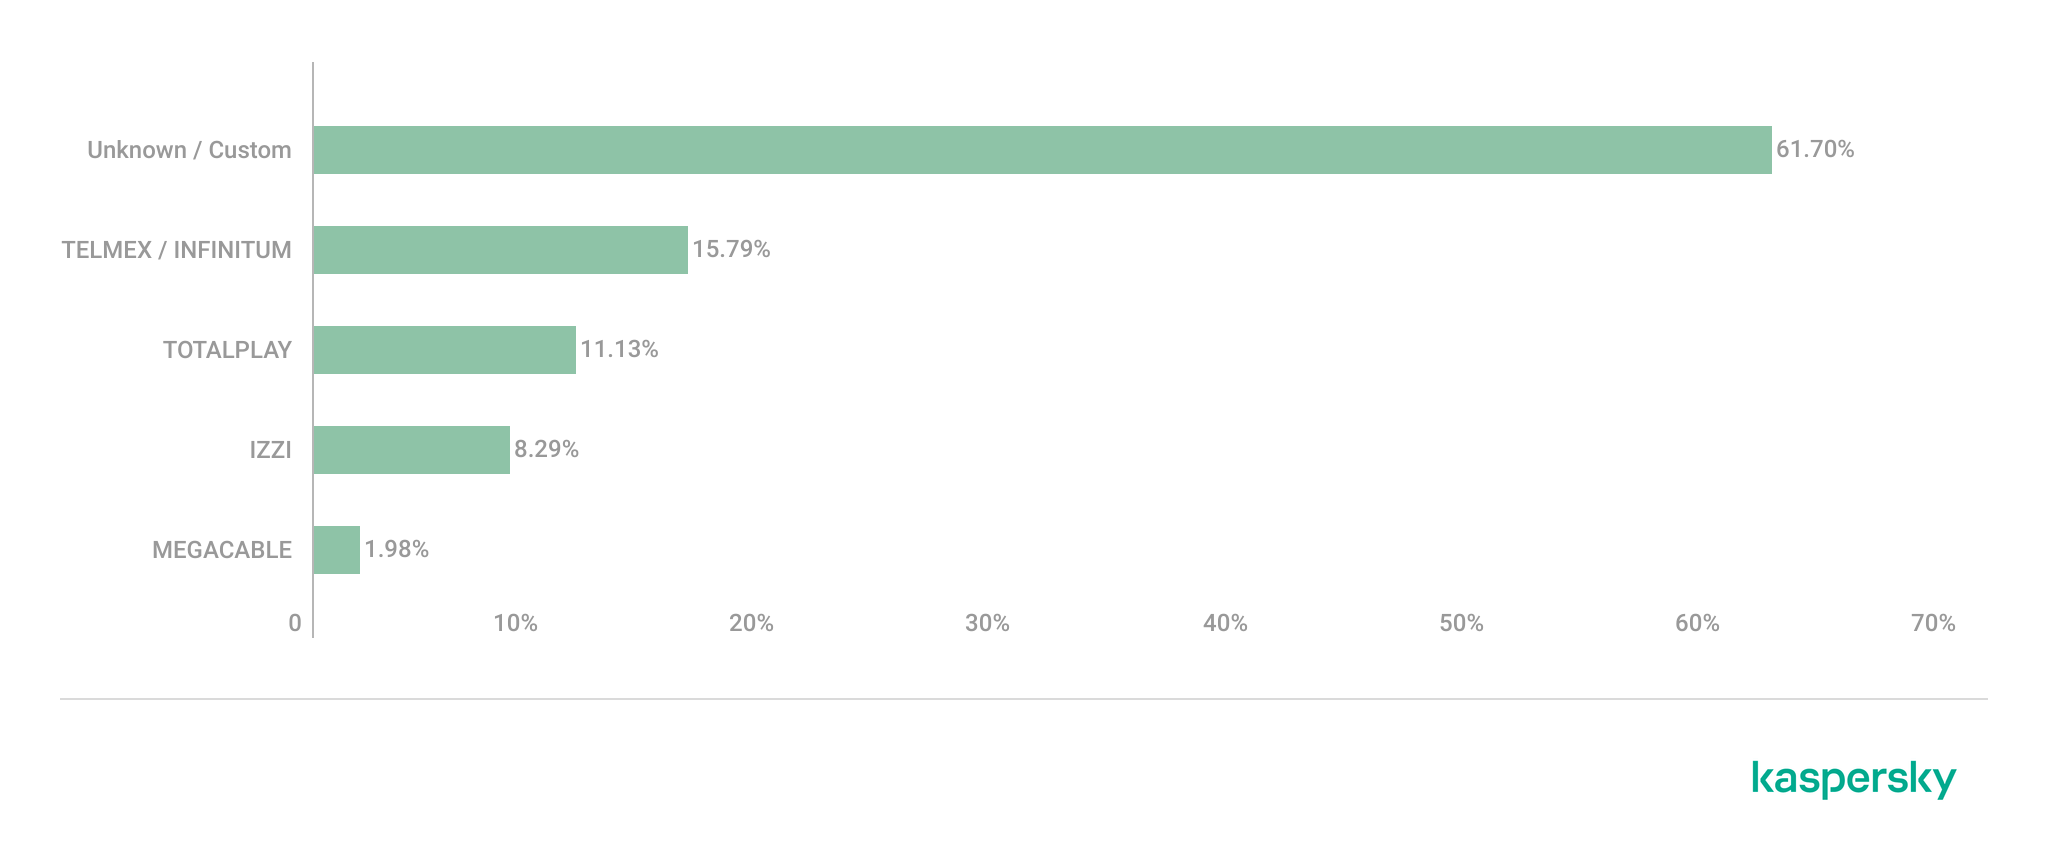
ISP deployments frequently exhibited standardized configuration patterns and recurring manufacturer identifiers. Our ISP deployment analysis revealed a high concentration of access points associated with major residential internet providers. Deployments associated with Infinitum, Totalplay and Izzi represented a substantial portion of the detected wireless infrastructure across all locations. These findings suggest a high degree of deployment standardization across networks associated with major residential internet providers. This observation was supported by the repeated presence of ISP-associated SSIDs such as “Infinitum”, “Totalplay”, and “Izzi”, combined with manufacturer identifiers frequently associated with consumer equipment, including Huawei, ZTE and other residential wireless equipment vendors.
It is important to note that, for this analysis, ISPs were primarily inferred from SSID naming conventions and manufacturer fingerprint data. A significant portion of the detected wireless networks fell into the “UNKNOWN/CUSTOM” category. This classification includes custom hotspots and networks whose naming conventions did not expose identifiable ISP-associated patterns. The findings suggest that many users and organizations (as we saw previously, approximately 66%) use custom network names, limiting direct provider attribution.
The following figure illustrates the distribution of ISP-associated wireless deployments in general.
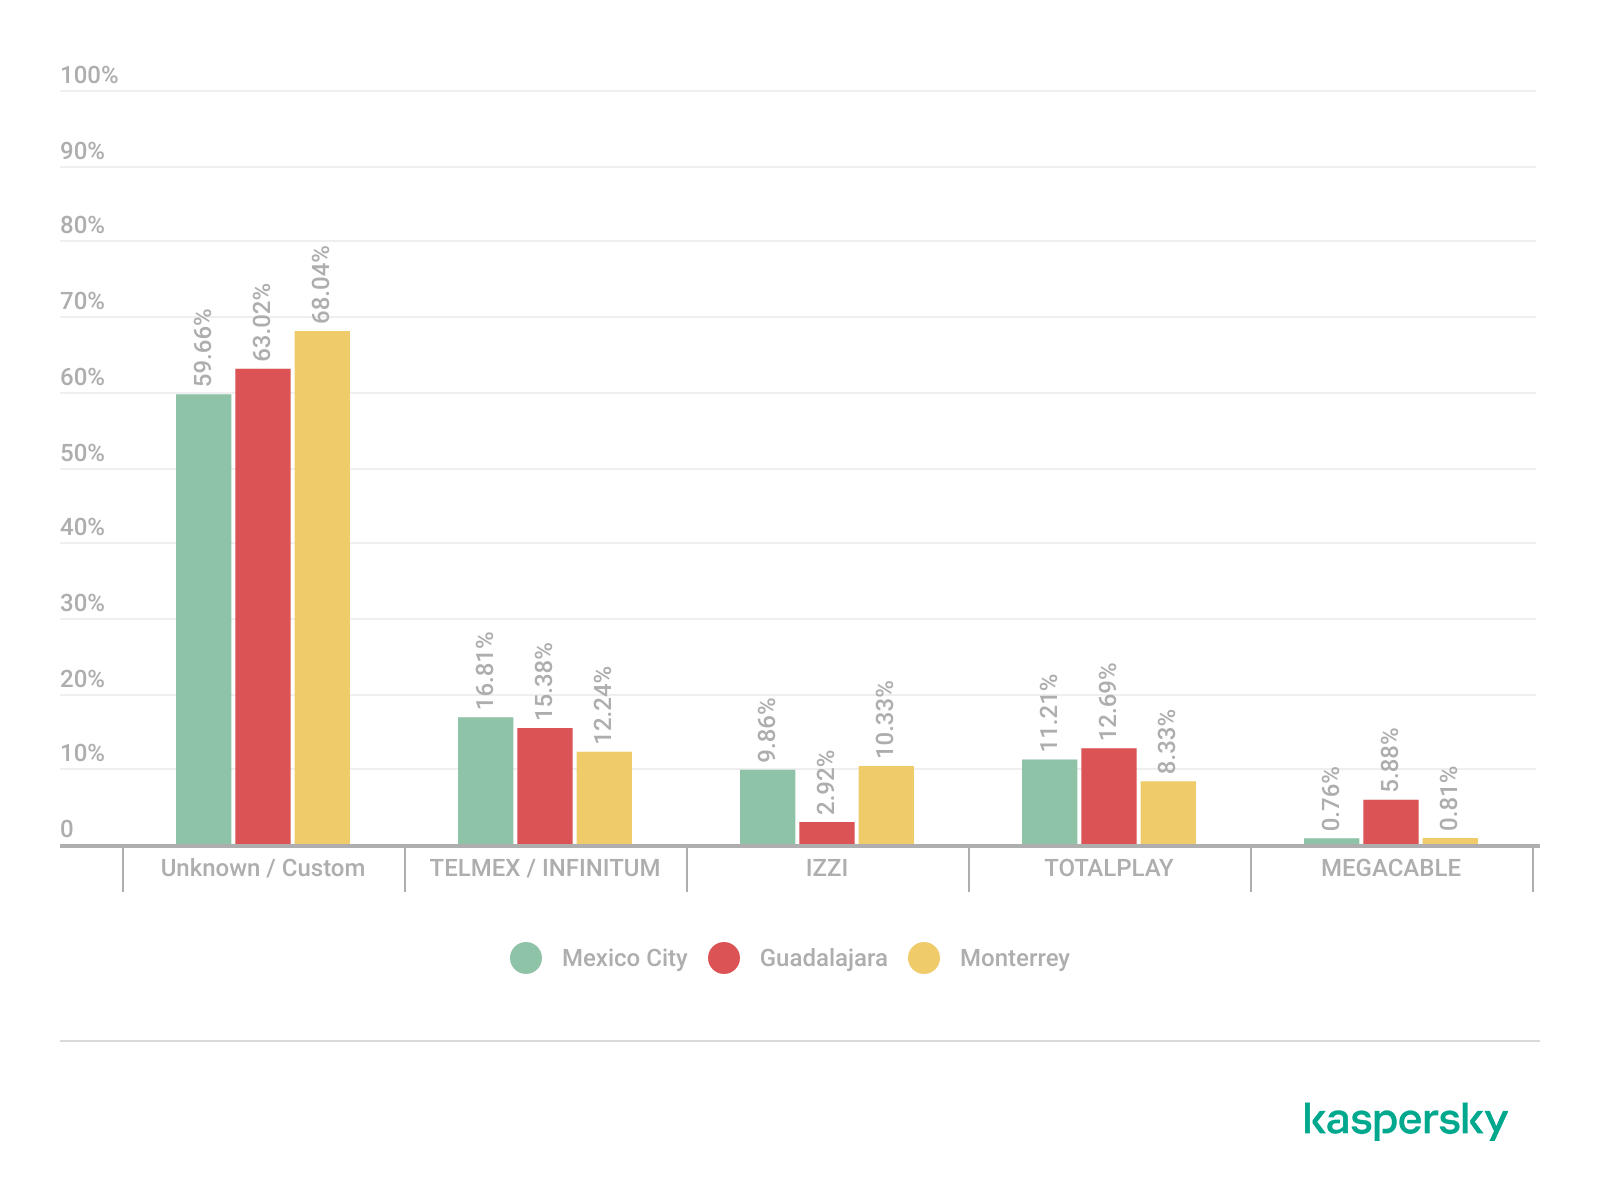
To better understand this distribution, we took the most frequently observed ISPs by city.
Most frequently observed ISPs across the three cities (download)
Frequency and signal characteristics
We also analyzed wireless signal characteristics to evaluate coverage quality, signal strength, and frequency band utilization in the three cities. In dense urban environments, signal quality and frequency spectrum distribution can affect wireless reliability, client connectivity, roaming performance, and overall network efficiency.
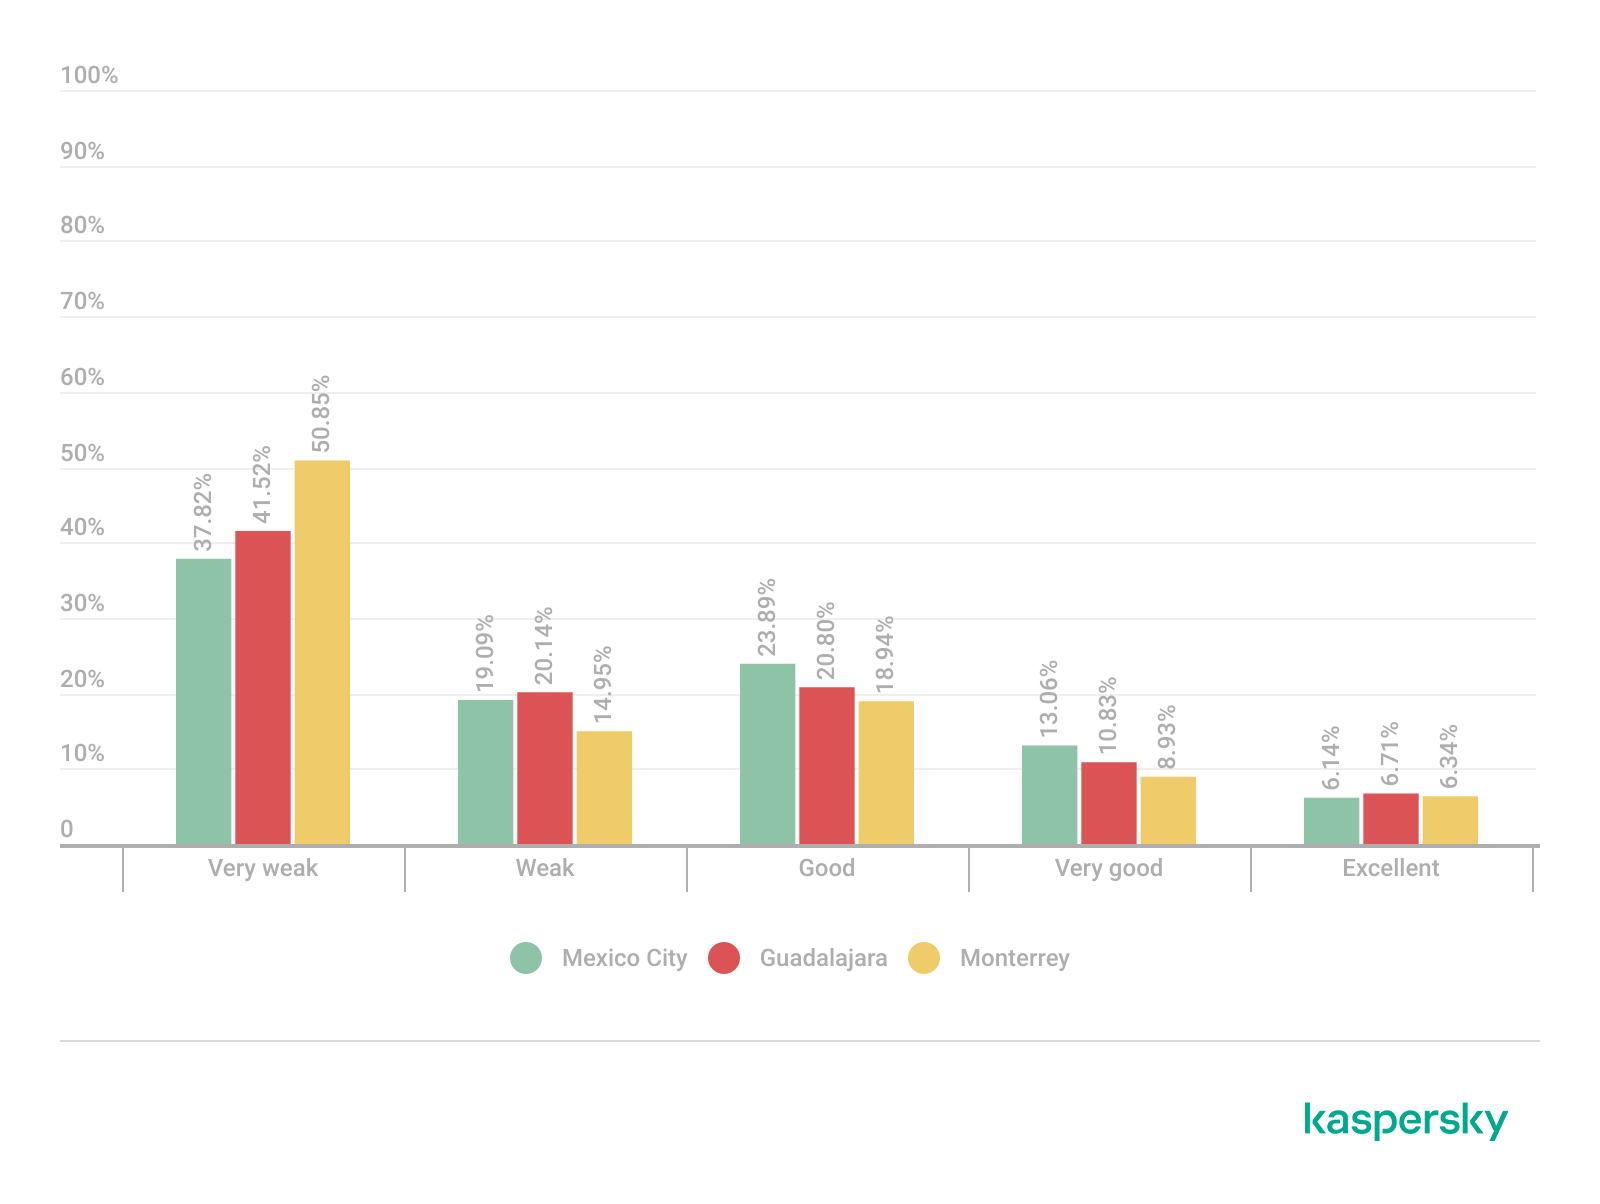
Signal quality analysis revealed that a substantial portion of the detected access points operated under weak or very weak signal conditions. Monterrey had the highest percentage of very weak signals, with approximately 50% of detected deployments. Similar patterns were observed in Guadalajara and Mexico City, suggesting high-density wireless environments with overlapping coverage areas. Only a limited percentage of networks were classified within the very good or excellent signal categories across the three locations.
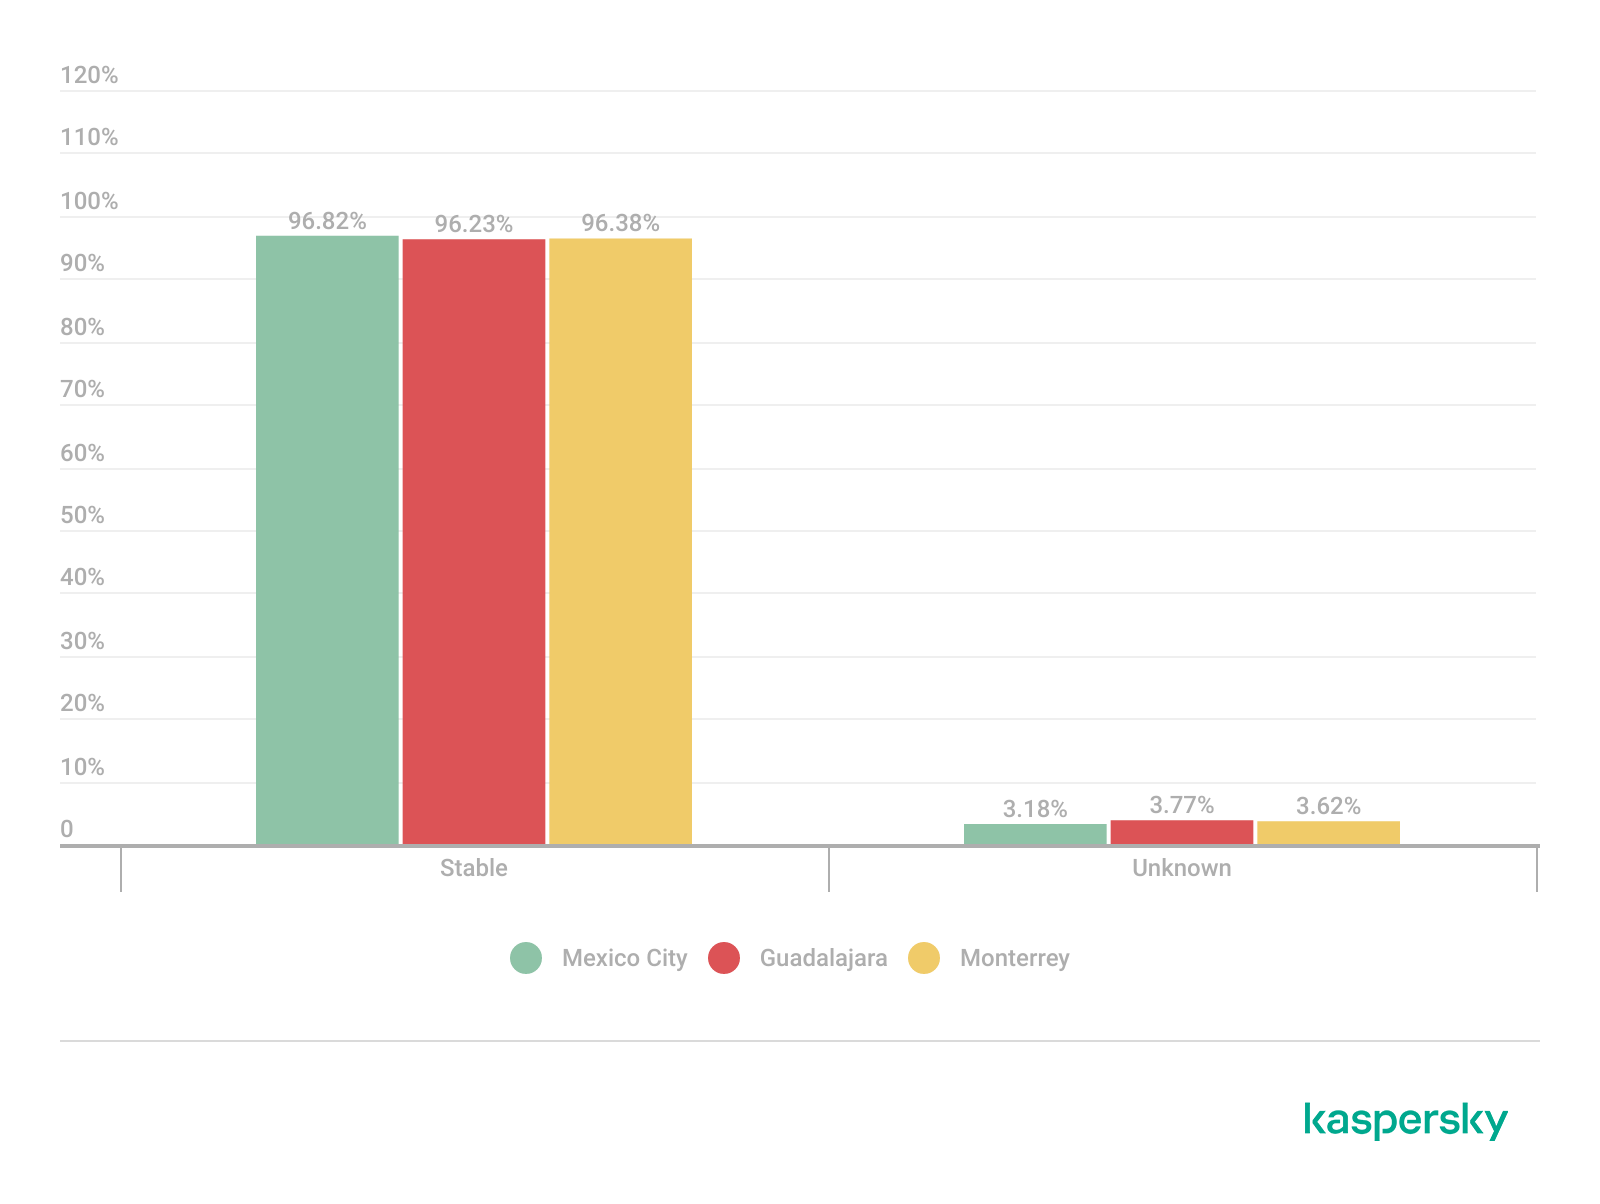
Signal stability analysis revealed that most detected wireless deployments exhibited stable beacon transmission behavior. More than 96% of the detected access points across all locations were classified as stable, while only a small percentage exhibited unstable or indeterminate signal behavior.
These findings imply that the majority of the wireless infrastructure observed during the assessment corresponded to permanently deployed access points rather than transient or intermittent wireless devices.
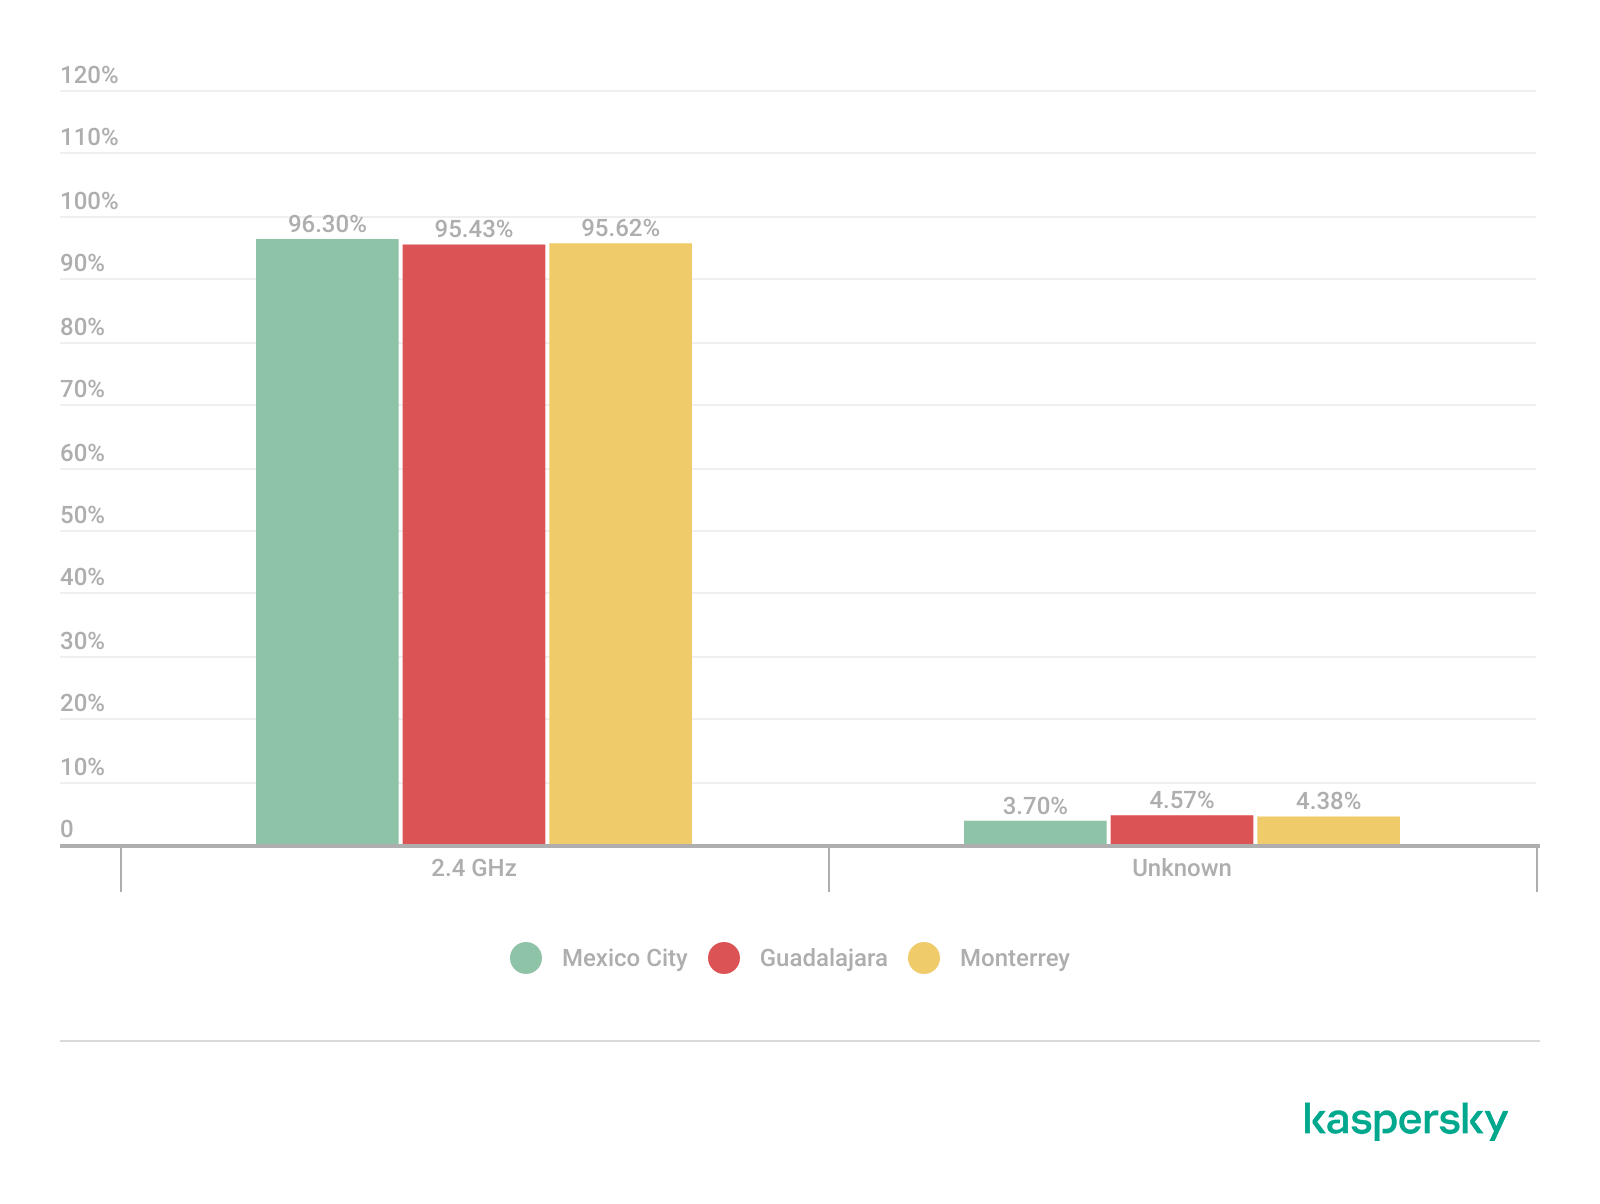
Frequency band analysis revealed the strong prevalence of 2.4 GHz wireless deployments across the three locations. More than 95% of the detected wireless networks operated within the 2.4 GHz spectrum, while only a small percentage of deployments were classified under the unknown or non-standard frequency categories. This uneven distribution reflects the continued prevalence of legacy-compatible wireless infrastructure and SOHO deployments.
These findings are consistent with dense urban wireless environments with large numbers of access points in restricted spectrum allocations.
Channel congestion and spectrum usage
Next, we analyzed wireless channel utilization to evaluate frequency spectrum congestion and channel allocation patterns across the three cities. Our analysis focused on the 2.4 GHz spectrum, where channel overlap and high access point density commonly produce interference and degraded wireless performance. In densely populated wireless environments, an excessive concentration of access points on a limited number of channels can lead to co-channel interference, packet collisions, reduced throughput, and degraded network stability.
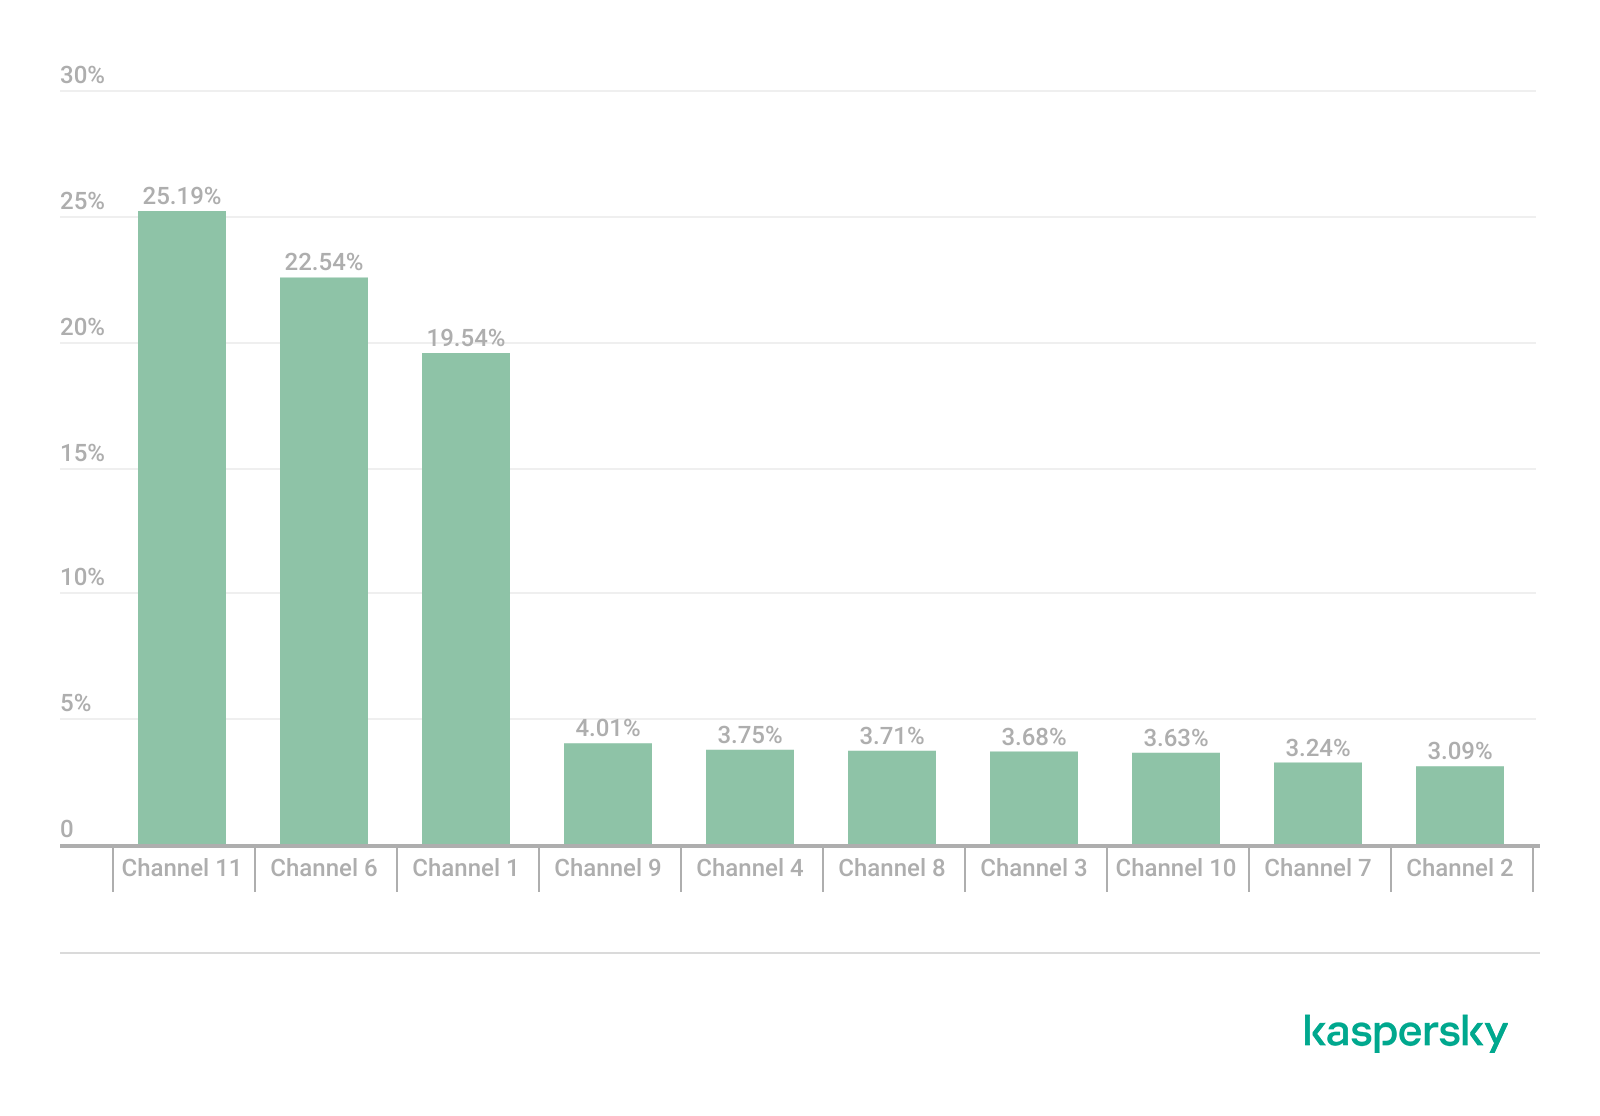
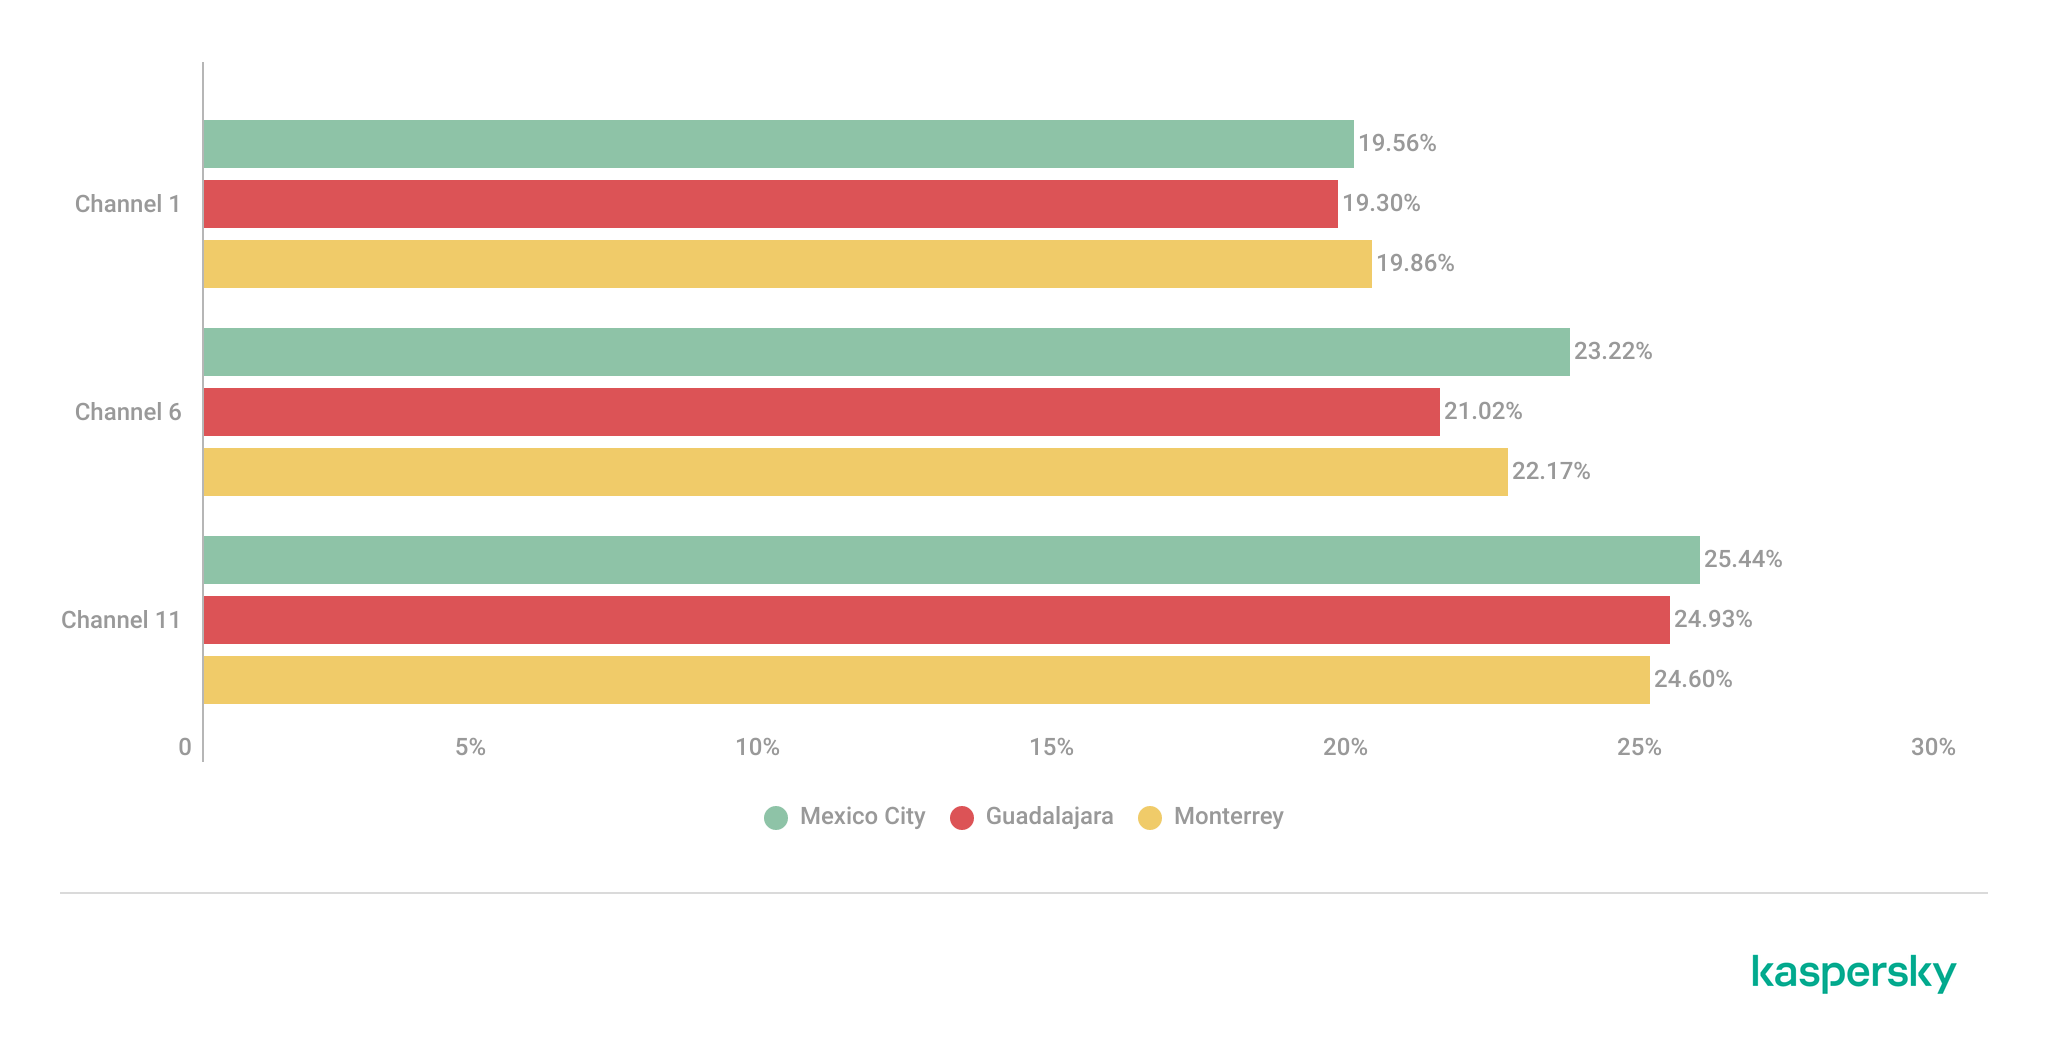
Spectrum congestion analysis revealed that the 2.4 GHz band consistently experienced elevated congestion levels across the three cities. The detailed results showed a strong concentration of deployments on channels 11, 6 and 1, which are traditionally recommended as non-overlapping channels within the 2.4 GHz spectrum. Channel 11 was the most utilized channel, accounting for 25.2% of the detected access points, followed by channel 6 with 22.5% and channel 1 with 19.5%. This distribution indicates that most wireless deployments adhere to standard channel allocation practices for 2.4 GHz Wi-Fi environments.
The following figure illustrates the overall distribution of the most frequently utilized wireless channels.
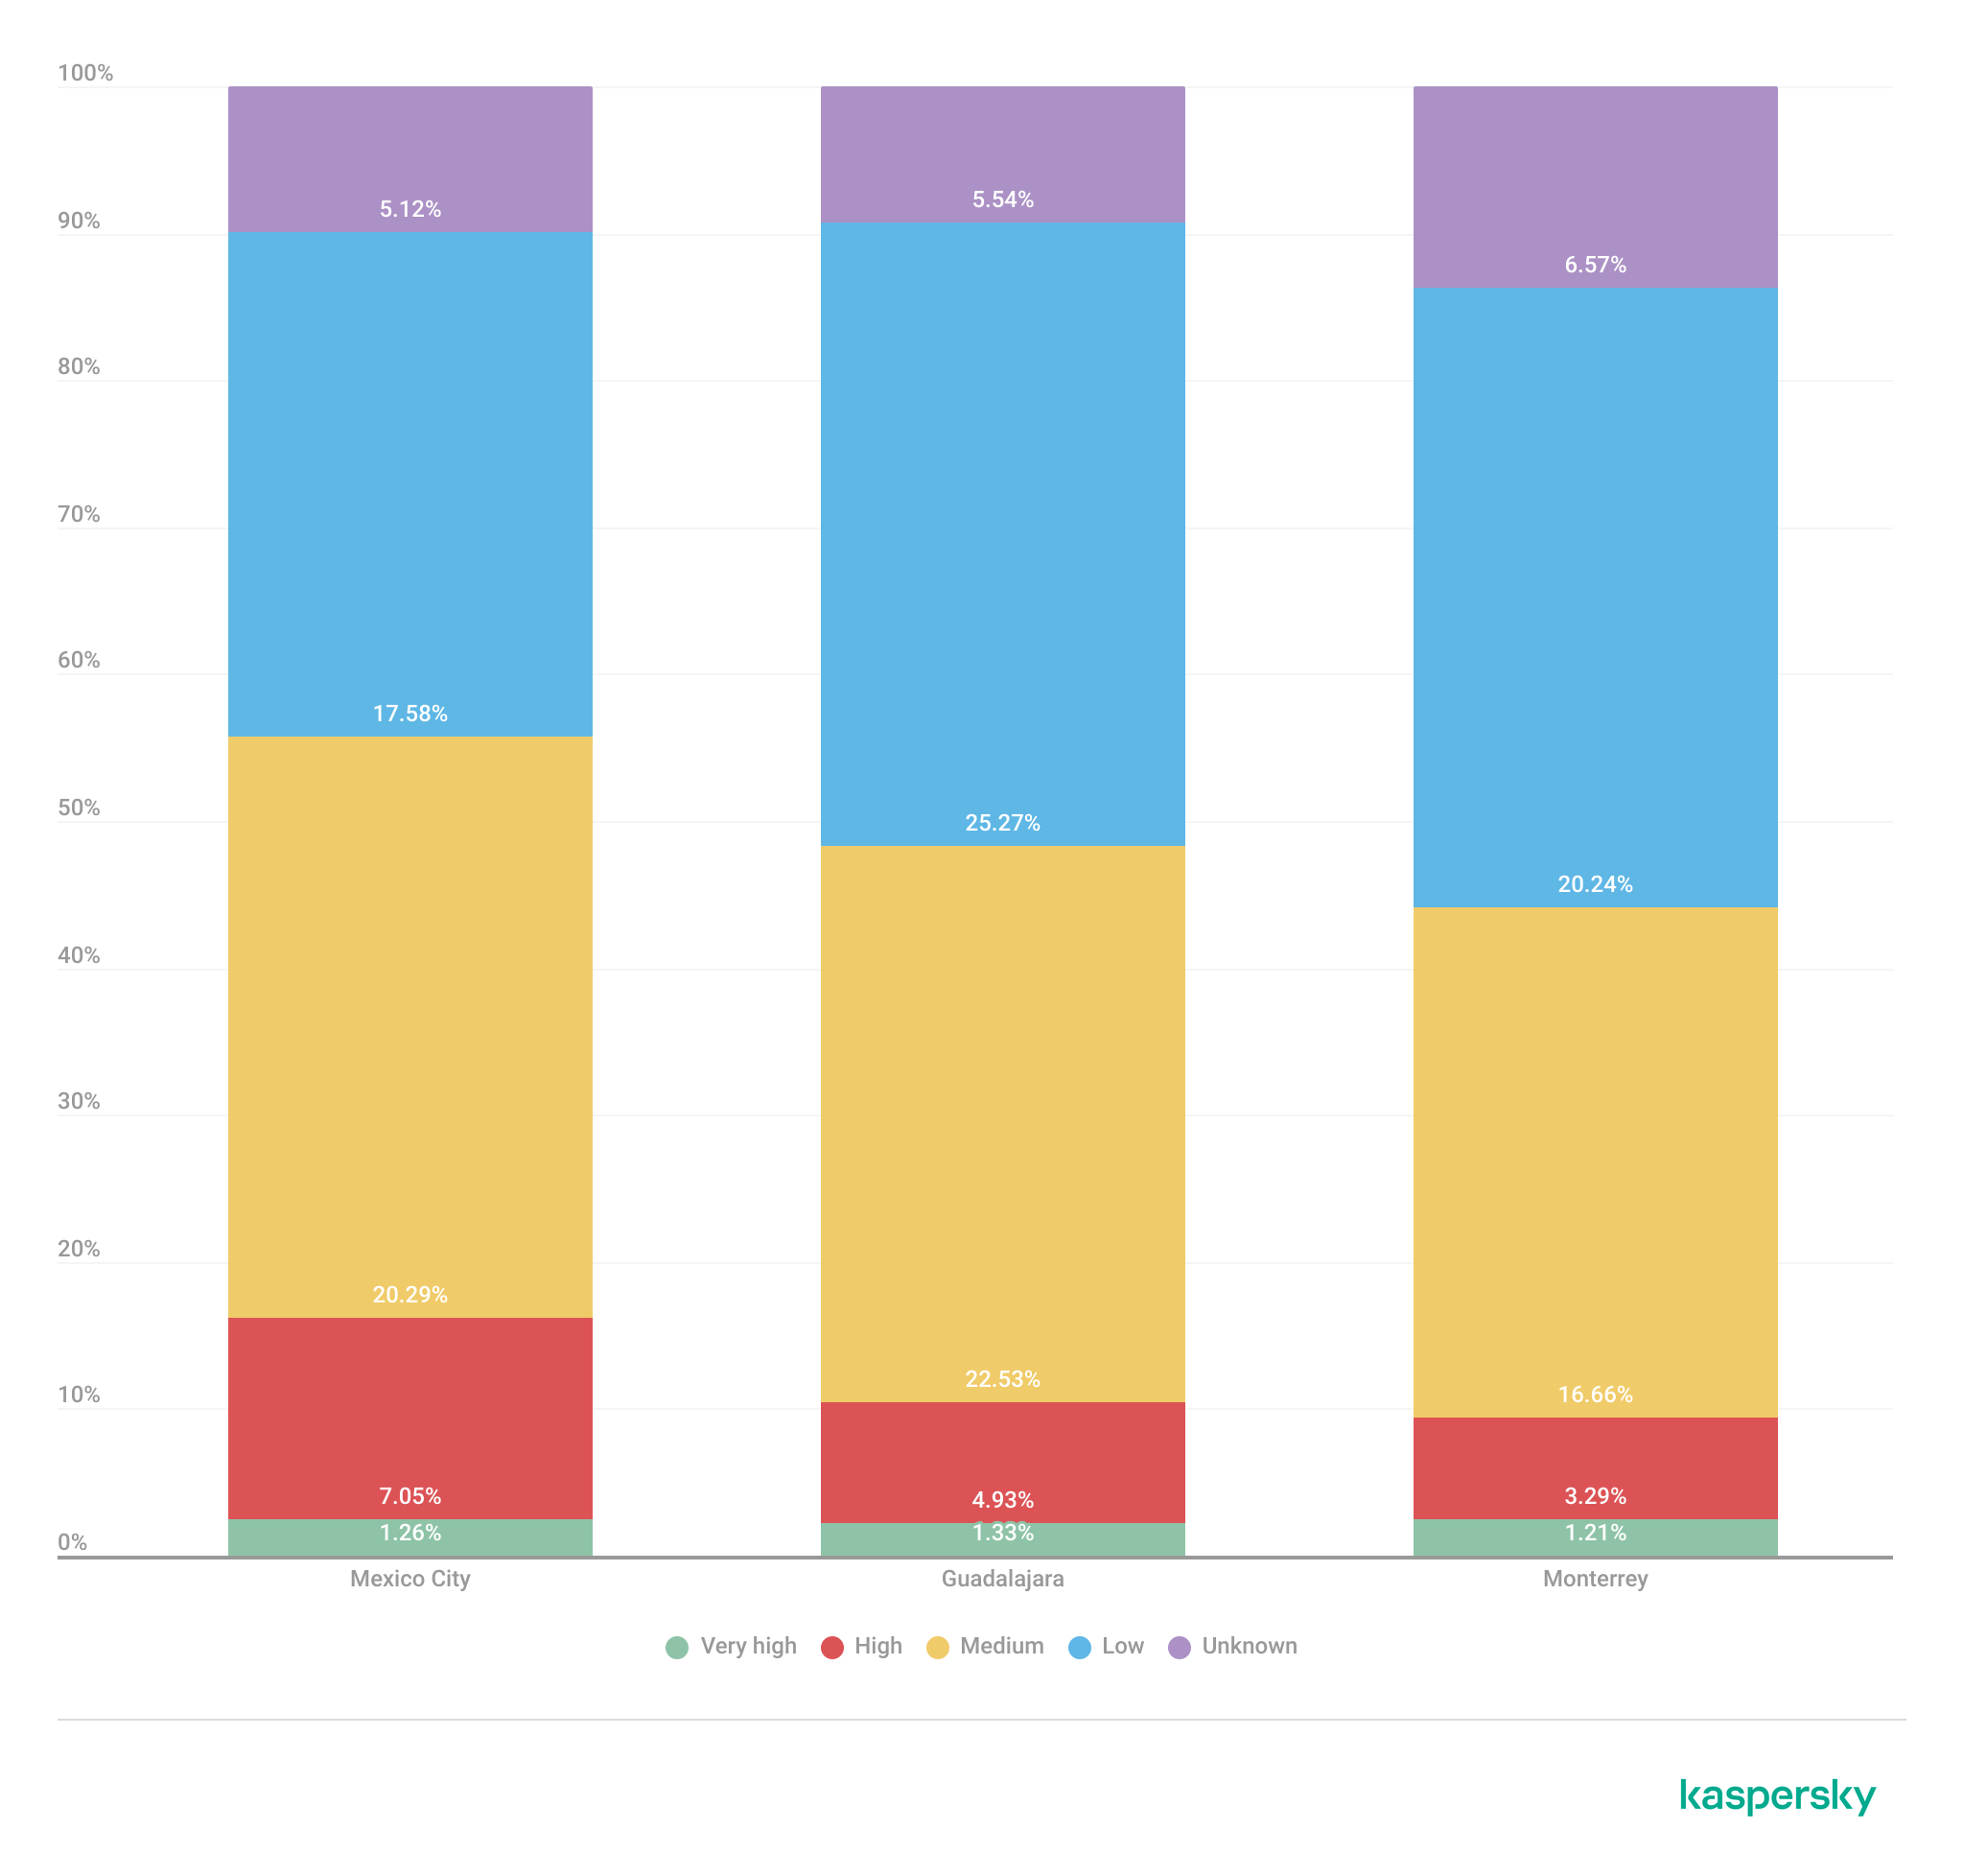
To further assess wireless spectrum saturation, the detected access points were grouped according to channel congestion levels: VERY_HIGH, HIGH, UNKNOWN, MEDIUM, LOW and NONE.
Mexico City had the highest proportion of heavily congested wireless channels, with approximately 7% of detected access points operating under HIGH congestion conditions. Guadalajara followed with nearly 5% of deployments categorized as HIGH congestion, while Monterrey had the lowest percentage at approximately 3.29%.
These findings suggest that wireless spectrum saturation increases proportionally with urban infrastructure density and access point concentration. Despite the presence of congested deployments, most detected access points were categorized as LOW or MEDIUM congestion, suggesting severe spectrum saturation was localized rather than uniformly distributed.
A thorough analysis of individual channel utilization revealed that channels 11, 6 and 1 consistently experienced the highest congestion levels across the three cities, which correlates with our previous findings. These channels accounted for the majority of VERY_HIGH congestion classifications, particularly within the 2.4 GHz band.
In Mexico City, channel 11 alone accounted for more than 25% of detected deployments and consistently exhibited VERY_HIGH congestion levels.
This behavior reflects the limited availability of non-overlapping channels within the 2.4 GHz spectrum and the widespread reliance on default wireless configurations.
Overall, the channel utilization analysis showed that wireless deployments are concentrated heavily within the traditional, non-overlapping 2.4 GHz channels. While this strategy reduces adjacent-channel interference, excessive access point density on the same channels can still produce significant co-channel contention and poor wireless performance in high-density urban environments.
Wireless security configurations
The next thing we evaluated was the security posture of the detected wireless networks. We analyzed the wireless security configurations advertised by access points in each of the locations.
Overall security configuration distribution
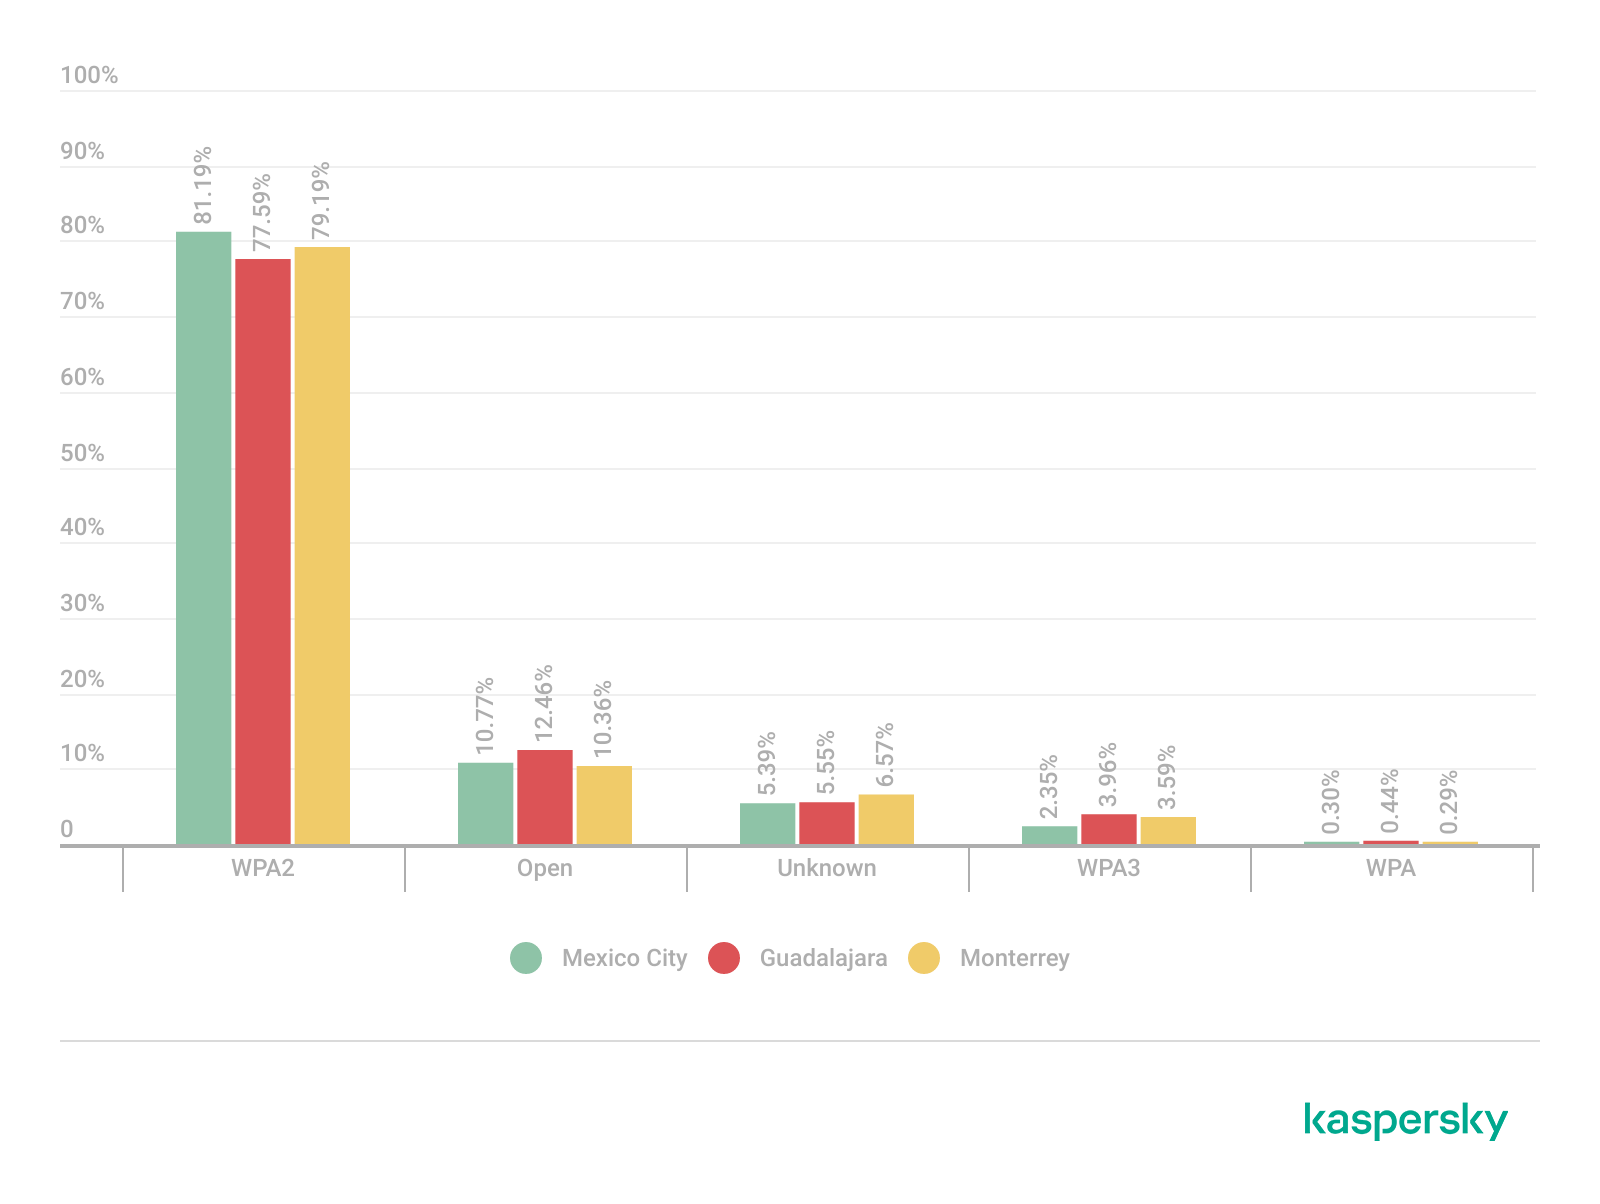
The analysis revealed that WPA2 was the dominant wireless authentication mechanism across the three cities. Mexico City had the highest WPA2 adoption rate at 81.19%, followed by Monterrey at 79.19% and Guadalajara at 77.59%.
The study found that every 6th open access point (17%) was unsafe, namely 16.5% in Mexico City, 18.5% in Guadalajara, and 17.2% in Monterrey. Open wireless deployments were consistently present across all locations, ranging between 10% and 12% of detected access points. These findings show that despite the widespread deployment of modern wireless security standards, encryption adoption remains incomplete.
Distribution of wireless authentication mechanisms across the three locations (download)
To simplify the interpretation of wireless security posture, we grouped detected networks into four categories:
Secure (WPA2/WPA3)
Insecure (Open/WEP)
Weak (WPA)
Unknown
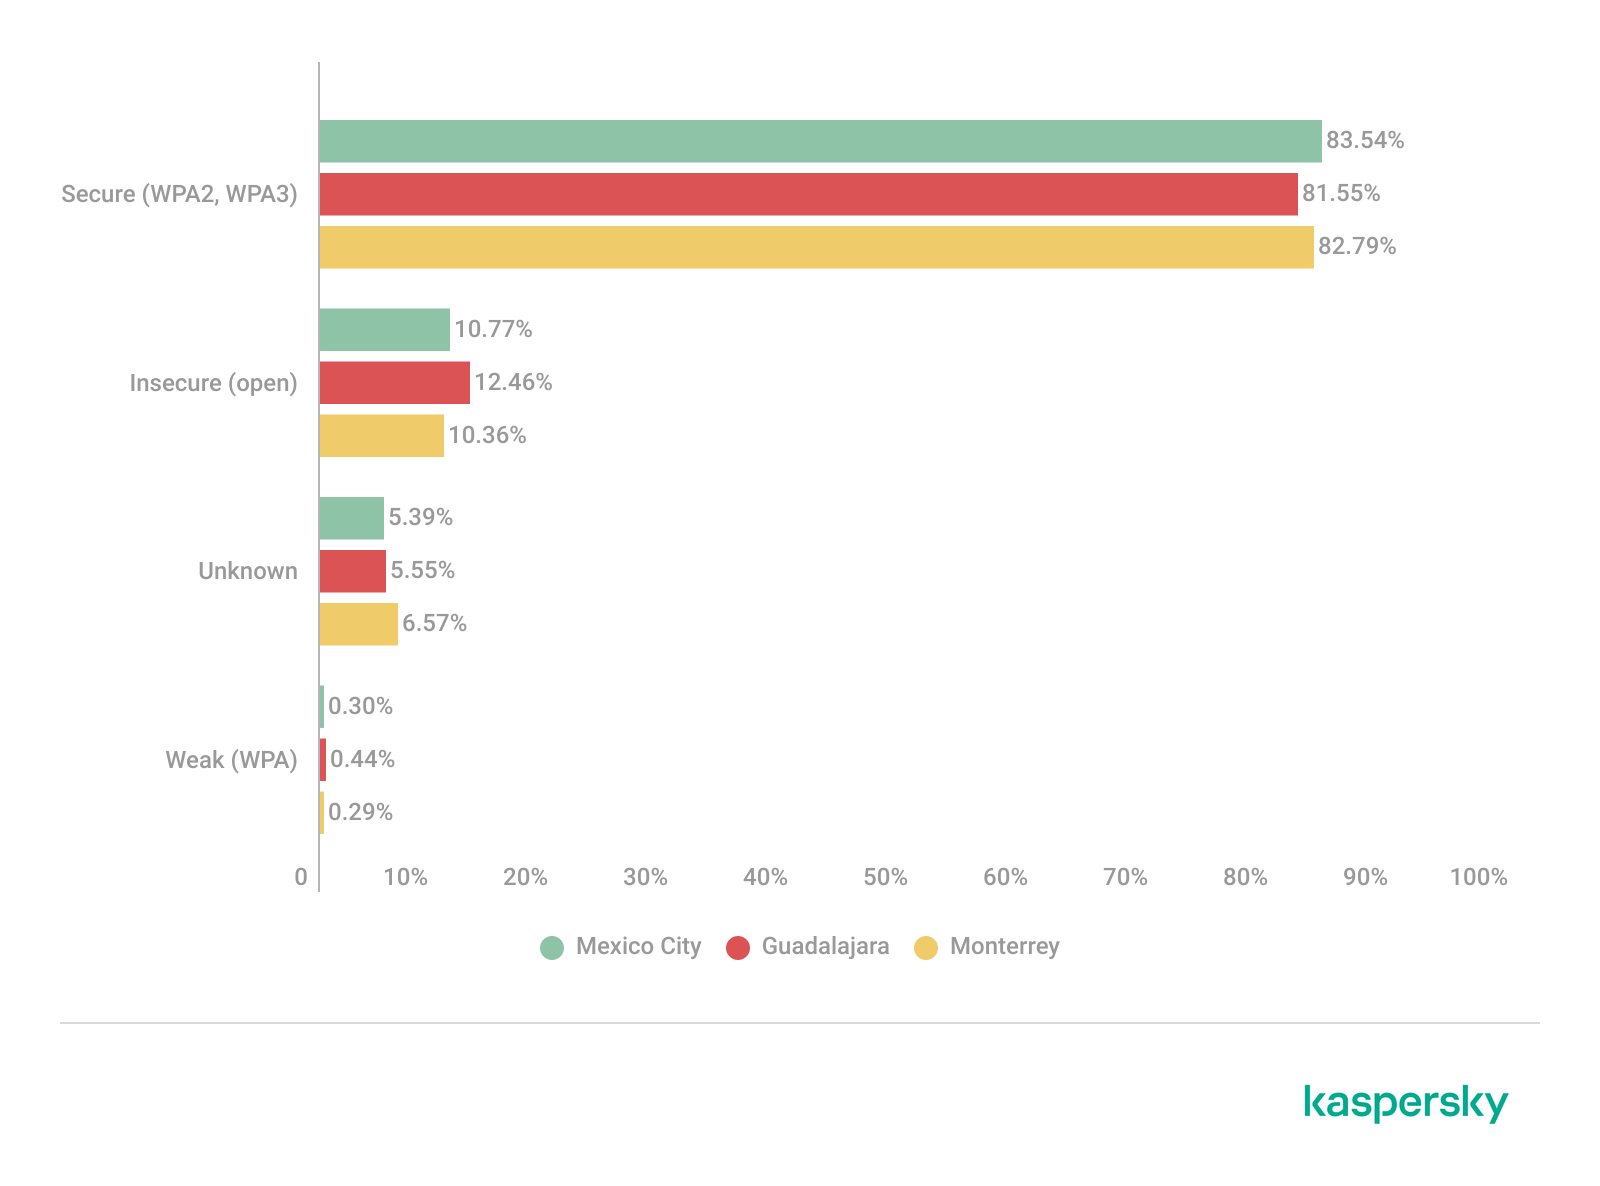
Across the three locations, secure networks comprised most of detected deployments, accounting for approximately 82% of all access points. However, insecure open networks still account for between 10% and 12% of detected wireless infrastructure, consistent with our previous findings. It is important to mention that networks within the unknown category are not considered secure.
Mexico City had the highest percentage of secure deployments at 83.54%, while Guadalajara had the highest percentage of insecure open networks at 12.46%. Although Monterrey had the lowest percentage of insecure networks, open deployments still accounted for more than 10% of the detected access points.
Wireless security posture grouping across the three locations (download)
Although modern WPA2/WPA3 encryption standards dominate current wireless deployments, the continued presence of open and legacy WPA deployments indicates that insecure wireless configurations remain relevant from an operational standpoint. These networks may expose users to passive traffic interception, unauthorized monitoring, rogue access point attacks, and credential harvesting techniques.
WPS-enabled networks
We also analyzed Wi-Fi Protected Setup (WPS) in all the locations to evaluate additional attack surfaces. WPS is a standard feature on wireless routers that enables devices such as printers, repeaters or mobile phones to connect to a secure Wi-Fi network without manually entering a long password, typically through a PIN-based enrolled mechanism. Although WPA2 and WPA3 provide strong encryption mechanisms, the presence of WPS can introduce security weaknesses due to inherently vulnerable PIN-based enrollment methods.
By combining detections from the three locations, we found that 55% of all detected access points did not advertise WPS capabilities, leaving 45% of deployments vulnerable to WPS-based abuse. These results suggest that, despite the adoption of modern encryption standards, a significant portion of wireless infrastructure continues to expose legacy convenience features.
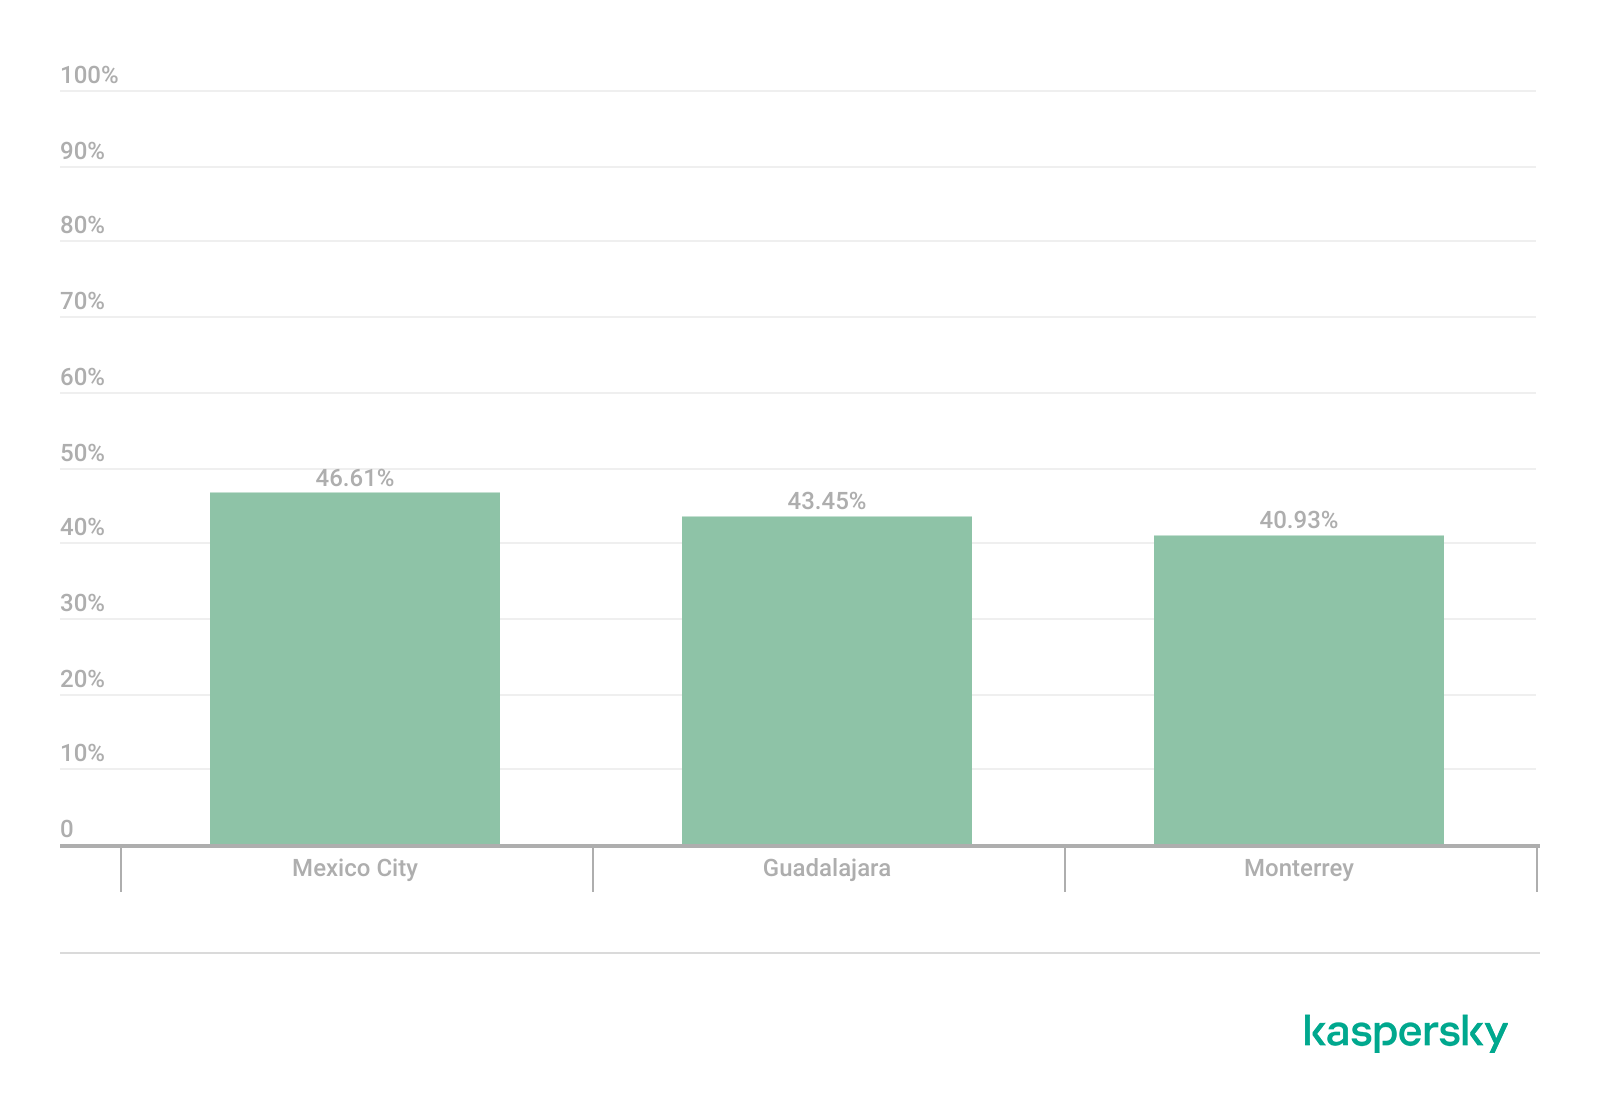
During the analysis, we found that Mexico City had the highest proportion of WPS-enabled networks, with 46.61% of the detected access points advertising WPS capabilities. Guadalajara was second with 43.45%, while Monterrey had the lowest proportion at 40.93%.
The percentage of detected access points advertising WPS capabilities across the three locations (download)
Almost half of the detected wireless networks in each city continued to advertise WPS, indicating that WPS prevalence is consistently high across the three cities.
Secure networks with WPS enabled
In many cases, networks classified as secure because of WPA2/WPA3 encryption still had WPS functionality enabled, which effectively increased the available attack surface.
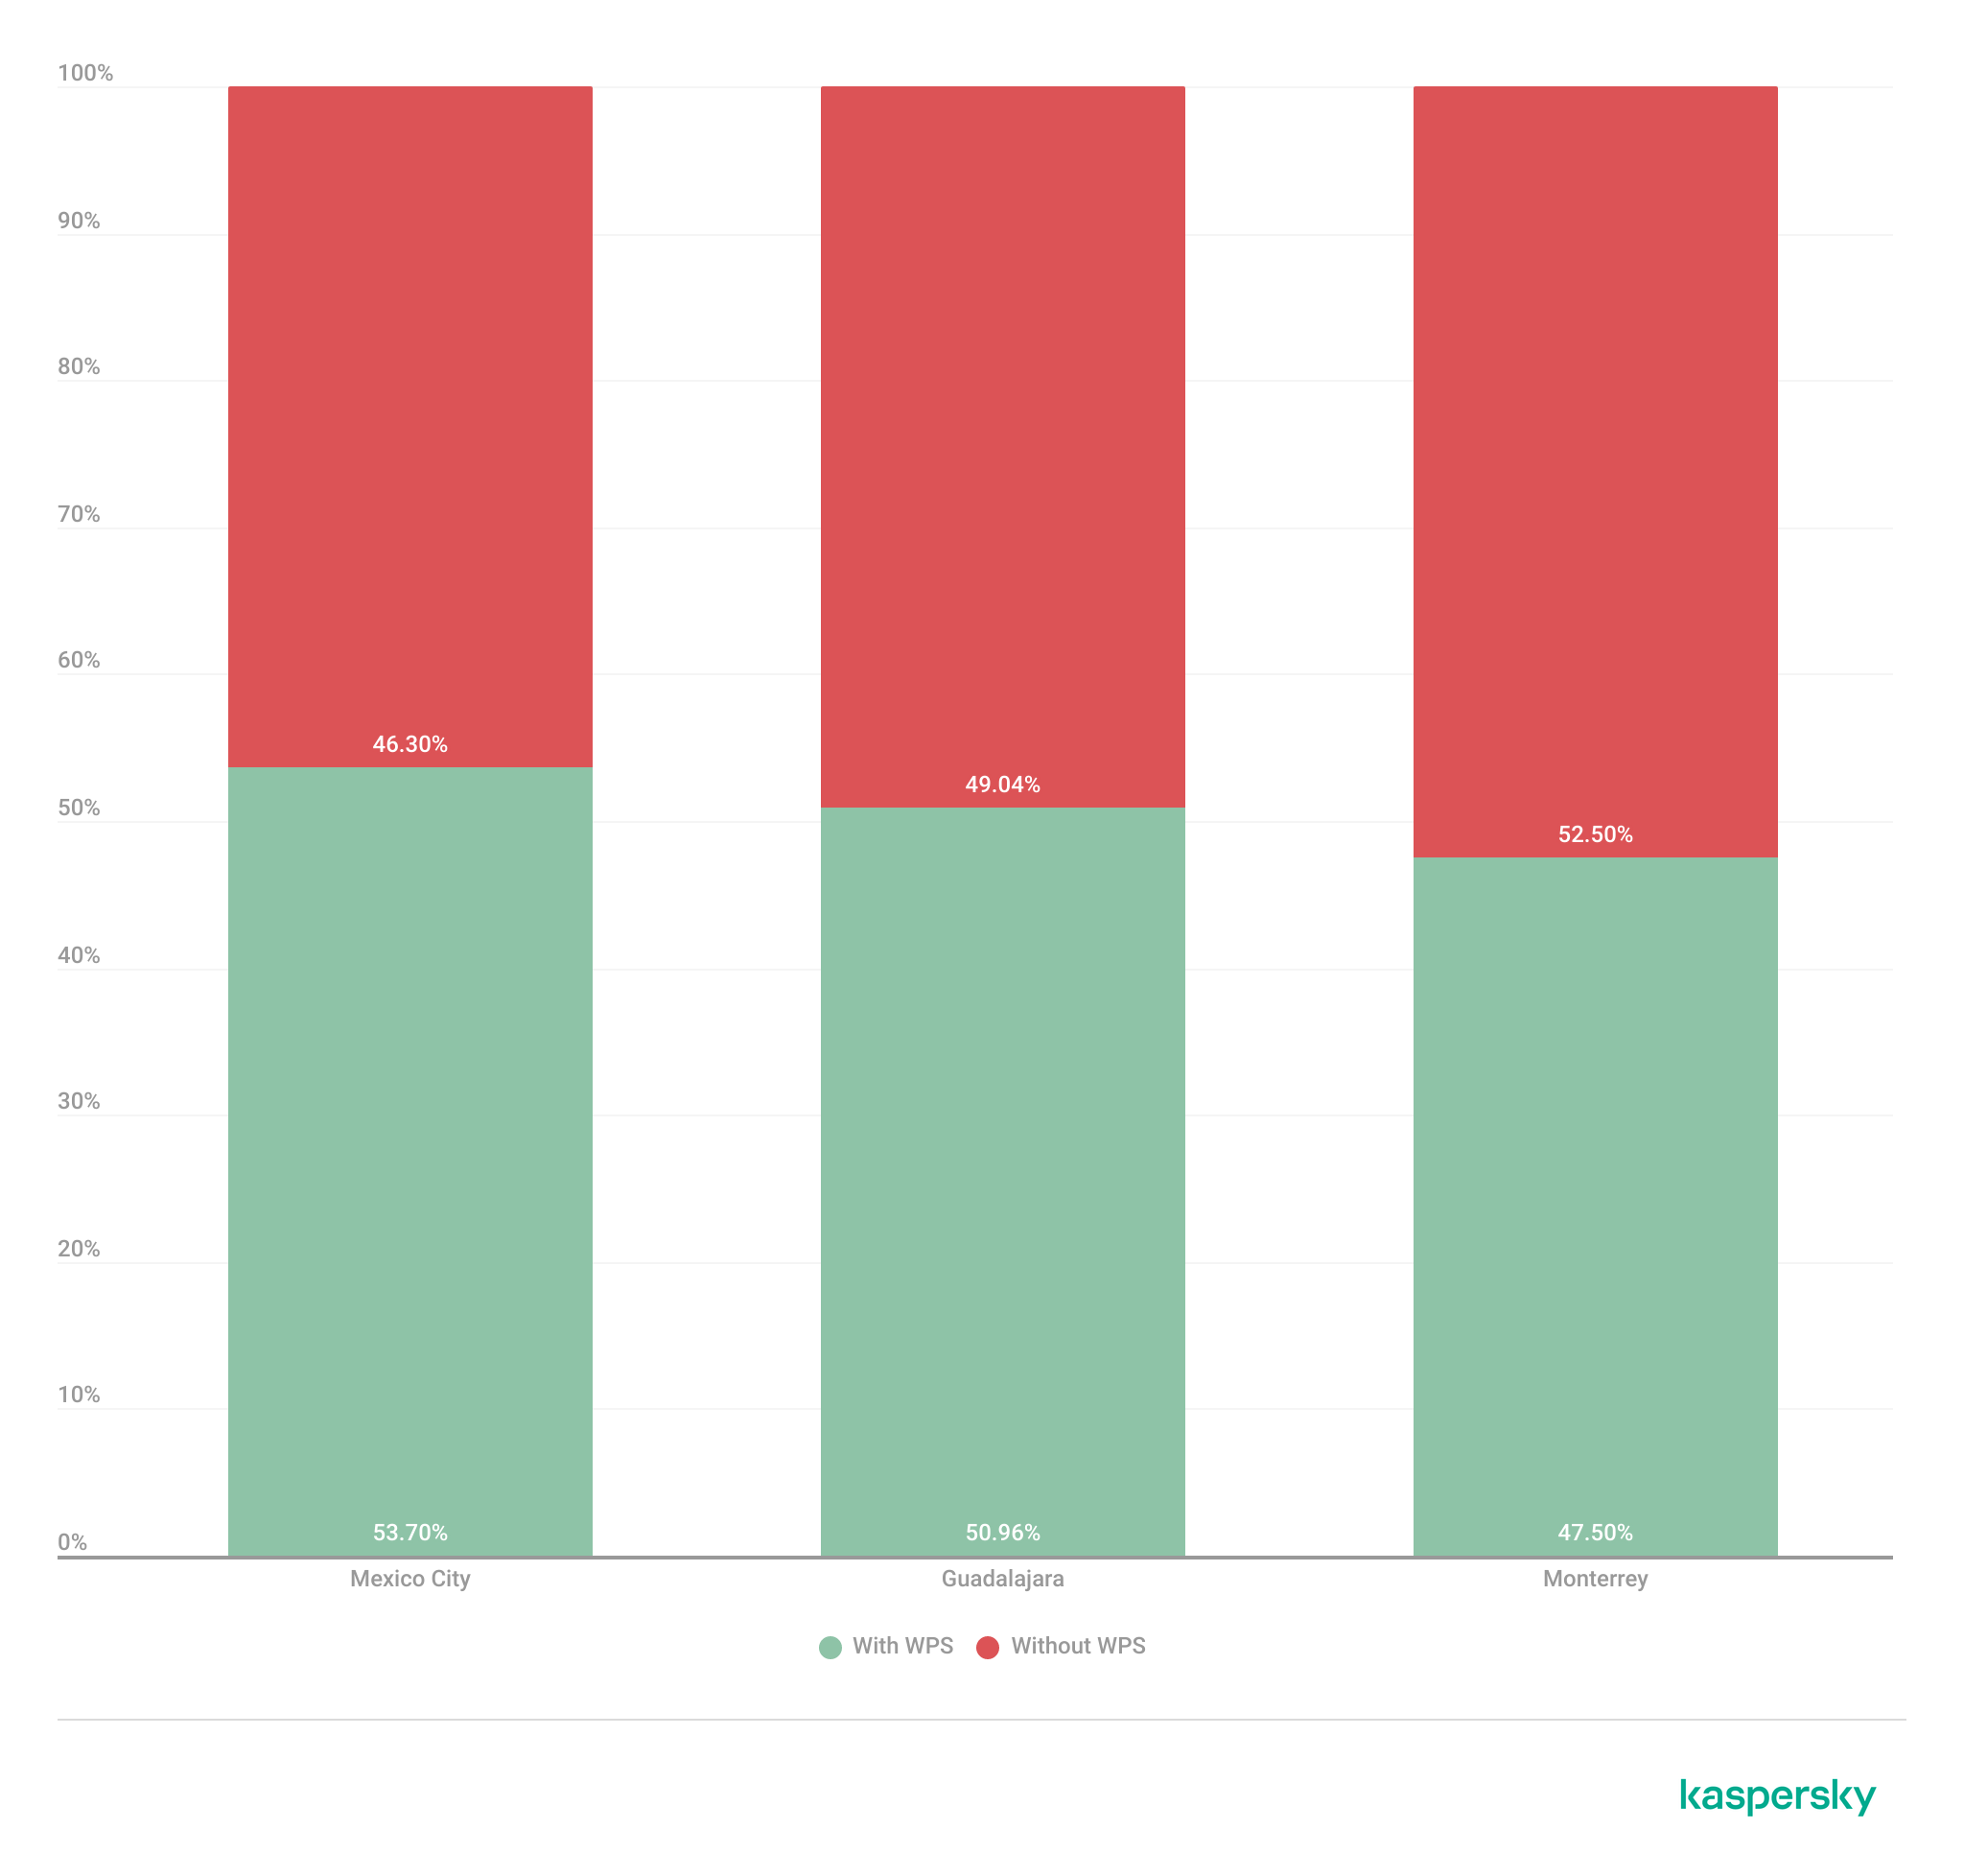
To further assess the relationship between encryption strength and WPS exposure, we conducted a secondary analysis of secure networks (WPA2/WPA3) only. The results showed that around half of all secure deployments still exposed WPS, with the following breakdown for each city:
Mexico City: 53.7%
Guadalajara: 50.9%
Monterrey: 47.5%
The proportion of secure networks with WPS enabled across the three locations (download)
These findings indicate that encryption strength alone is not enough to evaluate wireless security posture because additional protocol features, such as WPS, may still expose exploitable attack vectors.
Additional security considerations
Overall, travelers operating within dense public environments are exposed not only to insecure wireless infrastructure but also to various risks associated with digital interactions. These risks include many threats, from public USB charging systems and phishing QR codes to proximity-based protocols and exposure to shared public devices, such as interactive totems or kiosks. One particular point that should be taken into account in light of our research is the issue of rogue wireless deployments.
Rogue access points are not necessarily malicious; they may be set up accidentally by misconfiguring router settings. An entry point for potential compromise might be caused by various misconfigurations, from a weak password to an insecure protocol. However, attackers deploy such unauthorized hotspots with malicious intent to infiltrate a network. Threat actors may deploy rogue access points posing as legitimate public wireless networks in airports, hotels, cafés and tourist areas. These deployments are called “evil twins” and can trick users into connecting to attacker-controlled infrastructure capable of intercepting traffic, harvesting credentials, or performing man-in-the-middle attacks. Further risk lies in the potential compromise of local network devices or even malware distribution. Such threats complement our findings, underscoring the importance of implementing traffic encryption, using a security solution and exercising extreme caution while browsing via public networks.
Conclusion
The wardriving assessment conducted in Mexico City, Guadalajara, and Monterrey revealed that modern wireless infrastructure continues to present multiple forms of operational exposure despite the widespread adoption of WPA2 and WPA3 security standards. The analysis demonstrated that wireless environments are highly standardized in all the locations, with recurring ISP deployments, default SSID naming conventions, homogeneous manufacturer distribution, and predictable channel allocation practices observed in all three cities.
Although most of the detected networks were classified as secure under WPA2/WPA3 authentication mechanisms, a significant proportion were exposing additional attack surfaces through enabled WPS functionality, default configurations, sequential SSID structures, and infrastructure metadata disclosure. This demonstrates that encryption strength alone is insufficient for evaluating the overall security posture of wireless infrastructure. Additionally, the prevalence of open networks and legacy wireless configurations indicates that insecure deployments are still operationally relevant in all the locations.
The results also showed that wireless infrastructure is heavily concentrated within the 2.4 GHz spectrum, particularly around channels 11, 6, and 1. This leads to elevated congestion and increased co-channel interference in densely populated urban environments.
SSID analysis further revealed that publicly broadcast wireless identifiers frequently expose valuable operational information about ISPs, equipment manufacturers, deployment templates, organizational ownership, and user-defined naming practices. The identification of default ISP naming conventions, sequential SSID structures, and BSSID-derived SSIDs demonstrated that many deployments prioritize operational convenience and simplicity over exposure minimization and privacy.
The scope of the threats stemming from vulnerable wireless configurations poses serious digital exposure risks for users. The widespread presence of standard deployments, predictable SSID naming and publicly exposed infrastructure identifiers can facilitate passive reconnaissance, infrastructure fingerprinting and opportunistic targeting.
Recommendations
To minimize the risks of wireless-based exposure and the attack surface related to hotspot infrastructure, we recommend taking the following measures:
Disable WPS functionality on wireless routers whenever possible, particularly within WPA2/WPA3 deployments.
Avoid using default SSID naming conventions that disclose ISP providers, router manufacturers, or deployment templates.
Refrain from using personal, organizational, or location-based identifiers in wireless network names.
Avoid configuring SSID using BSSID or naming conventions derived from MAC addresses, as these may expose hardware fingerprinting information.
Promote migration toward modern WPA3-capable infrastructure while removing legacy wireless protocols when operationally feasible.
Reduce wireless congestion by optimizing channel allocation strategies and minimizing excessive dependence on the 2.4 GHz spectrum.
Encourage adoption of 5 GHz and newer wireless technologies to reduce interference and improve spectrum efficiency.
The findings presented in this assessment emphasize the importance of combining strong wireless encryption standards, secure deployment practices, exposure minimization strategies, and user awareness to enhance the overall security posture of wireless environments.
Mexico is one of the host countries for the 2026 FIFA World Cup, with matches to be played in three major cities: Mexico City, Monterrey, and Guadalajara. These locations are expected to see a large influx of international visitors, increasing the potential security risks. Many of those risks arise from users connecting to public wireless networks.
To better understand the wireless environments that visitors may encounter, we at Kaspersky GReAT conducted a wardriving assessment in the three host cities. The aim of the study was to analyze characteristics, deployment patterns, security configurations and potential exposure risks of public Wi-Fi infrastructure in urban wireless environments.
The information collected during the assessment was used exclusively for passive observation and infrastructure analysis. No attempts were made to authenticate, intercept communications, exploit systems or interact with the detected wireless networks beyond the publicly broadcast management information.
During processing of the collected data, one step involved filtering out networks belonging to cars or cell phones categorized as mobile hotspots because they do not represent networks that can be considered part of the assessment.
Research scope
The cities included in the study have high population density and extensive wireless infrastructure deployments. We chose areas with the most prominent wireless network activity and highly concentrated public access points. We carried out wardriving research in Monterrey back in 2008, but the city’s hotspot landscape has changed since then.
We chose the following analysis areas for each of the cities:
Mexico City: México City Stadium, Mexico City International Airport, Zócalo, Paseo de la Reforma, Colonia Roma, La Condesa, Polanco, and Coyoacán.
Guadalajara: Guadalajara Stadium, Guadalajara International Airport, the city center, Zapopan, Providencia, Avenida Chapultepec, Colonia Americana, Tlaquepaque, and the area around Andares.
Monterrey: Monterrey Stadium, Monterrey International Airport, Fundidora Park, Cintermex Monterrey, the downtown area, Barrio Antiguo, MacroPlaza, and the San Pedro financial district.
The wireless information was collected using passive wireless reconnaissance techniques. The collected information included:
SSID analysis and information exposure, including BSSID-derived SSIDs
Default router configurations and ISP deployments
Frequency and signal characteristics
Channel congestion and spectrum usage
Wireless security configurations, including:
Open and insecure wireless networks
WPS-enabled networks
Secure networks (WPA2/WPA3) with WPS enabled
We performed a wireless infrastructure analysis in Mexico City, Guadalajara, and Monterrey. We drove through the areas surrounding the World Cup stadiums, tourist zones, and other places where fan concentrations are likely to be largest. Our goal was to evaluate the security status, deployment characteristics and operational exposure of detected wireless networks.
In total, we recorded 84,588 signals with 69,473 unique Service Set Identifiers (SSIDs) in busy locations and World Cup zones across the three cities. Mexico City accounted for 61.4% of the signals, Guadalajara for 23.6%, and Monterrey for 14.8%. Approximately 82% of the signals had a single SSID (81.9%, 81.34%, and 84% respectively). Notably, they all operate under the IEEE 802.11 standard protocol.
Particular attention was given to identifying standard deployment patterns, legacy configurations, default vendor settings and information disclosure through publicly broadcast wireless identifiers.
The following sections present the results that were obtained by analyzing wireless infrastructure across the three locations.
Our findings
SSID analysis and information exposure
SSID analysis was conducted to evaluate naming conventions, deployment standardization and potential information exposure.
Only a few networks (0.0047%) have an invisible SSID, meaning the names of these networks are not broadcast. Some users prefer to hide the SSID for various reasons, such as the network’s purpose, the profile of its users, internal policies, etc. In contrast, the rest of the networks maintained active SSID broadcasting.
SSID structures may unintentionally disclose operational details about internet service providers (ISPs), device manufacturers, deployment practices, organizational ownership or user identity. The repeated presence of default SSID naming patterns across the analyzed locations indicates a significant degree of infrastructure homogeneity and reuse of default wireless configurations. It may also facilitate passive infrastructure profiling by revealing standard characteristics in use.
Approximately 34% of the detected networks retained the default SSID naming conventions provided by the manufacturer or ISP, while 66% used customized identifiers.
Distribution of SSID naming conventions (download)
Several recurring SSID naming conventions associated with ISP-provided deployments were identified in the three cities. The most frequently observed patterns include identifiers such as “Club_Totalplay_WiFi”, “izzi WiFi”, and “Megacable WiFi”, which suggests extensive standardization of wireless infrastructure deployment. Additionally, we observed distinctive location-specific SSIDs in each area of analysis, such as “XXXX-Internet para Todos-CDMX” or “RED JALISCO”.
Sequential SSID naming structures were also identified during the analysis. Patterns such as “INFINITUMXX” and “IZZI-XX” suggest automated ISP deployment and large-scale deployment strategies.
We identified 33 unique sequential naming structures among the 137 sequential SSIDs in total, representing approximately 0.16% of the detected wireless networks.
The following graph shows the top five sequential SSID patterns found in the largest number of networks:
Five most frequently observed sequential patterns (download)
Several customized SSIDs contained personal or organizational identifiers, including family names, professions, addresses or internal department references. Although personalized SSIDs may simplify local network identification for users, they may also expose sensitive information that could be useful for social engineering, physical targeting, or organizational profiling.
BSSID-derived SSID
During the analysis, multiple networks were identified that used the physical MAC address of a Wi-Fi access point (BSSID) as the visible SSID. This practice exposes hardware-level information that could facilitate vendor fingerprinting and targeted reconnaissance activities.
The organizationally unique identifier (OUI) contained in the first bytes of the BSSID identifies the equipment manufacturer. Threat actors can correlate exposed manufacturers with device-specific vulnerabilities.
Notably, we found that more than 30% of networks in all three cities reuse the MAC address as the SSID.
Default router configurations and ISP deployments
We performed wireless infrastructure profiling to identify the most common wireless equipment manufacturers and ISP deployments across the three locations.
Large-scale ISP deployments frequently use standardized wireless configurations and vendor-specific hardware platforms. Identifying dominant manufacturers and ISP naming conventions can provide insight into infrastructure and deployment practices facilitating the mapping of standardized attack surfaces.
The following figure shows the distribution of the most commonly used manufacturers.
Most frequently observed wireless equipment manufacturers (download)
The manufacturer analysis revealed a strong concentration of wireless infrastructure among a limited number of vendors. Across the three locations, Huawei Technologies, MediaTek-based devices, and other manufacturers’ equipment that is distributed through ISP channels represented a significant portion of the detected deployments. Mexico City had the most diverse infrastructure, while Monterrey and Guadalajara had a greater concentration of wireless equipment known as SOHO (small office/home office) or residential-grade hardware. The widespread presence of standard vendor platforms may facilitate infrastructure fingerprinting and large-scale targeting of known device-specific vulnerabilities.
Most frequently observed wireless equipment manufacturers across the three cities (download)
ISP deployments frequently exhibited standardized configuration patterns and recurring manufacturer identifiers. Our ISP deployment analysis revealed a high concentration of access points associated with major residential internet providers. Deployments associated with Infinitum, Totalplay and Izzi represented a substantial portion of the detected wireless infrastructure across all locations. These findings suggest a high degree of deployment standardization across networks associated with major residential internet providers. This observation was supported by the repeated presence of ISP-associated SSIDs such as “Infinitum”, “Totalplay”, and “Izzi”, combined with manufacturer identifiers frequently associated with consumer equipment, including Huawei, ZTE and other residential wireless equipment vendors.
It is important to note that, for this analysis, ISPs were primarily inferred from SSID naming conventions and manufacturer fingerprint data. A significant portion of the detected wireless networks fell into the “UNKNOWN/CUSTOM” category. This classification includes custom hotspots and networks whose naming conventions did not expose identifiable ISP-associated patterns. The findings suggest that many users and organizations (as we saw previously, approximately 66%) use custom network names, limiting direct provider attribution.
The following figure illustrates the distribution of ISP-associated wireless deployments in general.
To better understand this distribution, we took the most frequently observed ISPs by city.
Most frequently observed ISPs across the three cities (download)
Frequency and signal characteristics
We also analyzed wireless signal characteristics to evaluate coverage quality, signal strength, and frequency band utilization in the three cities. In dense urban environments, signal quality and frequency spectrum distribution can affect wireless reliability, client connectivity, roaming performance, and overall network efficiency.
Signal quality analysis revealed that a substantial portion of the detected access points operated under weak or very weak signal conditions. Monterrey had the highest percentage of very weak signals, with approximately 50% of detected deployments. Similar patterns were observed in Guadalajara and Mexico City, suggesting high-density wireless environments with overlapping coverage areas. Only a limited percentage of networks were classified within the very good or excellent signal categories across the three locations.
Signal stability analysis revealed that most detected wireless deployments exhibited stable beacon transmission behavior. More than 96% of the detected access points across all locations were classified as stable, while only a small percentage exhibited unstable or indeterminate signal behavior.
These findings imply that the majority of the wireless infrastructure observed during the assessment corresponded to permanently deployed access points rather than transient or intermittent wireless devices.
Frequency band analysis revealed the strong prevalence of 2.4 GHz wireless deployments across the three locations. More than 95% of the detected wireless networks operated within the 2.4 GHz spectrum, while only a small percentage of deployments were classified under the unknown or non-standard frequency categories. This uneven distribution reflects the continued prevalence of legacy-compatible wireless infrastructure and SOHO deployments.
These findings are consistent with dense urban wireless environments with large numbers of access points in restricted spectrum allocations.
Channel congestion and spectrum usage
Next, we analyzed wireless channel utilization to evaluate frequency spectrum congestion and channel allocation patterns across the three cities. Our analysis focused on the 2.4 GHz spectrum, where channel overlap and high access point density commonly produce interference and degraded wireless performance. In densely populated wireless environments, an excessive concentration of access points on a limited number of channels can lead to co-channel interference, packet collisions, reduced throughput, and degraded network stability.
Spectrum congestion analysis revealed that the 2.4 GHz band consistently experienced elevated congestion levels across the three cities. The detailed results showed a strong concentration of deployments on channels 11, 6 and 1, which are traditionally recommended as non-overlapping channels within the 2.4 GHz spectrum. Channel 11 was the most utilized channel, accounting for 25.2% of the detected access points, followed by channel 6 with 22.5% and channel 1 with 19.5%. This distribution indicates that most wireless deployments adhere to standard channel allocation practices for 2.4 GHz Wi-Fi environments.
The following figure illustrates the overall distribution of the most frequently utilized wireless channels.
To further assess wireless spectrum saturation, the detected access points were grouped according to channel congestion levels: VERY_HIGH, HIGH, UNKNOWN, MEDIUM, LOW and NONE.
Mexico City had the highest proportion of heavily congested wireless channels, with approximately 7% of detected access points operating under HIGH congestion conditions. Guadalajara followed with nearly 5% of deployments categorized as HIGH congestion, while Monterrey had the lowest percentage at approximately 3.29%.
These findings suggest that wireless spectrum saturation increases proportionally with urban infrastructure density and access point concentration. Despite the presence of congested deployments, most detected access points were categorized as LOW or MEDIUM congestion, suggesting severe spectrum saturation was localized rather than uniformly distributed.
A thorough analysis of individual channel utilization revealed that channels 11, 6 and 1 consistently experienced the highest congestion levels across the three cities, which correlates with our previous findings. These channels accounted for the majority of VERY_HIGH congestion classifications, particularly within the 2.4 GHz band.
In Mexico City, channel 11 alone accounted for more than 25% of detected deployments and consistently exhibited VERY_HIGH congestion levels.
This behavior reflects the limited availability of non-overlapping channels within the 2.4 GHz spectrum and the widespread reliance on default wireless configurations.
Overall, the channel utilization analysis showed that wireless deployments are concentrated heavily within the traditional, non-overlapping 2.4 GHz channels. While this strategy reduces adjacent-channel interference, excessive access point density on the same channels can still produce significant co-channel contention and poor wireless performance in high-density urban environments.
Wireless security configurations
The next thing we evaluated was the security posture of the detected wireless networks. We analyzed the wireless security configurations advertised by access points in each of the locations.
Overall security configuration distribution
The analysis revealed that WPA2 was the dominant wireless authentication mechanism across the three cities. Mexico City had the highest WPA2 adoption rate at 81.19%, followed by Monterrey at 79.19% and Guadalajara at 77.59%.
The study found that every 6th open access point (17%) was unsafe, namely 16.5% in Mexico City, 18.5% in Guadalajara, and 17.2% in Monterrey. Open wireless deployments were consistently present across all locations, ranging between 10% and 12% of detected access points. These findings show that despite the widespread deployment of modern wireless security standards, encryption adoption remains incomplete.
Distribution of wireless authentication mechanisms across the three locations (download)
To simplify the interpretation of wireless security posture, we grouped detected networks into four categories:
Secure (WPA2/WPA3)
Insecure (Open/WEP)
Weak (WPA)
Unknown
Across the three locations, secure networks comprised most of detected deployments, accounting for approximately 82% of all access points. However, insecure open networks still account for between 10% and 12% of detected wireless infrastructure, consistent with our previous findings. It is important to mention that networks within the unknown category are not considered secure.
Mexico City had the highest percentage of secure deployments at 83.54%, while Guadalajara had the highest percentage of insecure open networks at 12.46%. Although Monterrey had the lowest percentage of insecure networks, open deployments still accounted for more than 10% of the detected access points.
Wireless security posture grouping across the three locations (download)
Although modern WPA2/WPA3 encryption standards dominate current wireless deployments, the continued presence of open and legacy WPA deployments indicates that insecure wireless configurations remain relevant from an operational standpoint. These networks may expose users to passive traffic interception, unauthorized monitoring, rogue access point attacks, and credential harvesting techniques.
WPS-enabled networks
We also analyzed Wi-Fi Protected Setup (WPS) in all the locations to evaluate additional attack surfaces. WPS is a standard feature on wireless routers that enables devices such as printers, repeaters or mobile phones to connect to a secure Wi-Fi network without manually entering a long password, typically through a PIN-based enrolled mechanism. Although WPA2 and WPA3 provide strong encryption mechanisms, the presence of WPS can introduce security weaknesses due to inherently vulnerable PIN-based enrollment methods.
By combining detections from the three locations, we found that 55% of all detected access points did not advertise WPS capabilities, leaving 45% of deployments vulnerable to WPS-based abuse. These results suggest that, despite the adoption of modern encryption standards, a significant portion of wireless infrastructure continues to expose legacy convenience features.
During the analysis, we found that Mexico City had the highest proportion of WPS-enabled networks, with 46.61% of the detected access points advertising WPS capabilities. Guadalajara was second with 43.45%, while Monterrey had the lowest proportion at 40.93%.
The percentage of detected access points advertising WPS capabilities across the three locations (download)
Almost half of the detected wireless networks in each city continued to advertise WPS, indicating that WPS prevalence is consistently high across the three cities.
Secure networks with WPS enabled
In many cases, networks classified as secure because of WPA2/WPA3 encryption still had WPS functionality enabled, which effectively increased the available attack surface.
To further assess the relationship between encryption strength and WPS exposure, we conducted a secondary analysis of secure networks (WPA2/WPA3) only. The results showed that around half of all secure deployments still exposed WPS, with the following breakdown for each city:
Mexico City: 53.7%
Guadalajara: 50.9%
Monterrey: 47.5%
The proportion of secure networks with WPS enabled across the three locations (download)
These findings indicate that encryption strength alone is not enough to evaluate wireless security posture because additional protocol features, such as WPS, may still expose exploitable attack vectors.
Additional security considerations
Overall, travelers operating within dense public environments are exposed not only to insecure wireless infrastructure but also to various risks associated with digital interactions. These risks include many threats, from public USB charging systems and phishing QR codes to proximity-based protocols and exposure to shared public devices, such as interactive totems or kiosks. One particular point that should be taken into account in light of our research is the issue of rogue wireless deployments.
Rogue access points are not necessarily malicious; they may be set up accidentally by misconfiguring router settings. An entry point for potential compromise might be caused by various misconfigurations, from a weak password to an insecure protocol. However, attackers deploy such unauthorized hotspots with malicious intent to infiltrate a network. Threat actors may deploy rogue access points posing as legitimate public wireless networks in airports, hotels, cafés and tourist areas. These deployments are called “evil twins” and can trick users into connecting to attacker-controlled infrastructure capable of intercepting traffic, harvesting credentials, or performing man-in-the-middle attacks. Further risk lies in the potential compromise of local network devices or even malware distribution. Such threats complement our findings, underscoring the importance of implementing traffic encryption, using a security solution and exercising extreme caution while browsing via public networks.
Conclusion
The wardriving assessment conducted in Mexico City, Guadalajara, and Monterrey revealed that modern wireless infrastructure continues to present multiple forms of operational exposure despite the widespread adoption of WPA2 and WPA3 security standards. The analysis demonstrated that wireless environments are highly standardized in all the locations, with recurring ISP deployments, default SSID naming conventions, homogeneous manufacturer distribution, and predictable channel allocation practices observed in all three cities.
Although most of the detected networks were classified as secure under WPA2/WPA3 authentication mechanisms, a significant proportion were exposing additional attack surfaces through enabled WPS functionality, default configurations, sequential SSID structures, and infrastructure metadata disclosure. This demonstrates that encryption strength alone is insufficient for evaluating the overall security posture of wireless infrastructure. Additionally, the prevalence of open networks and legacy wireless configurations indicates that insecure deployments are still operationally relevant in all the locations.
The results also showed that wireless infrastructure is heavily concentrated within the 2.4 GHz spectrum, particularly around channels 11, 6, and 1. This leads to elevated congestion and increased co-channel interference in densely populated urban environments.
SSID analysis further revealed that publicly broadcast wireless identifiers frequently expose valuable operational information about ISPs, equipment manufacturers, deployment templates, organizational ownership, and user-defined naming practices. The identification of default ISP naming conventions, sequential SSID structures, and BSSID-derived SSIDs demonstrated that many deployments prioritize operational convenience and simplicity over exposure minimization and privacy.
The scope of the threats stemming from vulnerable wireless configurations poses serious digital exposure risks for users. The widespread presence of standard deployments, predictable SSID naming and publicly exposed infrastructure identifiers can facilitate passive reconnaissance, infrastructure fingerprinting and opportunistic targeting.
Recommendations
To minimize the risks of wireless-based exposure and the attack surface related to hotspot infrastructure, we recommend taking the following measures:
Disable WPS functionality on wireless routers whenever possible, particularly within WPA2/WPA3 deployments.
Avoid using default SSID naming conventions that disclose ISP providers, router manufacturers, or deployment templates.
Refrain from using personal, organizational, or location-based identifiers in wireless network names.
Avoid configuring SSID using BSSID or naming conventions derived from MAC addresses, as these may expose hardware fingerprinting information.
Promote migration toward modern WPA3-capable infrastructure while removing legacy wireless protocols when operationally feasible.
Reduce wireless congestion by optimizing channel allocation strategies and minimizing excessive dependence on the 2.4 GHz spectrum.
Encourage adoption of 5 GHz and newer wireless technologies to reduce interference and improve spectrum efficiency.
The findings presented in this assessment emphasize the importance of combining strong wireless encryption standards, secure deployment practices, exposure minimization strategies, and user awareness to enhance the overall security posture of wireless environments.
One of the biggest football (soccer) events of this summer is the World Cup 2026. The tournament is co-hosted by three countries: the U.S., Canada, and Mexico. Unfortunately, events of this scale attract not just fans, but also scammers from all over the globe. We’ve already covered how cybercriminals are prepping for the World Cup online, and today we’re talking about digital security for fans on the ground in Mexico.
The country will host 13 matches and welcome millions of tourists. They’ll be staying in hotels, heading to games, checking out restaurants, navigating airports, and visiting popular tourist spots — and everywhere they go, the temptation to connect to public Wi-Fi will be high.
We’ve surveyed more than 84 500 (!) public Wi-Fi access points in Mexico City, Guadalajara, and Monterrey — and we have a lot to share about their security. Spoiler alert: many networks are still using outdated security standards, so you really shouldn’t go on vacation without reliable protection and an eSIM.
What and how we tested
Walking across Mexico looking for public Wi-Fi access points would have been a bit tough, though that’s exactly what we did for a similar Wi-Fi security survey in Paris. You can check out the results of that in our post, How safe is Wi-Fi in Paris?
This time the mission was far more demanding: mapping the wireless landscape of three major metropolises. That’s why we went wardriving — scanning for and logging wireless networks from a moving vehicle while equipped with a smartphone or laptop. It’s similar to searching for Wi-Fi on your phone, where the device constantly listens for nearby networks. Except instead of connecting to them, we just collect data about them.
All information was used strictly for passive observation and infrastructure analysis. Beyond receiving publicly broadcast service information, the experts of Kaspersky’s Global Research and Analysis Team (GReAT) didn’t attempt to authenticate, intercept traffic, exploit systems, or otherwise interact with the wireless networks they discovered. Mobile access points deployed in cars and on mobile devices were excluded from the sample.
Our main target was Mexico City — the capital and one of the most densely populated cities in Latin America. We took a drive through popular tourist spots: Mexico City Stadium, Mexico City International Airport, Zócalo, Paseo de la Reforma, Colonia Roma, La Condesa, Polanco, Coyoacán.
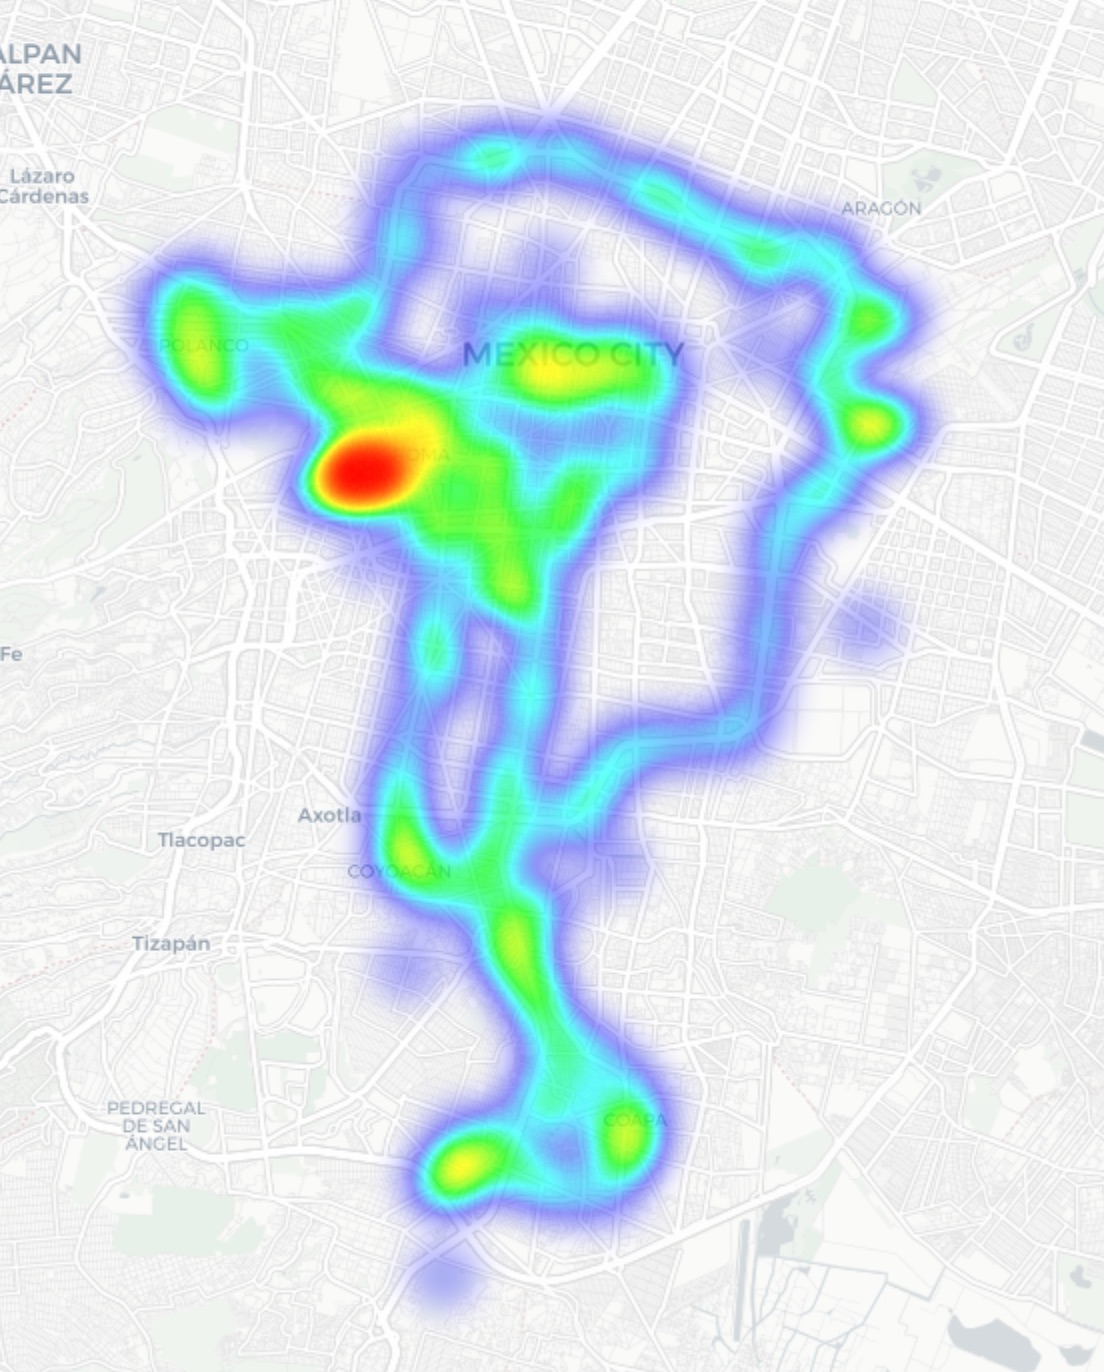
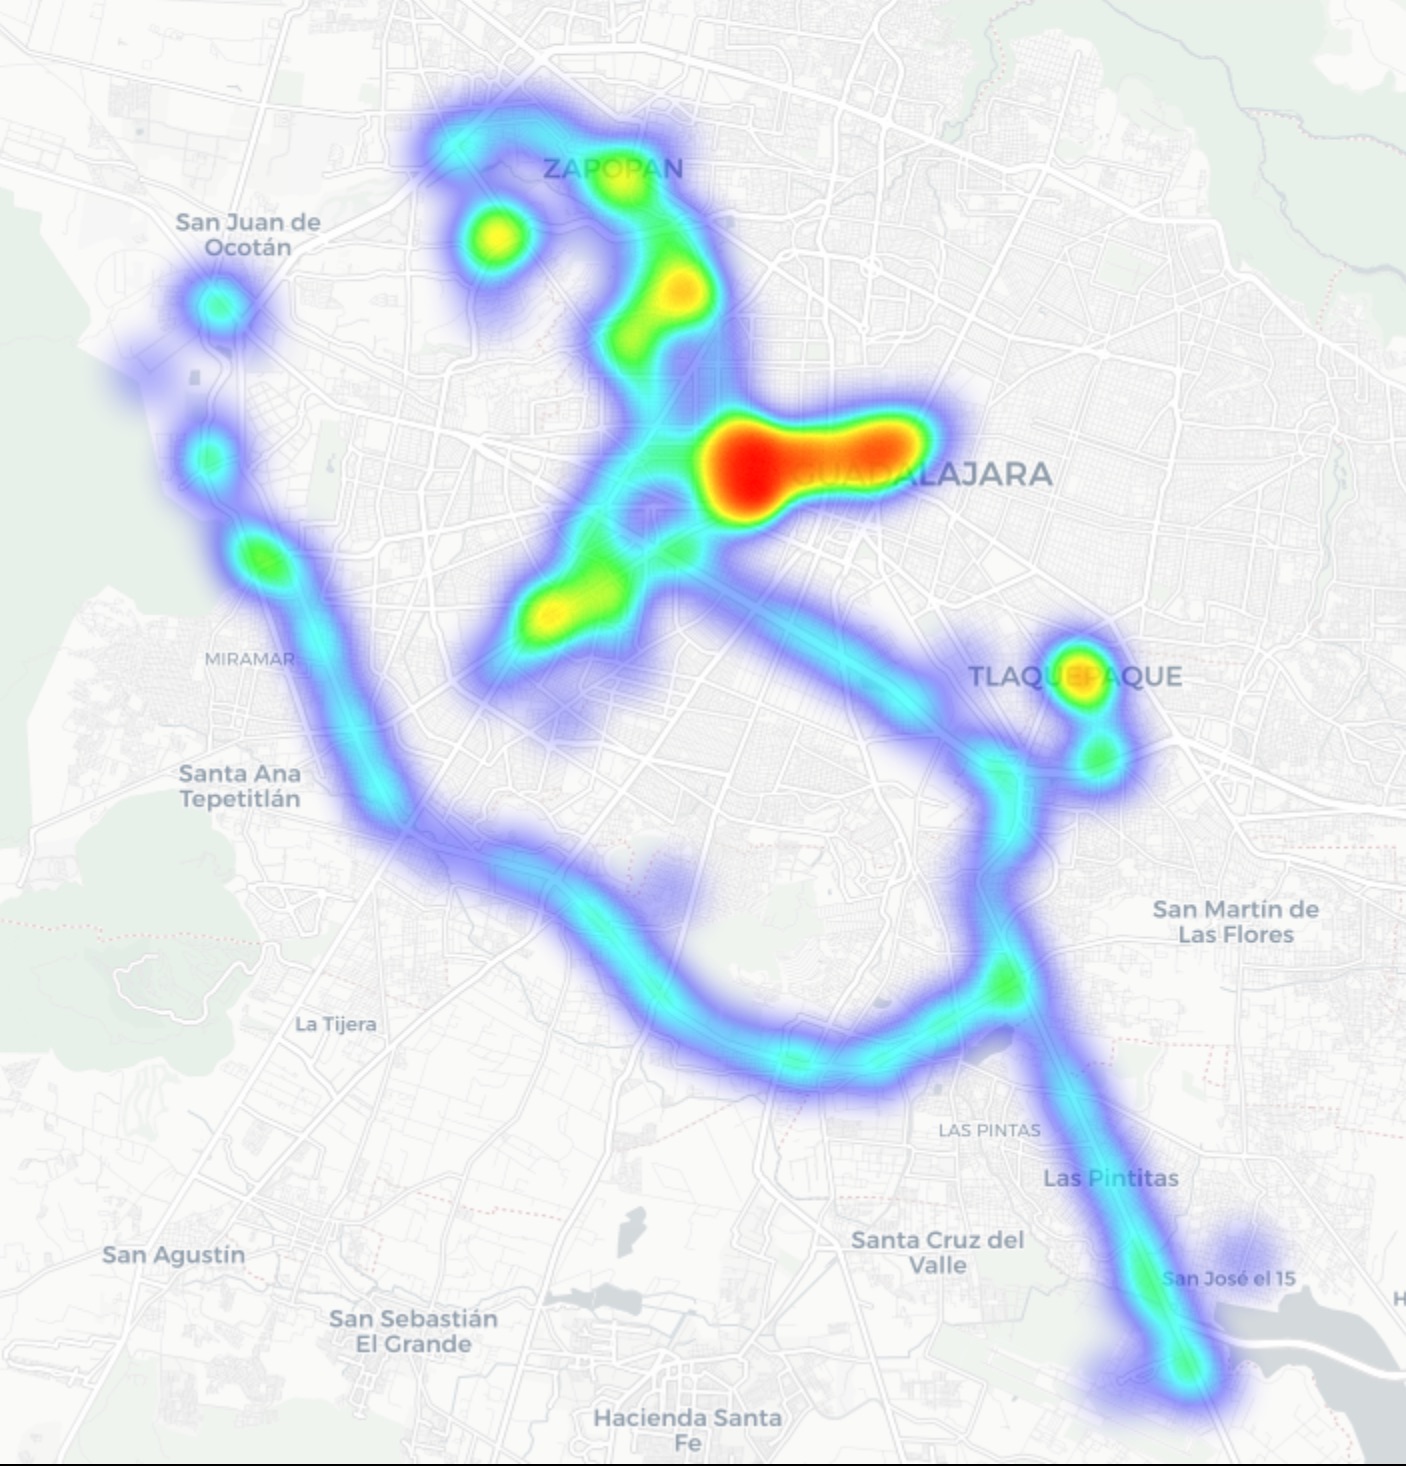
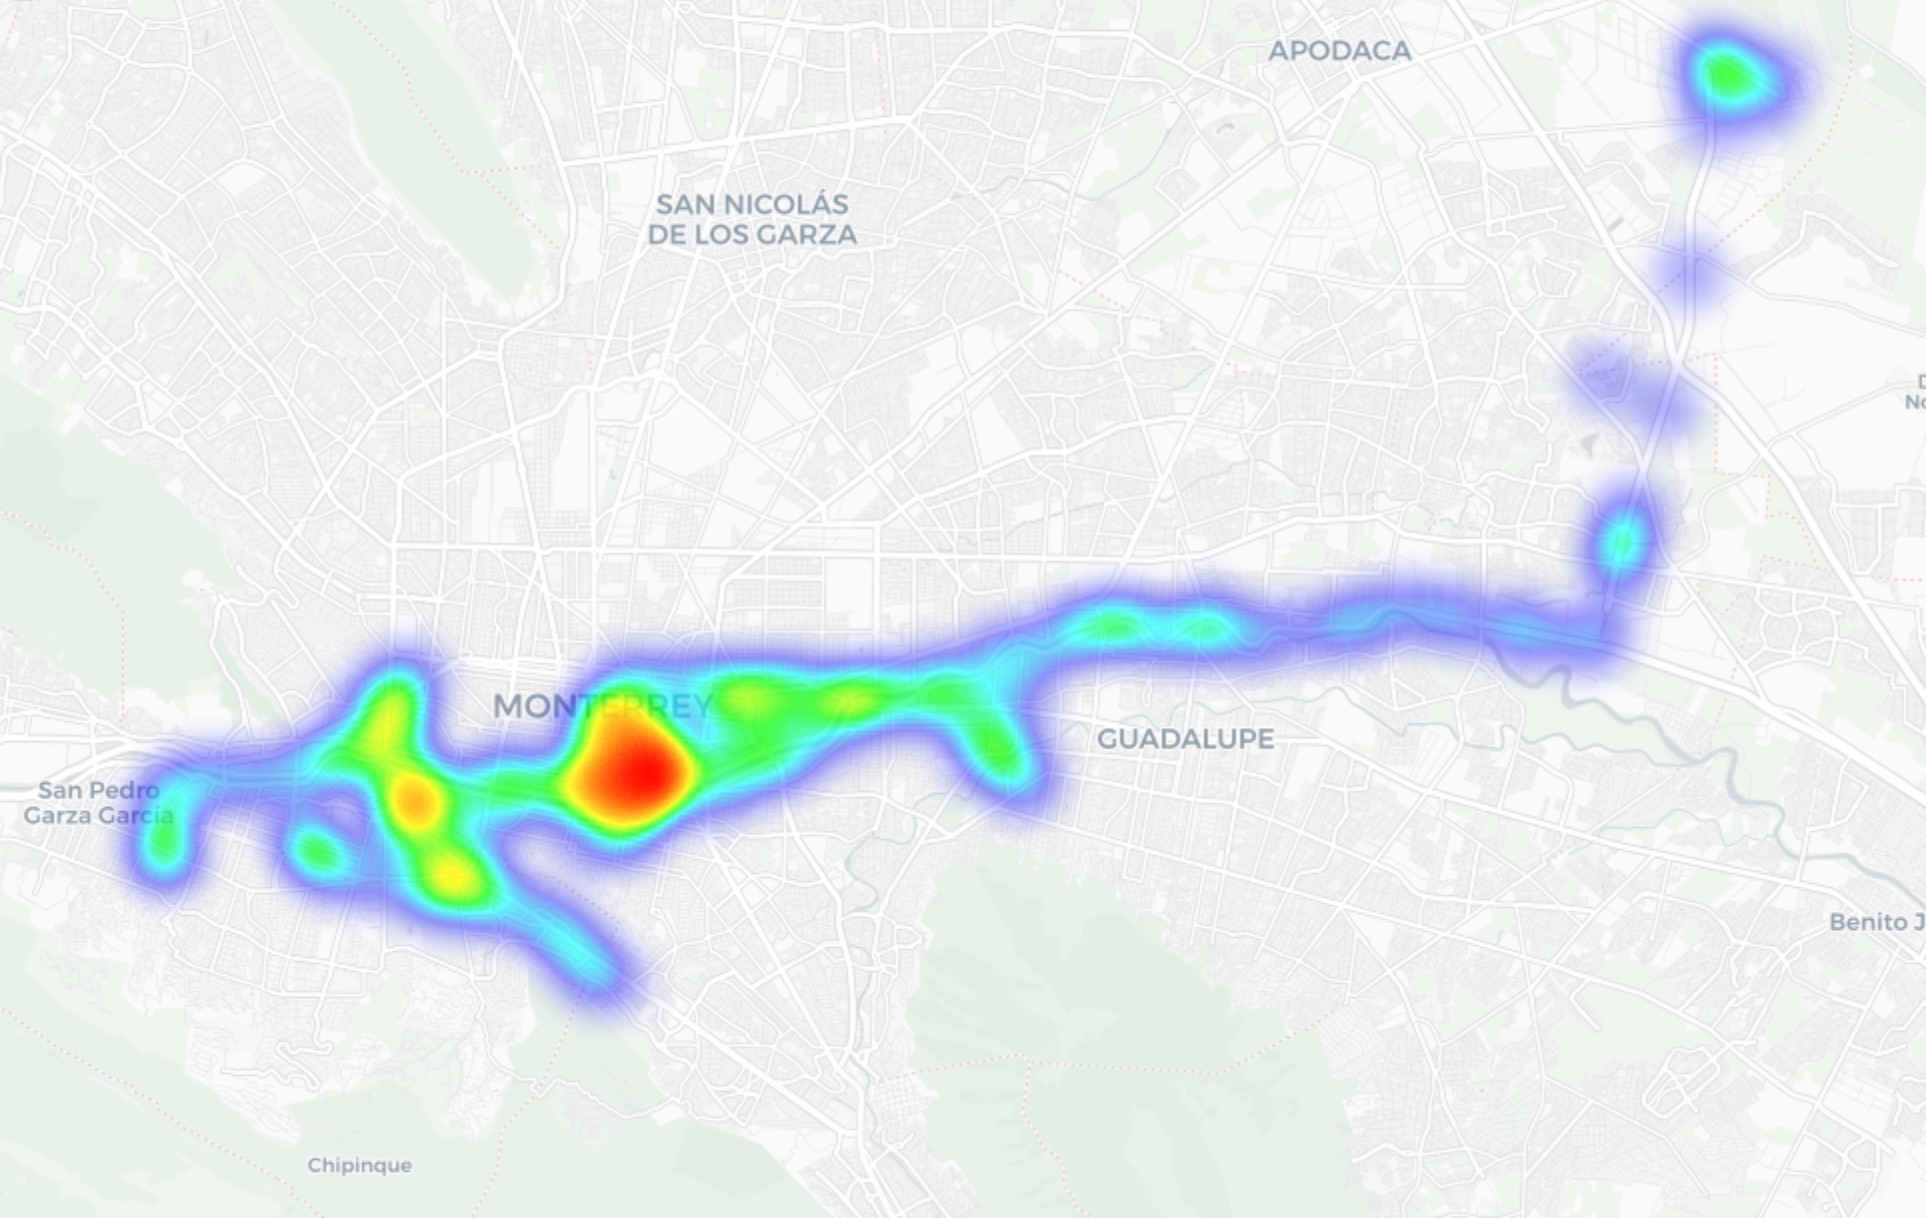
In Guadalajara and Monterrey, we drove similar routes: stadiums, main avenues, airports, and popular neighborhoods. Below you can see a heatmap of the areas we covered, ranging from red for areas with the highest density of public access points, through yellow and green, to blue for the lowest concentration.
Heatmap showing the locations of all Wi-Fi access points we covered in Mexico City
Heatmap showing the locations of all Wi-Fi access points we covered in Guadalajara
Heatmap showing the locations of all Wi-Fi access points we covered in Monterrey
We used passive radio reconnaissance to log 84 500 signals and 69 500 unique network identifiers across these three cities. The majority of the signals were caught in Mexico City (61.4%), followed by Guadalajara (23.6%) and Monterrey (14.8%).
What we analyzed:
Wireless network identifiers (SSIDs): the names that show up in your list of available Wi-Fi networks
Information that can be gleaned from these identifiers
Default router configurations and how ISPs deploy their networks
Frequencies used and signal characteristics
Channel load and radio frequency spectrum usage
Wireless network security configurations:
Open and insecure networks
Networks with WPS enabled
Secure networks (WPA2/WPA3) with WPS activated
You can find the full version of the study on the Securelist blog.
Telltale public Wi-Fi access point names
Network names (SSIDs) can tell you a lot by unintentionally revealing information about hardware manufacturers, ISPs, deployment methods, and whether an access point belongs to a business or a private user.
About 34% of the public Wi-Fi networks we logged didn’t bother changing their names at all, either sticking with the factory SSIDs from the router manufacturers or using standard naming conventions from their ISPs. For attackers, this can be a pretty solid hint, since this kind of network name lets them know which provider owns a given access point, what hardware is being used, and how it’s likely configured by default.
Another troubling nuance is the large number of Wi-Fi networks (over 30%) that use the access point’s MAC address (BSSID) as the visible network name. The first few bytes of a BSSID contain an Organizationally Unique Identifier (OUI), which gives away the router’s manufacturer. This is a useful lead for bad actors: they can find out who made the hardware and test for vulnerabilities specific to that brand’s models.
Is Mexican Wi-Fi well-protected?
An access point secured with WPA2/WPA3 can be considered more or less safe. All other authentication mechanisms yield much weaker results. We grouped the public Wi-Fi networks into four categories:
Secure (WPA2/WPA3)
Unsecured (open/WEP)
Weak (WPA)
Undetermined
The results are roughly the same across all three cities: about 82% of all analyzed access points are protected by secure standards. The outdated and insecure WPA protocol was practically nonexistent. However, more than 10% of the access points turned out to be completely unsecured. Connecting to these networks carries the risk of traffic interception and hidden surveillance.
But security isn’t evaluated by WPA protocols alone. We also checked for the presence of WPS, the infamous feature for quickly connecting to a network without entering a password, which is highly vulnerable to attacks. It turned out that WPS is enabled on nearly half (47%) of the access points in Mexico City, 43% in Guadalajara, and 41% in Monterrey. On average, 45% of the access points are potentially vulnerable to WPS-related attacks — sacrificing security for the sake of convenience.
What’s more, this feature frequently remained active even on seemingly secure WPA2/WPA3 networks — about half of them utilized WPS. This shows that having WPA2/WPA3 is still not enough to consider a Wi-Fi access point safe, as additional features like WPS can still leave the door open to attacks.
What else every tourist needs to know
Digital risks on a trip aren’t limited to public Wi-Fi alone, especially now that many are shifting away from public Wi-Fi to an eSIM. There are still plenty of threats in crowded places: public USB chargers, QR codes with swapped links, NFC and Bluetooth attacks, and, of course, social engineering tactics. Let’s break it all down.
Charging stations. Public USB chargers can also be dangerous: bad actors could potentially gain access to the data on your device or try to install malware. We covered these attacks in detail in our post, Data theft during smartphone charging.
Dangerous QR codes. Criminals can plant phishing QR codes in popular tourist spots. The pretexts can vary wildly; for instance, ads for team-specific fan “events”, or links supposedly offering discounts or restaurant menus. In reality, any QR code posted on the street can be considered insecure by default, and you shouldn’t scan them with your smartphone unless you have a QR code threat analyzer installed.
Fake broadcasts, tickets, and betting pools. Earlier, we described cases where bad actors were distributing malware via fake IPTV apps to capitalize on the WC26 hype. Remember, even if you plan to watch the tournament from home, you still need to stay alert and not trust the first sites that pop up advertising free broadcasts, offering betting pools, or promising unbelievably generous payouts.
Despite the prevalence of secure WPA2/WPA3 public Wi-Fi access points in Mexico City, Guadalajara, and Monterrey, our study shows that public Wi-Fi networks remain vulnerable. It’s also important to remember that attackers can create fake networks — so-called evil twins — disguised as legitimate public Wi-Fi in airports, hotels, cafés, and tourist spots.
For the average user, it’s practically impossible to tell how safe a specific access point is when trying to connect. That’s why the safest option is to use cellular data to access the internet — completely eliminating the need for Wi-Fi. Besides, there’s no need to research the nuances of local laws, rates, and other cellular details for every country you plan to visit; you can just buy a global eSIM online in two clicks. We explained how to make the entire process hassle-free in our post, Internet on the go with Kaspersky eSIM Store.
If you still plan on connecting to public Wi-Fi, always use a VPN to secure your device and data when connecting to unfamiliar — especially unsecured — Wi-Fi networks. This creates an encrypted tunnel between your device and the VPN server, making it impossible to intercept your data along the way. Haven’t picked a VPN yet? Try Kaspersky VPN Secure Connection, which is included with both Kaspersky Premium and Kaspersky Plus subscriptions.
Now, if you still plan to attend the World Cup without any cybersecurity solution, at least follow these basic rules of digital hygiene:
Don’t use public USB chargers
Don’t send sensitive information over connections that aren’t secure
Don’t log in to banking, email, or social media accounts over unsecured Wi-Fi
Turn off Bluetooth and NFC while walking around in crowded places
Don’t trust QR codes posted on the street
Connect to public Wi-Fi only when absolutely necessary
What else to read to make sure cheering for your favorite team isn’t only exciting, but also safe:
It starts with the familiar: a short message, a trusted name, a routine tone. Delivery updates, work pings, brand alerts hum in the background, rarely attracting scrutiny. You check, you answer… — until minutes later you’ve slipped into a trap built to lower your guard and hijack your trust.
That’s why messaging scams cut deep: they exploit everyday habits where instinct, not caution, leads. Communication once moved slowly, leaving room for doubt. Now it’s instant — and that speed is a weapon in criminal hands.
On our blog, we’ve already examined numerous scam schemes in messaging apps — from pig butchering, where the victim is groomed for a very long time, or catfishing, where the scammer creates a fake identity, to phishing via chatbots or through gift-giving campaigns in messaging apps.
Now, for the first time, Kaspersky has set out to capture the full end-to-end reality of messaging-based scams to understand how quickly harm occurs, how they impact trust and what remains after the interaction ends. What emerges is a highly organized and industrialized scam ecosystem embedded within everyday messaging channels such as SMS, WhatsApp, and email.
Kaspersky experts have prepared a report on targeted scams in messaging apps, detailing not only the financial but also the emotional damage caused by such attacks, as well as providing tips on how to protect yourself and avoid them. In this post, we explore the most interesting facts, but you can find more details in the full report.
The damage is underestimated
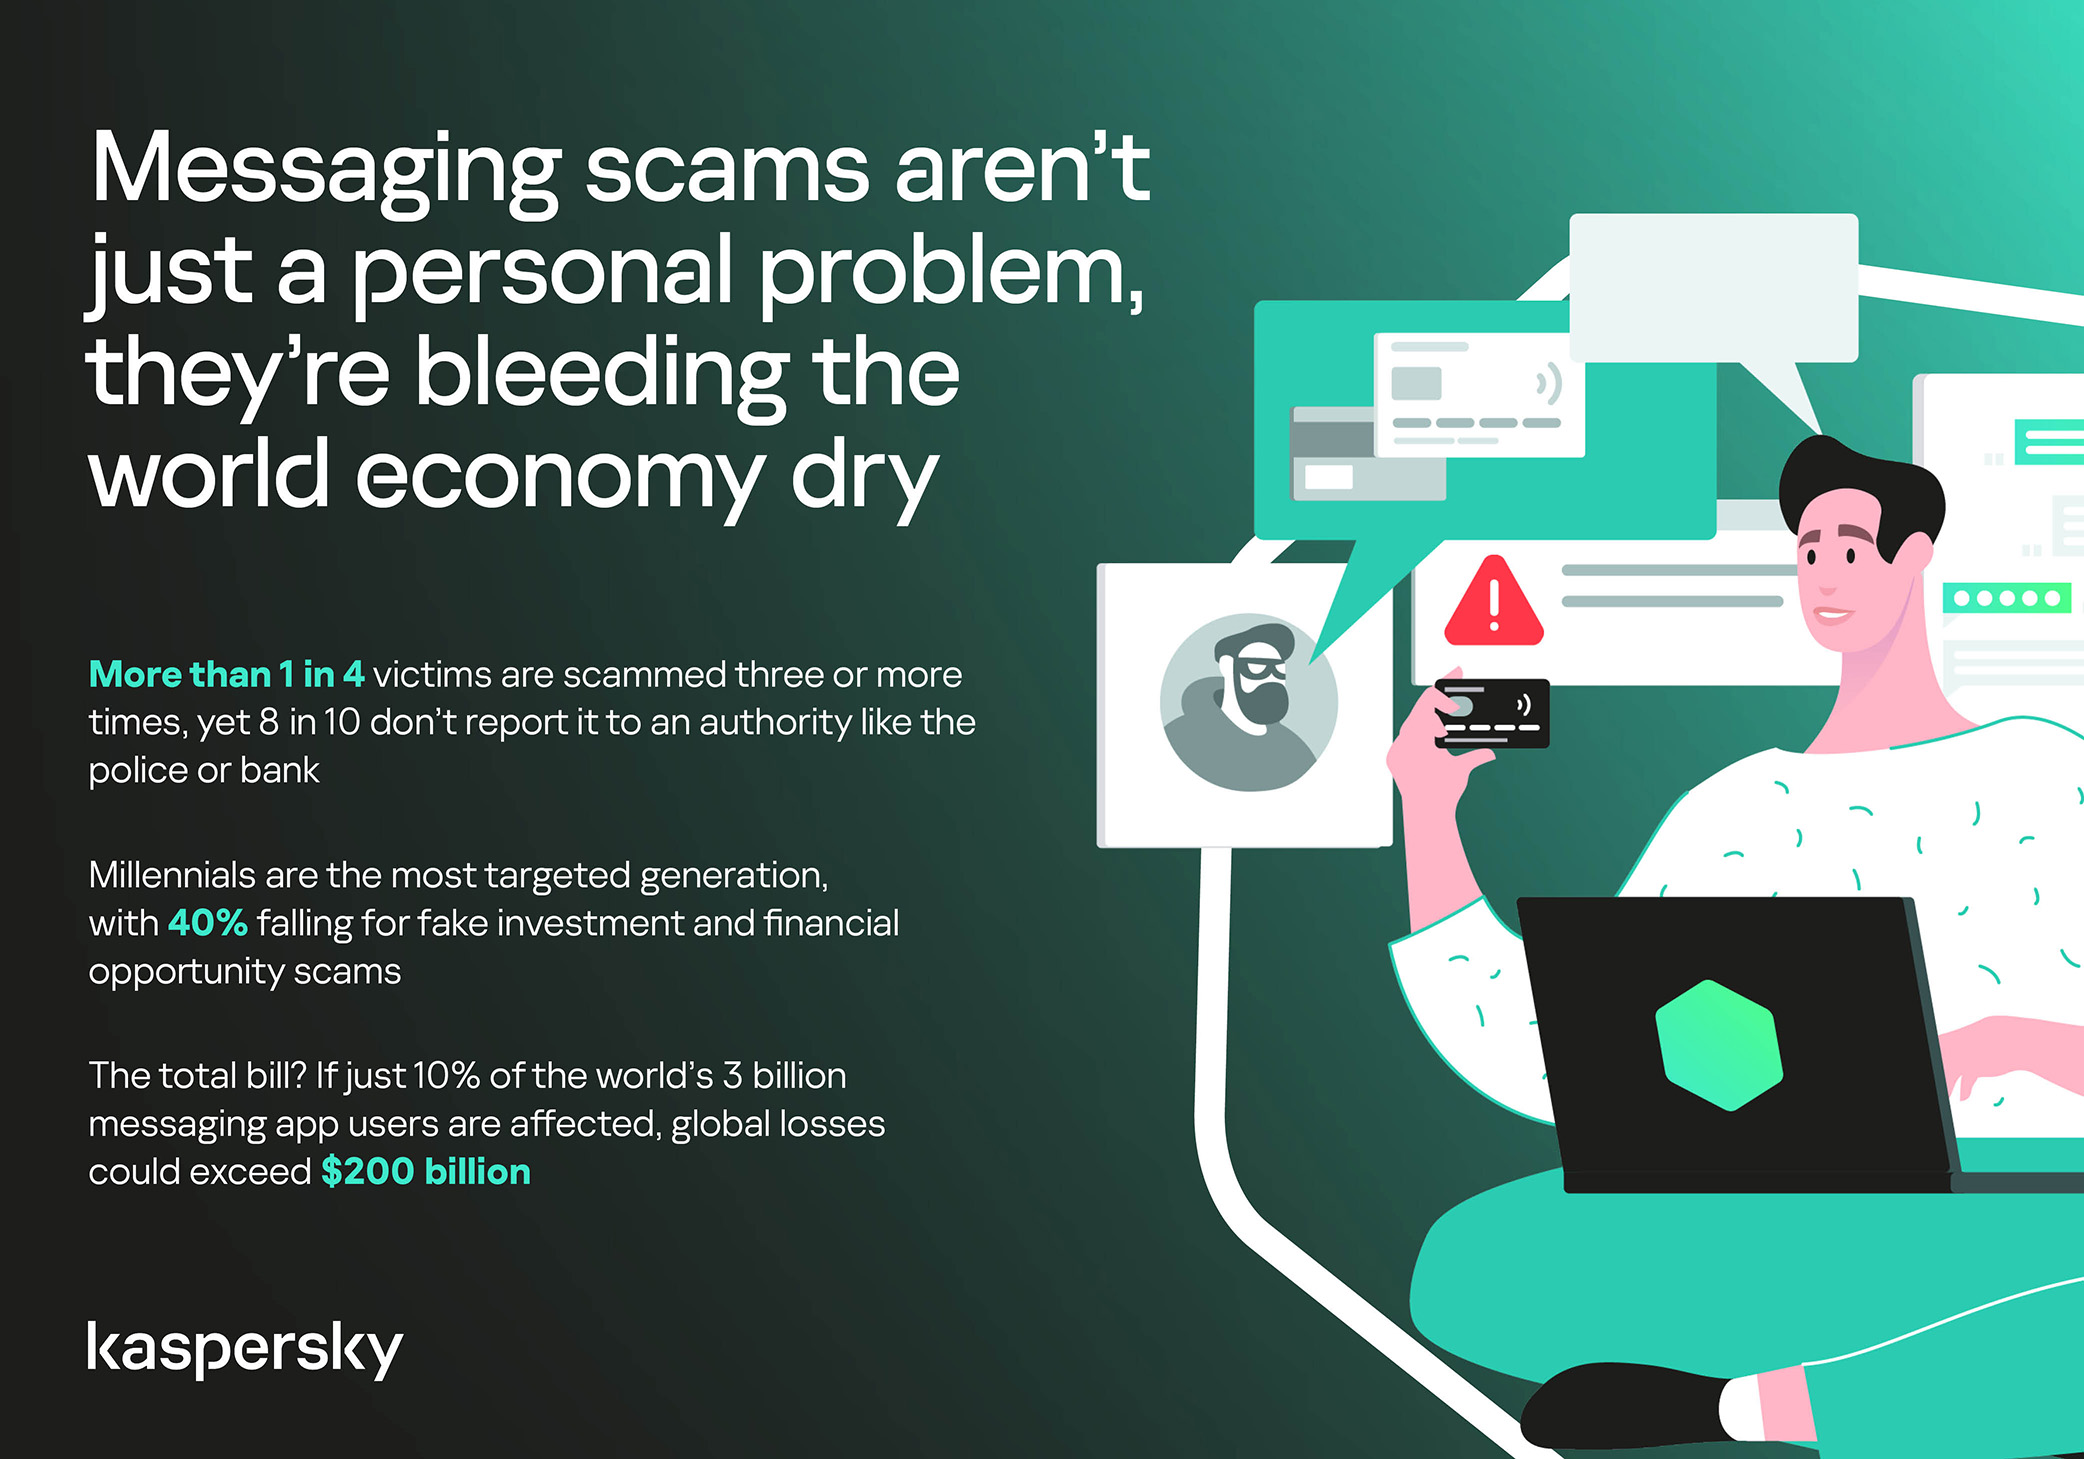
How much do you think a single successful attack via a messaging app costs the average victim? Ten dollars? Or maybe 50? You’re underestimating the scammers. Although more than a third (36%) of victims incur losses of less than $135, on average a victim loses… $733!
Country
Average loss per victim
Senegal
$392.94
Serbia
$493.32
Morocco
$504.28
Greece
$609.32
United Kingdom
$617.38
Côte d’Ivoire
$654.11
Spain
$672.67
United States
$724.73
Portugal
$868.20
Italy
$896.02
France
$1,193.58
Germany
$1,369.35
The average amount lost by a victim in a successful attack via a messaging app
On the one hand, the financial hit doesn’t look catastrophic in isolation. These are micro-losses by design. Small enough that some never report them to the police. Small enough that banks don’t always investigate. Small enough to be dismissed as bad luck rather than organized crime.
But $733 is not nothing. It’s enough to cover a month’s worth of groceries, school or daycare fees, or utility bills. Against the backdrop of the global cost-of-living crisis, a single such loss can seriously dent a family’s budget.
In 11% of cases, losses exceed $1,350, and more than a quarter of victims (28%) report having been scammed three or more times in the past six months. Once scammers discover that a phone number responds, that contact becomes an asset, circulating from one database to another.
Now imagine the scale of the problem: if just 10% of the three billion messaging‑app users worldwide fell victim with the average loss, the total damage would amount to… nearly $220 billion! This is comparable to the GDP of Greece, and exceeds that of Morocco, Serbia, or Côte d’Ivoire.
It becomes clear that behind the daily flood of fraudulent schemes lie large scam cartels operating on an industrial scale, using AI to personalize messages that mimic those of family members, friends, and familiar brands. This, in essence, forms the basis of a full-fledged economy built on digital identity theft.
Speed beats scrutiny
More than half of successful messaging scams (52%) unfold in under 30 minutes — from first contact to the moment money or personal data changes hands — or even faster, before the victim begins to doubt the legitimacy of the sender. In fact, one in seven scams takes less than five minutes — quicker than boiling an egg!
The speed isn’t accidental. It’s the method. Scammers structure their schemes to deny the victim a chance to come to their senses. Every element is engineered to compress the decision-making window: the urgency of the scenario, the familiarity of the format, the plausibility of the request.
They rush you — faster, faster, don’t tell anyone, you only have a few minutes, solve the problem, don’t ask questions. Click the link, fill in the details, approve the transaction, or else… Or else what? The scammers’ imagination knows no bounds here, but if you don’t do something right now, you’ll definitely regret it.
Alas, the realization of what has happened usually comes when the damage is already irreversible. More than half of victims (51%) lose money; another 43% hand over their personal data — most commonly phone numbers, names, and email addresses — to scammers, and often the victim loses both.
Where and how attacks occur
A delivery notification, a bank alert, a message from a merchant you ordered from last week — messaging apps permeate every aspect of everyday life, making such interactions completely normal. An attack shouldn’t feel like an attack. It should feel like the same message you’ve received hundreds of times.
It’s no surprise that scammers focus their attention on this method of communication first and foremost. The most popular platforms for scams are predictable: WhatsApp (43%), SMS/iMessage (40%), Facebook (27%), Telegram (22%), and Instagram (19%) — these are the ones that people trust most.
A wide variety of schemes is used. Brand impersonation is now one of the three most common types of messaging scam worldwide — accounting for 31% of cases. Fake delivery notifications top the list at 38%, followed by investment scams at 37%.
At the same time, nearly two-thirds (63%) of fraudulent schemes span multiple platforms, moving from SMS to WhatsApp, from WhatsApp to Telegram, etc. In this way, scammers achieve two goals: they mimic organic messaging and evade moderation algorithms.
AI has taken scams to a new level
Just a couple of years ago, fraudulent messages gave themselves away with bad grammar, awkward phrasing, illogical requests, and an obsessive sense of urgency. Today, a phishing message looks, sounds, and reads just like the real thing.
Scam cartels want to catch people in motion — between meetings, on a commute, or during everyday tasks — when your attention is already fragmented. They mimic your mother’s turn of phrase. They match your bank’s tone of voice. They copy your courier’s format exactly. They mirror the rhythm, structure, and style of authentic brand communications across messaging platforms. And AI is accelerating all of it.
What this creates is overlap. Legitimate and fraudulent messages appear in the same environment, using the same formats, language, and triggers. The difference between them is no longer obvious.
The data shows that two-thirds of victims (66%) believe AI was used in the scam against them, 42% cite messages written by AI, 31% report generated or cloned voices, and 25% encountered deepfake images or videos.
That’s why mere awareness and “tech-savviness” may no longer be enough to protect oneself. From Gen Z to Gen X, messaging scams cut across every generation.
And what about the emotional toll?
But money is far from the only problem a victim is left with after an attack. After what they’ve been through, people develop distrust toward incoming messages, unfamiliar numbers, and any requests for action. As a result, 99% of fraud victims say they no longer trust incoming notifications in messaging apps.
This creates a crisis of trust in all digital channels in general. Every legitimate message can now be perceived as a scam. Brands, banks, and delivery services are forced to operate in an environment where the customer is, by default, in a state of distrust.
Dr. Elizabeth Carter, a forensic linguist and criminologist at Kingston University in London, notes that scammers use familiar contexts, common social settings and embedded linguistic norms to create the illusion for the victim that their decision-making is rational and reasonable in the moment. However, what is actually happening is that they construct false realities in which those decisions end up causing financial and psychological harm. She also notes that it is very hard to identify a false reality while you are in it.
After realizing they had been deceived, more than half of victims felt anger — the kind that comes from having trusted something and discovering it was used against you. 42% of victims report frustration, 38% — feeling upset. Moreover, several months later, these feelings haven’t gone away: nearly half of all victims (48%) are still angry, a third (33%) remain frustrated, and 30% are upset.
And nearly one in 10 victims don’t tell anyone what happened. They feel shame, a sense of having fallen for something so obvious. This leaves a significant portion of the actual damage unreported: only 24% of victims contact the police, and only 23% report it to their bank.
So what can be done?
The crisis of trust — and even a touch of paranoia — that has arisen due to widespread attacks on users can linger in victims’ minds for a long time, affecting their quality of life. To prevent this, follow these guidelines:
Pause before you act. The sense of urgency you feel is almost always artificial. A legitimate bank, retailer, or delivery service won’t penalize you for taking 30 seconds to verify before clicking a link or confirming details. It’s precisely this instinct to resolve the situation quickly that scammers are counting on.
Verify through another channel. If a message appears to be from a relative, colleague, or company you trust — contact them through another channel before taking any action. Use secure verification methods, and cross-check identities when something doesn’t feel right. For families, agreeing on a “safe word” in advance can defeat even the most convincing voice clones.
Use a password manager. It will not only help you generate strong, unique passwords for all your accounts and store them securely, syncing them across all your devices, but also protect you from spoofed sites. Even if you click a phishing link and land on such a site, our password manager will notify you about the domain mismatch and refuse to autofill your username and password.
Use protection that works in real time. Modern security solutions, such as Kaspersky Premium, provide real-time protection against malicious links and phishing attempts in the apps and websites you use every day. On Android devices, a dedicated layer of anti-phishing security scans and neutralizes suspicious links as they appear, even within notifications, before you even have a chance to click them.
We’ve covered other threats in messaging apps in similar articles:
Threat actors are already gearing up for this year’s biggest football (soccer) event, the World Cup 2026. With millions of fans looking for ways to stream matches online, many will turn to IPTV apps to watch live TV broadcasts over the internet. It’s no surprise, then, that cybersecurity researchers have discovered multiple campaigns over the past few months where malware was disguised as fake Android IPTV apps.
In this post, we discuss what IPTV apps are, how criminals use fake versions to spread malware, what this malware is capable of, and, most importantly, how to avoid becoming a victim.
What are IPTV apps?
IPTV stands for Internet Protocol Television. This technology delivers TV content over the internet instead of through cable, over-the-air antennas, or satellites. Naturally, the simplest and most common examples of IPTV are the official platforms of TV networks, which can include both websites and dedicated apps.
However, alongside official options, pirate IPTV services also exist. They usually lure users with free or dirt-cheap access to content that can otherwise be hard to find without expensive subscriptions — most notably broadcasts of various sporting events; football matches in particular.
As is typically the case with pirated content, these apps are blocked from official app stores, forcing users to download them from third-party sites. Consequently, the risk of using these services isn’t tied to IPTV technology itself, but rather to the fake apps and modified APK files distributed under the guise of well-known platforms — both official and pirated.
Massiv banking Trojan disguised as IPTV apps
For instance, in February researchers found the Massiv banking Trojan distributed under the guise of fake IPTV apps. Even then, experts noted that this wasn’t the only malware leveraging this tactic — several others were also spotted in the wild. The primary targets of these IPTV-mimicking malicious fakes have mostly been users in Portugal, Spain, France, and Türkiye.
In most cases, the discovered fake IPTV apps lacked the advertised functionality, so users didn’t get access to any content after installing the apps. Instead, the fake app would open the website of a legitimate IPTV service in a built-in browser to mimic normal functioning and avoid raising user suspicion.
Of course, the most interesting activity happened out of the user’s sight. These are some of the features the malware did have:
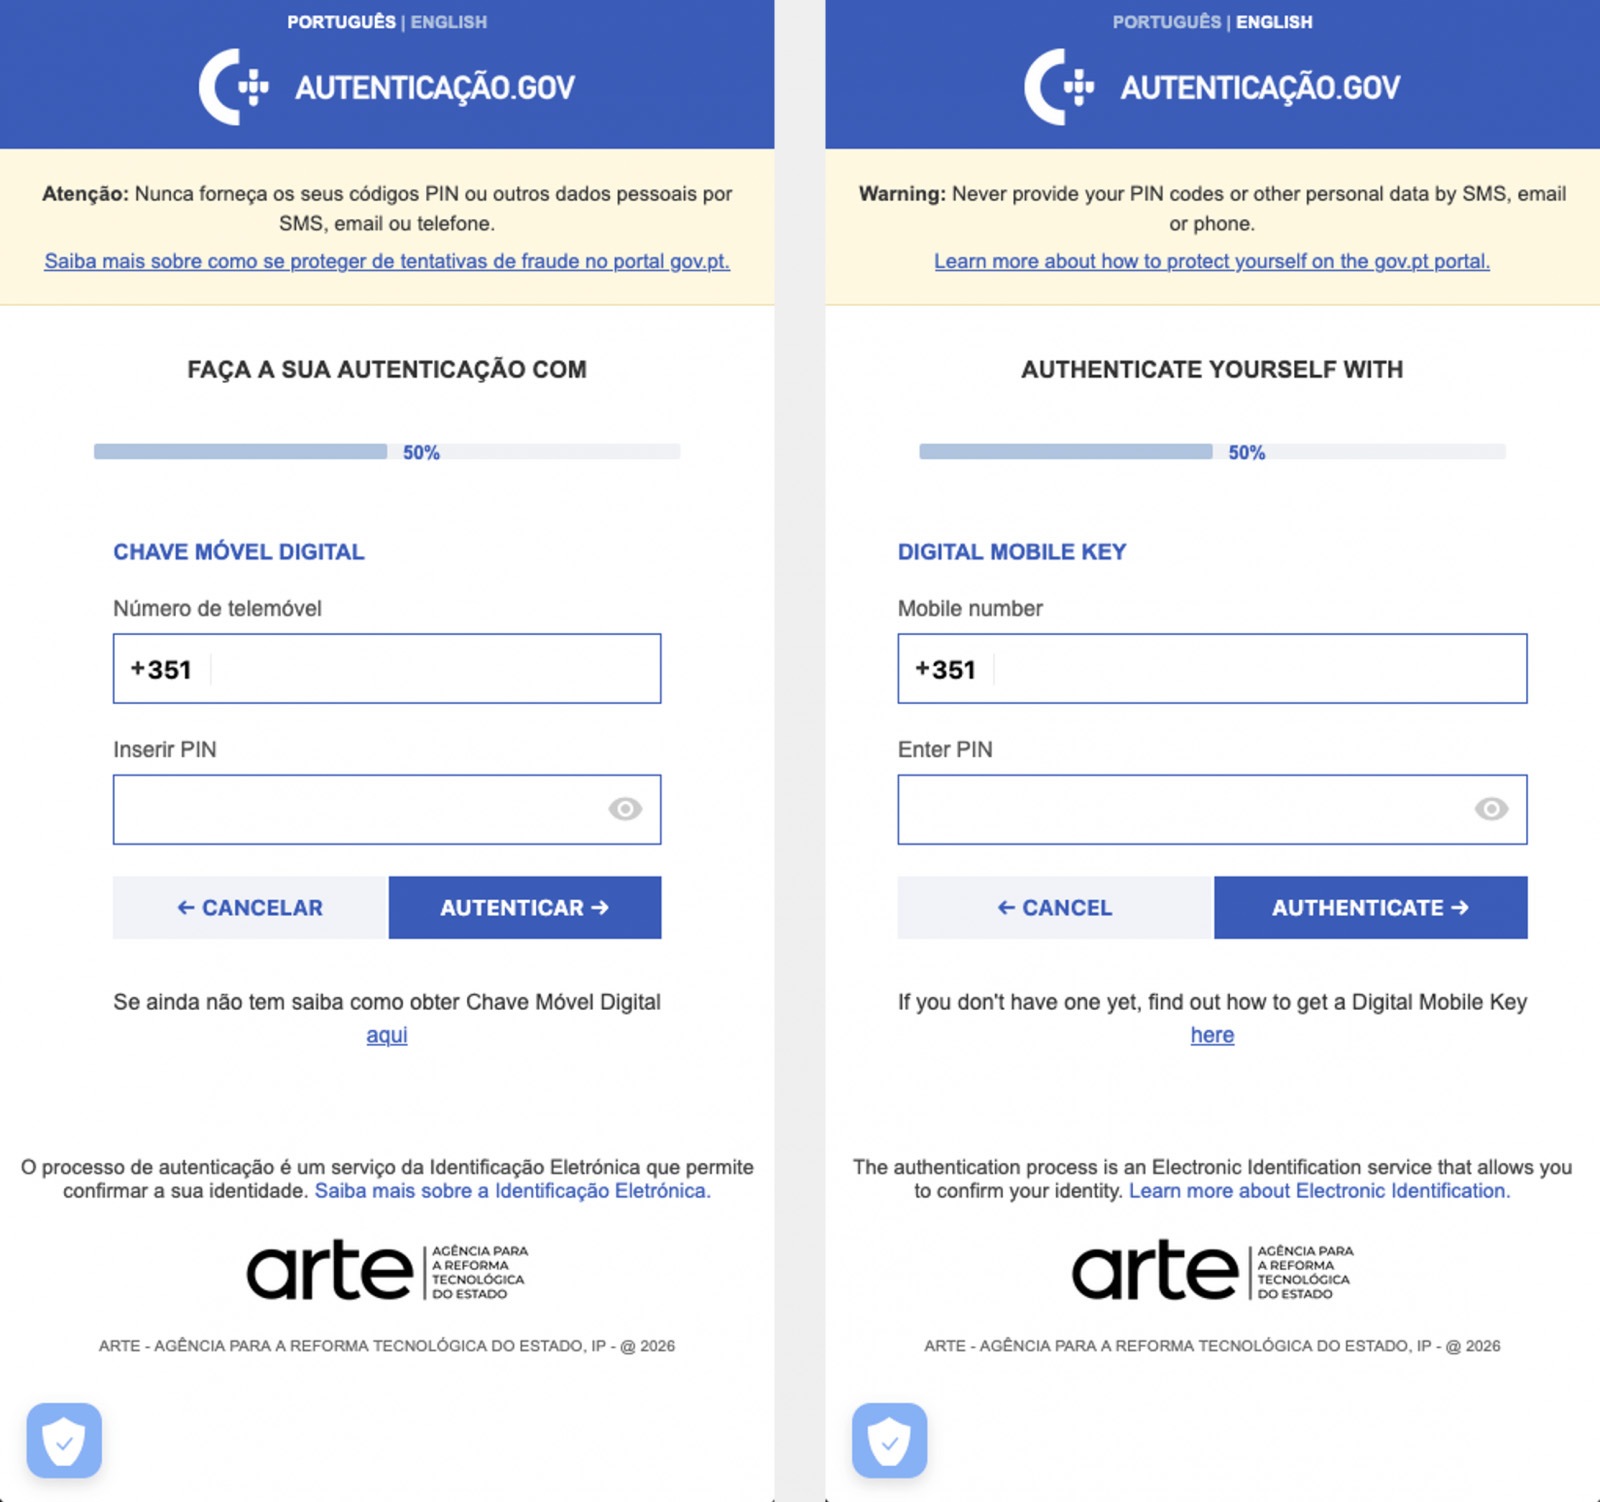
Displaying fake windows on top of legitimate ones: fake forms for entering bank details or signing in to official services, as shown in the screenshot below.
Activating a keylogger: recording and transmitting screen keyboard taps to the attackers.
Hijacking control of the compromised device.
The Massiv banking Trojan mimics the interface of the Portuguese government app Chave Móvel Digital in a fake pop-up window, looking even more convincing than the official version from Google Play. Source
Perseus steals valuable information from users’ notes
In March, researchers reported on a new campaign where several fake IPTV apps were used to distribute an even more advanced and feature-rich malware strain: Perseus.
Research into Perseus shows that the malware is based on the source code of an Android banking Trojan called Cerberus, which leaked nearly six years ago. Perseus comes in two different versions: Turkish and English. The English-language version is more advanced and shows clear signs of AI-driven refinement.
Perseus abuses Accessibility Services, a set of Android features originally designed to make life easier for users with severe visual impairments. Fraudsters learned long ago how to leverage this tool to steal data from Android devices — a topic we’ve covered in detail across several of our posts.
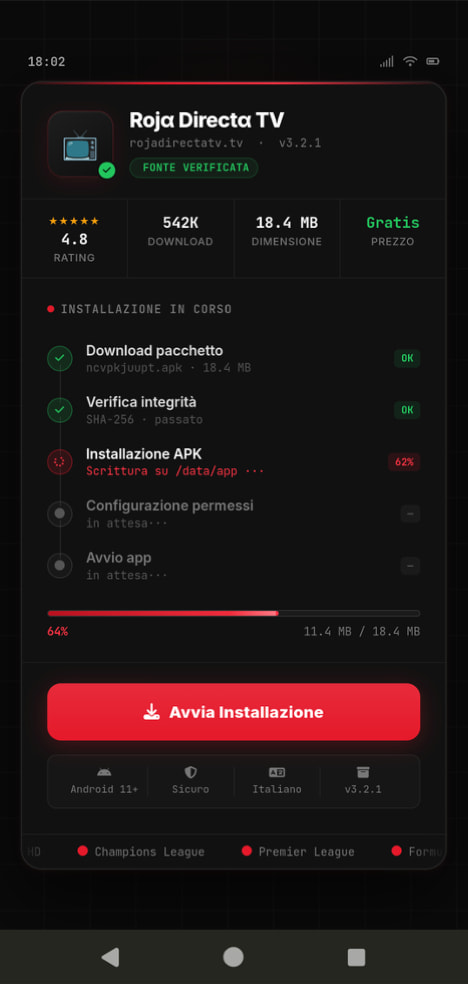
An example of a malicious APK disguised as Roja Directa TV, another IPTV app. Source
By abusing Accessibility Services, Perseus gains remote control over the victim’s device. Here’s what it can do:
Continuously capture and exfiltrate screenshots.
Send a structured map of the device’s UI for remote manipulation.
Mimic taps, swipes, text input, long presses, and other UI interactions.
Turn on the screen, launch apps, and block them from running.
Trigger a pitch-black screen overlay to hide its activities.
Log keystrokes.
On top of that, the English-language version of Perseus boasts another notable feature. The malware can hunt for sensitive information like passwords, recovery phrases, and financial data across an entire range of note-taking apps: Google Keep, Xiaomi Notes, Samsung Notes, ColorNote, Evernote, Microsoft OneNote, and Simple Notes.
All of these capabilities help criminals drain football fans’ money not just from various banking services, but from cryptocurrency apps as well.
How not to let cybercrooks ruin your World Cup
The World Cup is just around the corner, and millions of fans worldwide will definitely want to tune in to this year’s premier football event. Past experience shows that cybercriminals frequently cash in on major spectacles like this. So, how can you watch the matches safely?
Don’t download apps from unofficial stores.
Even when downloading an app from an official store — since malware occasionally slips through the cracks there, too— read the reviews carefully. Users who have been burned by fakes and malware often leave comments to warn others.
Avoid storing passwords or other sensitive information in note-taking apps. To ensure your data and finances stay secure, use a reliable password manager. By the way, Kaspersky Password Manager includes an encrypted note-taking feature, allowing you to store your valuable information safely.
You can’t even watch TV safely anymore these days! Check out other threats facing TV lovers:
Phishing campaigns have become significantly more sophisticated and convincing in recent years. Sender addresses are now nearly identical to the real deal, emails are flawlessly written, and users are called by their names. But what do you do when a suspicious email comes from a clearly legitimate email address?
Lately, phishers have been exploiting the Google AppSheet platform to set up email blasts that originate from an official Google-linked address. Following a successful attack, they walk away with their victims’ accounts and sensitive data.
In this post, we break down how this new data theft scheme works, and how to protect yourself from these sneaky phishing attacks.
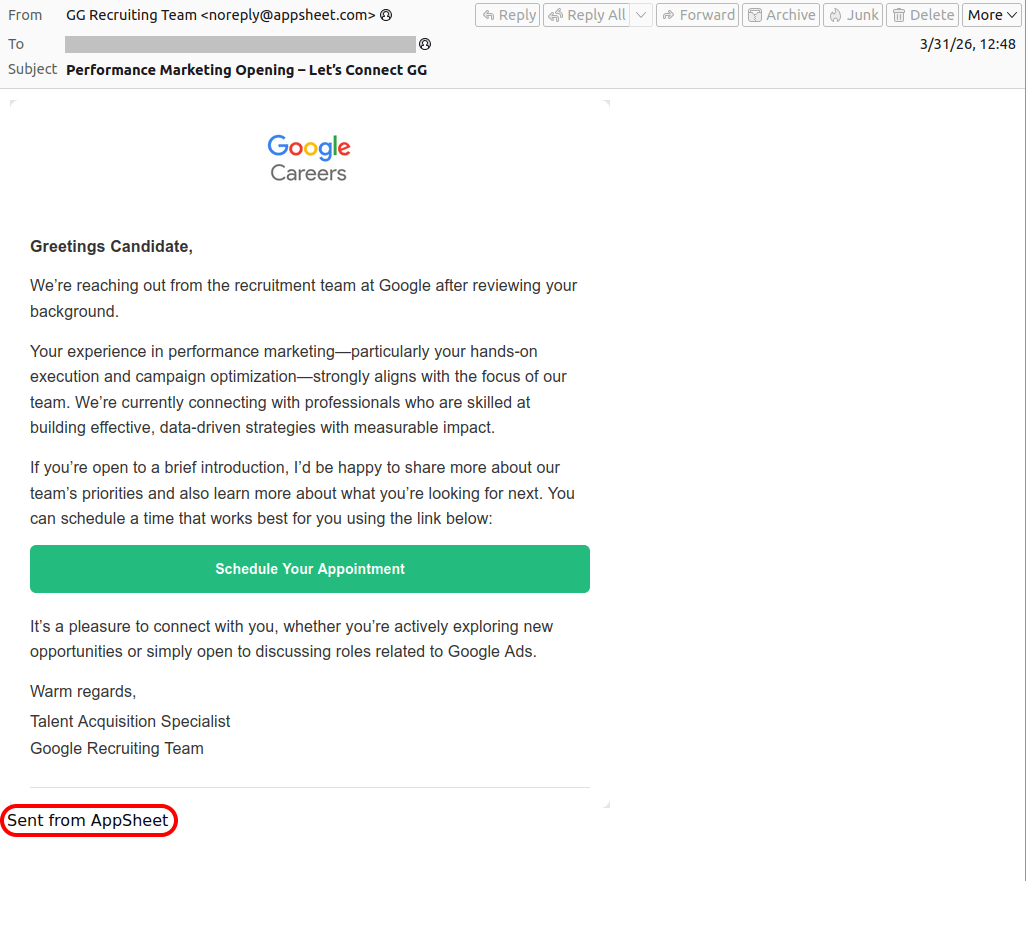
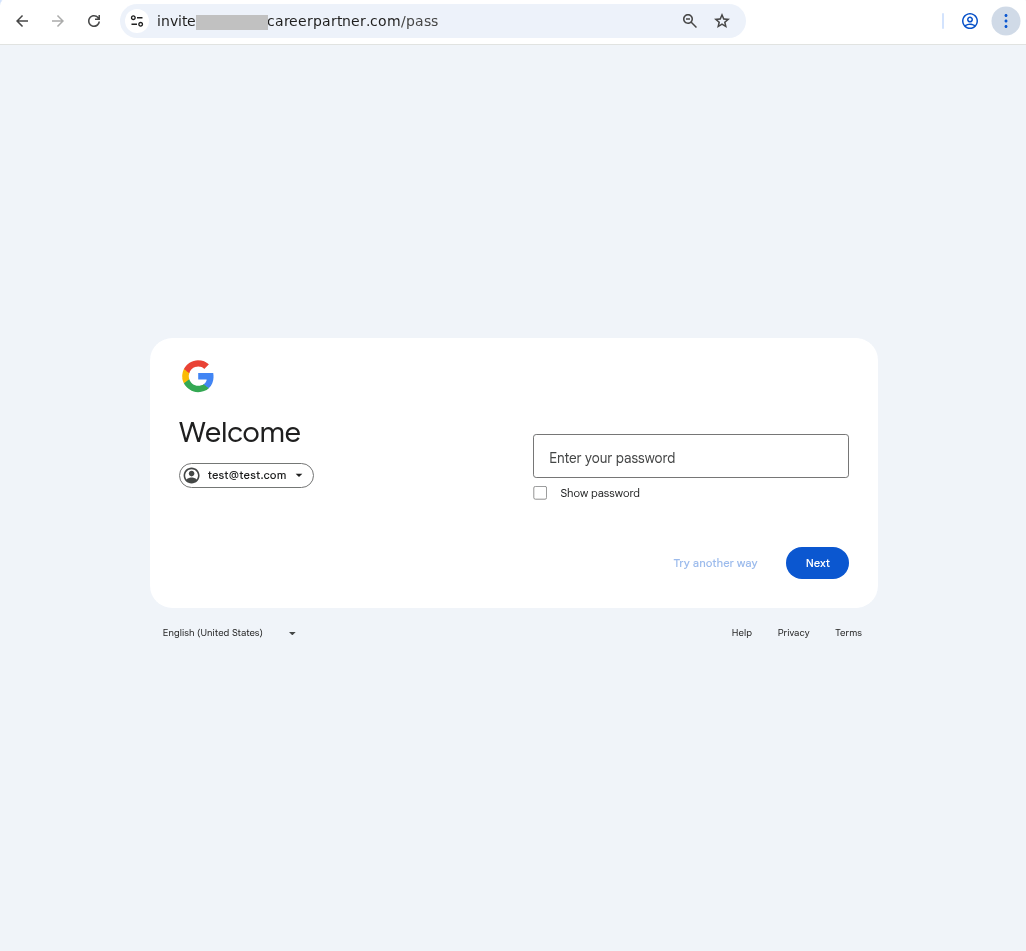
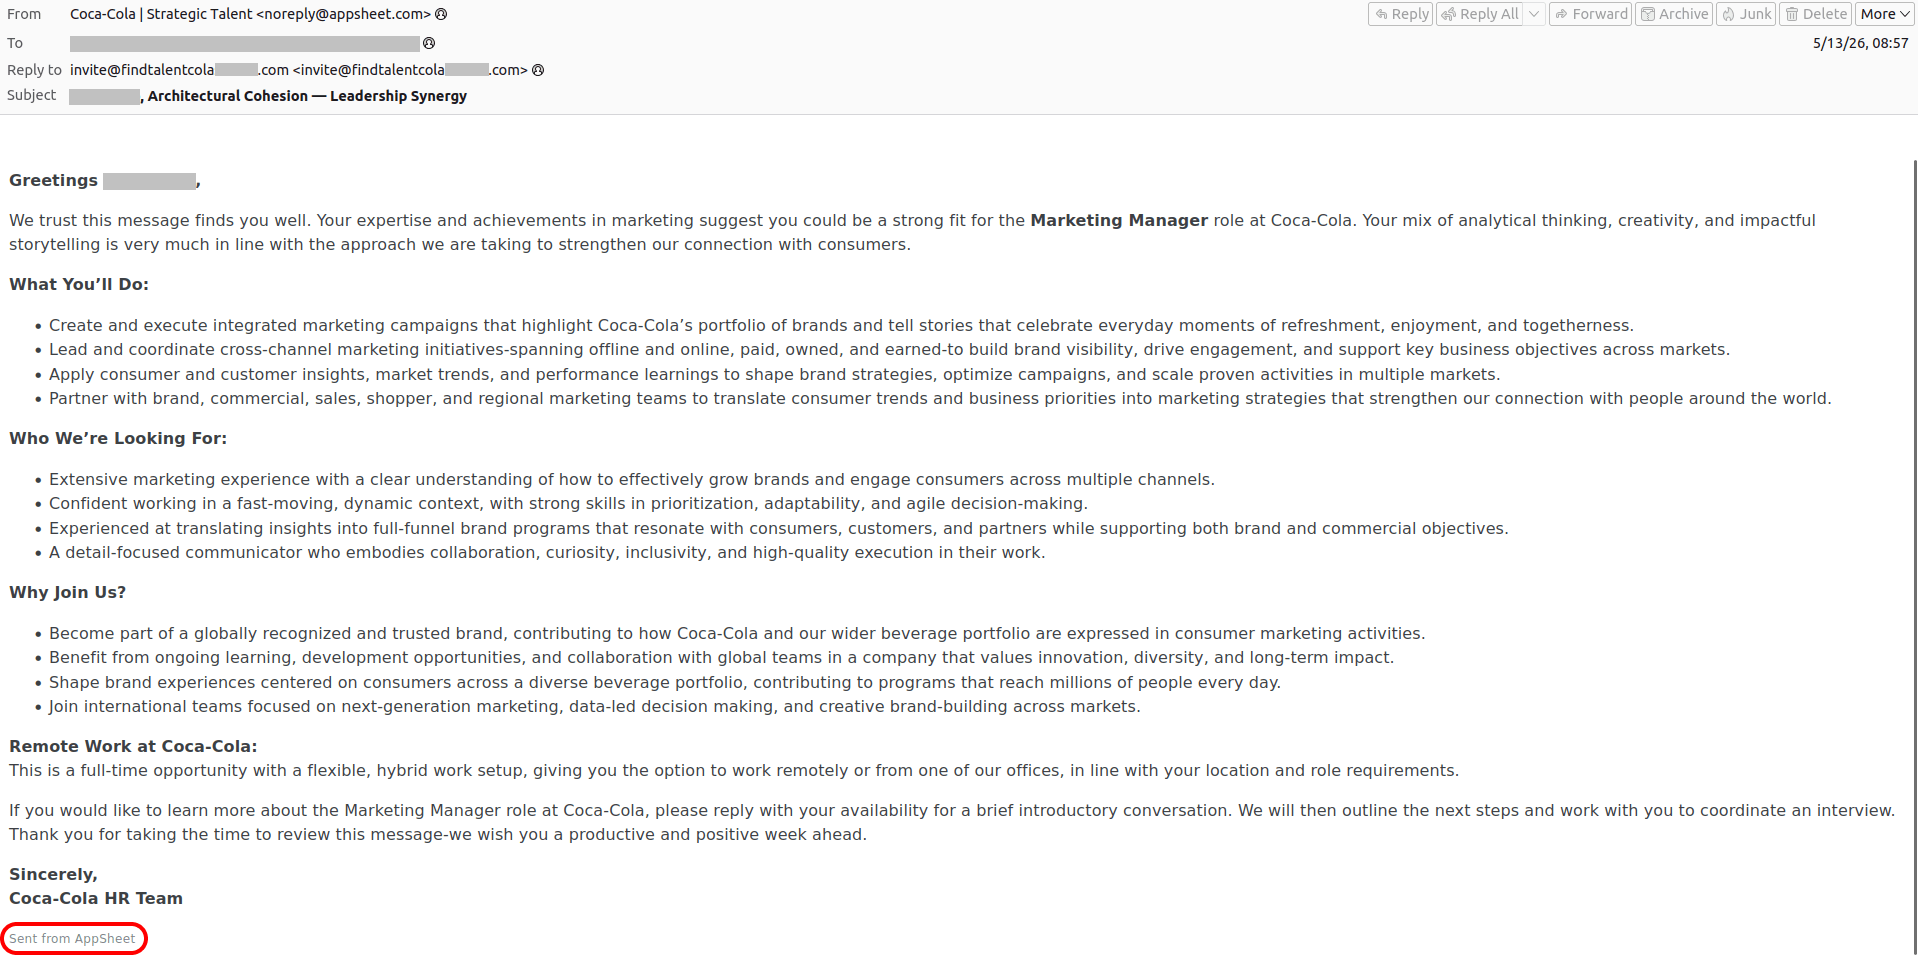
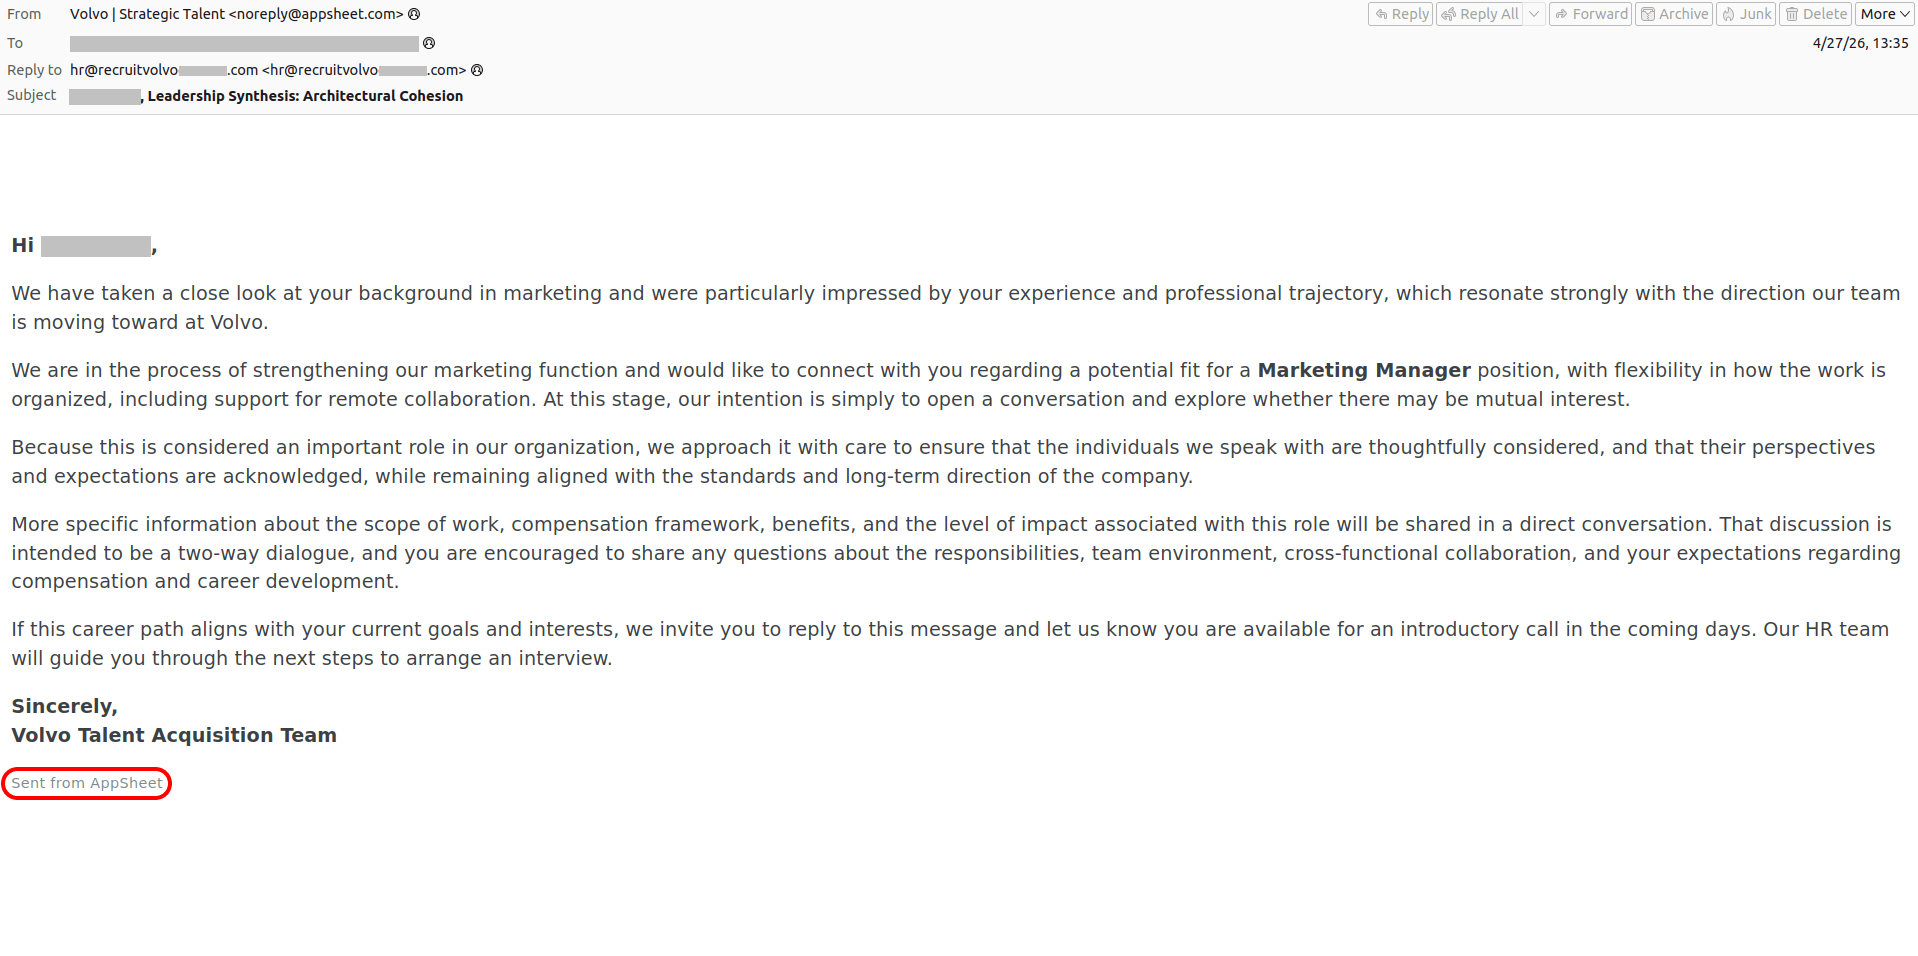
Google is offering you a job. Or Coca-Cola. Or maybe Volvo. Or are they?
AppSheet is a Google service for building apps without any coding skills. It’s frequently used by small businesses to automate routine workflows. Unfortunately, it’s precisely this simplicity that makes AppSheet so attractive to cybercriminals. All it takes to pull off a phishing scam these days are a few dollars and an app quickly thrown together using pre-made commands and blocks.
The playbook for AppSheet phishing attacks is pretty run-of-the-mill. The victim receives an email on behalf of a major company — and these messages often begin by addressing the recipient by name. It appears the attackers are parsing leaked data to match names with specific email addresses.
Next, the attackers play on the recipient’s emotions — employing either stick or carrot. They might panic the victim with urgent warnings that demand immediate action — think “Your account will be disabled soon” or “Suspicious activity detected”. Alternatively, they lure them in with irresistible bait, like the promise of a verified badge or an interview invitation from a tech giant. These fake HR emails are engineered to give victims an immediate rush. They make it look like the recipient’s application was already fast-tracked and highly rated, teasing a job offer that could drop as early as tomorrow.
For most people, these messages don’t raise a single red flag. The email bypasses the spam folder completely, and the From field displays the exact name of the company they expect to see. Unfortunately, none of it means the email is authentic: attackers can put whatever they want in the display name. And let’s be honest: very few people actually stop to scrutinize the sender’s email address.
In AppSheet-based phishing campaigns, the sender is always the same: noreply{@}appsheet.com. But here’s the real kicker: that address is 100% legitimate. Because it’s tied directly to Google’s own infrastructure, there’s a good chance that standard anti-spam filters greenlight these emails without blinking.
Naturally, to secure that coveted interview or fix their account, the victim clicks the link — and then voluntarily hands over their entire digital identity on a copycat website: full name, address, phone number, etc. From there, the attackers can sell the harvested data on the dark web, or weaponize it for secondary, targeted attacks. To top it all off, the victim is redirected to a phishing login page, which allows the attackers to steal their accounts.
Here’s a step-by-step breakdown of how a victim goes from receiving a fake Google Careers portal email to having their account completely compromised:
Greetings, Candidate! Why don't you click the link to our fake Google site to schedule an interview?
The link in the email leads to a spoofed site with a design indistinguishable from the original. The user is prompted to fill out a form: provide their full name, work email, phone number, and preferred date for interview…
…Once the victim completes the form, they see a prompt asking them to log in with their Google credentials. All of this data goes straight to the attackers.
Similar phishing campaigns are launched on behalf of other major tech brands — and the users who hand over their Apple account data risk losing not just their account but also control of all their Apple devices. The attackers might pressure the victim into signing out of their personal Apple ID, and in to a “corporate account” for verification — which is in reality an Apple account they own. The moment the victim does so, the criminals take complete remote control of the used device, often using Lost Mode to lock the victim out and hold their phone to ransom.
To make matters worse, attackers don’t always drop a malicious link in the initial email. Instead, they play the long game — hooking the target into a conversation by asking them to reply and confirm their interest. This pretexting creates an illusion of chatting with a real recruiter. And this playbook isn’t reserved exclusively for Silicon Valley, either. Attackers frequently impersonate globally recognized household names, like Volvo or Coca-Cola. Of course, it’s highly unlikely that attackers want someone’s Coca-Cola account — if the user even has one to begin with. Most likely, the goal is to steal sensitive data or convince the user to log in to a phishing form using their Google/Apple/Facebook, etc. credentials.
An "HR team member" from Coca-Cola reaches out to praise the victim, laying it on thick about their expertise and achievements, analytical thinking, and creativity… The attackers intentionally keep the endgame under wraps — whether that means routing the victim to a phishing site, orchestrating a full account takeover, or pulling off a straight-up financial scam
A similar email pretending to be from the Volvo talent acquisition team
Do you want to become Meta-verified?
Of course, “dream jobs” aren’t the only bait used. We’ve seen campaigns where “Facebook Support” reaches out to tell a user they’ve been deemed eligible for the prestigious Meta Verified badge — a blue checkmark normally reserved for top-tier celebrities and global brands. To secure the coveted blue checkmark, the victim is directed to a phishing page where they’re asked to complete an identity form — before handing over the ultimate prize: their Facebook username and password. And it’s all in the name of security, naturally!
These spoofed sites are created in a wide variety of languages, and tailored to users in different countries. Below is the Dutch version.
To get the blue checkmark, the user is required to provide "additional information". Miss the deadline by just a few days and the offer expires
After the victim fills out the standard fields — name, phone number, personal and work emails, and birthdate — a prompt appears asking for their Facebook password
In other campaigns, attackers abuse Google’s AppSheet to weaponize sheer panic, trying to unsettle the user with claims that they’ve violated Meta’s intellectual property policy — and threatening to permanently close their Facebook account. To appeal, the victim must click a link to… a phishing site, provide their personal information, and, of course, enter their Facebook username and password.
For the sake of plausibility, the user is not only asked to fill out fields with personal information, but also to describe in detail why the decision to close the account was a mistake
Finally, the user is prompted to confirm their appeal request by signing in to “Facebook”. In reality, the victim is simply handing their credentials over to the attackers
How to spot phishing and protect your accounts
Sadly, phishing attacks are becoming increasingly sophisticated, with attackers routinely hijacking the reputation of legitimate services and domains. Here’s how to keep from falling into their traps, and safeguard your data:
Remember: not all phishing emails end up in the spam folder. Standard spam filters in email clients often fail to detect advanced attacks — and the AppSheet case is a prime example. To avoid accidentally taking the bait, use Kaspersky Premium on all your devices. It intercepts phishing emails and instantly blocks links to spoof websites — even if the attacker is hiding behind a completely legitimate domain. Additionally, the Android version can detect malicious and phishing links in messages from any app.
Check the email for odd typos. To keep their messages from setting off alarms, attackers frequently resort to sneakily inserting extra spaces or swapping out characters. Take this example from one of the emails we found: Fac eb o ok S u ppo r t instead of Facebook Support.
Before taking any action on a website, carefully check its domain name against the official address. Bad actors frequently create addresses that only appear to be the real thing until you look close enough. Install Kaspersky Premium to always be sure you don’t land on a spoofed site.
Look at the sender’s address first, not just the display name. If an email claims to be from Google Careers, Apple HR, or Facebook Support, but the sender address points to AppSheet or another unrelated service, don’t even bother reading this message. That domain mismatch is a dead giveaway that you’re looking at a trap. Cross-reference email addresses with the ones listed on the companies’ official websites.
Check for email signatures. For instance, all emails sent via AppSheet include a disclosure note at the very bottom. You are much more likely to receive a legitimate AppSheet notification from a small company or business, but definitely not from a tech giant. Major corporations typically use their own domains for their emails.
Usea password manager. Even if you land on a spoofed site and try to enter your password, a reliable password manager will notify you about the domain mismatch and refuse to autofill your username and password.
Don’t forget about two-factor authentication. If it’s enabled, just having your username and password won’t help the attackers access your account — they’ll also need a one-time code. However, they might still try to trick you into giving that up too, so be doubly careful whenever you enter two-factor authentication codes anywhere.
Use passkeys instead of passwords whenever possible. This technology provides excellent protection against phishing: even if you visit a malicious site and try to sign in, the passkey won’t work on the spoofed domain. You can store and sync passkeys across different devices in Kaspersky Password Manager. Read our post on the subject to learn more about how passkeys work.
Phishing attacks are growing increasingly sophisticated. Here’s what else you should know about phishing:

 Login
Login