
Normal view

Received — 3 August 2026 AWS Security Blog

Accelerating AWS Network Firewall troubleshooting with AWS DevOps Agent

24 July 2026 at 21:54

When an administrator introduces a rule change in AWS Network Firewall and network connectivity is disrupted, pinpointing the cause requires inspecting multiple points in the traffic path. The firewall gives you stateless and stateful rule engines, domain rules, and routing to the firewall endpoint inside your Amazon Virtual Private Cloud (Amazon VPC). A network drop looks the same from the workload no matter where it started. Isolating the cause means correlating the alert and flow logs with the firewall configuration, route tables, and recent API calls in AWS CloudTrail that might have changed them. That manual correlation is exactly where AWS DevOps Agent helps, accelerating root cause analysis so you can restore connectivity in minutes instead of hours.

AWS DevOps Agent does that correlation for you. As your always-available operations teammate, it resolves and proactively prevents operational issues across AWS, multicloud, and on-premises environments. When an Amazon CloudWatch alarm triggers, it reaches the agent through a webhook. The agent then reads the firewall configuration and logs through AWS APIs, ties the drop to recent API activity, and returns a root cause with a mitigation plan you review before you apply it.

This post connects CloudWatch monitoring to DevOps Agent. It walks through three Network Firewall failures from end to end. The first is a domain deny list blocking a legitimate endpoint. The second is a stateless rule priority misconfiguration. The third is an asymmetric cross Availability Zone (AZ) routing drop. Each maps to a different layer, so each leads down a different investigation path. An AWS Cloud Development Kit (AWS CDK) app deploys the whole environment in your own account so you can reproduce each failure and follow along.

The sample workload

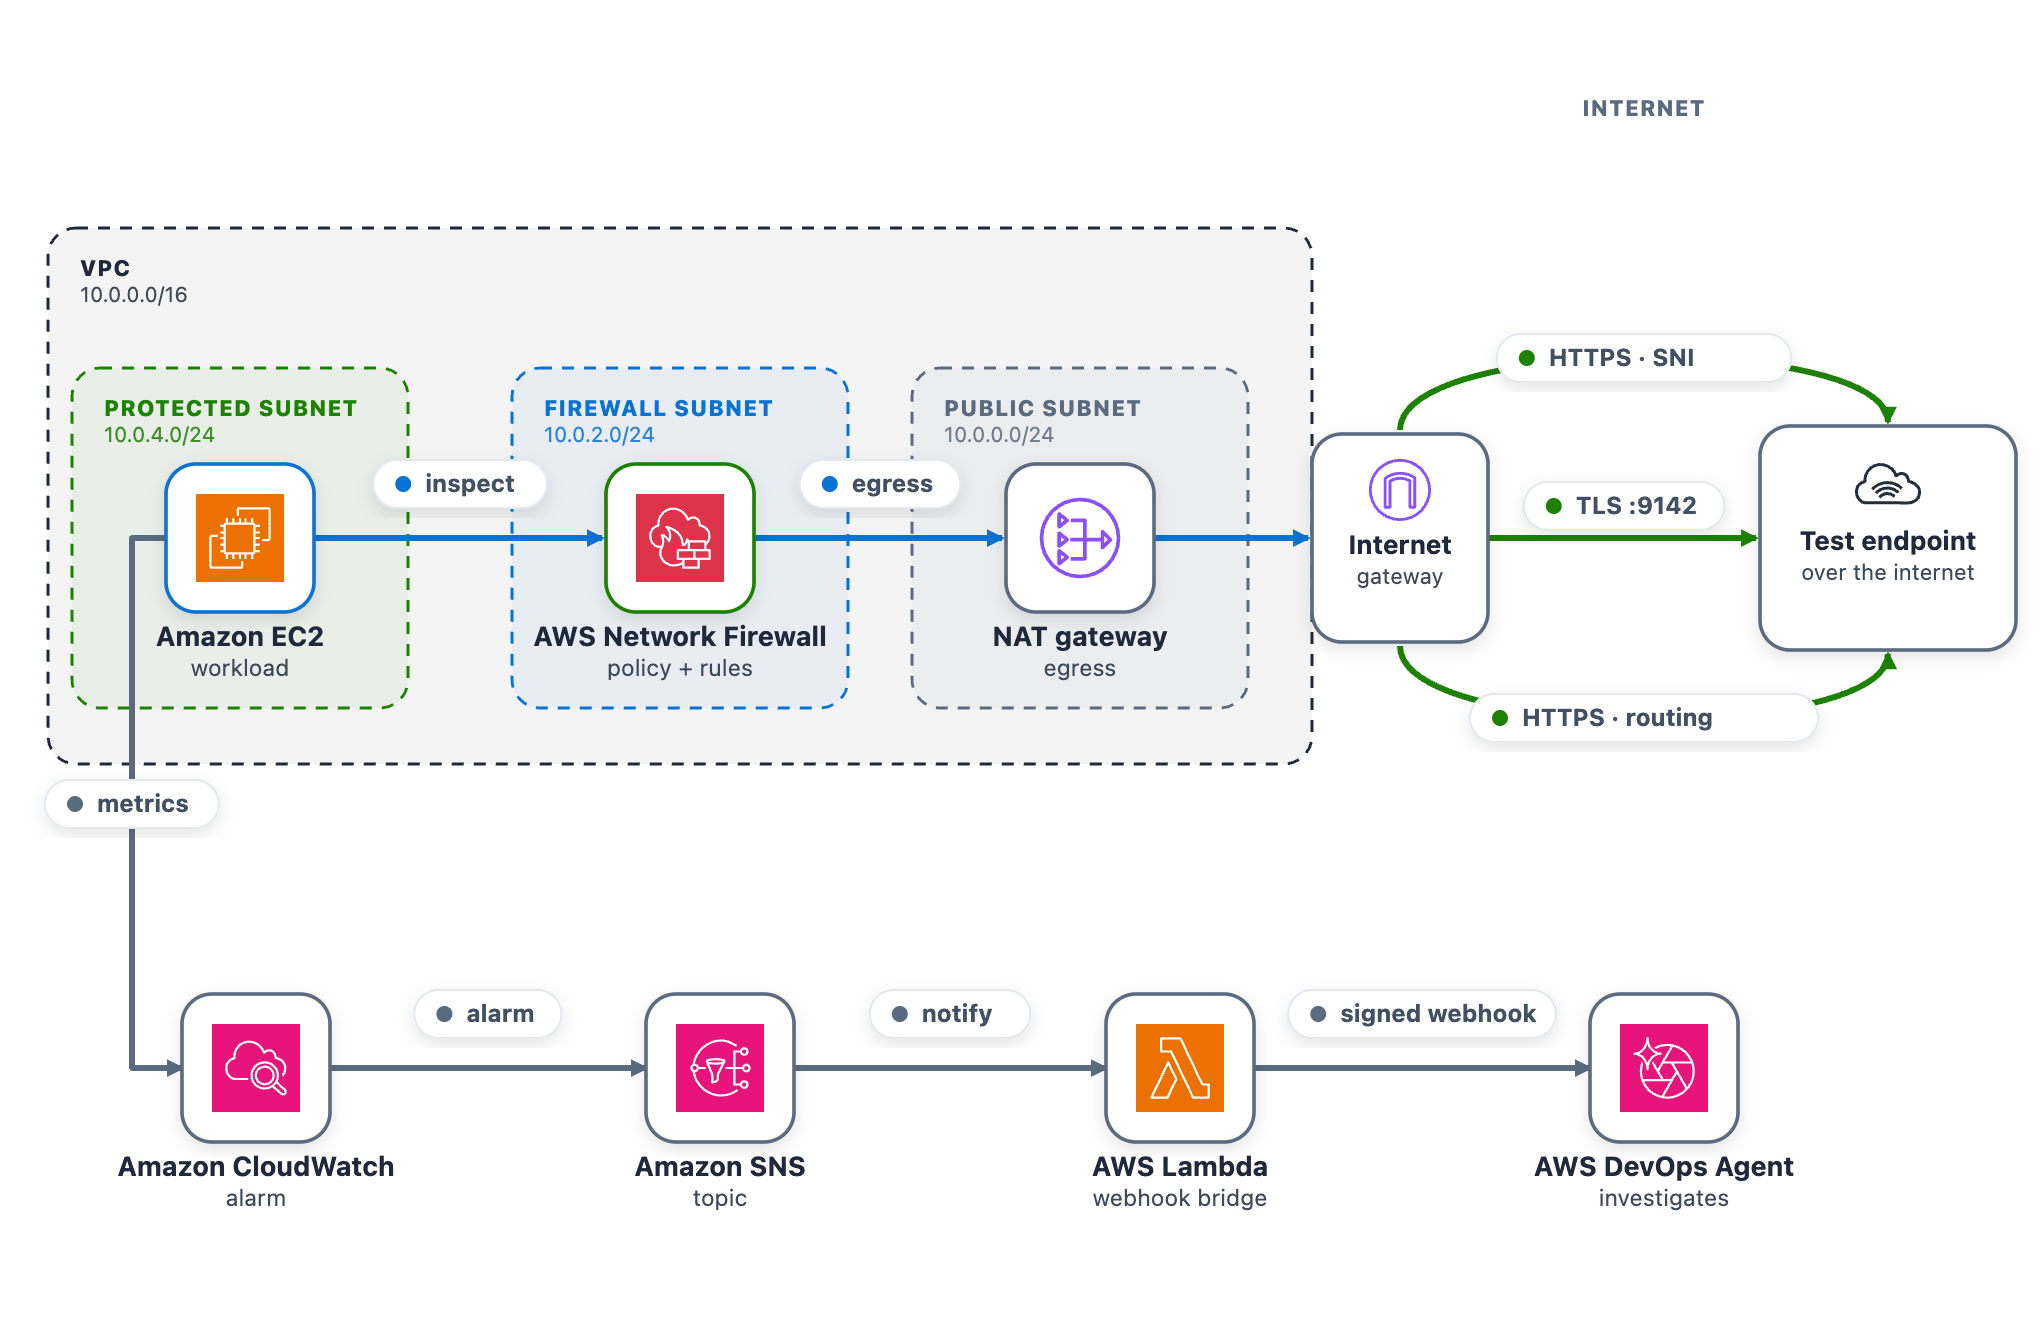
As part of this blog post, we provide a CDK stack that deploys both the AWS DevOps Agent Space and a sample workload used to walk through three separate troubleshooting scenarios. A single t3.micro instance in a protected subnet checks its connectivity to a test endpoint on a continuous loop and publishes results to CloudWatch. Traffic takes the internet egress path through Network Firewall, the NAT gateway, and the internet gateway, so the firewall can intercept or drop it. After completing the walkthrough, you can apply the same troubleshooting techniques with DevOps Agent against your own Network Firewall deployments.

The test endpoint runs in a separate VPC deployed by the same CDK app. It serves HTTPS on port 443 and TCP on port 9142, giving each scenario a different protocol layer to exercise: Scenario 1 targets a TLS connection on 443 (matched by Server Name Indication), Scenario 2 targets a TCP connection on 9142, and Scenario 3 exercises the whole egress path.

A live status page shows one card per scenario plus the network topology. The whole stack deploys from a single CDK app across two Availability Zones, each with a firewall endpoint and NAT gateway, which is what makes Scenario 3 possible.

As shown in the following figure, the egress data path runs from the workload through Network Firewall and the NAT and internet gateways to the test endpoint. The alarm pipeline runs from CloudWatch through Amazon Simple Notification Service (Amazon SNS) and the webhook AWS Lambda function to DevOps Agent.

Figure 1: The sample workload

Figure 1: The sample workload

To use this with your own workload, you need a CloudWatch alarm that detects the connectivity problem and the webhook pipeline (SNS topic and Lambda function) that delivers it to DevOps Agent. The agent reads your firewall configuration, logs, and CloudTrail through AWS APIs, so no additional instrumentation is needed on the firewall side.

Prerequisites

To follow along with this post, you need:

Deploy the sample workload

Clone the project and deploy it into us-east-1 with one command (set awsRegion to use another AWS Region).

git clone https://github.com/aws-samples/sample-accelerating-aws-network-firewall-troubleshooting-with-aws-devops-agent.git
cd sample-accelerating-aws-network-firewall-troubleshooting-with-aws-devops-agent
bash scripts/deploy.sh

The script checks prerequisites, installs dependencies, compiles and tests, and bootstraps the CDK if needed. It then deploys all the stacks from a clean baseline and prints the outputs, including the status-page URL and sign-in details.

  1. Open the status-page link (an https://<random-id>.cloudfront.net address).
  2. Sign in using the username and password provided from the CDK output and confirm all three cards show the green Healthy status.
  3. Keep the page open while you run the scenarios.

Connect AWS DevOps Agent

To connect AWS DevOps Agent to the alarm pipeline

  1. In the AWS DevOps Agent console, open the nf-devops-agent-space Agent Space created by the CDK deployment.
  2. Configure the DevOps Agent webhook and download the CSV file with the webhook URL and signing secret.
  3. On the status page, choose Configure webhook, paste the URL and signing secret, and save. The page writes them to the nf-devops-agent-webhook-credentials AWS Secrets Manager secret, so there is no AWS CLI or console step. Until you set it, the bridge Lambda function sees a placeholder and skips delivery.
  4. Verify the path before you run a scenario. In the Lambda console, open nf-devops-agent-webhook and use the Test tab with this event.
    {
      "Records": [
        {
          "Sns": {
            "Message": "{\"AlarmName\":\"TEST-webhook-verification\",\"AlarmDescription\":\"[TEST] Webhook integration test - not a real alarm.\",\"NewStateValue\":\"ALARM\",\"NewStateReason\":\"[TEST] Manual webhook connectivity test. Safe to ignore.\",\"Region\":\"us-east-1\"}"
          }
        }
      ]
    }
  5. A 200 response confirms the path, and a test investigation appears in the DevOps Agent Operator Web App view.

How the alarm pipeline works

Every scenario reaches DevOps Agent the same way. A CloudWatch alarm moves to ALARM and notifies the SNS topic. Amazon SNS invokes a Lambda function. The function reads the webhook URL and signing secret from Secrets Manager, signs an alarm payload, and POSTs it to the DevOps Agent webhook (as shown in Figure 1). Amazon SNS also provides delivery retries, fan-out to other subscribers, and cross-account publishing.

  • Prebuilt Network Firewall metric (Scenario 1) Alarm-1 watches the DroppedPackets metric, summed across the stateful streams, and triggers when drops rise above a baseline threshold. This requires no workload or custom metric and works on an already-deployed firewall. However, it only tells you that the firewall is dropping packets, not which rule is responsible.
  • Application health metric (Scenarios 2 and 3) Alarm-2 and Alarm-3 watch a custom metric from a connectivity check. Use this for an alarm tied to user-facing impact or to tell one traffic path from another, which requires running a component that emits the metric.
Alarm Source Triggers when
Alarm-1 Native AWS/NetworkFirewall DroppedPackets The firewall’s dropped-packet count rises above the baseline
Alarm-2 Custom application health metric The port 9142 (TCP) connectivity check to the test endpoint is being dropped
Alarm-3 Custom application health metric The cross Availability Zone connectivity check is being dropped

Run the scenarios

Work through each of the scenarios one at a time, following the same cycle. Interrupt network connectivity, watch the alarm trigger, let DevOps Agent investigate, apply the recommended fix, and confirm recovery before moving on.

The status-page cards follow the live CloudWatch alarm state. A card shows a green dot and the word Healthy when its alarm is clear, and a red dot and the word DROPPED when its alarm triggers. In the DROPPED state the card also adds a Condition: line describing what’s being dropped, which isn’t shown when the card is healthy. Network Firewall applies changes to new flows, so a change shows within a minute or two. Recovery comes from the mitigation DevOps Agent recommends, which you review and apply.

Scenario 1. Domain deny list blocking a legitimate endpoint

At baseline, the rg-domain Suricata domain rule group denies only an unused placeholder, so the test endpoint stays reachable. The rule group inspects the TLS Server Name Indication (SNI) on each outbound connection and drops any that matches a denied domain. The exact rule syntax and console steps follow.

To add the domain deny rule

  1. Go to the Amazon VPC console.
  2. In the navigation pane, under Network Firewall, choose Network Firewall rule groups.
  3. Choose the rg-domain rule group to open its details page.
  4. In the Rules section, choose Edit.
  5. The rules box already contains two baseline placeholder rules (they match blocked.placeholder.invalid, so nothing real is denied). Leave those in place. Find the <app-endpoint-dns> value for Scenario 1 in the deployment script output (a Nework Load Balancer (NLB) DNS name such as NfTest-AppNl-a1b2C3dEf4G5-1234abcd5678efgh.elb.us-east-1.amazonaws.com). On a new line below the existing rules, add a drop rule that matches that DNS name on the TLS SNI, then choose Save.
    drop tls $HOME_NET any -> $EXTERNAL_NET any (ssl_state:client_hello; tls.sni; content:"<app-endpoint-dns>"; startswith; nocase; endswith; msg:"S1 domain denylist"; flow:to_server, established; sid:2000002; rev:1;)
  6. After saving, the rules box holds all three lines. The two placeholders remain, plus the new drop rule for the endpoint DNS name (note the distinct sid 2000002).
Figure 2: Scenario 1 – Firewall rule change blocking the connection

Figure 2: Scenario 1 – Firewall rule change blocking the connection

What happens. The workload’s HTTPS check to the test endpoint times out, the “AWS/NetworkFirewall DroppedPackets metric climbs above baseline, and Alarm-1 moves to ALARM. The Scenario 1 card reads DROPPED (with the condition Firewall dropping the monitored domain on its allow/deny rules), while the Scenario 2 and Scenario 3 cards stay Healthy (Figure 3). On the topology, the alarm pipeline from CloudWatch through Amazon SNS and Lambda to DevOps Agent and the workload-to-firewall inspect lines both turn amber, which the legend defines as collateral / alarm active, because the packets are now dropped at the firewall. To demonstrate the resulting failure, the HTTPS · SNI line from the internet gateway to the test endpoint is shown in red, which the legend defines as dropped (root cause).

Figure 3: Scenario 1 active – Traffic blocked at the firewall

Figure 3: Scenario 1 active – Traffic blocked at the firewall

Let DevOps Agent investigate. The agent runs several lines of investigation in parallel and correlates them:

  1. Reads the DroppedPackets metric and correlates the spike with a simultaneous drop in passed packets, confirming the firewall is actively blocking traffic.
  2. Reads the ALERT log and finds the workload’s TLS connections to the test endpoint blocked by the S1 domain denylist rule.
  3. Compares the current state against a baseline window, where the same endpoint was reachable with no alerts, which shows the block is new.
  4. Searches CloudTrail and surfaces the UpdateRuleGroup call that added the deny rule, identifying the user, role, and timestamp approximately one minute before the drops began.
  5. Reports the root cause as that manual rule-group change. Recommends removing the deny entry or adding an allow exception and enabling FirewallPolicyChangeProtection to prevent unauthorized changes.
  6. Presents this as a plan you review and apply, not an automatic change.

In the DevOps Agent Operator Web App view, the agent first restates the Alarm-1 trigger and confirms the firewall is dropping packets above the threshold (Figure 4).

Figure 4: Scenario 1 – The symptom

Figure 4: Scenario 1 – The symptom

Next, the agent identifies the root cause: a manual update to the rg-domain rule group that added a domain deny rule (SID 2000002) shortly before the alarm fired, blocking TLS connections to the ELB endpoint (Figure 5).

Figure 5: Scenario 1 – The root cause

Figure 5: Scenario 1 – The root cause

Finally, the agent presents a mitigation plan, recommending you remove the problematic deny rule (SID 2000002) to restore connectivity (Figure 6).

Figure 6: Scenario 1 – The mitigation plan

Figure 6: Scenario 1 – The mitigation plan

Note: In a real-world environment, this type of rule typically exists for a reason. Before removing it, verify whether it was intentional but scoped too broadly. If so, refine the rule to block only unauthorized endpoints rather than removing it entirely.

Confirm recovery. Apply the change the agent recommends. After the deny entry is gone, DroppedPackets falls back to baseline, Alarm-1 clears, and the card returns to green. Move on to Scenario 2.

Scenario 2. Stateless rule priority misconfiguration

At baseline, the rg-stateless-priority stateless rule group keeps the allow rule at priority 100 and the drop rule at 200 for the test class, TCP destination port 9142. The workload opens a TCP connection to the test endpoint on this port. Lower priority numbers evaluate first, so the allow rule wins. This scenario uses port 9142 instead of 443 to demonstrate a stateless rule, which matches on the packet’s 5-tuple (protocol, ports, addresses) rather than application content.

Introduce the change. Invert the two rule priorities so the drop rule evaluates before the allow rule. This is the kind of change a rushed rule edit can introduce.

To invert the stateless rule priorities

  1. Go to the Amazon VPC console.
  2. In the navigation pane, under Network Firewall, choose Network Firewall rule groups.
  3. Choose the rg-stateless-priority rule group to open its details page.
  4. In the Rules section, choose Edit.
  5. Raise the (Action: Pass) rule’s priority number so it sits after the (Action: Drop) rule, then choose Save. For example, change the (Action: Pass) rule from 100 to 300 (any number higher than the drop rule’s 200 works). You only need to move one rule, and using 300 avoids a clash with the drop rule that already sits at 200. Network Firewall evaluates the lowest priority number first, so the (Action: Drop) rule at 200 now wins for this traffic class, ahead of the (Action: Pass) rule at 300.
Figure 7: Scenario 2 – Rule priority change blocking the traffic class

Figure 7: Scenario 2 – Rule priority change blocking the traffic class

What happens. The drop rule now wins, the TCP connection to the test endpoint on port 9142 times out, the StatelessRuleFailures metric climbs above baseline, and Alarm-2 moves to ALARM. The Scenario 2 card reads DROPPED (with the condition Stateless rules dropping the monitored traffic class), while the Scenario 1 and Scenario 3 cards stay Healthy (Figure 8). On the topology, the alarm pipeline from CloudWatch through Amazon SNS and Lambda to DevOps Agent and the workload-to-firewall inspect lines both turn amber, which the legend defines as collateral / alarm active, because the packets are now dropped at the firewall. To demonstrate the resulting failure, the TLS :9142 line from the internet gateway to the test endpoint is shown in red, which the legend defines as dropped (root cause).

Figure 8: Scenario 2 active

Figure 8: Scenario 2 active

Let DevOps Agent investigate. A stateless drop happens before traffic reaches the stateful inspection engine, so it produces no ALERT log entries. The agent turns to configuration and flow logs instead:

  1. Reads the stateless rule group state and finds the drop rule at the lower priority number, ahead of the pass rule, so the drop evaluates first.
  2. Reads the flow logs and sees passed packets drop to zero within a minute of the change.
  3. Searches CloudTrail and surfaces the UpdateRuleGroup call that inverted the priorities, identifying the user, role, and timestamp about a minute before the alarm.
  4. Reports the root cause as that priority inversion. Recommends removing the redundant drop rule and managing the rule group through infrastructure-as-code (IaC) to prevent manual misconfigurations.
  5. Presents this as a plan you review and apply, not an automatic change.

In the DevOps Agent Operator Web App view, the agent first restates the Alarm-2 trigger and confirms that a workload connectivity health check is failing because the firewall’s stateless rules are dropping egress (Figure 9).

Figure 9: Scenario 2 – The symptom

Figure 9: Scenario 2 – The symptom

Next, the agent identifies the root cause, using the rule-group state and CloudTrail to pinpoint the conflicting DROP/PASS rules, where the new DROP rule’s lower priority number makes it match first (Figure 10).

Figure 10: Scenario 2 – The root cause

Figure 10: Scenario 2 – The root cause

Finally, the agent presents a mitigation plan, recommending you remove the conflicting DROP rule at priority 200 to restore traffic flow (Figure 11).

Figure 11: Scenario 2 – The mitigation plan

Figure 11: Scenario 2 – The mitigation plan

Confirm recovery. Apply the change the agent recommends. After the allow rule is ahead of the drop rule again, Alarm-2 clears and the card returns to green. Move on to Scenario 3.

Scenario 3. Asymmetric cross Availability Zone routing drop

At baseline, the protected subnet in each Availability Zone routes its egress through the firewall endpoint in that same Availability Zone , and the matching return route uses that same endpoint. One endpoint sees both directions of the flow, so the stateful engine completes the handshake. The workload runs in the protected subnet in us-east-1a (CIDR 10.0.4.0/24), so at baseline its egress and its return both use the us-east-1a firewall endpoint.

Introduce the change. Make the flow asymmetric by sending egress out one Availability Zone endpoint while the return comes back through the other. This takes two route edits, and both are required. With only the first edit the flow can still complete, so the alarm will not trigger until both are saved. It makes no firewall-policy change, mirroring a real multi-Availability-Zone routing mistake.

To create asymmetric cross Availability Zone routing

  1. Go to the Amazon VPC console and choose Route tables in the navigation pane.
  2. Flip the egress. Select the NfNetworkStack/SampleVpc/protectedSubnet1 route table (the us-east-1a protected subnet, where the workload runs). On the Routes tab, choose Edit routes. Its 0.0.0.0/0 route currently targets the us-east-1a firewall endpoint. For the target, choose Gateway Load Balancer Endpoint and select the us-east-1b firewall endpoint, then choose Save changes.
  3. Move the return. Select the NfNetworkStack/SampleVpc/publicSubnet2 route table (the us-east-1b public subnet, where egress now exits). Choose Edit routes, then Add route. For the destination enter the workload CIDR 10.0.4.0/24. For the target, choose Gateway Load Balancer Endpoint and select the us-east-1a firewall endpoint. Choose Save changes.

After both edits, a flow’s egress leaves through the us-east-1b endpoint while its return is directed to the us-east-1a endpoint. Neither endpoint sees the whole flow.

Figure 12: Scenario 3 routing change breaking the flow’s symmetry

Figure 12: Scenario 3 routing change breaking the flow’s symmetry

What happens. A new connection leaves through one endpoint. Its return arrives at the other endpoint, which never saw the connection open, so the handshake fails. Unlike Scenarios 1 and 2, this affects the whole subnet, so all egress stops and Alarm-2 and Alarm-3 both move to ALARM. The AWS/NetworkFirewall DroppedPackets alarm (Alarm-1) stays quiet because no endpoint is making a drop decision. The flow is lost to asymmetric routing rather than counted as a firewall drop. This is why monitoring application connectivity matters. A routing fault is invisible to the firewall’s own drop counter. On the status page, the Scenario 2 card reads DROPPED (with the condition “Stateless rules dropping the monitored traffic class”) and the Scenario 3 card reads DROPPED (with the condition Return traffic dropped by asymmetric cross-Availability-Zone routing), while the Scenario 1 card stays Healthy (Figure 13). On the topology, the alarm pipeline from CloudWatch through Amazon SNS and Lambda to DevOps Agent and the workload-to-firewall inspect lines both turn amber, which the legend defines as collateral / alarm active, while the egress path from the firewall through the NAT gateway and the TLS :9142 and HTTPS · routing lines to the test endpoint turn red, which the legend defines as dropped (root cause).

Figure 13: Scenario 3 – The status page during a path-wide outage

Figure 13: Scenario 3 – The status page during a path-wide outage

Let DevOps Agent investigate. Both Alarm-2 and Alarm-3 fire in the same datapoint. DevOps Agent recognizes them as linked and merges them into a single investigation:

  1. Reads the flow logs and sees bidirectional TLS connections stop abruptly, with only one-way traffic remaining and no flows reaching the established state.
  2. Reads the firewall metrics and sees received and passed packets shift from one Availability Zone to the other at the moment of the change.
  3. Calls DescribeRouteTables and finds the egress route pointing at one Availability Zone firewall endpoint while the return route points at the other.
  4. Searches CloudTrail and surfaces the ReplaceRoute and CreateRoute calls by the same user, about a minute before both alarms fired.
  5. Reports the root cause as that asymmetric routing change. Recommends restoring symmetric same-Availability-Zone routing so egress and return traverse the same endpoint.
  6. Presents this as a plan you review and apply, not an automatic change.

A mitigation plan is a recommendation you review, not an automatic change, and the right fix depends on the intended design. Restoring symmetric routing can mean sending the workload subnet’s egress back through its own-Availability-Zone firewall endpoint (this sample’s architecture) or, in a design that doesn’t inspect this path, back through a NAT gateway. The agent infers a plausible target from what it can observe, so review the specific route it proposes against your intended topology before you apply it. (Connecting your pipeline or infrastructure-as-code, covered in the next section, lets the agent recommend the target that matches your design.)

In the DevOps Agent Operator Web App view, the agent restates the Alarm-3 (AsymmetricFlowFailures) trigger and confirms the workload’s egress to a monitored endpoint is being blocked by the Network Firewall (Figure 14).

Figure 14: Scenario 3 – The symptom

Figure 14: Scenario 3 – The symptom

Next, the agent identifies the root cause: manual route table changes that created cross-AZ asymmetric routing through the network firewall, breaking its symmetric routing requirement (Figure 15)

Figure 15: Scenario 3 – The root cause

Figure 15: Scenario 3 – The root cause

Finally, the agent presents a mitigation plan, recommending you restore symmetric routing by pointing protectedSubnet1‘s default route back to the same Availability Zone firewall endpoint, so one endpoint sees both directions of the flow again (Figure 16).

Figure 16: Scenario 3 – The mitigation plan

Figure 16: Scenario 3 – The mitigation plan

Confirm recovery. Apply the change the agent recommends, after checking the route target matches your intended design. After the workload subnet’s egress and return use the same Availability Zone firewall endpoint again, the control probe recovers, the alarms clear, and every card returns to green.

Further considerations

In production a single change can trigger several alarms at the same time, as Scenario 3 shows. DevOps Agent links related investigations and works them as one, so you review a single root cause. You can validate the linked findings or unlink an alarm to investigate it independently. If you would rather collapse alarms before they reach the agent, you can add correlation logic in the bridge Lambda function, buffering and grouping by firewall. You can also add email, Amazon Simple Queue Service (Amazon SQS), or HTTP subscribers to the SNS topic, or add the webhook Lambda function to a topic you already run. DevOps Agent produces a mitigation plan but does not change your environment on its own.

You can also give the agent more to work with. DevOps Agent connects to source repositories and CI/CD pipelines, integrating with GitHub (including GitHub Enterprise Server and GitLab Self-Managed through a private connection). It can associate AWS resources with deployments of AWS CloudFormation, AWS CDK, Amazon Elastic Container Registry (Amazon ECR) images, and Terraform. With deployed configuration and recent deployment events in view, the agent correlates the disruption against the change that introduced it and recommends a fix matching your intended design. For this sample, that means recommending the workload subnet’s own Availability Zone firewall endpoint rather than a generic symmetric path.

DevOps Agent also supports proactive incident prevention. It analyzes patterns across past investigations and delivers recommendations to prevent similar issues from recurring, including governance recommendations that strengthen deployment processes and pipeline controls. For Network Firewall rule changes, this means the agent can recommend guardrails for your CI/CD pipeline based on the classes of misconfigurations it has already resolved. You can access these recommendations through the Improvements page in the DevOps Agent Operator Web App.

Clean up

Clean up the environment with one command.

bash scripts/destroy.sh

It reverts any active scenario, runs cdk destroy for all stacks, and sweeps for stragglers by the Project = nf-devops-agent tag. The main cost drivers are the two Network Firewall endpoints, the NAT gateways (one in the main VPC for each Availability Zone, one in the test-endpoint VPC), and the test endpoint’s load balancers. Each of these bills at an hourly rate for as long as it’s provisioned, whether or not traffic is flowing, so a stack left running continues to accrue charges around the clock even while idle. Running the scenarios and tearing the stack down the same day limits the cost to a few active hours rather than days of idle hourly charges.

Conclusion

In this post, we showed you how AWS DevOps Agent accelerates troubleshooting for three common network firewall connectivity issues. The first was a domain deny list. The second was a stateless priority inversion. The third was an asymmetric cross-AZ routing drop. For each one, DevOps Agent investigated the drop and returned a root cause with a mitigation plan you approve before applying. The first scenario triggered on a prebuilt Network Firewall metric, and the other two on application health metrics. That shows both ways to alarm on a firewall problem through one pipeline.

The pattern isn’t specific to Network Firewall. The same flow fits any service that emits CloudWatch metrics and logs, such as AWS WAF, security groups, and network ACLs. Clone the sample repository to explore the solution, then apply what you learn to your own firewall, application, and alarms. For more details, see the AWS Network Firewall Developer Guide and the AWS Network Firewall pricing page. Start with the Getting Started with AWS DevOps Agent guide to connect your first webhook.
Salman Ahmed

Salman is a Senior Technical Account Manager at AWS, specializing in helping customers design, implement, and optimize their AWS environments. He combines deep networking expertise with a passion for exploring emerging technologies to help organizations get the most out of their cloud investments. Outside of work, he enjoys photography, traveling, and watching his favorite sports teams.

Received — 8 June 2026 AWS Security Blog

Automating identity lifecycle and security with AWS Directory Service APIs

21 May 2026 at 18:00

Managing identities and access across complex environments has become more critical than ever. AWS Directory Service for Managed Microsoft Active Directory, also known as AWS Managed Microsoft AD, has added new capabilities to manage users and groups. Now, you can perform create, read, update, and delete (CRUD) operations on users and groups directly through AWS Command Line Interface (AWS CLI), APIs, and the AWS Management Console. You can use this powerful capability to automate identity lifecycle management and enhance security in your AWS environment. By using these APIs, collectively known as the Directory Service Data APIs, you can perform operations such as:

  • Listing users and groups
  • Retrieving user and group details
  • Disabling and enabling user accounts
  • Resetting user passwords
  • Managing group memberships

These APIs provide new possibilities for automating identity management tasks and integrating Active Directory management into your existing workflows and applications.

The introduction of these APIs brings several key benefits:

  • Automation of the identity lifecycle: You can now programmatically manage user accounts throughout their lifecycle—from creation to deletion—enabling streamlined onboarding and offboarding processes.
  • Enhanced security: By integrating these APIs with security services like Amazon GuardDuty, you can create automated responses to potential security threats, such as disabling accounts with inappropriate access.
  • Improved compliance: You can use automated user management to help enforce consistent policies and help maintain compliance with various regulatory requirements.
  • Operational efficiency: You can automate routine tasks such as user provisioning, deprovisioning, and group management, reducing manual effort and the potential for human error.
  • Integration capabilities: By using these APIs, you can seamlessly integrate with existing identity management systems, custom applications, and third-party tools.
  • Cost optimization: By automating processes and reducing manual intervention, you can potentially help your organization optimize operational costs associated with identity management.

In this post, we explore these new APIs and demonstrate how you can use them to create an automated solution for detecting and responding to unexpected behavior by Active Directory users. We walk through a practical example that combines GuardDuty, AWS Step Functions, Amazon EventBridge, and the new AWS Directory Service APIs to create a robust security automation workflow.

Solution overview

To demonstrate the power of these new APIs, let’s explore a practical solution that automates the detection and response to unexpected behavior by Active Directory users. This solution combines several AWS services to create a robust security automation workflow:

    1. GuardDuty continuously monitors for unexplained behavior of Active Directory users from AWS Managed Microsoft AD. For the example in this post, we’re using Backdoor:Runtime/C&CActivity.B!DNS
    2. An EventBridge rule detects GuardDuty findings related to these users and triggers a Step Functions workflow.
      {
        "detail-type": ["GuardDuty Finding"],
        "source": ["aws.guardduty"],
        "detail": {
          "type": ["Backdoor:Runtime/C&CActivity.B!DNS"]
        }
      }
    3. The Step Functions workflow will:
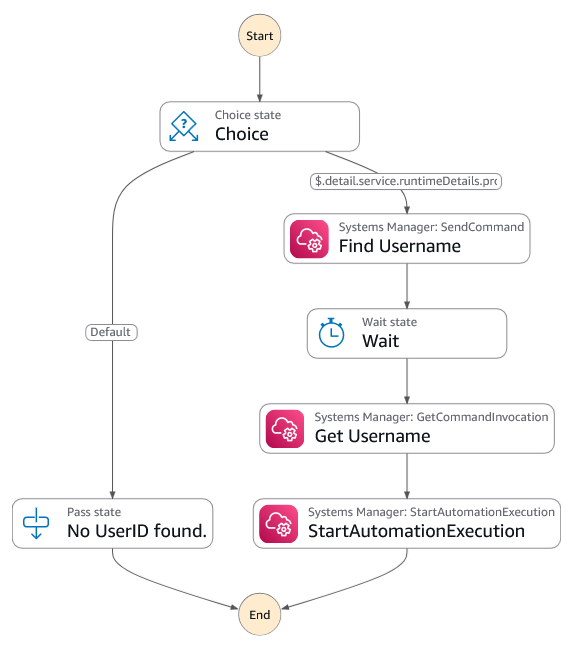
      1. Extract the Active Directory username from the instance using a run command.
      2. Start an automation that will disable the account using the DisableUser API.
Figure 1: Diagram of the Step Functions workflow showing the process of Systems Manager finding the username and starting the automation to disable the account

Figure 1: Diagram of the Step Functions workflow showing the process of Systems Manager finding the username and starting the automation to disable the account

  1. Finally, another EventBridge rule will monitor the DisableUser API call. It will send an email to the user using Amazon Simple Notification Service (Amazon SNS) notifications.
    {
      "detail-type": ["AWS API Call via CloudTrail"],
      "source": ["aws.ds"],
      "detail": {
        "eventSource": ["ds.amazonaws.com"],
        "eventName": ["DisableUser"]
      }
    }

This solution delivers automated, near real-time remediation of potential security threats — significantly reducing exposure windows and containing the impact of unauthorized account access.

The following figure shows a high-level architecture diagram of the solution.

Figure 2: Diagram showing the workflow of what happens when potentially damaging activity is detected

Figure 2: Diagram showing the workflow of what happens when potentially damaging activity is detected

Note: The solution must be deployed in the primary AWS Region of your directory.

Prerequisites

To complete the walkthrough in this post, you must have the following prerequisites in place.

GuardDuty

GuardDuty is an automated threat detection service that continuously monitors for unexpected activity and unauthorized behavior to protect your AWS accounts, workloads, and data stored in Amazon Simple Storage Service (Amazon S3).

To activate GuardDuty:

  1. Go to the GuardDuty console.
    1. If you’re activating GuardDuty for the first time, under Try threat detection with GuardDuty, select All Features and then choose Get Started.
    2. If you’ve used GuardDuty before, select Runtime Monitoring and then choose Enable under Runtime Monitoring.
Figure 3: Runtime Monitoring enabled

Figure 3: Runtime Monitoring enabled

AWS Managed Microsoft AD

AWS Managed Microsoft AD provides a fully managed service for Microsoft Active Directory (AD) in the AWS Cloud. When you create your directory, AWS deploys two domain controllers that are exclusively yours in separate Availability Zones for high availability. For use cases that require even higher resilience and performance in a specific AWS Region or during specific hours, you can scale AWS Managed Microsoft AD by deploying additional domain controllers to meet your needs. These domain controllers can help load balance, increase overall performance, or provide additional nodes to protect against temporary availability issues. Using AWS Managed Microsoft AD, you can define the correct number of domain controllers for your directory based on your use case.

To deploy a new AWS Managed Microsoft AD:

  1. Go to the Directory Service console.
  2. Choose Set up directory and select AWS Managed Microsoft AD.
  3. Select Standard Edition and enter a directory DNS name and password.
  4. Select a virtual private cloud (VPC). For this example, use the Default VPC.
  5. Choose Create directory.

Create a test Active Directory user

You will use this test user account to sign in to an EC2 instance and initiate a command that simulates unexplained activity that results in this account being disabled.

To create the test user, you can use AWS CloudShell or the AWS CLI from your local machine. Run the following commands, replacing the --directory-id value with your own:

# Create the test user
aws ds-data create-user \
 --directory-id "your-directory-id" \
 --sam-account-name "TestUser" \
 --given-name "Test" \
 --surname "User"

Then

# Set a password for the test user 
aws ds reset-user-password \
 --directory-id "your-directory-id" \
 --user-name "TestUser" \
 --new-password "YourSecurePassword123!"

In this example, the password is set to YourSecurePassword123!. If you need to replace it with a password that meets your organization’s requirements, see Resetting and enabling an AWS Managed Microsoft AD user’s password. For more information on creating users, see Creating an AWS Managed Microsoft AD user in the AWS Directory Service documentation.

Test EC2 instance

To generate alerts on GuardDuty, you need a domain joined Linux EC2 instance. If you don’t have a domain joined EC2 Linux instance, follow these instructions for joining a Linux instance to an Active Directory domain. This instance will be used to simulate suspicious activity that triggers a GuardDuty finding and initiates the automated remediation workflow.

Implement the solution

Let’s walk through the steps to implement this solution in your AWS environment.

Deploy the solution

  1. Download the CloudFormation template
  2. Navigate to the CloudFormation console in the AWS account.
  3. For Create Stack, choose with new resources (standard).
  4. For Template source, choose Upload a template file. Choose Choose file and select the template you downloaded in step 1.
  5. Choose Next.
  6. For Stack name, enter a stack name (such as CRUD-API-MAD).
  7. In the Parameters area, do the following:
    1. For DirectoryID, enter the AWS Active Directory ID.
    2. For NotificationEmail, enter the email address to send the notification to.
  8. On the Configure stack options page, choose Next.
  9. Select I acknowledge that AWS CloudFormation might create IAM resources with custom names, then choose Submit.

After the page is refreshed, the status of your stack should be CREATE_IN_PROGRESS. When the status changes to CREATE_COMPLETE, proceed to the next section.

Test

To simulate a threat, use a GuardDuty test domain that GuardDuty will recognize as a command and control server.

  1. Go to the Amazon EC2 console.
  2. Choose Instances from the navigation pane.
  3. Select the test EC2 instance that you created earlier.
  4. Choose Connect, select the Session Manager tab, and choose Connect.
  5. Authenticate with your test user by entering su followed by the test user with the domain name that you created earlier. For example su TestUser@example.com, then enter the password.
  6. Enter the command curl guarddutyc2activityb.com.
    You will receive an error because the page won’t resolve, but GuardDuty will have detected concerning events.
  7. Go to the GuardDuty console and select Findings from the navigation pane.
  8. Within 3–5 minutes, you should see a high severity finding for Backdoor:Runtime/C&CActivity.B!DNS.
  9. This will then trigger the automation to disable the account.
    Figure 4: Account successfully disabled

    Figure 4: Account successfully disabled

  10. After the account is disabled, an email notification will be sent notifying an administrator that the account was disabled (it might take up to 5 minutes to receive the notification).

    Figure 5: AWS notification message showing the username has been disabled

    Figure 5: AWS notification message showing the username has been disabled

Note: You must archive the GuardDuty finding before running this test again, because the EventBridge rule only runs once against a GuardDuty finding with the same details. To archive the finding, select the check box next to the Backdoor:Runtime/C&CActivity.B!DNS finding, choose Actions (top right), and select Archive.

Conclusion

The new AWS Directory Service APIs for AWS Managed Microsoft AD provide powerful capabilities for programmatically managing Active Directory users and groups. By using these APIs in conjunction with services such as Amazon GuardDuty and AWS Step Functions, you can create sophisticated automation workflows that enhance your security posture and streamline identity management processes.

The solution we’ve explored in this post demonstrates just one of many possible use cases for these new APIs. As you integrate these capabilities into your own environments, you will probably discover numerous opportunities to improve efficiency, security, and compliance in your identity management practices.

For a solution that uses PowerShell Active Directory cmdlets with AWS Systems Manager Run Command to disable users, see How to automatically disable users in AWS Managed Microsoft AD based on GuardDuty findings.

For more information about AWS Directory Service and its APIs, visit the AWS Directory Service documentation.

We’re excited to see how you’ll use these new APIs to innovate and improve your identity management workflows. If you have any questions or want to share your own use cases, leave a comment below or reach out to AWS Support.

Remember, the cloud journey is all about continuous improvement and innovation. Keep exploring, keep learning, and keep pushing the boundaries of what’s possible with AWS.

Ali Alzand

Ali Alzand

Ali is a Senior Infrastructure Migration & Modernization Specialist Solutions Architect at AWS who helps enterprise customers migrate, modernize, and operate their Microsoft workloads on AWS. He specializes in Infrastructure as Code, automating at scale with AWS Systems Manager, EC2 Image Builder, and CloudFormation. He also designs event-driven architectures building responsive, loosely coupled solutions with EventBridge and Lambda. Outside of work, Ali enjoys grilling with friends and discovering new cuisines around town.

Kevin Sookhan

Kevin Sookhan

Kevin is a Specialist Solutions Architect at Amazon Web Services with over 20 years of experience working with Microsoft technologies. He has expertise in running Microsoft workloads on AWS with specialization in helping customers with their migrations, cost optimization, and infrastructure architecture.

Received — 29 January 2026 AWS Security Blog

How to get started with security response automation on AWS

29 January 2026 at 20:44

December 2, 2019: Original publication date of this post.


At AWS, we encourage you to use automation. Not just to deploy your workloads and configure services, but to also help you quickly detect and respond to security events within your AWS environments. In addition to increasing the speed of detection and response, automation also helps you scale your security operations as your workloads in AWS increase and scale as well. For these reasons, security automation is a key principle outlined in the Well-Architected Framework, the AWS Cloud Adoption Framework, and the AWS Security Incident Response Guide.

Security response automation is a broad topic that spans many areas. The goal of this blog post is to introduce you to core concepts and help you get started. You will learn how to implement automated security response mechanisms within your AWS environments. This post will include common patterns that customers often use, implementation considerations, and an example solution. Additionally, we will share resources AWS has produced in the form of the Automated Security Response GitHub repo. The GitHub repo includes scripts that are ready-to-deploy for common scenarios.

What is security response automation?

Security response automation is a planned and programmed action taken to achieve a desired state for an application or resource based on a condition or event. When you implement security response automation, you should adopt an approach that draws from existing security frameworks. Frameworks are published materials which consist of standards, guidelines, and best practices in order help organizations manage cybersecurity-related risk. Using frameworks helps you achieve consistency and scalability and enables you to focus more on the strategic aspects of your security program. You should work with compliance professionals within your organization to understand any specific compliance or security frameworks that are also relevant for your AWS environment.

Our example solution is based on the NIST Cybersecurity Framework (CSF), which is designed to help organizations assess and improve their ability to help prevent, detect, and respond to security events. According to the CSF, “cybersecurity incident response” supports your ability to contain the impact of potential cybersecurity events.

Although automation is not a CSF requirement, automating responses to events enables you to create repeatable, predictable approaches to monitoring and responding to threats. When we build automation around events that we know should not occur, it gives us an advantage over a malicious actor because the automation is able to respond within minutes or even seconds compared to an on-call support engineer.

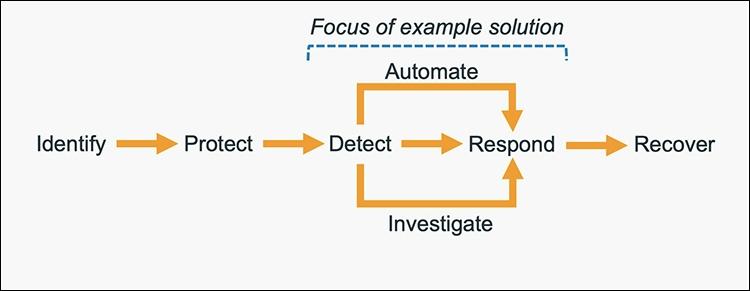
The five main steps in the CSF are identify, protect, detect, respond and recover. We’ve expanded the detect and respond steps to include automation and investigation activities.

Figure 1: The five steps in the CSF

Figure 1: The five steps in the CSF

The following definitions for each step in the diagram above are based on the CSF but have been adapted for our example in this blog post. Although we will focus on the detect, automate and respond steps, it’s important to understand the entire process flow.

  • Identify: Identify and understand the resources, applications, and data within your AWS environment.
  • Protect: Develop and implement appropriate controls and safeguards to facilitate the delivery of services.
  • Detect: Develop and implement appropriate activities to identify the occurrence of a cybersecurity event. This step includes the implementation of monitoring capabilities which will be discussed further in the next section.
  • Automate: Develop and implement planned, programmed actions that will achieve a desired state for an application or resource based on a condition or event.
  • Investigate: Perform a systematic examination of the security event to establish the root cause.
  • Respond: Develop and implement appropriate activities to take automated or manual actions regarding a detected security event.
  • Recover: Develop and implement appropriate activities to maintain plans for resilience and to restore capabilities or services that were impaired due to a security event

Security response automation on AWS

AWS CloudTrail and AWS Config continuously log details regarding users and other identity principals, the resources they interacted with, and configuration changes they might have made in your AWS account. We are able to combine these logs with Amazon EventBridge, which gives us a single service to trigger automations based on events. You can use this information to automatically detect resource changes and to react to deviations from your desired state.

Figure 2: Automated remediation flow

Figure 2: Automated remediation flow

As shown in the diagram above, an automated remediation flow on AWS has three stages:

  1. Monitor: Your automated monitoring tools collect information about resources and applications running in your AWS environment. For example, they might collect AWS CloudTrail information about activities performed in your AWS account, usage metrics from your Amazon EC2 instances, or flow log information about the traffic going to and from network interfaces in your Amazon Virtual Private Cloud (VPC).
  2. Detect: When a monitoring tool detects a predefined condition—such as a breached threshold, anomalous activity, or configuration deviation—it raises a flag within the system. A triggering condition might be an anomalous activity detected by Amazon GuardDuty, a resource out of compliance with an AWS Config rule, or a high rate of blocked requests on an Amazon VPC security group or AWS Web Application Firewall (AWS WAF) web access control list (web-acl).
  3. Respond: When a condition is flagged, an automated response is triggered that performs an action you’ve predefined—something intended to remediate or mitigate the flagged condition.

Examples of automated response actions may include modifying a VPC security group, patching an Amazon EC2 instance, rotating various different types of credentials, or adding an additional entry into an IP set in AWS WAF that is part of a web-acl rule to block suspicious clients who triggered a threshold from a monitoring metric.

You can use the event-driven flow described above to achieve a variety of automated response patterns with varying degrees of complexity. Your response pattern could be as simple as invoking a single AWS Lambda function, or it could be a complex series of AWS Step Function tasks with advanced logic. In this blog post, we’ll use two simple Lambda functions in our example solution.

How to define your response automation

Now that we’ve introduced the concept of security response automation, start thinking about security requirements within your environment that you’d like to enforce through automation. These design requirements might come from general best practices you’d like to follow, or they might be specific controls from compliance frameworks relevant for your business.

Customers start with the run-books they already use as part of their Incident Response Lifecycle. Simple run-books, like responding to an exfiltrated credential, can be quickly mapped to automation especially if your run book calls for the disabling of the credential and the notification of on-call personnel. But it can be resource driven as well. Events such as a new AWS VPC being created might trigger your automation to immediately deploy your company’s standard configuration for VPC flowlog collection.

Your objectives should be quantitative, not qualitative. Here are some examples of quantitative objectives:

  • Remote administrative network access to servers should be limited.
  • Server storage volumes should be encrypted.
  • AWS console logins should be protected by multi-factor authentication.

As an optional step, you can expand these objectives into user stories that define the conditions and remediation actions when there is an event. User stories are informal descriptions that briefly document a feature within a software system. User stories may be global and span across multiple applications or they may be specific to a single application.

For example:

“Remote administrative network access to servers should have limited access from internal trusted networks only. Remote access ports include SSH TCP port 22 and RDP TCP port 3389. If remote access ports are detected within the environment and they are accessible to outside resources, they should be automatically closed and the owner will be notified.”

Once you’ve completed your user story, you can determine how to use automated remediation to help achieve these objectives in your AWS environment. User stories should be stored in a location that provides versioning support and can reference the associated automation code.

You should carefully consider the effect of your remediation mechanisms in order to help prevent unintended impact on your resources and applications. Remediation actions such as instance termination, credential revocation, and security group modification can adversely affect application availability. Depending on the level of risk that’s acceptable to your organization, your automated mechanism can only provide a notification which would then be manually investigated prior to remediation. Once you’ve identified an automated remediation mechanism, you can build out the required components and test them in a non-production environment.

Sample response automation walkthrough

In the following section, we’ll walk you through an automated remediation for a simulated event that indicates potential unauthorized activity—the unintended disabling of CloudTrail logging. Outside parties might want to disable logging to avoid detection and the recording of their unauthorized activity. Our response is to re-enable the CloudTrail logging and immediately notify the security contact. Here’s the user story for this scenario:

“CloudTrail logging should be enabled for all AWS accounts and regions. If CloudTrail logging is disabled, it will automatically be enabled and the security operations team will be notified.”

A note about the sample response automation below as it references Amazon EventBridge: EventBridge was formerly referred to as Amazon CloudWatch Events. If you see other documentation referring to Amazon CloudWatch, you can find that configuration now via the Amazon EventBridge console page.

Additionally, we will be looking at this scenario through the lens of an account that has a stand-alone CloudTrail configuration. While this is an acceptable configuration, AWS recommends using AWS Organizations, which allows you to configure an organizational CloudTrail. These organizational trails are immutable to the child accounts so that logging data cannot be removed or tampered with.

In order to use our sample remediation, you will need to enable Amazon GuardDuty and AWS Security Hub in the AWS Region you have selected. Both of these services include a 30-day trial at no additional cost. See the AWS Security Hub pricing page and the Amazon GuardDuty pricing page for additional details.

Important: You’ll use AWS CloudTrail to test the sample remediation. Running more than one CloudTrail trail in your AWS account will result in charges based on the number of events processed while the trail is running. Charges for additional copies of management events recorded in a Region are applied based on the published pricing plan. To minimize the charges, follow the clean-up steps that we provide later in this post to remove the sample automation and delete the trail.

Deploy the sample response automation

In this section, we’ll show you how to deploy and test the CloudTrail logging remediation sample. Amazon GuardDuty generates the finding

Stealth:IAMUser/CloudTrailLoggingDisabled when CloudTrail logging is disabled, and AWS Security Hub collects findings from GuardDuty using the standardized finding format mentioned earlier. We recommend that you deploy this sample into a non- production AWS account.

Select the Launch Stack button below to deploy a CloudFormation template with an automation sample in the us-east-1 Region. You can also download the template and implement it in another Region. The template consists of an Amazon EventBridge rule, an AWS Lambda function, and the IAM permissions necessary for both components to execute. It takes several minutes for the CloudFormation stack build to complete.

Select the Launch Stack button to launch the template

  1. In the CloudFormation console, choose the Select Template form, and then select Next.
  2. On the Specify Details page, provide the email address for a security contact. For the purpose of this walkthrough, it should be an email address that you have access to. Then select Next.
  3. On the Options page, accept the defaults, then select Next.
  4. On the Review page, confirm the details, then select Create.
  5. While the stack is being created, check the inbox of the email address that you provided in step 2. Look for an email message with the subject AWS Notification – Subscription Confirmation. Select the link in the body of the email to confirm your subscription to the Amazon Simple Notification Service (Amazon SNS) topic. You should see a success message like the one shown in Figure 3:

    Figure 3: SNS subscription confirmation

    Figure 3: SNS subscription confirmation

  6. Return to the CloudFormation console. After the Status field for the CloudFormation stack changes to CREATE COMPLETE (as shown in Figure 4), the solution is implemented and is ready for testing.

    Figure 4: CREATE_COMPLETE status

    Figure 4: CREATE_COMPLETE status

Test the sample automation

You’re now ready to test the automated response by creating a test trail in CloudTrail, then trying to stop it.

  1. From the AWS Management Console, choose Services > CloudTrail.
  2. Select Trails, then select Create Trail.
  3. On the Create Trail form:
    1. Enter a value for Trail name and for AWS KMS alias, as shown in Figure 5.
    2. For Storage location, create a new S3 bucket or choose an existing one. For our testing, we create a new S3 bucket.

      Figure 5: Create a CloudTrail trail

      Figure 5: Create a CloudTrail trail

    3. On the next page, under Management events, select Write-only (to minimize event volume).

      Figure 6: Create a CloudTrail trail

      Figure 6: Create a CloudTrail trail

  4. On the Trails page of the CloudTrail console, verify that the new trail has started. You should see the status as logging, as shown in Figure 7.

    Figure 7: Verify new trail has started

    Figure 7: Verify new trail has started

  5. You’re now ready to act like an unauthorized user trying to cover their tracks. Stop the logging for the trail that you just created:
    1. Select the new trail name to display its configuration page.
    2. In the top-right corner, choose the Stop logging button.
    3. When prompted with a warning dialog box, select Stop logging.
    4. Verify that the logging has stopped by confirming that the Start logging button now appears in the top right, as shown in Figure 8.

      Figure 8: Verify logging switch is off

      Figure 8: Verify logging switch is off

    You have now simulated a security event by disabling logging for one of the trails in the CloudTrail service. Within the next few seconds, the near real-time automated response will detect the stopped trail, restart it, and send an email notification. You can refresh the Trails page of the CloudTrail console to verify through the Stop logging button at the top right corner.

    Within the next several minutes, the investigatory automated response will also begin. GuardDuty will detect the action that stopped the trail and enrich the data about the source of unexpected behavior. Security Hub will then ingest that information and optionally correlate with other security events.

    Following the steps below, you can monitor findings within Security Hub for the finding type TTPs/Defense Evasion/Stealth:IAMUser-CloudTrailLoggingDisabled to be generated:

  6. In the AWS Management Console, choose Services > Security Hub.
    1. In the left pane, select Findings.
    2. Select the Add filters field, then select Type.
    3. Select EQUALS, paste TTPs/Defense Evasion/Stealth:IAMUser-CloudTrailLoggingDisabled into the field, then select Apply.
    4. Refresh your browser periodically until the finding is generated.

    Figure 9: Monitor Security Hub for your finding

    Figure 9: Monitor Security Hub for your finding

  7. Select the title of the finding to review details. When you’re ready, you can choose to archive the finding by selecting the Archive link. Alternately, you can select a custom action to continue with the response. Custom actions are one of the ways that you can integrate Security Hub with custom partner solutions.

Now that you’ve completed your review of the finding, let’s dig into the components of automation.

How the sample automation works

This example incorporates two automated responses: a near real-time workflow and an investigatory workflow. The near real-time workflow provides a rapid response to an individual event, in this case the stopping of a trail. The goal is to restore the trail to a functioning state and alert security responders as quickly as possible. The investigatory workflow still includes a response to provide defense in depth and uses services that support a more in-depth investigation of the incident.

Figure 10: Sample automation workflow

Figure 10: Sample automation workflow

In the near real-time workflow, Amazon EventBridge monitors for the undesired activity.

When a trail is stopped, AWS CloudTrail publishes an event on the EventBridge bus. An EventBridge rule detects the trail-stopping event and invokes a Lambda function to respond to the event by restarting the trail and notifying the security contact via an Amazon Simple Notification Service (SNS) topic.

In the investigative workflow, CloudTrail logs are monitored for undesired activities. For example, if a trail is stopped, there will be a corresponding log record. GuardDuty detects this activity and retrieves additional data points regarding the source IP that executed the API call. Two common examples of those additional data points in GuardDuty findings include whether the API call came from an IP address on a threat list, or whether it came from a network not commonly used in your AWS account. An AWS Lambda function responds by restarting the trail and notifying the security contact. The finding is imported into AWS Security Hub, where it’s aggregated with other findings for analyst viewing. Using EventBridge, you can configure Security Hub to export the finding to partner security orchestration tools, SIEM (security information and event management) systems, and ticketing systems for investigation.

AWS Security Hub imports findings from AWS security services such as GuardDuty, Amazon Macie and Amazon Inspector, plus from third-party product integrations you’ve enabled. Findings are provided to Security Hub in AWS Security Finding Format (ASFF), which minimizes the need for data conversion. Security Hub correlates these findings to help you identify related security events and determine a root cause. Security Hub also publishes its findings to Amazon EventBridge to enable further processing by other AWS services such as AWS Lambda. You can also create custom actions using Security Hub. Custom actions are useful for security analysts working with the Security Hub console who want to send a specific finding, or a small set of findings, to a response or a remediation workflow.

Deeper look into how the “Respond” phase works

Amazon EventBridge and AWS Lambda work together to respond to a security finding.

Amazon EventBridge is a service that provides real-time access to changes in data in AWS services, your own applications, and Software-as-a-Service (SaaS) applications without writing code. In this example, EventBridge identifies a Security Hub finding that requires action and invokes a Lambda function that performs remediation. As shown in Figure 11, the Lambda function both notifies the security operator via SNS and restarts the stopped CloudTrail.

Figure 11: Sample “respond” workflow

Figure 11: Sample “respond” workflow

To set this response up, we looked for an event to indicate that a trail had stopped or was disabled. We knew that the GuardDuty finding Stealth:IAMUser/CloudTrailLoggingDisabled is raised when CloudTrail logging is disabled. Therefore, we configured the default event bus to look for this event.

You can learn more regarding the available GuardDuty findings in the user guide.

How the code works

When Security Hub publishes a finding to EventBridge, it includes full details of the finding as discovered by GuardDuty. The finding is published in JSON format. If you review the details of the sample finding, note that it has several fields helping you identify the specific events that you’re looking for. Here are some of the relevant details:

{
   …
   "source":"aws.securityhub",
   …
   "detail":{
      "findings": [{
		…
    	“Types”: [
			"TTPs/Defense Evasion/Stealth:IAMUser-CloudTrailLoggingDisabled"
			],
		…
      }]
}

You can build an event pattern using these fields, which an EventBridge filtering rule can then use to identify events and to invoke the remediation Lambda function. Below is a snippet from the CloudFormation template we provided earlier that defines that event pattern for the EventBridge filtering rule:

# pattern matches the nested JSON format of a specific Security Hub finding
      EventPattern:
        source:
        - aws.securityhub
        detail-type:
          - "Security Hub Findings - Imported"
        detail:
          findings:
            Types:
              - "TTPs/Defense Evasion/Stealth:IAMUser-CloudTrailLoggingDisabled"

Once the rule is in place, EventBridge continuously monitors the event bus for events with this pattern.

When EventBridge finds a match, it invokes the remediating Lambda function and passes the full details of the event to the function. The Lambda function then parses the JSON fields in the event so that it can act as shown in this Python code snippet:

# extract trail ARN by parsing the incoming Security Hub finding (in JSON format)
trailARN = event['detail']['findings'][0]['ProductFields']['action/awsApiCallAction/affectedResources/AWS::CloudTrail::Trail']   

# description contains useful details to be sent to security operations
description = event['detail']['findings'][0]['Description']

The code also issues a notification to security operators so they can review the findings and insights in Security Hub and other services to better understand the incident and to decide whether further manual actions are warranted. Here’s the code snippet that uses SNS to send out a note to security operators:

#Sending the notification that the AWS CloudTrail has been disabled.
snspublish = snsclient.publish(
	TargetArn = snsARN,
	Message="Automatically restarting CloudTrail logging.  Event description: \"%s\" " %description
	)

While notifications to human operators are important, the Lambda function will not wait to take action. It immediately remediates the condition by restarting the stopped trail in CloudTrail. Here’s a code snippet that restarts the trail to reenable logging:

try:
	client = boto3.client('cloudtrail')
	enablelogging = client.start_logging(Name=trailARN)
	logger.debug("Response on enable CloudTrail logging- %s" %enablelogging)
except ClientError as e:
	logger.error("An error occured: %s" %e)

After the trail has been restarted, API activity is once again logged and can be audited.

This can help provide relevant data for the remaining steps in the incident response process. The data is especially important for the post-incident phase, when your team analyzes lessons learned to help prevent future incidents. You can also use this phase to identify additional steps to automate in your incident response.

How to Enable Custom Action and build your own Automated Response

Unlike how you set up the notification earlier, you may not want fully automate responses to findings. To set up automation that you can manually trigger it for specific findings, you can use custom actions. A custom action is a Security Hub mechanism for sending selected findings to EventBridge that can be matched by an EventBridge rule. The rule defines a specific action to take when a finding is received that is associated with the custom action ID. Custom actions can be used, for example, to send a specific finding, or a small set of findings, to a response or remediation workflow. You can create up to 50 custom actions.

In this section, we will walk you through how to create a custom action in Security Hub which will trigger an EventBridge rule to execute a Lambda function for the same security finding related to CloudTrail Disabled.

Create a Custom Action in Security Hub

  1. Open Security Hub. In the left navigation pane, under Management, open the Custom actions page.
  2. Choose Create custom action.
  3. Enter an Action Name, Action Description, and Action ID that are representative of an action that you are implementing—for example Enable CloudTrail Logging.
  4. Choose Create custom action.
  5. Copy the custom action ARN that was generated. You will need it in the next steps.

Create Amazon EventBridge Rule to capture the Custom Action

In this section, you will define an EventBridge rule that will match events (findings) coming from Security Hub which were forwarded by the custom action you defined above.

  1. Navigate to the Amazon EventBridge console.
  2. On the right side, choose Create rule.
  3. On the Define rule detail page, give your rule a name and description that represents the rule’s purpose (for example, the same name and description that you used for the custom action). Then choose Next.
  4. Security Hub findings are sent as events to the AWS default event bus. In the Define pattern section, you can identify filters to take a specific action when matched events appear. For the Build event pattern step, leave the Event source set to AWS events or EventBridge partner events.
  5. Scroll down to Event pattern. Under Event source, leave it set to AWS Services, and under AWS Service, select Security Hub.
  6. For the Event Type, choose Security Hub Findings – Custom Action.
  7. Then select Specific custom action ARN(s) and enter the ARN for the custom action that you created earlier.
  8. Notice that as you selected these options, the event pattern on the right was updating. Choose Next.
  9. On the Select target(s) step, from the Select a target dropdown, select Lambda function. Then, from the Function dropdown, select SecurityAutoremediation-CloudTrailStartLoggingLamb-xxxx. This lambda function was created as part of the Cloudformation template.
  10. Choose Next.
  11. For the Configure tags step, choose Next.
  12. For the Review and create step, choose Create rule.

Trigger the automation

As GuardDuty and Security Hub have been enabled, after AWS Cloudtrail logging is enabled, you should see a security finding generated by Amazon GuardDuty and collected in AWS Security Hub.

  1. Navigate to the Security Hub Findings page.
  2. In the top corner, from the Actions dropdown menu, select the Enable CloudTrail Logging custom action.
  3. Verify the CloudTrail configuration by accessing the AWS CloudTrail dashboard.
  4. Confirm that the trail status displays as Logging, which indicates the successful execution of the remediation Lambda function triggered by the EventBridge rule through the custom action.

How AWS helps customers get started

Many customers look at the task of building automation remediation as daunting. Many operations teams might not have the skills or human scale to take on developing automation scripts. Because many Incident Response scenarios can be mapped to findings in AWS security services, we can begin building tools that respond and are quickly adaptable to your environment.

Automated Security Response (ASR) on AWS is a solution that enables AWS Security Hub customers to remediate findings with a single click using sets of predefined response and remediation actions called Playbooks. The remediations are implemented as AWS Systems Manager automation documents. The solution includes remediations for issues such as unused access keys, open security groups, weak account password policies, VPC flow logging configurations, and public S3 buckets. Remediations can also be configured to trigger automatically when findings appear in AWS Security Hub.

The solution includes the playbook remediations for some of the security controls defined as part of the following standards:

  • AWS Foundational Security Best Practices (FSBP) v1.0.0
  • Center for Internet Security (CIS) AWS Foundations Benchmark v1.2.0
  • Center for Internet Security (CIS) AWS Foundations Benchmark v1.4.0
  • Center for Internet Security (CIS) AWS Foundations Benchmark v3.0.0
  • Payment Card Industry (PCI) Data Security Standard (DSS) v3.2.1
  • National Institute of Standards and Technology (NIST) Special Publication 800-53 Revision 5

A Playbook called Security Control is included that allows operation with AWS Security Hub’s Consolidated Control Findings feature.

Figure 12: Architecture of the Automated Security Solution

Figure 12: Architecture of the Automated Security Solution

Additionally, the library includes instructions in the Implementation Guide on how to create new automations in an existing Playbook.

You can use and deploy this library into your accounts at no additional cost, however there are costs associated with the services that it consumes.

Clean up

After you’ve completed the sample security response automation, we recommend that you remove the resources created in this walkthrough example from your account in order to minimize the charges associated with the trail in CloudTrail and data stored in S3.

Important: Deleting resources in your account can negatively impact the applications running in your AWS account. Verify that applications and AWS account security do not depend on the resources you’re about to delete.

Here are the clean-up steps:

Summary

You’ve learned the basic concepts and considerations behind security response automation on AWS and how to use Amazon EventBridge, Amazon GuardDuty and AWS Security Hub to automatically re-enable AWS CloudTrail when it becomes disabled unexpectedly. Additionally you got a chance to learn about the AWS Automated Security Response library and how it can help you rapidly get started with automations through Security Hub. As a next step, you may want to start building your own custom response automations and dive deeper into the AWS Security Incident Response Guide, NIST Cybersecurity Framework (CSF) or the AWS Cloud Adoption Framework (CAF) Security Perspective. You can explore additional automatic remediation solutions on the AWS Solution Library. You can find the code used in this example on GitHub.

If you have feedback about this blog post, submit them in the Comments section below. If you have questions about using this solution, start a thread in the
EventBridge, GuardDuty or Security Hub forums, or contact AWS Support.

❌