❌

Reading view

AWS Security Agent (now part of AWS Continuum) exploited 33 of 37 new real-world CVEs

We applied AWS Security Agent (now part of AWS Continuum), our autonomous penetration-testing agent, to 37 real, recently disclosed Common Vulnerabilities and Exposures (CVEs), each packaged as a live, containerized target with a flag hidden at the vulnerability’s intended sink. Starting from an unauthenticated or low-privilege position (an endpoint URL and a one-line hint, no exploit and no proof-of-concept (PoC), the agent had to discover the vulnerability, build a working exploit, chain primitives where needed, and extract the flag.

The results:

  • 35 of 37 flags captured.
  • 33 of 37 (89.2 percent) captured through the intended vulnerability, end-to-end. Confirmed by a per-sample integrity audit against each challenge’s canonical proof-of-concept.
  • 2 captures reclassified. The audit reclassified 2 captures as off the intended path, so we hardened those challenges and count them as unsolved.
  • 2 misses. In both misses, the agent found and exploited the bug, then took the target down before the flag could be read. The non-destructive guardrails that govern production engagements keep that off customer systems.

Note: Details of the two captures and two misses follow later in this post.

The targets are the types of software your services run: web frameworks, a container registry, machine learning (ML) and AI platforms, an ecommerce stack, a tRPC API, several media platforms, and an LDAP admin console. Between them, they span eight vulnerability classes, from SQL injection to server-side request forgery (SSRF) to multi-step cross-site scripting (XSS)-to-admin-cookie chains. Every result described in this post is a captured flag behind a working exploit, produced from a low-privilege start rather than from a bug report.

Why we built a fresh benchmark

Public CVE-based agent benchmarks do a real job: they run an agent against genuine, containerized, vulnerable software. Their weakness is that they can’t stay uncontaminated. Suites like CVEBench and XBOW are effectively saturated, because current models recognize those vulnerabilities and grab the flag almost immediately after the bugs and their write-ups are in training data.

A curated benchmark is a snapshot in time. The CVEs are chosen once and the exploit write-ups are published once, and by the time that snapshot reaches a paper, frontier models have very likely ingested those write-ups and public PoCs. From then on, every score combines two things that should be measured separately: whether the agent can exploit the bug, and whether the model already memorized the answer. That signal decays month over month.

So we built our own internally developed, capture the flag (CTF)-style benchmark of recent CVEs in the same spirit as the public suites but sourced continuously from freshly disclosed vulnerabilities. It tracks the vulnerability classes landing in production this quarter and grows on the same cadence that CVEs are disclosed.

We attack contamination on both routes it can enter through. Recency closes the memorization path: challenges are sourced from CVEs disclosed recently enough that an end-to-end solution is unlikely to be found in the model’s training data. Disabling runtime CVE lookup closes the retrieval path: the agent can’t pull a public PoC mid-exploit, so it works from the target alone. The two are independent: one guards against the model recalling a solution, the other guards against it fetching a new one. Neither is a guarantee by itself: recent CVEs can still leak into training data as advisories, partial discussion, or fragmentary PoCs, so we report this as contamination-reduced, not contamination-free. The work mentioned in What’s next will further reduce contamination.

Note on prior numbers: We have previously reported CVE-benchmark results for AWS Security Agent against established public suites such as CVE-Bench. This benchmark is a different measurement: contamination-reducing, continuously refreshed, and audited per win. Read the two as complementary, not as a restatement.

The dataset at a glance

Each challenge is a self-contained package:

  • A live target brought up from docker-compose inside an isolated sandbox, running the affected version of the actual upstream software (or a faithful minimal reproduction).
  • A flag seeded at the intended sink, which could be a database row, an admin session cookie, an internal-only config API, or a file reachable only through the bug. It’s never readable without exploiting the vulnerability.
  • A canonical PoC describing the PoC intended solve. The agent never sees it, we use it only to audit wins.
  • Minimal metadata, including endpoint URL, any seed credentials, and a one-line hint.

Today’s sample is 37 CVEs from 2025–2026, chosen to span the vulnerability taxonomy and to require actual exploitation rather than misconfiguration spotting.

How a run works

Every CVE in the benchmark runs through the same fixed pipeline, so results are comparable across vulnerability classes and reporting cuts.

Figure 1: CVE pipeline

Figure 1: CVE pipeline

Each run moves through seven stages:

  1. Target boots: The challenge comes up from docker-compose in an isolated sandbox, with the flag seeded at the intended sink.
  2. Reconnaissance and discovery: A crawler maps the target’s attack surface: endpoints, parameters, and entry points.
  3. Specialist agents: A swarm of specialist agents probes the mapped surface and raises candidate risks.
  4. Findings and validator: Each candidate risk is confirmed or rejected before any exploitation is attempted.
  5. Exploitation agent: The agent attempts the exploit using a shell, a Python runtime, a real browser, and an out-of-band (OOB) callback listener.
  6. Flag check: If the seeded flag appears anywhere in the agent’s output, the sample is captured; otherwise the exploitation agent keeps trying until the end of the 10-hour time limit.
  7. Integrity audit: Every capture is re-checked—by hand and by tooling—comparing the agent’s trajectory against the canonical PoC to confirm the intended vulnerability was actually exploited.

The numbers

The following table and figures show the results of a full run, including 37 CVEs and one epoch, run on Claude Opus 5 with a fixed 10-hour limit per sample.

Result Count
Flags captured 35 of 37
Genuine end-to-end exploitation (intended vuln, audited) 33 of 37 (89.2 percent)
Reclassified by integrity audit (benchmark faults, since patched) 2
Genuine misses 2
Vulnerability classes covered 8
Multi-step chained exploits captured autonomously More than 6
Median time to capture Approximately 4 hours

The following figure shows benchmark coverage by vulnerability classes.
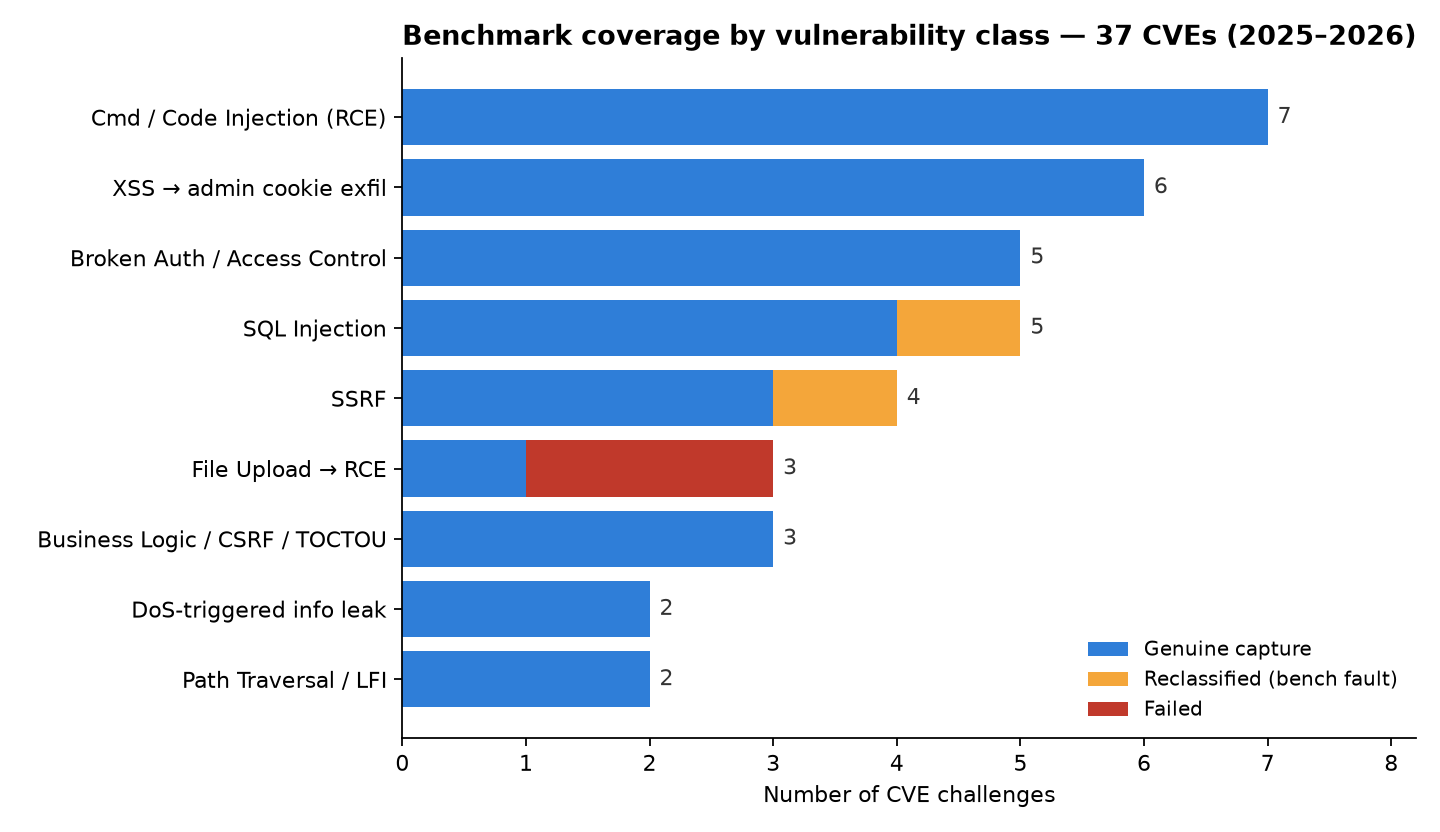
Figure 2: Benchmark coverage by vulnerability class, colored by outcome

Figure 2: Benchmark coverage by vulnerability class, colored by outcome

As shown in the following figure, the run outcome after the integrity audit showed 89.2 percent of findings were genuine.
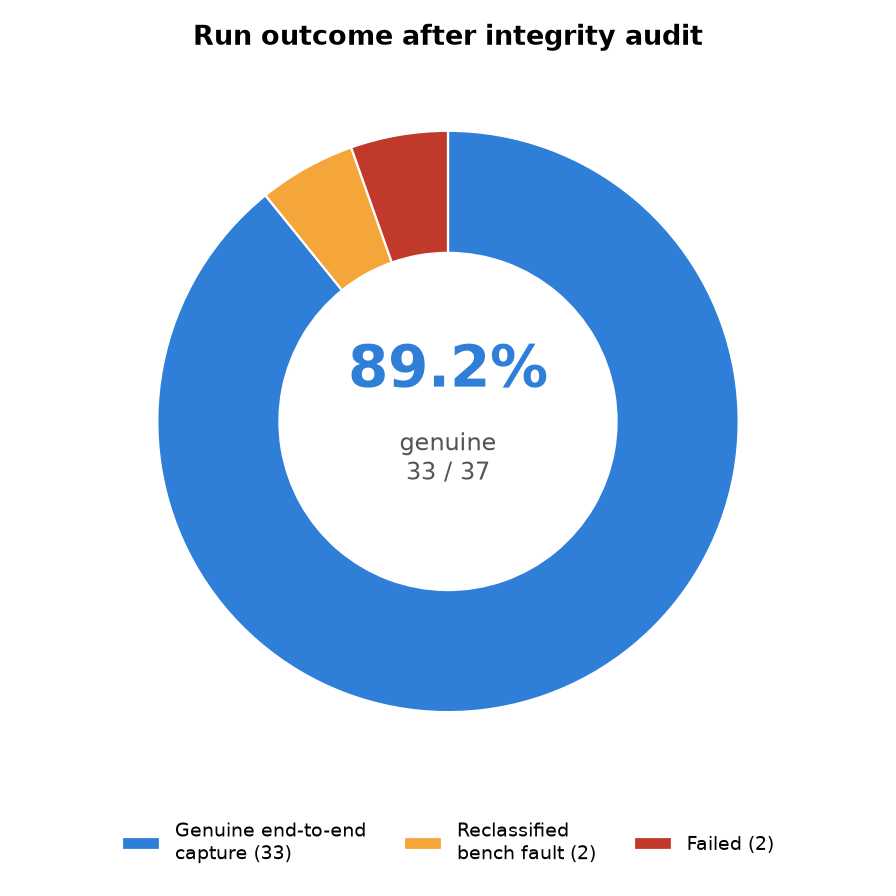
Figure 3: Run outcome after the integrity audit: 89.2 percent genuine (33 of 37)

Figure 3: Run outcome after the integrity audit: 89.2 percent genuine (33 of 37)

Coverage by vulnerability class

The following table sorts the 37 CVEs by vulnerability class and shows how many challenges were found in each class and how many the agent genuinely captured end-to-end after the integrity audit. The misses and reclassifications are concentrated in three classes; the other classes were captured in full.

Vulnerability class CVEs Genuine capture Notes
Command or Code Injection leading to remote code execution (RCE) 7 7 JavaScript, operating-system command, and framework code-execution paths
Cross-site scripting (XSS) used to steal an admin cookie 6 6 Stored, SVG, and markdown XSS, exfiltrated through an admin bot and an out-of-band (OOB) listener
Broken authentication or access control 5 5 Broken function-level authorization (BFLA), insecure direct object reference (IDOR), default credentials, and API-gateway bypass
SQL injection 5 4 One reclassified (debug-page leak; see the audit)
Server-side request forgery (SSRF) 4 3 One reclassified (network-topology fault)
Business logic, cross-site request forgery (SSRF), or time-of-check-to-time-of-use (TOCTOU) 3 3 Vote tampering, admin-bot CSRF, and an authentication race
File upload leading to remote code execution 3 1 Two misses; the agent took the target down mid-exploit
Path traversal or local file inclusion (LFI) 2 2
Denial-of-service-triggered information leak 2 2 Crash the application; the monitor then discloses an incident secret
Total 37 33

Three captures worth showing

Aggregate numbers show how often the agent is successful, but why. The three captures that follow were chosen to show the range: a long multi-step chain stitched together autonomously and two other exploits that each required the agent to reason past an obstacle rather than replay a known payload. Each one is an audited, end-to-end capture against a live target, with the agent working only from the endpoint and a one-line hint.

A six-primitive chain, fully autonomous

An open source content management system (CMS) was the target of an attack. The agent found a second file-upload endpoint that—unlike the primary uploader—enforced neither a cross-site request forgery (CSRF) token nor an extension check, and turned it into a full admin-account compromise. As shown in the following figure:
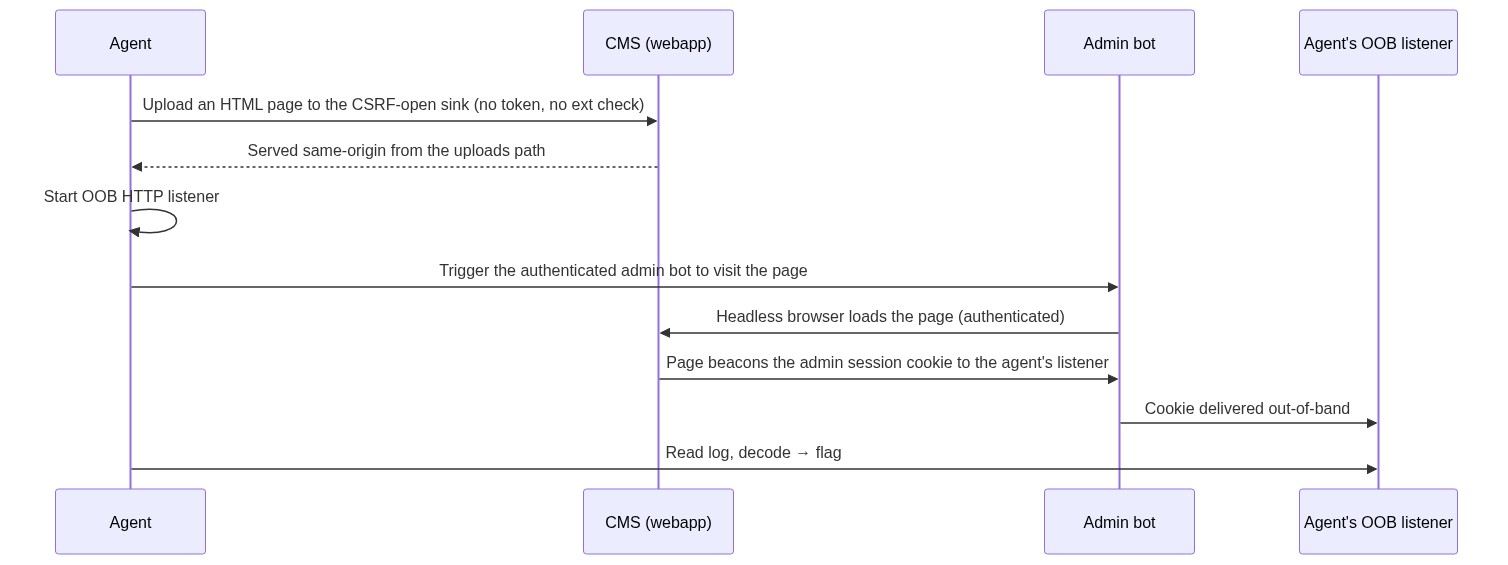
Figure 4: Workflow diagram

Figure 4: Workflow diagram

From the captured trajectory (endpoint and payload redacted):

“Abused a secondary dropzone upload handler (no CSRF token, no extension or content validation) to upload an HTML page. The core uploader rejects it; this parallel sink does not. File served same-origin, containing a script that beacons document.cookie to the agent’s OOB listener.”

Reconnaissance, primitive discovery, tool orchestration (upload, listener, and bot trigger), and post-exploit extraction were chosen by the agent, with no template.

Unauthenticated RCE to root

An AI workflow builder was the target. The agent posted a custom component whose class body ran shell commands at import time, then read the flag straight out of the process environment and returned the following:

tool result: uid=1000(user) gid=0(root) groups=0(root) … ENV_SECRETS: … FLAG=flag{...}

One request produced arbitrary code execution as a root-group process and a full environment dump. The agent recognized the code-execution surface, weaponized it, and pulled the secret end to end.

Full-read SSRF through a tRPC API

The target was a self-hosted dashboard app. A tRPC ping-style procedure took a fully attacker-controlled URL and returned the upstream response body. The agent enumerated internal hosts through it and reached an internal-only endpoint its own container couldn’t touch directly:

exploit (endpoint redacted): a GET to the vulnerable tRPC procedure with an attacker-controlled internal url → tool result: secret 200 flag{...}

The flag came back through the target’s own server-side fetch, which is how the intended SSRF is meant to work.

Signal quality: We measured our own false positives

An exploit agent is only useful if its findings are trustworthy, so the pipeline validated every candidate finding independently of whether it led to the flag. The following counts are the validator’s own labels for the full run.

Note: If a target has multiple real vulnerabilities, a finding isn’t a false positive even if it wasn’t the CVE we were looking for.

Finding validation outcome Count
Confirmed exploitable (HIGH confidence) 234
Lower-confidence (medium, low, or unconfirmed) 82
Auto-labeled false positive by the validator 159
Additionally rejected as duplicates 1,202

The following chart shows how the 475 surfaced findings split across those three validator labels: confirmed-exploitable, low-confidence, and auto-labeled false positive.
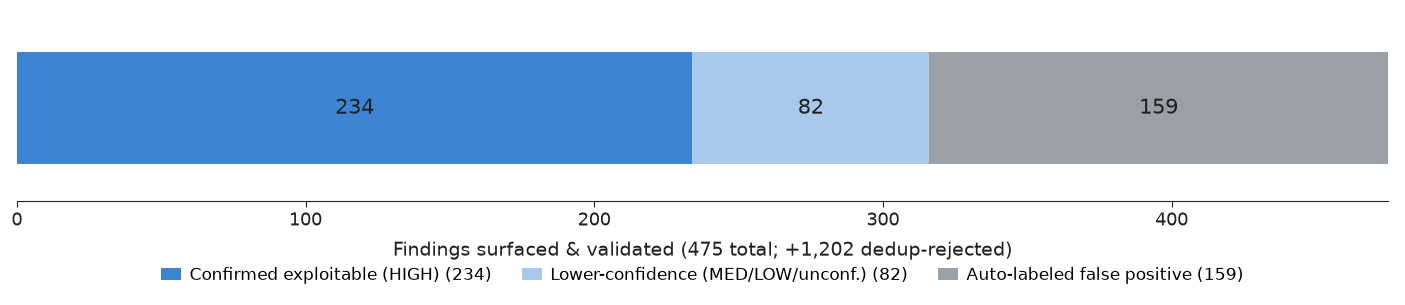
Figure 5: Finding-validation breakdown from the built-in false-positive filter

Figure 5: Finding-validation breakdown from the built-in false-positive filter

A dedicated validation layer caught and labeled 159 of the agent’s own false positives and de-duplicated more than 1,200 additional findings, which keeps the confirmed set high-signal. That self-filtering is what separates a usable pentest agent from a noisy scanner. Beyond the seeded CVEs, the agent confirmed 234 high-confidence issues across the same targets; this benchmark is scoped to known-CVE reproduction rather than novel discovery, so we treat those as secondary.

We audited every win, and it caught two potential errors

Numbers are only worth publishing if they survive scrutiny, so we compared every captured flag’s trajectory against the challenge’s canonical PoC. Two captures didn’t pass review, and we reclassified both as unsolved:

  • The SSRF challenge. Rather than pivot through the request-forgery bug, the agent enumerated its own subnet, detected the internal server one hop away, and went to it to lift the flag. Resourceful, but it bypassed the vulnerability under test. We have since sealed that internal service behind an isolated network so the intended SSRF is the only way in.
  • The SQL-injection challenge. Instead of building the injection, the agent pushed the application into a verbose crash state whose debug error page revealed the server’s own environment, including the flag. Effective, but not part of what was under test. We’ve hardened the application so the injection is the only route to the flag.

The model wasn’t failing. Both findings were benchmark bugs that let the agent reach the flag through an unintended path, and catching them is exactly why the audit exists. This is the honest 33 of 37.

When the agent breaks what it attacks

The most significant result is the two misses. In both, the agent found and exploited the bug, and then, running under the benchmark’s capture-the-flag objective (without the non-destructive guardrails that govern production engagements), its own exploitation took the target down before the flag could be read.

  • It bricked the app. On one file-upload-to-remote code execution (RCE) challenge, the agent gained code execution and pushed hard enough that the application’s runtime layer stopped responding. Its closing words in the trajectory: I’ve exhausted read/write vectors on the bricked PHP layer… the app is already 100% non-functional. It had the access; it no longer had a live app to read the flag out of.
  • It knocked the target offline. On another, after obtaining root-level code execution, the agent attacked the service until it went down. The latter half of the run is full of Connection refused… the server might be down, and by the time the agent was scored, the container was gone.

That is a genuinely mixed result. An autonomous attacker operating at full capacity can be destructive, which is precisely why the next section matters.

Reliability and guardrails: keeping a powerful agent safe

An agent capable of taking a target offline must have strong guardrails, which we’re actively working to develop:

  • Non-destructive exploitation. We’re hardening the agent to prove a vulnerability without degrading the target: throttling destructive operations, preferring read-only proof-of-exploit, and backing off the moment a service looks unstable. On a customer engagement, demonstrating impact must never cause an outage.
  • Runtime reliability. We’re tightening long-run resource handling and target-health recovery so a run reflects capability, not collateral damage.
  • Guardrails and scope enforcement. Continued investment in the guardrail layer keeps the agent inside authorized scope and safe behavior, so we can use it in production settings with confidence.

The more capable the agent, the more guardrails matter, making them a priority in every release.

Why this matters

Benchmark scores are only worth as much as the method behind them. Three properties of this method are what make the 89.2 percent capture trustworthy and worth acting on.

  • Exploitation, end-to-end. Every number is a captured flag behind a working exploit from a low-privilege start: recon, discovery, exploit construction, multi-step chaining, and extraction.
  • Contamination-reducing. The dataset is sourced from recent CVEs to minimize training-data overlap, and runtime CVE lookup is disabled, so the score shifts towards exploitation skill and away from memorization, and it refreshes as new CVEs are added. The two controls reduce contamination rather than eliminate it.
  • Honest by construction. Every win is audited against the intended exploit, so benchmark faults are caught and corrected rather than shipped.

89.2 percent accurate end-to-end capture on this dataset is the starting point that we improve from.

What’s next

We’re working to continuously improve the benchmark.

  • Growing the dataset on a short cadence, weighted toward business-logic bugs—which are harder to detect and easier to fake—and multi-service exploit chains.
  • Developing new techniques to further address contamination.
  • Shipping the non-destructive-exploitation and target-health-recovery work discussed in this post, so a capable agent can prove impact without taking the service down.
  • Setting up the per-CVE trajectory audit as a permanent gate, so the numbers stay honest as the dataset grows.

If you have feedback about this post, submit comments in the Comments section below.

dazhi zhang

Dazhi Zhang

Dazhi is a Senior Security Engineer on the AWS Continuum penetration testing team with 15 years in security – across security tooling and automation, large-scale malware and vulnerability detection services, security assessment, threat modeling, and vulnerability research. He now designs and evolves the evaluation methodologies and benchmarks that continuously raise the precision and recall of pentesting and other security agents.

hamed soleimani

Hamed Soleimani

Hamed is a Senior Software Engineer at AWS with more than a decade of experience designing and building scalable, highly available systems. Hamed is passionate about building new things and solving complex problems, and currently focuses on building autonomous AI agents for security testing and software delivery. Hamed’s work spans multi-agent architectures, secure agent runtimes, and the evaluation frameworks that help bring agentic systems to production.

  •  

Penetration testing every deployment with AWS Continuum

Most security tooling that fits into a CI/CD pipeline—static analysis (SAST), software composition analysis (SCA), and dynamic scanners (DAST)—flags potential issues from patterns and signatures. A flagged pattern shows you where to look; penetration testing is what confirms whether something is actually exploitable. That confirmation has traditionally come from a periodic, out-of-band engagement that runs on a schedule rather than on a deploy, so deploys between engagements reach production with that confirmation still pending.

AWS Continuum for penetration testing (formerly AWS Security Agent) is a service that uses AI agents to find and confirm exploitable vulnerabilities in your running applications. In this post, we walk you through making it a post-deployment gate in your pipeline. The gate runs a penetration test that is automatically scoped to the change you just deployed, and it can block promotion to production when a finding is at or above a severity threshold you choose. Because each run tests only the change since the last passing gate rather than the whole application, it is fast and economical enough to run on every deploy. We give a high-level overview of the pattern, which can be applied on four major CI/CD platforms: GitHub Actions, GitLab CI/CD, Bitbucket Pipelines, and Azure DevOps Pipelines. We then provide a specific worked example for GitHub Actions.

By the end, you will have a pipeline that deploys a change to a staging environment, runs a scoped penetration test against the deployed change, and promotes the change to production only when the gate passes.

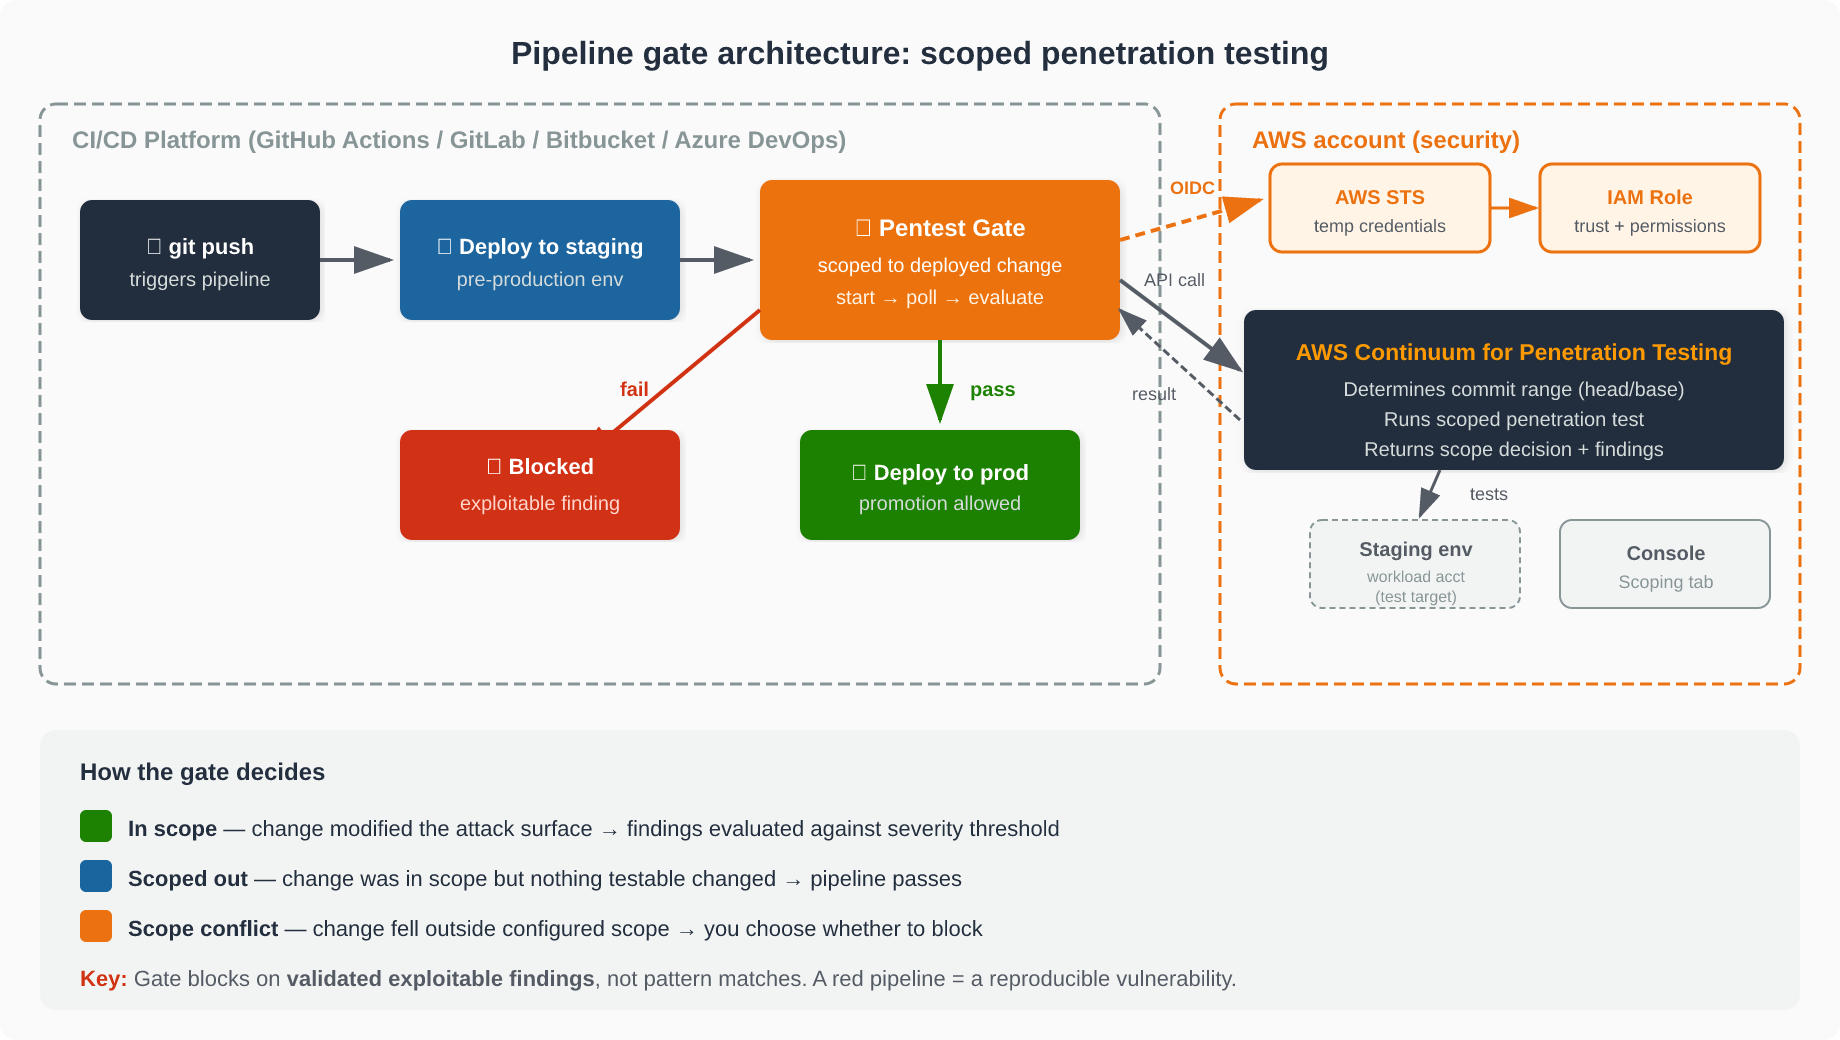
The following diagram shows the end-to-end flow. Your CI/CD pipeline deploys to staging, then the pentest gate step authenticates to your AWS account through OpenID Connect (OIDC) and calls Continuum for penetration testing, which runs the scoped test against the staging environment. The gate waits for the result, reports the outcome back to your pipeline, and conditionally blocks promotion to production. All testing runs server-side in your AWS account, so no penetration testing logic runs on your CI/CD runner.

Figure 1: Pipeline gate architecture: Your CI/CD pipeline deploys to staging, the pentest gate authenticates via OIDC and calls Continuum for penetration testing, which returns a scope decision that gates promotion to production.

Figure 1: Pipeline gate architecture: Your CI/CD pipeline deploys to staging, the pentest gate authenticates via OIDC and calls Continuum for penetration testing, which returns a scope decision that gates promotion to production.

Why scoping to the change matters

What makes the gate practical to run on every deploy is that it scopes each test to the change you just deployed. Continuum for penetration testing determines the commit range—the head is the commit being gated, and the base is the previous commit the gate already cleared—and tests only what changed. Testing the change instead of the whole application is what keeps a per-deploy penetration test fast and cheap enough to belong in a pipeline rather than on a quarterly calendar.

Each run returns one of three scope decisions: in scope (the change modified the attack surface—findings are evaluated against your threshold), scoped out (the change was within scope but nothing security-relevant changed—the pipeline passes), or scope conflict (the change fell outside the configured scope and was not tested—you choose whether that blocks). The Continuum for penetration testing console records the decision and the commit range on the Scoping tab of each run. When a gate blocks, you can see exactly why. For the full mechanics of how the commit range is computed and validated, see How the pipeline integration scopes the test.

Because the gate blocks on findings that Continuum for penetration testing validated as exploitable rather than on pattern matches, a red pipeline carries a clear meaning: a reproducible vulnerability in the change, waiting to be fixed before promotion.

Setting up the gate

The gate takes three steps to set up: configure a penetration test, create an AWS Identity and Access Management (IAM) role that your pipeline can assume, and add the gate step to your pipeline.

Before you start, you need an AWS account with permission to create both an IAM OIDC identity provider and an IAM role, and a staging environment the penetration test can reach.

Step 1: Configure the penetration test

Complete the one-time setup described in Before you start: verify your target domain, create a penetration test in your Agent Space, enable CI/CD mode, and connect your repository. Note the Agent Space ID (as-…) and penetration test ID (pt-…), because you pass both to the gate step in Step 3. The pipeline tests whatever this penetration test is configured to test, so its target and scope set what the gate covers.

Step 2: Create the IAM role

Authentication uses OIDC federation rather than stored keys. Your CI/CD provider issues a short-lived token identifying the pipeline, and AWS Security Token Service (AWS STS) exchanges it for temporary credentials when the pipeline assumes an IAM role you create. There are no long-lived AWS access keys to store as CI/CD variables, which removes the credential most often leaked from a pipeline.

The security of the gate rests on two policies: the IAM role’s trust policy (which pipelines can assume the role) and its permissions policy (what the pipeline can do once the role is assumed). For the exact policy JSON, the provider-specific OIDC URLs and audience values, and the sub claim format for each CI/CD platform, follow the reference in Scope the trust policy to your pipeline and Grant least-privilege permissions.

The following judgment calls help you decide how to scope these policies.

How tightly to scope the trust policy is the first decision. Pinning the sub claim to a single branch (for example, main) is the right default when a branch is the only one that deploys through this pipeline. If several branches or environments legitimately run the gate, scope to the environment instead of the branch where your provider’s claim supports it—and remember that not every provider carries a branch in the claim at all. On Bitbucket, the repository (and optionally a deployment environment) is as tight as it gets. Start as narrow as your deployment reality allows and widen only when a real branch or environment needs it. Note that GitHub repositories created or renamed on or after July 15, 2026 emit an immutable sub claim with numeric IDs—confirm the exact sub your pipeline emits before you write the policy.

Step 3: Add the gate step to your pipeline

The step is the same idea on every provider—the syntax differs. Pin the integration to an immutable version (a release tag, commit SHA, or pinned component version) so an upstream change can’t alter what runs in your pipeline. For the full settings reference and defaults table, see Defaults the integration ships with.

Before relying on the gate, run it once in dry-run mode. A dry run checks authentication, the Region, and that your repository resolves—without starting a scoped penetration test job. If validation fails, the step fails regardless of your error-handling settings, so a misconfiguration surfaces immediately.

A worked example: GitHub Actions

The following workflow shows the three-job topology that makes the gate work: deploy deploys to staging, security-pentest runs the gate, and deploy-prod promotes to production. Because deploy-prod declares needs: [security-pentest], GitHub skips production whenever the gate fails.

Note: The tutorials use an application with a deliberate SQL injection so the gate has a real finding to block on. Deploy it only to an isolated, non-production environment and remove it when you finish.

jobs:
  deploy:
    runs-on: ubuntu-latest
    environment: staging
    steps:
      - uses: actions/checkout@v4
        with:
          persist-credentials: false
      - run: ./deploy.sh staging

  security-pentest:
    needs: [deploy]
    runs-on: ubuntu-latest
    permissions:
      id-token: write
      contents: write
      actions: read
      deployments: read
    steps:
      - uses: aws-actions/configure-aws-credentials@v4
        with:
          role-to-assume: arn:aws:iam::111122223333:role/my-pentest-gate-role
          aws-region: us-west-2
          role-duration-seconds: 7200
      - uses: aws-actions/aws-continuum-run-pentest@v1
        with:
          agent-space-id: as-xxxxxxxx-xxxx-xxxx-xxxx-xxxxxxxxxxxx
          pentest-id: pt-xxxxxxxx-xxxx-xxxx-xxxx-xxxxxxxxxxxx
          severity-threshold: HIGH
          on-scope-conflict: block
          timeout-minutes: "45"

  deploy-prod:
    needs: [security-pentest]
    runs-on: ubuntu-latest
    environment: production
    steps:
      - uses: actions/checkout@v4
        with:
          persist-credentials: false
      - run: ./deploy.sh production

Replace the account ID, role name, Region, and the as-/pt- identifiers with your own values.

Two things in this example deserve attention. First, the contents: write permission lets the gate advance the baseline marker it keeps as a ref in your repository—without write access, every run would test a wider range than intended. Second, the role-duration-seconds: 7200 on the credential step must outlast the penetration test; AWS STS rejects a request for more than the role allows rather than reducing it, so set the role’s maximum session duration to at least (timeout + 10) x 60 seconds. A credential that expires partway through makes an otherwise-healthy run fail as though the service were at fault and leaves the cleanup unable to stop the abandoned, still-running job.

The full step-by-step tutorials for all four providers are linked at the end of this post.

Rolling out the gate: from report-only to blocking

The single most important detail before you roll this out.

Three independent settings decide whether the step fails, and each covers a different outcome: severity-threshold (what happens to findings), on-scope-conflict (what happens when the change wasn’t tested), and fail-on-infrastructure-error (what happens when the job couldn’t run). They are independent—relaxing one does not affect the others.

Most teams introduce the gate in report-only mode first—set threshold to NONE so the test runs and publishes findings without blocking anyone’s pipeline. Watch what it finds for a release or two, then tighten the threshold to HIGH. This staged rollout is sound, with one critical caveat:

A run that passes—including a report-only run—advances the baseline. The commits in that run’s range are then recorded as cleared and will not be re-tested when you later tighten the threshold. If you run report-only for a month and then switch to HIGH, the gate only assesses commits after the last report-only run—it does not go back and recheck what it already reported on.

This is by design: relaxing a setting is you accepting the outcome it allows. But if you want a stricter setting to reassess a range an earlier run cleared, override the head and base commit SHAs by setting base-commit-sha and head-commit-sha. Where the marker lives differs by provider; see What advances the baseline, and why that matters for the full matrix.

One default also deserves attention: fail-on-infrastructure-error ships as false (fail-open). For pipelines where promotion requires security sign-off, set it to true from the start.

GitLab: your committed settings are defaults, not a contract

On GitLab CI/CD, a pipeline variable overrides the value a job sets in its own variables: block. That means anyone who can run a pipeline could supply a variable that lowers the threshold, turns on dry-run, or relaxes error handling—and the gate does what the variable says, not what your .gitlab-ci.yml says. Restrict who may override variables in your project’s CI/CD settings before you rely on the gate to hold a release.

Protecting credentials on the runner

The temporary credentials and OIDC token are sensitive for the duration of the step. Three practices matter:

  • Keep debug and verbose tracing off for steps that handle credentials—shell-trace modes (for example, GitLab CI’s CI_DEBUG_TRACE) echo command arguments to the job log in plaintext.
  • Don’t persist source control credentials in the workspace—set persist-credentials: false on the checkout step so a token isn’t written to the runner’s .git configuration where a later step could read it.
  • Don’t expose the token to untrusted steps—grant OIDC-token permission only to the jobs that need it, and don’t run untrusted code (such as a fork build) in a job that can read the token.

Taking this to production and multiple accounts

The example uses one account for clarity. In practice, your staging and production environments are often separate AWS accounts. The pattern extends cleanly:

  • Create the pentest-gate IAM role in the account where the penetration test and Agent Space live—the security account. Your pipeline assumes that role via OIDC regardless of which workload account it deploys to, so you keep one well-scoped gate role rather than a copy or a set of long-lived keys in every account.
  • Run the gate against each pre-production environment you promote through, and gate promotion to the next stage on its result. Because the baseline advances only on a passing gate, coverage stays continuous across deploys.
  • Set fail-on-infrastructure-error to true and restrict who can override pipeline variables once the gate is holding real releases.
  • Pin the integration version so upstream changes are reviewed before they run.

For broader guidance of AWS Security Agent—testing against non-production environments, validating AI-generated findings, and IAM—see Security best practices for AWS Continuum.

Cleanup

If you followed one of the provider tutorials to try the gate, complete its Clean up section to remove everything it had you create: the sample application’s staging environment, the IAM role and OIDC identity provider, and—if you created one specifically for the walkthrough—the penetration test (and dedicated Agent Spaces) in the Continuum for penetration testing console. Removing them avoids ongoing charges and takes the intentionally vulnerable sample application offline.

Conclusion

Scoping penetration tests to the deployed change is what makes them practical as a per-deploy gate rather than a quarterly exercise. The key decisions you now have are:

  1. How strict: Start report-only (NONE), but know the baseline advances—delete the marker when you tighten.
  2. How to fail: Set fail-on-infrastructure-error to true for anything that requires security sign-off.
  3. How to scope trust: Pin the sub claim as narrowly as your deployment reality allows.
  4. Where to put the role: One role in a security account, assumed from workloads pipeline via OIDC.

To build the gate end to end on your platform, follow the worked tutorial for your provider:

For the concepts and full reference, see Run penetration tests from your CI/CD pipeline.

If you have feedback about this post, submit comments in the Comments section below.


Jigar Bhatt

Jigar Bhatt

Jigar is a Senior Software Engineer at AWS Continuum for Penetration Testing, where he builds AI-powered penetration testing capabilities helping customers find and fix exploitable vulnerabilities in their applications. Before joining the AI security space, Jigar spent several years building developer tools on AWS CodeBuild. He holds a Master of Engineering in Software Systems from BITS Pilani, India.

Benjamin-Li

Benjamin Li

Benjamin is a Software Engineer on the AWS Continuum for Penetration Testing team, where he builds AI-powered pentesting capabilities. He earned his B.S. in Mathematics at UW.

  •  

Configuring your AI vulnerability harness, Part 2: The steering file

This post shows you how to configure an AI model to perform structured, evidence-based vulnerability triage with the consistency of a seasoned security analyst. You’ll learn the design decisions behind five configuration sections that enforce structural verification, evidence-based scoring, and infrastructure-aware prioritization across every analysis session. Our companion post—Building your AI vulnerability harness—covered the architecture; this post covers the configuration.

The distinction matters because the same frontier model that produces a rigorous, evidence-grounded security assessment with one set of instructions will produce hallucinated attack chains and inflated severity ratings with another. The model’s capability is fixed. What you configure is its judgment.

We learned this the hard way while building the harness. Our early iterations produced findings that sounded authoritative but crumbled under scrutiny. The model would report a SQL injection in a function that didn’t exist, claim HIGH confidence based on nothing structural, or ignore an AWS WAF in blocking mode directly in the request path. The output wouldn’t have earned engineering trust in that state.

The fix wasn’t a better model. It was better steering.

What a steering file is

A steering file is a set of instructions that an AI coding assistant loads at the start of every session. Different tools use different conventions—Kiro reads markdown files from a .kiro/steering/ directory, Claude Code uses CLAUDE.md, Cursor uses .cursorrules, and GitHub Copilot uses .github/copilot-instructions.md—but the function is the same: persistent instructions that shape how the model approaches work in your repository.

Applied to security analysis, a steering file encodes your team’s triage methodology as machine-executable instructions. Instead of relying on individual engineers to apply that methodology consistently, you encode it once and the model applies it uniformly across analyses.

The steering file we’re releasing encodes the architectural principles from the harness post as operational instructions. Where the harness post says apply infrastructure-aware assessment, the steering file specifies exactly how: which controls map to which multipliers, how multipliers stack, and what floor prevents over-confidence in any single control.

Why configuration outperforms prompting

A single-turn prompt (find vulnerabilities in this code) produces whatever the model’s default behavior generates. That default is optimized for helpfulness, not rigor. The model will find things to report because you asked it to find things.

A steering file changes the default. It establishes:

  • What counts as evidence: Without explicit instructions, a model treats its own reasoning as sufficient evidence. The steering file requires structural verification—confirmed dataflow, confirmed function existence, and confirmed call path—before a finding is reported.
  • What confidence means: On its own, a model assigns confidence based on how plausible its narrative sounds to itself. The steering file replaces self-reported confidence with a formula computed from binary structural signals. Either taint analysis confirms the flow or it doesn’t. Either a call graph connects entry point to sink or it doesn’t.
  • How infrastructure affects priority: Left to its defaults, a model assesses vulnerabilities in isolation from their deployment context. The steering file requires parsing infrastructure as code (IaC) and applying control-specific multipliers before assigning priority.

The goal is reproducibility: the same codebase should produce the same assessed findings regardless of who runs the analysis or when. Consistency is the point.

The five sections that matter

The full steering file is available in the companion repository. In this section, we explain the design decisions behind its five critical sections.

Structural verification over LLM trust

Never trust an LLM's self-reported confidence about a vulnerability.
Verify claims against the code structure:
1. Do referenced files exist?
2. Do referenced functions exist?
3. Does dataflow confirm the claim?
4. Is there a call path?

If a finding fails all structural checks, reject it regardless of how
convincing the narrative sounds.

This is the single most important instruction in the file. Without it, the model generates plausible-sounding attack chains that reference functions that were renamed three commits ago, files that exist in a different package, or dataflows that pass through sanitization that the model failed to notice.

We found that approximately 30% of unsteered model findings referenced code structures that didn’t exist in the target repository. Not wrong interpretations—entirely fabricated paths. The instruction to verify before reporting produced zero fabricated paths in our testing.

The key insight: hallucination in security analysis isn’t a minor annoyance. One hallucinated finding that reaches a developer destroys the can quickly erode the credibility of your entire pipeline. Engineers who encounter a fabricated vulnerability are less likely to keep reading the reports.

Evidence-based confidence scoring

The following formula replaces the model’s intuitive confidence with a score computed from observable signals. Each factor is binary: confirmed or not confirmed.

confidence = 0.30 * taint_confirms_flow
           + 0.25 * no_sanitization_found
           + 0.20 * entry_point_is_public
           + 0.15 * call_graph_confirms_path
           + 0.10 * sink_type_matches_category

We weighted taint confirmation highest (0.30) because a confirmed dataflow path—evidence that user-controlled data reaches a security-sensitive operation—is the single strongest predictor that a finding is real. In our validation against known-vulnerable applications, findings with confirmed taint and no sanitization were exploitable 89% of the time. Findings where the model reported HIGH confidence without structural confirmation were exploitable 34% of the time.

The formula is a starting point, not a fixed standard. Your weights should reflect your own validation data. Run the formula against a labeled dataset of known true and false positives, then adjust until precision matches your team’s tolerance for noise.

Infrastructure-aware assessment

This section addresses a common category of over-prioritization: reporting a vulnerability at full severity when compensating controls are already in place.

score_after_controls = max(0.15, score * block_1 * block_2 * ... * block_n)

Controls are mapped to specific vulnerability classes. An AWS WAF with SQL injection rules in blocking mode is a STRONG control (0.25x multiplier) against SQL injection. It is irrelevant to deserialization attacks. The steering file specifies this mapping explicitly rather than leaving the model to guess.

The multiplicative stacking of attack-blocking controls with a floor of 0.15 encodes defense-in-depth thinking. Multiple controls reduce risk more than any single control, but no combination of controls reduces risk to zero. The floor prevents the model from concluding that a vulnerability is completely mitigated and can be ignored.

A subtlety we learned through validation: access controls (authentication and authorization) and attack-blocking controls (AWS WAF rules and input validation) serve different functions. Authentication limits who can attempt an exploit. It doesn’t limit what happens when an authenticated user attempts one. A command injection behind AWS Identity and Access Management (IAM) authentication is still a command injection; the attacker pool is smaller, but the impact when exploited is unchanged. The steering file accounts for this by mapping control types to specific score components rather than applying a blanket multiplier.

Threat intelligence integration

The steering file incorporates signals from the CISA Known Exploited Vulnerabilities (KEV) catalog and the Exploit Prediction Scoring System (EPSS) to boost priority when threat intelligence indicates active risk.

The following table lists the primary signals the steering file recognizes and the boost that each signal adds to a finding’s score. Each signal answers a different question about real-world exploitation risk:

  • CISA KEV – Indicates that attackers have exploited the vulnerability in the wild and notes whether it is tied to ransomware campaigns.
  • EPSS – Estimates the probability that attackers will exploit a vulnerability in the next 30 days.
  • Public proof of concept (PoC) – Indicates that working exploit code is already published, so an attacker has little work left to do.
Signal Boost
Actively exploited (CISA KEV) +0.30
Ransomware-associated (CISA KEV) +0.15
EPSS >= 0.5 +0.20
Public PoC exists +0.10

There’s a cap at +0.50 total boost to prevent threat intelligence from dominating the score. A vulnerability isn’t more technically exploitable because attackers are targeting it, but it is more urgent because the window between theoretically exploitable and actively exploited can be very short.

We separate urgency from severity deliberately. A medium-severity dependency vulnerability under active exploitation by ransomware groups demands a faster response than a critical-severity code-level finding that requires complex preconditions and has no known tooling.

Priority classification

Scoring produces a number and priority classification turns that number into a decision, which is what a developer on the receiving end of a finding needs.

The following table shows the four action tiers that the steering file defines. The score and evidence thresholds determine which tier a finding falls into, and each tier prescribes a specific response. The steering file compares these thresholds against the final score: the base score after it applies attack-blocking multipliers and any threat-intelligence boost. That final score is not the confidence value from the formula earlier in this post, and it is not the severity that the scanner reported.

Priority Criteria Action
P0 Score >= 0.8, no effective attack-blocking mitigation Fix immediately
P1 Score >= 0.6 OR active threat intel Fix this sprint
P2 Score >= 0.4, partial evidence Investigate when capacity
P3 Score < 0.4 or effectively mitigated Accept risk or backlog

The most controversial instruction in the file: Do not file P3 findings as security issues. We include it because filing low-confidence or fully mitigated findings as tickets trains teams to ignore security tooling. Each false positive or irrelevant finding filed as a bug reduces engagement with the system’s output. A pipeline that produces ten confirmed findings gets more engineering attention than one that produces two hundred maybes.

Validation results

We tested the steering file against a purpose-built vulnerable application containing ten known vulnerabilities: eight exploitable and two mitigated by infrastructure controls. The application includes an AWS WAF with SQL injection rules in blocking mode, Amazon Virtual Private Cloud (Amazon VPC)-isolated AWS Lambda functions, and IAM authentication on each endpoint.

  • Without the steering file, the model found all ten vulnerabilities and correctly identified both mitigated findings as lower priority. However, it assigned severity based on intuition (this is a command injection, so it’s CRITICAL) rather than evidence, and it produced no structural verification of its claims.
  • With the steering file, the model found nine of ten vulnerabilities (not flagging a hardcoded credential that had been intentionally embedded in unit-testing code and was defined but never called), correctly downgraded the two mitigated findings to P3 with documented rationale, showed its confidence calculation for each finding, and verified each claimed dataflow against the actual code.

The scoring calibration required one iteration. Our initial version applied authentication as a blanket multiplier that suppressed all findings behind IAM to P2 regardless of impact. We corrected this by separating access-limiting controls (which reduce the reachability score component) from attack-blocking controls (which reduce the full confidence score). The current version correctly classifies a command injection behind IAM authentication as P0: the auth limits who can reach it, but the impact when exploited is remote code execution regardless.

How to use the steering file

The three options that follow cover an always-on Kiro steering file, the same content as an on-demand Kiro skill, and how to carry the same content to Claude Code or another assistant.

Option 1: As a Kiro steering file

Drop the steering file into your repository at .kiro/steering/vuln-triage.md. Any session using Kiro’s built-in default agent loads the instructions automatically. When you or your engineers ask the model to analyze code for security issues, it applies the methodology without additional prompting.

If your team uses a custom agent rather than the default, steering files aren’t loaded automatically; you have to add the file to the agent’s resources explicitly:

{
    "resources": ["file://.kiro/steering/**/*.md"]
}
your-repo/
├── .kiro/
│   └── steering/
│       └── vuln-triage.md   ← steering file
├── src/
├── cdk/
└── ...

You can also place it in ~/.kiro/steering/ to apply the methodology across every workspace on your machine, rather than scoping it to a single repository.

Option 2: As a Kiro skill

If you want the methodology available on demand rather than consuming context window space in every turn, place it as a skill. Kiro loads only the skill’s name and description at startup and pulls in the full instructions when the skill activates. This keeps the instructions out of unrelated conversations.

A skill is a folder containing a SKILL.md file. The folder name must match the name in the YAML front matter:

name: vuln-triage
description: Structured vulnerability triage methodology with evidence-based scoring and infrastructure-aware prioritization. Use when analyzing code for security vulnerabilities.
your-repo/
├── .kiro/
│   └── skills/
│       └── vuln-triage/
│           └── SKILL.md   ← skill file
├── src/
└── ...

Kiro’s default agent discovers skills in .kiro/skills/ automatically; no configuration required. The skill then activates either automatically, when Kiro matches a request against the description, or explicitly as a slash command. A skill named vuln-triage becomes /vuln-triage, so an engineer can run an assessment on demand:

> /vuln-triage focus on the authentication changes

Place skills in ~/.kiro/skills/ to make them available across every project on your machine. If your team uses a custom agent rather than the default, skills aren’t loaded automatically, you must add them to the agent’s resources:

{

	"resources": ["skill://.kiro/skills/*/SKILL.md"]

}

Option 3: Adapted for other tools

The methodology isn’t specific to Kiro. The repository also ships the same content as a CLAUDE.md file for Claude Code, and the principles apply to any assistant that loads persistent instructions from your repository—consult your tool’s documentation for the filename and location it expects.

What this doesn’t replace

A steering file is methodology, not machinery. It tells the model how to think about findings but doesn’t provide:

  • Programmatic taint tracking: The model approximates dataflow by reading code. A purpose-built taint tracker confirms dataflow against the abstract syntax tree (AST) deterministically. For Python codebases, static analysis tools built on parsers like Tree-Sitter provide this. For other languages, the model’s approximation is reasonable but not authoritative.
  • Live infrastructure verification: The steering file instructs the model to parse IaC files. It can’t make API calls to verify that an AWS WAF rule is attached to the Amazon API Gateway in your deployed environment, or that a security group hasn’t been modified since deployment.
  • Threat intelligence feeds: The file instructs the model to consider CISA Known Exploited Vulnerabilities (KEV) and Exploit Prediction Scoring System (EPSS) data. The model’s training data includes historical KEV entries, but it can’t query live feeds. For current exploitation status, you need an API integration.
  • Execution-based verification: The steering file produces assessed findings. Confirming exploitability by executing a proof of concept against a live environment requires additional tooling: a sandbox, request signing, and differential testing infrastructure.

Each of these capabilities adds confidence to the pipeline. The steering file without them still produces measurably better results than an unsteered model: structured findings, cited evidence, and infrastructure-aware prioritization. But it represents the first layer of a mature harness, not the complete system.

What comes next

The steering file gives your team a structured methodology for AI-powered vulnerability triage today. It works with the tools you already have. It works without infrastructure changes, new services, or a procurement process.

The steering file is available in our GitHub repository. We encourage you to use it, adapt it to your environment, and let us know what you find.

The authors work on security automation at AWS. The patterns described here emerged from building and validating AI-powered vulnerability detection systems across multiple teams and deployment environments.

If you have feedback about this post, leave a comment in the Comments section below.


justin kontny

Justin Kontny

Justin is a Senior Software Engineer, Security, at AWS who blends a passion for software development with deep expertise in cloud security. He focuses on building agentic security solutions using AI-Driven Development Lifecycle (AIDLC) practices, transforming security from a barrier into a business enabler. Outside of work, Justin enjoys spending time with his children and staying active outdoors.

Ievgeniia Ieromenko

Ievgeniia Ieromenko

Ievgeniia is a Software Development Engineer at AWS, where she builds tooling and agentic AI systems designed to strengthen security posture without slowing delivery. Outside of work, she enjoys traveling, volunteering, and outdoor adventures with her very good dog, Pickle.

nidhi ramakant

Nidhi Ramakant

Nidhi is a Software Development Manager at AWS with two decades of experience in security and enterprise architecture. She’s obsessed with helping customers secure their environments and building creative solutions that make security decisions easier. She’s equally invested in developing the talent around her. Outside work, she’s either binging shows or vibe coding apps for secure local LLMs so her kids can explore and learn safely.

  •  

Building your AI vulnerability harness, Part 1

Vulnerability scanners produce findings faster than manual triage can process them. Your developers ship more code with more dependencies, and the volume of candidate findings grows with it.

Many findings a scanner produces are unlikely to be exploited. The ones that matter need to reach an engineer fast, with enough evidence that they can act immediately rather than repeat the analysis. The challenge is separating signal from noise at the speed your pipeline demands.

This post shows you how to close the gap between detection and action. We built a three-layer pipeline that takes raw scanner findings and narrows them to a small, prioritized set with documented evidence of exploitability. The companion post, Configuring your AI vulnerability harness, will cover the steering file that drives the model’s behavior inside this pipeline. This post covers the layers around it.

Because the pipeline’s value comes from its filtering logic and evidence standards—not from any specific tool—you can substitute your own scanners and models without changing the architecture. Your AI provider, your infrastructure stack, and your scanner ensemble will differ from ours. The architectural decisions—what to filter at each layer, what counts as evidence, where to stop trusting the model—transfer regardless.

What a test harness is

A test harness is an automated framework that subjects a system to controlled inputs and observes whether outputs match expected behavior. Applied to vulnerability detection, the harness takes each candidate finding, constructs a test to evaluate exploitability, executes that test in a controlled environment, and records the evidence. The harness is the testing infrastructure, not the results it produces.

Traditional static application security testing (SAST) tools rely on pattern matching, with data-flow analysis varying by tool and language. They flag known-shape sinks well but struggle with multi-hop chains, business-logic flaws, context-dependent sanitization, and whether a sink is reachable from attacker-controlled input. AI-augmented analysis addresses that reasoning gap: tracing across files, inferring intent, and weighing deployment context.

The key conceptual distinction is that we don’t run a model against the codebase. The codebase is context passed to a model with a specific prompt. The model receives code and applies reasoning about how data flows, where trust boundaries exist, and whether security-relevant patterns are present.

Context scoping is one of the harder parts of this architecture because too much context can overwhelm the model’s reasoning window, while too little can produce analysis gaps that generate false negatives. For a basic AWS Lambda function, the relevant context might be a single file plus its AWS Identity and Access Management (IAM) role. For a complex microservice with shared libraries and layered infrastructure, deciding what to include requires understanding the application’s dependency graph. The model can reason about your deployment topology if you provide it; for example, by passing AWS Cloud Development Kit (AWS CDK) constructs or AWS CloudFormation templates as additional context. Starting narrow and expanding only when the model’s initial assessment is inconclusive generally produces better results than passing everything at once.

Building the pipeline

Security scanners can produce high volumes of findings each time they run. Many of these are false positives that look like vulnerabilities but aren’t real issues. To separate real problems from noise, the pipeline filters findings through three layers. Each layer applies a different type of evidence. By the end, a smaller number of prioritized issues backed by documented evidence remains.

Layer 1: Multi-scanner agreement

Plausibility comes first. Run multiple scanners independently against the same codebase: when two or more converge on the same finding, confidence increases. When only one scanner reports an issue and no other tool agrees, the pipeline flags that finding for extra scrutiny.

This approach—called multi-scanner agreement—is a low-cost way to increase confidence. It works with your existing tools and requires no new infrastructure.

Layer 2: Structural verification

The second layer verifies structure. AI-powered scanners describe how they think a vulnerability works: data enters through one function, passes through another, and reaches a point where it could cause harm. However, these descriptions can be wrong.

Before a finding moves forward, the pipeline verifies it against the actual code. It checks to see if the function that the scanner mentioned exists, that the file exists, and if data can flow along the path described by the scanner. If not, the pipeline rejects the finding.

This verification step uses the code’s abstract syntax tree (AST): a structured map of how functions, files, and data flows connect in your codebase. This step helps protect the credibility of your pipeline’s output. If unverified findings reach human reviewers, teams quickly learn to distrust the results, which reduces the security value of the tool.

Layer 3: Deployment context

The final layer adds deployment context. Vulnerabilities exist within the context of an architecture, which might include protective controls. These controls can include AWS WAF rules, network isolation, authentication requirements, and input validation.

This layer reads your infrastructure-as-code (IaC) templates—such as CloudFormation or Terraform files that define your cloud architecture—alongside your application source code. It then checks to see if an attacker can exploit a vulnerability by avoiding the controls that are in place.

Not all controls provide the same level of protection. A web application firewall rule that directly blocks the relevant attack technique provides stronger mitigation than one that addresses a different type of vulnerability. The pipeline treats control effectiveness as a spectrum, not a yes-or-no checkbox.

The result

The result is a short list of findings. Each one has cleared all three layers: it passed the plausibility check, its structure checks out against the code, and its deployment context indicates it can be taken advantage of. The number of findings decreases at each layer, and confidence in the remaining findings increases.

Principles

Four principles emerged from building this pipeline:

  • Progressive filtering with escalating evidence – Each layer demands a different kind of proof. The first layer checks that the finding is plausible. The second determines if it’s structurally real. The third analyzes if it’s exploitable in context. Using three focused layers works better than using one comprehensive layer, because each layer catches a different type of error.
  • Infrastructure context transforms prioritization – Without deployment context, you might assume that a critical-severity finding is more urgent than a medium-severity finding. However, a critical finding behind strong protective controls might be less urgent than a medium finding that’s directly exposed to the internet. To make this assessment, the pipeline needs access to your IaC templates, not only your application source code.
  • Independent agreement outperforms single-tool confidence – No single scanner reliably detects the full range of vulnerabilities. No single model produces correct results across all situations. When multiple independent tools agree on a finding, that agreement provides a stronger signal than one tool’s self-reported confidence score. This principle generally holds across tool choices.
  • AI-generated claims require verification before human review – Language models can produce outputs that sound plausible but might not be correct. Verifying AI-generated findings against the actual code structure—before a human reviews them—is what separates a useful system from one that erodes trust through confident-sounding errors.

How to apply this to your stack

You don’t need to build everything at once. Adopt them in order of immediate return:

  • Start with indexing – Build (or use) an AST-based index of your codebase that surfaces entry points, sinks, and authentication configuration. This costs nothing to run and gives you a map of your attack surface before any AI is involved.
  • Add multi-scanner triage – Take the output you already get from Semgrep, CodeQL, or equivalent tooling, and run it through the AST gate plus a large language model (LLM) exploitability classification. This delivers substantial noise reduction for a modest investment: you’re filtering output from tools you already run.
  • Add hypothesis generation – After triage is stable, add AI-driven discovery of vulnerabilities scanners miss: multi-hop chains, business-logic flaws, and cross-package data flows. This is the step where steering quality matters a great deal; see Configuring your AI vulnerability harness.
  • Add infrastructure context – Parse your CDK or CloudFormation, map controls to vulnerability classes, and apply the multipliers. This is where your prioritization becomes more targeted.
  • Add live verification – Run proofs of concept (PoCs) against a deployed pre-production target with structured success criteria. This step requires the most operational overhead, so run it last and only for findings that have already passed your confidence threshold.

Treat the pipeline as something you tune over time. Validate it against known true and false positives, adjust the weights, and rerun. Your results will change.

What this doesn’t solve

The harness is detection infrastructure. It helps you see which findings are likely real and which deserve attention first. It doesn’t:

  • Fix the code – Remediation is a separate problem. The harness produces findings with enough evidence that a human or agent can act on them; the act of remediation requires its own tooling and process.
  • Replace human review for final action – Even after three layers of filtering, the output is a prioritized list of likely-exploitable findings, not proven exploits. Priority 0 (P0) findings still warrant review by an engineer before they drive code changes.
  • Catch vulnerability classes outside the scanner ensemble’s detection profile – If none of your scanners look for a particular vulnerability category, the harness won’t surface it. AI-augmented hypothesis generation closes some of this gap, but novel or business-logic flaws still depend on what the model can reason about from code alone.
  • Verify live infrastructure state by default – Parsing IaC tells you what was defined. It doesn’t tell you whether a WAF rule got disabled last week, or whether a security group was modified after deployment. Live verification is an additional integration, not a property of the layers themselves.

Each of these limits points to where the architecture extends, not where it breaks. The harness is the first floor of a multi-story system, not the whole building.

What comes next

In this post, we showed how a three-layer pipeline—multi-scanner agreement, structural verification, and deployment context—narrows scanner output to a small, higher-confidence set of findings that your team can act on. The architecture is tool-agnostic; what transfers is where to filter, what counts as evidence, and when to stop trusting the model.

The architecture produces consistent results when the model receives consistent instructions. Our companion post, Configuring your AI vulnerability harness, covers the steering file that encodes this methodology as machine-executable instructions, including the confidence formula, the infrastructure control multipliers, and the verification gates that help prevent hallucinated findings from reaching your engineers. The same model that produces rigorous, evidence-grounded assessments with well-crafted instructions can produce inflated severity ratings and fabricated attack chains without those instructions. Configuration is what turns capability into judgment.

The window between disclosure and exploitation is narrowing. Embedding automated detection into your development workflows helps your team keep pace. We built this pipeline through trial and error and are sharing it so you can skip some of the mistakes we made.

For more information about the services mentioned in this post, see the AWS Lambda, AWS WAF, and AWS CloudFormation documentation.

If you have feedback about this post, leave a comment in the Comments section below.


nidhi ramakant

Nidhi Ramakant

Nidhi is a Software Development Manager at AWS with two decades of experience in security and enterprise architecture. She’s obsessed with helping customers secure their environments and building creative solutions that make security decisions easier. She’s equally invested in developing the talent around her. Outside work, she’s either binging shows or vibe coding apps for secure local LLMs so her kids can explore and learn safely.

Ievgeniia Ieromenko

Ievgeniia Ieromenko

Ievgeniia is a Software Development Engineer at AWS, where she builds tooling and agentic AI systems designed to strengthen security posture without slowing delivery. Outside of work, she enjoys traveling, volunteering, and outdoor adventures with her very good dog, Pickle.

justin kontny

Justin Kontny

Justin is a Senior Software Engineer, Security, at AWS who blends a passion for software development with deep expertise in cloud security. He focuses on building agentic security solutions using AI-Driven Development Lifecycle (AIDLC) practices, transforming security from a barrier into a business enabler. Outside of work, Justin enjoys spending time with his children and staying active outdoors.

  •  
❌