❌

Reading view

FBI Probes Service Selling 153M+ Drivers Licenses

A new identity theft service launched on the dark web this week is selling digital scans of more than 153 million drivers licenses from people in the United States and Canada. Based on interviews with individuals whose licenses are available for purchase on this service, it appears to be siphoning images collected by a widely-used identity verification company based in Louisiana. KrebsOnSecurity also has learned that the New Orleans field office of the Federal Bureau of Investigation (FBI) today launched an official inquiry into the source of the images.

A record available at this identity theft service that includes the drivers license for U.S. Defense Secretary Pete Hegseth, one of several high-ranking U.S. government officials whose drivers licenses can be found for sale.

On Monday, Aug. 31, a source alerted KrebsOnSecurity to a service advertised by a new user on the Russian cybercrime forum Exploit, offering access to digital scans of identity documents on more than 170 million people in North America. The source brought it to my attention because the proprietor of this identity theft service offered my Virginia drivers license as a free sample in their initial sales thread on Exploit.

The service, dubbed Nexus, claims to have more than 153 million drivers licenses for people in the United States and Canada, as well as more than 10 million identification cards; more than three million travel documents and/or international IDs; and at least 579,000 medical cards.

A quick look around Nexus finds they are likely not exaggerating about that 153 million number: Running a blank search in Nexus (with no search parameters entered) returns approximately 11.5 million pages of results, with roughly 15 results displayed per page. It includes documents from people in both Canada and the United States, but the bulk of these records are on Americans: searching for just Canadian drivers licenses returns approximately 1.1 million results, with the largest concentration from Ontario (473,673 records).

Curiously, the identity records include not only drivers licenses but also marijuana dispensary cards. Some of the records list their β€œsource” as β€œCDL,” presumably short for β€œcommercial drivers license.” Other records carry the source notation of β€œCAC,” which may refer to Common Access Cards, government issued identity cards that grant physical access to government buildings and secure rooms.

The people behind Nexus claim the license images are coming from an active breach at β€œa major identity verification company” whose customers include multiple Fortune 500 companies.

The record totals listed by the Nexus identity theft service. The number of drivers license records increased by nearly 400,000 in the span of just 24 hours.

β€œWe have been continuously exfiltrating new data for over a year into our private database,” the service enthused in its introductory post on Exploit. β€œRecords are available to preview before purchase with pertinent information redacted. Customer photos are displayed if available.”

Indeed, over the past 24 hours, the number of drivers license records listed as available in Nexus has increased by nearly 400,000, suggesting that freshly stolen license data is being harvested and uploaded to this service on a semi-regular basis.

The record featuring my drivers license includes six image files: three pairs of photos of the license’s front and back, a basic image scan, as well as infrared and ultraviolet versions of the same images. A date and timestamp is appended to each image file, and the timestamp on my license scan corresponds to a date in June 2025 when I took a flight to the midwest United States to attend a family funeral.

Some of the 153 million+ license scans β€” including mine β€” feature six image files with date and timestamps appended to the filenames. Not all records include photos, and some that do feature photos do not display the associated filenames.

Intent on discovering the source of this data, KrebsOnSecurity asked more than a dozen friends and family members for permission to search for their licenses in this service. Each person whose license could be found (nine of them) confirmed having traveled on or very close to the dates in the timestamps attached to their images. It is unclear what timezone these timestamps are in, but from reviewing car rental records shared by several people who helped with this research, it appears the timezone is set to Greenwich Mean Time (GMT).

At first, I thought the source of the data might have something to do with airports. However, that theory went out the window when it became apparent there were no passports in this data set. Also, only some of those who helped with this research said they showed their drivers license at the airport on the day of their travel. One person whose license was in Nexus hadn’t flown at all recently, but was renting a car from Hertz for several months around the date of their timestamp.

Two of those who agreed to help are federal employees who said they shared other forms of government identification when passing through airport security. However, those individuals each said they shared their state-issued drivers licenses later that day when renting vehicles at their respective destinations, and that both rented their cars from Hertz.

After finding a note in my calendar for the day of my June 2025 flight reminding me to bring my passport, I remembered that I also never actually shared my drivers license when I went through security at Reagan National Airport on that day because I did not yet have a Real ID, a security-enhanced drivers license that is now required by the Transportation Security Administration (TSA) for all domestic travel. Instead, I showed the TSA agent my government-issued U.S. passport.

Here’s where it gets interesting: I was able to find my mother’s drivers license in this service as well, and the timestamps for her images are just a few seconds apart from mine. That’s notable because we both handed our licenses to the Hertz rental car representative at the same time.

According to my mom, the only place she gave her drivers license to that day was the rental car company, and if memory serves that is also true for me. I don’t recall if the rental car representative inserted our licenses into any kind of machine, but I remember they held onto them for several minutes behind the counter while we were signing various forms. KrebsOnSecurity sought comment from Hertz and will update this story in the event they reply.

Zach Edwards is a well-known security and privacy researcher who recently launched a service called DecryptAds to help people better understand how online advertisers are tracking them. A scan of Edwards’s drivers license is available for purchase on this identity theft service, and Edwards said the timestamp on his record corresponds to the middle of a trip last month to Las Vegas for the annual DEFCON security conference.

Edwards told KrebsOnSecurity that although he did not rent a car in Vegas, he did hand over his license at the TSA checkpoint, at a marijuana dispensary in Vegas, and at his hotel (the Aria). But he said the only one of those three that for sure scanned his ID in some kind of device was the dispensary.

To enter Planet13’s weed dispensary in Las Vegas, one must pass through a red telephone booth. Image: Zach Edwards.

Edwards said the dispensary he visited that day was Planet13, a multi-state chain with stores in California, Florida, Illinois and Nevada. In 2022, the New Orleans-based identity provider idscan.net published a press release announcing an exclusive identity verification agreement with Planet13’s dispensaries nationally. IDScan says it processes ID verification for more than 1,000 marijuana dispensaries in 19 U.S. states.

The β€œtrust” page of idscan.net states that the company provides identity verification services for numerous big brands, including Hertz, Target, Fedex, Motorola Solutions, the financial services giant Jack Henry, and Caesars Entertainment. And as idscan.net’s own documentation states, the technology scans IDs with both infrared and ultraviolet light. Idscan.net says the company’s systems and technology perform more than 21 million verifications monthly, at more than 20,000 locations around the world.

Image: idscan.net.

Contacted by KrebsOnSecurity, idscan.net said it was investigating the matter, but the company has not yet shared an official statement or a substantive reply to specific questions sent via email.

β€œAt this point I’m not able to share any additional information, but the updates you have provided have been welcome, and helpful to our team’s investigation,” wrote Jillian Kossman, a marketing and operations leader at idscan.net.

During the course of my research for this story, word got around to the FBI that I was poking at the apparent source of this new identity theft service’s data. Probably they were tipped off when I shared with a trusted source that Nexus also is selling the drivers license information for the assistant director of the FBI (I did not find FBI Director Kash Patel’s license in Nexus).

Earlier this afternoon, I was added to a conference call with a half-dozen FBI agents, including senior leaders from the agency’s cyber division. During that call, the FBI shared that earlier today their New Orleans field office opened an official investigation into an apparent breach involving idscan.net.

Edwards said that as more in-person and online experiences require sharing drivers licenses, vendors who collect this sensitive data need to be held to a higher standard.

β€œThis episode should further strengthen the resolve for people who are fighting back against online ID schemes which are requiring countless providers to ask for drivers licenses in order to access services under the guise of protecting kids,” Edwards told KrebsOnSecurity. β€œThese systems are putting sensitive data into more and more 3rd party vendors, and we don’t have nearly the oversight to ensure they are safe.”

Larry Baldwin is principal intelligence researcher at the cybersecurity firm Cybera. Baldwin said a front and back scan of his drivers license available at Nexus contains timestamps that correspond to the date of a car rental from Hertz on a recent vacation.

Baldwin said the Nexus identity theft service presents multiple serious security and privacy threats, noting that state-issued drivers licenses are commonly used as proof of one’s identity when opening new lines of credit. Baldwin said the service could also dangerously expose many people who do not wish to be found but who cannot meaningfully change their appearance (or at least not enough to fool today’s AI-based image matching tools).

This category of people, he said, includes those fleeing domestic violence, and even people who have been assigned a whole new life and identity as part of the federal government’s witness protection program, which is generally reserved for criminal defendants in racketeering and conspiracy investigations who agree to cooperate with federal authorities.

β€œJust when it seems like we’re making some headway in improving authentication controls through drivers license verification systems, this happens and the very thing those improvements are dependent on are compromised,” Baldwin said.

Update, Sept. 2, 6:05 p.m. ET: A spokesperson for Caesars Entertainment said Caesars has not been a client of IDScan.net and has not used VeriScan since February 2025, despite IDScan.net listing them as a client on their website. That person said Caesars had no active VeriScan accounts at the time of the incident and did not authorize IDScan.net to retain data from its accounts, and that IDScan.net said the incident should have no impact on Caesars Entertainment.

Update, 8:56 p.m. ET: Shortly after this story was published, the Nexus identity theft service website vanished from the darkweb, replacing its login page with a plain text message that reads, β€œThis service is no longer available.”

This is a potentially fast-moving story. Any changes or updates will be noted here along with a timestamp.

  •  

Who’s Tracking You? Use This New Service to Find Out

It can be daunting to determine who’s responsible for showing ads on the websites we visit, or who’s harvesting data from the mobile apps we use every day. That information is already semi-public, but it is not easily parsed and traditionally much of it has remained walled away in the hands of large advertising platforms. Not anymore: A powerful and free new service called DecryptAds scrapes and correlates this adtech data and makes it simple to quickly learn a great deal about the entities that are tracking you.

A Decryptads summary of the advertising partnerships declared by espn.com.

The newly launched decryptads.com says it is constantly scraping the files that websites and apps make publicly available to disclose the companies that are permitted to run ads or collect user data. These files include:

–ads.txt: all of the adtech companies and data brokers that may run ads or harvest data from the site;
–app-ads.txt: entities that can harvest data from or display ads on mobile and smart TV apps;
–buyers.json/sellers.json: the entities buying, selling or reselling ad inventory for a given site or app.

Zach Edwards is chief research officer for DecryptAds and a threat researcher at the security company Infoblox. Edwards said he and two other founders decided the service was needed because the adtech data in these files is generally only useful when it can be cross-referenced to build a more complete picture of the advertising ecosystem for each website or app.

β€œIt’s an adtech tool but we’re trying to approach adtech from a security perspective,” Edwards said. β€œIt’s really built for a lot of privacy and security use cases that have been dramatically underserved.”

Those use cases, he said, include tracking down the source of malicious ads that try to foist malware on targeted users, identifying ad networks located in adversarial nations, and detecting the fast growing swarms of AI-generated slop websites and apps. And as decryptads.com demonstrates, these potential security and privacy threats are near impossible to detect just by viewing a single apps.txt or app-ads.txt file.

β€œSupply-chain integrity issues rarely live in a single file,” the site explains. β€œThey show up as broken cross-references between ads.txt, app-ads.txt, and sellers.json files; as cloned declaration sets across unrelated domains; as seller removals that only make sense when viewed across exchanges; and even as supply paths in bid logs that never actually appear in any given publisher’s authorized-seller list.”

A search in DecryptAds for the hugely popular sports network espn.com reveals 143 ad partners and 19 registered data broker domains are listed within its ads.txt and app-ads.txt files. That data broker information is gradually becoming available because four states β€” California, Oregon, Texas and Vermont β€” have recently passed laws requiring data brokers to register if they buy or sell data on consumers from those states. DecryptAds reports that almost half of those data brokers are collecting geolocation data from espn.com visitors who aren’t blocking ads, while another three disclose that they collect device fingerprints and sensitive personal information.

A visual representation of the complex ad supply chain declared by espn.com. Image: decryptads.com.

HIGH-RISK AD PARTNERS

DecryptAds also makes it easy to learn the beneficiaries and national origins of the advertising firms lurking in apps and websites, displaying a conspicuous warning when adtech partners of an app or website are based in β€œgeo-risk” areas like China and Russia, or in countries with strong financial and political ties to both β€” such as Cyprus and the United Arab Emirates (UAE).

According to DecryptAds, espn.com works with four different advertising entities that are based in either Russia, China or the UAE, including the adtech firm Between Digital, which lists a New York address. However, the dossier on Between Digital flags them as a Russian firm, showing that their publisher offers (PDF) are processed through Alfa Bank, Russia’s largest private commercial bank and one of several financial institutions placed under U.S. sanctions in 2022 after Russia invaded Ukraine. KrebsOnSecurity sought comment from both Between Digital and the company’s founder, and will update this story in the event that either replies.

A search for several top U.S. military news websites β€” including armytimes.com, airforcetimes.com, defensenews.com, navytimes.com, marinecorpstimes.com and federaltimes.com β€” shows they all allow Between Digital to serve ads and track users, as well as two entities in the UAE and another in the ownership secrecy haven of Panama. DecryptAds reports that Between Digital is collecting ad data on approximately 55,000 partner websites.

The β€œGeo Risk” section of decryptads.com.

Pivoting on Between Digital’s app-ads.txt file reveals hundreds of domains featuring simple web-based games that are frequently interrupted by ads. Edwards said Between Digital’s own declarations show the company is listed as both a publisher and a reseller on approximately two-thirds of their portfolio.

β€œIt means they are basically playing both sides of the bidding equation, which creates opportunities to direct client spend at your owned and operated properties or client infrastructure, essentially creating opportunities for conflicts of interest,” Edwards told KrebsOnSecurity. β€œThe problem we have right now is that for years we’ve had almost no one policing these ads.txt and app-ads.txt files.”

The Opera Web browser remains quite popular, and probably many users are unaware that since 2016 it has been majority owned and controlled by the Chinese company Kunlun Tech (the operational headquarters of Opera remain in Oslo, Norway).

Opera.com’s profile at DecryptAds identifies 27 registered data brokers collecting information, including 15 adtech partners in the UAE, six in China, three in Cyprus, two in Russia and one each in Hong Kong and Ukraine. DecryptAds makes clear, however, that these companies represent just seven percent of the adtech partners specified in Opera.com’s ads.txt and app-ads.txt files.

LEGAL DOSSIERS

One feature of DecryptAds that sent this author down multiple hours-long research rabbit holes is its Legal Dossier lookup, which takes several minutes for each search but eventually churns out oodles of useful information about who owns a particular domain or app, when it was registered, and any aliases or relationships it may have to adtech companies and other websites or apps.

For example, last month KrebsOnSecurity wrote about researchers from Bitsight who found that an extremely popular line of TV streaming sticks called H96 quietly rent out each user’s Internet connection to strangers. Bitsight also discovered that when these devices aren’t being used to stream pirated video content, they are spoofing themselves as mobile phones clicking ads on AI-generated slop websites.

Bitsight concluded that the same Chinese companyΒ that made several of the malicious apps common to all of these H96 streaming sticks β€” the Fengwo Group β€” also also ran the network of ads and AI slop websites being clicked on by tens of thousands of these devices that are pretending to be mobile phones.

Examples of ad landing pages linked to the Fengwo Group. These sites were designed to show ads only to H96 devices that were spoofing their device type as mobile phones. Image: Bitsight.

A DecryptAds legal dossier on the (now dormant) Fengwo Group domain name for the AI slop website pictured on the left in the screenshot above (medicalbeautyhub dot com) shows it shares a seller ID (1674071) with a gaming website β€” giacoloredstones[.]com β€” which features yet another seller ID (103488000).

Pivoting on that latter seller ID reveals hundreds of active websites within Russia’s Yandex ad system featuring extremely low-quality games or simple utilities that pepper visitors with ads.

QUIET REMOVALS

Edwards said that when advertising networks suspect a given advertiser is engaged in unauthentic clicks or displaying malicious ads, very often those networks will quietly remove the offender from their list of approved partners without letting anyone else know about their suspicions.

This practice, he said, makes it easier for dodgy adtech firms to avoid accountability and continue victimizing others. To address that visibility gap, DecryptAds features a quiet removals feed that records and correlates all of the sellers.json removals across ad exchanges for the same seller domain or name.

A screenshot of the Quiet Removals Feed at decryptads.com.

β€œThe way the adtech industry works, someone will write a report about ad fraud and only share it with their own clients and they won’t make it public,” Edwards said. β€œThe ban is just removing them from the sellers.json file, but they told nobody. One day it was there, the next it was gone. So if you’re trying to navigate who is suspicious, that’s usually tough to do because there are a lot of adtech companies removing things all at once.”

MALVERTISING AND AI SLOP

Malvertising, the term given to the practice of inserting malicious ads that foist malware or redirect visitors to phishing pages, remains an all-too-frequent occurrence in the modern adtech industry. But Edwards said these malicious ads are far more commonly found now on newly generated AI slop websites than on high traffic destinations that typically employ a variety of technologies and third party tools to quickly flag bad ads.

β€œNone of these slop AI content farms are paying for that kind of protection,” he said. β€œThey’re just signing up the lowest quality partners, and it essentially becomes a greased rail to target the users of those sites with malicious ads. Most malvertising attacks don’t happen on espn.com or huffpost.com, but rather [on] some lower quality content farm and someone just went there because it came up in a search.”

Edwards said the AI slop websites are populated with machine-generated blog posts and images, and cover a wide array of themes from home improvement and decorating to food recipes, hunting, cars and consumer technology. He said organizations that get hit with malicious ads are often at a loss for what to do next, unaware that in most cases the answer is one of the entities listed inside the website’s ads.txt or app-ads.txt file.

β€œA lot of serious organizations are starting to understand that if we’re not breaking down this ad data, we’re not going to know who’s targeting government people with zero-click payloads on an almost daily basis,” he said.

Edwards maintains that truly getting a handle on the malvertising and AI slop problems will require more data-sharing by the major ad networks. Specifically, he says those platforms do not broadly share what’s known as the β€œsupply chain object” or SCO, structured data attached to each advertising bid request that lets buyers see every seller, reseller and intermediary involved in passing an ad impression from the publisher to the final buyer.

β€œThat SCO tells you who sold it or resold it, and who was the final entity that bought the impression that served that malware payload,” Edwards explained. β€œYou may see the malicious zero-click redirection, but without the supply chain object β€” which is only served server side β€” you won’t know who targeted your people with malware and won’t have a way to try and prevent it properly. But if we can encourage the adtech industry to expose that SCO, it will get easier to find the culprit behind any one bad ad.”

DecryptAds also offers an application programming interface (API) that allows researchers to automate queries and integrate the site’s functionality into popular AI platforms.

WHAT CAN YOU DO?

The only sane reaction to the examples described above is to block all online ads outright. This approach is broadly endorsed by security experts because it also makes it more difficult for adtech firms and data brokers to build detailed profiles on you and track your movements around the web and in the real world.

However, much depends on how you normally prefer to browse the Internet, and how much trust you place in third party browser plugins and extensions. For those primarily surfing via a regular desktop or laptop Web browser, uBlock Origin Lite is an excellent free and well-maintained open source option. uBlock Origin also should work with mobile browsers like Firefox, but apparently only on Android-based devices.

Adblock Plus is a decent option for iPhone and iPad users. For power users, Adblock and uBlock Origin both support custom blocking rules from easylist.to, which publishes a frequently updated list that removes most advertisements from webpages.

The well established browser extension NoScript blocks all non-approved Javascript code, and it generally does a fine job blocking most ads from loading. However, script blockers like NoScript may not be suitable for average users who don’t enjoy constantly having to referee which scripts should be allowed to load so that each site displays properly.

More technically inclined/adventuresome readers should strongly consider a hardware approach to blocking ads at the local network level, because that is easily the cheapest, most secure and scalable way to do it. A tiny, low-cost and broadly available computer known as a Raspberry Pi can be turned into a powerful ad blocker for all devices on a local network when fitted with a microSD memory card and a free program called Pi-hole. Once you’ve set it up properly and changed your router’s network settings to use the Pi-hole’s DNS sinkhole and DHCP servers, it should prevent ads from displaying on any devices connected to that network.

Bear in mind that ad blockers often do little to block ads and/or tracking that occurs from within mobile apps that users have chosen to install on their devices. Many websites now push users to install a mobile app, supposedly in order to more fully access and enjoy the site’s services and content. But in my experience, they’re not doing this because the user experience is somehow way better on the app (as LinkedIn tries to convince us non-app users several times a week via email). On the contrary, I find most mobile apps to be horribly designed, annoying, and/or completely unnecessary, and when given the option I will almost always choose to interact with a website or service directly in a Web browser.

No, the cold truth is that big web destinations tend to get pushy with their apps because they make it easier for these companies to keep you on their platforms longer and to collect (and in many cases resell) far more precise data about who, what and where their users are. Also, companies pushing customers the hardest to install mobile apps always seem to liberally opt everyone in to having their data used to train large language models these days. So be cautious about the apps you install on your mobile devices (including any smart TVs!), and poke around their listings at DecryptAds if you want to learn more about their privacy practices and any relationships they may have to adtech firms.

  •  

Canadian Man Pleads Guilty in Snowflake Extortions

A 26-year-old Canadian man once described as one of the most consequential cybercrime threat actors of 2024 has pleaded guilty to computer fraud and conspiracy to hack and extort more than 165 organizations that used the cloud provider Snowflake. Connor Riley Moucka, of Kitchener, Ontario, also admitted to stealing call and text history records of more than 100 million AT&T customers.

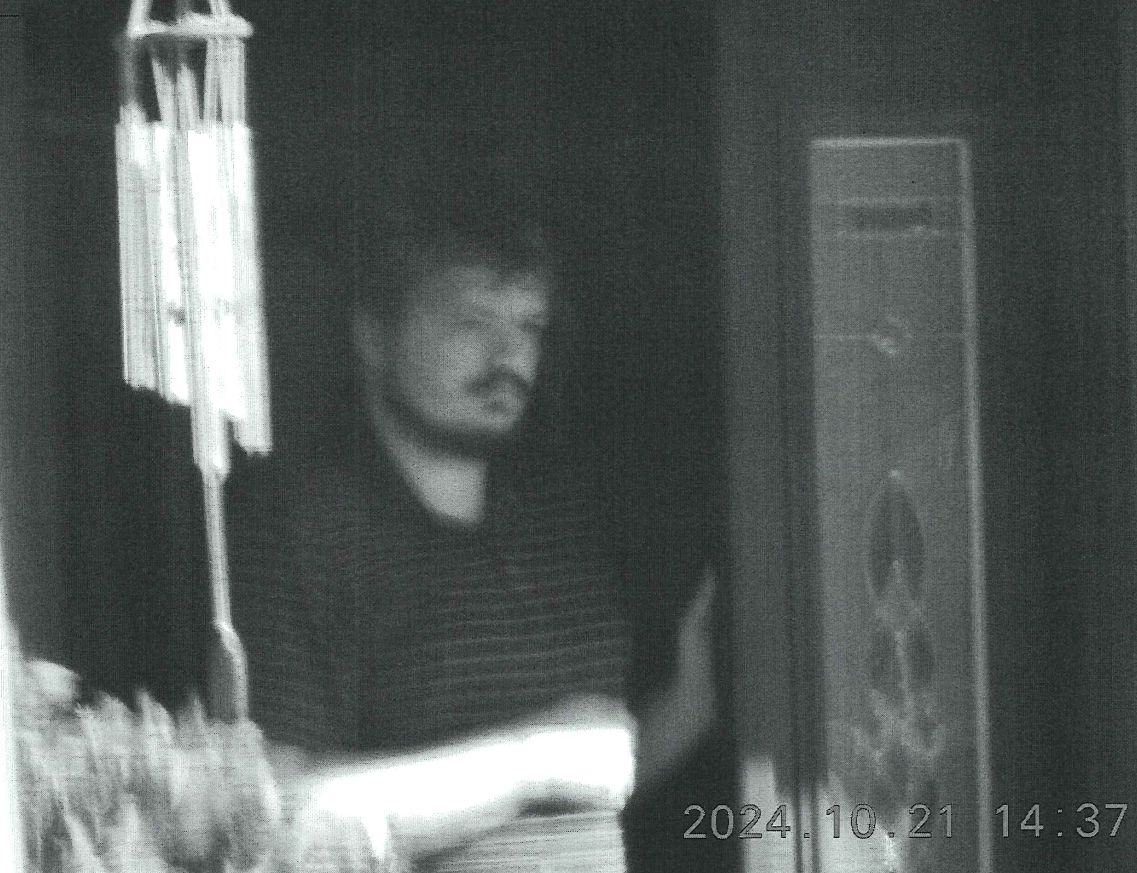
A surveillance photo of Connor Riley Moucka, a.k.a. β€œJudische” and β€œWaifu,” dated Oct 21, 2024, 9 days before Moucka’s arrest. This image was included in an affidavit filed by an investigator with the Royal Canadian Mounted Police (RCMP).

The U.S. Justice Department said between February and October 2024, Moucka and co-conspirators used stolen login credentials to steal cloud-hosted data belonging to at least 165 customers of a U.S.-based software-as-a-service company.

The hackers targeted stolen credentials for Snowflake customer accounts that did not enforce multi-factor authentication, and extorted or attempted to extort a host of well-known companies, including TicketMaster, Lending Tree, Advance Auto Parts and Neiman Marcus. Snowflake responded to the data thefts by increasing password complexity requirements and enforcing multi-factor authentication.

Moucka adopted new nicknames frequently β€” sometimes operating multiple identities concurrently β€” but two of his best-known monikers were β€œJudische” and β€œWaifu.” Judische’s admitted role in the Snowflake data thefts was first documented by KrebsOnSecurity in a September 2024 story about the overlap between Western, English-speaking cybercriminals and extremist groups that harass and extort minors into harming themselves or others.

That September 2024 story identified Judische as a software engineer from Ontario who has been involved in numerous data breaches and voice phishing attacks against U.S. companies since at least 2020. A little more than a month later, Canadian authorities arrested Moucka on a provisional warrant from the United States.

The government says Moucka and others used their unauthorized access to steal billions of sensitive customer records and download terabytes of information, β€œincluding individuals’ non-content call and text history records, banking and other financial information, payroll records, Drug Enforcement Administration (DEA) registration numbers, driver’s license numbers, passport numbers, social security numbers and other personally identifiable information. They then extorted victims by threatening to publish data online.”

Moucka also threatened and harassed government officials and security researchers who were helping to track him down. The Justice Department said the conspirators made over $2.5 million in ransom payments, and that in at least one instance, Moucka re-extorted a victim with threats of further disclosure of the victim’s stolen data.

β€œMoucka used the stolen data of a government officer and members of a then-former government officer’s immediate family in this re-extortion attempt,” reads a statement from the Justice Department.

One of Moucka’s admitted co-conspirators is Cameron β€œKiberphant0m” Wagenius, a U.S. Army soldier who pleaded guilty in July 2025 to extorting AT&T and Verizon for their customer account data. Less than a month before Wagenius’s arrest, KrebsOnSecurity publishedΒ a deep diveΒ into Kiberphant0m’s various Telegram and Discord identities over the years, revealing how the owner of the accounts told others they were in the Army and stationed in South Korea.

One of several selfies on the Facebook page of Cameron Wagenius.

Kiberphant0m also re-extorted victims. Immediately following Moucka’s arrest, Kiberphant0m posted on hacker forums what he claimed were the AT&T call logs for then President-elect Donald Trump and for then Vice President Kamala Harris, as well schematics allegedly stolen from the U.S. National Security Agency (NSA).

Wagenius is set to be sentenced on September 3, 2026. The government says he faces a maximum penalty of 20 years in prison for conspiracy to commit wire fraud, a maximum penalty of five years in prison for extortion in relation to computer fraud, and a mandatory two-year sentence consecutive to any other prison time for aggravated identity theft.

The third alleged co-conspirator is John Erin Binns, 26, an elusive American man who fled the United States after being indicted for his admitted role in a 2021 breach at T-Mobile that exposed the personal information of at least 76 million customers.

Sources close to the investigation said Binns, also known as β€œIRDev” and β€œIntelSecrets,” was until recently incarcerated in a Turkish prison, but that he has since been released and has resurfaced online. Those sources said Binns also recently obtained Turkish citizenship, and under Turkish law a citizen cannot be extradited to a foreign country.

An image of a passport that Binns shared in an email to KrebsOnSecurity in Feb. 2023.

Moucka pleaded guilty to four criminal counts, including computer fraud, wire fraud, aggravated identity theft, and conspiracy. He is slated to be sentenced on Oct. 27 and faces a mandatory minimum penalty of two years in prison on the aggravated identity theft count, as well as a maximum penalty of 30 years in prison on the remaining counts. Ultimately, it will be up the federal judge how much time Moucka actually serves for his extensive cybercriminal rap sheet.

For an interview with Moucka prior to his arrest and a deeper look at Binns, see our original report on Moucka’s arrest.

  •  

Arch Linux-userpackages worden tijdelijk niet geΓΌpdatet vanwege malwareaanval

De ontwikkelaars achter Arch Linux hebben dee mogelijkheid om packages in de Arch Linux User Repository de 'adopteren' en bij te werken tijdelijk uitgeschakeld vanwege een grootschalige malwareaanval. Het is de tweede aanval in korte tijd. De ontwikkelaars geven op dit moment nog weinig informatie over de aanval.
  •  

Threat landscape for industrial automation systems. Q1 2026

All threats

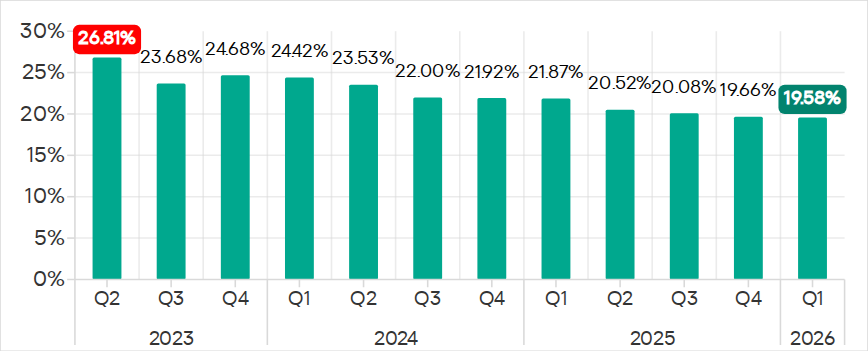
The percentage of ICS computers on which malicious objects were blocked continued to decrease, reaching 19.6% in Q1 2026. This is the lowest value in three years, and it is 1.4 times lower than in Q2 2023.

Percentage of ICS computers on which malicious objects were blocked, Q2 2023–Q1 2026

Percentage of ICS computers on which malicious objects were blocked, Q2 2023–Q1 2026

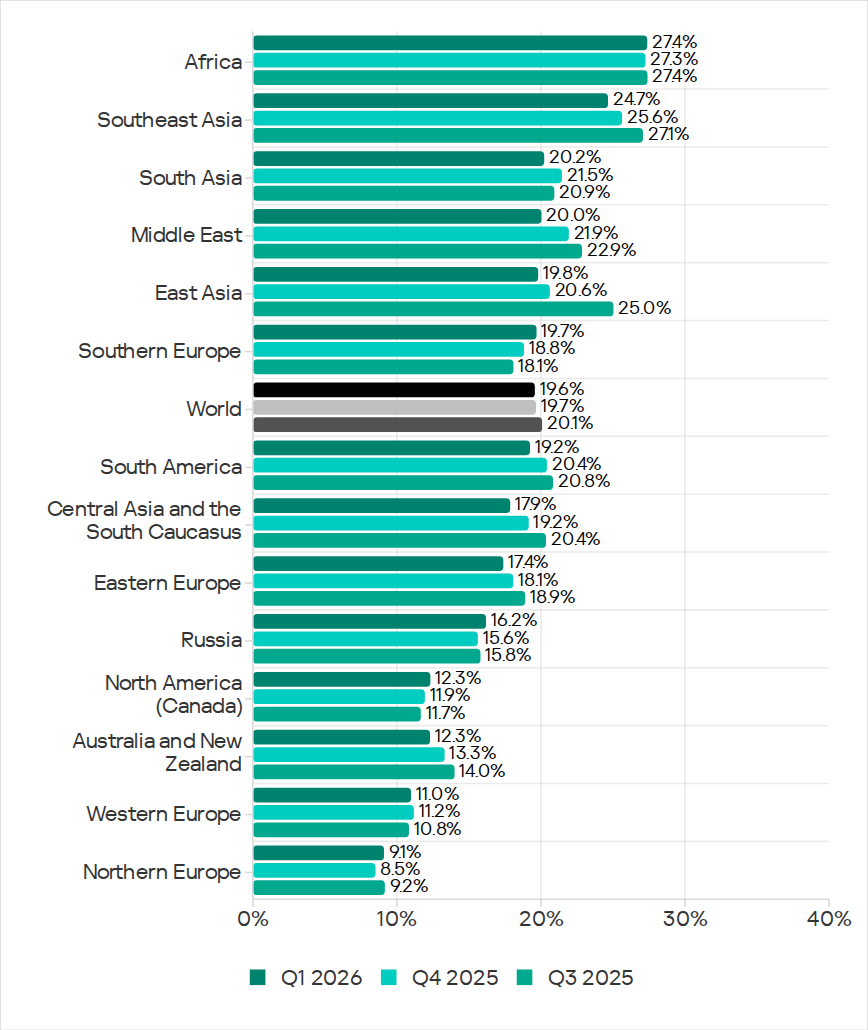
Regionally, the percentages ranged from 9.1% in Northern Europe to 27.4% in Africa.

Regions ranked by percentage of attacked ICS computers

Regions ranked by percentage of attacked ICS computers

The percentage of ICS computers on which malicious objects were blocked increased in five regions over the quarter, most notably in Southern Europe, Northern Europe, and Russia.

In Q1 2026, Southern Europe led the way in growth for internet and email threats. The region also saw the fastest growth in spyware, as well as malicious scripts and phishing pages.

In Russia, the percentage of ICS computers on which malicious objects were blocked exceeded the figures for the previous two quarters. Russia saw an increase in the percentage for threats from the internet, and a slight increase in the figure for threats from email clients (Russia is one of three regions where this figure did not decrease).

Among the threat categories, the greatest increases were observed in the percentages for denylisted internet resources, as well as spyware (distributed in the region via the internet and email clients).

Selected industries

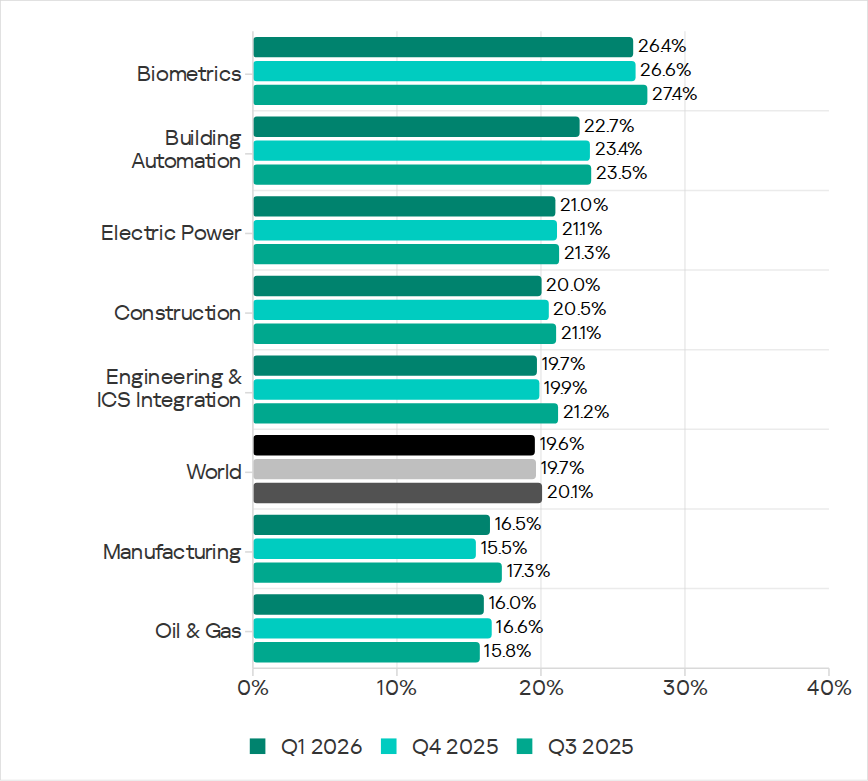
Biometric systems (26.4%) traditionally rank top among the industries and OT infrastructure types covered in this report in terms of the percentage of ICS computers on which malicious objects were blocked. These systems are characterized by internet access, extensive email use for data exchange and approvals (such as access granting), and, in many cases, minimal cybersecurity controls within the organizations that use these systems.

Industries ranked by the percentage of ICS computers on which malicious objects were blocked

Industries ranked by the percentage of ICS computers on which malicious objects were blocked

Biometric systems rank first among industries in terms of email threats. At the same time, unlike other industries, the percentage for email threats in biometric systems exceeds that for internet threats.

In all selected industries, the global average follows a downward trend. In Q1 2026, the percentage of ICS computers on which malicious objects were blocked increased only in the manufacturing sector β€” by 1.0 pp. The percentages for this industry increased across 10 regions, with the most notable increases in Western Europe, Northern Europe, and Russia.

Threat categories

In Q1 2026, Kaspersky security solutions blocked malware from 10,052 different malware families of various categories on industrial automation systems.

Over the quarter, the percentage of ICS computers on which denylisted internet resources were blocked increased (after decreasing over the previous two quarters), and there was a slight increase in the percentage for AutoCAD malware.

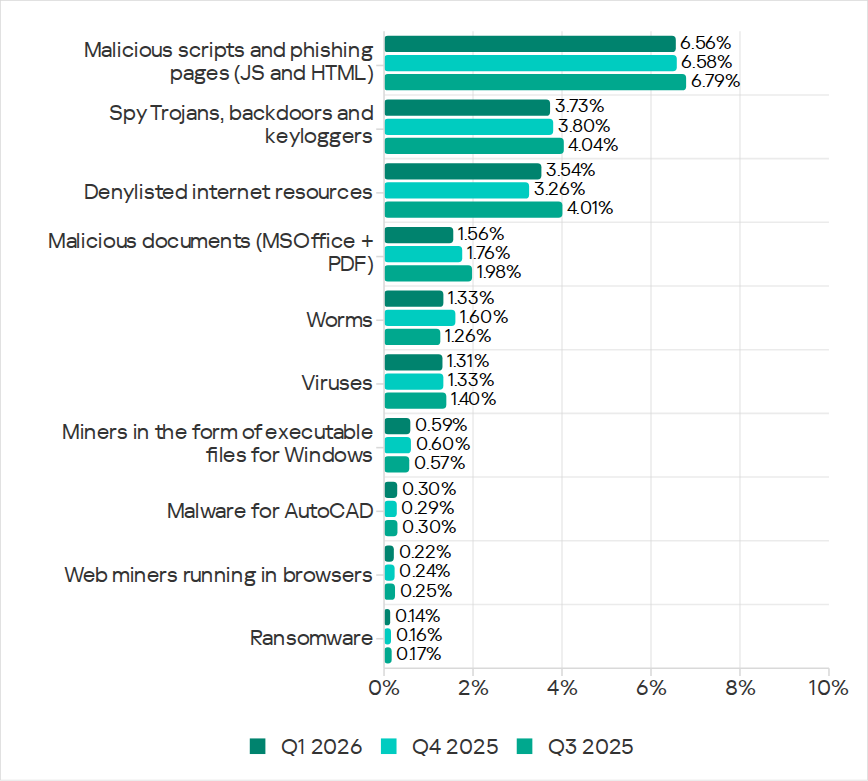
Percentage of ICS computers on which the activity of malicious objects from various categories was prevented

Percentage of ICS computers on which the activity of malicious objects from various categories was prevented

Malicious scripts and phishing pages (JS and HTML)

Malicious scripts and phishing pages retained their to spot among threat categories by the percentage of ICS computers on which these threats were blocked. The global average in Q1 2026 was 6.56%.

Over the quarter, the percentages increased in four regions. The most significant change was observed in Southern Europe (9.85%, +0.94 pp). The figures for malicious scripts in the region increased over three consecutive quarters.

Among the selected industries, across all regions, the highest percentages for the malicious scripts and phishing pages category were recorded for biometric systems (19.59%) and building automation (15.43%) in Southern Europe. These same industries lead in similar rankings for malicious documents and spyware.

Spyware

The percentage of ICS computers on which spyware was blocked decreased over two consecutive quarters, dropping to 3.73%. Despite the decline, spyware has ranked second among threat categories by the percentage of attacked computers for three consecutive quarters.

The percentages increased in five regions over the quarter, most notably in Southern Europe (5.46%, +0.35 pp) and Russia (2.84%, +0.24 pp).

In Southern Europe, the percentage of ICS computers on which spyware was blocked increased in all the selected industries except manufacturing. The greatest increase was observed in biometric systems.

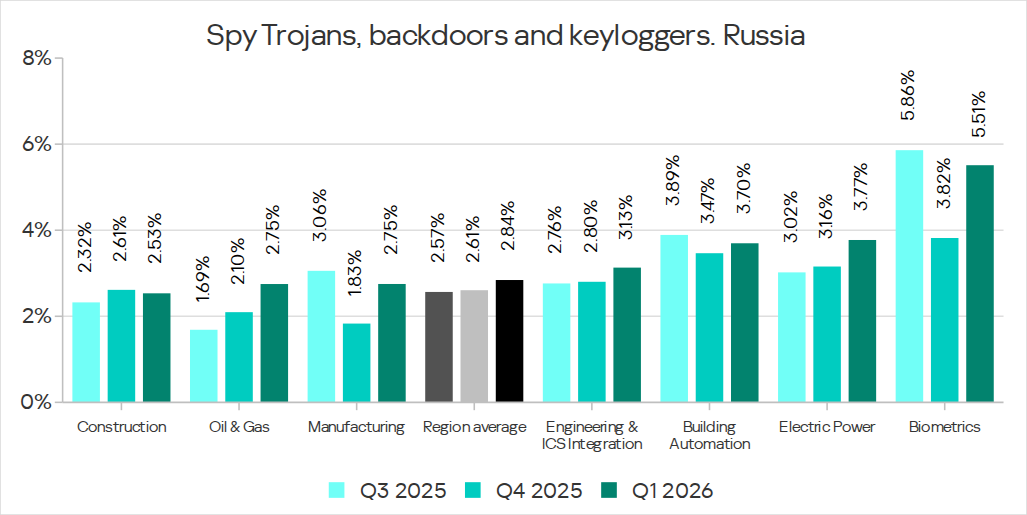
Among the selected industries, the highest percentage of spyware in Russia was recorded in biometric systems. That said, the percentage of ICS computers on which spyware was blocked increased in all industries in the region except construction. The percentage figure has been increasing for two consecutive quarters in the oil and gas industry (by a factor of 1.63 over six months), and for three consecutive quarters in engineering and ICS integration, as well as electric power. In the remaining sectors, the values have been fluctuating.

Percentage of ICS computers on which spyware was blocked in various industries in Russia, Q3 2025–Q1 2026

Percentage of ICS computers on which spyware was blocked in various industries in Russia, Q3 2025–Q1 2026

Denylisted internet resources

The percentage of ICS computers on which denylisted internet resources were blocked increased to 3.54%.

The most notable increase over the quarter occurred in Southeast Asia (4.58%, +0.65 pp). Among the industries in the region, the highest percentage figures for this threat category were recorded in electric power and construction. Over the quarter, the largest increases in percentages figures were observed in the electric power and manufacturing industries.

In North America (Canada), denylisted internet resources (2.14%) showed the greatest increase among all categories β€” by a factor of 1.22.

Among the selected industries across all regions, the highest percentage figures for the denylisted internet resources category were in the electric power (7.11%) and construction (6.25%) industries in Southeast Asia.

Malicious documents (Microsoft Office + PDF)

The percentage figure for this category decreased over two consecutive quarters, reaching its lowest value (1.56%) for the entire period of observations in Q1 2026. It increased just in two regions: Australia and New Zealand (1.12%, +0.04 pp), and Russia (0.62%, +0.01 pp).

Among the selected industries across all regions, the highest percentages for malicious documents were recorded for biometric systems (9.02%) and building automation (6.97%) in Southern Europe. These same industries also lead in similar rankings for malicious scripts and spyware.

Ransomware

The percentage of ICS computers on which ransomware was blocked has decreased for two consecutive quarters, dropping to 0.14%. This is the lowest value among all categories.

The percentage increased in two regions: North America (Canada) (0.11%, +0.04 pp) and slightly in Northern Europe (0.06%, +0.01 pp).

Among the selected industries across all regions, the highest percentages for ransomware were recorded in the oil and gas and manufacturing industries (0.92% and 0.65%, respectively) in Central Asia and the South Caucasus, and in biometric systems (0.89%) in Russia.

Miners in the form of executable files for Windows

The percentage of ICS computers on which miners in the form of executable files for Windows were blocked decreased to 0.59%.

The percentage increased in seven regions. The largest increase was observed in Africa (0.63%, +0.16 pp). Among the selected industries, the largest increases in the region were in the manufacturing and oil and gas industries.

Among the selected industries across all regions, the highest percentages for miners in the form of executable files were recorded in construction (1.99%), biometric systems (1.98%), and the oil and gas industry (1.97%) in Central Asia and the South Caucasus.

Web miners

The percentage of ICS computers on which web miners were blocked has been declining for a year, and in Q1 2026, it reached the lowest value for the entire period under review (0.22%).

At the same time, the percentage increased in seven regions. The largest increases were observed in South Asia (0.28%, +0.11 pp), the Middle East (0.31%, +0.09 pp), and Africa (0.34%, +0.08 pp). Despite the increases, the percentages in these regions for Q1 2026 did not exceed those observed in 2023–2024 and in Q1 2025.

Among the selected industries across all regions, the highest percentages for web miners were recorded for biometric systems (0.97%) in Russia. Biometric systems in South Asia (0.79%) ranked second, and the electric power sector in Southeast Asia (0.76%) ranked third.

Worms

The percentage of ICS computers on which worms were blocked decreased to 1.33%.

The percentage decreased across all regions following an increase in the previous quarter (due to a wave of phishing attacks that distributed the Backdoor.MSIL.XWorm backdoor worm across all regions of the world).

Among the selected industries across all regions, the highest percentage figure for worms was recorded for biometric systems (4.80%) in Central Asia and the South Caucasus. Two industries in Africa – biometric systems (4.04%) and electric power (3.53%) – took the second and third spots, respectively.

Viruses

The percentage of ICS computers on which viruses were blocked decreased to 1.31%.

The top 3 regions by this figure remained the same: Southeast Asia (6.11%, first by a wide margin), Africa (4.15%), and East Asia (2.97%). These same regions are also among the leaders by the percentage of systems affected by AutoCAD malware. The largest increase in this figure was observed in Africa (+0.41 pp).

Among the selected industries across all regions, the highest percentages for viruses were recorded in the construction industry (6.35%) and building automation (5.50%) in Southeast Asia.

Malware for AutoCAD

The percentage of ICS computers on which malware for AutoCAD was blocked increased to 0.30%.

The most notable increase over the quarter was observed in Africa, with the region’s percentage figure rising by 0.47 pp, a very significant increase for this category, and almost doubling (to 0.91%).

Among the selected industries across all regions, the highest percentages for AutoCAD malware were recorded in the construction industry in East Asia (5.58%) and Southeast Asia (3.87%).

Main threat sources

In Q1 2026, the average percentages across all threat sources, except threats from the internet, decreased globally.

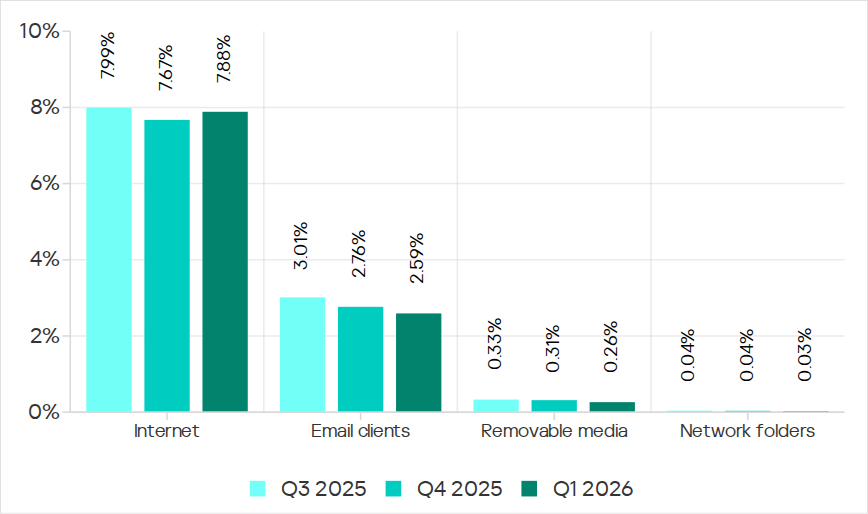
Percentage of ICS computers on which malicious objects from various sources were blocked

Percentage of ICS computers on which malicious objects from various sources were blocked

Internet

The percentage of ICS computers on which threats from the internet were blocked increased to 7.88%. However, over the past three years, the percentage figure for internet threats has followed a downward trend.

The largest increases in the percentages were recorded in Southern Europe (8.59%, +0.59 pp), Southeast Asia (10.16%, +0.55 pp), and Northern Europe (4.47%, +0.51 pp).

Among the selected industries across all regions, the highest percentages for threats from the internet were recorded in electric power (13.16%) and construction (12.55%) in Southeast Asia, and in the engineering and ICS integration sector (12.33%) in South Asia.

Email clients

The percentage of ICS computers on which threats delivered via email clients were blocked decreased to 2.59%. This is a three-year low.

The percentage of this threat source increased in three regions: Southern Europe (6.54%, +0.2 pp), East Asia (1.5%, +0.09 pp), and slightly in Russia (0.7%, +0.04 pp).

Among the selected industries across all regions, the highest percentages for email threats were recorded for biometric systems (19.78%) and building automation (12.34%) in Southern Europe. In these two industries, the percentage of ICS computers on which email threats are blocked is higher than the percentage for threats from the internet. A similar situation was observed in two other instances, both in biometric systems (in South America and Southeast Asia).

Removable media

The percentage of ICS computers on which threats were detected when connecting removable media continued to decrease, reaching its lowest value for the period under review (0.26%).

Among the selected industries across all regions, the highest percentages for removable media threats blocked on ICS computers were observed in the electric power sector in Central Asia and the South Caucasus (1.45%), East Asia (1.34%), and Africa (1.16%).

Network folders

The percentage of ICS computers on which threats are blocked in network folders is steadily decreasing. In Q1 2026, it was the lowest for the period under review (0.029%).

East Asia has traditionally led by a wide margin. The percentage for East Asia (0.135%) is 27 times higher than the lowest regional value (recorded in Northern Europe).

The largest increases in the percentages for threats from network folders were observed in Africa (0.037%, +0.006 pp) and South America (0.013%, +0.006 pp).
Among the selected industries across all regions, the construction industry in East Asia, at 0.36%, holds the top positions in the ranking by the percentage of ICS computers on which threats are blocked in network folders.

For more information on industrial threats see the full version of the report.

  •  

Threat landscape for industrial automation systems. Q1 2026

All threats

The percentage of ICS computers on which malicious objects were blocked continued to decrease, reaching 19.6% in Q1 2026. This is the lowest value in three years, and it is 1.4 times lower than in Q2 2023.

Percentage of ICS computers on which malicious objects were blocked, Q2 2023–Q1 2026

Percentage of ICS computers on which malicious objects were blocked, Q2 2023–Q1 2026

Regionally, the percentages ranged from 9.1% in Northern Europe to 27.4% in Africa.

Regions ranked by percentage of attacked ICS computers

Regions ranked by percentage of attacked ICS computers

The percentage of ICS computers on which malicious objects were blocked increased in five regions over the quarter, most notably in Southern Europe, Northern Europe, and Russia.

In Q1 2026, Southern Europe led the way in growth for internet and email threats. The region also saw the fastest growth in spyware, as well as malicious scripts and phishing pages.

In Russia, the percentage of ICS computers on which malicious objects were blocked exceeded the figures for the previous two quarters. Russia saw an increase in the percentage for threats from the internet, and a slight increase in the figure for threats from email clients (Russia is one of three regions where this figure did not decrease).

Among the threat categories, the greatest increases were observed in the percentages for denylisted internet resources, as well as spyware (distributed in the region via the internet and email clients).

Selected industries

Biometric systems (26.4%) traditionally rank top among the industries and OT infrastructure types covered in this report in terms of the percentage of ICS computers on which malicious objects were blocked. These systems are characterized by internet access, extensive email use for data exchange and approvals (such as access granting), and, in many cases, minimal cybersecurity controls within the organizations that use these systems.

Industries ranked by the percentage of ICS computers on which malicious objects were blocked

Industries ranked by the percentage of ICS computers on which malicious objects were blocked

Biometric systems rank first among industries in terms of email threats. At the same time, unlike other industries, the percentage for email threats in biometric systems exceeds that for internet threats.

In all selected industries, the global average follows a downward trend. In Q1 2026, the percentage of ICS computers on which malicious objects were blocked increased only in the manufacturing sector β€” by 1.0 pp. The percentages for this industry increased across 10 regions, with the most notable increases in Western Europe, Northern Europe, and Russia.

Threat categories

In Q1 2026, Kaspersky security solutions blocked malware from 10,052 different malware families of various categories on industrial automation systems.

Over the quarter, the percentage of ICS computers on which denylisted internet resources were blocked increased (after decreasing over the previous two quarters), and there was a slight increase in the percentage for AutoCAD malware.

Percentage of ICS computers on which the activity of malicious objects from various categories was prevented

Percentage of ICS computers on which the activity of malicious objects from various categories was prevented

Malicious scripts and phishing pages (JS and HTML)

Malicious scripts and phishing pages retained their to spot among threat categories by the percentage of ICS computers on which these threats were blocked. The global average in Q1 2026 was 6.56%.

Over the quarter, the percentages increased in four regions. The most significant change was observed in Southern Europe (9.85%, +0.94 pp). The figures for malicious scripts in the region increased over three consecutive quarters.

Among the selected industries, across all regions, the highest percentages for the malicious scripts and phishing pages category were recorded for biometric systems (19.59%) and building automation (15.43%) in Southern Europe. These same industries lead in similar rankings for malicious documents and spyware.

Spyware

The percentage of ICS computers on which spyware was blocked decreased over two consecutive quarters, dropping to 3.73%. Despite the decline, spyware has ranked second among threat categories by the percentage of attacked computers for three consecutive quarters.

The percentages increased in five regions over the quarter, most notably in Southern Europe (5.46%, +0.35 pp) and Russia (2.84%, +0.24 pp).

In Southern Europe, the percentage of ICS computers on which spyware was blocked increased in all the selected industries except manufacturing. The greatest increase was observed in biometric systems.

Among the selected industries, the highest percentage of spyware in Russia was recorded in biometric systems. That said, the percentage of ICS computers on which spyware was blocked increased in all industries in the region except construction. The percentage figure has been increasing for two consecutive quarters in the oil and gas industry (by a factor of 1.63 over six months), and for three consecutive quarters in engineering and ICS integration, as well as electric power. In the remaining sectors, the values have been fluctuating.

Percentage of ICS computers on which spyware was blocked in various industries in Russia, Q3 2025–Q1 2026

Percentage of ICS computers on which spyware was blocked in various industries in Russia, Q3 2025–Q1 2026

Denylisted internet resources

The percentage of ICS computers on which denylisted internet resources were blocked increased to 3.54%.

The most notable increase over the quarter occurred in Southeast Asia (4.58%, +0.65 pp). Among the industries in the region, the highest percentage figures for this threat category were recorded in electric power and construction. Over the quarter, the largest increases in percentages figures were observed in the electric power and manufacturing industries.

In North America (Canada), denylisted internet resources (2.14%) showed the greatest increase among all categories β€” by a factor of 1.22.

Among the selected industries across all regions, the highest percentage figures for the denylisted internet resources category were in the electric power (7.11%) and construction (6.25%) industries in Southeast Asia.

Malicious documents (Microsoft Office + PDF)

The percentage figure for this category decreased over two consecutive quarters, reaching its lowest value (1.56%) for the entire period of observations in Q1 2026. It increased just in two regions: Australia and New Zealand (1.12%, +0.04 pp), and Russia (0.62%, +0.01 pp).

Among the selected industries across all regions, the highest percentages for malicious documents were recorded for biometric systems (9.02%) and building automation (6.97%) in Southern Europe. These same industries also lead in similar rankings for malicious scripts and spyware.

Ransomware

The percentage of ICS computers on which ransomware was blocked has decreased for two consecutive quarters, dropping to 0.14%. This is the lowest value among all categories.

The percentage increased in two regions: North America (Canada) (0.11%, +0.04 pp) and slightly in Northern Europe (0.06%, +0.01 pp).

Among the selected industries across all regions, the highest percentages for ransomware were recorded in the oil and gas and manufacturing industries (0.92% and 0.65%, respectively) in Central Asia and the South Caucasus, and in biometric systems (0.89%) in Russia.

Miners in the form of executable files for Windows

The percentage of ICS computers on which miners in the form of executable files for Windows were blocked decreased to 0.59%.

The percentage increased in seven regions. The largest increase was observed in Africa (0.63%, +0.16 pp). Among the selected industries, the largest increases in the region were in the manufacturing and oil and gas industries.

Among the selected industries across all regions, the highest percentages for miners in the form of executable files were recorded in construction (1.99%), biometric systems (1.98%), and the oil and gas industry (1.97%) in Central Asia and the South Caucasus.

Web miners

The percentage of ICS computers on which web miners were blocked has been declining for a year, and in Q1 2026, it reached the lowest value for the entire period under review (0.22%).

At the same time, the percentage increased in seven regions. The largest increases were observed in South Asia (0.28%, +0.11 pp), the Middle East (0.31%, +0.09 pp), and Africa (0.34%, +0.08 pp). Despite the increases, the percentages in these regions for Q1 2026 did not exceed those observed in 2023–2024 and in Q1 2025.

Among the selected industries across all regions, the highest percentages for web miners were recorded for biometric systems (0.97%) in Russia. Biometric systems in South Asia (0.79%) ranked second, and the electric power sector in Southeast Asia (0.76%) ranked third.

Worms

The percentage of ICS computers on which worms were blocked decreased to 1.33%.

The percentage decreased across all regions following an increase in the previous quarter (due to a wave of phishing attacks that distributed the Backdoor.MSIL.XWorm backdoor worm across all regions of the world).

Among the selected industries across all regions, the highest percentage figure for worms was recorded for biometric systems (4.80%) in Central Asia and the South Caucasus. Two industries in Africa – biometric systems (4.04%) and electric power (3.53%) – took the second and third spots, respectively.

Viruses

The percentage of ICS computers on which viruses were blocked decreased to 1.31%.

The top 3 regions by this figure remained the same: Southeast Asia (6.11%, first by a wide margin), Africa (4.15%), and East Asia (2.97%). These same regions are also among the leaders by the percentage of systems affected by AutoCAD malware. The largest increase in this figure was observed in Africa (+0.41 pp).

Among the selected industries across all regions, the highest percentages for viruses were recorded in the construction industry (6.35%) and building automation (5.50%) in Southeast Asia.

Malware for AutoCAD

The percentage of ICS computers on which malware for AutoCAD was blocked increased to 0.30%.

The most notable increase over the quarter was observed in Africa, with the region’s percentage figure rising by 0.47 pp, a very significant increase for this category, and almost doubling (to 0.91%).

Among the selected industries across all regions, the highest percentages for AutoCAD malware were recorded in the construction industry in East Asia (5.58%) and Southeast Asia (3.87%).

Main threat sources

In Q1 2026, the average percentages across all threat sources, except threats from the internet, decreased globally.

Percentage of ICS computers on which malicious objects from various sources were blocked

Percentage of ICS computers on which malicious objects from various sources were blocked

Internet

The percentage of ICS computers on which threats from the internet were blocked increased to 7.88%. However, over the past three years, the percentage figure for internet threats has followed a downward trend.

The largest increases in the percentages were recorded in Southern Europe (8.59%, +0.59 pp), Southeast Asia (10.16%, +0.55 pp), and Northern Europe (4.47%, +0.51 pp).

Among the selected industries across all regions, the highest percentages for threats from the internet were recorded in electric power (13.16%) and construction (12.55%) in Southeast Asia, and in the engineering and ICS integration sector (12.33%) in South Asia.

Email clients

The percentage of ICS computers on which threats delivered via email clients were blocked decreased to 2.59%. This is a three-year low.

The percentage of this threat source increased in three regions: Southern Europe (6.54%, +0.2 pp), East Asia (1.5%, +0.09 pp), and slightly in Russia (0.7%, +0.04 pp).

Among the selected industries across all regions, the highest percentages for email threats were recorded for biometric systems (19.78%) and building automation (12.34%) in Southern Europe. In these two industries, the percentage of ICS computers on which email threats are blocked is higher than the percentage for threats from the internet. A similar situation was observed in two other instances, both in biometric systems (in South America and Southeast Asia).

Removable media

The percentage of ICS computers on which threats were detected when connecting removable media continued to decrease, reaching its lowest value for the period under review (0.26%).

Among the selected industries across all regions, the highest percentages for removable media threats blocked on ICS computers were observed in the electric power sector in Central Asia and the South Caucasus (1.45%), East Asia (1.34%), and Africa (1.16%).

Network folders

The percentage of ICS computers on which threats are blocked in network folders is steadily decreasing. In Q1 2026, it was the lowest for the period under review (0.029%).

East Asia has traditionally led by a wide margin. The percentage for East Asia (0.135%) is 27 times higher than the lowest regional value (recorded in Northern Europe).

The largest increases in the percentages for threats from network folders were observed in Africa (0.037%, +0.006 pp) and South America (0.013%, +0.006 pp).
Among the selected industries across all regions, the construction industry in East Asia, at 0.36%, holds the top positions in the ranking by the percentage of ICS computers on which threats are blocked in network folders.

For more information on industrial threats see the full version of the report.

  •  

Windows krijgt 416 bugfixes in grootste Patch Tuesday-ronde ooit

Microsoft repareert het hoogste aantal kwetsbaarheden ooit tijdens zijn maandelijkse Patch Tuesday-updateronde. Het lost niet minder dan 602 bugs op, waarvan 416 alleen al in Windows. Microsoft gaf eerder aan dat AI het bedrijf helpt om meer bugs te vinden. Die voorspelling lijkt nu uit te komen, hoewel het bedrijf AI nu niet noemt.
  •  

Remus Stealer: A New, Not-So-New Infostealer

Blogs

Blog

Remus Stealer: A New, Not-So-New Infostealer

In this post, we explore the emergence of Remus Stealer, analyzing its structural and behavioral similarities to the infamous Lumma malware.

SHARE THIS:

The underground marketplace rarely stays quiet for long. A new information-stealing malware dubbed Remus Stealer has surfaced in the cybercrime underground, exhibiting significant similarities to the notorious Lumma malware family across its administration panel, stolen log files, and core code structure.

Despite parallels in its code and functionality, threat actors are eagerly buying into the platform. In addition to its familiar features, it provides attackers with a distinct, modern command and control (C2) and networking infrastructure designed to slip past current security perimeters.

What We Know About Remus

Flashpoint first observed Remus appearing for sale within illicit communities in March 2026. The malware listing offers similar functionality to other popular Malware-as-a-Service (MaaS) offerings, including Google OAuth cookie restoration and Telegram channel integration for logs.

Much like the Lumma malware family, the Remus subscription service operates on a three-tiered access model:

  • Basic: US$250
  • Pro: US$500
  • Enterprise: US$1,000

At this time, Remus has no additional channels or automated bots associated with its sale or distribution. Despite undeniable similarities to Lumma, its developer claims to not be a rebrand of the Lumma project.

Since March 2026, Remus has continued its operations mostly unhindered by negative associations associated with Lummaβ€”particularly the doxxing of its panel in August 2025.

Similarities to Lumma

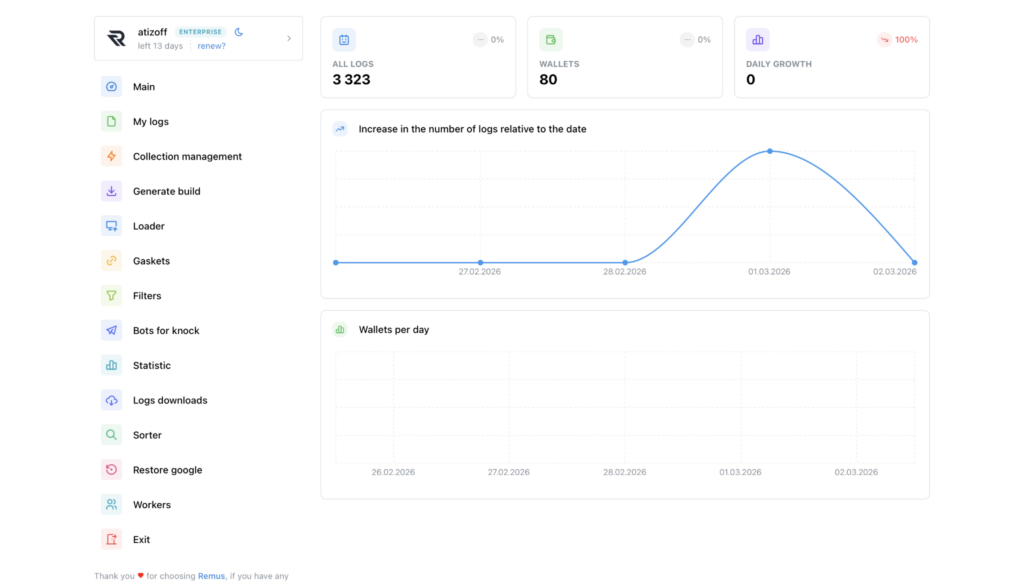
Similarities can be observed in the Remus and Lumma panels in both aesthetics and functionality. Both panels use similar assets for tab icons and have embedded advertisements for other illicit services such as packers and log clouds. Harvested logs also share extremely similar directory structures in log files, including unique identifiers.

Remus Stealer panel (Source: Flashpoint Collections)

Code-Level Overlaps

Remus is a 64-bit compiled binary, and Lumma was a 32-bit binary. However, major similarities between the code bases of both malware can be observed.

Upon execution of an unpacked sample, both Remus and Lumma will send warning messages to the user that the build is unpacked. This was a unique phenomenon first established by Lumma several years ago. In both Remus and Lumma samples, the pack check and window message are performed before the main functionality of the malware.

In both Remus and Lumma, a function is used first to check if the sample is packed, and a second function is used to send the window error message.

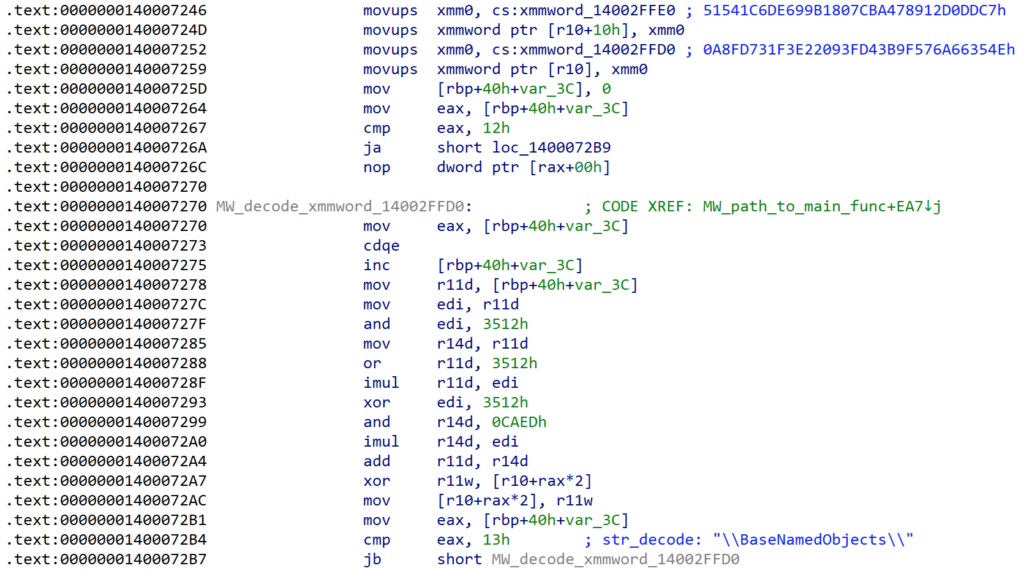
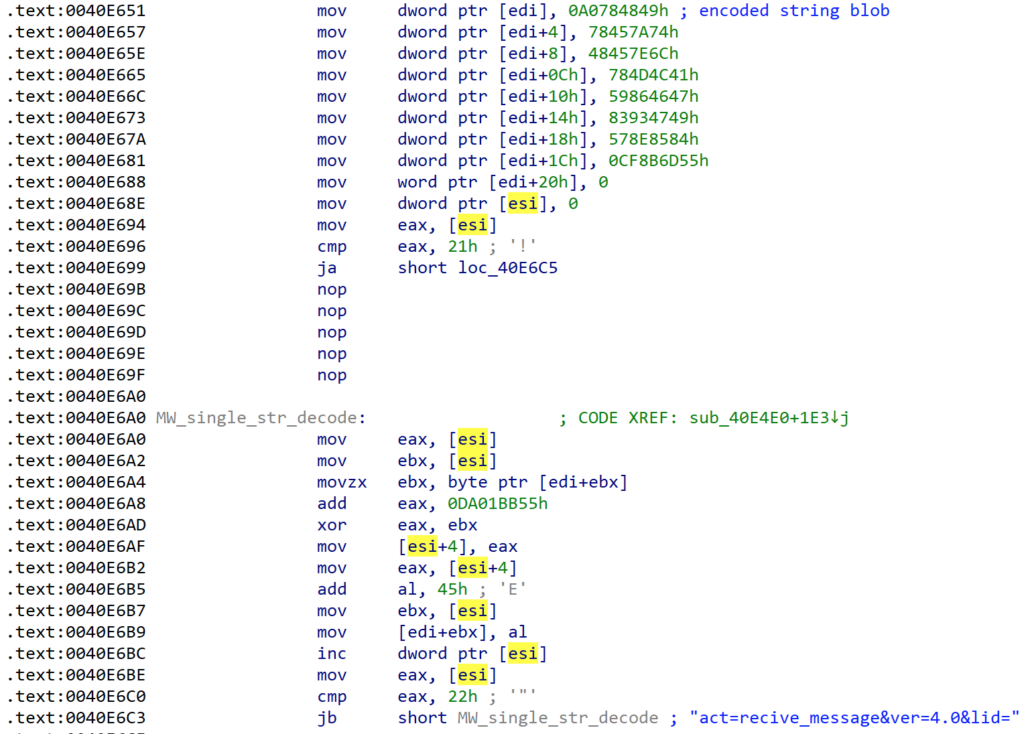
Remus uses similar string obfuscation methods to Lumma, in which each string has been uniquely encoded and then decoded during runtime. Deobfuscation occurs by looping byte by byte through encoded blobs. Each encoded string is obfuscated by a unique pattern. This can be seen in the code samples below:

Remus inline string deobfuscation (Source: Flashpoint)
Lumma inline string deobfuscation. (Source: Flashpoint)

Of note, both samples have at least one NOP instruction between the encoded blob being moved onto the stack and the deobfuscation loop.

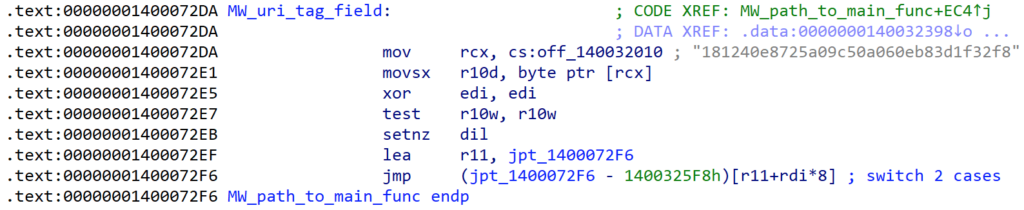
Another unique feature of Lumma is the presence of a plaintext identifier string used to link customers to specific build generations. In Lumma, this string was referred to as the LID (Lumma ID), and this ID method appears in Remus as well as a β€œtag.”

Lumma ID (Source: Flashpoint)
Remus tag (Source: Flashpoint)

Like the Lumma LID string, the Remus tag could be leveraged to attribute variant builds and campaigns to single threat actors or groups.

Additionally, both Remus and Lumma exhibit similar control flow obfuscation by replacing direct jumps with indirect jumps read from offsets that have been moved onto the stack, jumps computed from a jump table, and jumps resolved by a pointer.

Differentiators of Remus

Although Remus bears remarkable similarities to Lumma, its main differences lie in its C2 beaconing.

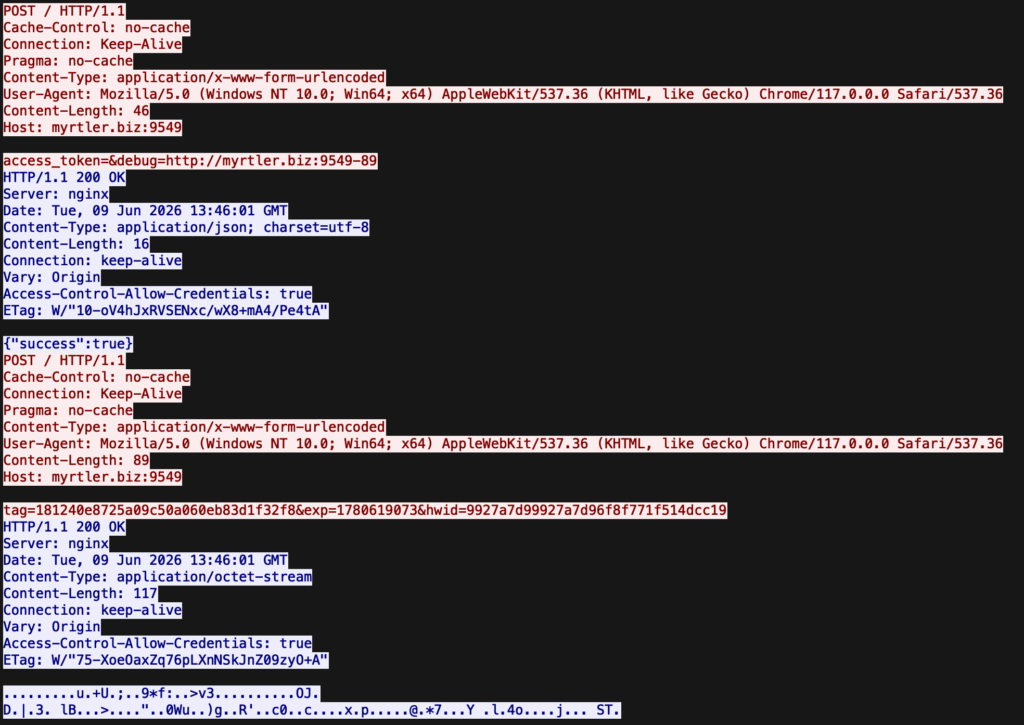
Before performing main stealer functionality, Remus will beacon out to its C2 infrastructure. It will attempt to resolve several domain:port combinations via POST requests, and attempt a final connection to find the C2 server using EtherHiding. If it is unable to connect, the malware will terminate.

After a connection is established, the stealer sends a POST request to the C2 in order to receive an access token. Once received and decoded, this access token is used to receive encrypted config data used by Remus to target assets on the victim system. Data collected for logs is then exfiltrated as encrypted POST data.

Network traffic from Remus sample (Source: Flashpoint)

Protect Against Infostealers Using Flashpoint

Remus stealer represents a sophisticated continuation of the MaaS infostealer model left behind by Lumma’s collapse. While the developer asserts independence, the overwhelming code overlaps, matching obfuscation techniques, and administrative panels indicate that Remus is either heavily inspired by, or derived from the Lumma codebase. These traits have allowed it to thrive, providing threat actors with a familiar, robust alternative that sidesteps the reputational baggage and law enforcement scrutiny of its predecessors.

Flashpoint continuously tracks the latest developments in illicit communities, hard-to-reach adversary spaces, and malware repositories to identify emerging threats. Request a demo to learn how Flashpoint’s primary source collections and analyst insights empowers your security teams.

See Flashpoint in Action

The post Remus Stealer: A New, Not-So-New Infostealer appeared first on Flashpoint.

  •  

ChatGPT's lockdownmodus beperkt webfuncties en voorkomt promptinjectionaanvallen

ChatGPT krijgt een Lockdown Mode die bepaalde internetfuncties van de chatbot uitschakelt of beperkt. Zo zijn gebruikers minder vatbaar voor promptinjectionaanvallen, waarbij hackers prompts verstoppen op websites en zo de controle willen overnemen van de chatbot. De modus was al beschikbaar voor bedrijven en komt nu uit voor consumenten.
  •  

Meta: hackers konden tienduizenden Instagram-accounts overnemen met Meta AI

Meta's eigen AI-chatbot heeft hackers geholpen bij het overnemen van meer dan 20.000 Instagram-accounts. De kwetsbaarheid werd eerder deze week bekend, maar nu zegt Meta hoeveel slachtoffers er waren. De chatbot laat hackers zeer eenvoudig het e-mailadres van een Instagram-account veranderen, waarna ze het account kunnen overnemen.
  •  
❌