Reading view

Wardriving assessment across Mexico: Preparing for the 2026 World Cup

Introduction

Mexico is one of the host countries for the 2026 FIFA World Cup, with matches to be played in three major cities: Mexico City, Monterrey, and Guadalajara. These locations are expected to see a large influx of international visitors, increasing the potential security risks. Many of those risks arise from users connecting to public wireless networks.

To better understand the wireless environments that visitors may encounter, we at Kaspersky GReAT conducted a wardriving assessment in the three host cities. The aim of the study was to analyze characteristics, deployment patterns, security configurations and potential exposure risks of public Wi-Fi infrastructure in urban wireless environments.

The information collected during the assessment was used exclusively for passive observation and infrastructure analysis. No attempts were made to authenticate, intercept communications, exploit systems or interact with the detected wireless networks beyond the publicly broadcast management information.

During processing of the collected data, one step involved filtering out networks belonging to cars or cell phones categorized as mobile hotspots because they do not represent networks that can be considered part of the assessment.

Research scope

The cities included in the study have high population density and extensive wireless infrastructure deployments. We chose areas with the most prominent wireless network activity and highly concentrated public access points. We carried out wardriving research in Monterrey back in 2008, but the city’s hotspot landscape has changed since then.

We chose the following analysis areas for each of the cities:

  1. Mexico City: México City Stadium, Mexico City International Airport, Zócalo, Paseo de la Reforma, Colonia Roma, La Condesa, Polanco, and Coyoacán.
  2. Guadalajara: Guadalajara Stadium, Guadalajara International Airport, the city center, Zapopan, Providencia, Avenida Chapultepec, Colonia Americana, Tlaquepaque, and the area around Andares.
  3. Monterrey: Monterrey Stadium, Monterrey International Airport, Fundidora Park, Cintermex Monterrey, the downtown area, Barrio Antiguo, MacroPlaza, and the San Pedro financial district.

The wireless information was collected using passive wireless reconnaissance techniques. The collected information included:

  • SSID analysis and information exposure, including BSSID-derived SSIDs
  • Default router configurations and ISP deployments
  • Frequency and signal characteristics
  • Channel congestion and spectrum usage
  • Wireless security configurations, including:
    • Open and insecure wireless networks
    • WPS-enabled networks
    • Secure networks (WPA2/WPA3) with WPS enabled

We performed a wireless infrastructure analysis in Mexico City, Guadalajara, and Monterrey. We drove through the areas surrounding the World Cup stadiums, tourist zones, and other places where fan concentrations are likely to be largest. Our goal was to evaluate the security status, deployment characteristics and operational exposure of detected wireless networks.

In total, we recorded 84,588 signals with 69,473 unique Service Set Identifiers (SSIDs) in busy locations and World Cup zones across the three cities. Mexico City accounted for 61.4% of the signals, Guadalajara for 23.6%, and Monterrey for 14.8%. Approximately 82% of the signals had a single SSID (81.9%, 81.34%, and 84% respectively). Notably, they all operate under the IEEE 802.11 standard protocol.

Particular attention was given to identifying standard deployment patterns, legacy configurations, default vendor settings and information disclosure through publicly broadcast wireless identifiers.

The following sections present the results that were obtained by analyzing wireless infrastructure across the three locations.

Our findings

SSID analysis and information exposure

SSID analysis was conducted to evaluate naming conventions, deployment standardization and potential information exposure.

Only a few networks (0.0047%) have an invisible SSID, meaning the names of these networks are not broadcast. Some users prefer to hide the SSID for various reasons, such as the network’s purpose, the profile of its users, internal policies, etc. In contrast, the rest of the networks maintained active SSID broadcasting.

SSID structures may unintentionally disclose operational details about internet service providers (ISPs), device manufacturers, deployment practices, organizational ownership or user identity. The repeated presence of default SSID naming patterns across the analyzed locations indicates a significant degree of infrastructure homogeneity and reuse of default wireless configurations. It may also facilitate passive infrastructure profiling by revealing standard characteristics in use.

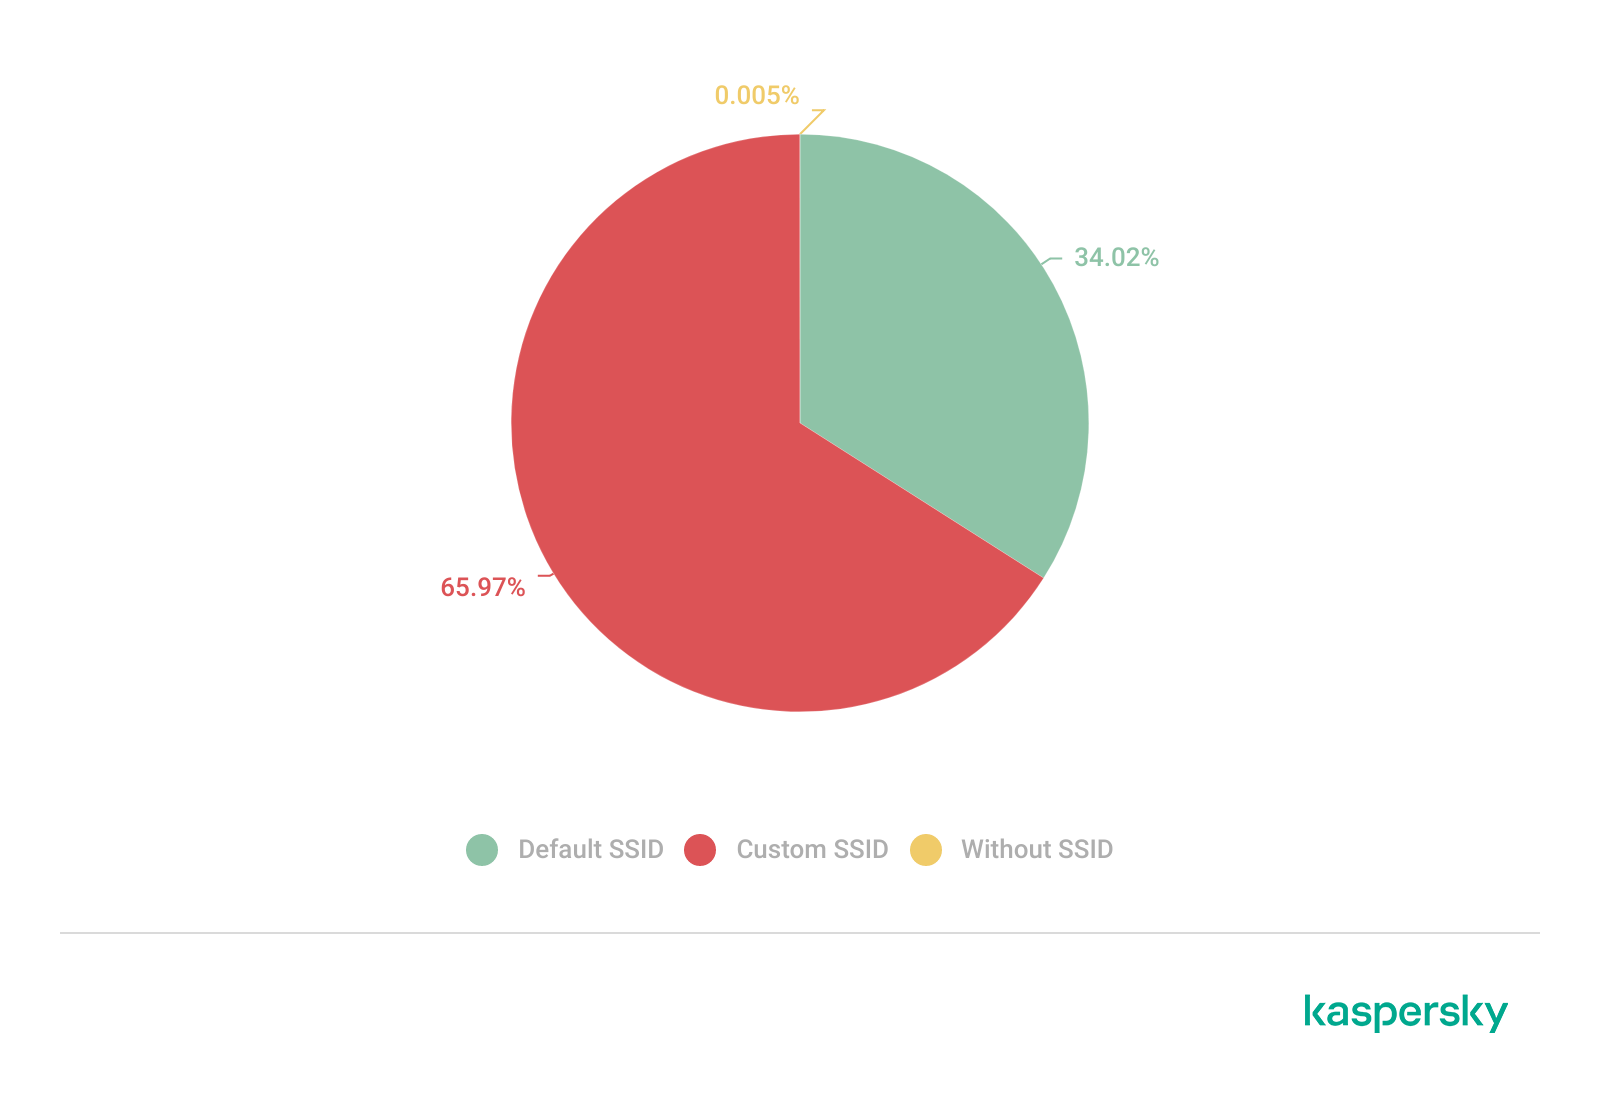
Approximately 34% of the detected networks retained the default SSID naming conventions provided by the manufacturer or ISP, while 66% used customized identifiers.

Distribution of SSID naming conventions (download)

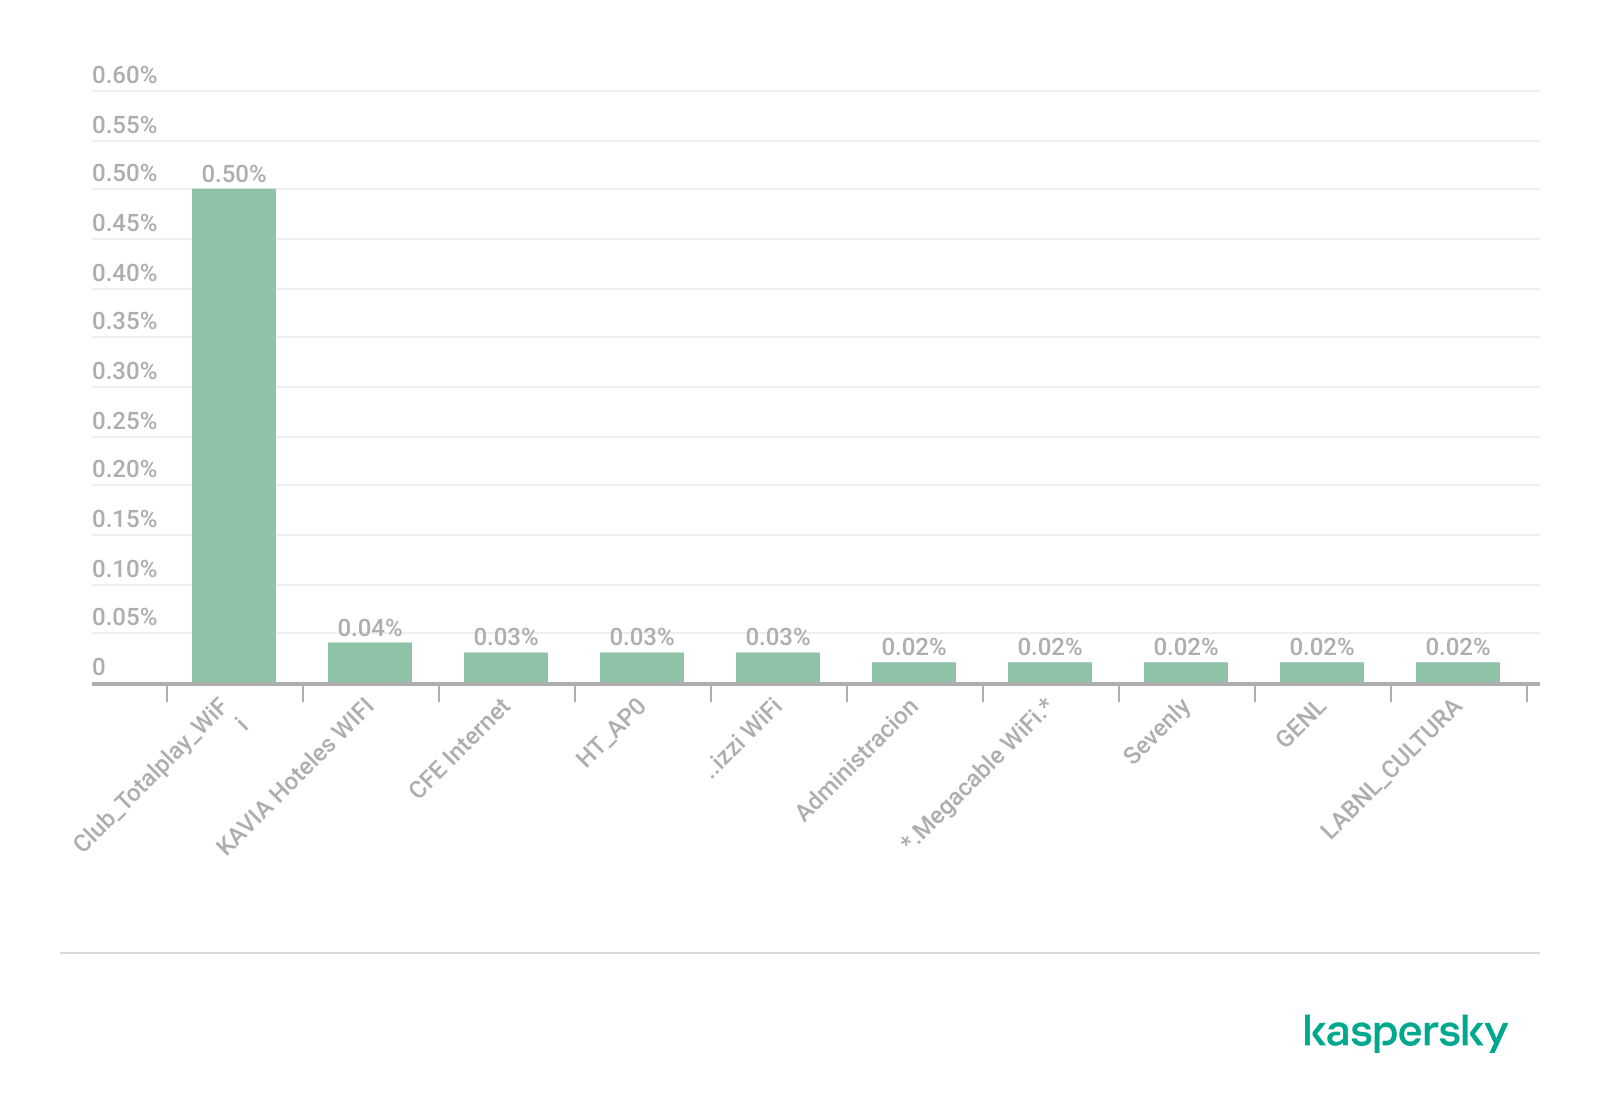
Several recurring SSID naming conventions associated with ISP-provided deployments were identified in the three cities. The most frequently observed patterns include identifiers such as “Club_Totalplay_WiFi”, “izzi WiFi”, and “Megacable WiFi”, which suggests extensive standardization of wireless infrastructure deployment. Additionally, we observed distinctive location-specific SSIDs in each area of analysis, such as “XXXX-Internet para Todos-CDMX” or “RED JALISCO”.

Most frequently observed SSID patterns (download)

Sequential SSID naming structures were also identified during the analysis. Patterns such as “INFINITUMXX” and “IZZI-XX” suggest automated ISP deployment and large-scale deployment strategies.

We identified 33 unique sequential naming structures among the 137 sequential SSIDs in total, representing approximately 0.16% of the detected wireless networks.

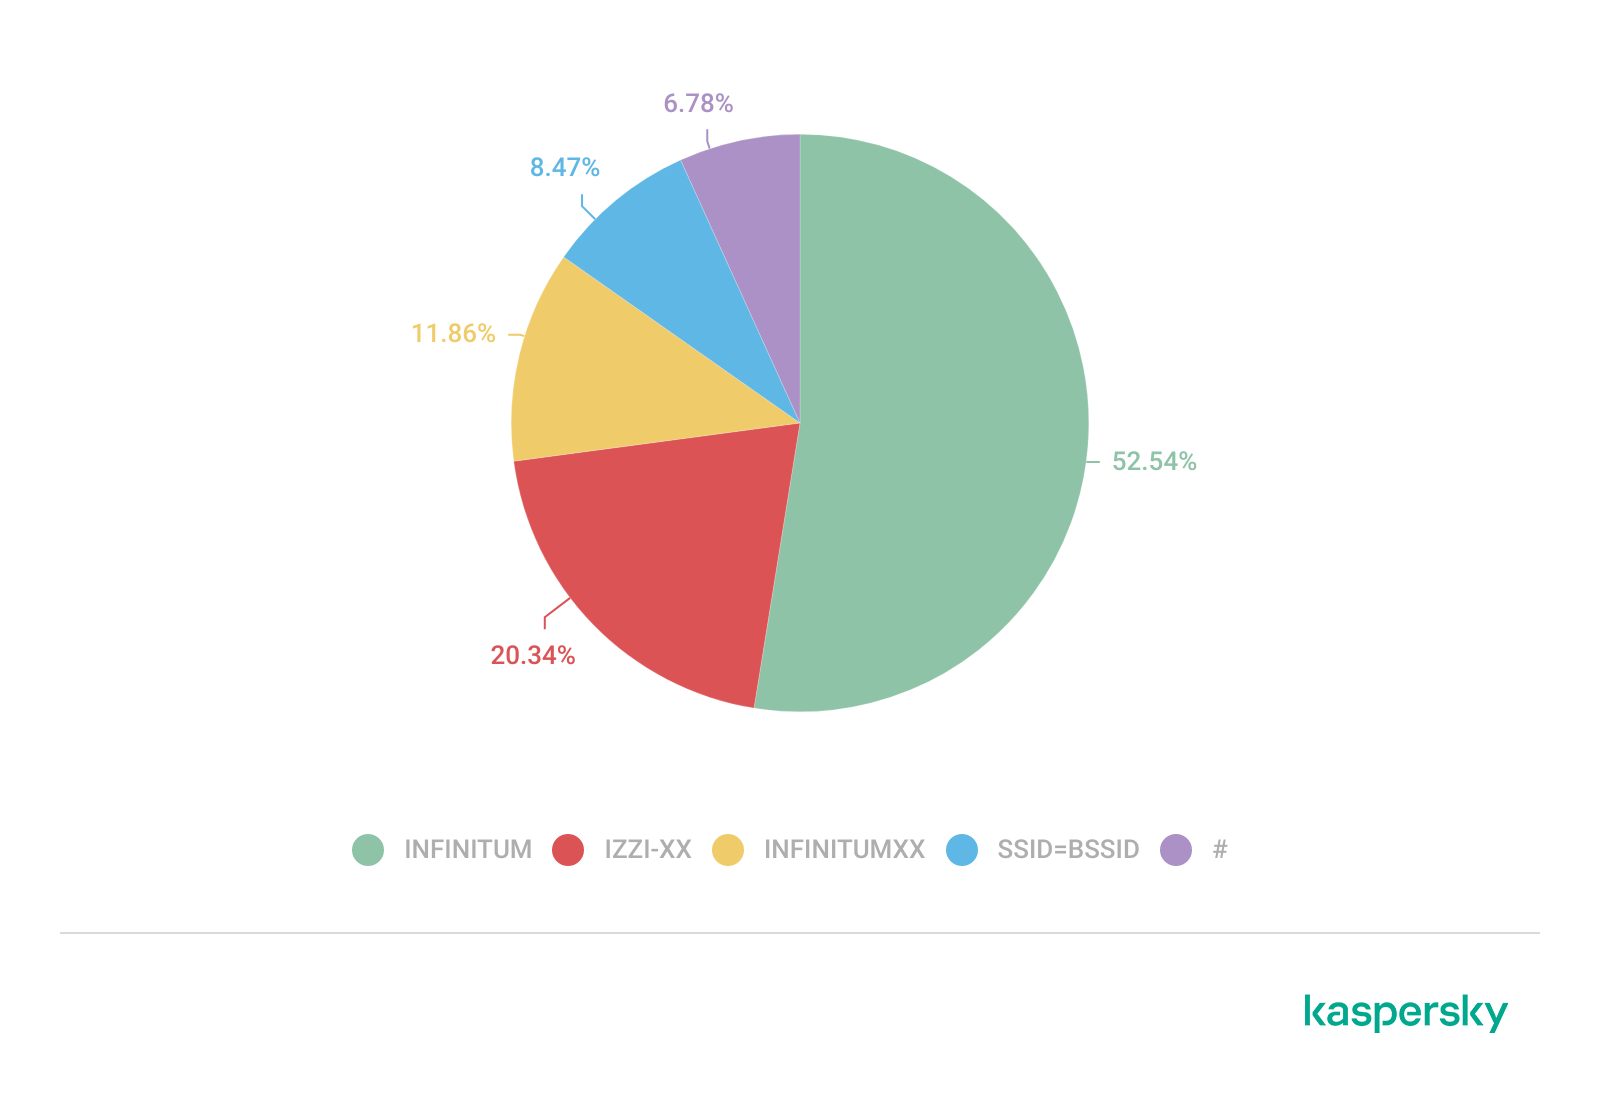
The following graph shows the top five sequential SSID patterns found in the largest number of networks:

Five most frequently observed sequential patterns (download)

Several customized SSIDs contained personal or organizational identifiers, including family names, professions, addresses or internal department references. Although personalized SSIDs may simplify local network identification for users, they may also expose sensitive information that could be useful for social engineering, physical targeting, or organizational profiling.

BSSID-derived SSID

During the analysis, multiple networks were identified that used the physical MAC address of a Wi-Fi access point (BSSID) as the visible SSID. This practice exposes hardware-level information that could facilitate vendor fingerprinting and targeted reconnaissance activities.

The organizationally unique identifier (OUI) contained in the first bytes of the BSSID identifies the equipment manufacturer. Threat actors can correlate exposed manufacturers with device-specific vulnerabilities.

BSSID-derived SSID by city (download)

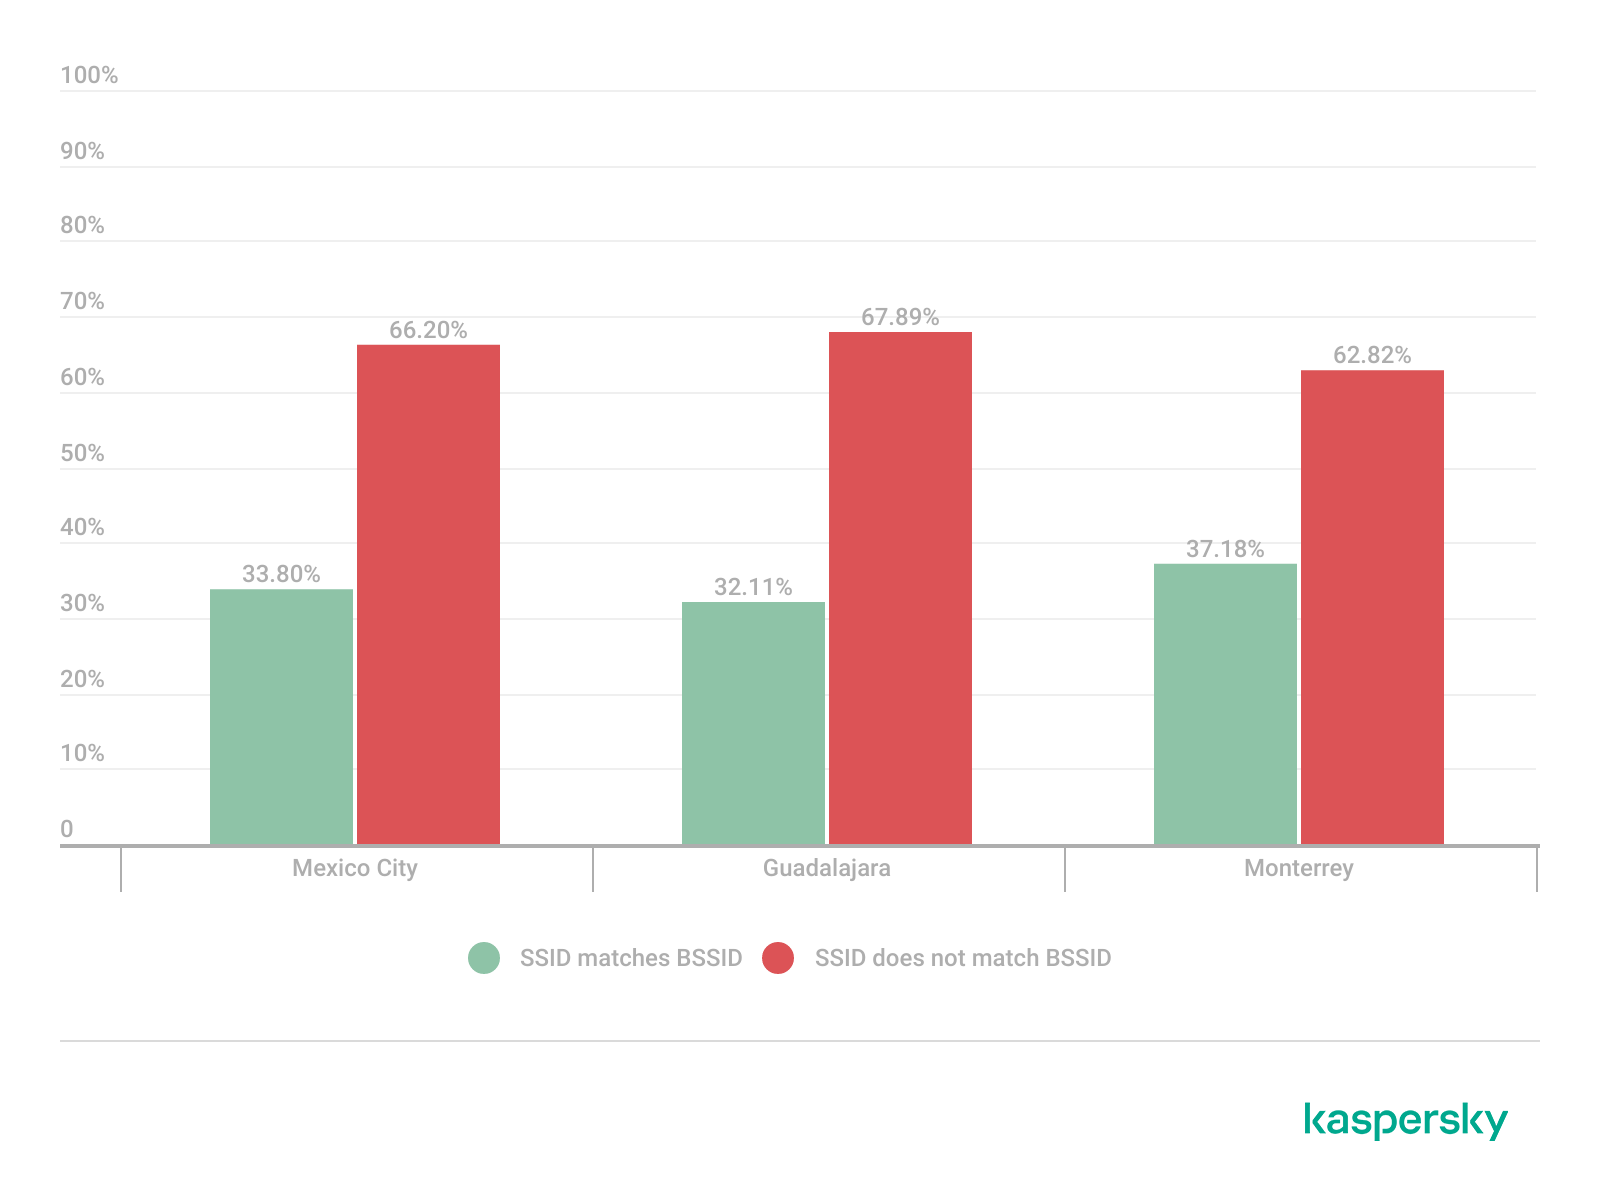
Notably, we found that more than 30% of networks in all three cities reuse the MAC address as the SSID.

Default router configurations and ISP deployments

We performed wireless infrastructure profiling to identify the most common wireless equipment manufacturers and ISP deployments across the three locations.

Large-scale ISP deployments frequently use standardized wireless configurations and vendor-specific hardware platforms. Identifying dominant manufacturers and ISP naming conventions can provide insight into infrastructure and deployment practices facilitating the mapping of standardized attack surfaces.

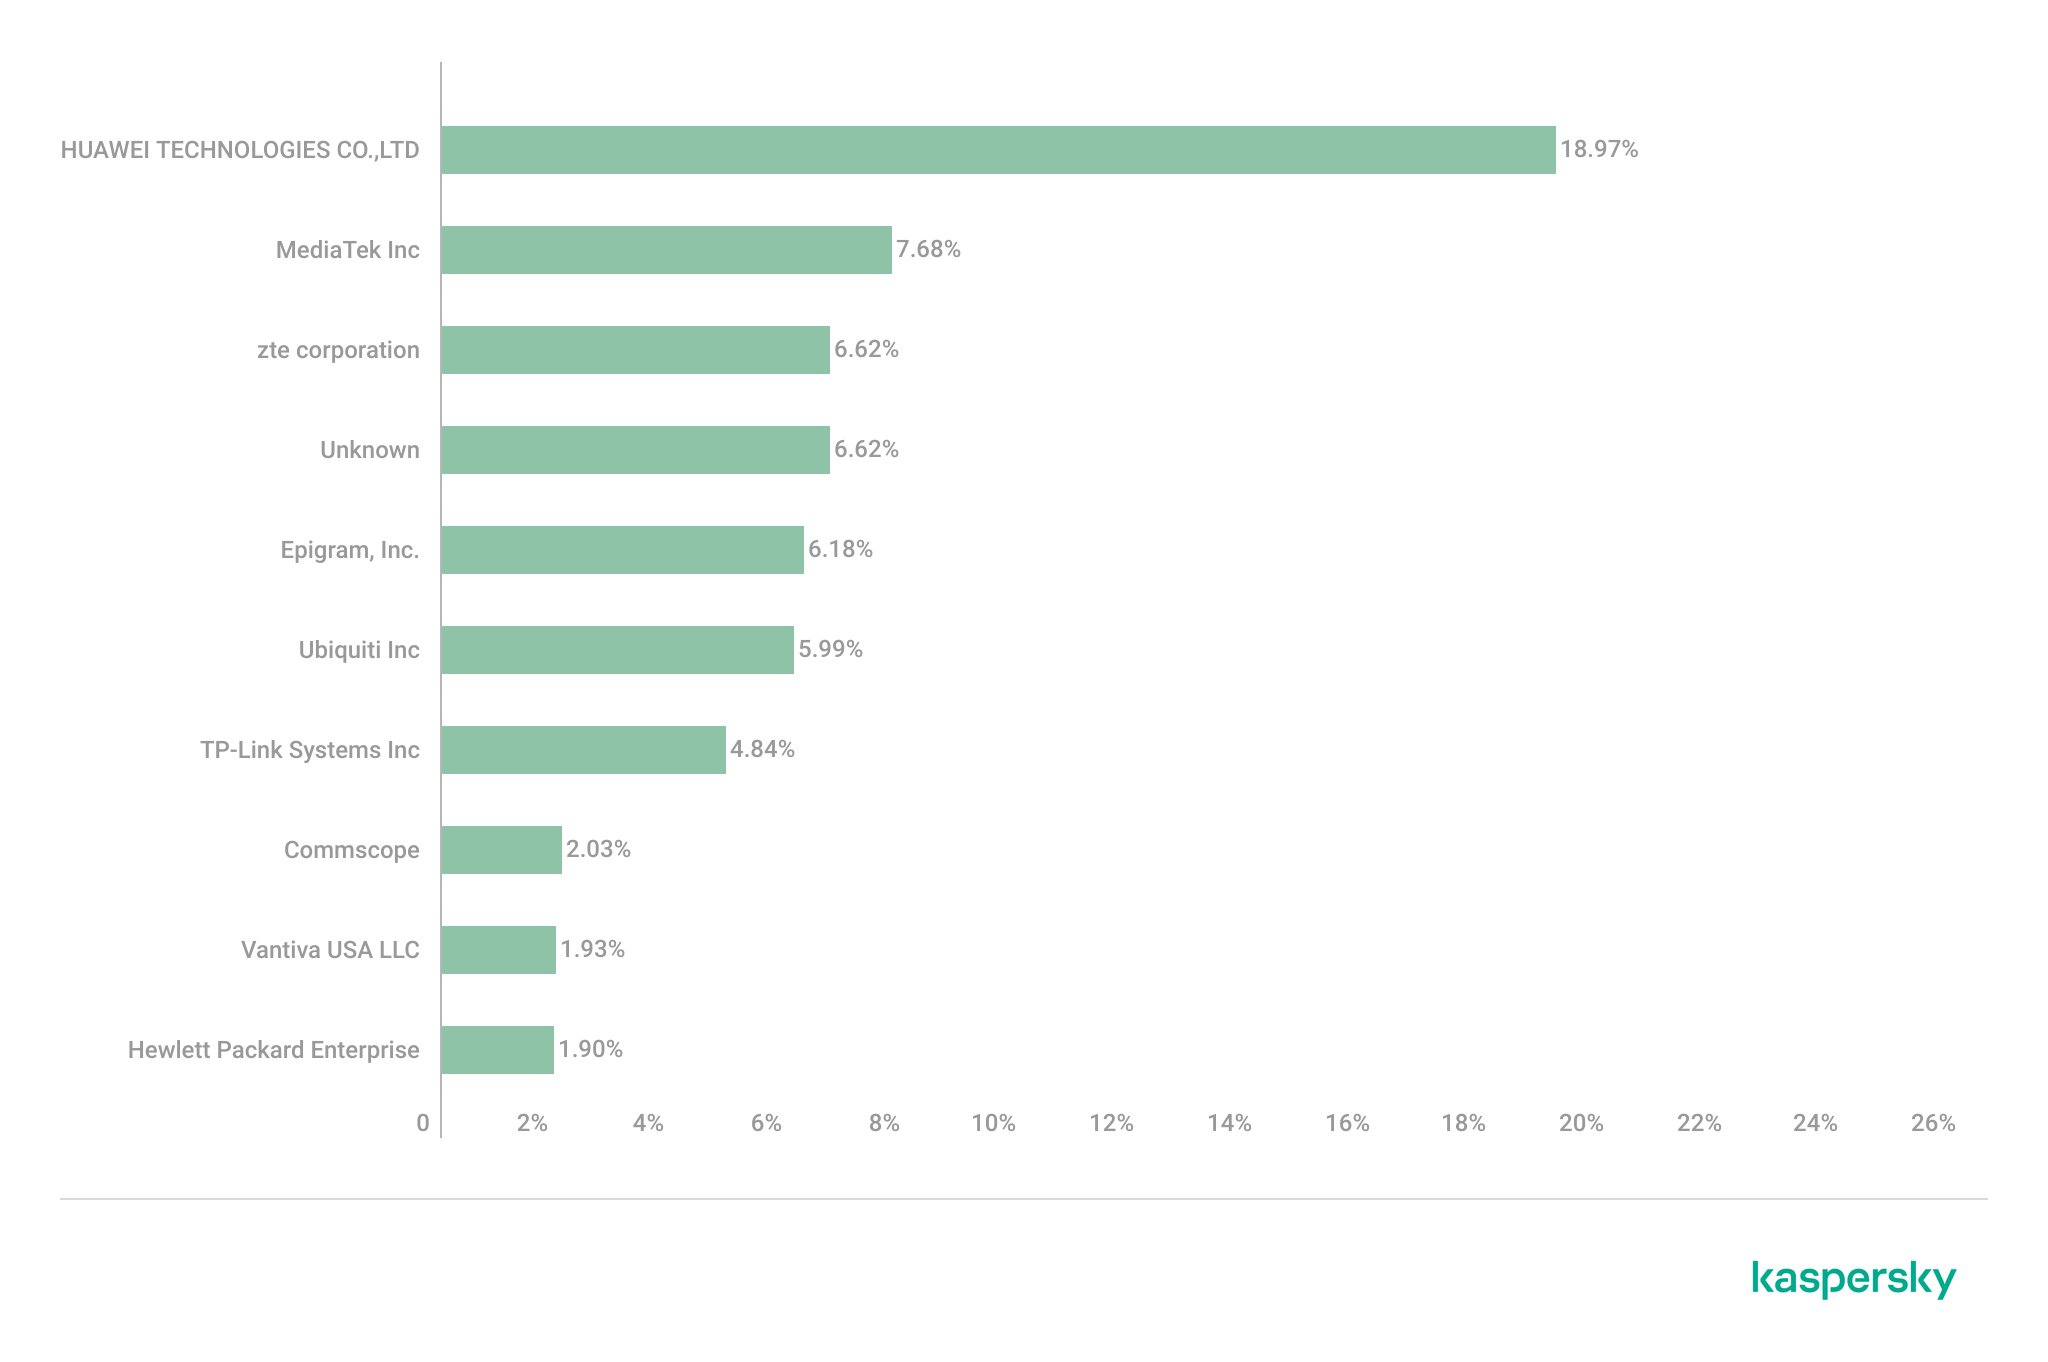
The following figure shows the distribution of the most commonly used manufacturers.

Most frequently observed wireless equipment manufacturers (download)

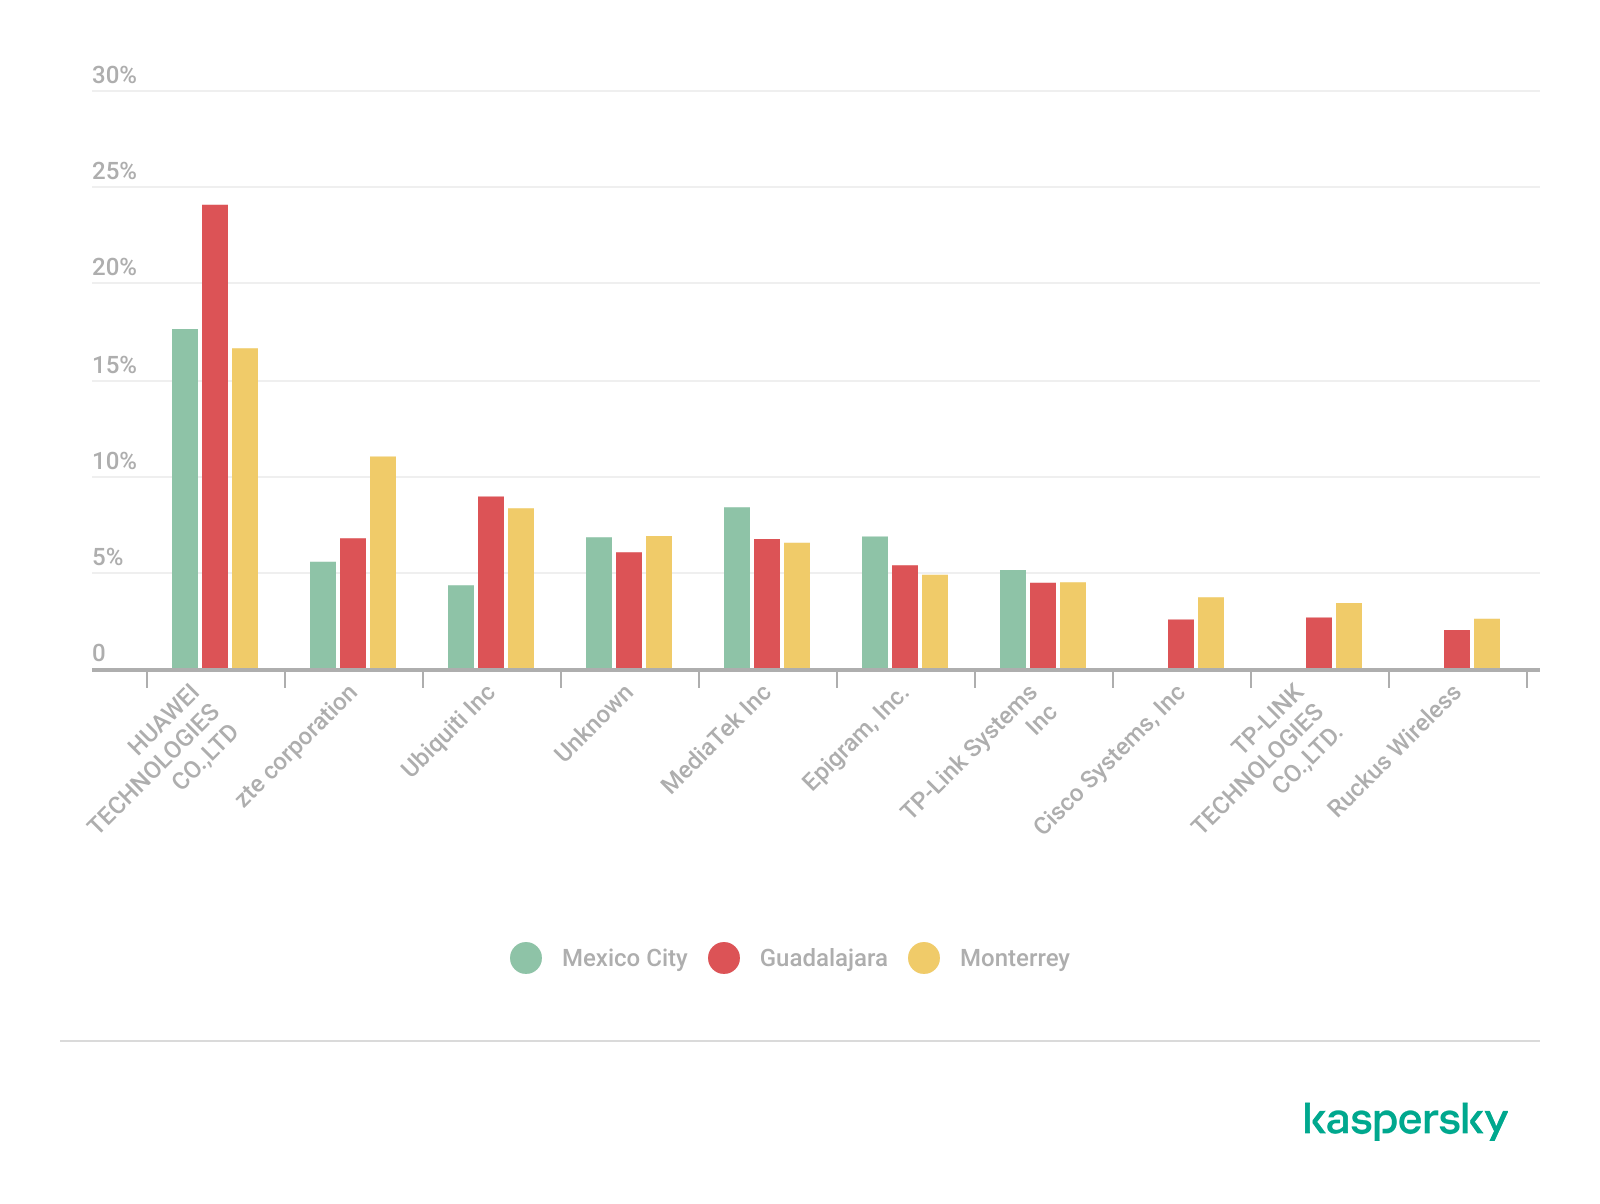
The manufacturer analysis revealed a strong concentration of wireless infrastructure among a limited number of vendors. Across the three locations, Huawei Technologies, MediaTek-based devices, and other manufacturers’ equipment that is distributed through ISP channels represented a significant portion of the detected deployments. Mexico City had the most diverse infrastructure, while Monterrey and Guadalajara had a greater concentration of wireless equipment known as SOHO (small office/home office) or residential-grade hardware. The widespread presence of standard vendor platforms may facilitate infrastructure fingerprinting and large-scale targeting of known device-specific vulnerabilities.

Most frequently observed wireless equipment manufacturers across the three cities (download)

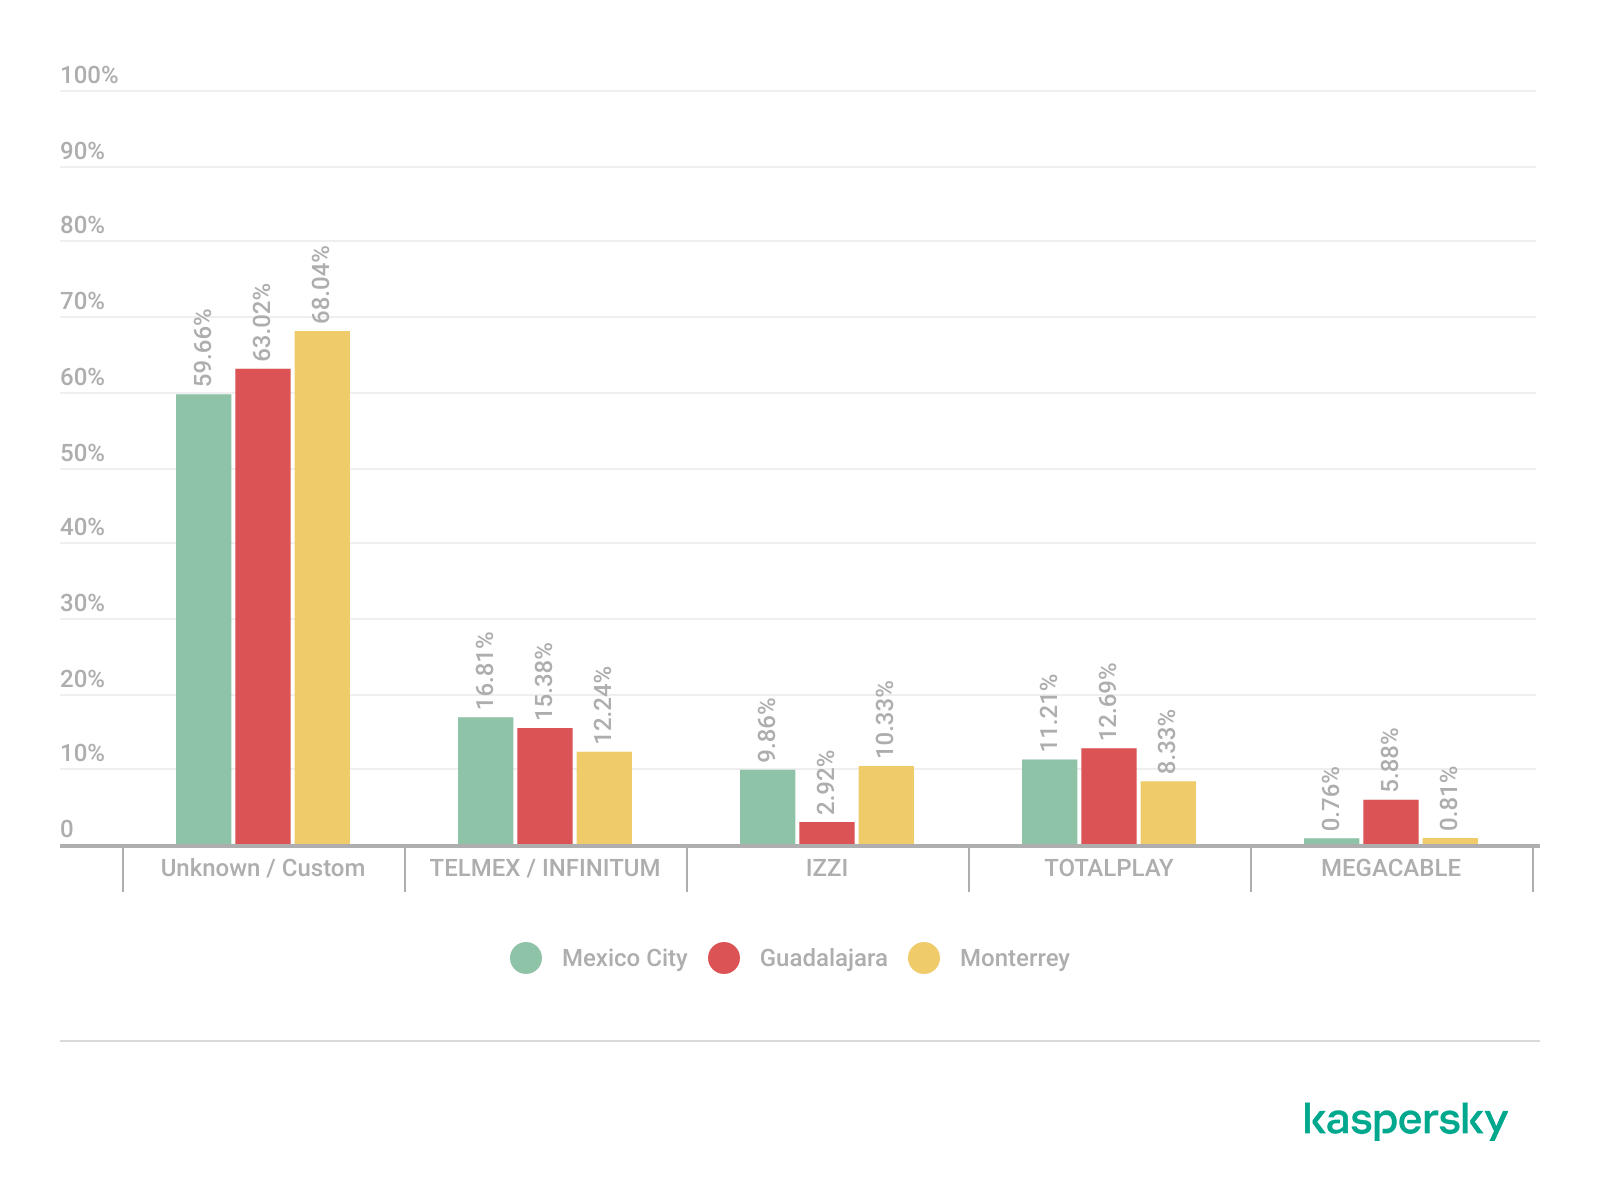
ISP deployments frequently exhibited standardized configuration patterns and recurring manufacturer identifiers. Our ISP deployment analysis revealed a high concentration of access points associated with major residential internet providers. Deployments associated with Infinitum, Totalplay and Izzi represented a substantial portion of the detected wireless infrastructure across all locations. These findings suggest a high degree of deployment standardization across networks associated with major residential internet providers. This observation was supported by the repeated presence of ISP-associated SSIDs such as “Infinitum”, “Totalplay”, and “Izzi”, combined with manufacturer identifiers frequently associated with consumer equipment, including Huawei, ZTE and other residential wireless equipment vendors.

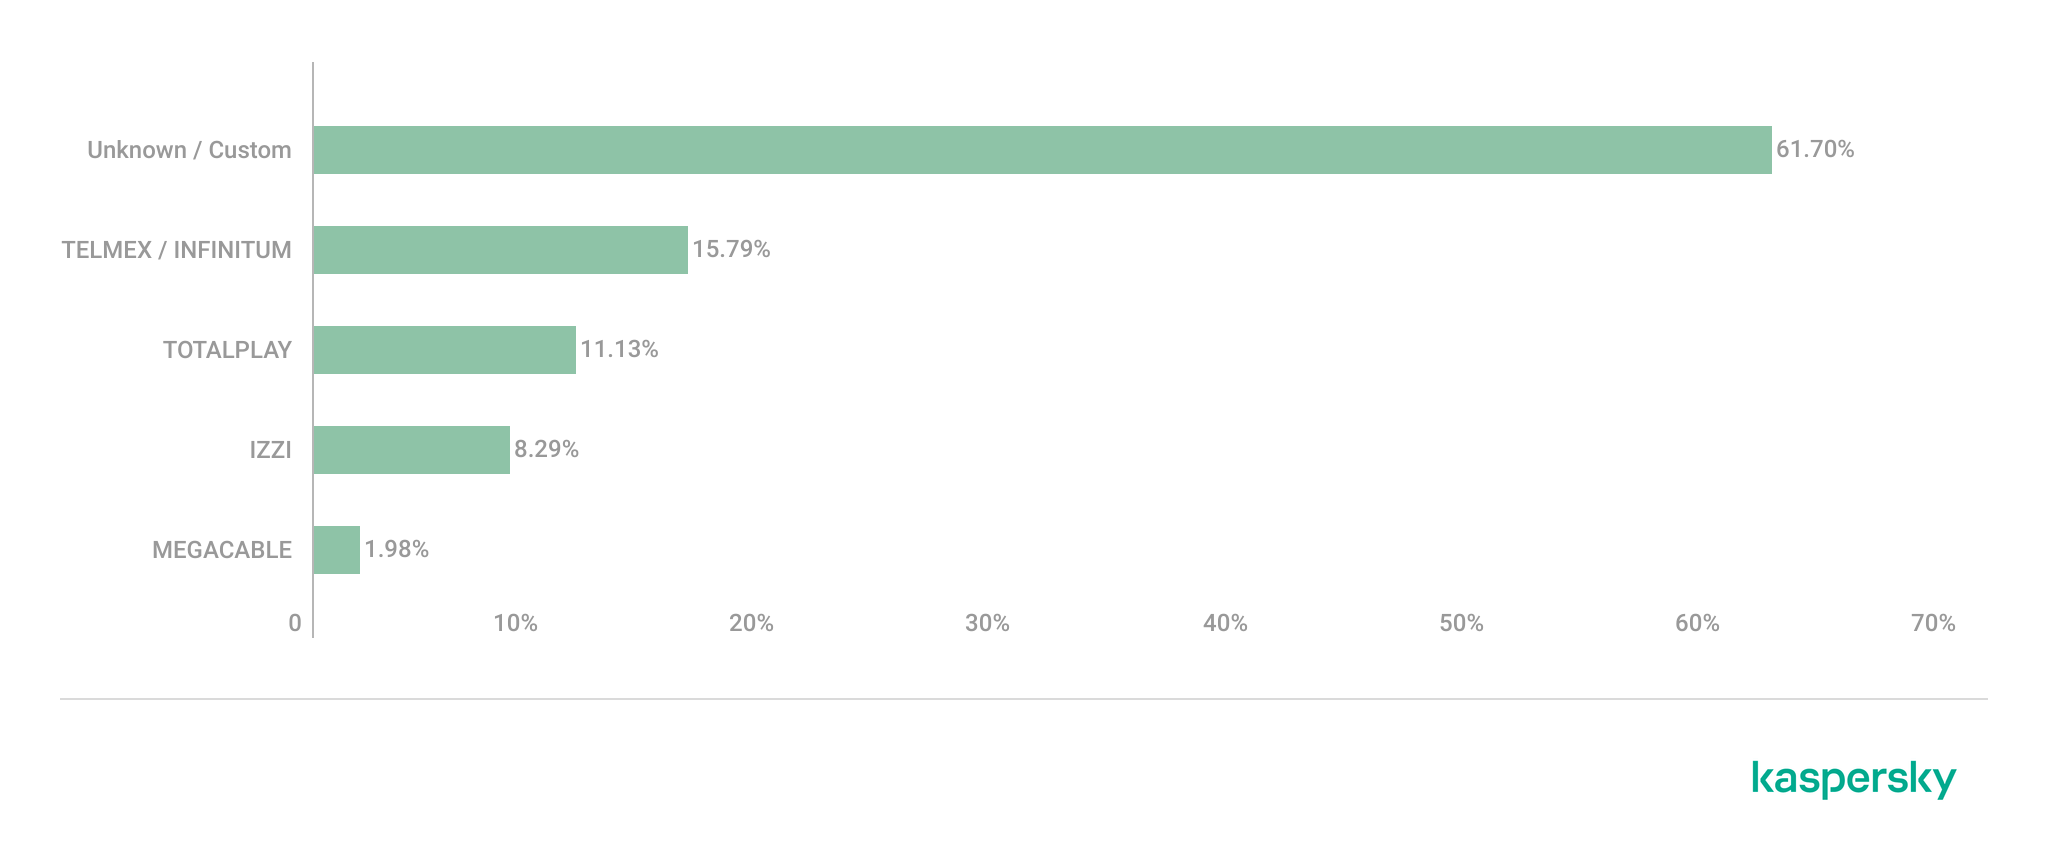
It is important to note that, for this analysis, ISPs were primarily inferred from SSID naming conventions and manufacturer fingerprint data. A significant portion of the detected wireless networks fell into the “UNKNOWN/CUSTOM” category. This classification includes custom hotspots and networks whose naming conventions did not expose identifiable ISP-associated patterns. The findings suggest that many users and organizations (as we saw previously, approximately 66%) use custom network names, limiting direct provider attribution.

The following figure illustrates the distribution of ISP-associated wireless deployments in general.

Most frequently observed ISPs (download)

To better understand this distribution, we took the most frequently observed ISPs by city.

Most frequently observed ISPs across the three cities (download)

Frequency and signal characteristics

We also analyzed wireless signal characteristics to evaluate coverage quality, signal strength, and frequency band utilization in the three cities. In dense urban environments, signal quality and frequency spectrum distribution can affect wireless reliability, client connectivity, roaming performance, and overall network efficiency.

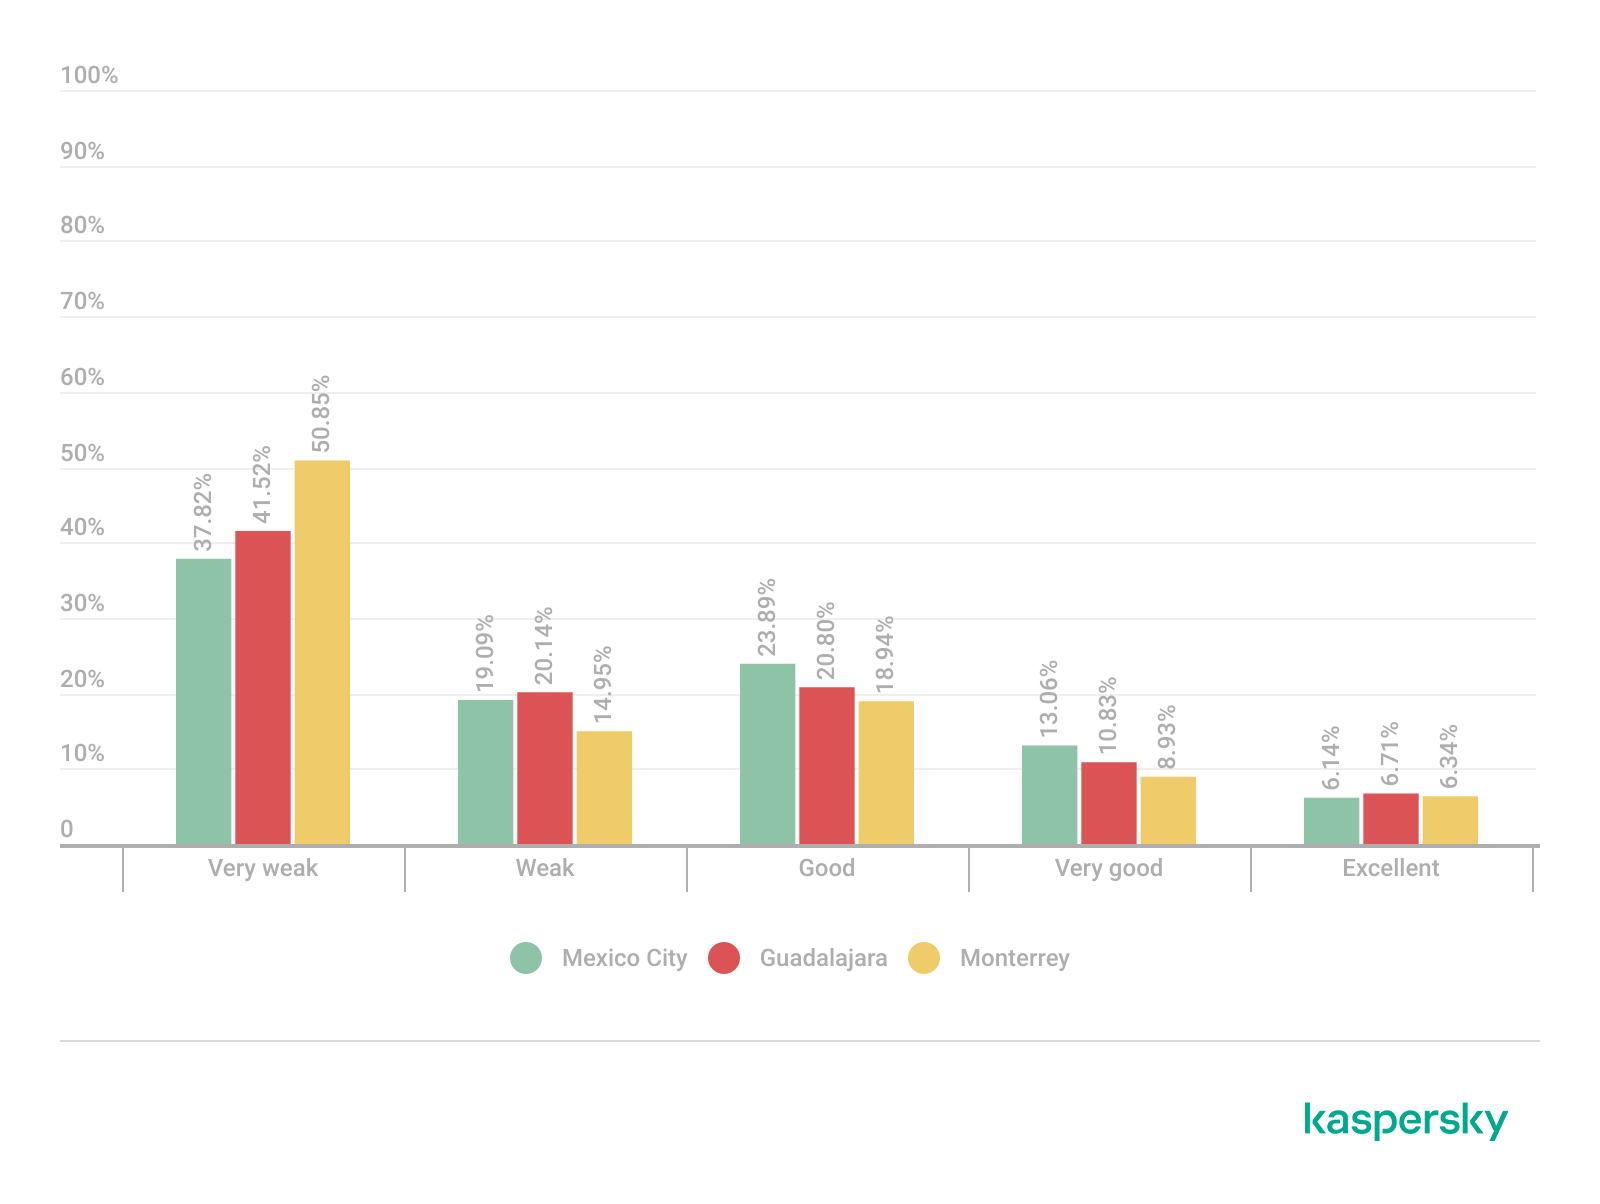
Signal quality analysis revealed that a substantial portion of the detected access points operated under weak or very weak signal conditions. Monterrey had the highest percentage of very weak signals, with approximately 50% of detected deployments. Similar patterns were observed in Guadalajara and Mexico City, suggesting high-density wireless environments with overlapping coverage areas. Only a limited percentage of networks were classified within the very good or excellent signal categories across the three locations.

Signal quality distribution by city (download)

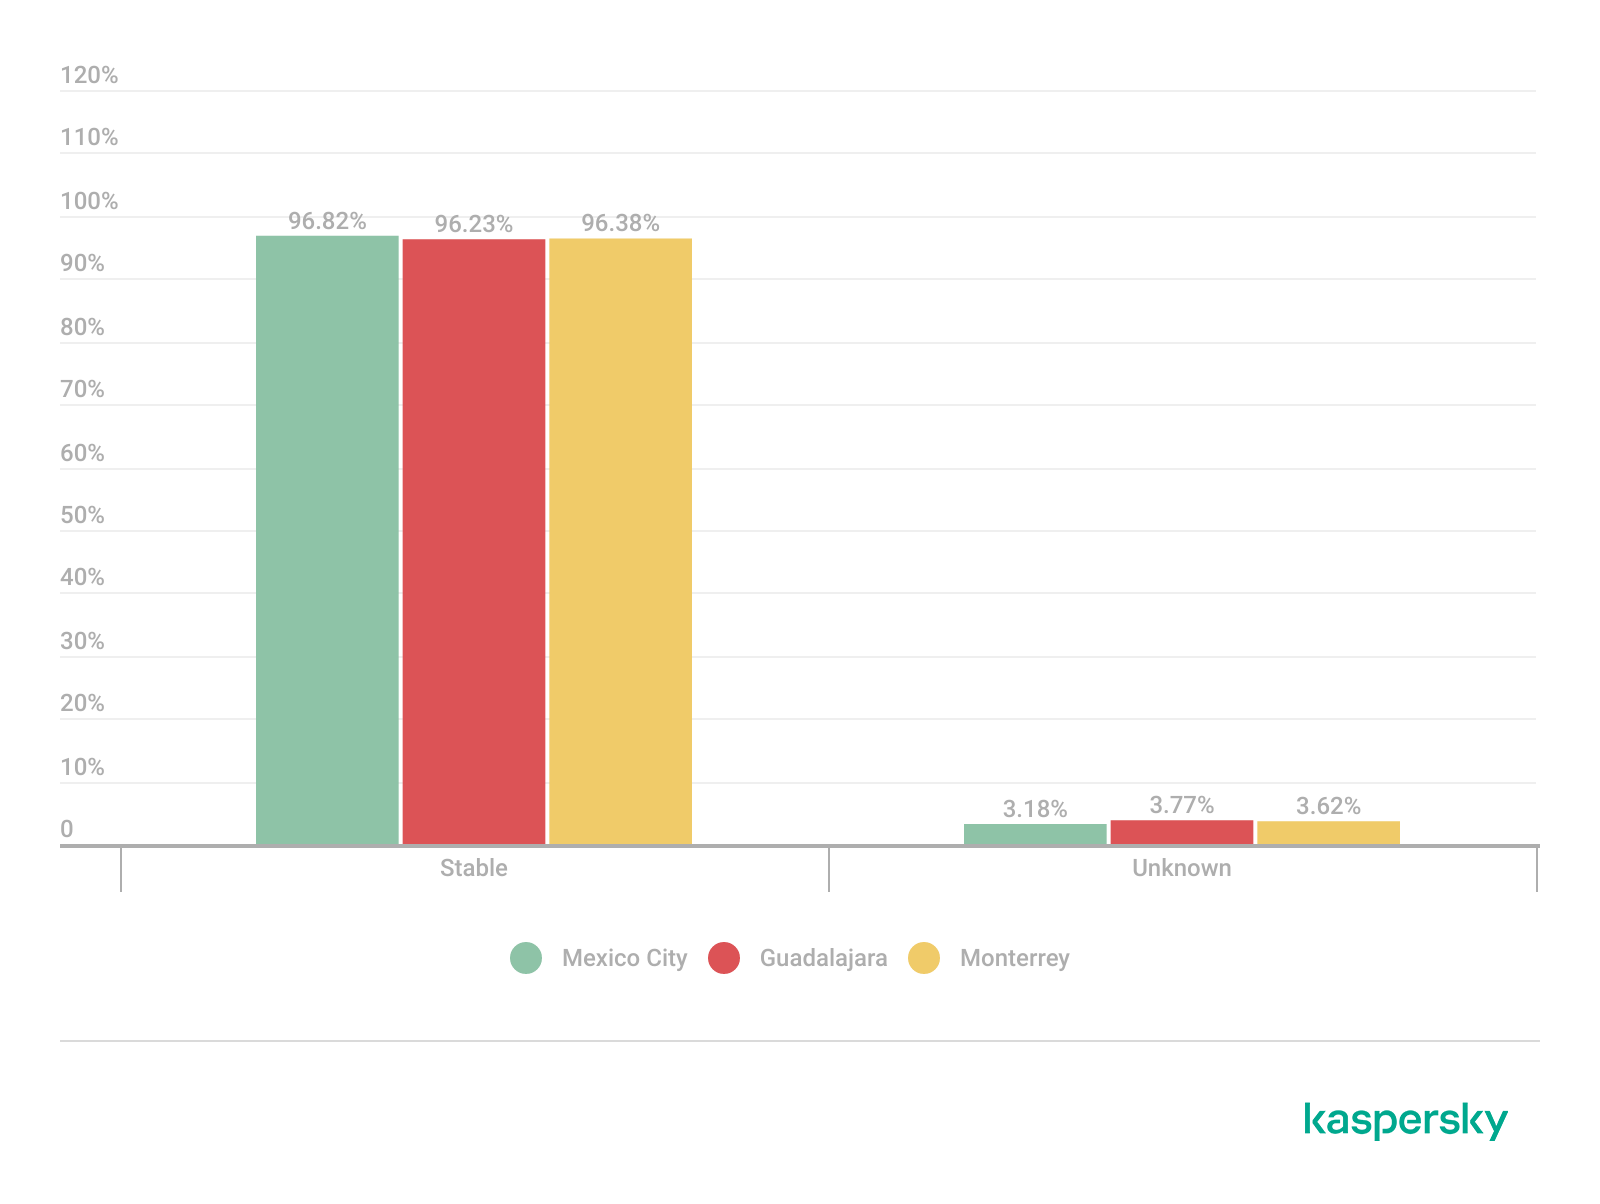
Signal stability analysis revealed that most detected wireless deployments exhibited stable beacon transmission behavior. More than 96% of the detected access points across all locations were classified as stable, while only a small percentage exhibited unstable or indeterminate signal behavior.

These findings imply that the majority of the wireless infrastructure observed during the assessment corresponded to permanently deployed access points rather than transient or intermittent wireless devices.

Signal stability status (download)

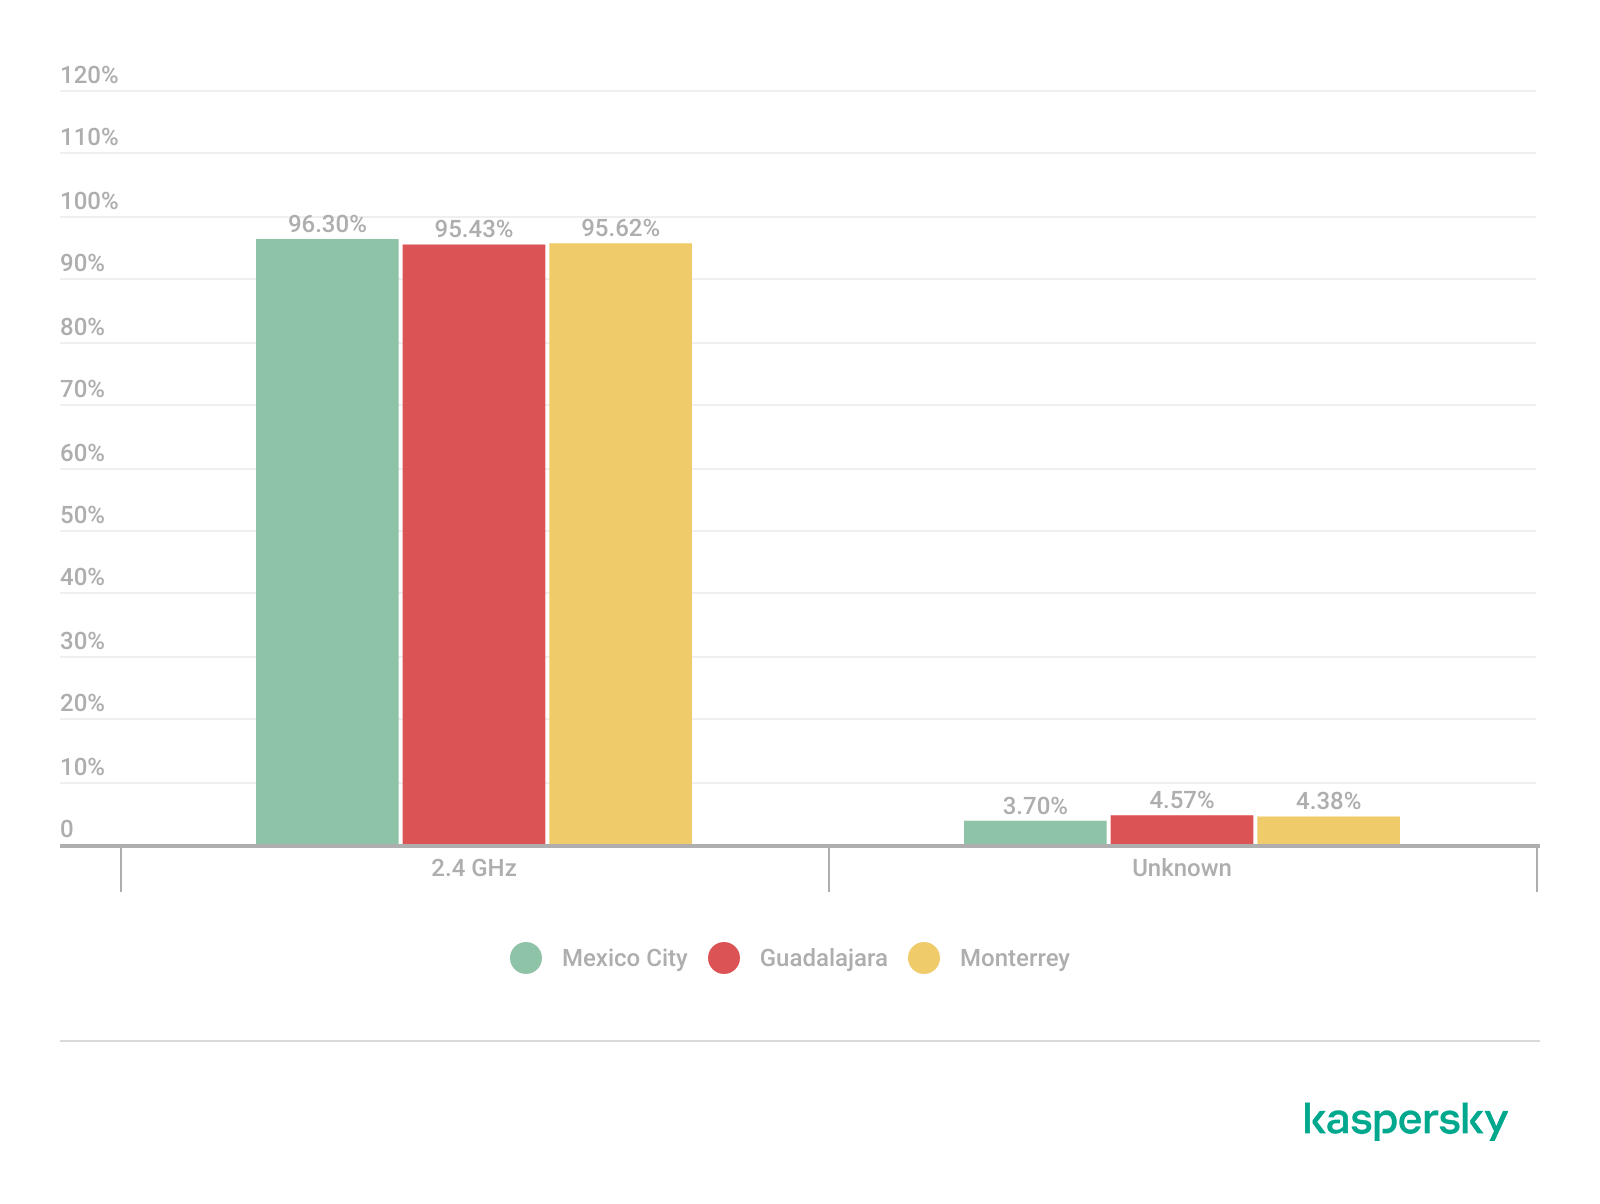
Frequency band analysis revealed the strong prevalence of 2.4 GHz wireless deployments across the three locations. More than 95% of the detected wireless networks operated within the 2.4 GHz spectrum, while only a small percentage of deployments were classified under the unknown or non-standard frequency categories. This uneven distribution reflects the continued prevalence of legacy-compatible wireless infrastructure and SOHO deployments.

Frequency band utilization (download)

These findings are consistent with dense urban wireless environments with large numbers of access points in restricted spectrum allocations.

Channel congestion and spectrum usage

Next, we analyzed wireless channel utilization to evaluate frequency spectrum congestion and channel allocation patterns across the three cities. Our analysis focused on the 2.4 GHz spectrum, where channel overlap and high access point density commonly produce interference and degraded wireless performance. In densely populated wireless environments, an excessive concentration of access points on a limited number of channels can lead to co-channel interference, packet collisions, reduced throughput, and degraded network stability.

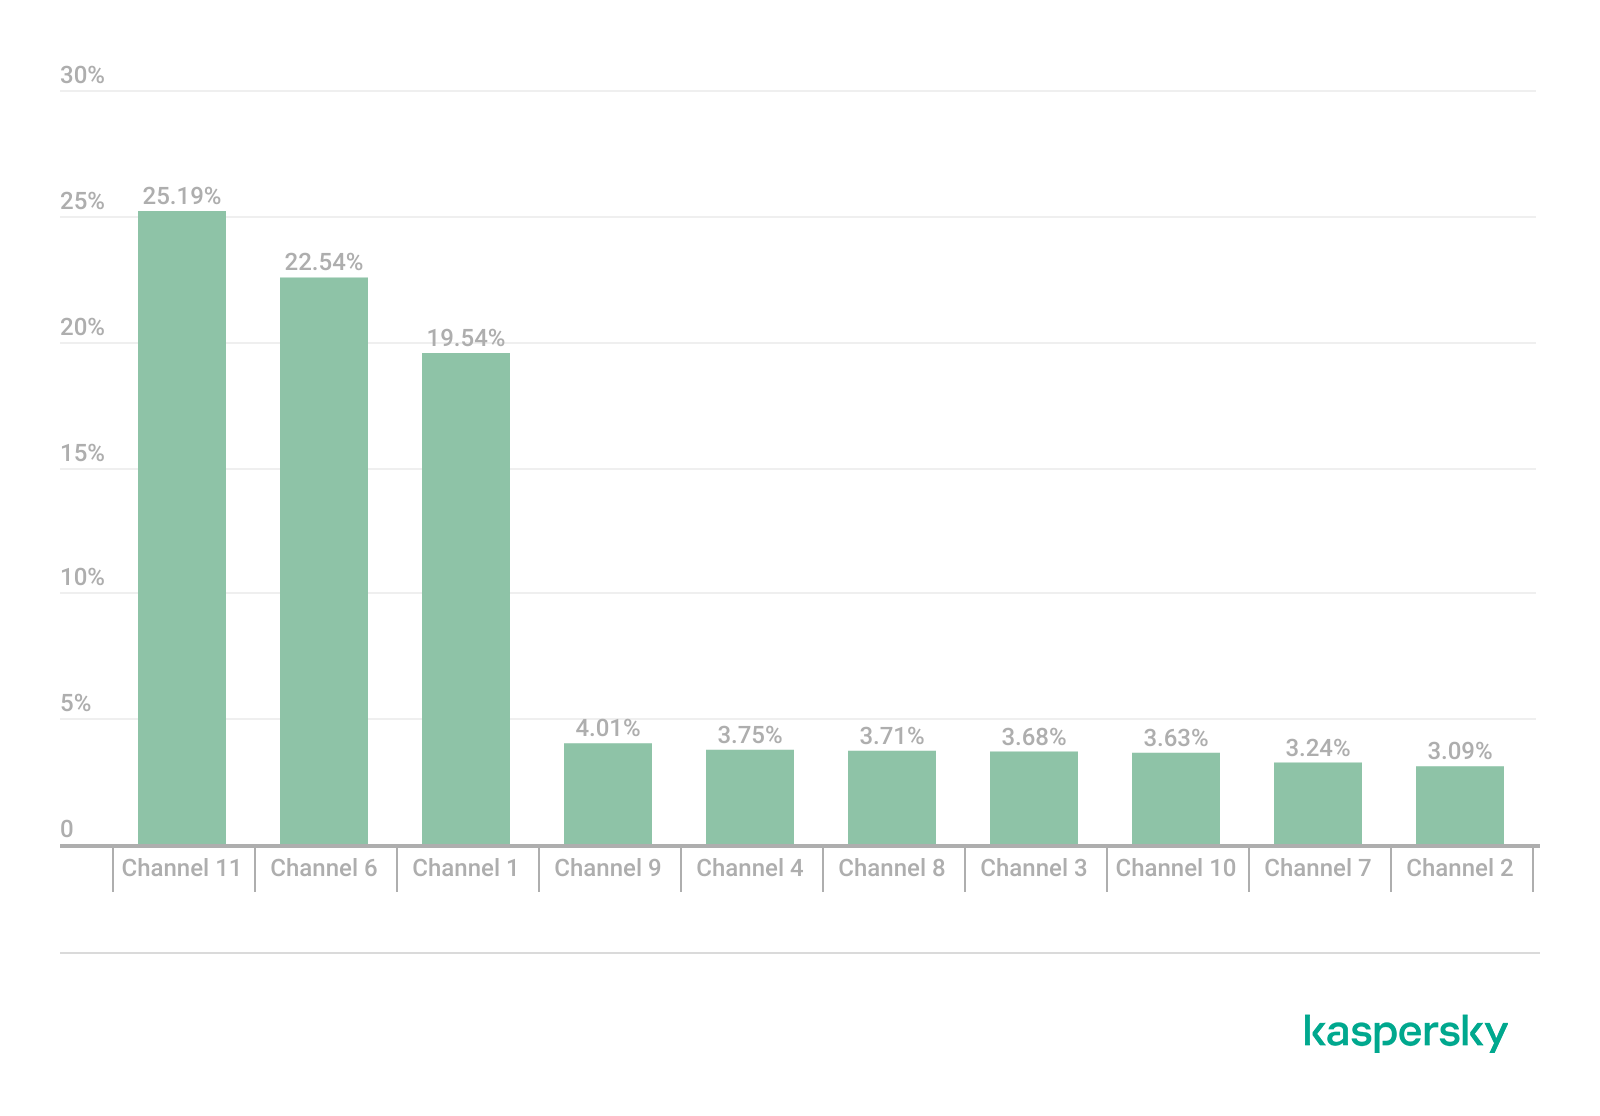
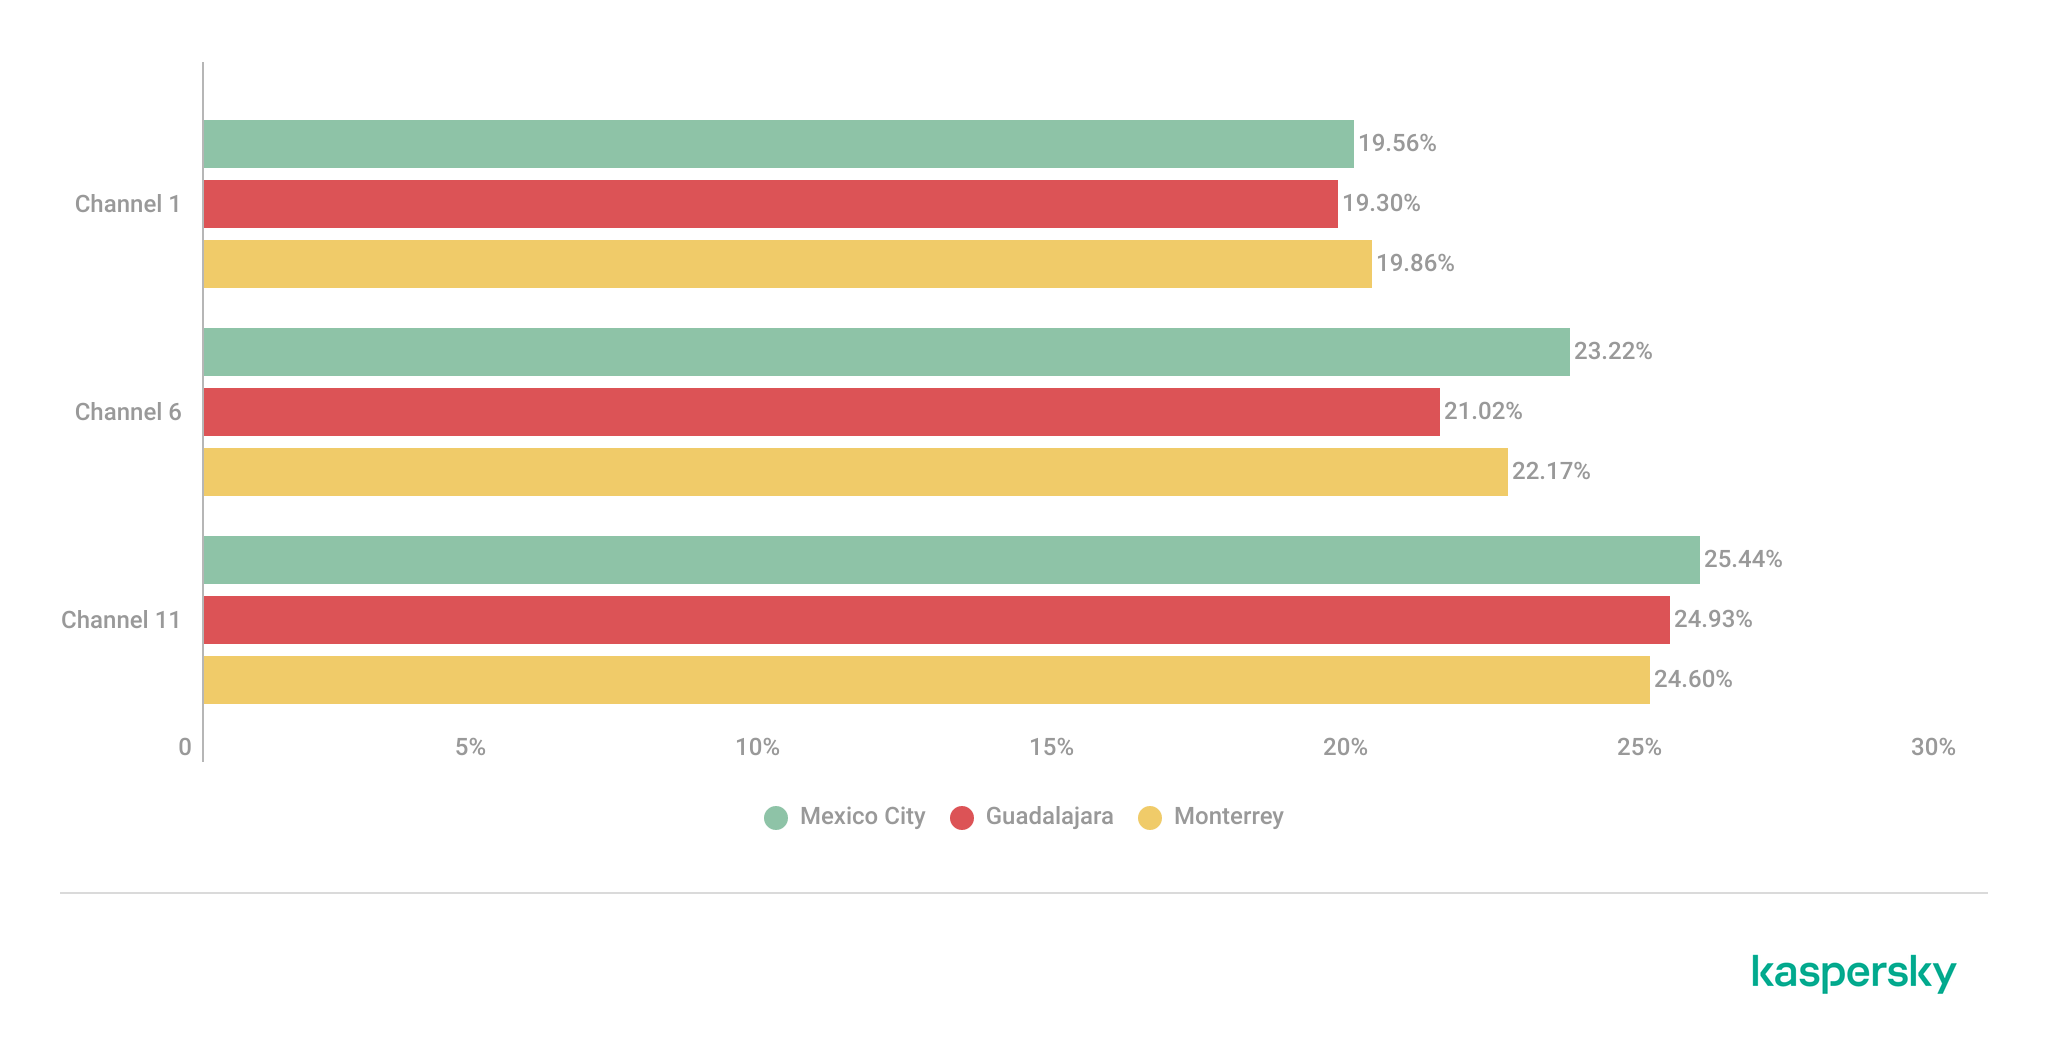
Spectrum congestion analysis revealed that the 2.4 GHz band consistently experienced elevated congestion levels across the three cities. The detailed results showed a strong concentration of deployments on channels 11, 6 and 1, which are traditionally recommended as non-overlapping channels within the 2.4 GHz spectrum. Channel 11 was the most utilized channel, accounting for 25.2% of the detected access points, followed by channel 6 with 22.5% and channel 1 with 19.5%. This distribution indicates that most wireless deployments adhere to standard channel allocation practices for 2.4 GHz Wi-Fi environments.

The following figure illustrates the overall distribution of the most frequently utilized wireless channels.

Most utilized wireless channels (download)

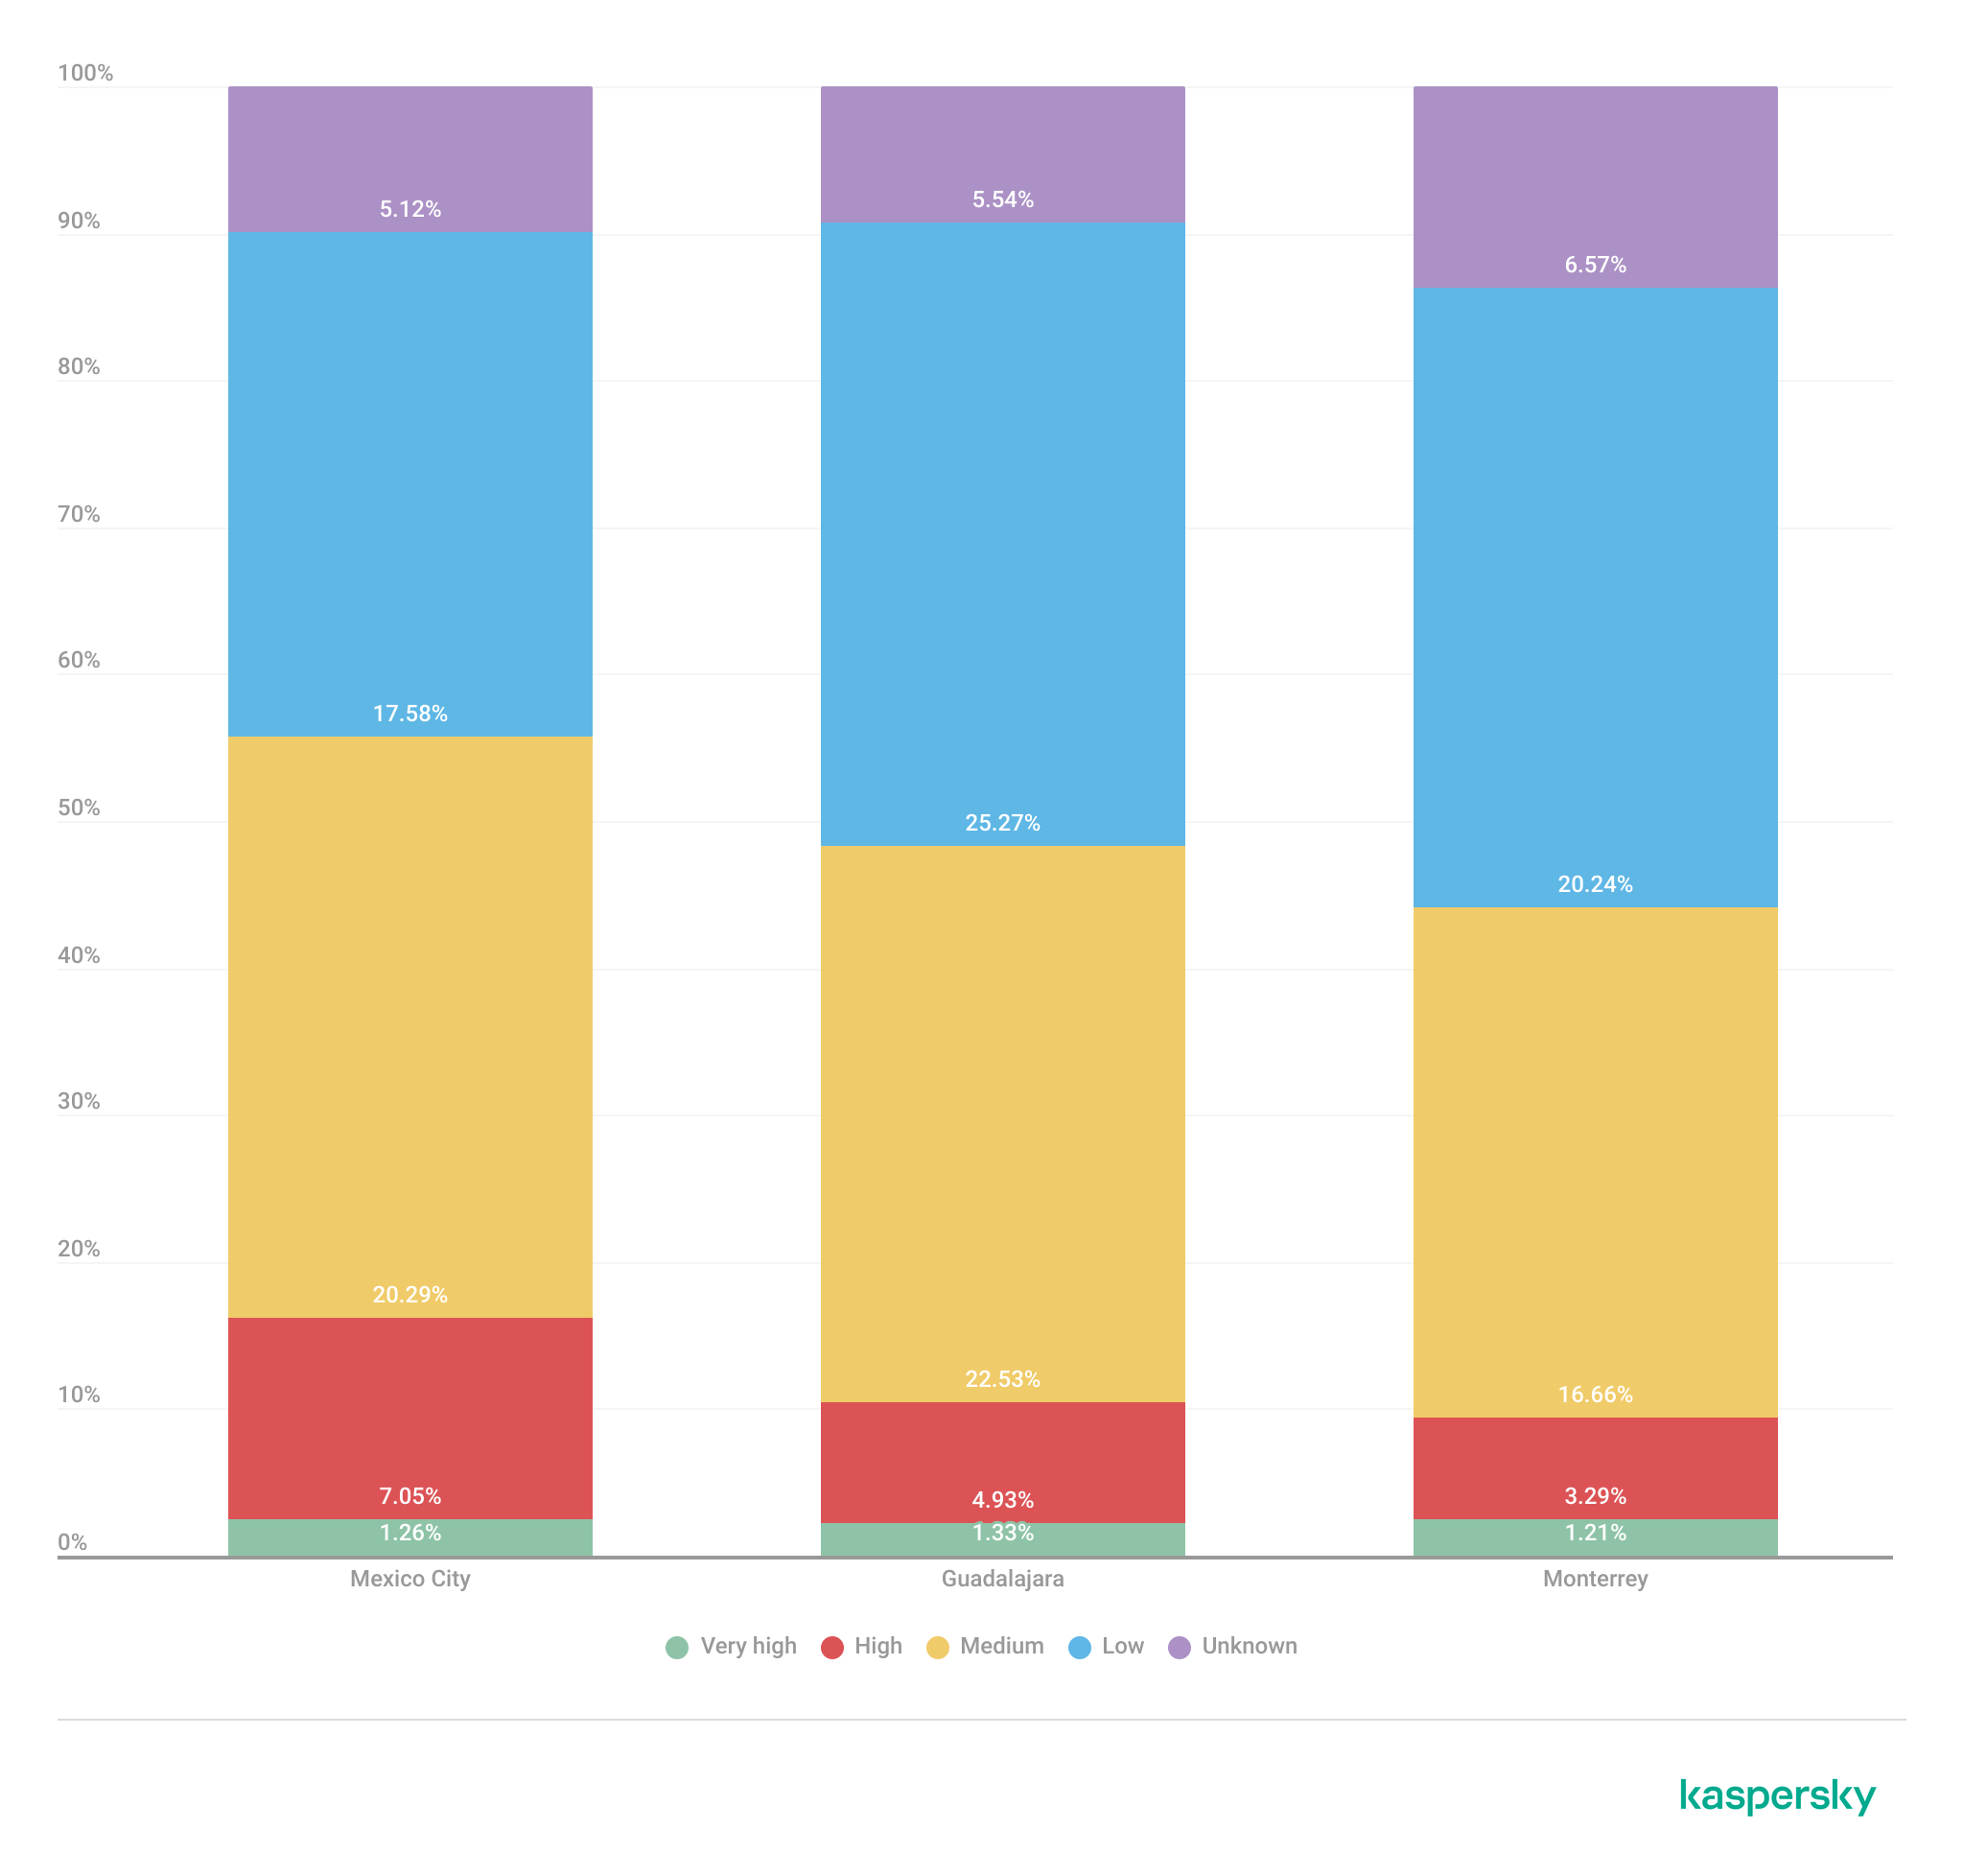
To further assess wireless spectrum saturation, the detected access points were grouped according to channel congestion levels: VERY_HIGH, HIGH, UNKNOWN, MEDIUM, LOW and NONE.

Mexico City had the highest proportion of heavily congested wireless channels, with approximately 7% of detected access points operating under HIGH congestion conditions. Guadalajara followed with nearly 5% of deployments categorized as HIGH congestion, while Monterrey had the lowest percentage at approximately 3.29%.

These findings suggest that wireless spectrum saturation increases proportionally with urban infrastructure density and access point concentration. Despite the presence of congested deployments, most detected access points were categorized as LOW or MEDIUM congestion, suggesting severe spectrum saturation was localized rather than uniformly distributed.

Channel congestion by city (download)

A thorough analysis of individual channel utilization revealed that channels 11, 6 and 1 consistently experienced the highest congestion levels across the three cities, which correlates with our previous findings. These channels accounted for the majority of VERY_HIGH congestion classifications, particularly within the 2.4 GHz band.

In Mexico City, channel 11 alone accounted for more than 25% of detected deployments and consistently exhibited VERY_HIGH congestion levels.

This behavior reflects the limited availability of non-overlapping channels within the 2.4 GHz spectrum and the widespread reliance on default wireless configurations.

Most congested channels by city (download)

Overall, the channel utilization analysis showed that wireless deployments are concentrated heavily within the traditional, non-overlapping 2.4 GHz channels. While this strategy reduces adjacent-channel interference, excessive access point density on the same channels can still produce significant co-channel contention and poor wireless performance in high-density urban environments.

Wireless security configurations

The next thing we evaluated was the security posture of the detected wireless networks. We analyzed the wireless security configurations advertised by access points in each of the locations.

Overall security configuration distribution

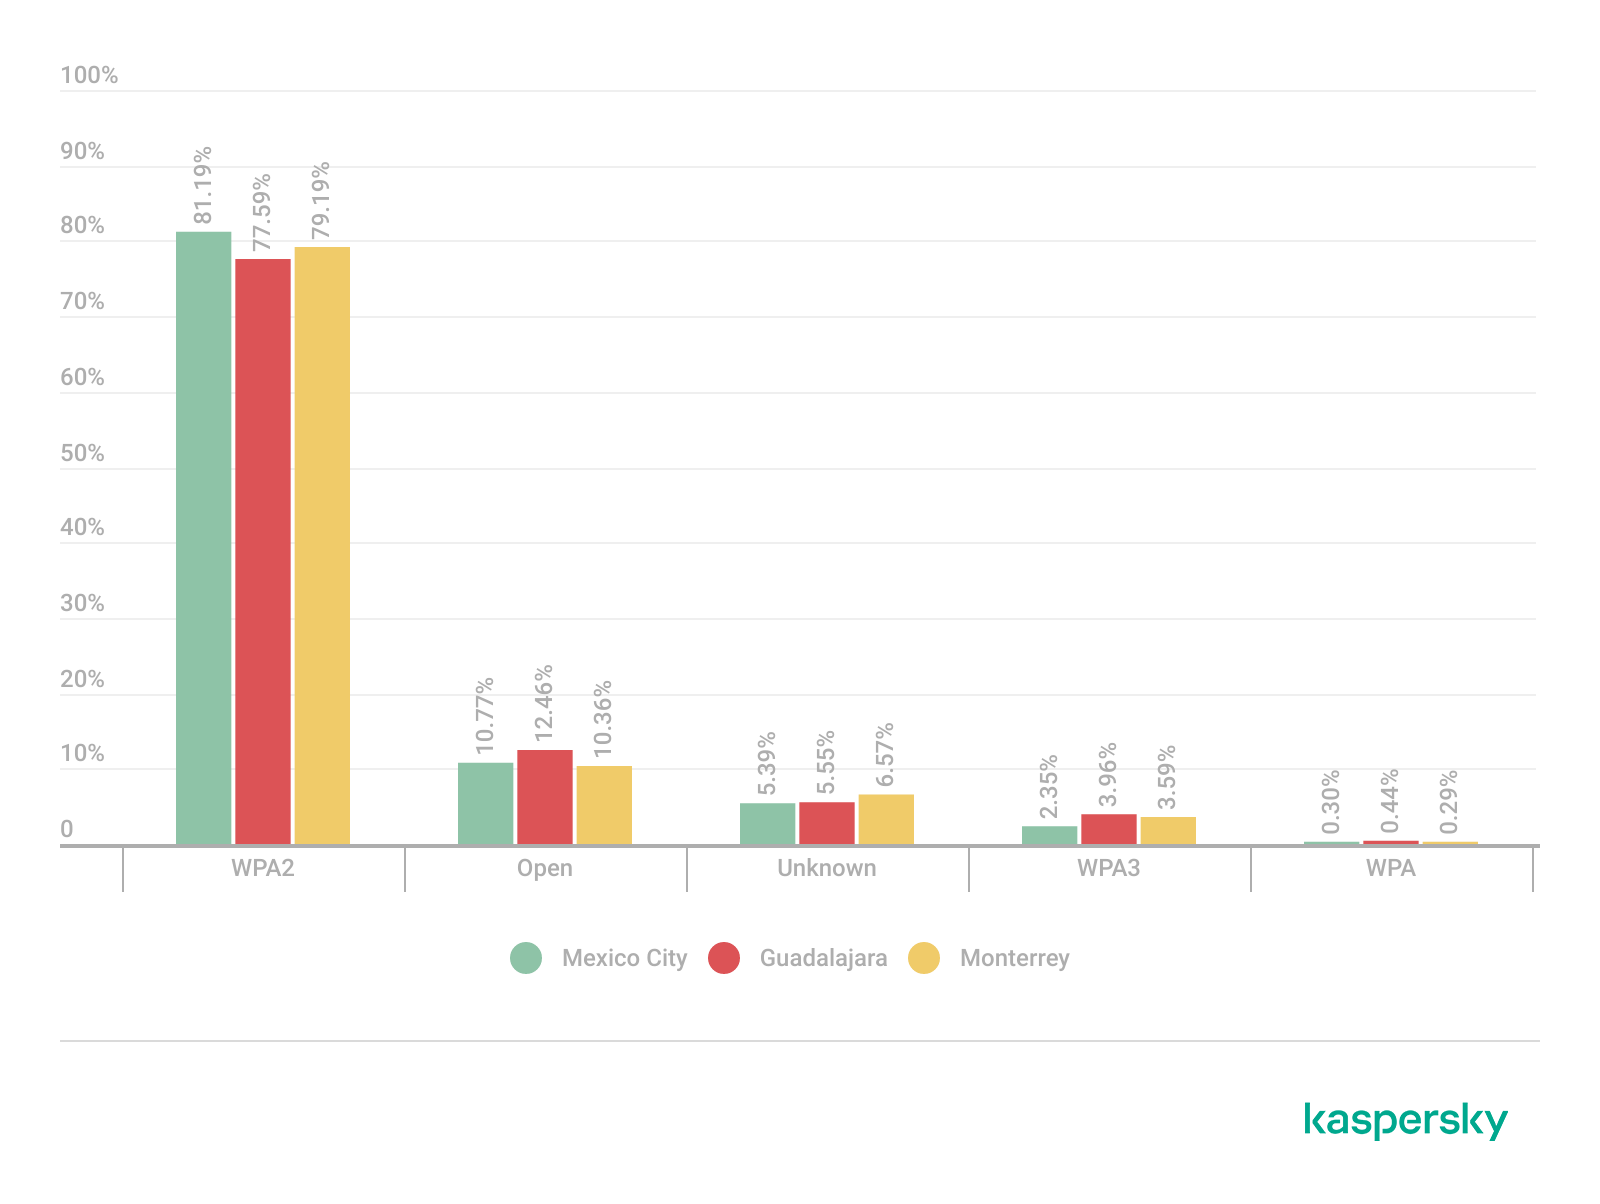
The analysis revealed that WPA2 was the dominant wireless authentication mechanism across the three cities. Mexico City had the highest WPA2 adoption rate at 81.19%, followed by Monterrey at 79.19% and Guadalajara at 77.59%.

The study found that every 6th open access point (17%) was unsafe, namely 16.5% in Mexico City, 18.5% in Guadalajara, and 17.2% in Monterrey. Open wireless deployments were consistently present across all locations, ranging between 10% and 12% of detected access points. These findings show that despite the widespread deployment of modern wireless security standards, encryption adoption remains incomplete.

Distribution of wireless authentication mechanisms across the three locations (download)

To simplify the interpretation of wireless security posture, we grouped detected networks into four categories:

  • Secure (WPA2/WPA3)
  • Insecure (Open/WEP)
  • Weak (WPA)
  • Unknown

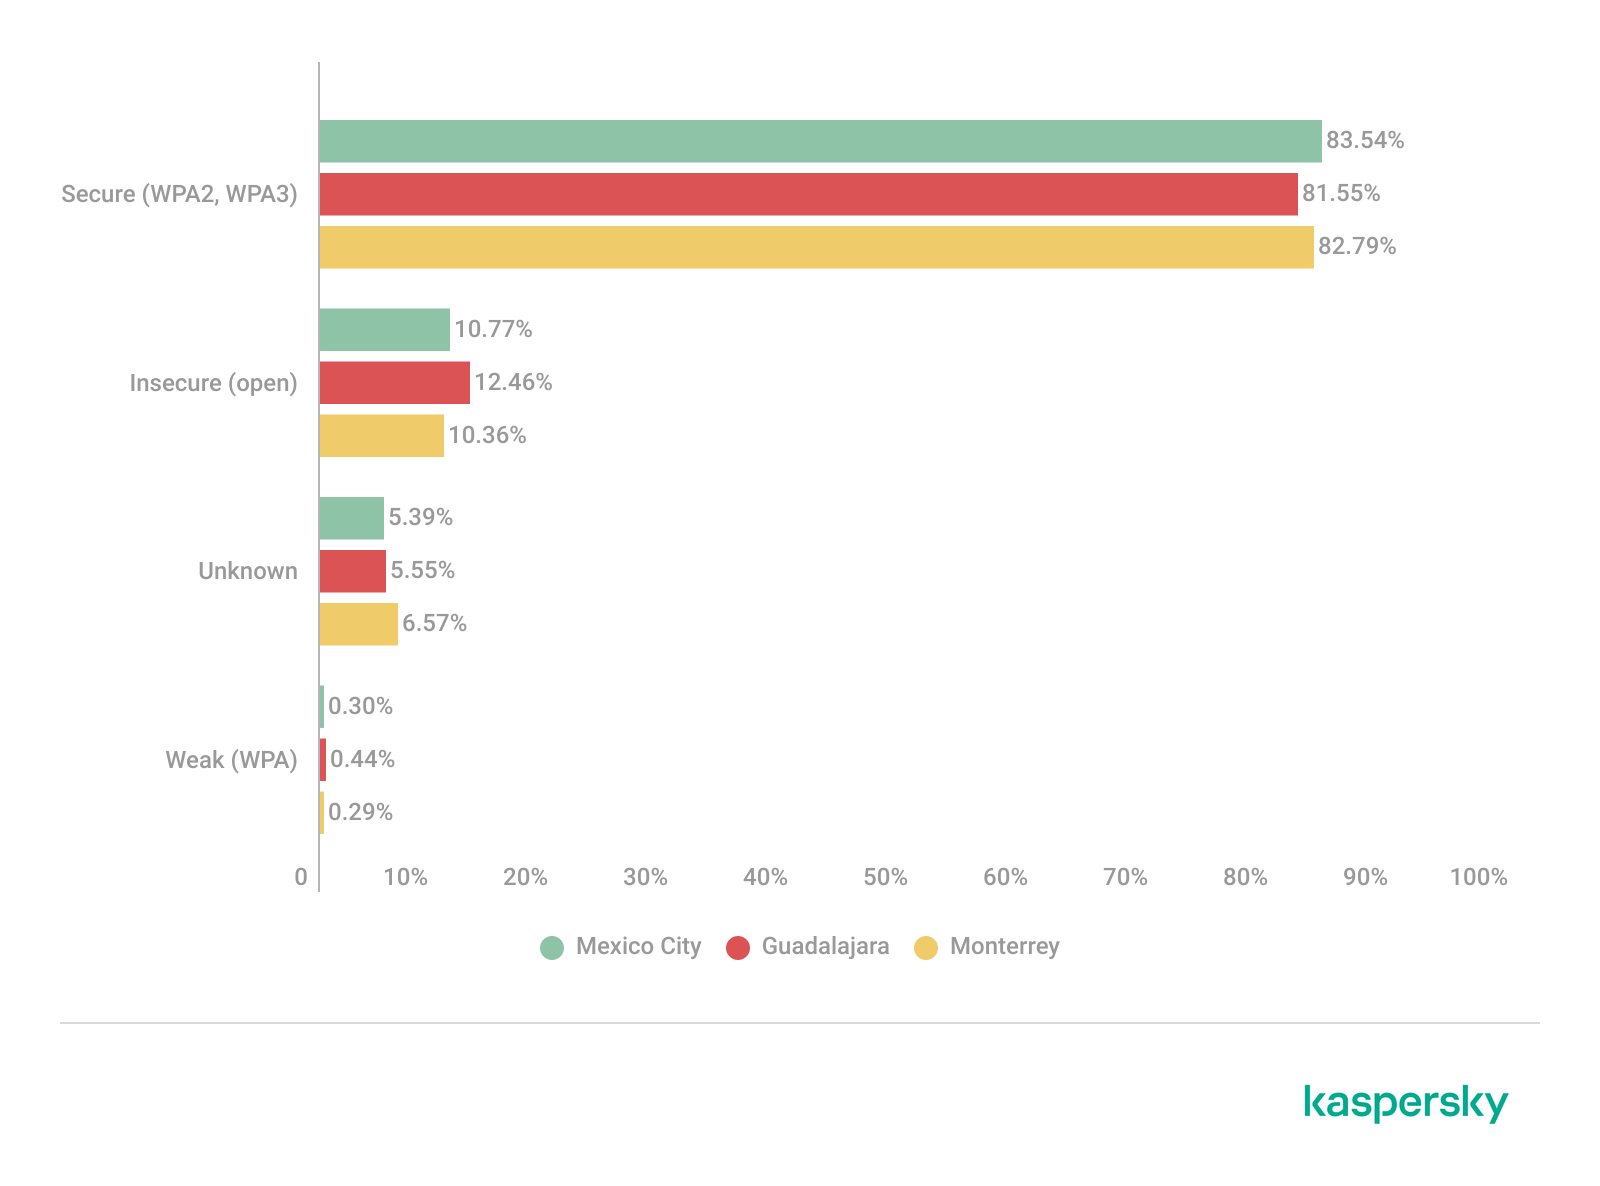
Across the three locations, secure networks comprised most of detected deployments, accounting for approximately 82% of all access points. However, insecure open networks still account for between 10% and 12% of detected wireless infrastructure, consistent with our previous findings. It is important to mention that networks within the unknown category are not considered secure.

Mexico City had the highest percentage of secure deployments at 83.54%, while Guadalajara had the highest percentage of insecure open networks at 12.46%. Although Monterrey had the lowest percentage of insecure networks, open deployments still accounted for more than 10% of the detected access points.

Wireless security posture grouping across the three locations (download)

Although modern WPA2/WPA3 encryption standards dominate current wireless deployments, the continued presence of open and legacy WPA deployments indicates that insecure wireless configurations remain relevant from an operational standpoint. These networks may expose users to passive traffic interception, unauthorized monitoring, rogue access point attacks, and credential harvesting techniques.

WPS-enabled networks

We also analyzed Wi-Fi Protected Setup (WPS) in all the locations to evaluate additional attack surfaces. WPS is a standard feature on wireless routers that enables devices such as printers, repeaters or mobile phones to connect to a secure Wi-Fi network without manually entering a long password, typically through a PIN-based enrolled mechanism. Although WPA2 and WPA3 provide strong encryption mechanisms, the presence of WPS can introduce security weaknesses due to inherently vulnerable PIN-based enrollment methods.

By combining detections from the three locations, we found that 55% of all detected access points did not advertise WPS capabilities, leaving 45% of deployments vulnerable to WPS-based abuse. These results suggest that, despite the adoption of modern encryption standards, a significant portion of wireless infrastructure continues to expose legacy convenience features.

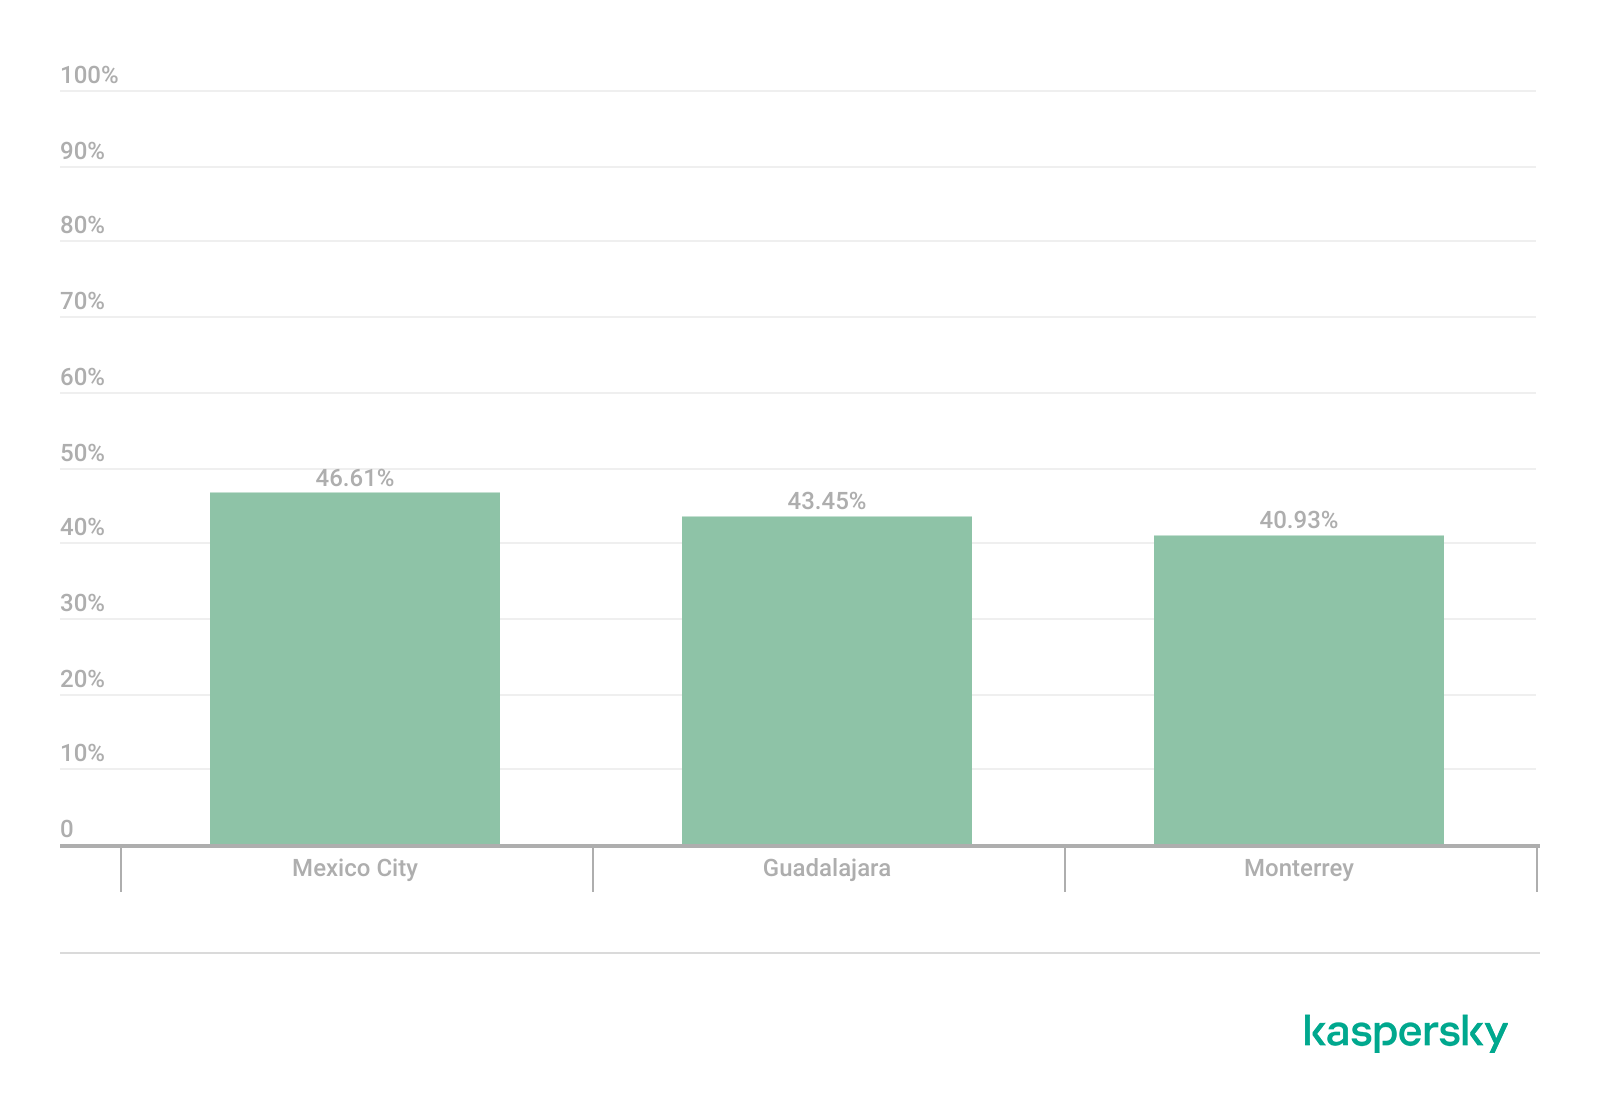
During the analysis, we found that Mexico City had the highest proportion of WPS-enabled networks, with 46.61% of the detected access points advertising WPS capabilities. Guadalajara was second with 43.45%, while Monterrey had the lowest proportion at 40.93%.

The percentage of detected access points advertising WPS capabilities across the three locations (download)

Almost half of the detected wireless networks in each city continued to advertise WPS, indicating that WPS prevalence is consistently high across the three cities.

Secure networks with WPS enabled

In many cases, networks classified as secure because of WPA2/WPA3 encryption still had WPS functionality enabled, which effectively increased the available attack surface.

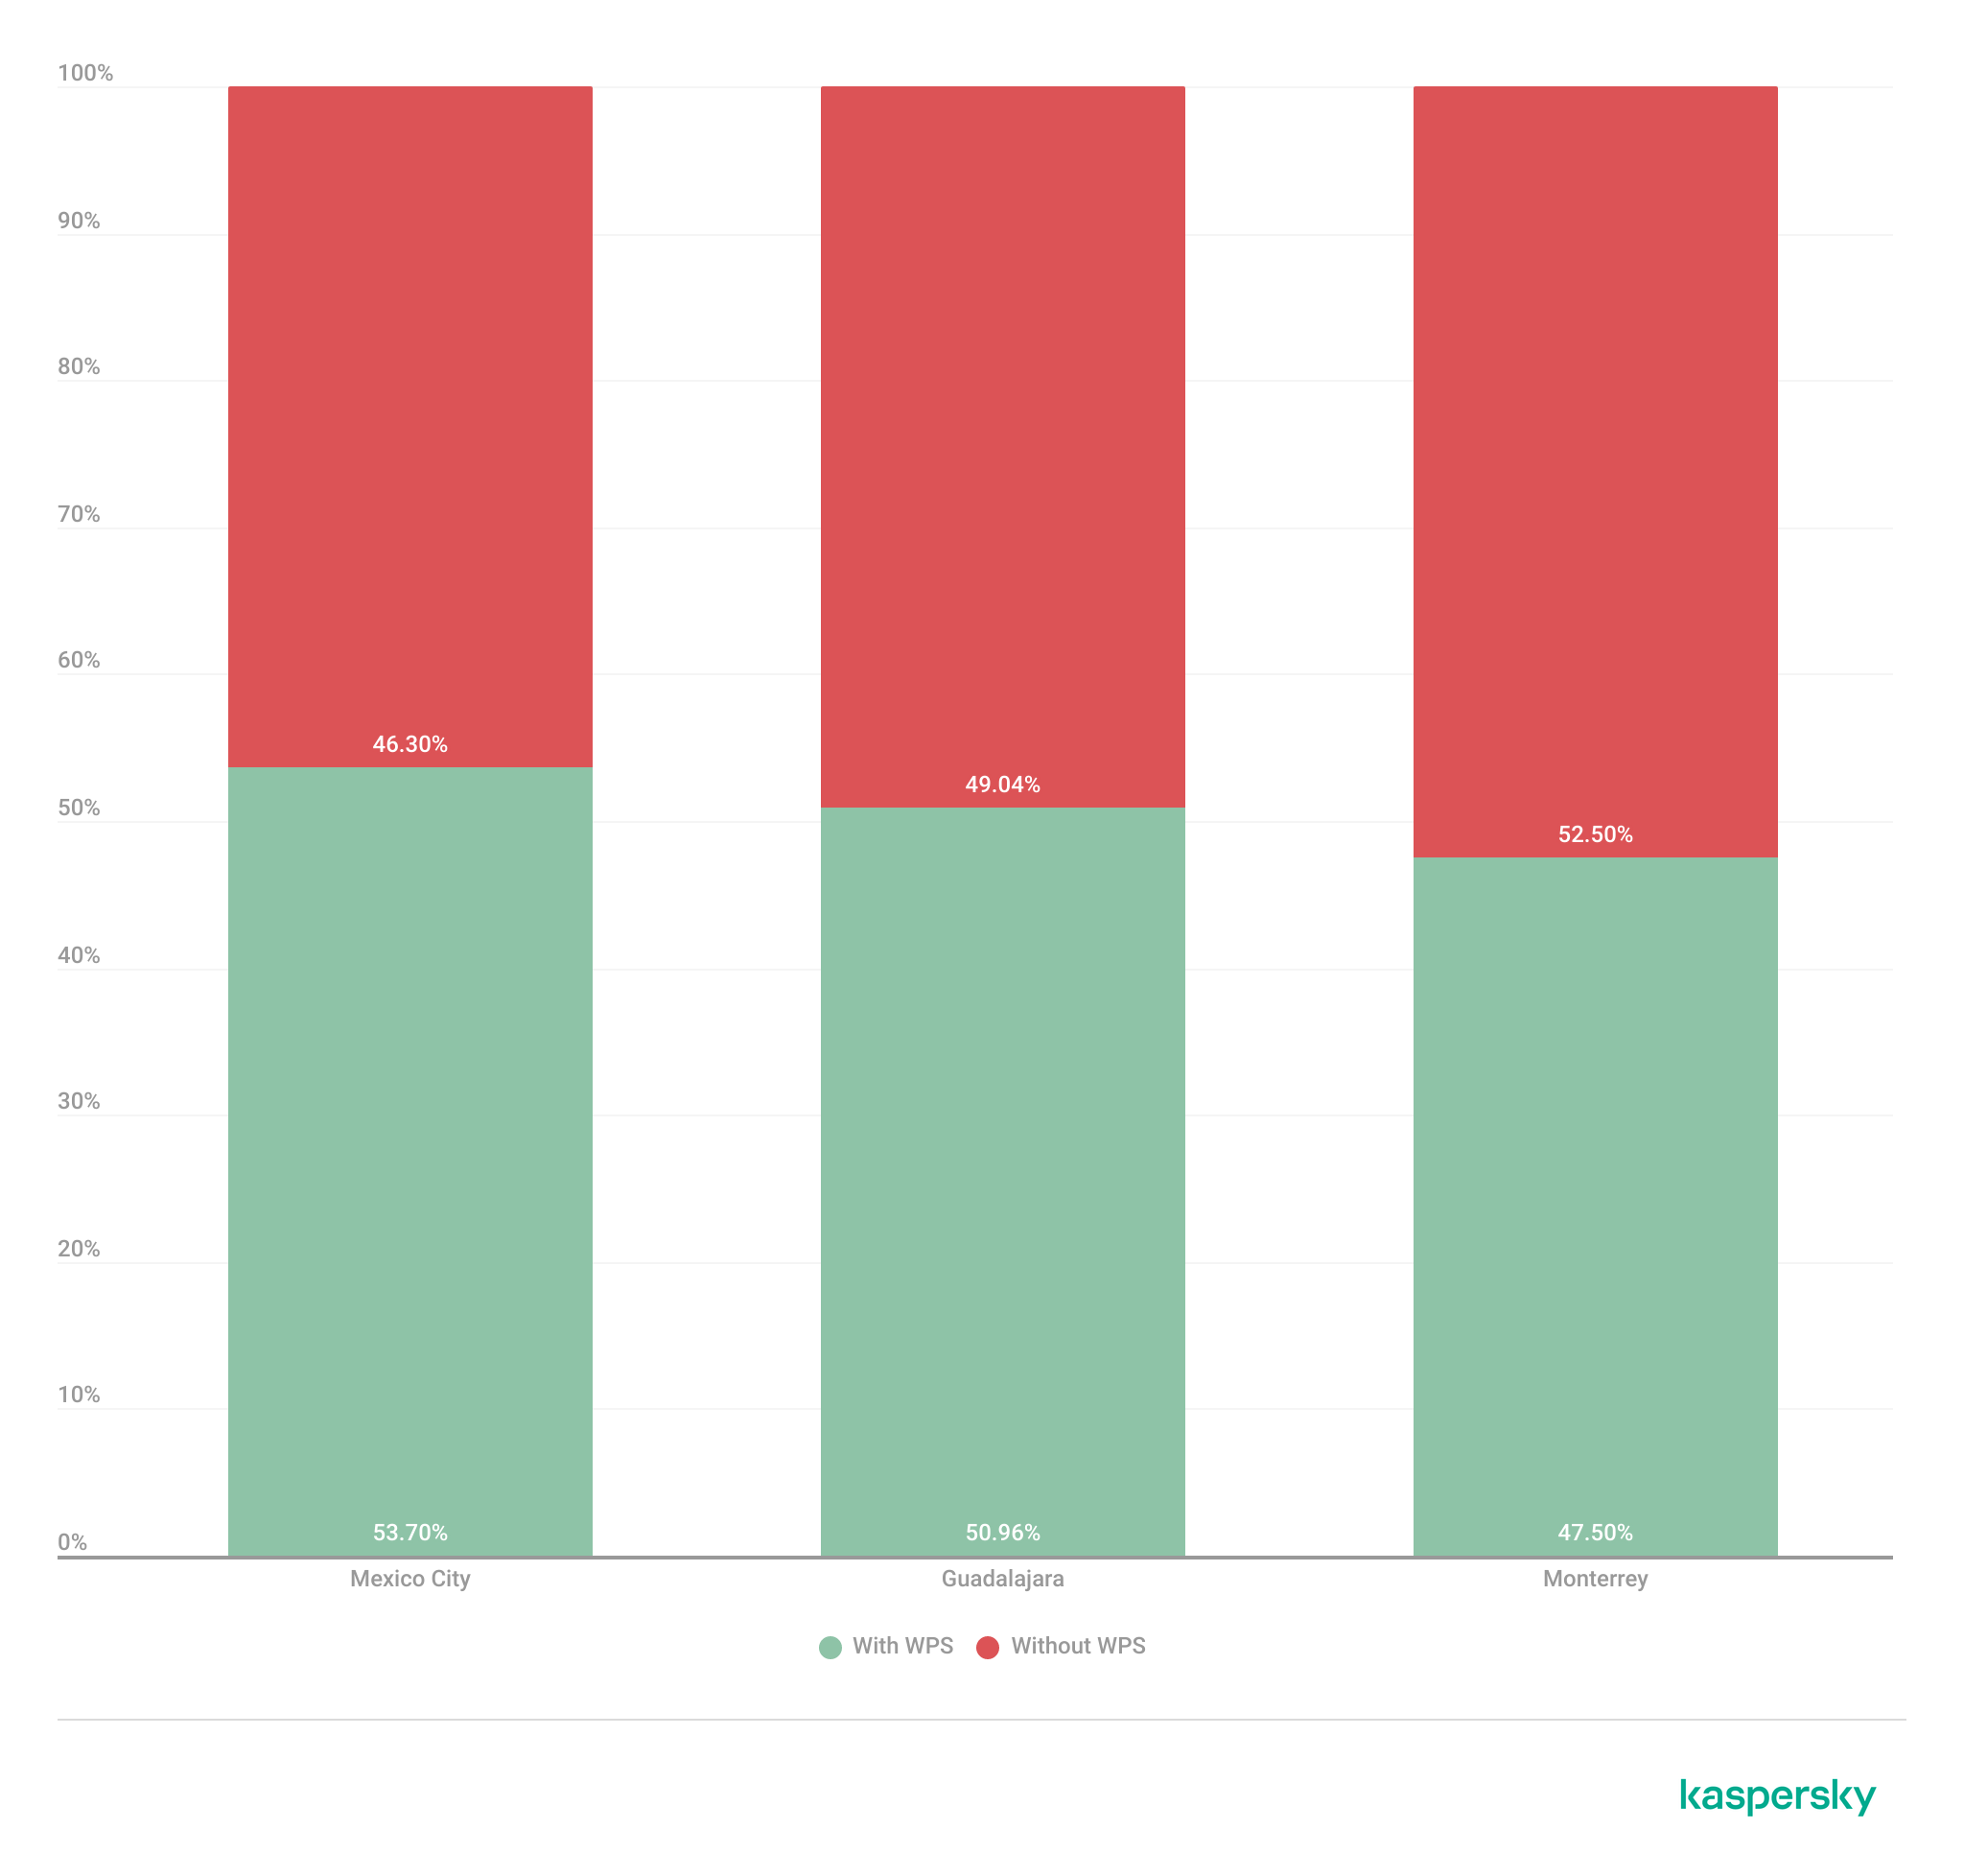
To further assess the relationship between encryption strength and WPS exposure, we conducted a secondary analysis of secure networks (WPA2/WPA3) only. The results showed that around half of all secure deployments still exposed WPS, with the following breakdown for each city:

  • Mexico City: 53.7%
  • Guadalajara: 50.9%
  • Monterrey: 47.5%

The proportion of secure networks with WPS enabled across the three locations (download)

These findings indicate that encryption strength alone is not enough to evaluate wireless security posture because additional protocol features, such as WPS, may still expose exploitable attack vectors.

Additional security considerations

Overall, travelers operating within dense public environments are exposed not only to insecure wireless infrastructure but also to various risks associated with digital interactions. These risks include many threats, from public USB charging systems and phishing QR codes to proximity-based protocols and exposure to shared public devices, such as interactive totems or kiosks. One particular point that should be taken into account in light of our research is the issue of rogue wireless deployments.

Rogue access points are not necessarily malicious; they may be set up accidentally by misconfiguring router settings. An entry point for potential compromise might be caused by various misconfigurations, from a weak password to an insecure protocol. However, attackers deploy such unauthorized hotspots with malicious intent to infiltrate a network. Threat actors may deploy rogue access points posing as legitimate public wireless networks in airports, hotels, cafés and tourist areas. These deployments are called “evil twins” and can trick users into connecting to attacker-controlled infrastructure capable of intercepting traffic, harvesting credentials, or performing man-in-the-middle attacks. Further risk lies in the potential compromise of local network devices or even malware distribution. Such threats complement our findings, underscoring the importance of implementing traffic encryption, using a security solution and exercising extreme caution while browsing via public networks.

Conclusion

The wardriving assessment conducted in Mexico City, Guadalajara, and Monterrey revealed that modern wireless infrastructure continues to present multiple forms of operational exposure despite the widespread adoption of WPA2 and WPA3 security standards. The analysis demonstrated that wireless environments are highly standardized in all the locations, with recurring ISP deployments, default SSID naming conventions, homogeneous manufacturer distribution, and predictable channel allocation practices observed in all three cities.

Although most of the detected networks were classified as secure under WPA2/WPA3 authentication mechanisms, a significant proportion were exposing additional attack surfaces through enabled WPS functionality, default configurations, sequential SSID structures, and infrastructure metadata disclosure. This demonstrates that encryption strength alone is insufficient for evaluating the overall security posture of wireless infrastructure. Additionally, the prevalence of open networks and legacy wireless configurations indicates that insecure deployments are still operationally relevant in all the locations.

The results also showed that wireless infrastructure is heavily concentrated within the 2.4 GHz spectrum, particularly around channels 11, 6, and 1. This leads to elevated congestion and increased co-channel interference in densely populated urban environments.

SSID analysis further revealed that publicly broadcast wireless identifiers frequently expose valuable operational information about ISPs, equipment manufacturers, deployment templates, organizational ownership, and user-defined naming practices. The identification of default ISP naming conventions, sequential SSID structures, and BSSID-derived SSIDs demonstrated that many deployments prioritize operational convenience and simplicity over exposure minimization and privacy.

The scope of the threats stemming from vulnerable wireless configurations poses serious digital exposure risks for users. The widespread presence of standard deployments, predictable SSID naming and publicly exposed infrastructure identifiers can facilitate passive reconnaissance, infrastructure fingerprinting and opportunistic targeting.

Recommendations

To minimize the risks of wireless-based exposure and the attack surface related to hotspot infrastructure, we recommend taking the following measures:

  • Disable WPS functionality on wireless routers whenever possible, particularly within WPA2/WPA3 deployments.
  • Avoid using default SSID naming conventions that disclose ISP providers, router manufacturers, or deployment templates.
  • Refrain from using personal, organizational, or location-based identifiers in wireless network names.
  • Avoid configuring SSID using BSSID or naming conventions derived from MAC addresses, as these may expose hardware fingerprinting information.
  • Promote migration toward modern WPA3-capable infrastructure while removing legacy wireless protocols when operationally feasible.
  • Reduce wireless congestion by optimizing channel allocation strategies and minimizing excessive dependence on the 2.4 GHz spectrum.
  • Encourage adoption of 5 GHz and newer wireless technologies to reduce interference and improve spectrum efficiency.

The findings presented in this assessment emphasize the importance of combining strong wireless encryption standards, secure deployment practices, exposure minimization strategies, and user awareness to enhance the overall security posture of wireless environments.


  •  

Wardriving assessment across Mexico: Preparing for the 2026 World Cup

Introduction

Mexico is one of the host countries for the 2026 FIFA World Cup, with matches to be played in three major cities: Mexico City, Monterrey, and Guadalajara. These locations are expected to see a large influx of international visitors, increasing the potential security risks. Many of those risks arise from users connecting to public wireless networks.

To better understand the wireless environments that visitors may encounter, we at Kaspersky GReAT conducted a wardriving assessment in the three host cities. The aim of the study was to analyze characteristics, deployment patterns, security configurations and potential exposure risks of public Wi-Fi infrastructure in urban wireless environments.

The information collected during the assessment was used exclusively for passive observation and infrastructure analysis. No attempts were made to authenticate, intercept communications, exploit systems or interact with the detected wireless networks beyond the publicly broadcast management information.

During processing of the collected data, one step involved filtering out networks belonging to cars or cell phones categorized as mobile hotspots because they do not represent networks that can be considered part of the assessment.

Research scope

The cities included in the study have high population density and extensive wireless infrastructure deployments. We chose areas with the most prominent wireless network activity and highly concentrated public access points. We carried out wardriving research in Monterrey back in 2008, but the city’s hotspot landscape has changed since then.

We chose the following analysis areas for each of the cities:

  1. Mexico City: México City Stadium, Mexico City International Airport, Zócalo, Paseo de la Reforma, Colonia Roma, La Condesa, Polanco, and Coyoacán.
  2. Guadalajara: Guadalajara Stadium, Guadalajara International Airport, the city center, Zapopan, Providencia, Avenida Chapultepec, Colonia Americana, Tlaquepaque, and the area around Andares.
  3. Monterrey: Monterrey Stadium, Monterrey International Airport, Fundidora Park, Cintermex Monterrey, the downtown area, Barrio Antiguo, MacroPlaza, and the San Pedro financial district.

The wireless information was collected using passive wireless reconnaissance techniques. The collected information included:

  • SSID analysis and information exposure, including BSSID-derived SSIDs
  • Default router configurations and ISP deployments
  • Frequency and signal characteristics
  • Channel congestion and spectrum usage
  • Wireless security configurations, including:
    • Open and insecure wireless networks
    • WPS-enabled networks
    • Secure networks (WPA2/WPA3) with WPS enabled

We performed a wireless infrastructure analysis in Mexico City, Guadalajara, and Monterrey. We drove through the areas surrounding the World Cup stadiums, tourist zones, and other places where fan concentrations are likely to be largest. Our goal was to evaluate the security status, deployment characteristics and operational exposure of detected wireless networks.

In total, we recorded 84,588 signals with 69,473 unique Service Set Identifiers (SSIDs) in busy locations and World Cup zones across the three cities. Mexico City accounted for 61.4% of the signals, Guadalajara for 23.6%, and Monterrey for 14.8%. Approximately 82% of the signals had a single SSID (81.9%, 81.34%, and 84% respectively). Notably, they all operate under the IEEE 802.11 standard protocol.

Particular attention was given to identifying standard deployment patterns, legacy configurations, default vendor settings and information disclosure through publicly broadcast wireless identifiers.

The following sections present the results that were obtained by analyzing wireless infrastructure across the three locations.

Our findings

SSID analysis and information exposure

SSID analysis was conducted to evaluate naming conventions, deployment standardization and potential information exposure.

Only a few networks (0.0047%) have an invisible SSID, meaning the names of these networks are not broadcast. Some users prefer to hide the SSID for various reasons, such as the network’s purpose, the profile of its users, internal policies, etc. In contrast, the rest of the networks maintained active SSID broadcasting.

SSID structures may unintentionally disclose operational details about internet service providers (ISPs), device manufacturers, deployment practices, organizational ownership or user identity. The repeated presence of default SSID naming patterns across the analyzed locations indicates a significant degree of infrastructure homogeneity and reuse of default wireless configurations. It may also facilitate passive infrastructure profiling by revealing standard characteristics in use.

Approximately 34% of the detected networks retained the default SSID naming conventions provided by the manufacturer or ISP, while 66% used customized identifiers.

Distribution of SSID naming conventions (download)

Several recurring SSID naming conventions associated with ISP-provided deployments were identified in the three cities. The most frequently observed patterns include identifiers such as “Club_Totalplay_WiFi”, “izzi WiFi”, and “Megacable WiFi”, which suggests extensive standardization of wireless infrastructure deployment. Additionally, we observed distinctive location-specific SSIDs in each area of analysis, such as “XXXX-Internet para Todos-CDMX” or “RED JALISCO”.

Most frequently observed SSID patterns (download)

Sequential SSID naming structures were also identified during the analysis. Patterns such as “INFINITUMXX” and “IZZI-XX” suggest automated ISP deployment and large-scale deployment strategies.

We identified 33 unique sequential naming structures among the 137 sequential SSIDs in total, representing approximately 0.16% of the detected wireless networks.

The following graph shows the top five sequential SSID patterns found in the largest number of networks:

Five most frequently observed sequential patterns (download)

Several customized SSIDs contained personal or organizational identifiers, including family names, professions, addresses or internal department references. Although personalized SSIDs may simplify local network identification for users, they may also expose sensitive information that could be useful for social engineering, physical targeting, or organizational profiling.

BSSID-derived SSID

During the analysis, multiple networks were identified that used the physical MAC address of a Wi-Fi access point (BSSID) as the visible SSID. This practice exposes hardware-level information that could facilitate vendor fingerprinting and targeted reconnaissance activities.

The organizationally unique identifier (OUI) contained in the first bytes of the BSSID identifies the equipment manufacturer. Threat actors can correlate exposed manufacturers with device-specific vulnerabilities.

BSSID-derived SSID by city (download)

Notably, we found that more than 30% of networks in all three cities reuse the MAC address as the SSID.

Default router configurations and ISP deployments

We performed wireless infrastructure profiling to identify the most common wireless equipment manufacturers and ISP deployments across the three locations.

Large-scale ISP deployments frequently use standardized wireless configurations and vendor-specific hardware platforms. Identifying dominant manufacturers and ISP naming conventions can provide insight into infrastructure and deployment practices facilitating the mapping of standardized attack surfaces.

The following figure shows the distribution of the most commonly used manufacturers.

Most frequently observed wireless equipment manufacturers (download)

The manufacturer analysis revealed a strong concentration of wireless infrastructure among a limited number of vendors. Across the three locations, Huawei Technologies, MediaTek-based devices, and other manufacturers’ equipment that is distributed through ISP channels represented a significant portion of the detected deployments. Mexico City had the most diverse infrastructure, while Monterrey and Guadalajara had a greater concentration of wireless equipment known as SOHO (small office/home office) or residential-grade hardware. The widespread presence of standard vendor platforms may facilitate infrastructure fingerprinting and large-scale targeting of known device-specific vulnerabilities.

Most frequently observed wireless equipment manufacturers across the three cities (download)

ISP deployments frequently exhibited standardized configuration patterns and recurring manufacturer identifiers. Our ISP deployment analysis revealed a high concentration of access points associated with major residential internet providers. Deployments associated with Infinitum, Totalplay and Izzi represented a substantial portion of the detected wireless infrastructure across all locations. These findings suggest a high degree of deployment standardization across networks associated with major residential internet providers. This observation was supported by the repeated presence of ISP-associated SSIDs such as “Infinitum”, “Totalplay”, and “Izzi”, combined with manufacturer identifiers frequently associated with consumer equipment, including Huawei, ZTE and other residential wireless equipment vendors.

It is important to note that, for this analysis, ISPs were primarily inferred from SSID naming conventions and manufacturer fingerprint data. A significant portion of the detected wireless networks fell into the “UNKNOWN/CUSTOM” category. This classification includes custom hotspots and networks whose naming conventions did not expose identifiable ISP-associated patterns. The findings suggest that many users and organizations (as we saw previously, approximately 66%) use custom network names, limiting direct provider attribution.

The following figure illustrates the distribution of ISP-associated wireless deployments in general.

Most frequently observed ISPs (download)

To better understand this distribution, we took the most frequently observed ISPs by city.

Most frequently observed ISPs across the three cities (download)

Frequency and signal characteristics

We also analyzed wireless signal characteristics to evaluate coverage quality, signal strength, and frequency band utilization in the three cities. In dense urban environments, signal quality and frequency spectrum distribution can affect wireless reliability, client connectivity, roaming performance, and overall network efficiency.

Signal quality analysis revealed that a substantial portion of the detected access points operated under weak or very weak signal conditions. Monterrey had the highest percentage of very weak signals, with approximately 50% of detected deployments. Similar patterns were observed in Guadalajara and Mexico City, suggesting high-density wireless environments with overlapping coverage areas. Only a limited percentage of networks were classified within the very good or excellent signal categories across the three locations.

Signal quality distribution by city (download)

Signal stability analysis revealed that most detected wireless deployments exhibited stable beacon transmission behavior. More than 96% of the detected access points across all locations were classified as stable, while only a small percentage exhibited unstable or indeterminate signal behavior.

These findings imply that the majority of the wireless infrastructure observed during the assessment corresponded to permanently deployed access points rather than transient or intermittent wireless devices.

Signal stability status (download)

Frequency band analysis revealed the strong prevalence of 2.4 GHz wireless deployments across the three locations. More than 95% of the detected wireless networks operated within the 2.4 GHz spectrum, while only a small percentage of deployments were classified under the unknown or non-standard frequency categories. This uneven distribution reflects the continued prevalence of legacy-compatible wireless infrastructure and SOHO deployments.

Frequency band utilization (download)

These findings are consistent with dense urban wireless environments with large numbers of access points in restricted spectrum allocations.

Channel congestion and spectrum usage

Next, we analyzed wireless channel utilization to evaluate frequency spectrum congestion and channel allocation patterns across the three cities. Our analysis focused on the 2.4 GHz spectrum, where channel overlap and high access point density commonly produce interference and degraded wireless performance. In densely populated wireless environments, an excessive concentration of access points on a limited number of channels can lead to co-channel interference, packet collisions, reduced throughput, and degraded network stability.

Spectrum congestion analysis revealed that the 2.4 GHz band consistently experienced elevated congestion levels across the three cities. The detailed results showed a strong concentration of deployments on channels 11, 6 and 1, which are traditionally recommended as non-overlapping channels within the 2.4 GHz spectrum. Channel 11 was the most utilized channel, accounting for 25.2% of the detected access points, followed by channel 6 with 22.5% and channel 1 with 19.5%. This distribution indicates that most wireless deployments adhere to standard channel allocation practices for 2.4 GHz Wi-Fi environments.

The following figure illustrates the overall distribution of the most frequently utilized wireless channels.

Most utilized wireless channels (download)

To further assess wireless spectrum saturation, the detected access points were grouped according to channel congestion levels: VERY_HIGH, HIGH, UNKNOWN, MEDIUM, LOW and NONE.

Mexico City had the highest proportion of heavily congested wireless channels, with approximately 7% of detected access points operating under HIGH congestion conditions. Guadalajara followed with nearly 5% of deployments categorized as HIGH congestion, while Monterrey had the lowest percentage at approximately 3.29%.

These findings suggest that wireless spectrum saturation increases proportionally with urban infrastructure density and access point concentration. Despite the presence of congested deployments, most detected access points were categorized as LOW or MEDIUM congestion, suggesting severe spectrum saturation was localized rather than uniformly distributed.

Channel congestion by city (download)

A thorough analysis of individual channel utilization revealed that channels 11, 6 and 1 consistently experienced the highest congestion levels across the three cities, which correlates with our previous findings. These channels accounted for the majority of VERY_HIGH congestion classifications, particularly within the 2.4 GHz band.

In Mexico City, channel 11 alone accounted for more than 25% of detected deployments and consistently exhibited VERY_HIGH congestion levels.

This behavior reflects the limited availability of non-overlapping channels within the 2.4 GHz spectrum and the widespread reliance on default wireless configurations.

Most congested channels by city (download)

Overall, the channel utilization analysis showed that wireless deployments are concentrated heavily within the traditional, non-overlapping 2.4 GHz channels. While this strategy reduces adjacent-channel interference, excessive access point density on the same channels can still produce significant co-channel contention and poor wireless performance in high-density urban environments.

Wireless security configurations

The next thing we evaluated was the security posture of the detected wireless networks. We analyzed the wireless security configurations advertised by access points in each of the locations.

Overall security configuration distribution

The analysis revealed that WPA2 was the dominant wireless authentication mechanism across the three cities. Mexico City had the highest WPA2 adoption rate at 81.19%, followed by Monterrey at 79.19% and Guadalajara at 77.59%.

The study found that every 6th open access point (17%) was unsafe, namely 16.5% in Mexico City, 18.5% in Guadalajara, and 17.2% in Monterrey. Open wireless deployments were consistently present across all locations, ranging between 10% and 12% of detected access points. These findings show that despite the widespread deployment of modern wireless security standards, encryption adoption remains incomplete.

Distribution of wireless authentication mechanisms across the three locations (download)

To simplify the interpretation of wireless security posture, we grouped detected networks into four categories:

  • Secure (WPA2/WPA3)
  • Insecure (Open/WEP)
  • Weak (WPA)
  • Unknown

Across the three locations, secure networks comprised most of detected deployments, accounting for approximately 82% of all access points. However, insecure open networks still account for between 10% and 12% of detected wireless infrastructure, consistent with our previous findings. It is important to mention that networks within the unknown category are not considered secure.

Mexico City had the highest percentage of secure deployments at 83.54%, while Guadalajara had the highest percentage of insecure open networks at 12.46%. Although Monterrey had the lowest percentage of insecure networks, open deployments still accounted for more than 10% of the detected access points.

Wireless security posture grouping across the three locations (download)

Although modern WPA2/WPA3 encryption standards dominate current wireless deployments, the continued presence of open and legacy WPA deployments indicates that insecure wireless configurations remain relevant from an operational standpoint. These networks may expose users to passive traffic interception, unauthorized monitoring, rogue access point attacks, and credential harvesting techniques.

WPS-enabled networks

We also analyzed Wi-Fi Protected Setup (WPS) in all the locations to evaluate additional attack surfaces. WPS is a standard feature on wireless routers that enables devices such as printers, repeaters or mobile phones to connect to a secure Wi-Fi network without manually entering a long password, typically through a PIN-based enrolled mechanism. Although WPA2 and WPA3 provide strong encryption mechanisms, the presence of WPS can introduce security weaknesses due to inherently vulnerable PIN-based enrollment methods.

By combining detections from the three locations, we found that 55% of all detected access points did not advertise WPS capabilities, leaving 45% of deployments vulnerable to WPS-based abuse. These results suggest that, despite the adoption of modern encryption standards, a significant portion of wireless infrastructure continues to expose legacy convenience features.

During the analysis, we found that Mexico City had the highest proportion of WPS-enabled networks, with 46.61% of the detected access points advertising WPS capabilities. Guadalajara was second with 43.45%, while Monterrey had the lowest proportion at 40.93%.

The percentage of detected access points advertising WPS capabilities across the three locations (download)

Almost half of the detected wireless networks in each city continued to advertise WPS, indicating that WPS prevalence is consistently high across the three cities.

Secure networks with WPS enabled

In many cases, networks classified as secure because of WPA2/WPA3 encryption still had WPS functionality enabled, which effectively increased the available attack surface.

To further assess the relationship between encryption strength and WPS exposure, we conducted a secondary analysis of secure networks (WPA2/WPA3) only. The results showed that around half of all secure deployments still exposed WPS, with the following breakdown for each city:

  • Mexico City: 53.7%
  • Guadalajara: 50.9%
  • Monterrey: 47.5%

The proportion of secure networks with WPS enabled across the three locations (download)

These findings indicate that encryption strength alone is not enough to evaluate wireless security posture because additional protocol features, such as WPS, may still expose exploitable attack vectors.

Additional security considerations

Overall, travelers operating within dense public environments are exposed not only to insecure wireless infrastructure but also to various risks associated with digital interactions. These risks include many threats, from public USB charging systems and phishing QR codes to proximity-based protocols and exposure to shared public devices, such as interactive totems or kiosks. One particular point that should be taken into account in light of our research is the issue of rogue wireless deployments.

Rogue access points are not necessarily malicious; they may be set up accidentally by misconfiguring router settings. An entry point for potential compromise might be caused by various misconfigurations, from a weak password to an insecure protocol. However, attackers deploy such unauthorized hotspots with malicious intent to infiltrate a network. Threat actors may deploy rogue access points posing as legitimate public wireless networks in airports, hotels, cafés and tourist areas. These deployments are called “evil twins” and can trick users into connecting to attacker-controlled infrastructure capable of intercepting traffic, harvesting credentials, or performing man-in-the-middle attacks. Further risk lies in the potential compromise of local network devices or even malware distribution. Such threats complement our findings, underscoring the importance of implementing traffic encryption, using a security solution and exercising extreme caution while browsing via public networks.

Conclusion

The wardriving assessment conducted in Mexico City, Guadalajara, and Monterrey revealed that modern wireless infrastructure continues to present multiple forms of operational exposure despite the widespread adoption of WPA2 and WPA3 security standards. The analysis demonstrated that wireless environments are highly standardized in all the locations, with recurring ISP deployments, default SSID naming conventions, homogeneous manufacturer distribution, and predictable channel allocation practices observed in all three cities.

Although most of the detected networks were classified as secure under WPA2/WPA3 authentication mechanisms, a significant proportion were exposing additional attack surfaces through enabled WPS functionality, default configurations, sequential SSID structures, and infrastructure metadata disclosure. This demonstrates that encryption strength alone is insufficient for evaluating the overall security posture of wireless infrastructure. Additionally, the prevalence of open networks and legacy wireless configurations indicates that insecure deployments are still operationally relevant in all the locations.

The results also showed that wireless infrastructure is heavily concentrated within the 2.4 GHz spectrum, particularly around channels 11, 6, and 1. This leads to elevated congestion and increased co-channel interference in densely populated urban environments.

SSID analysis further revealed that publicly broadcast wireless identifiers frequently expose valuable operational information about ISPs, equipment manufacturers, deployment templates, organizational ownership, and user-defined naming practices. The identification of default ISP naming conventions, sequential SSID structures, and BSSID-derived SSIDs demonstrated that many deployments prioritize operational convenience and simplicity over exposure minimization and privacy.

The scope of the threats stemming from vulnerable wireless configurations poses serious digital exposure risks for users. The widespread presence of standard deployments, predictable SSID naming and publicly exposed infrastructure identifiers can facilitate passive reconnaissance, infrastructure fingerprinting and opportunistic targeting.

Recommendations

To minimize the risks of wireless-based exposure and the attack surface related to hotspot infrastructure, we recommend taking the following measures:

  • Disable WPS functionality on wireless routers whenever possible, particularly within WPA2/WPA3 deployments.
  • Avoid using default SSID naming conventions that disclose ISP providers, router manufacturers, or deployment templates.
  • Refrain from using personal, organizational, or location-based identifiers in wireless network names.
  • Avoid configuring SSID using BSSID or naming conventions derived from MAC addresses, as these may expose hardware fingerprinting information.
  • Promote migration toward modern WPA3-capable infrastructure while removing legacy wireless protocols when operationally feasible.
  • Reduce wireless congestion by optimizing channel allocation strategies and minimizing excessive dependence on the 2.4 GHz spectrum.
  • Encourage adoption of 5 GHz and newer wireless technologies to reduce interference and improve spectrum efficiency.

The findings presented in this assessment emphasize the importance of combining strong wireless encryption standards, secure deployment practices, exposure minimization strategies, and user awareness to enhance the overall security posture of wireless environments.

  •  

State of ransomware in 2026

With International Anti-Ransomware Day taking place on May 12, Kaspersky presents its annual report on the evolving global and regional ransomware cyberthreat landscape.

Ransomware remains one of the most persistent and adaptive cyberthreats. In 2026:

  • New families continue to emerge, adopting post-quantum cryptography ciphers.
  • As ransom payments drop, some groups implement encryptionless extortion attacks.
  • In a constantly changing ecosystem of threat actors, initial access brokers maintain a relevant role in this market, showing increased focus on access to RDWeb as the preferred method of remote access.

Ransomware attacks decline but remain a major threat

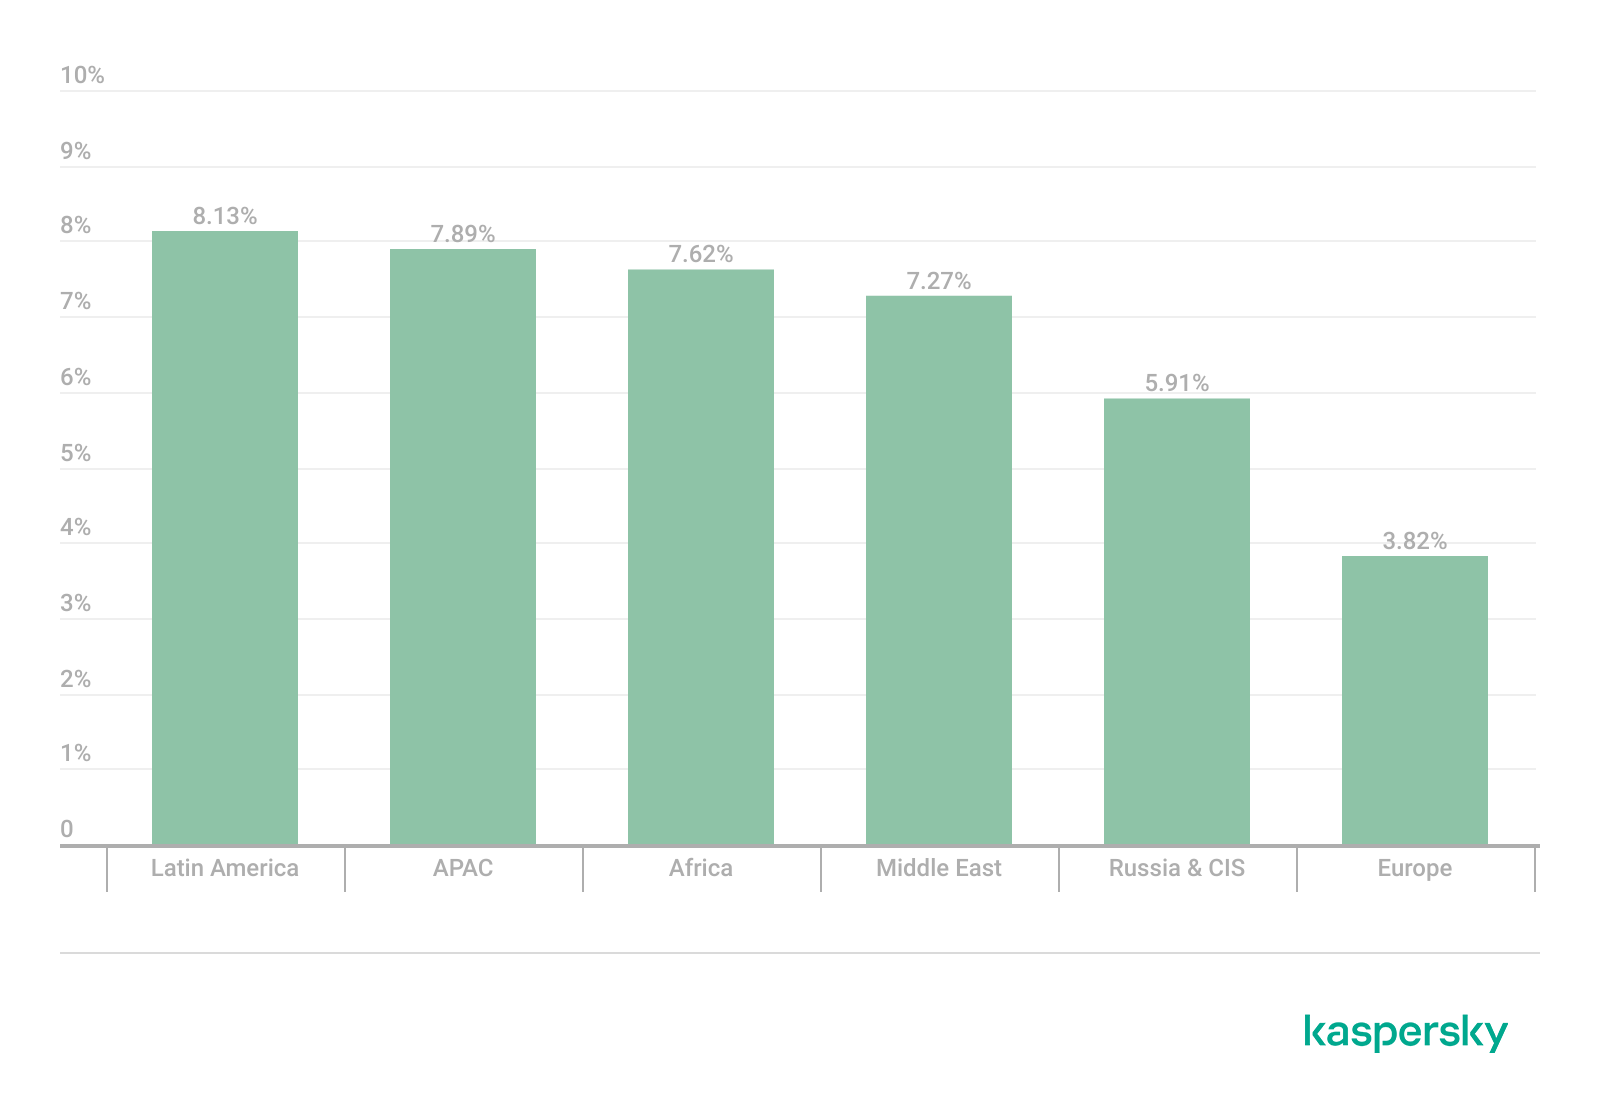
According to Kaspersky Security Network, the share of organizations affected by ransomware decreased in 2025 across all regions compared to 2024.

Percentage of organizations affected by ransomware attacks by region, 2025 (download)

Despite the formal decrease, organizations across all sectors continue to face a high likelihood of attack, as ransomware operators refine their tactics and scale their operations with increasing efficiency. Kaspersky and VDC Research have found that in the manufacturing sector alone, ransomware attacks may have caused over $18 billion in losses in the first three quarters of the year.

The continued rise of EDR killers and defense evasion tooling

In 2026, ransomware operators increasingly prioritize neutralizing endpoint defenses before executing their payloads. Tools commonly referred to as “EDR killers” have become a standard component of attack playbooks. This reflects a continuing trend toward more deliberate and methodical intrusions.

Attackers attempt to terminate security processes and disable monitoring agents, often by exploiting trusted components such as signed drivers. This technique is called Bring Your Own Vulnerable Driver (BYOVD) and allows adversaries to blend into legitimate system activity while gradually degrading defensive visibility.

Thus, evasion is no longer an opportunistic step but a planned and repeatable phase of the attack lifecycle. As a result, organizations are increasingly challenged not just to detect ransomware but also to maintain control in environments where security controls themselves are actively targeted.

The appearance of new families adopting post-quantum cryptography

We predicted that quantum-resistant ransomware would appear in 2025. Looking back at the previous year, we see that advanced ransomware groups indeed started using post-quantum cryptography as quantum computing evolved. The encryption techniques used by this quantum-proof ransomware could be used to resist decryption attempts from both classical and quantum computers, making it nearly impossible for victims to decrypt their data without having to pay a ransom.

One example is the appearance of the PE32 ransomware family (link in Russian); it leverages the cutting-edge ML-KEM (Module-Lattice-Based Key-Encapsulation Mechanism) standard to secure its AES keys. This specific cryptographic framework was recently selected by NIST as the primary standard for post-quantum defense.

Within the PE32 ransomware architecture, this is realized through the Kyber1024 algorithm, a robust mechanism providing Level 5 security, roughly equivalent in strength to AES-256. Its primary function is the secure generation and transmission of shared secrets between parties, specifically engineered to withstand future quantum computing attacks. This shift toward post-quantum readiness is part of a broader industry trend; for instance, TLS 1.3 and QUIC protocols have already adopted the X25519Kyber768 hybrid model, which fuses classical encryption with quantum-resistant security.

The shift to encryptionless extortion

In 2025, the share of ransoms paid dropped to 28%. As a response to this, one of the developments in the 2026 landscape is the growing prevalence of extortion incidents in which no file encryption takes place at all. Instead, attackers leave out the “ware” in “ransomware” and focus on extracting sensitive data and leveraging the threat of public disclosure as their primary means of extortion. ShinyHunters is an excellent example of such a group, using a data leak site to publicize its victims.

By avoiding encryption, attackers may aim at reducing the likelihood of immediate detection, shortening the duration of the attack, and eliminating dependencies on stable encryption routines. Often, this model is used alongside traditional tactics in so-called double extortion schemes, but an increasing number of campaigns rely exclusively on data theft.

For victims, this shift fundamentally changes the nature of the risk. While backups remain effective against encryption-based disruption, they provide no protection against data exposure, regulatory consequences, and reputational damage. Ransomware is therefore evolving from a business continuity issue into a broader data security and compliance challenge.

Industrialization of initial access (Access-as-a-Service)

The ransomware ecosystem continues to evolve toward a highly industrialized and specialized model, with initial access remaining as one of its most critical components. In 2026, many ransomware operators keep relying on IABs (initial access brokers), a network of intermediaries who supply pre-compromised access to corporate environments, aiming to no longer perform full intrusions themselves.

This “access-as-a-service” model is fueled by credential theft operations, and the widespread availability of compromised accounts harvested through infostealers and phishing campaigns.

The primary access vectors offered for sale have not changed: RDP, VPN, and RDWeb are still the top access vectors. Consequently, remote access infrastructure remains the primary attack surface for initial access sales. In response to the measures against public exposure of RDP access points to the internet, attackers are now targeting RDWeb portals, which are frequently vulnerable and occasionally inadequately safeguarded.

The result is a threat landscape where unauthorized access is increasingly commoditized, and the barrier to launching ransomware attacks declines. This means that preventing initial compromise is only part of the challenge; equal emphasis must be placed on detecting misuse of legitimate credentials and limiting lateral movement within already-breached environments.
Ransomware developments on the dark web

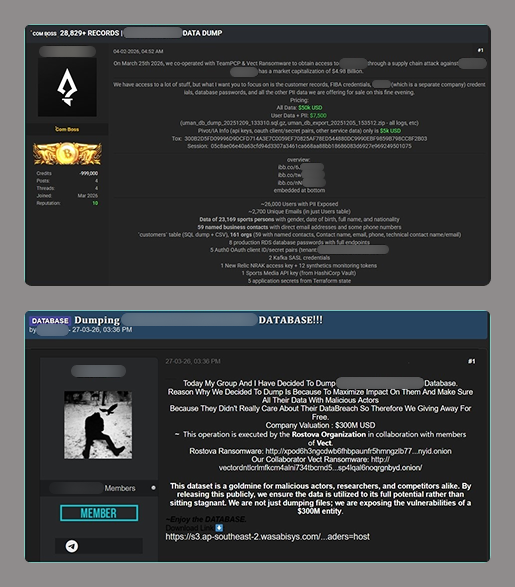
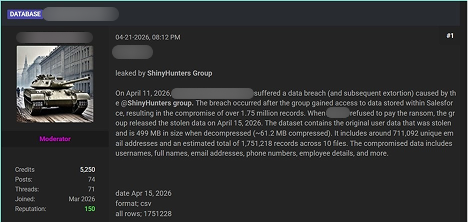
Telegram channels and underground forums increasingly function as platforms for the distribution and sale of compromised datasets and access credentials including those that were obtained as a result of ransomware attacks.

Advertisements posted on these resources typically include the nature of the access, a description of the exfiltrated or compromised data, price terms, and contact information for prospective buyers. In addition, some malicious actors mention their collaboration with other ransomware groups. Lesser-known gangs can use this name-dropping to promote themselves

Multiple threat actors not related to ransomware groups distribute datasets downloaded from ransomware blogs on underground forums and Telegram. By re-publishing download links and files, they spread compromised data as well as information on the ransomware attack within the community.

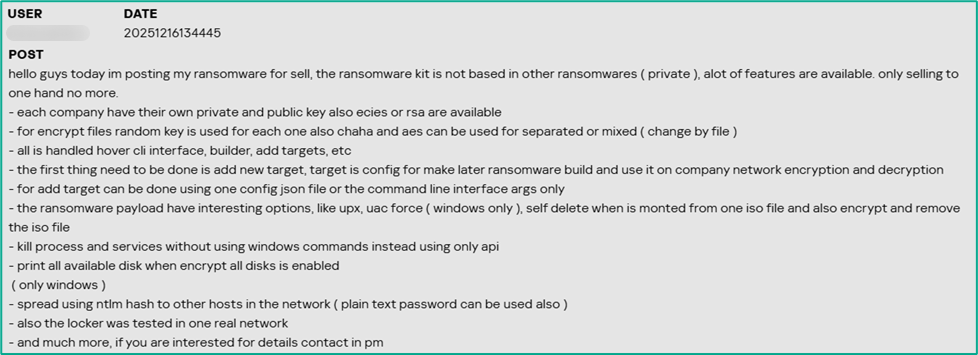
The ransomware itself is also sold or offered for subscription on the dark web platforms. The sellers underscore the uniqueness of their malware, as well as its encryption and defense evasion features.

Law enforcement actions

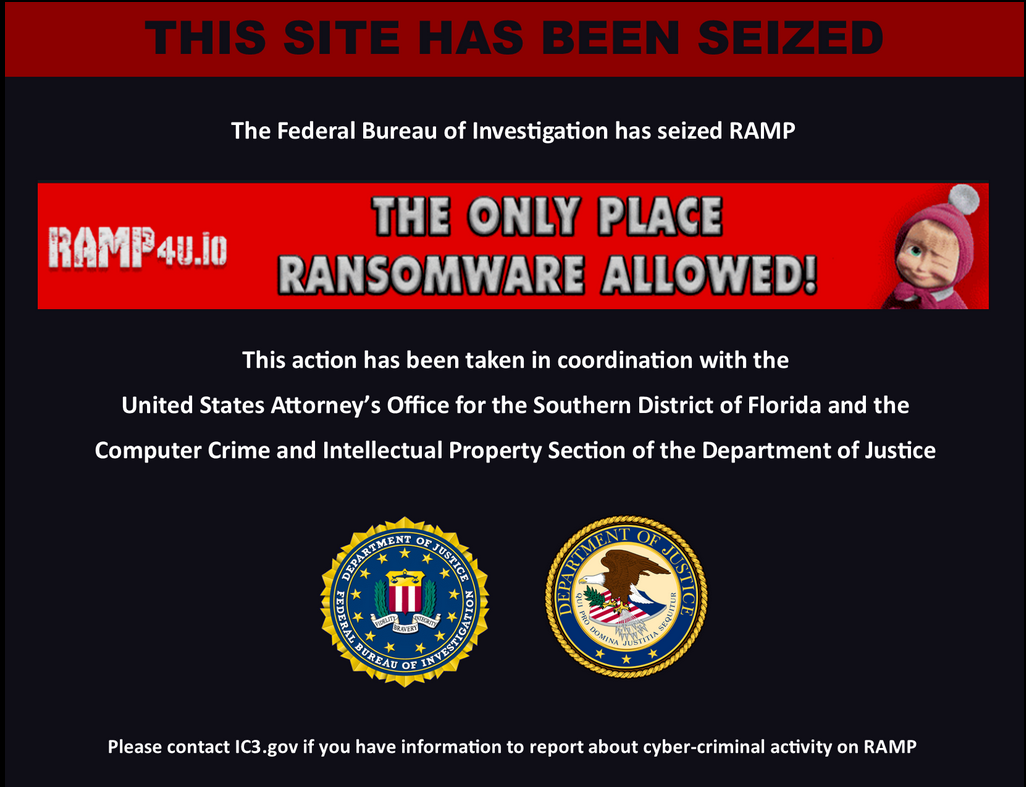
Law enforcement agencies are actively shutting down dark web platforms and ransomware data leak sites. A major underground forum, RAMP, which also functioned as a platform for threat actors to advertise their ransomware services and publish service‑related updates, was seized by authorities in January 2026. Another underground forum, LeakBase, where malicious actors distributed exfiltrated and compromised data, was seized in March 2026. In 2025, law enforcement agencies seized well-known forums like Nulled, Cracked, and XSS. Also in 2025, the DLSs of BlackSuit and 8Base ransomware groups were seized. These takedowns cause inconvenience to ransomware coordination, specifically for initial access brokers and affiliates, though similar forums are expected to fill the void over time.

Top ransomware groups in 2025

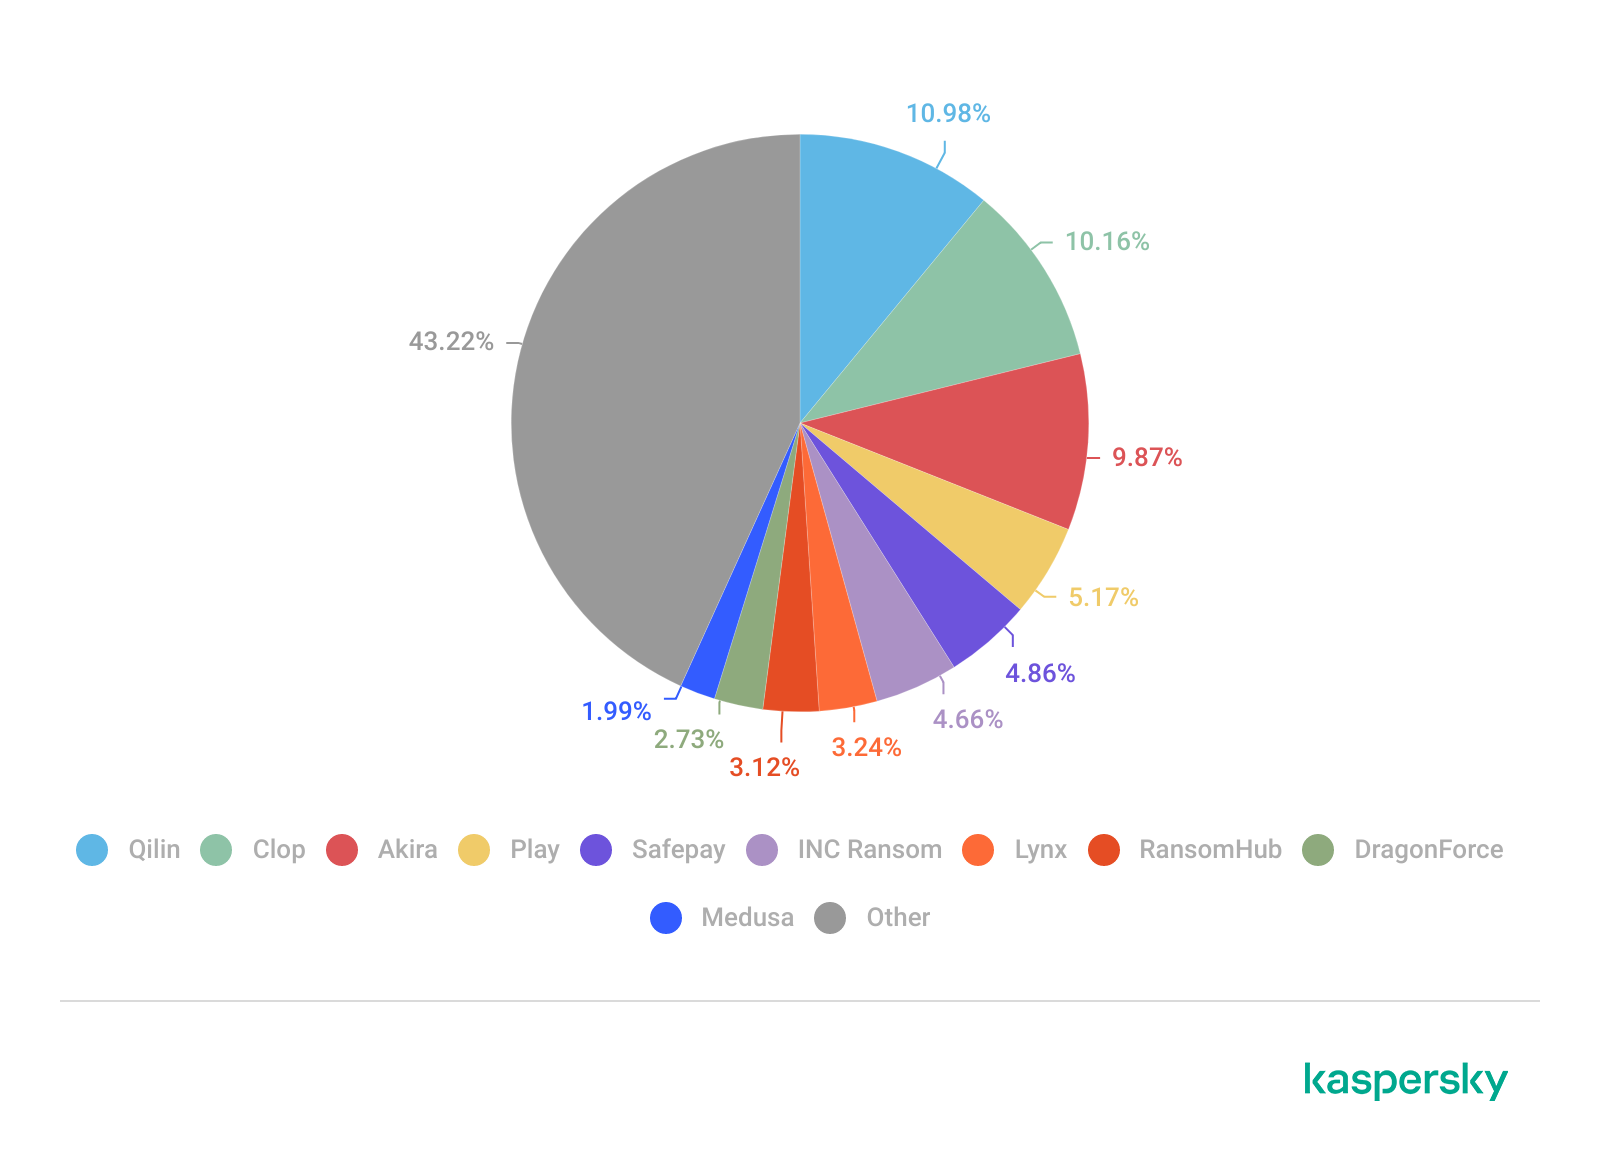
RansomHub’s sudden dormancy in 2025 marked a shift, and Qilin became the dominant player from Q2 onward. According to Kaspersky research, Qilin was the most active group executing targeted attacks in 2025.

Each group’s share of victims according to its data leak site (DLS) as a percentage of all reported victims of all groups during the period under review (download)

Qilin stands out as one of the fastest-growig and dominant RaaS platforms. Its combination of high-volume operations and structured affiliate model positions it as a central player in the current ecosystem.

Clop, the second most active group in 2025, is distinguished through its large-scale, supply-chain-style attacks, exploiting widely used file transfer and enterprise software to compromise hundreds of victims simultaneously. This one-to-many approach sets it apart from more traditional, single-target campaigns.

Third place is occupied by Akira, which remains notable for its consistency and operational stability, maintaining a steady stream of victims without major disruption. Its ability to sustain activity over time makes it one of the most reliable indicators of baseline ransomware threat levels.

Although no longer active, RansomHub stands out for its rapid rise and equally rapid disappearance in 2025, highlighting the volatility of the RaaS market. Its shutdown created a vacuum that significantly reshaped affiliate distribution across other groups.

DragonForce is also notable – not just for its own operations, but for its broader influence within the ransomware ecosystem, including reported involvement in infrastructure conflicts and possible links to the disruption of competing groups. Thus, the group claims that RansomHub “has moved to their infrastructure.” This positions it as more than just an operator and potentially an ecosystem-level actor.

New actors in 2026

While emerging actors generally operate on a smaller scale, they provide insight into the continuous churn and low barrier to entry within the ransomware ecosystem.

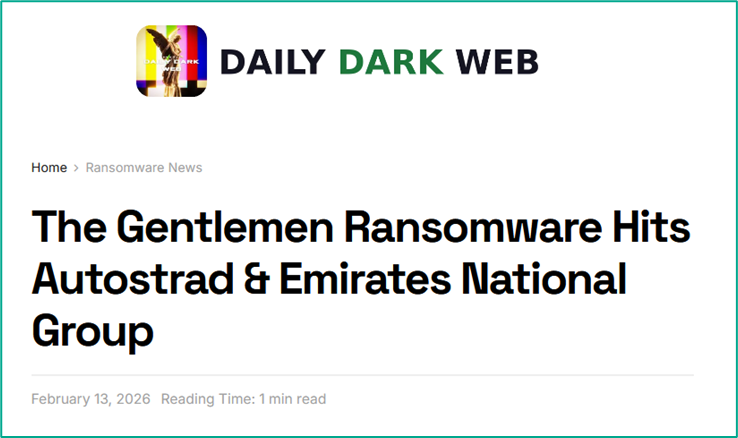
The Gentlemen group caught our attention in early 2026, as they managed to attack a significant number of victims over a short time. This actor is also notable for reflecting a broader shift toward professionalization and controlled operations within the ransomware ecosystem. Unlike many emerging groups that rely on opportunistic attacks and inconsistent leak activity, The Gentlemen demonstrate a more deliberate approach: structured intrusion workflows, selective targeting, and measured communication with victims. This signals a move away from chaotic, high-noise campaigns toward predictable, business-like execution models that are easier to scale and harder to disrupt. Their TTPs include the massive exploitation of hardware very common on big corporations, such as FortiOS/FortiProxy, SonicWall VPN, and Cisco ASA appliances. The group might be comprised of professional cybercriminals who left other prominent groups.

The group is also notable for its emphasis on data-centric extortion strategies, often prioritizing exfiltration and leverage over purely disruptive encryption. This aligns with one of the defining trends of 2026: ransomware evolving into a form of data breach monetization rather than just system denial. By focusing on controlled pressure and reputational risk instead of immediate operational damage, The Gentlemen exemplify how attackers are adapting to lower ransom payment rates and improved backup practices among victims.
Some other groups to take note of in 2026:

  • Devman appears to be an emerging actor with limited but growing activity, likely leveraging existing tooling rather than developing custom capabilities.
  • MintEye hasn’t been very active yet, with just five known victims, suggesting opportunistic campaigns without a consistent operational tempo.
  • DireWolf is associated with small-scale, targeted attacks, though its overall footprint remains relatively limited compared to larger RaaS groups.
  • NightSpire demonstrates characteristics of an amateur group, such as mistakes during its operations, uncommon communication channels with the victims, and sometimes giving them insufficient time to pay up. Although they both encrypt and leak data, they prioritize publication rather than encryption.
  • Vect shows low-volume activity. It is yet unclear whether they use a completely new codebase or are rather a rebrand of an existing group.
  • Tengu is a less prominent actor, with limited public reporting and no clear distinguishing tactics beyond standard extortion models.
  • Kazu appears to be created by ransomware operators previously engaged with multiple other groups. As of now, they don’t stand out for scale or technique.

Although there is little to say about these groups at the time of writing this report, each of them may be equally likely to disappear from the threat landscape or grow into a prominent threat. That’s why it’s important to track them from their early days. Moreover, collectively, these groups illustrate how dynamic the ransomware landscape is, with new entrants constantly replenishing it.

Conclusion and protection recommendations

Despite the growing effort by law enforcement agencies across the globe to seize and disrupt dark web platforms and threat actor infrastructures, ransomware operations remain stable, with new groups quickly taking the place of those who went silent. In 2026, we see a shift towards encryptionless extortion, with data leaks increasingly becoming the main threat to target organizations. At the same time, data encryption is also upgrading to the next level with the emergence of post-quantum ransomware.

To resist the evolving threat, Kaspersky recommends organizations:

Prioritize proactive prevention through patching and vulnerability management. Many ransomware attacks exploit unpatched systems, so organizations should implement automated patch management tools to ensure timely updates for operating systems, software, and drivers. For Windows environments, enabling Microsoft’s Vulnerable Driver Blocklist is critical to thwarting BYOVD attacks. Regularly scan for vulnerabilities and prioritize high-severity flaws, especially in widely used software.

Strengthen remote access: RDP and RDWeb connections should never be directly exposed to the internet, only through VPN or ZTNA (Zero Trust Network Access). It’s highly recommended to adopt multi-factor authentication on everything; the architecture may require continuous authentication for access, as one valid credential captured is enough to cause a breach. Monitoring the underground for stolen employee credentials is essential. Audit open ports across the entire attack surface. The adoption of the “Principle of Least Privilege” (PoLP), where users, systems, or processes are granted only the minimum access rights, such as read, write, or execute permissions, necessary to perform their specific job functions, is highly recommended.

Strengthen endpoint and network security with advanced detection and segmentation. Deploy robust endpoint detection and response solutions such as Kaspersky NEXT EDR to monitor for suspicious activity like driver loading or process termination. Network segmentation is equally important. Limit lateral movement by isolating critical systems and using firewalls to restrict traffic. Complete and immediate offboarding for employees is necessary as well as periodic permission reviews, with automatic revocation of unused access. Sessions with complete logging for privileged accounts are more than necessary. Monitoring the traffic divergence to new sites or even to legitimate endpoints can help the defenders to spot a new insider threat.

Invest in backups, training, and incident response planning. Maintain offline or immutable backups that are tested regularly to ensure rapid recovery without paying a ransom. Backups should cover critical data and systems and be stored in air-gapped environments to resist encryption or deletion. User education is essential to combatting phishing, which remains one of the top attack vectors. Conduct simulated phishing exercises and train employees to recognize AI-crafted emails. Kaspersky Global Emergency Response Team (GERT) can help develop and test an incident response plan to minimize potential downtime and costs.

The recommendation to avoid paying a ransom remains robust, especially given the risk of unavailable keys due to dismantled infrastructure, affiliate chaos, or malicious intent. By investing in backups, incident response, and preventive measures like patching and training, organizations can avoid funding criminals and mitigate the impact.

Kaspersky also offers free decryptors for certain ransomware families. If you get hit by ransomware, check to see if there’s a decryptor available for the ransomware family used against you.

  •  

State of ransomware in 2026

With International Anti-Ransomware Day taking place on May 12, Kaspersky presents its annual report on the evolving global and regional ransomware cyberthreat landscape.

Ransomware remains one of the most persistent and adaptive cyberthreats. In 2026:

  • New families continue to emerge, adopting post-quantum cryptography ciphers.
  • As ransom payments drop, some groups implement encryptionless extortion attacks.
  • In a constantly changing ecosystem of threat actors, initial access brokers maintain a relevant role in this market, showing increased focus on access to RDWeb as the preferred method of remote access.

Ransomware attacks decline but remain a major threat

According to Kaspersky Security Network, the share of organizations affected by ransomware decreased in 2025 across all regions compared to 2024.

Percentage of organizations affected by ransomware attacks by region, 2025 (download)

Despite the formal decrease, organizations across all sectors continue to face a high likelihood of attack, as ransomware operators refine their tactics and scale their operations with increasing efficiency. Kaspersky and VDC Research have found that in the manufacturing sector alone, ransomware attacks may have caused over $18 billion in losses in the first three quarters of the year.

The continued rise of EDR killers and defense evasion tooling

In 2026, ransomware operators increasingly prioritize neutralizing endpoint defenses before executing their payloads. Tools commonly referred to as “EDR killers” have become a standard component of attack playbooks. This reflects a continuing trend toward more deliberate and methodical intrusions.

Attackers attempt to terminate security processes and disable monitoring agents, often by exploiting trusted components such as signed drivers. This technique is called Bring Your Own Vulnerable Driver (BYOVD) and allows adversaries to blend into legitimate system activity while gradually degrading defensive visibility.

Thus, evasion is no longer an opportunistic step but a planned and repeatable phase of the attack lifecycle. As a result, organizations are increasingly challenged not just to detect ransomware but also to maintain control in environments where security controls themselves are actively targeted.

The appearance of new families adopting post-quantum cryptography

We predicted that quantum-resistant ransomware would appear in 2025. Looking back at the previous year, we see that advanced ransomware groups indeed started using post-quantum cryptography as quantum computing evolved. The encryption techniques used by this quantum-proof ransomware could be used to resist decryption attempts from both classical and quantum computers, making it nearly impossible for victims to decrypt their data without having to pay a ransom.

One example is the appearance of the PE32 ransomware family (link in Russian); it leverages the cutting-edge ML-KEM (Module-Lattice-Based Key-Encapsulation Mechanism) standard to secure its AES keys. This specific cryptographic framework was recently selected by NIST as the primary standard for post-quantum defense.

Within the PE32 ransomware architecture, this is realized through the Kyber1024 algorithm, a robust mechanism providing Level 5 security, roughly equivalent in strength to AES-256. Its primary function is the secure generation and transmission of shared secrets between parties, specifically engineered to withstand future quantum computing attacks. This shift toward post-quantum readiness is part of a broader industry trend; for instance, TLS 1.3 and QUIC protocols have already adopted the X25519Kyber768 hybrid model, which fuses classical encryption with quantum-resistant security.

The shift to encryptionless extortion

In 2025, the share of ransoms paid dropped to 28%. As a response to this, one of the developments in the 2026 landscape is the growing prevalence of extortion incidents in which no file encryption takes place at all. Instead, attackers leave out the “ware” in “ransomware” and focus on extracting sensitive data and leveraging the threat of public disclosure as their primary means of extortion. ShinyHunters is an excellent example of such a group, using a data leak site to publicize its victims.

By avoiding encryption, attackers may aim at reducing the likelihood of immediate detection, shortening the duration of the attack, and eliminating dependencies on stable encryption routines. Often, this model is used alongside traditional tactics in so-called double extortion schemes, but an increasing number of campaigns rely exclusively on data theft.

For victims, this shift fundamentally changes the nature of the risk. While backups remain effective against encryption-based disruption, they provide no protection against data exposure, regulatory consequences, and reputational damage. Ransomware is therefore evolving from a business continuity issue into a broader data security and compliance challenge.

Industrialization of initial access (Access-as-a-Service)

The ransomware ecosystem continues to evolve toward a highly industrialized and specialized model, with initial access remaining as one of its most critical components. In 2026, many ransomware operators keep relying on IABs (initial access brokers), a network of intermediaries who supply pre-compromised access to corporate environments, aiming to no longer perform full intrusions themselves.

This “access-as-a-service” model is fueled by credential theft operations, and the widespread availability of compromised accounts harvested through infostealers and phishing campaigns.

The primary access vectors offered for sale have not changed: RDP, VPN, and RDWeb are still the top access vectors. Consequently, remote access infrastructure remains the primary attack surface for initial access sales. In response to the measures against public exposure of RDP access points to the internet, attackers are now targeting RDWeb portals, which are frequently vulnerable and occasionally inadequately safeguarded.

The result is a threat landscape where unauthorized access is increasingly commoditized, and the barrier to launching ransomware attacks declines. This means that preventing initial compromise is only part of the challenge; equal emphasis must be placed on detecting misuse of legitimate credentials and limiting lateral movement within already-breached environments.
Ransomware developments on the dark web

Telegram channels and underground forums increasingly function as platforms for the distribution and sale of compromised datasets and access credentials including those that were obtained as a result of ransomware attacks.

Advertisements posted on these resources typically include the nature of the access, a description of the exfiltrated or compromised data, price terms, and contact information for prospective buyers. In addition, some malicious actors mention their collaboration with other ransomware groups. Lesser-known gangs can use this name-dropping to promote themselves

Multiple threat actors not related to ransomware groups distribute datasets downloaded from ransomware blogs on underground forums and Telegram. By re-publishing download links and files, they spread compromised data as well as information on the ransomware attack within the community.

The ransomware itself is also sold or offered for subscription on the dark web platforms. The sellers underscore the uniqueness of their malware, as well as its encryption and defense evasion features.

Law enforcement actions

Law enforcement agencies are actively shutting down dark web platforms and ransomware data leak sites. A major underground forum, RAMP, which also functioned as a platform for threat actors to advertise their ransomware services and publish service‑related updates, was seized by authorities in January 2026. Another underground forum, LeakBase, where malicious actors distributed exfiltrated and compromised data, was seized in March 2026. In 2025, law enforcement agencies seized well-known forums like Nulled, Cracked, and XSS. Also in 2025, the DLSs of BlackSuit and 8Base ransomware groups were seized. These takedowns cause inconvenience to ransomware coordination, specifically for initial access brokers and affiliates, though similar forums are expected to fill the void over time.

Top ransomware groups in 2025

RansomHub’s sudden dormancy in 2025 marked a shift, and Qilin became the dominant player from Q2 onward. According to Kaspersky research, Qilin was the most active group executing targeted attacks in 2025.

Each group’s share of victims according to its data leak site (DLS) as a percentage of all reported victims of all groups during the period under review (download)

Qilin stands out as one of the fastest-growig and dominant RaaS platforms. Its combination of high-volume operations and structured affiliate model positions it as a central player in the current ecosystem.

Clop, the second most active group in 2025, is distinguished through its large-scale, supply-chain-style attacks, exploiting widely used file transfer and enterprise software to compromise hundreds of victims simultaneously. This one-to-many approach sets it apart from more traditional, single-target campaigns.

Third place is occupied by Akira, which remains notable for its consistency and operational stability, maintaining a steady stream of victims without major disruption. Its ability to sustain activity over time makes it one of the most reliable indicators of baseline ransomware threat levels.

Although no longer active, RansomHub stands out for its rapid rise and equally rapid disappearance in 2025, highlighting the volatility of the RaaS market. Its shutdown created a vacuum that significantly reshaped affiliate distribution across other groups.

DragonForce is also notable – not just for its own operations, but for its broader influence within the ransomware ecosystem, including reported involvement in infrastructure conflicts and possible links to the disruption of competing groups. Thus, the group claims that RansomHub “has moved to their infrastructure.” This positions it as more than just an operator and potentially an ecosystem-level actor.

New actors in 2026

While emerging actors generally operate on a smaller scale, they provide insight into the continuous churn and low barrier to entry within the ransomware ecosystem.

The Gentlemen group caught our attention in early 2026, as they managed to attack a significant number of victims over a short time. This actor is also notable for reflecting a broader shift toward professionalization and controlled operations within the ransomware ecosystem. Unlike many emerging groups that rely on opportunistic attacks and inconsistent leak activity, The Gentlemen demonstrate a more deliberate approach: structured intrusion workflows, selective targeting, and measured communication with victims. This signals a move away from chaotic, high-noise campaigns toward predictable, business-like execution models that are easier to scale and harder to disrupt. Their TTPs include the massive exploitation of hardware very common on big corporations, such as FortiOS/FortiProxy, SonicWall VPN, and Cisco ASA appliances. The group might be comprised of professional cybercriminals who left other prominent groups.

The group is also notable for its emphasis on data-centric extortion strategies, often prioritizing exfiltration and leverage over purely disruptive encryption. This aligns with one of the defining trends of 2026: ransomware evolving into a form of data breach monetization rather than just system denial. By focusing on controlled pressure and reputational risk instead of immediate operational damage, The Gentlemen exemplify how attackers are adapting to lower ransom payment rates and improved backup practices among victims.
Some other groups to take note of in 2026:

  • Devman appears to be an emerging actor with limited but growing activity, likely leveraging existing tooling rather than developing custom capabilities.
  • MintEye hasn’t been very active yet, with just five known victims, suggesting opportunistic campaigns without a consistent operational tempo.
  • DireWolf is associated with small-scale, targeted attacks, though its overall footprint remains relatively limited compared to larger RaaS groups.
  • NightSpire demonstrates characteristics of an amateur group, such as mistakes during its operations, uncommon communication channels with the victims, and sometimes giving them insufficient time to pay up. Although they both encrypt and leak data, they prioritize publication rather than encryption.
  • Vect shows low-volume activity. It is yet unclear whether they use a completely new codebase or are rather a rebrand of an existing group.
  • Tengu is a less prominent actor, with limited public reporting and no clear distinguishing tactics beyond standard extortion models.
  • Kazu appears to be created by ransomware operators previously engaged with multiple other groups. As of now, they don’t stand out for scale or technique.

Although there is little to say about these groups at the time of writing this report, each of them may be equally likely to disappear from the threat landscape or grow into a prominent threat. That’s why it’s important to track them from their early days. Moreover, collectively, these groups illustrate how dynamic the ransomware landscape is, with new entrants constantly replenishing it.

Conclusion and protection recommendations

Despite the growing effort by law enforcement agencies across the globe to seize and disrupt dark web platforms and threat actor infrastructures, ransomware operations remain stable, with new groups quickly taking the place of those who went silent. In 2026, we see a shift towards encryptionless extortion, with data leaks increasingly becoming the main threat to target organizations. At the same time, data encryption is also upgrading to the next level with the emergence of post-quantum ransomware.

To resist the evolving threat, Kaspersky recommends organizations:

Prioritize proactive prevention through patching and vulnerability management. Many ransomware attacks exploit unpatched systems, so organizations should implement automated patch management tools to ensure timely updates for operating systems, software, and drivers. For Windows environments, enabling Microsoft’s Vulnerable Driver Blocklist is critical to thwarting BYOVD attacks. Regularly scan for vulnerabilities and prioritize high-severity flaws, especially in widely used software.

Strengthen remote access: RDP and RDWeb connections should never be directly exposed to the internet, only through VPN or ZTNA (Zero Trust Network Access). It’s highly recommended to adopt multi-factor authentication on everything; the architecture may require continuous authentication for access, as one valid credential captured is enough to cause a breach. Monitoring the underground for stolen employee credentials is essential. Audit open ports across the entire attack surface. The adoption of the “Principle of Least Privilege” (PoLP), where users, systems, or processes are granted only the minimum access rights, such as read, write, or execute permissions, necessary to perform their specific job functions, is highly recommended.

Strengthen endpoint and network security with advanced detection and segmentation. Deploy robust endpoint detection and response solutions such as Kaspersky NEXT EDR to monitor for suspicious activity like driver loading or process termination. Network segmentation is equally important. Limit lateral movement by isolating critical systems and using firewalls to restrict traffic. Complete and immediate offboarding for employees is necessary as well as periodic permission reviews, with automatic revocation of unused access. Sessions with complete logging for privileged accounts are more than necessary. Monitoring the traffic divergence to new sites or even to legitimate endpoints can help the defenders to spot a new insider threat.

Invest in backups, training, and incident response planning. Maintain offline or immutable backups that are tested regularly to ensure rapid recovery without paying a ransom. Backups should cover critical data and systems and be stored in air-gapped environments to resist encryption or deletion. User education is essential to combatting phishing, which remains one of the top attack vectors. Conduct simulated phishing exercises and train employees to recognize AI-crafted emails. Kaspersky Global Emergency Response Team (GERT) can help develop and test an incident response plan to minimize potential downtime and costs.

The recommendation to avoid paying a ransom remains robust, especially given the risk of unavailable keys due to dismantled infrastructure, affiliate chaos, or malicious intent. By investing in backups, incident response, and preventive measures like patching and training, organizations can avoid funding criminals and mitigate the impact.

Kaspersky also offers free decryptors for certain ransomware families. If you get hit by ransomware, check to see if there’s a decryptor available for the ransomware family used against you.

  •  
❌