❌

Reading view

Transforming Bedrock Guardrails events into OCSF with CloudWatch

Security teams investigating possible AI-related security events need guardrail intervention data alongside their existing security telemetry. When a guardrail identifies or blocks a prompt injection attempt or redacts sensitive data, that intervention carries additional investigative value comparable to a failed sign-in or a network intrusion alert. AWS Bedrock publishes this telemetry to AWS CloudWatch metrics and model invocation logs for operational monitoring.

In this post, I show you how to transform AWS Bedrock Guardrails intervention events into structured Open Cybersecurity Schema Framework (OCSF) Detection Finding records and land them in the CloudWatch unified data store. Launched in December 2025, the unified data store consolidates operational, security, and compliance data from AWS services and third-party sources into a single platform. Security operations center (SOC) and threat analysts can query guardrail events alongside identity, network, and endpoint data, including AWS CloudTrail and AWS Virtual Private Cloud (AWS VPC) Flow Logs, using AWS Athena or CloudWatch Logs Insights.

Use case

Consider an organization deploying AWS Bedrock across many applications, with guardrails applied as a governance control. The guardrails detect and block several categories of activity: harmful content, off-topic queries, sensitive information such as personally identifiable information (PII), and prompt injection attempts. Each time a guardrail intervenes, it produces a signal the security team wants to investigate alongside the rest of its telemetry.

Without a consolidation layer, guardrail interventions stay siloed as per-AWS Region CloudWatch metrics and entries in raw model invocation logs, separate from the identity, network, and audit data the security team already relies on. The CloudWatch unified data store is built to remove this kind of silo: it consolidates operational and security data across accounts and Regions into one store. Routing normalized guardrail records into it is what makes them correlatable with the rest of your security telemetry. To investigate effectively, the team needs to answer questions that span multiple data sources:

  • Identify which user accounts trigger the most guardrail interventions, and whether those same accounts also show unusual AWS Identity and Access Management (IAM) activity such as failed API calls or privilege changes. A spike in prompt injection blocks from a role that’s also generating access-denied events is a stronger signal than either on its own.
  • Determine whether prompt injection attempts correlate with specific source IP addresses that also appear in VPC Flow Logs, which helps distinguish a single misbehaving client from a coordinated pattern across the environment.
  • Track the trend of guardrail violations across the organization and compare it against a baseline from 30 days ago, so the team can tell routine policy noise apart from an emerging change in attacker behavior or a misconfigured application.

AWS GuardDuty already helps here: its AI Protection feature analyzes CloudTrail data events from AWS Bedrock and produces managed threat findings, including a direct prompt injection finding and anomalous model invocation findings. GuardDuty AI Protection is a complementary managed detection layer for AWS Bedrock activity. The pipeline in this post works alongside it: it captures the raw guardrail intervention records themselves, normalizes them to OCSF, and lands them in the unified data store so you can run your own cross-source correlation and long-term trend analysis alongside GuardDuty findings, CloudTrail, and VPC Flow Logs.

Guardrail traces arrive as JSON embedded in the AWS Bedrock model invocation logs, in an AWS Bedrock-specific shape rather than a normalized security schema. After the pipeline transforms them to OCSF and ingests them into the CloudWatch unified data store, a single Athena query answers all three questions, because guardrail findings then share the same field structure as other security sources and sit in the same catalog as AWS CloudTrail events and VPC Flow Logs.

Solution overview

At a high level, the solution captures guardrail intervention events from AWS Bedrock model invocation logs, transforms them into OCSF Detection Finding records with an AWS Lambda function, and lands them in the CloudWatch unified data store, where SOC analysts query them with Athena or CloudWatch Logs Insights. The CloudWatch unified data store provides Apache Iceberg-compatible access through AWS S3 Tables, CloudWatch Logs Insights queries, and, for supported sources, built-in OCSF normalization at ingestion.

Why a custom transform step

CloudWatch offers native OCSF conversion through the ParseToOCSF log transformation processor for specific AWS log sources. As of this writing, that processor supports five AWS log sources: CloudTrail, AWS Route 53 Resolver, VPC Flow Logs, AWS EKS audit logs, and AWS WAF. AWS Bedrock Guardrails isn’t one of the sources that ParseToOCSF supports, so guardrail traces aren’t converted to OCSF automatically.

Guardrail traces also need transformation logic that ingestion-time processors don’t provide. A single model invocation log can contain multiple guardrail assessments (for example, a content policy filter and a sensitive information policy match in one request), and the transform step splits that one log entry into one OCSF Detection Finding per assessment rather than a single combined record. This one-to-many expansion, combined with conditional severity assignment based on policy type, is application logic rather than field normalization. For these two reasons, this solution uses a dedicated transform step to produce OCSF records, then uses built-in CloudWatch mechanisms for enrichment, storage, centralization, and query.

This solution captures AWS Bedrock model invocation logs containing guardrail trace data, filters for intervention events, transforms them into OCSF Detection Finding records (class_uid 2004), and writes the structured records to a CloudWatch Logs log group that is associated with AWS S3 Tables through the CloudWatch unified data store managed integration. Guardrail interventions are detection events: the guardrail detected and blocked prohibited content, so OCSF class 2004 (Detection Finding) under the Findings category is the appropriate classification.

How a source’s records are stored depends on whether it’s a vended source or a custom source. For the five vended sources that ParseToOCSF supports, the unified data store produces individual typed OCSF columns. For any custom source, including AWS Bedrock Guardrails in this solution, records land in the associated S3 Tables table as OCSF JSON in a single managed cwl__message column rather than as typed columns. This is a property of custom sources in general, not specific to AWS Bedrock. You read the OCSF fields at query time with Athena json_extract functions, and you can correlate them with the vended sources that share the same catalog. This post shows that query pattern.

The pipeline supports multiple AWS Bedrock event types by changing the filter pattern and OCSF mapping. This post demonstrates the guardrail interventions row:

Bedrock event source OCSF event class class_uid
Guardrail interventions (this post) DETECTION_FINDING 2004
Model invocation API calls API_ACTIVITY 6003
Agent guardrail traces DETECTION_FINDING 2004
Token consumption anomalies DETECTION_FINDING 2004

Architecture

The following diagram shows the end-to-end pipeline from guardrail intervention to CloudWatch unified data store ingestion. It shows the flow within a single account for clarity. In an organization, you deploy this transform pipeline in each workload account and use CloudWatch Logs centralization to bring the OCSF output into one central account, so you query organization-wide without standing up the query layer per account or per Region. The Multi-account deployment section later in this post covers this pattern.
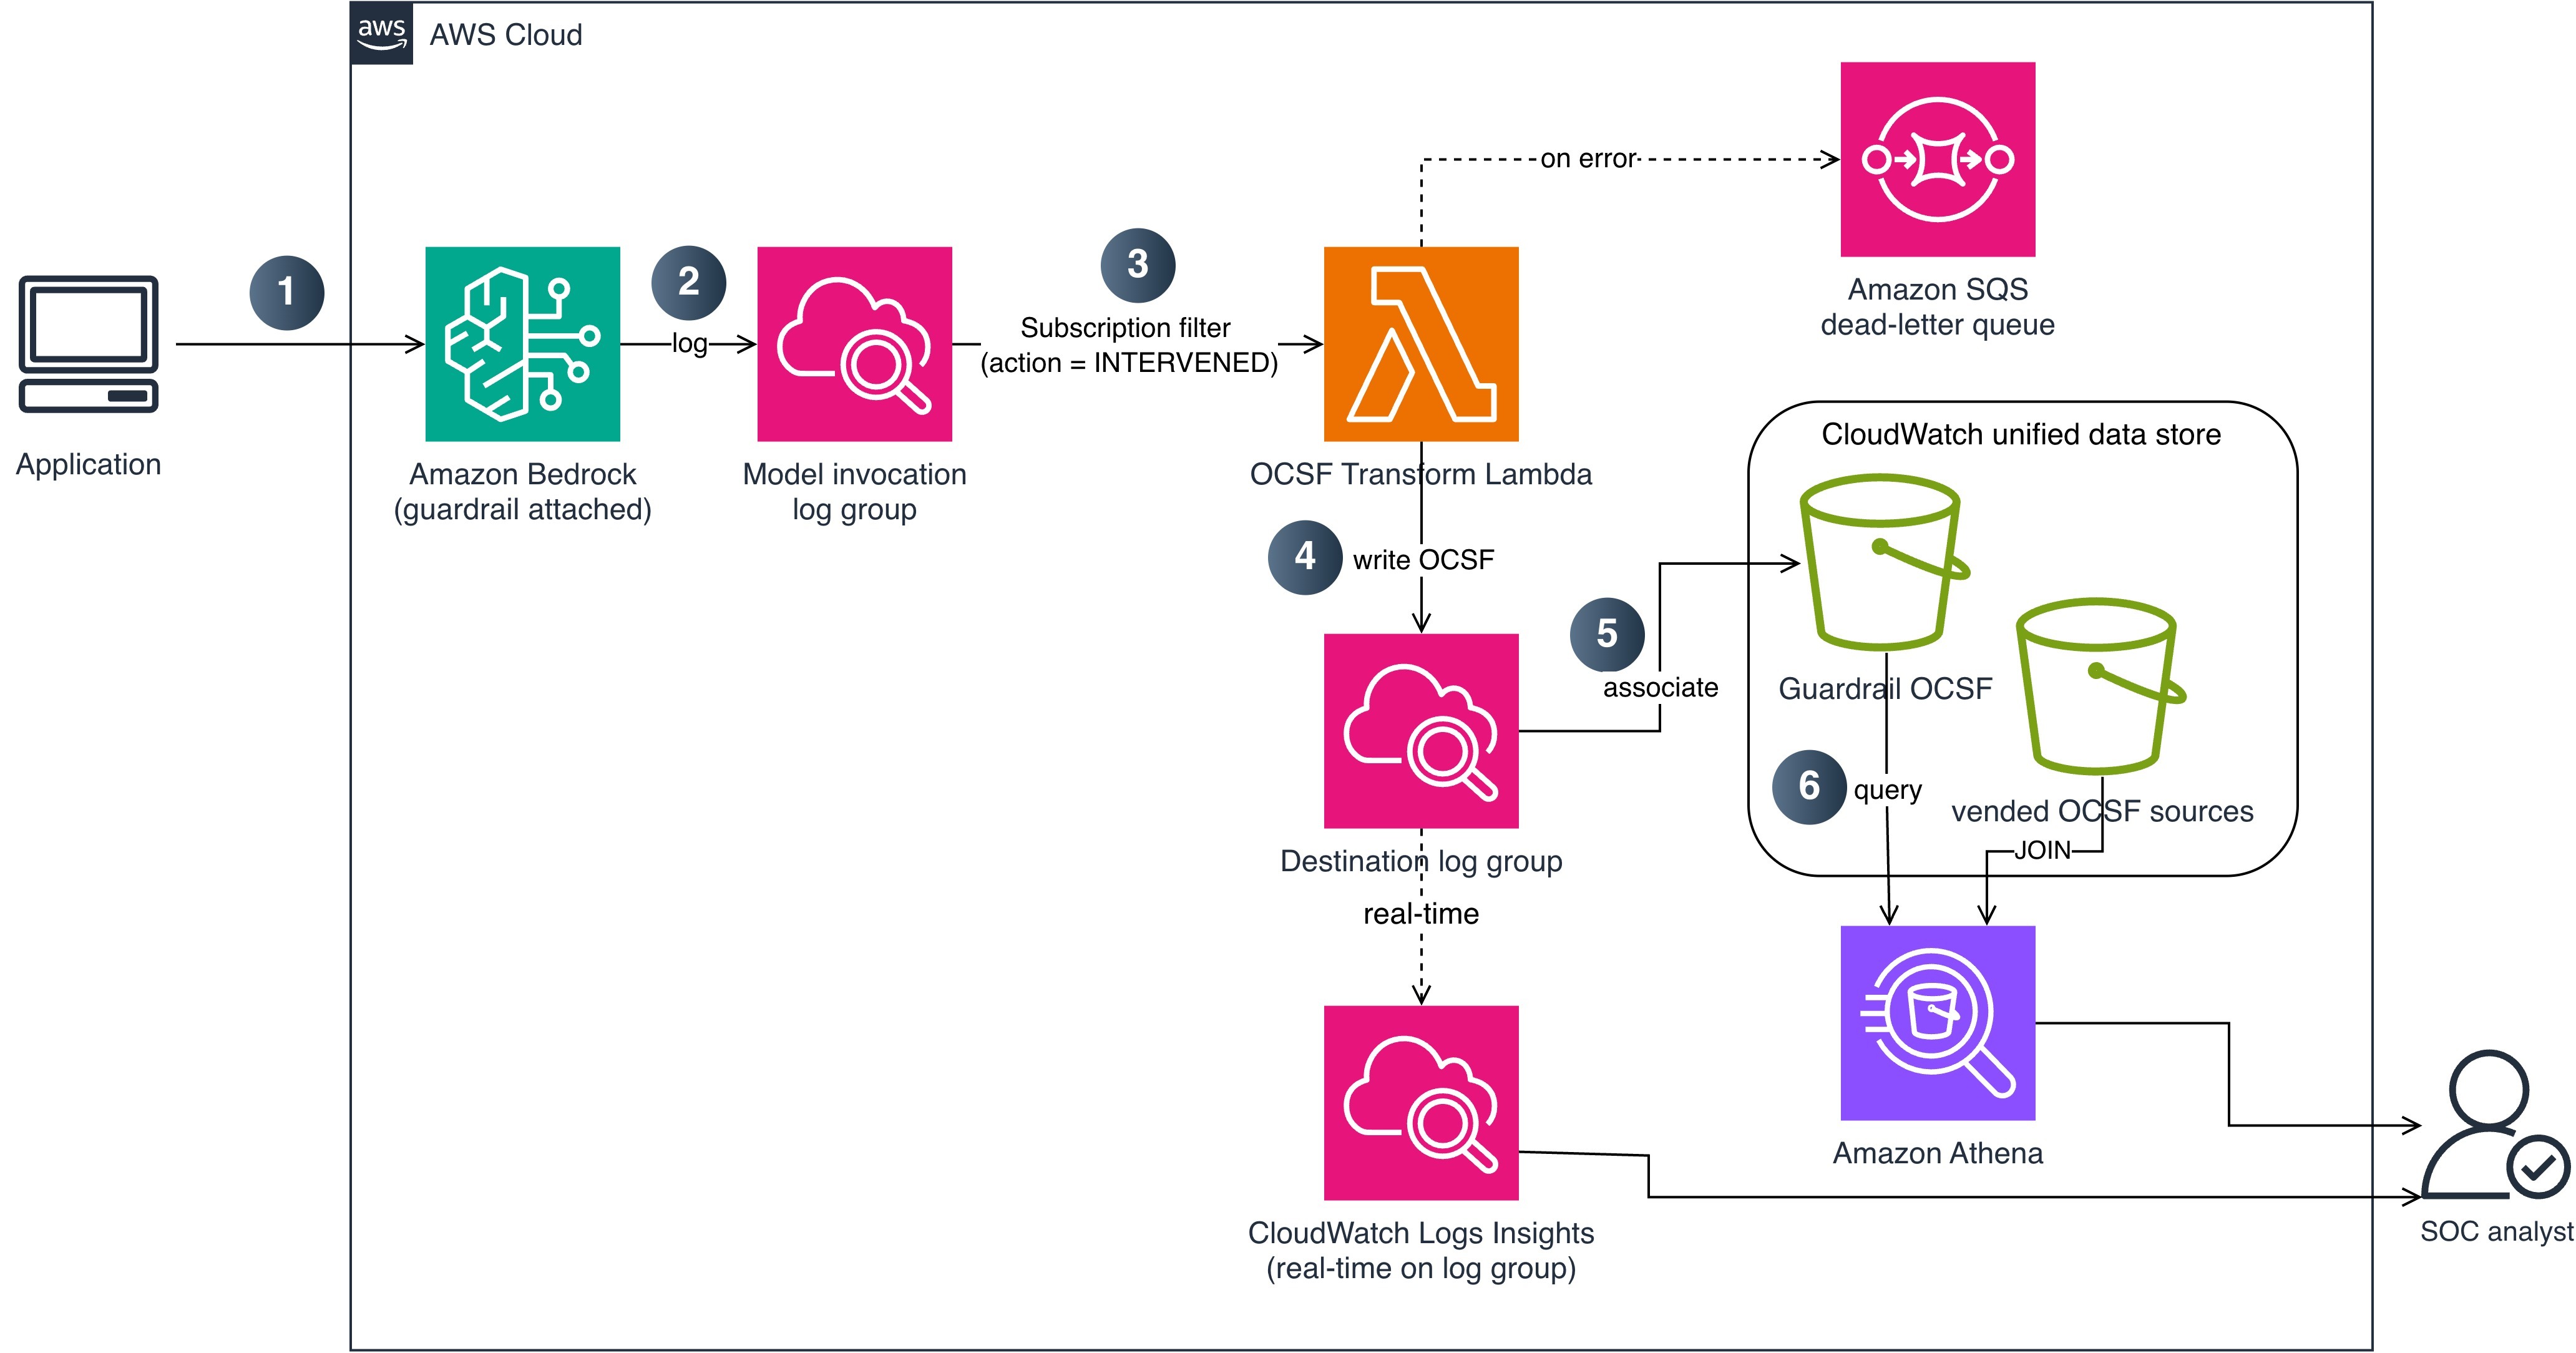
Figure 1: End-to-end pipeline from guardrail intervention to CloudWatch unified data store ingestion

Figure 1: End-to-end pipeline from guardrail intervention to CloudWatch unified data store ingestion

The data flow consists of the following steps:

  1. An application calls AWS Bedrock (InvokeModel or Converse API) with a guardrail attached.
  2. AWS Bedrock evaluates the guardrail and logs the invocation, including guardrail trace data, to a CloudWatch Logs log group using model invocation logging. A subscription filter matches log entries where the guardrail action is INTERVENED (blocked or masked content).
  3. The subscription filter delivers matching records to a Lambda function (OCSF Transform). This step performs the custom transformation that native OCSF conversion doesn’t cover for AWS Bedrock, expanding each guardrail assessment into its own OCSF Detection Finding.
  4. The Lambda function writes the OCSF JSON records to a dedicated CloudWatch Logs log group and sets contextual fields (account ID and Region) on each record during transformation. If the Lambda function fails to process a record, the message routes to an AWS Simple Queue Service (AWS SQS) dead-letter queue for later analysis and redrive.
  5. The destination log group is associated with AWS S3 Tables through the CloudWatch unified data store managed integration, so the unified data store stores the OCSF records as an Apache Iceberg table. Because AWS Bedrock Guardrails is a custom source, each record is stored as OCSF JSON in a managed cwl__message column.
  6. SOC analysts query guardrail intervention data with Athena, using json_extract to read the OCSF fields, and correlate it with vended security sources (CloudTrail, VPC Flow Logs) that share the same catalog. For real-time operational queries, analysts can also query the destination log group directly with CloudWatch Logs Insights.

OCSF mapping

The following table shows how AWS Bedrock Guardrails intervention fields map to OCSF Detection Finding (class_uid 2004) attributes.

OCSF field Source Example value
class_uid Static 2004 (Detection Finding)
category_uid Static 2 (Findings)
severity_id Derived from policy type 3 (Medium) for content/topic; 4 (High) for prompt injection
activity_id Static 1 (Create)
time Invocation log timestamp 1721001600000
cloud.provider Static AWS
cloud.region Set by the transform function us-east-1
cloud.account.uid Set by the transform function 123456789012
actor.user.uid Invocation log identity.arn arn:aws:sts::123456789012:assumed-role/AppRole/session
finding_info.title Derived from policy type ContentPolicy Intervention
finding_info.desc Guardrail trace action/topic Blocked: HATE content detected on INPUT
resource.uid Model ARN arn:aws:bedrock:us-east-1::foundation-model/anthropic.claude-sonnet-4-20250514-v1:0
resource.type Static AwsBedrock:Model
metadata.product.name Static Amazon Bedrock Guardrails
metadata.product.vendor_name Static AWS
metadata.version Static 1.3.0
unmapped.guardrail_id Guardrail trace guardrailId my-content-guardrail
unmapped.guardrail_arn Guardrail trace guardrailArn arn:aws:bedrock:us-east-1:123456789012:guardrail/abc123
unmapped.guardrail_version Guardrail trace guardrailVersion 3
unmapped.guardrail_content_source Guardrail trace INPUT or OUTPUT
unmapped.guardrail_policy_type Guardrail trace ContentPolicy, TopicPolicy, SensitiveInformationPolicy, WordPolicy, ContextualGroundingPolicy, PromptAttack

Prerequisites

The following prerequisites are needed to deploy the reference implementation. Before you begin, clone the repository:

git clone https://github.com/aws-samples/sample-bedrock-guardrails-cloudwatch.git
cd sample-bedrock-guardrails-cloudwatch

Verify you have the following:

Implementation

The reference implementation deploys two CloudFormation stacks: TransformPipelineStack and MonitoringStack. The following commands deploy the stacks in dependency order:

cdk deploy TransformPipelineStack \
  -c destination_log_group=/aws/cloudwatch-uds/bedrock-guardrails-ocsf

cdk deploy MonitoringStack \
  -c alarm_email=your-team@example.com

Or deploy both stacks at once:

cdk deploy --all \
  -c destination_log_group=/aws/cloudwatch-uds/bedrock-guardrails-ocsf \
  -c alarm_email=your-team@example.com

Enable model invocation logging

Model invocation logging captures the guardrail trace data you need. Turn on full request and response logging to a CloudWatch Logs log group and configure textDataDeliveryEnabled to capture the text bodies that include the guardrail trace output when a guardrail is attached to the invocation. The following AWS Command Line Interface (AWS CLI) command enables it:

aws bedrock put-model-invocation-logging-configuration \
  --logging-config '{
    "cloudWatchConfig": {
      "logGroupName": "/aws/bedrock/model-invocation-logs",
      "roleArn": "arn:aws:iam::123456789012:role/BedrockLoggingRole"
    },
    "textDataDeliveryEnabled": true
  }'

Because logging is an account-level prerequisite rather than part of the pipeline, the CDK stacks don’t manage it. Enable it once for each account before deploying.

Deploying the transform pipeline

The TransformPipelineStack deploys the Lambda function, subscription filter, destination log group, and dead-letter queue.

  • Create the subscription filter: The stack creates a CloudWatch Logs subscription filter on your model invocation log group with a filter pattern that matches guardrail interventions. This captures only the events where a guardrail blocked or modified content, not the successful pass-through events, which reduces Lambda invocations and cost.
  • Transform to OCSF: The Lambda function parses each CloudWatch Logs event and produces one OCSF Detection Finding record (class_uid 2004) per guardrail assessment in the trace. The transformation maps guardrail trace fields to OCSF attributes as described in the OCSF mapping table and sets contextual fields such as account ID and Region. Severity is set to High for prompt injection interventions and Medium for content, topic, or sensitive information interventions. The records contain structural metadata only; no prompt or response content is included.
  • Dead-letter queue: If the Lambda function fails to process a record, the message routes to an AWS SQS dead-letter queue with error metadata (error type, message, timestamp) for investigation and redrive.

Configure S3 Tables integration

To make the OCSF records queryable through Athena, associate the destination log group with AWS S3 Tables. This is a two-step managed setup: create an S3 Tables integration, then associate the log group as a data source. The integration delivers to the managed aws-cloudwatch table bucket at no additional storage charge.

  1. Tag the destination log group so the unified data store recognizes it as a data source. Use the tags cw:datasource:name (for example, bedrock_guardrails) and cw:datasource:type (for example, ocsf). The generated table name joins the two tag values with a double underscore, so these example tags produce a table named bedrock_guardrails__ocsf.
  2. Create the integration with CreateS3TableIntegration (CloudWatch Observability Admin), supplying an encryption configuration and an IAM role. This returns an integration AWS Resource Name (ARN).
  3. Associate the data source with AssociateSourceToS3TableIntegration (CloudWatch Logs), passing the integration ARN and the dataSource name and type from step 1.

The reference implementation performs steps 2 and 3 with the CloudFormation resource AWS::ObservabilityAdmin::S3TableIntegration and a custom resource that calls AssociateSourceToS3TableIntegration, so cdk deploy sets up the association for you.

After association, the OCSF records become available as an Apache Iceberg table in the managed catalog, at the path "s3tablescatalog/aws-cloudwatch"."logs"."bedrock_guardrails__ocsf". You can query it with Athena, AWS Redshift, or any Iceberg-compatible tool.

As noted in the solution overview, AWS Bedrock Guardrails is a custom source, so each record is stored as OCSF JSON in a managed cwl__message column. You read the fields at query time with the Athena json_extract_scalar function, as shown in the next section, and correlate against vended sources such as CloudTrail in the same catalog.

Enable analytics access

The association delivers records to the managed table, but analytics engines can’t read them until you enable the AWS S3 Tables analytics integration and grant read permissions. Complete these steps once in each Region:

  1. In the AWS S3 console, choose Table buckets, then choose Enable integration. The first time you do this in a Region, AWS S3 creates a service role that lets AWS Lake Formation federate access to your tables in the AWS Glue Data Catalog. This is what makes the s3tablescatalog catalog visible to Athena.
  2. In the Lake Formation console, under Data lake permissions, choose Grant, and grant Select and Describe on the aws-cloudwatch table bucket (and the bedrock_guardrails__ocsf table) to each IAM principal that runs queries, such as your SOC analyst roles. Without this grant, Athena queries return an access denied error even when the IAM policy allows Athena.
  3. In the Athena query editor, choose the AWS S3 Tables catalog from the data source list, and select the logs database.

Deploy the monitoring stack

The MonitoringStack creates a CloudWatch dashboard and alarms for pipeline health. The dashboard includes widgets for intervention count by policy type, transform errors, Lambda duration, and dead-letter queue depth. Alarms notify your team when the error rate exceeds 5 percent, the dead-letter queue depth exceeds 0, or p99 Lambda duration exceeds 10 seconds. Notifications are sent through AWS Simple Notification Service (AWS SNS).

Query interventions

After deployment, guardrail interventions are available through two query paths. Use the one that matches your investigation:

  • Athena (through AWS S3 Tables) for cross-source correlation and historical analysis. Athena joins the OCSF guardrail records with vended OCSF sources in the unified data store (such as CloudTrail and VPC Flow Logs) over long time ranges. Because AWS Bedrock Guardrails is a custom source, its OCSF fields live inside the cwl__message column, so you read them with json_extract_scalar. Use Athena when you need to join guardrail findings against other security data or run trend analysis across weeks or months.
  • CloudWatch Logs Insights for real-time, operational queries against the destination log group. Use Logs Insights when you need results in seconds on recent data, without a table join, such as during an active investigation.

The Athena queries in this section run against the managed table "s3tablescatalog/aws-cloudwatch"."logs"."bedrock_guardrails__ocsf". For readability, the examples reference it as bedrock_guardrails_ocsf after selecting the s3tablescatalog/aws-cloudwatch catalog and logs database in the Athena query editor.

Correlate with IAM activity in Athena

The following example identifies users who trigger both prompt injection interventions and failed CloudTrail activity. The guardrail side extracts fields from cwl__message; the CloudTrail side is a vended source with typed OCSF columns.

WITH guardrail_violators AS (
    SELECT json_extract_scalar(cwl__message, '$.actor.user.uid') AS user_arn,
           COUNT(*) AS violation_count
    FROM bedrock_guardrails_ocsf
    WHERE json_extract_scalar(cwl__message, '$.unmapped.guardrail_policy_type') = 'PromptAttack'
    GROUP BY json_extract_scalar(cwl__message, '$.actor.user.uid')
),
iam_failures AS (
    SELECT "actor.user.uid" AS user_arn, COUNT(*) AS failure_count
    FROM aws_cloudtrail__management
    WHERE "status_id" = 2
    GROUP BY "actor.user.uid"
)
SELECT g.user_arn, g.violation_count, i.failure_count
FROM guardrail_violators g
JOIN iam_failures i ON g.user_arn = i.user_arn
ORDER BY g.violation_count DESC;

You can also track violation trends by policy type over time to establish baselines and detect spikes:

SELECT date_trunc('day', from_unixtime(
         cast(json_extract_scalar(cwl__message, '$.time') as bigint) / 1000)) AS event_day,
       json_extract_scalar(cwl__message, '$.unmapped.guardrail_policy_type') AS policy_type,
       COUNT(*) AS violation_count
FROM bedrock_guardrails_ocsf
GROUP BY 1, 2
ORDER BY event_day, violation_count DESC;

If you run these correlation queries frequently, you can materialize the extracted OCSF fields into a typed table with CREATE TABLE AS SELECT (CTAS) and refresh it on a schedule. Queries against the materialized table use plain column names instead of json_extract_scalar, which keeps recurring dashboards and joins concise.

Real-time queries in CloudWatch Logs Insights

For operational queries on recent data without a table join, query the destination log group directly in CloudWatch Logs Insights:

fields @timestamp, severity, finding_info.title, actor.user.uid, unmapped.guardrail_policy_type
| filter class_uid = 2004
| filter unmapped.guardrail_policy_type = "PromptAttack"
| stats count() as attack_count by actor.user.uid
| sort attack_count desc
| limit 10

This query returns results in seconds on recently ingested records.

Multi-account deployment

For organizations running AWS Bedrock across multiple accounts, the recommended pattern is to transform locally and centralize the OCSF output, rather than replicating raw invocation logs and transforming centrally.

Deploy the subscription filter and transform pipeline in each workload account where model invocation logging is enabled. Each account produces OCSF records in its own destination log group. Then use CloudWatch Logs centralization to replicate those OCSF records into a central logging account automatically. Centralization integrates with AWS Organizations and picks up new accounts as they join, and you create the AWS S3 Tables integration one time in the central account (rather than in every workload account) for organization-wide querying.

Transforming in each workload account keeps the guardrail trace parsing close to the source, avoids moving raw invocation logs (which might contain prompt and response text) across account boundaries, and centralizes only the sanitized OCSF findings. If your organization prefers to keep transformation logic in one place, an alternative is to centralize the raw invocation logs first and run a single transform pipeline in the logging account; this concentrates the parsing logic but moves more data, including request and response content, between accounts.

Clean up

To avoid ongoing charges, destroy the stacks in reverse dependency order:

cdk destroy MonitoringStack --force
cdk destroy TransformPipelineStack --force

Conclusion

In this post, you learned how to transform AWS Bedrock Guardrails intervention events into OCSF Detection Finding records and ingest them into the CloudWatch unified data store. This integration gives SOC teams structured guardrail telemetry that correlates with CloudTrail, VPC Flow Logs, and the other security sources already available in CloudWatch. Because guardrail interventions are a custom source, their OCSF fields are stored as JSON and read with Athena json_extract functions, so you can join them with the vended OCSF sources that share the same catalog.

The pipeline filters for intervention events only, which keeps costs low while capturing the security-relevant signals. Athena over AWS S3 Tables provides cross-source correlation and historical analysis, and CloudWatch Logs Insights provides real-time operational queries.

Clone the reference implementation and adapt the OCSF mapping and subscription filter to your guardrail configuration. To extend the pipeline, apply the same transform pattern to agent guardrail traces, which map to the same OCSF Detection Finding class.

References

If you have feedback about this post, submit comments in the Comments section below.

Dhananjay Karanjkar

Dhananjay Karanjkar

Dhananjay is a Senior Lead Consultant at AWS Professional Services, specializing in agentic AI systems, multi-agent orchestration, and generative AI security. He holds two US patents and serves as a Responsible AI Champion, with a background spanning financial services, enterprise consulting, and enterprise-scale AI delivery. When not architecting AI solutions, he trains for triathlons, paints oil portraits, and is an avid reader.

  •  

Accelerating AWS Network Firewall troubleshooting with AWS DevOps Agent

When an administrator introduces a rule change in AWS Network Firewall and network connectivity is disrupted, pinpointing the cause requires inspecting multiple points in the traffic path. The firewall gives you stateless and stateful rule engines, domain rules, and routing to the firewall endpoint inside your Amazon Virtual Private Cloud (Amazon VPC). A network drop looks the same from the workload no matter where it started. Isolating the cause means correlating the alert and flow logs with the firewall configuration, route tables, and recent API calls in AWS CloudTrail that might have changed them. That manual correlation is exactly where AWS DevOps Agent helps, accelerating root cause analysis so you can restore connectivity in minutes instead of hours.

AWS DevOps Agent does that correlation for you. As your always-available operations teammate, it resolves and proactively prevents operational issues across AWS, multicloud, and on-premises environments. When an Amazon CloudWatch alarm triggers, it reaches the agent through a webhook. The agent then reads the firewall configuration and logs through AWS APIs, ties the drop to recent API activity, and returns a root cause with a mitigation plan you review before you apply it.

This post connects CloudWatch monitoring to DevOps Agent. It walks through three Network Firewall failures from end to end. The first is a domain deny list blocking a legitimate endpoint. The second is a stateless rule priority misconfiguration. The third is an asymmetric cross Availability Zone (AZ) routing drop. Each maps to a different layer, so each leads down a different investigation path. An AWS Cloud Development Kit (AWS CDK) app deploys the whole environment in your own account so you can reproduce each failure and follow along.

The sample workload

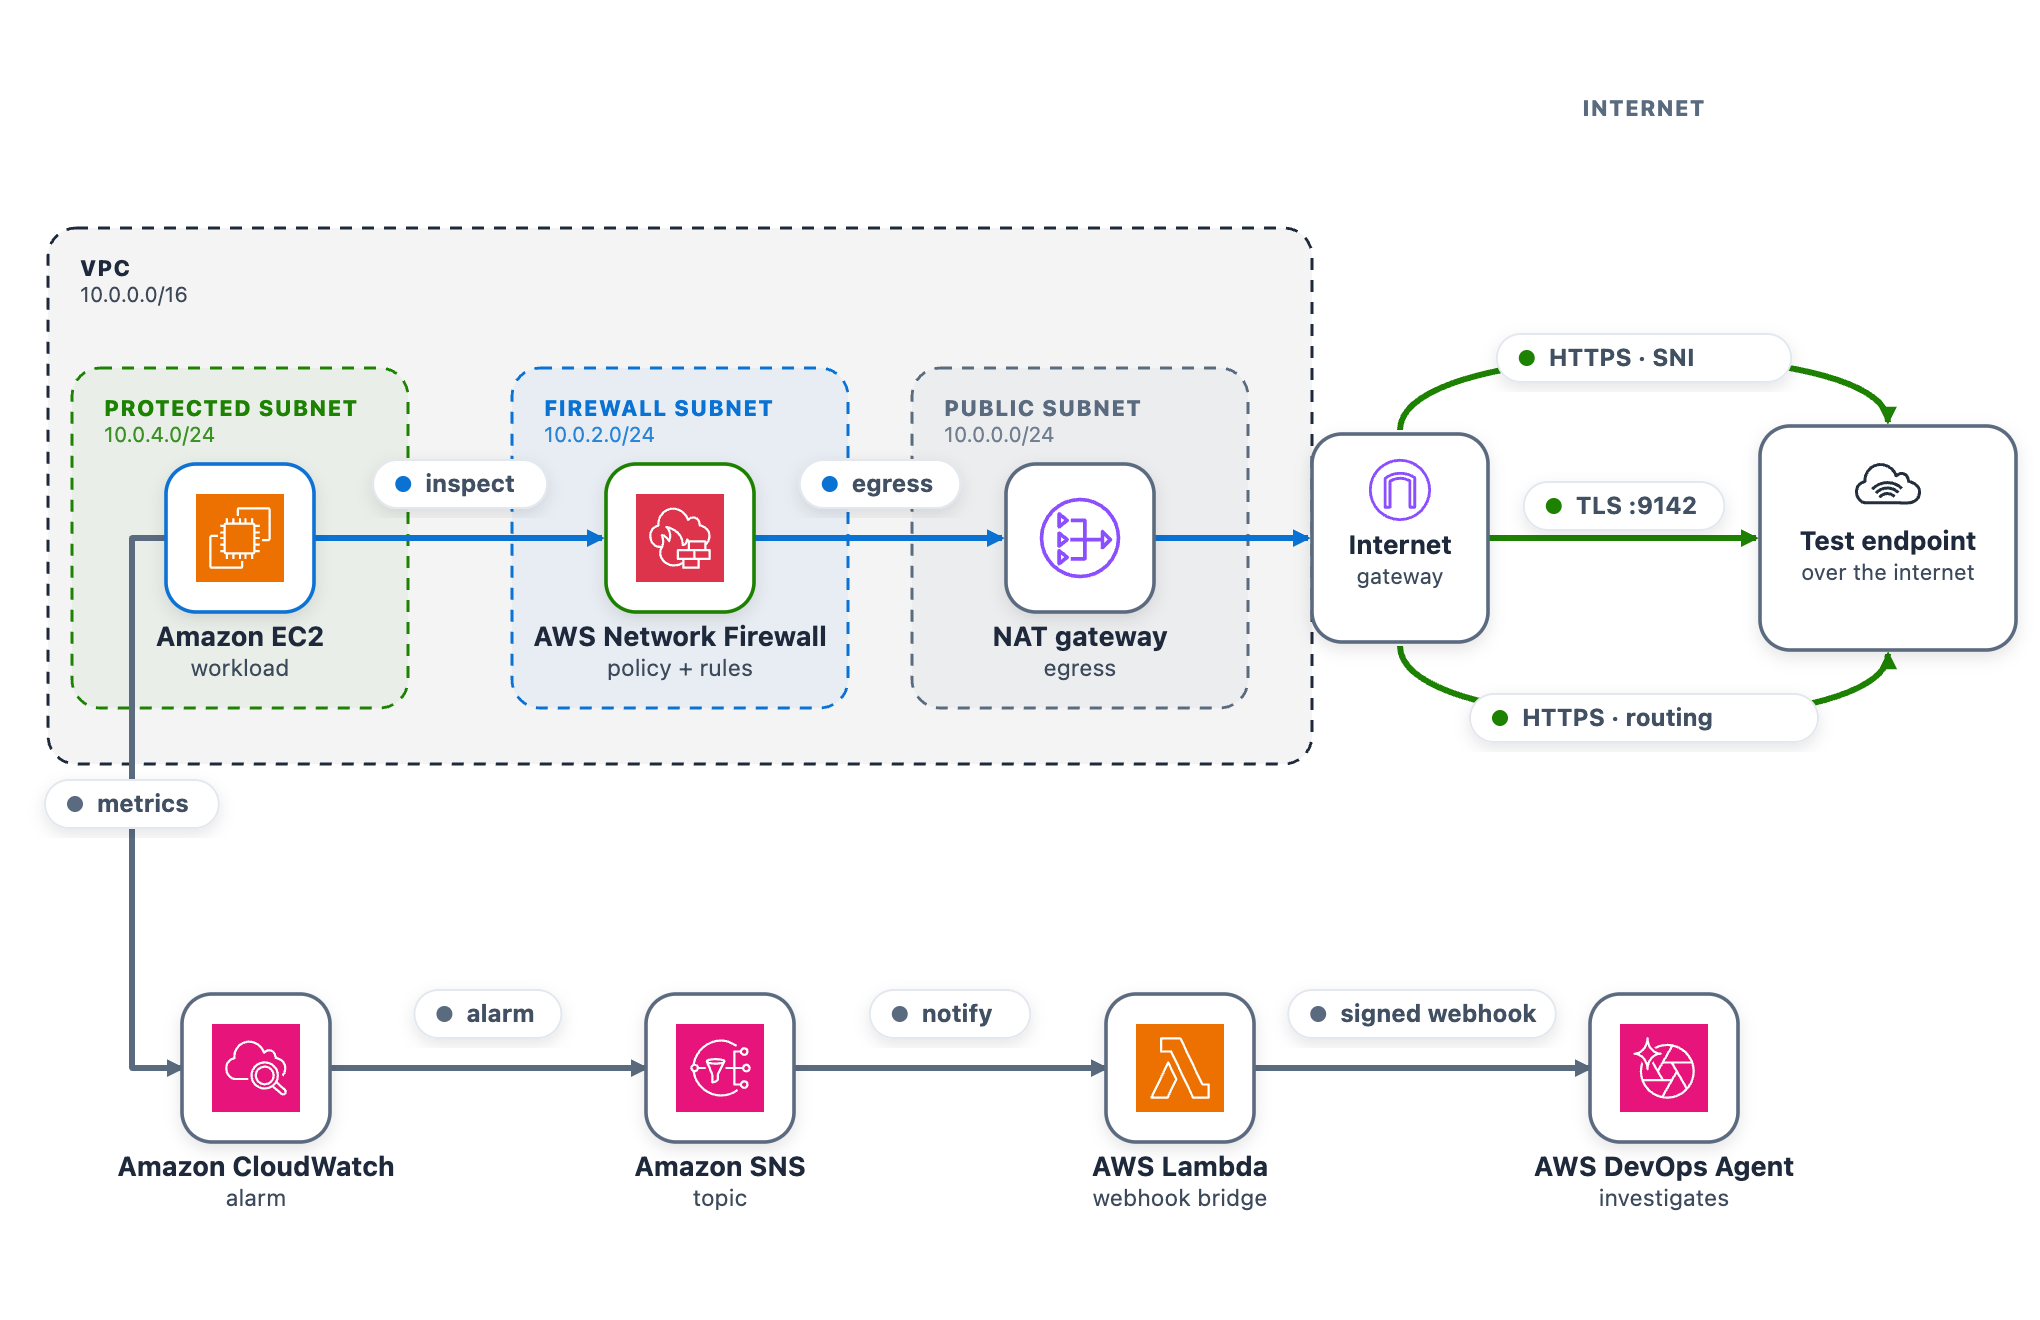
As part of this blog post, we provide a CDK stack that deploys both the AWS DevOps Agent Space and a sample workload used to walk through three separate troubleshooting scenarios. A single t3.micro instance in a protected subnet checks its connectivity to a test endpoint on a continuous loop and publishes results to CloudWatch. Traffic takes the internet egress path through Network Firewall, the NAT gateway, and the internet gateway, so the firewall can intercept or drop it. After completing the walkthrough, you can apply the same troubleshooting techniques with DevOps Agent against your own Network Firewall deployments.

The test endpoint runs in a separate VPC deployed by the same CDK app. It serves HTTPS on port 443 and TCP on port 9142, giving each scenario a different protocol layer to exercise: Scenario 1 targets a TLS connection on 443 (matched by Server Name Indication), Scenario 2 targets a TCP connection on 9142, and Scenario 3 exercises the whole egress path.

A live status page shows one card per scenario plus the network topology. The whole stack deploys from a single CDK app across two Availability Zones, each with a firewall endpoint and NAT gateway, which is what makes Scenario 3 possible.

As shown in the following figure, the egress data path runs from the workload through Network Firewall and the NAT and internet gateways to the test endpoint. The alarm pipeline runs from CloudWatch through Amazon Simple Notification Service (Amazon SNS) and the webhook AWS Lambda function to DevOps Agent.

Figure 1: The sample workload

Figure 1: The sample workload

To use this with your own workload, you need a CloudWatch alarm that detects the connectivity problem and the webhook pipeline (SNS topic and Lambda function) that delivers it to DevOps Agent. The agent reads your firewall configuration, logs, and CloudTrail through AWS APIs, so no additional instrumentation is needed on the firewall side.

Prerequisites

To follow along with this post, you need:

Deploy the sample workload

Clone the project and deploy it into us-east-1 with one command (set awsRegion to use another AWS Region).

git clone https://github.com/aws-samples/sample-accelerating-aws-network-firewall-troubleshooting-with-aws-devops-agent.git
cd sample-accelerating-aws-network-firewall-troubleshooting-with-aws-devops-agent
bash scripts/deploy.sh

The script checks prerequisites, installs dependencies, compiles and tests, and bootstraps the CDK if needed. It then deploys all the stacks from a clean baseline and prints the outputs, including the status-page URL and sign-in details.

  1. Open the status-page link (an https://<random-id>.cloudfront.net address).
  2. Sign in using the username and password provided from the CDK output and confirm all three cards show the green Healthy status.
  3. Keep the page open while you run the scenarios.

Connect AWS DevOps Agent

To connect AWS DevOps Agent to the alarm pipeline

  1. In the AWS DevOps Agent console, open the nf-devops-agent-space Agent Space created by the CDK deployment.
  2. Configure the DevOps Agent webhook and download the CSV file with the webhook URL and signing secret.
  3. On the status page, choose Configure webhook, paste the URL and signing secret, and save. The page writes them to the nf-devops-agent-webhook-credentials AWS Secrets Manager secret, so there is no AWS CLI or console step. Until you set it, the bridge Lambda function sees a placeholder and skips delivery.
  4. Verify the path before you run a scenario. In the Lambda console, open nf-devops-agent-webhook and use the Test tab with this event.
    {
      "Records": [
        {
          "Sns": {
            "Message": "{\"AlarmName\":\"TEST-webhook-verification\",\"AlarmDescription\":\"[TEST] Webhook integration test - not a real alarm.\",\"NewStateValue\":\"ALARM\",\"NewStateReason\":\"[TEST] Manual webhook connectivity test. Safe to ignore.\",\"Region\":\"us-east-1\"}"
          }
        }
      ]
    }
  5. A 200 response confirms the path, and a test investigation appears in the DevOps Agent Operator Web App view.

How the alarm pipeline works

Every scenario reaches DevOps Agent the same way. A CloudWatch alarm moves to ALARM and notifies the SNS topic. Amazon SNS invokes a Lambda function. The function reads the webhook URL and signing secret from Secrets Manager, signs an alarm payload, and POSTs it to the DevOps Agent webhook (as shown in Figure 1). Amazon SNS also provides delivery retries, fan-out to other subscribers, and cross-account publishing.

  • Prebuilt Network Firewall metric (Scenario 1) – Alarm-1 watches the DroppedPackets metric, summed across the stateful streams, and triggers when drops rise above a baseline threshold. This requires no workload or custom metric and works on an already-deployed firewall. However, it only tells you that the firewall is dropping packets, not which rule is responsible.
  • Application health metric (Scenarios 2 and 3) – Alarm-2 and Alarm-3 watch a custom metric from a connectivity check. Use this for an alarm tied to user-facing impact or to tell one traffic path from another, which requires running a component that emits the metric.
Alarm Source Triggers when
Alarm-1 Native AWS/NetworkFirewall DroppedPackets The firewall’s dropped-packet count rises above the baseline
Alarm-2 Custom application health metric The port 9142 (TCP) connectivity check to the test endpoint is being dropped
Alarm-3 Custom application health metric The cross Availability Zone connectivity check is being dropped

Run the scenarios

Work through each of the scenarios one at a time, following the same cycle. Interrupt network connectivity, watch the alarm trigger, let DevOps Agent investigate, apply the recommended fix, and confirm recovery before moving on.

The status-page cards follow the live CloudWatch alarm state. A card shows a green dot and the word Healthy when its alarm is clear, and a red dot and the word DROPPED when its alarm triggers. In the DROPPED state the card also adds a Condition: line describing what’s being dropped, which isn’t shown when the card is healthy. Network Firewall applies changes to new flows, so a change shows within a minute or two. Recovery comes from the mitigation DevOps Agent recommends, which you review and apply.

Scenario 1. Domain deny list blocking a legitimate endpoint

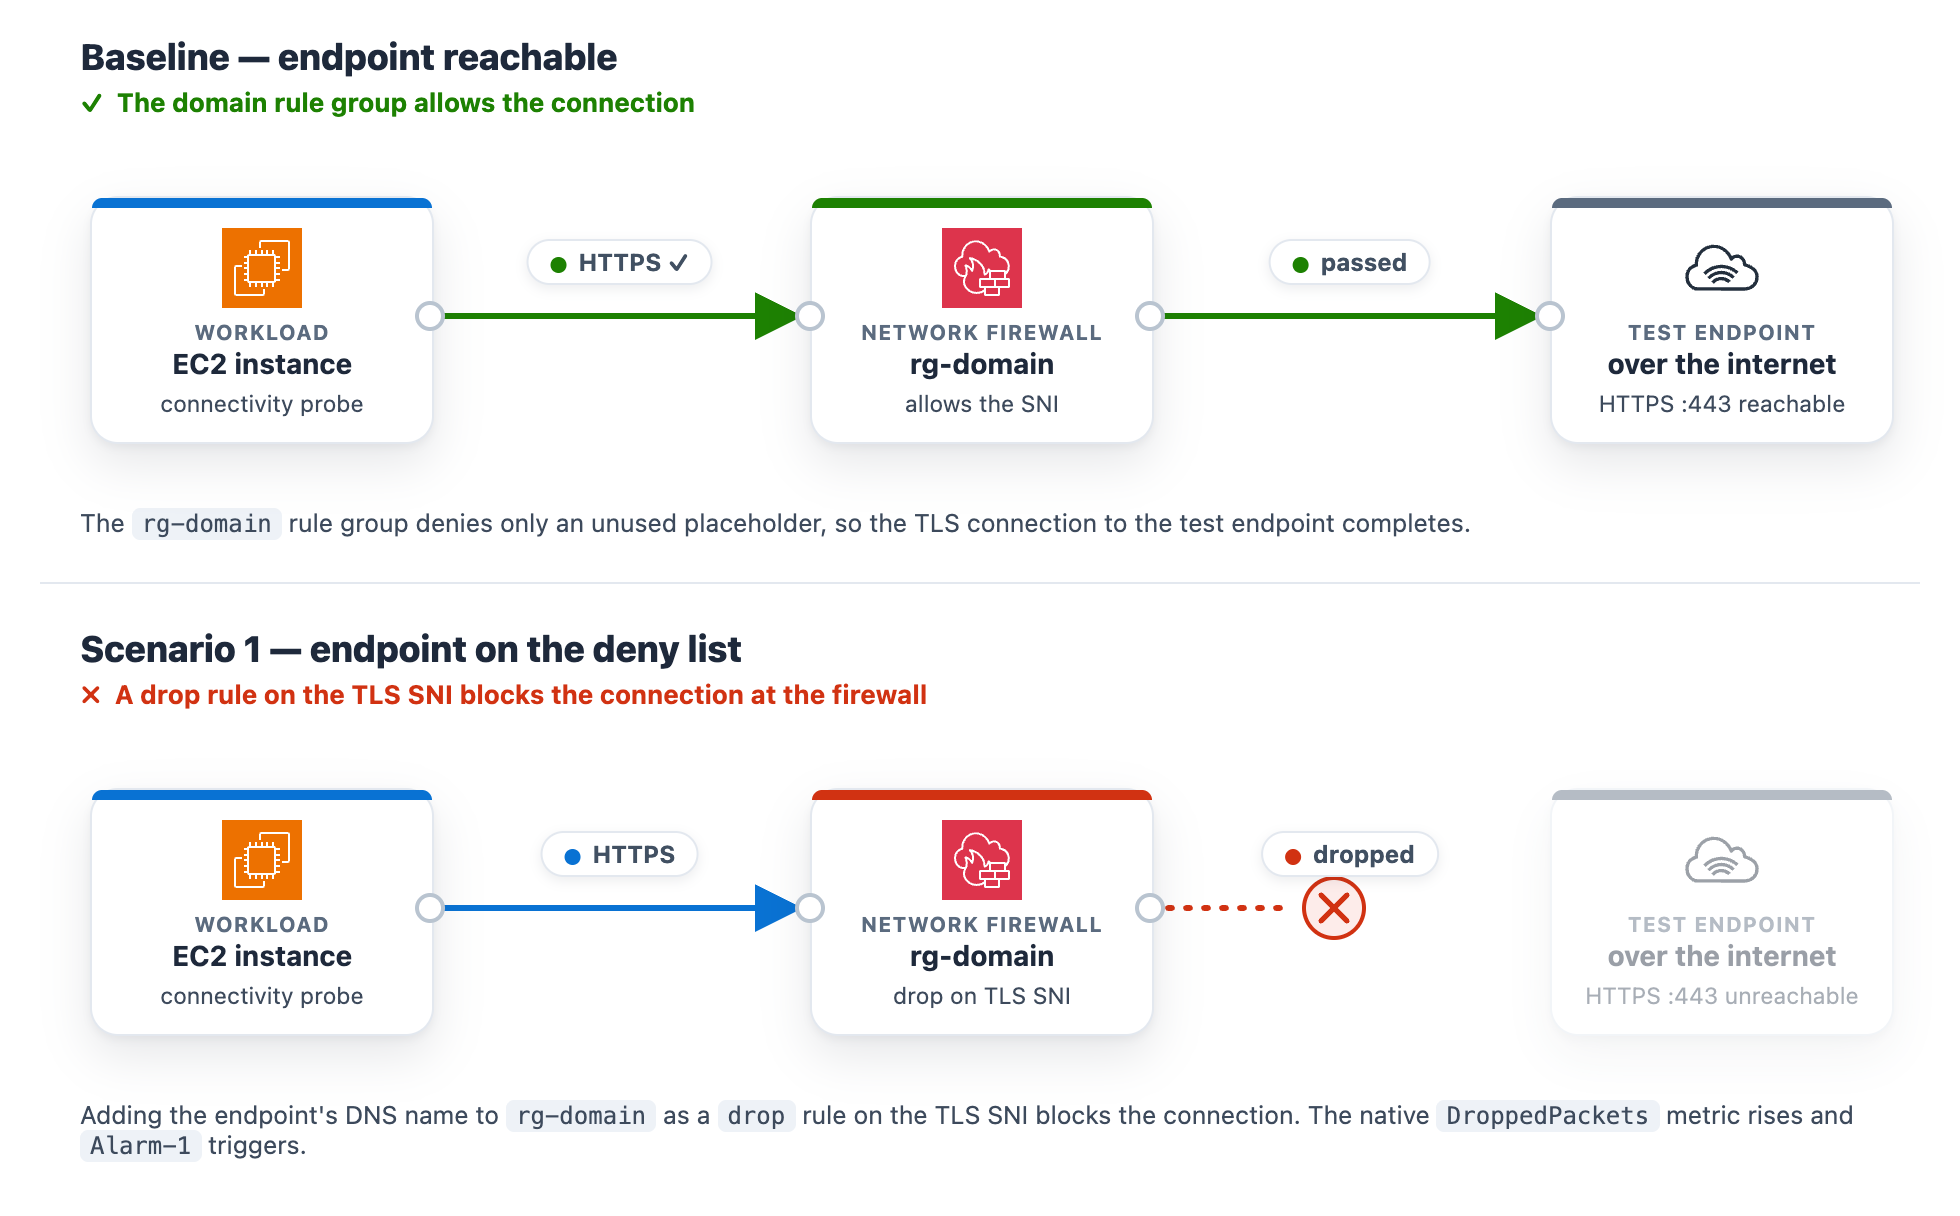
At baseline, the rg-domain Suricata domain rule group denies only an unused placeholder, so the test endpoint stays reachable. The rule group inspects the TLS Server Name Indication (SNI) on each outbound connection and drops any that matches a denied domain. The exact rule syntax and console steps follow.

To add the domain deny rule

  1. Go to the Amazon VPC console.
  2. In the navigation pane, under Network Firewall, choose Network Firewall rule groups.
  3. Choose the rg-domain rule group to open its details page.
  4. In the Rules section, choose Edit.
  5. The rules box already contains two baseline placeholder rules (they match blocked.placeholder.invalid, so nothing real is denied). Leave those in place. Find the <app-endpoint-dns> value for Scenario 1 in the deployment script output (a Nework Load Balancer (NLB) DNS name such as NfTest-AppNl-a1b2C3dEf4G5-1234abcd5678efgh.elb.us-east-1.amazonaws.com). On a new line below the existing rules, add a drop rule that matches that DNS name on the TLS SNI, then choose Save.
    drop tls $HOME_NET any -> $EXTERNAL_NET any (ssl_state:client_hello; tls.sni; content:"<app-endpoint-dns>"; startswith; nocase; endswith; msg:"S1 domain denylist"; flow:to_server, established; sid:2000002; rev:1;)
  6. After saving, the rules box holds all three lines. The two placeholders remain, plus the new drop rule for the endpoint DNS name (note the distinct sid 2000002).
Figure 2: Scenario 1 – Firewall rule change blocking the connection

Figure 2: Scenario 1 – Firewall rule change blocking the connection

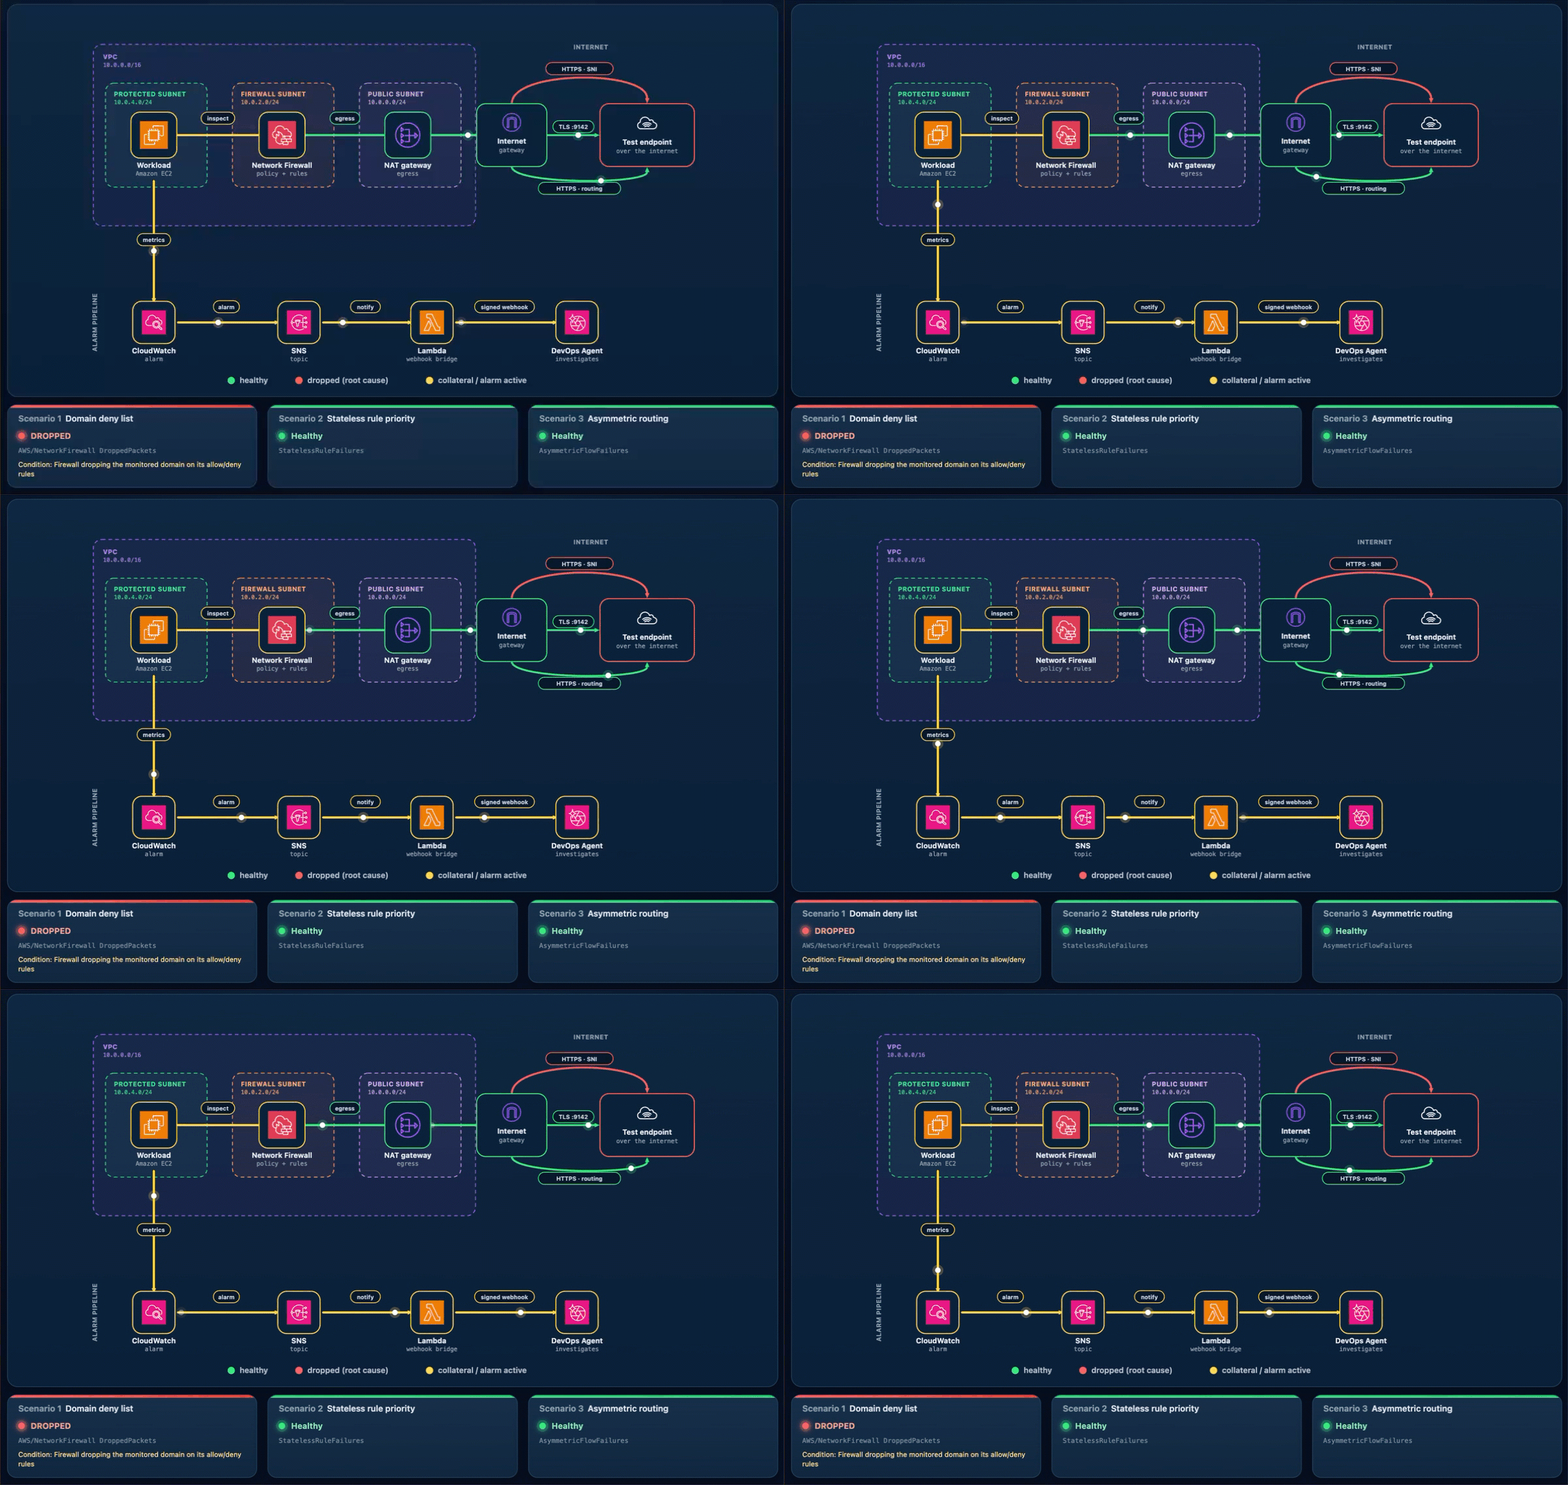
What happens. The workload’s HTTPS check to the test endpoint times out, the “AWS/NetworkFirewall DroppedPackets metric climbs above baseline, and Alarm-1 moves to ALARM. The Scenario 1 card reads DROPPED (with the condition Firewall dropping the monitored domain on its allow/deny rules), while the Scenario 2 and Scenario 3 cards stay Healthy (Figure 3). On the topology, the alarm pipeline from CloudWatch through Amazon SNS and Lambda to DevOps Agent and the workload-to-firewall inspect lines both turn amber, which the legend defines as collateral / alarm active, because the packets are now dropped at the firewall. To demonstrate the resulting failure, the HTTPS · SNI line from the internet gateway to the test endpoint is shown in red, which the legend defines as dropped (root cause).

Figure 3: Scenario 1 active – Traffic blocked at the firewall

Figure 3: Scenario 1 active – Traffic blocked at the firewall

Let DevOps Agent investigate. The agent runs several lines of investigation in parallel and correlates them:

  1. Reads the DroppedPackets metric and correlates the spike with a simultaneous drop in passed packets, confirming the firewall is actively blocking traffic.
  2. Reads the ALERT log and finds the workload’s TLS connections to the test endpoint blocked by the S1 domain denylist rule.
  3. Compares the current state against a baseline window, where the same endpoint was reachable with no alerts, which shows the block is new.
  4. Searches CloudTrail and surfaces the UpdateRuleGroup call that added the deny rule, identifying the user, role, and timestamp approximately one minute before the drops began.
  5. Reports the root cause as that manual rule-group change. Recommends removing the deny entry or adding an allow exception and enabling FirewallPolicyChangeProtection to prevent unauthorized changes.
  6. Presents this as a plan you review and apply, not an automatic change.

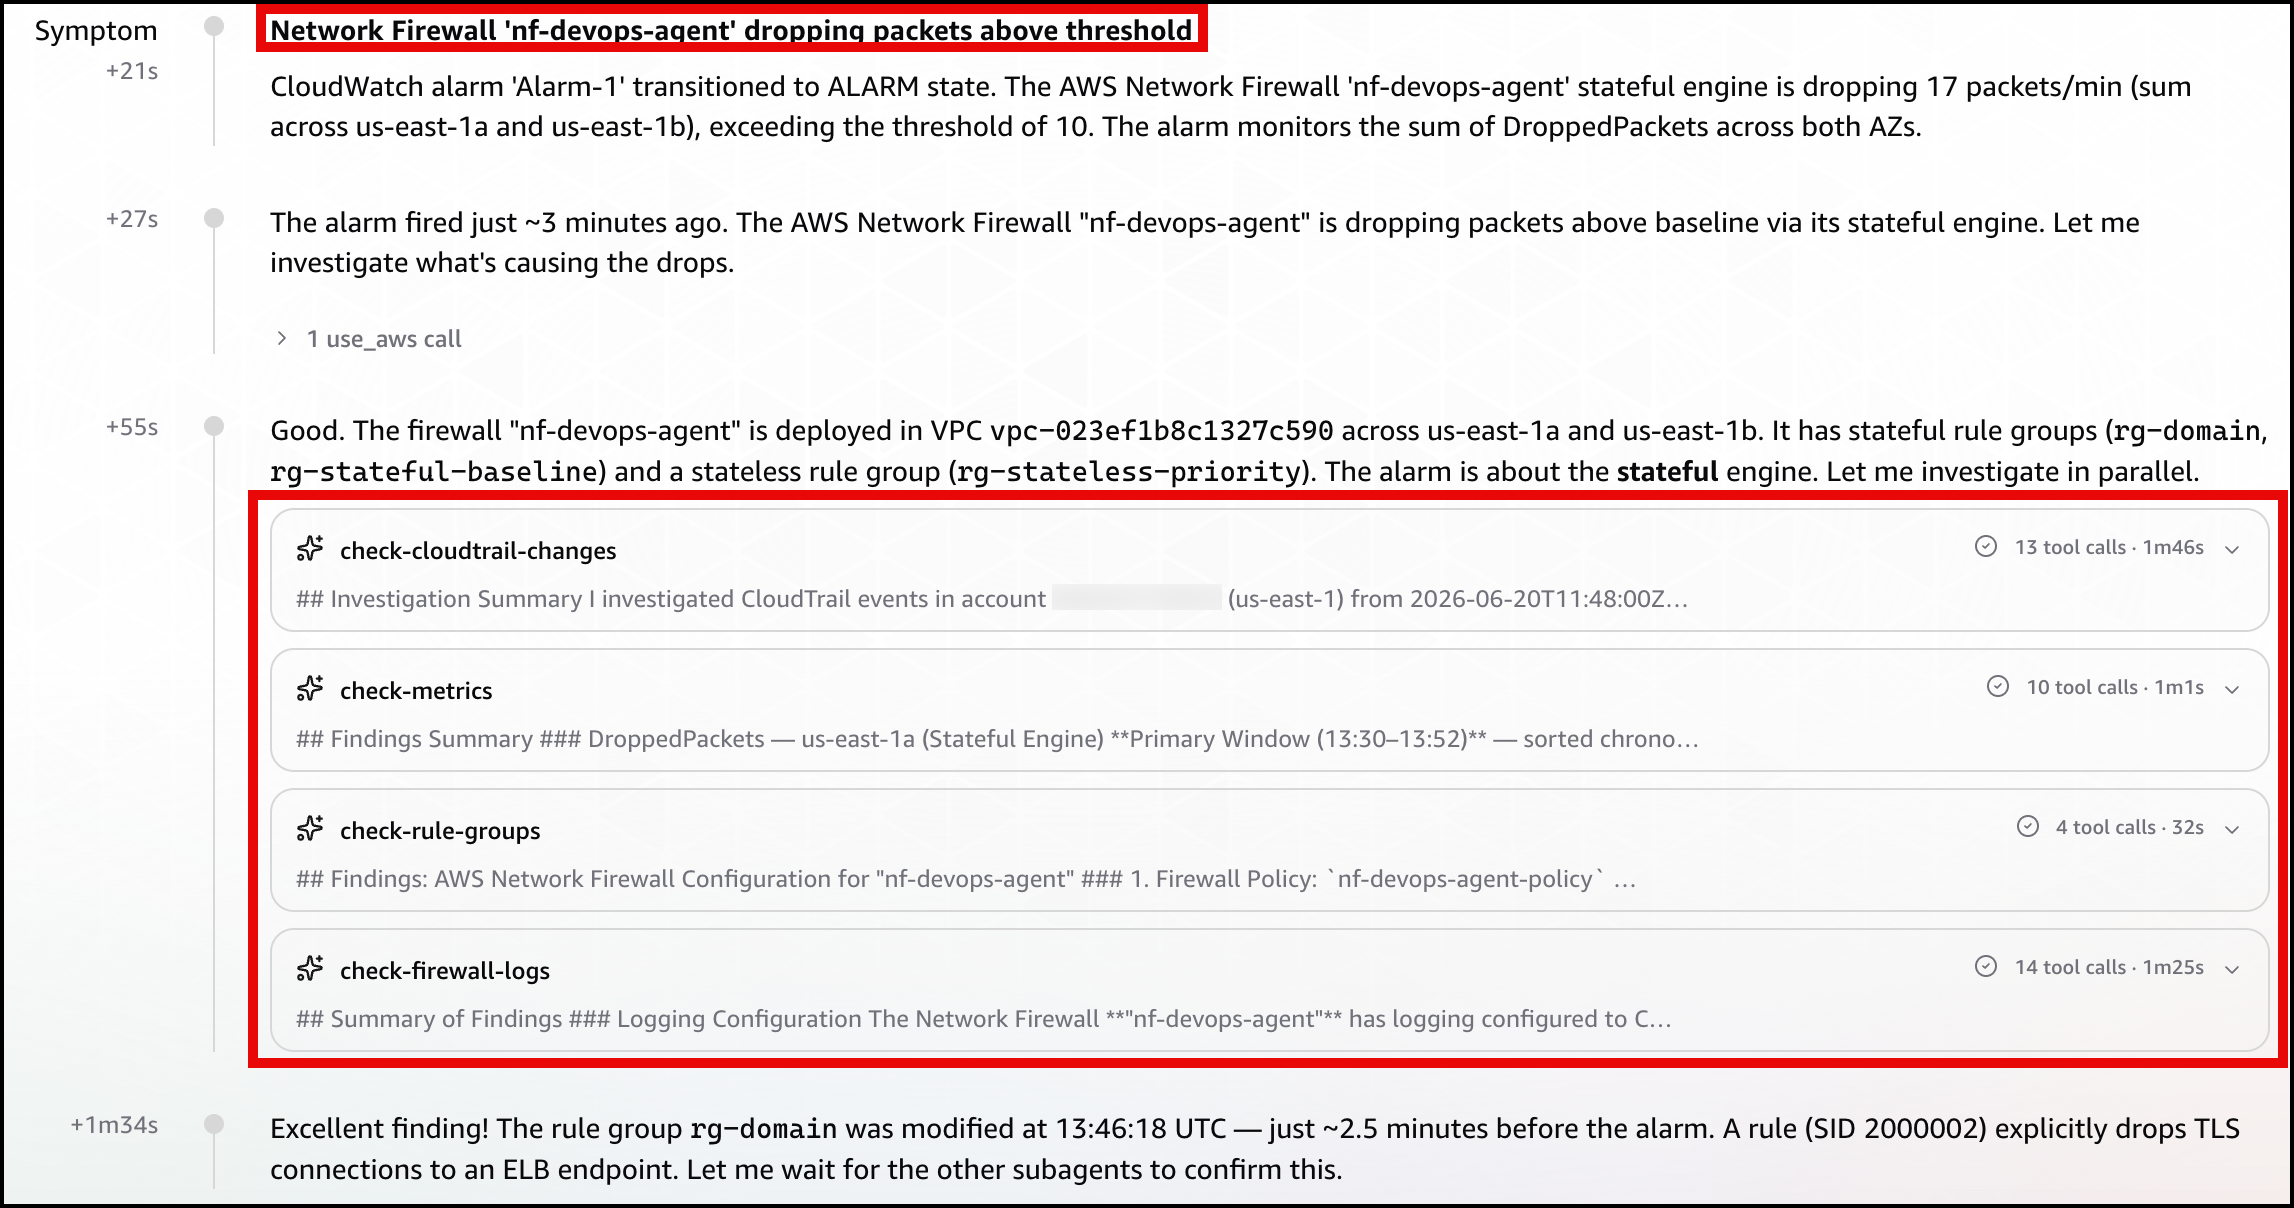
In the DevOps Agent Operator Web App view, the agent first restates the Alarm-1 trigger and confirms the firewall is dropping packets above the threshold (Figure 4).

Figure 4: Scenario 1 – The symptom

Figure 4: Scenario 1 – The symptom

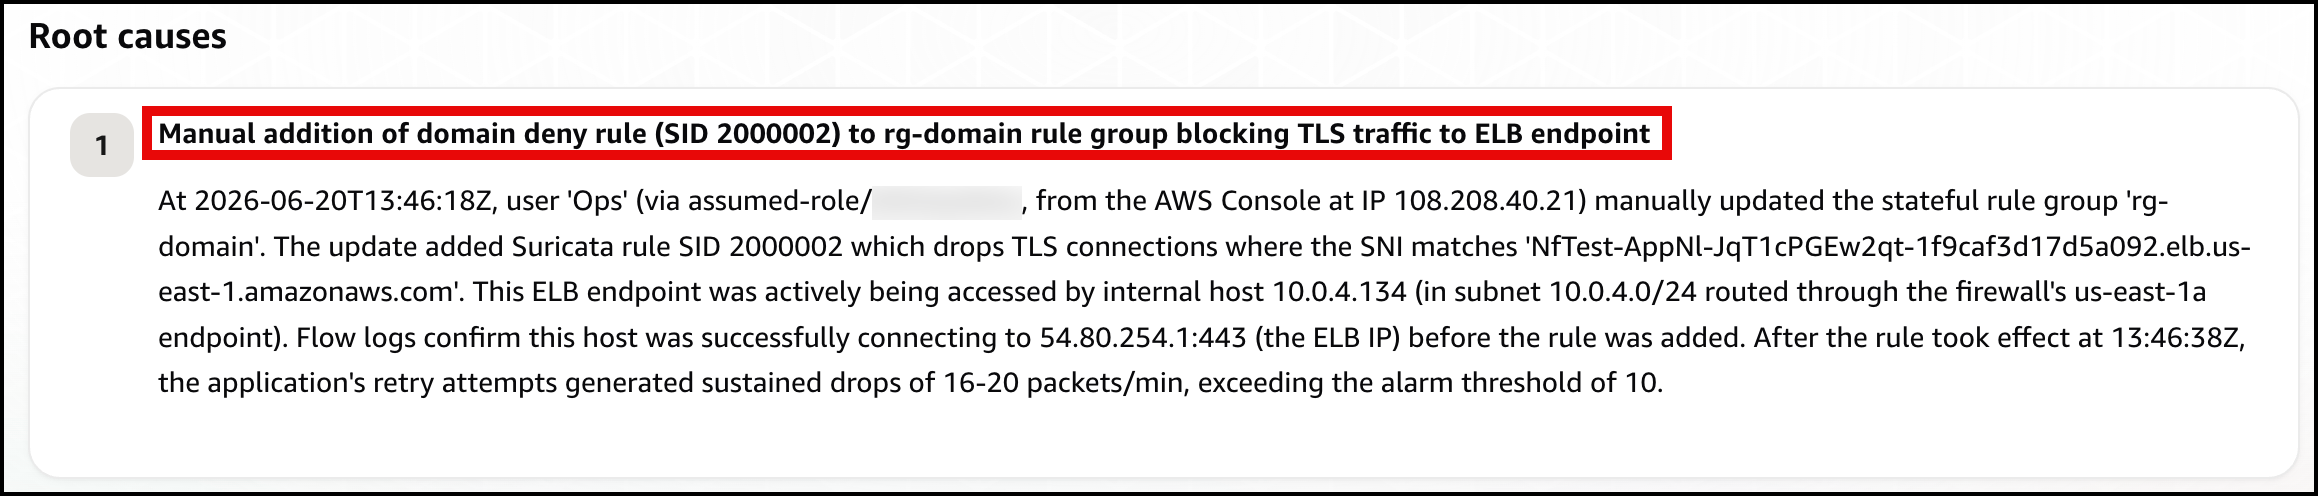
Next, the agent identifies the root cause: a manual update to the rg-domain rule group that added a domain deny rule (SID 2000002) shortly before the alarm fired, blocking TLS connections to the ELB endpoint (Figure 5).

Figure 5: Scenario 1 – The root cause

Figure 5: Scenario 1 – The root cause

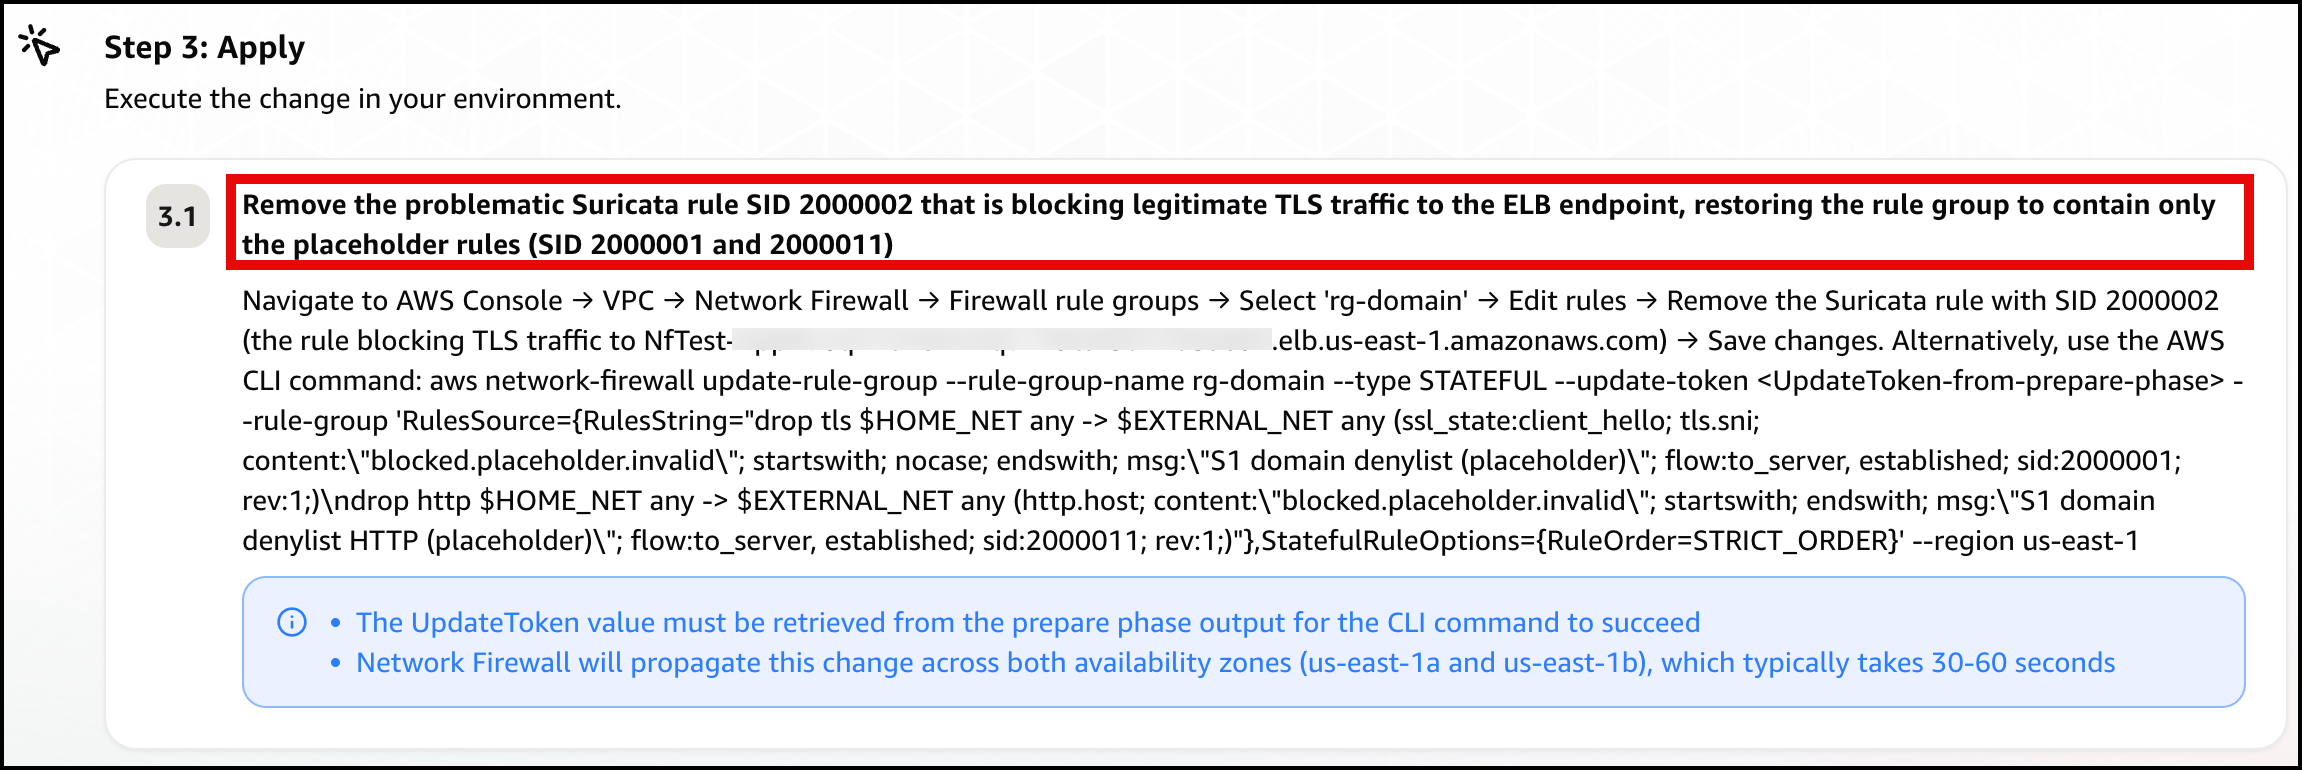
Finally, the agent presents a mitigation plan, recommending you remove the problematic deny rule (SID 2000002) to restore connectivity (Figure 6).

Figure 6: Scenario 1 – The mitigation plan

Figure 6: Scenario 1 – The mitigation plan

Note: In a real-world environment, this type of rule typically exists for a reason. Before removing it, verify whether it was intentional but scoped too broadly. If so, refine the rule to block only unauthorized endpoints rather than removing it entirely.

Confirm recovery. Apply the change the agent recommends. After the deny entry is gone, DroppedPackets falls back to baseline, Alarm-1 clears, and the card returns to green. Move on to Scenario 2.

Scenario 2. Stateless rule priority misconfiguration

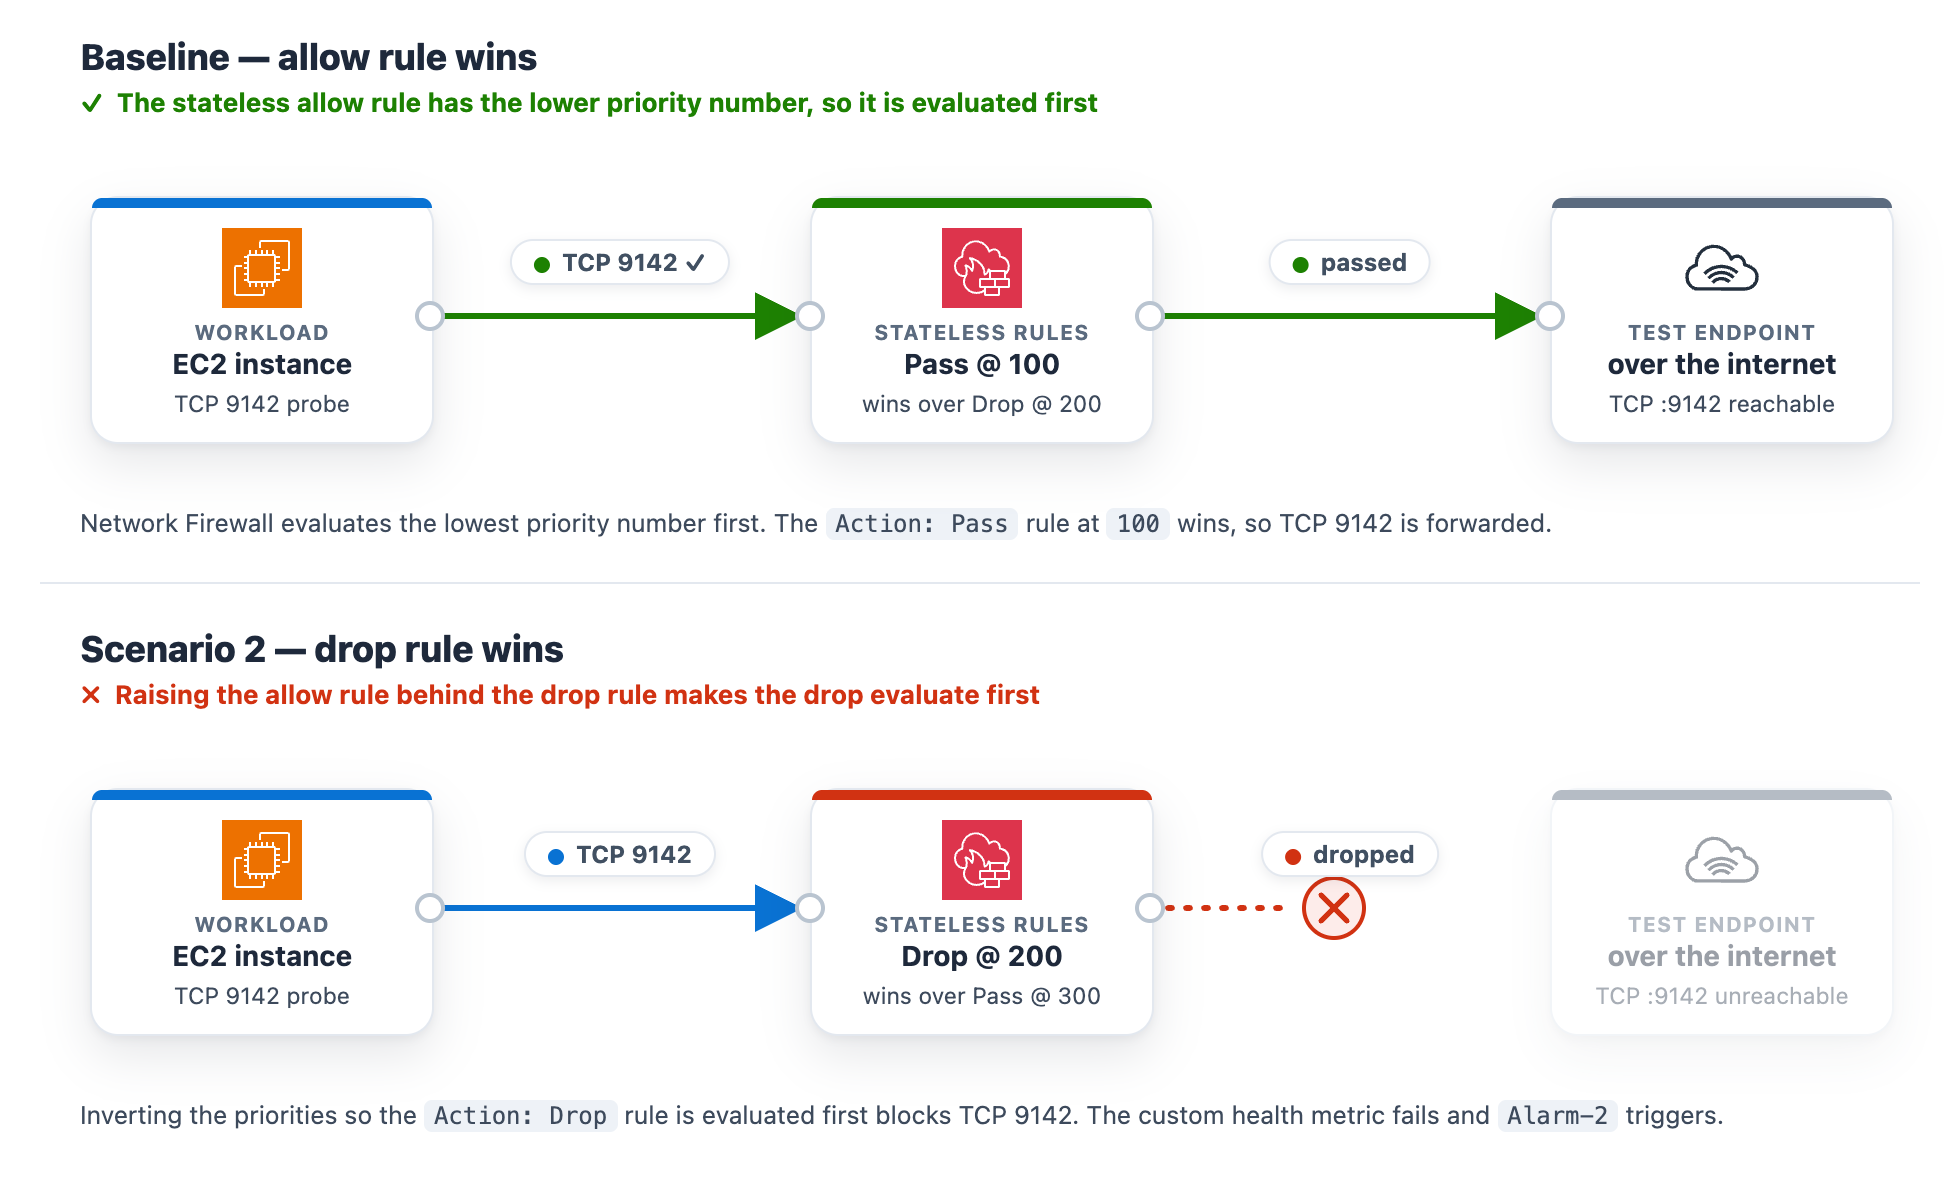
At baseline, the rg-stateless-priority stateless rule group keeps the allow rule at priority 100 and the drop rule at 200 for the test class, TCP destination port 9142. The workload opens a TCP connection to the test endpoint on this port. Lower priority numbers evaluate first, so the allow rule wins. This scenario uses port 9142 instead of 443 to demonstrate a stateless rule, which matches on the packet’s 5-tuple (protocol, ports, addresses) rather than application content.

Introduce the change. Invert the two rule priorities so the drop rule evaluates before the allow rule. This is the kind of change a rushed rule edit can introduce.

To invert the stateless rule priorities

  1. Go to the Amazon VPC console.
  2. In the navigation pane, under Network Firewall, choose Network Firewall rule groups.
  3. Choose the rg-stateless-priority rule group to open its details page.
  4. In the Rules section, choose Edit.
  5. Raise the (Action: Pass) rule’s priority number so it sits after the (Action: Drop) rule, then choose Save. For example, change the (Action: Pass) rule from 100 to 300 (any number higher than the drop rule’s 200 works). You only need to move one rule, and using 300 avoids a clash with the drop rule that already sits at 200. Network Firewall evaluates the lowest priority number first, so the (Action: Drop) rule at 200 now wins for this traffic class, ahead of the (Action: Pass) rule at 300.
Figure 7: Scenario 2 – Rule priority change blocking the traffic class

Figure 7: Scenario 2 – Rule priority change blocking the traffic class

What happens. The drop rule now wins, the TCP connection to the test endpoint on port 9142 times out, the StatelessRuleFailures metric climbs above baseline, and Alarm-2 moves to ALARM. The Scenario 2 card reads DROPPED (with the condition Stateless rules dropping the monitored traffic class), while the Scenario 1 and Scenario 3 cards stay Healthy (Figure 8). On the topology, the alarm pipeline from CloudWatch through Amazon SNS and Lambda to DevOps Agent and the workload-to-firewall inspect lines both turn amber, which the legend defines as collateral / alarm active, because the packets are now dropped at the firewall. To demonstrate the resulting failure, the TLS :9142 line from the internet gateway to the test endpoint is shown in red, which the legend defines as dropped (root cause).

Figure 8: Scenario 2 active

Figure 8: Scenario 2 active

Let DevOps Agent investigate. A stateless drop happens before traffic reaches the stateful inspection engine, so it produces no ALERT log entries. The agent turns to configuration and flow logs instead:

  1. Reads the stateless rule group state and finds the drop rule at the lower priority number, ahead of the pass rule, so the drop evaluates first.
  2. Reads the flow logs and sees passed packets drop to zero within a minute of the change.
  3. Searches CloudTrail and surfaces the UpdateRuleGroup call that inverted the priorities, identifying the user, role, and timestamp about a minute before the alarm.
  4. Reports the root cause as that priority inversion. Recommends removing the redundant drop rule and managing the rule group through infrastructure-as-code (IaC) to prevent manual misconfigurations.
  5. Presents this as a plan you review and apply, not an automatic change.

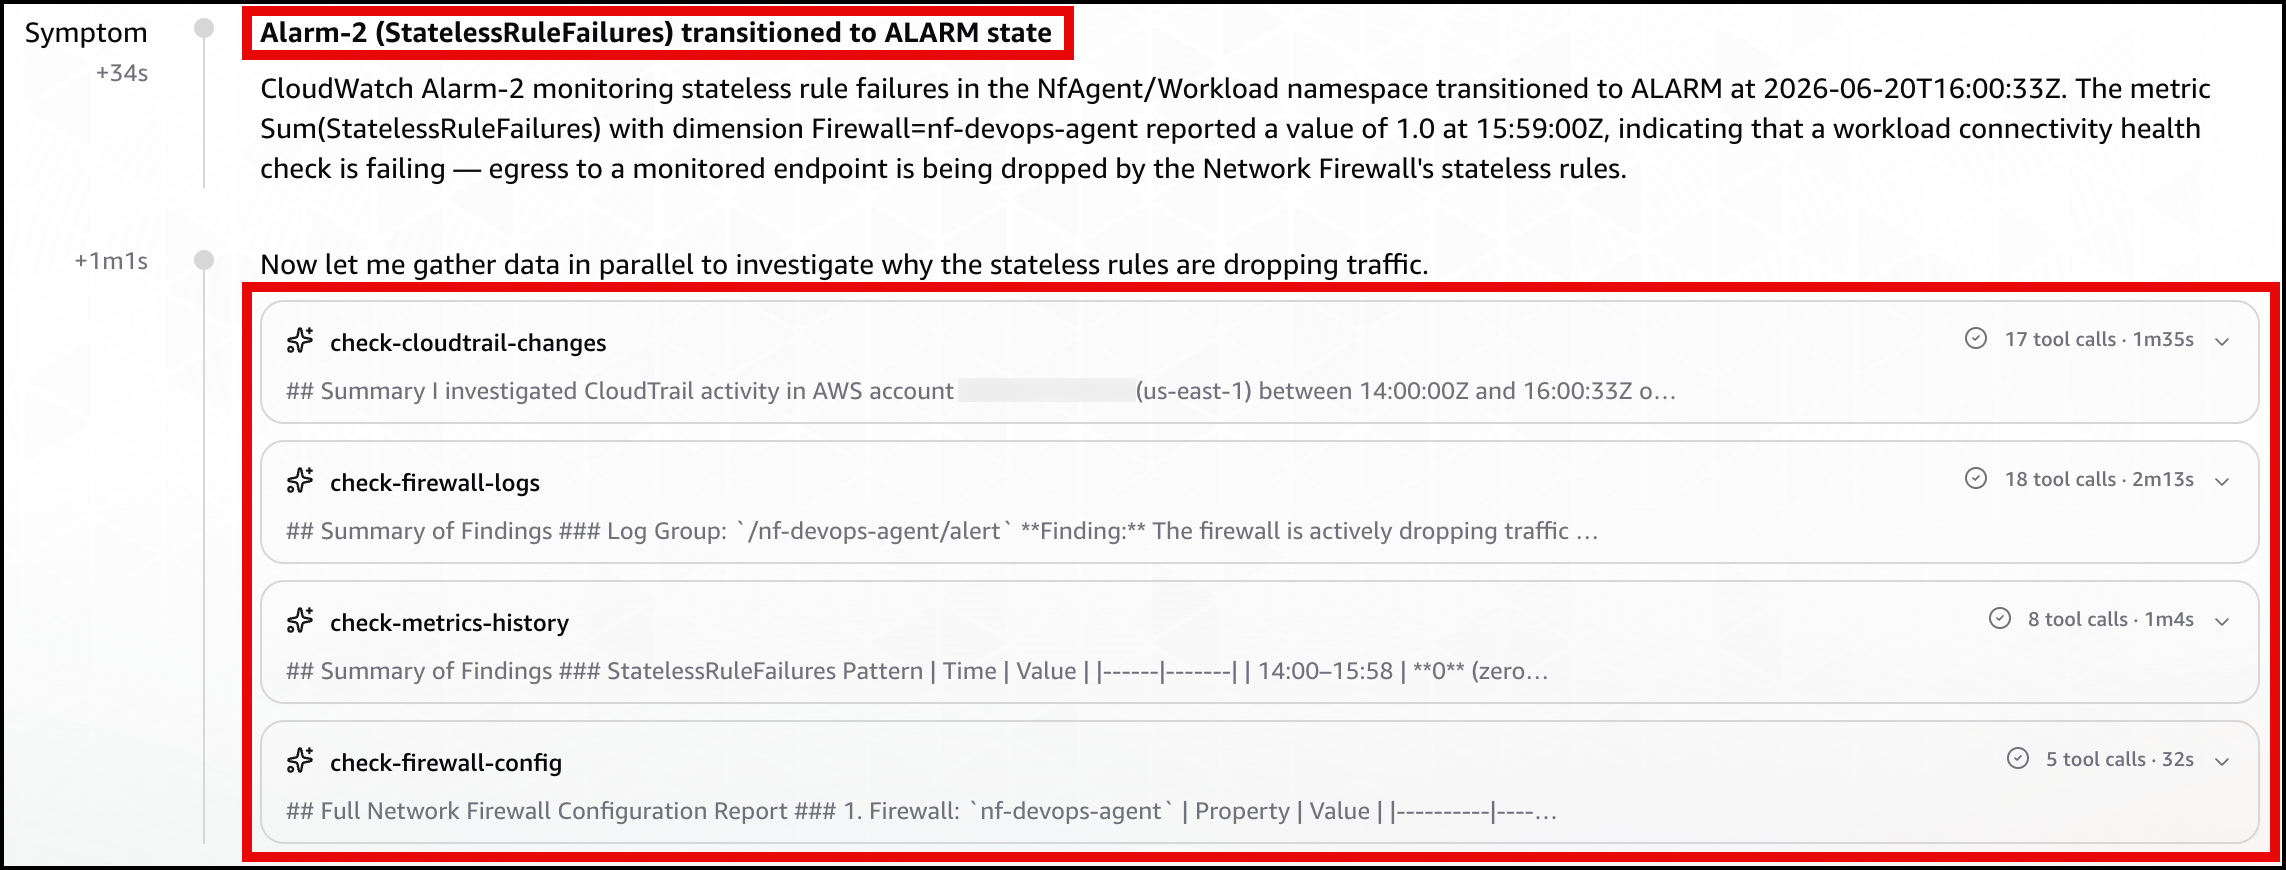
In the DevOps Agent Operator Web App view, the agent first restates the Alarm-2 trigger and confirms that a workload connectivity health check is failing because the firewall’s stateless rules are dropping egress (Figure 9).

Figure 9: Scenario 2 – The symptom

Figure 9: Scenario 2 – The symptom

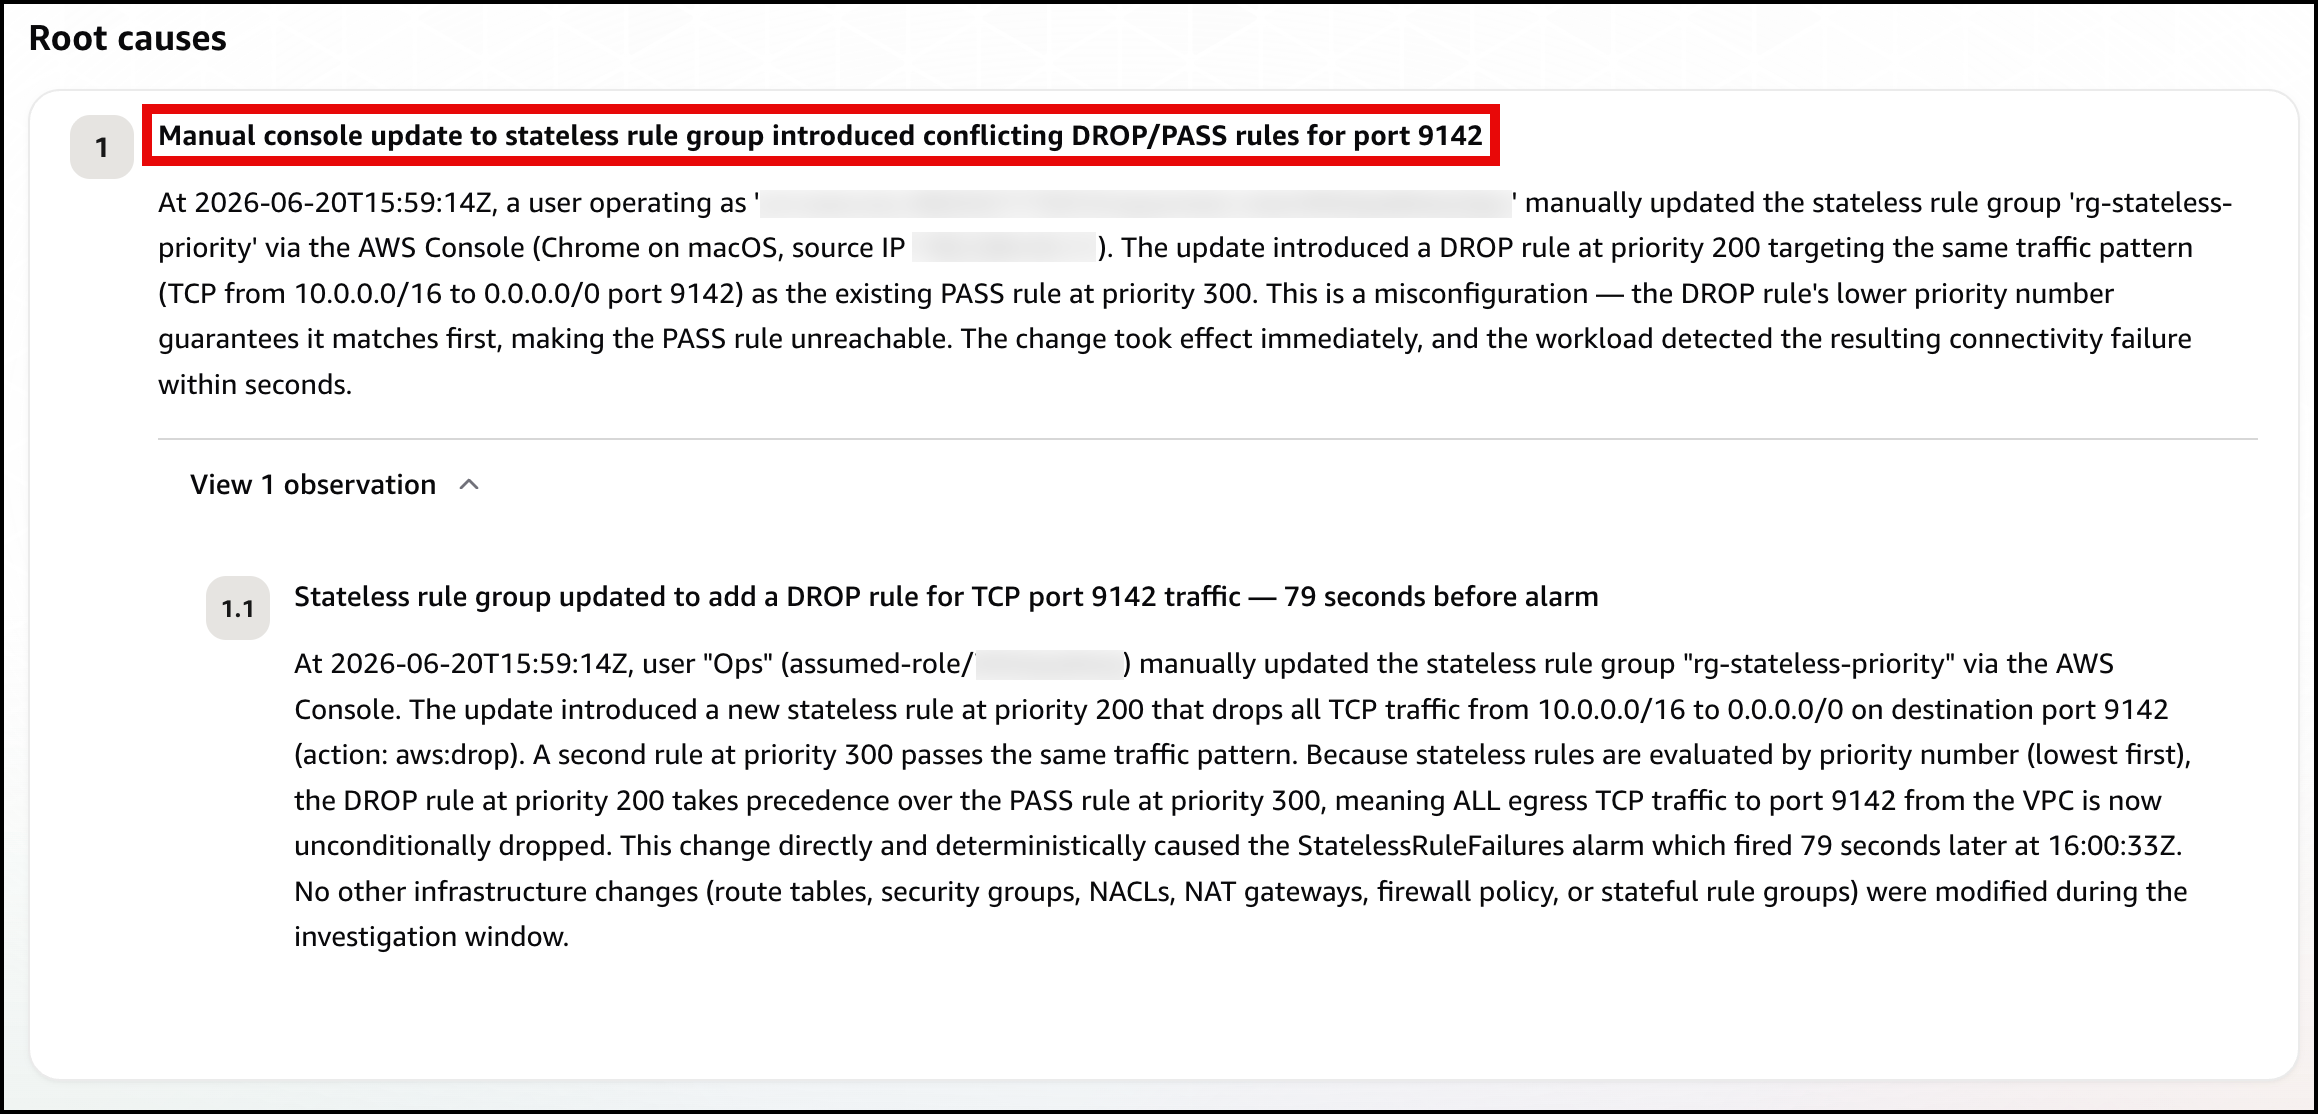
Next, the agent identifies the root cause, using the rule-group state and CloudTrail to pinpoint the conflicting DROP/PASS rules, where the new DROP rule’s lower priority number makes it match first (Figure 10).

Figure 10: Scenario 2 – The root cause

Figure 10: Scenario 2 – The root cause

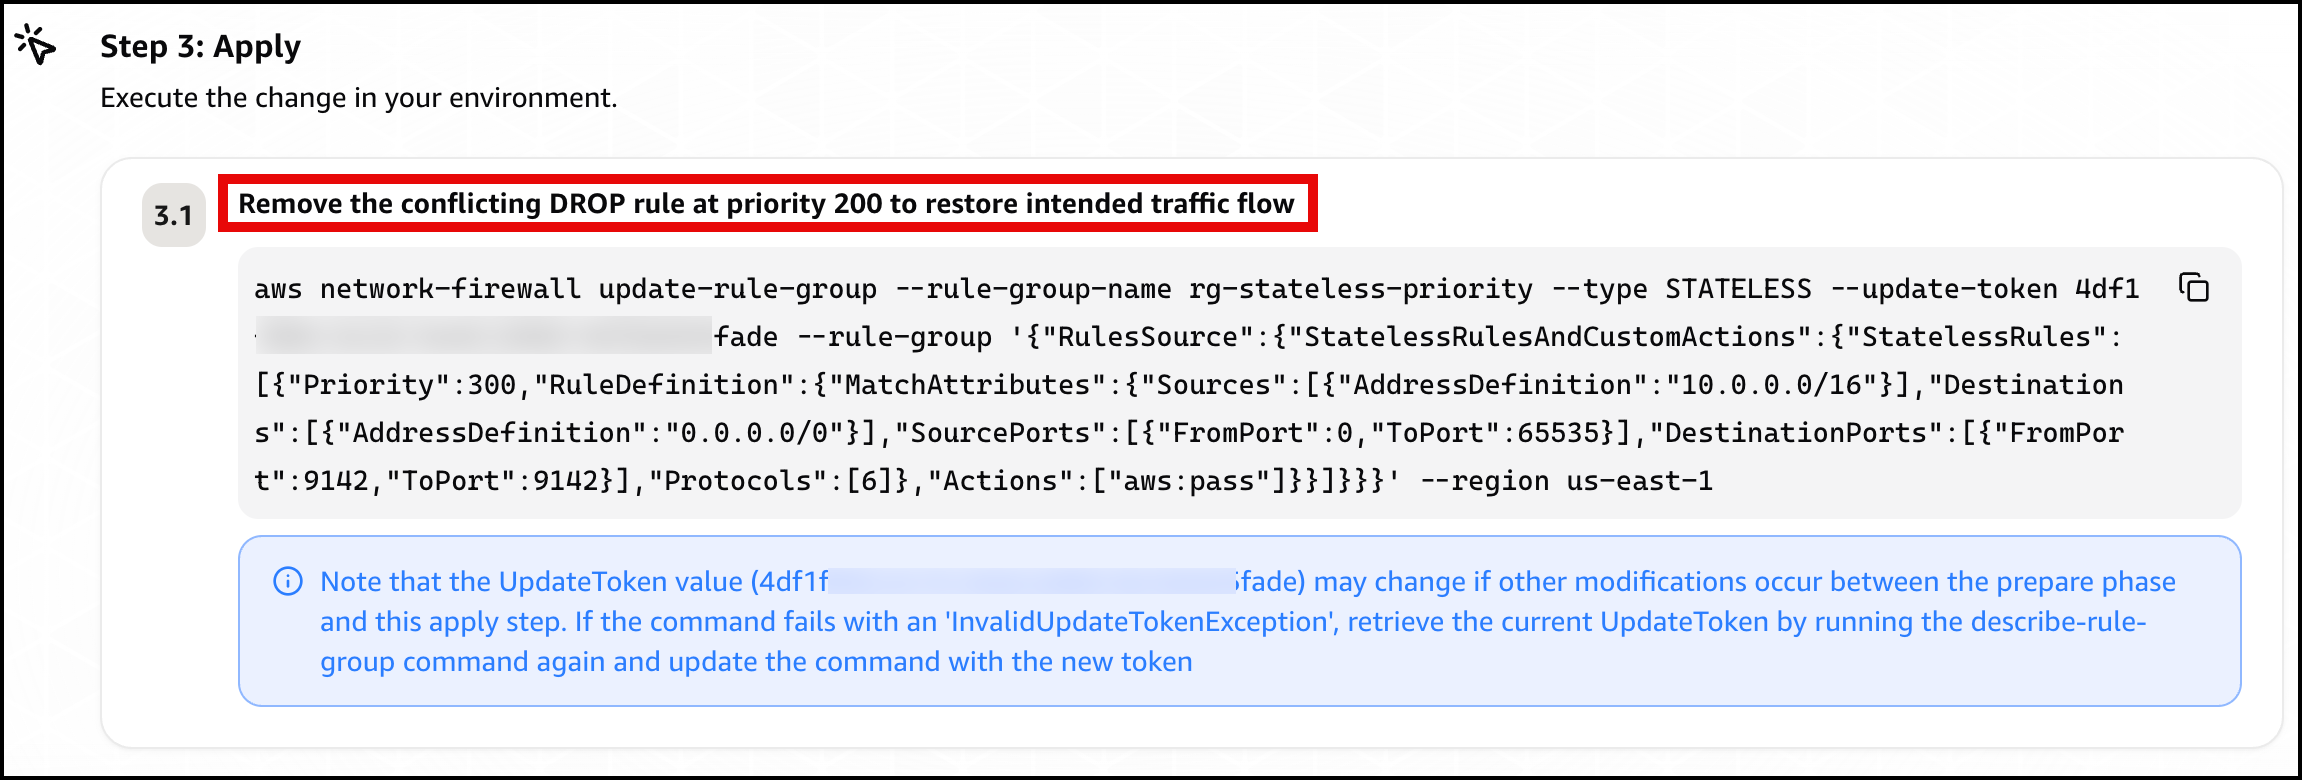
Finally, the agent presents a mitigation plan, recommending you remove the conflicting DROP rule at priority 200 to restore traffic flow (Figure 11).

Figure 11: Scenario 2 – The mitigation plan

Figure 11: Scenario 2 – The mitigation plan

Confirm recovery. Apply the change the agent recommends. After the allow rule is ahead of the drop rule again, Alarm-2 clears and the card returns to green. Move on to Scenario 3.

Scenario 3. Asymmetric cross Availability Zone routing drop

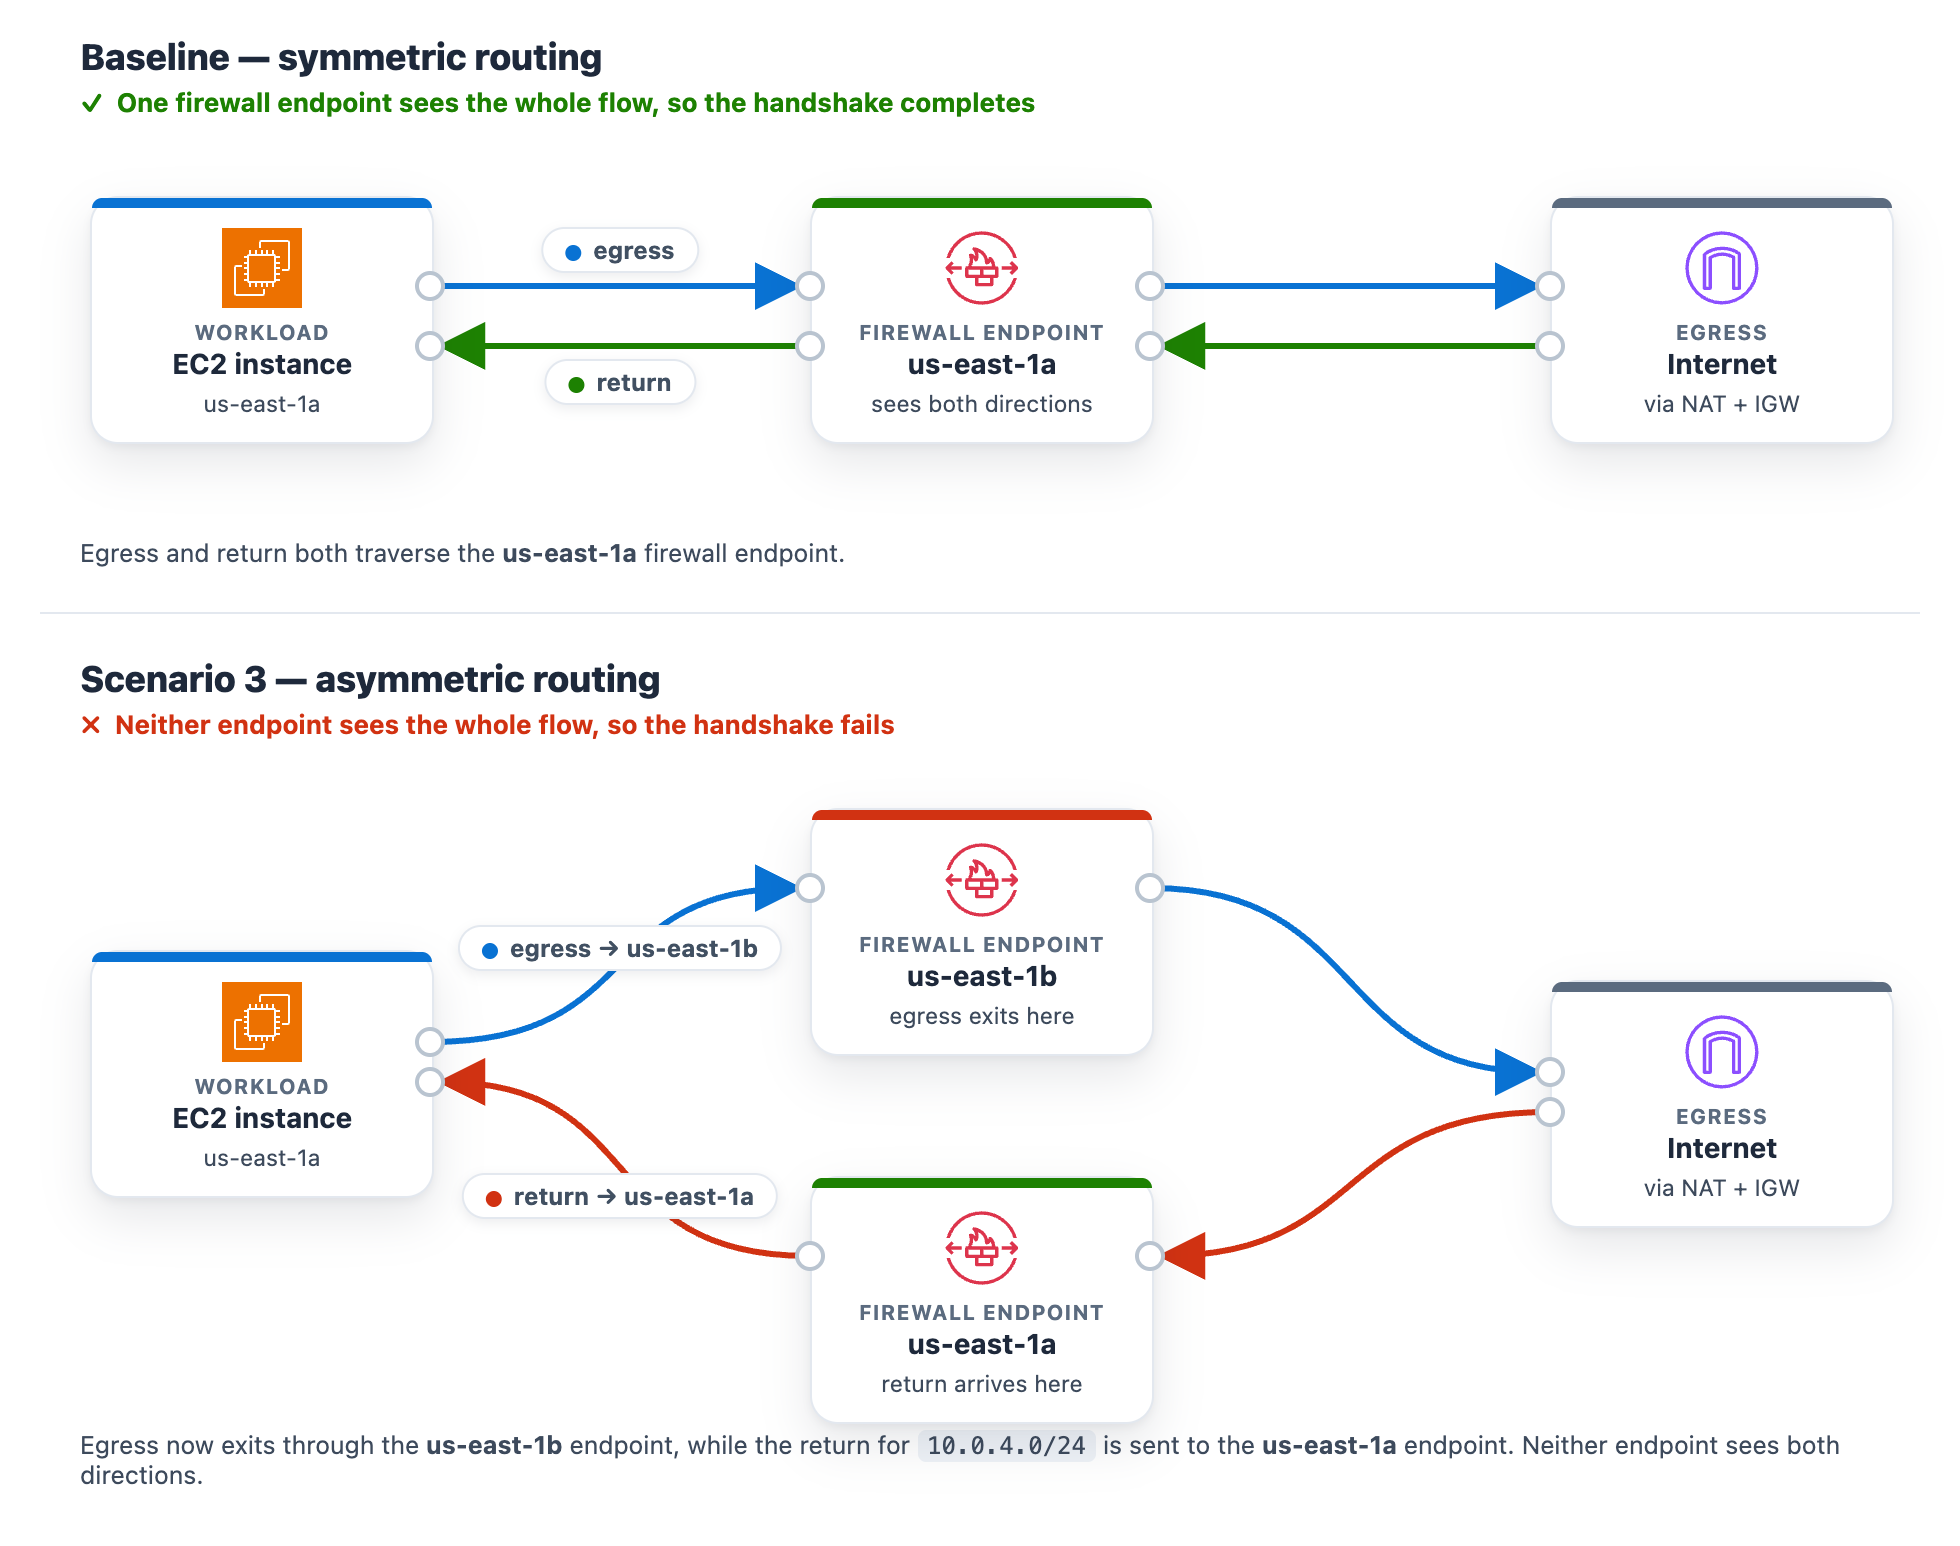
At baseline, the protected subnet in each Availability Zone routes its egress through the firewall endpoint in that same Availability Zone , and the matching return route uses that same endpoint. One endpoint sees both directions of the flow, so the stateful engine completes the handshake. The workload runs in the protected subnet in us-east-1a (CIDR 10.0.4.0/24), so at baseline its egress and its return both use the us-east-1a firewall endpoint.

Introduce the change. Make the flow asymmetric by sending egress out one Availability Zone endpoint while the return comes back through the other. This takes two route edits, and both are required. With only the first edit the flow can still complete, so the alarm will not trigger until both are saved. It makes no firewall-policy change, mirroring a real multi-Availability-Zone routing mistake.

To create asymmetric cross Availability Zone routing

  1. Go to the Amazon VPC console and choose Route tables in the navigation pane.
  2. Flip the egress. Select the NfNetworkStack/SampleVpc/protectedSubnet1 route table (the us-east-1a protected subnet, where the workload runs). On the Routes tab, choose Edit routes. Its 0.0.0.0/0 route currently targets the us-east-1a firewall endpoint. For the target, choose Gateway Load Balancer Endpoint and select the us-east-1b firewall endpoint, then choose Save changes.
  3. Move the return. Select the NfNetworkStack/SampleVpc/publicSubnet2 route table (the us-east-1b public subnet, where egress now exits). Choose Edit routes, then Add route. For the destination enter the workload CIDR 10.0.4.0/24. For the target, choose Gateway Load Balancer Endpoint and select the us-east-1a firewall endpoint. Choose Save changes.

After both edits, a flow’s egress leaves through the us-east-1b endpoint while its return is directed to the us-east-1a endpoint. Neither endpoint sees the whole flow.

Figure 12: Scenario 3 routing change breaking the flow’s symmetry

Figure 12: Scenario 3 routing change breaking the flow’s symmetry

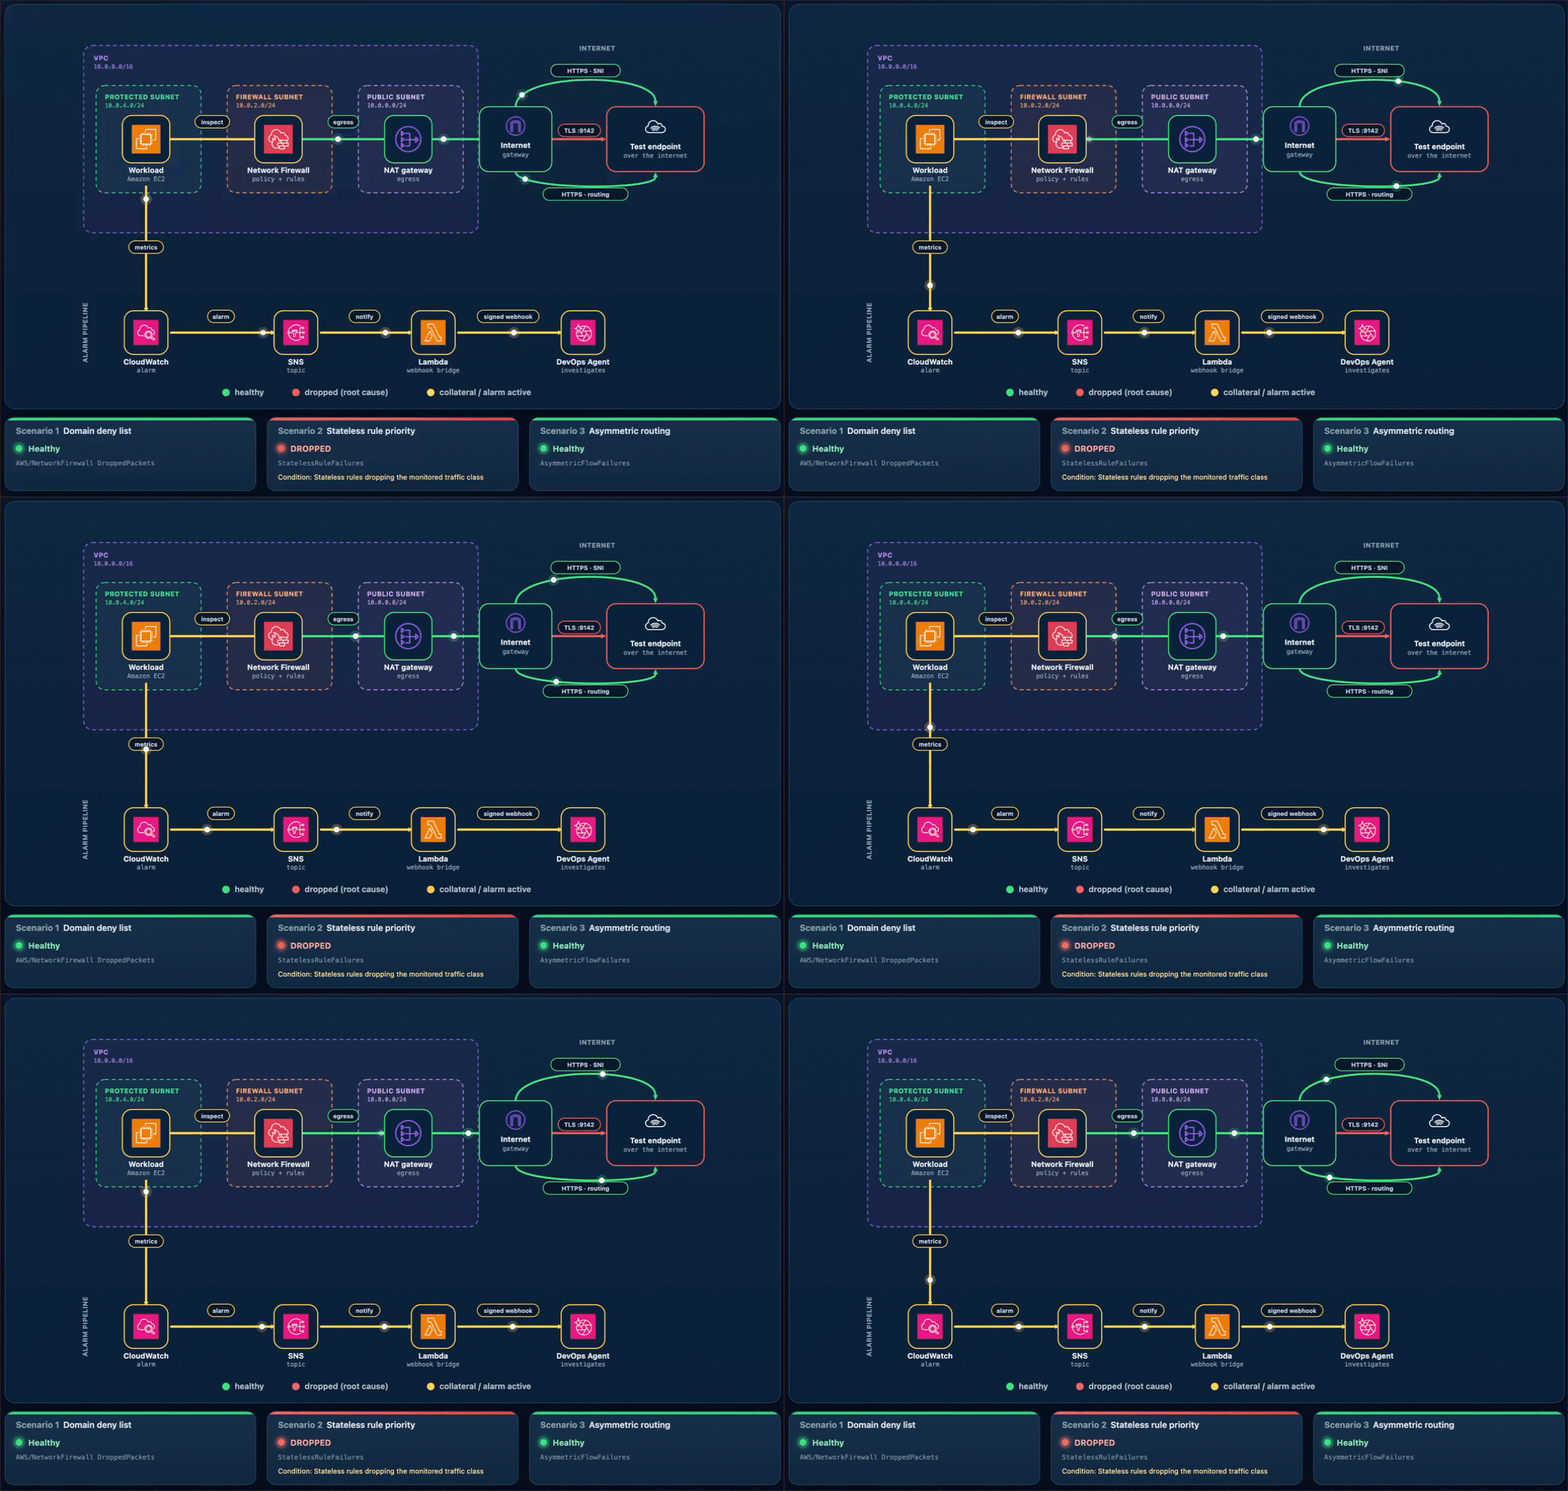
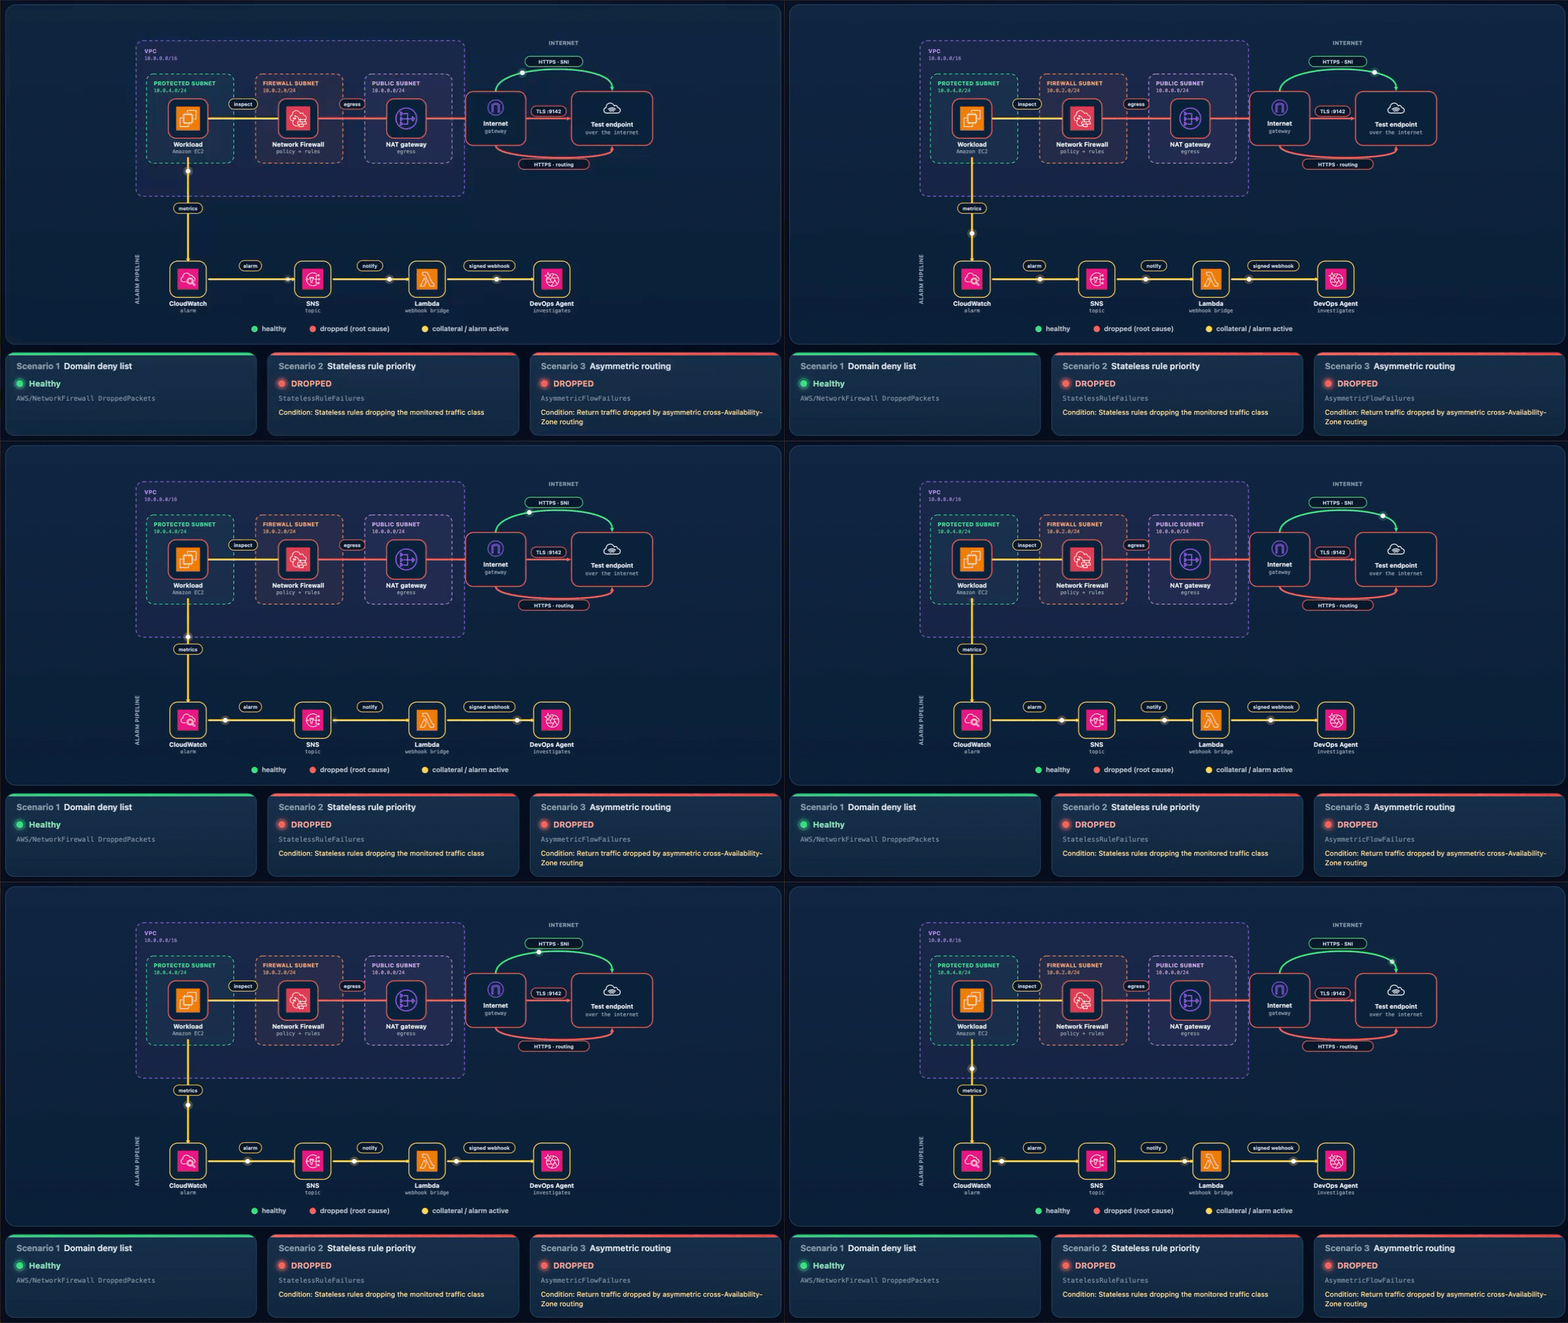
What happens. A new connection leaves through one endpoint. Its return arrives at the other endpoint, which never saw the connection open, so the handshake fails. Unlike Scenarios 1 and 2, this affects the whole subnet, so all egress stops and Alarm-2 and Alarm-3 both move to ALARM. The AWS/NetworkFirewall DroppedPackets alarm (Alarm-1) stays quiet because no endpoint is making a drop decision. The flow is lost to asymmetric routing rather than counted as a firewall drop. This is why monitoring application connectivity matters. A routing fault is invisible to the firewall’s own drop counter. On the status page, the Scenario 2 card reads DROPPED (with the condition “Stateless rules dropping the monitored traffic class”) and the Scenario 3 card reads DROPPED (with the condition Return traffic dropped by asymmetric cross-Availability-Zone routing), while the Scenario 1 card stays Healthy (Figure 13). On the topology, the alarm pipeline from CloudWatch through Amazon SNS and Lambda to DevOps Agent and the workload-to-firewall inspect lines both turn amber, which the legend defines as collateral / alarm active, while the egress path from the firewall through the NAT gateway and the TLS :9142 and HTTPS · routing lines to the test endpoint turn red, which the legend defines as dropped (root cause).

Figure 13: Scenario 3 – The status page during a path-wide outage

Figure 13: Scenario 3 – The status page during a path-wide outage

Let DevOps Agent investigate. Both Alarm-2 and Alarm-3 fire in the same datapoint. DevOps Agent recognizes them as linked and merges them into a single investigation:

  1. Reads the flow logs and sees bidirectional TLS connections stop abruptly, with only one-way traffic remaining and no flows reaching the established state.
  2. Reads the firewall metrics and sees received and passed packets shift from one Availability Zone to the other at the moment of the change.
  3. Calls DescribeRouteTables and finds the egress route pointing at one Availability Zone firewall endpoint while the return route points at the other.
  4. Searches CloudTrail and surfaces the ReplaceRoute and CreateRoute calls by the same user, about a minute before both alarms fired.
  5. Reports the root cause as that asymmetric routing change. Recommends restoring symmetric same-Availability-Zone routing so egress and return traverse the same endpoint.
  6. Presents this as a plan you review and apply, not an automatic change.

A mitigation plan is a recommendation you review, not an automatic change, and the right fix depends on the intended design. Restoring symmetric routing can mean sending the workload subnet’s egress back through its own-Availability-Zone firewall endpoint (this sample’s architecture) or, in a design that doesn’t inspect this path, back through a NAT gateway. The agent infers a plausible target from what it can observe, so review the specific route it proposes against your intended topology before you apply it. (Connecting your pipeline or infrastructure-as-code, covered in the next section, lets the agent recommend the target that matches your design.)

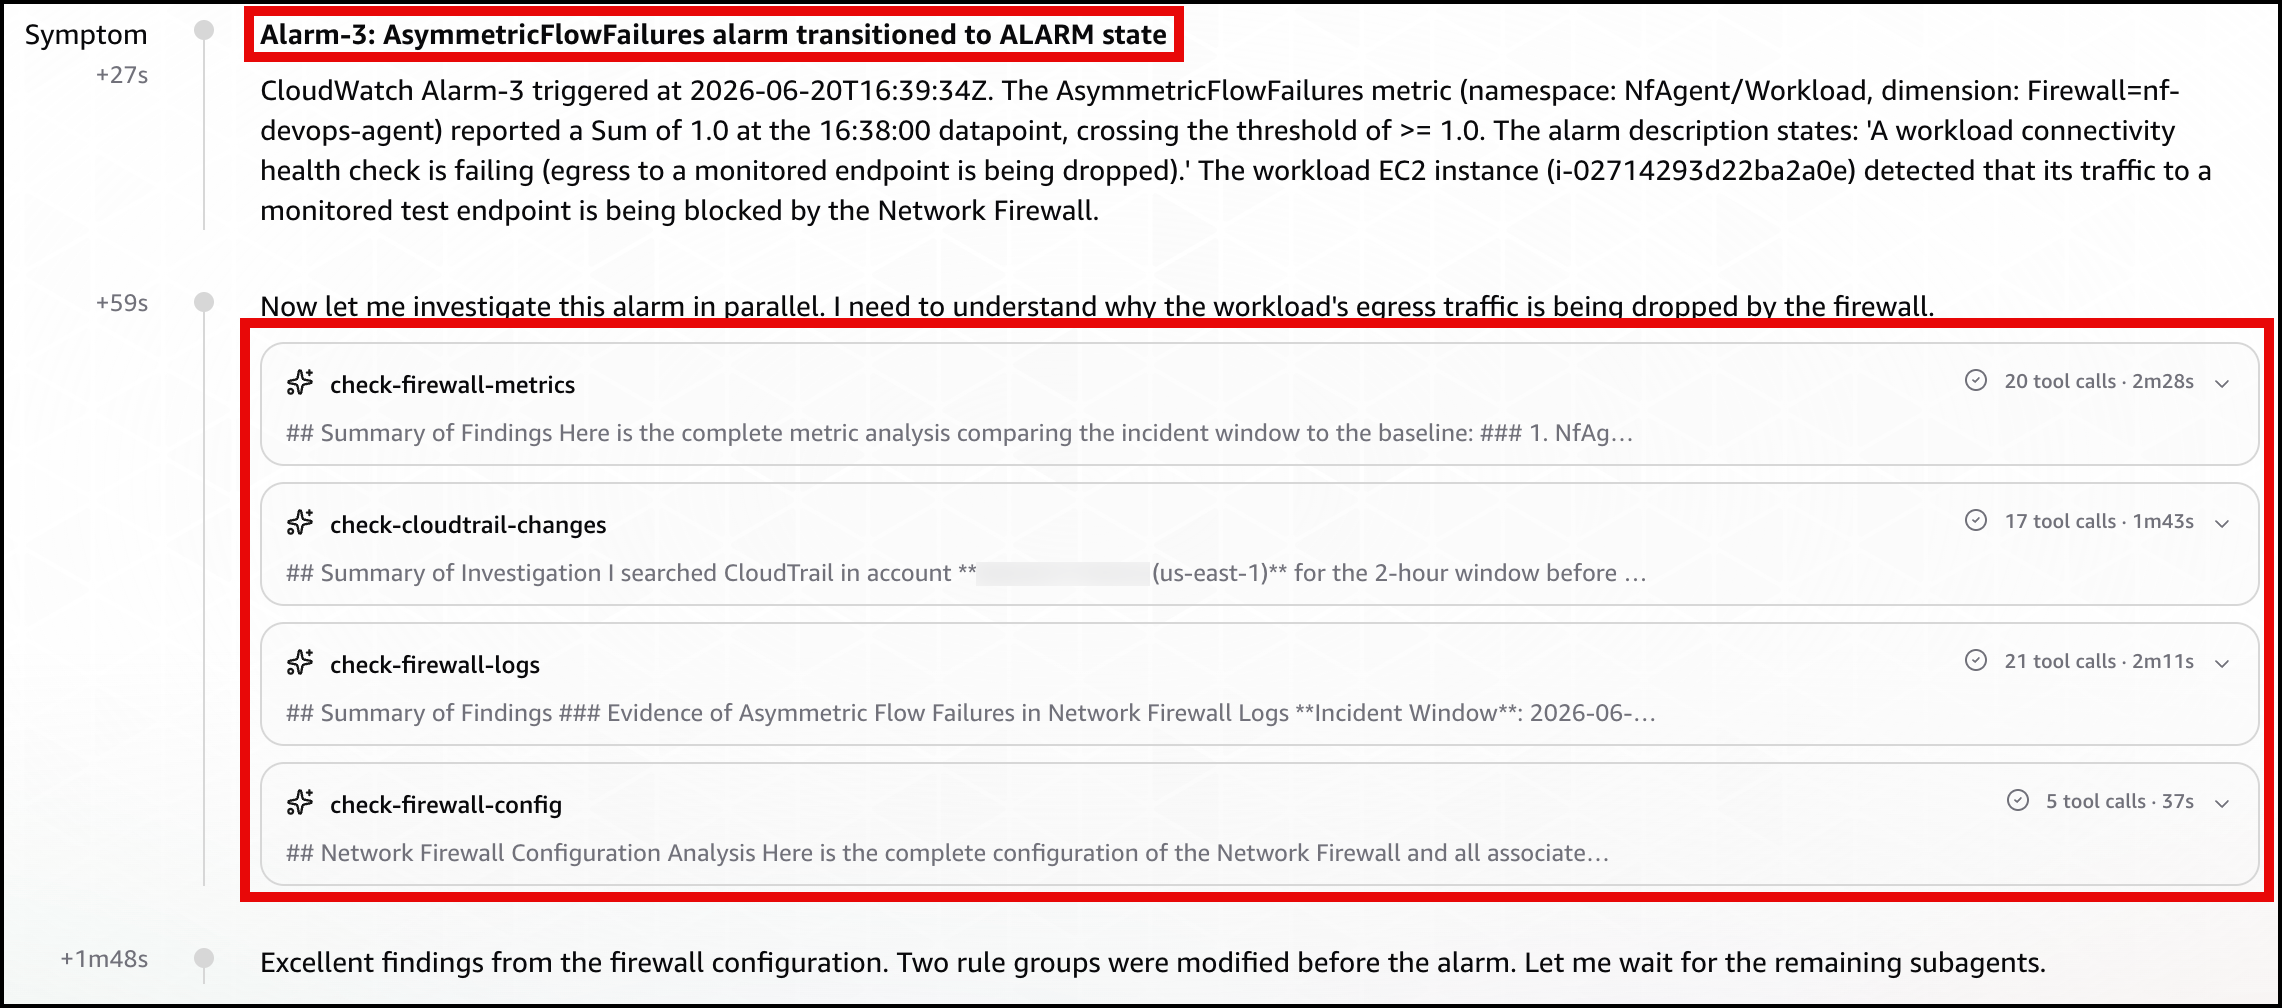
In the DevOps Agent Operator Web App view, the agent restates the Alarm-3 (AsymmetricFlowFailures) trigger and confirms the workload’s egress to a monitored endpoint is being blocked by the Network Firewall (Figure 14).

Figure 14: Scenario 3 – The symptom

Figure 14: Scenario 3 – The symptom

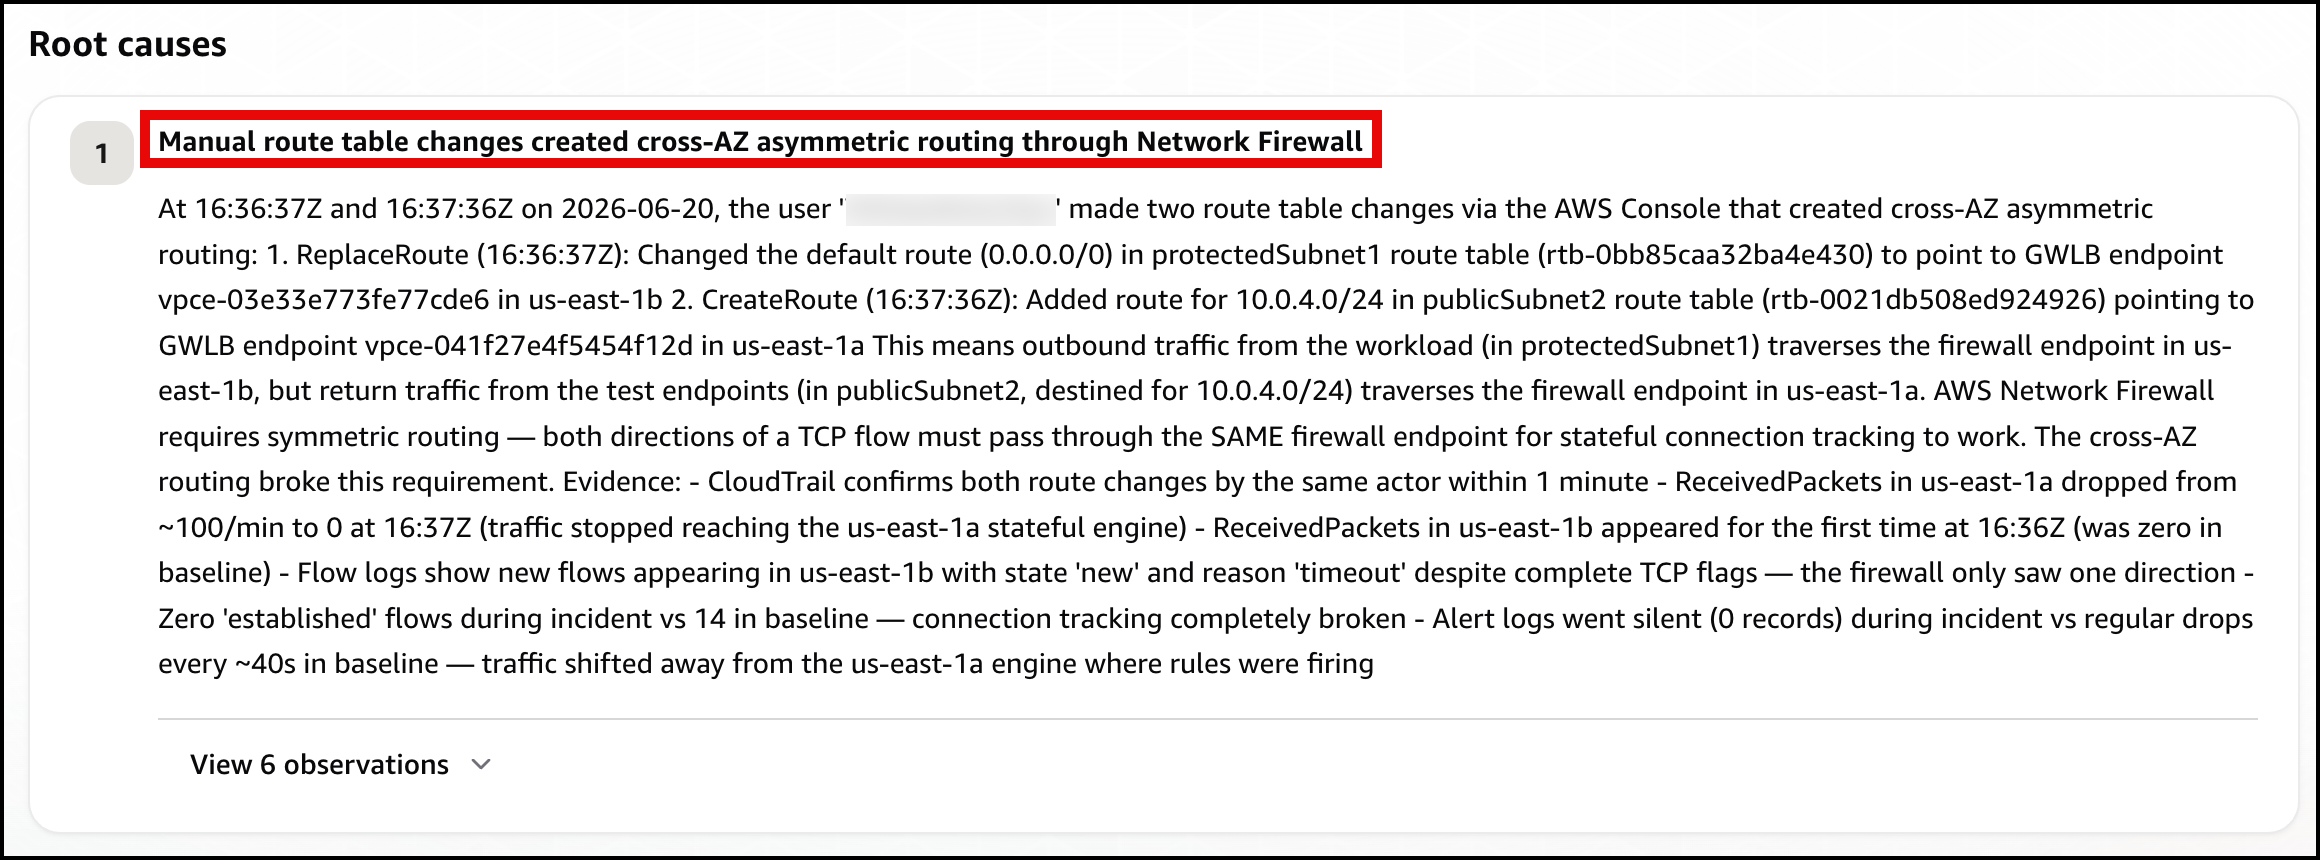
Next, the agent identifies the root cause: manual route table changes that created cross-AZ asymmetric routing through the network firewall, breaking its symmetric routing requirement (Figure 15)

Figure 15: Scenario 3 – The root cause

Figure 15: Scenario 3 – The root cause

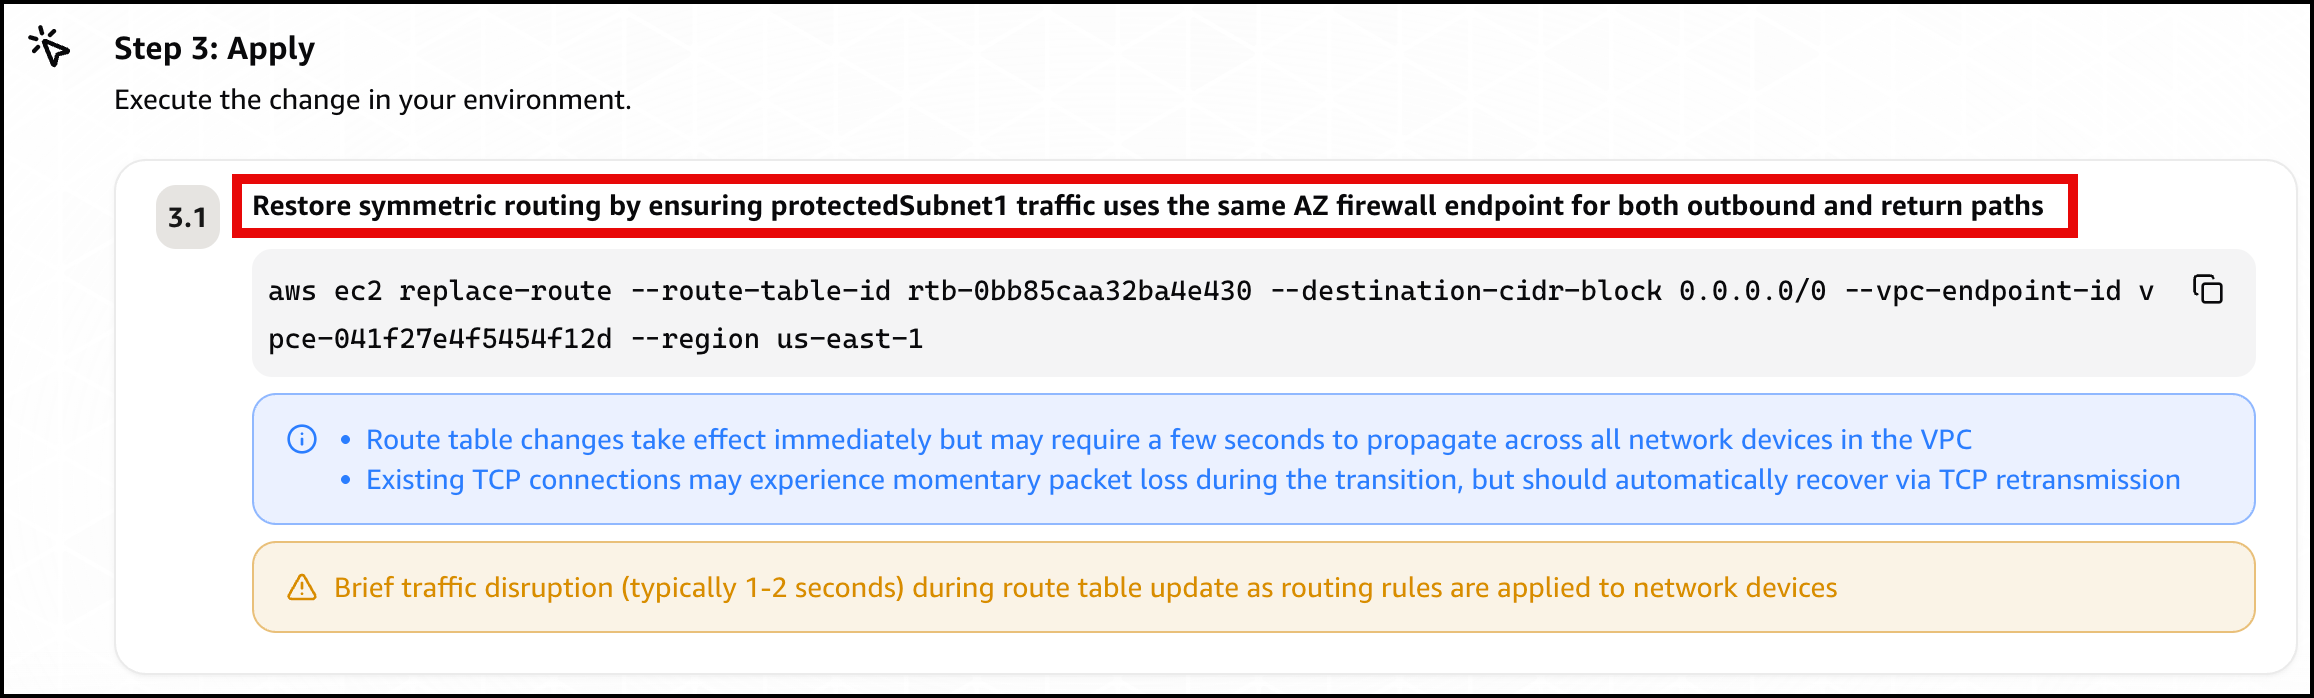
Finally, the agent presents a mitigation plan, recommending you restore symmetric routing by pointing protectedSubnet1‘s default route back to the same Availability Zone firewall endpoint, so one endpoint sees both directions of the flow again (Figure 16).

Figure 16: Scenario 3 – The mitigation plan

Figure 16: Scenario 3 – The mitigation plan

Confirm recovery. Apply the change the agent recommends, after checking the route target matches your intended design. After the workload subnet’s egress and return use the same Availability Zone firewall endpoint again, the control probe recovers, the alarms clear, and every card returns to green.

Further considerations

In production a single change can trigger several alarms at the same time, as Scenario 3 shows. DevOps Agent links related investigations and works them as one, so you review a single root cause. You can validate the linked findings or unlink an alarm to investigate it independently. If you would rather collapse alarms before they reach the agent, you can add correlation logic in the bridge Lambda function, buffering and grouping by firewall. You can also add email, Amazon Simple Queue Service (Amazon SQS), or HTTP subscribers to the SNS topic, or add the webhook Lambda function to a topic you already run. DevOps Agent produces a mitigation plan but does not change your environment on its own.

You can also give the agent more to work with. DevOps Agent connects to source repositories and CI/CD pipelines, integrating with GitHub (including GitHub Enterprise Server and GitLab Self-Managed through a private connection). It can associate AWS resources with deployments of AWS CloudFormation, AWS CDK, Amazon Elastic Container Registry (Amazon ECR) images, and Terraform. With deployed configuration and recent deployment events in view, the agent correlates the disruption against the change that introduced it and recommends a fix matching your intended design. For this sample, that means recommending the workload subnet’s own Availability Zone firewall endpoint rather than a generic symmetric path.

DevOps Agent also supports proactive incident prevention. It analyzes patterns across past investigations and delivers recommendations to prevent similar issues from recurring, including governance recommendations that strengthen deployment processes and pipeline controls. For Network Firewall rule changes, this means the agent can recommend guardrails for your CI/CD pipeline based on the classes of misconfigurations it has already resolved. You can access these recommendations through the Improvements page in the DevOps Agent Operator Web App.

Clean up

Clean up the environment with one command.

bash scripts/destroy.sh

It reverts any active scenario, runs cdk destroy for all stacks, and sweeps for stragglers by the Project = nf-devops-agent tag. The main cost drivers are the two Network Firewall endpoints, the NAT gateways (one in the main VPC for each Availability Zone, one in the test-endpoint VPC), and the test endpoint’s load balancers. Each of these bills at an hourly rate for as long as it’s provisioned, whether or not traffic is flowing, so a stack left running continues to accrue charges around the clock even while idle. Running the scenarios and tearing the stack down the same day limits the cost to a few active hours rather than days of idle hourly charges.

Conclusion

In this post, we showed you how AWS DevOps Agent accelerates troubleshooting for three common network firewall connectivity issues. The first was a domain deny list. The second was a stateless priority inversion. The third was an asymmetric cross-AZ routing drop. For each one, DevOps Agent investigated the drop and returned a root cause with a mitigation plan you approve before applying. The first scenario triggered on a prebuilt Network Firewall metric, and the other two on application health metrics. That shows both ways to alarm on a firewall problem through one pipeline.

The pattern isn’t specific to Network Firewall. The same flow fits any service that emits CloudWatch metrics and logs, such as AWS WAF, security groups, and network ACLs. Clone the sample repository to explore the solution, then apply what you learn to your own firewall, application, and alarms. For more details, see the AWS Network Firewall Developer Guide and the AWS Network Firewall pricing page. Start with the Getting Started with AWS DevOps Agent guide to connect your first webhook.

Salman Ahmed

Salman is a Senior Technical Account Manager at AWS, specializing in helping customers design, implement, and optimize their AWS environments. He combines deep networking expertise with a passion for exploring emerging technologies to help organizations get the most out of their cloud investments. Outside of work, he enjoys photography, traveling, and watching his favorite sports teams.

  •  
❌