We often describe cases of malware distribution under the guise of game cheats and pirated software. Sometimes such methods are used to spread complex malware that employs advanced techniques and sophisticated infection chains.
In February 2026, researchers from Howler Cell announced the discovery of a mass campaign distributing pirated games infected with a previously unknown family of malware. It turned out to be a loader called RenEngine, which was delivered to the device using a modified version of the Ren’Py engine-based game launcher. Kaspersky solutions detect the RenEngine loader as Trojan.Python.Agent.nb and HEUR:Trojan.Python.Agent.gen.
However, this threat is not new. Our solutions began detecting the first samples of the RenEngine loader in March 2025, when it was used to distribute the Lumma stealer (Trojan-PSW.Win32.Lumma.gen).
In the ongoing incidents, ACR Stealer (Trojan-PSW.Win32.ACRstealer.gen) is being distributed as the final payload. We have been monitoring this campaign for a long time and will share some details in this article.
Incident analysis
Disguise as a visual novel
Let’s look at the first incident, which we detected in March 2025. At that time, the attackers distributed the malware under the guise of a hacked game on a popular gaming web resource.
The website featured a game download page with two buttons: Free Download Now and Direct Download. Both buttons had the same functionality: they redirected users to the MEGA file-sharing service, where they were offered to download an archive with the “game.”
Game download page
When the “game” was launched, the download process would stop at 100%. One might think that the game froze, but that was not the case — the “real” malicious code just started working.
Placeholder with the download screen
“Game” source files analysis
The full infection chain
After analyzing the source files, we found Python scripts that initiated the initial device infection. These scripts imitated the endless loading of the game. In addition, they contained the is_sandboxed function for bypassing the sandbox and xor_decrypt_file for decrypting the malicious payload. Using the latter, the script decrypts the ZIP archive, unpacks its contents into the .temp directory, and launches the unpacked files.
Contents of the .temp directory
There are five files in the .temp directory. The DKsyVGUJ.exe executable is not malicious. Its original name is Ahnenblatt4.exe, and it is a well-known legitimate application for organizing genealogical data. The borlndmm.dll library also does not contain malicious code; it implements the memory manager required to run the executable. Another library, cc32290mt.dll, contains a code snippet patched by attackers that intercepts control when the application is launched and deploys the first stage of the payload in the process memory.
HijackLoader
The dbghelp.dll system library is used as a “container” to launch the first stage of the payload. It is overwritten in memory with decrypted shellcode obtained from the gayal.asp file using the cc32290mt.dll library. The resulting payload is HijackLoader. This is a relatively new means of delivering and deploying malicious implants. A distinctive feature of this malware family is its modularity and configuration flexibility. HijackLoader was first detected and described in the summer of 2023. More detailed information about this loader is available to customers of the Kaspersky Intelligence Reporting Service.
The final payload can be delivered in two ways, depending on the configuration parameters of the malicious sample. The main HijackLoader ti module is used to launch and prepare the process for the final payload injection. In some cases, an additional module is also used, which is injected into an intermediate process launched by the main one. The code that performs the injection is the same in both cases.
Before creating a child process, the configuration parameters are encrypted using XOR and saved to the %TEMP% directory with a random name. The file name is written to the system environment variables.
Loading configuration parameters saved by the main module
In the analyzed sample, the execution follows a longer path with an intermediate child process, cmd.exe. It is created in suspended mode by calling the auxiliary module modCreateProcess. Then, using the ZwCreateSection and ZwMapViewOfSection system API calls, the code of the same dbghelp.dll library is loaded into the address space of the process, after which it intercepts control.
Next, the ti module, launched inside the child process, reads the hap.eml file, from which it decrypts the second stage of HijackLoader. The module then loads the pla.dll system library and overwrites the beginning of its code section with the received payload, after which it transfers control to this library.
Payload decryption
The decrypted payload is an EXE file, and the configuration parameters are set to inject it into the explorer.exe child process. The payload is written to the memory of the child process in several stages:
First, the malicious payload is written to a temporary file on disk using the transaction mechanism provided by the Windows API. The payload is written in several stages and not in the order in which the data is stored in the file. The MZ signature, with which any PE file begins, is written last with a delay.
Writing the payload to a temporary file
After that, the payload is loaded from the temporary file into the address space of the current process using the ZwCreateSection call. The transaction that wrote to the file is rolled back, thus deleting the temporary file with the payload.
Next, the sample uses the modCreateProcess module to launch the child process explorer.exe and injects the payload into it by creating a shared memory region with the ZwMapViewOfSection call.
Payload injection into the child process
Another HijackLoader module, rshell, is used to launch the shellcode. Its contents are also injected into the child process, replacing the code located at its entry point.
The rshell module injection
The last step performed by the parent process is starting a thread in the child process by calling ZwResumeThread. After that, the thread starts executing the rshell module code placed at the child process entry point, and the parent process terminates.
The rshell module prepares the final malicious payload. Once it has finished, it transfers control to another HijackLoader module called ESAL. It replaces the contents of rshell with zeros using the memset function and launches the final payload, which is a stealer from the Lumma family (Trojan-PSW.Win32.Lumma).
In addition to the modules described above, this HijackLoader sample contains the following modules, which were used at intermediate stages: COPYLIST, modTask, modUAC, and modWriteFile.
Kaspersky solutions detect HijackLoader with the verdicts Trojan.Win32.Penguish and Trojan.Win32.DllHijacker.
Not only games
In addition to gaming sites, we found that attackers created dozens of different web resources to distribute RenEngine under the guise of pirated software. On one such site, for example, users can supposedly download an activated version of the CorelDRAW graphics editor.
Distribution of RenEngine under the guise of the CorelDRAW pirated version
When the user clicks the Descargar Ahora (“Download Now”) button, they are redirected several times to other malicious websites, after which an infected archive is downloaded to their device.
File storage imitations
Distribution
According to our data, since March 2025, RenEngine has affected users in the following countries:
Distribution of incidents involving the RenEngine loader by country (TOP 20), February 2026 (download)
The distribution pattern of this loader suggests that the attacks are not targeted. At the time of publication, we have recorded the highest number of incidents in Russia, Brazil, Türkiye, Spain, and Germany.
Recommendations for protection
The format of game archives is generally not standardized and is unique for each game. This means that there is no universal algorithm for unpacking and checking the contents of game archives. If the game engine does not check the integrity and authenticity of executable resources and scripts, such an archive can become a repository for malware if modified by attackers. Despite this, Kaspersky Premium protects against such threats with its Behavior Detection component.
The distribution of malware under the guise of pirated software and hacked games is not a new tactic. It is relatively easy to avoid infection by the malware described in this article: simply install games and programs from trusted sites. In addition, it is important for gamers to remember the need to install specialized security solutions. This ongoing campaign employs the Lumma and ACR stylers, and Vidar was also found — none of these are new threats, but rather long-known malware. This means that modern antivirus technologies can detect even modified versions of the above-mentioned stealers and their alternatives, preventing further infection.
A SIEM is a complex system offering broad and flexible threat detection capabilities. Due to its complexity, its effectiveness heavily depends on how it is configured and what data sources are connected to it. A one-time SIEM setup during implementation is not enough: both the organization’s infrastructure and attackers’ techniques evolve over time. To operate effectively, the SIEM system must reflect the current state of affairs.
We provide customers with services to assess SIEM effectiveness, helping to identify issues and offering options for system optimization. In this article, we examine typical SIEM operational pitfalls and how to address them. For each case, we also include methods for independent verification.
This material is based on an assessment of Kaspersky SIEM effectiveness; therefore, all specific examples, commands, and field names are taken from that solution. However, the assessment methodology, issues we identified, and ways to enhance system effectiveness can easily be extrapolated to any other SIEM.
Methodology for assessing SIEM effectiveness
The primary audience for the effectiveness assessment report comprises the SIEM support and operation teams within an organization. The main goal is to analyze how well the usage of SIEM aligns with its objectives. Consequently, the scope of checks can vary depending on the stated goals. A standard assessment is conducted across the following areas:
Composition and scope of connected data sources
Coverage of data sources
Data flows from existing sources
Correctness of data normalization
Detection logic operability
Detection logic accuracy
Detection logic coverage
Use of contextual data
SIEM technical integration into SOC processes
SOC analysts’ handling of alerts in the SIEM
Forwarding of alerts, security event data, and incident information to other systems
Deployment architecture and documentation
At the same time, these areas are examined not only in isolation but also in terms of their potential influence on one another. Here are a couple of examples illustrating this interdependence:
Issues with detection logic due to incorrect data normalization. A correlation rule with the condition deviceCustomString1 not contains <string> triggers a large number of alerts. The detection logic itself is correct: the specific event and the specific field it targets should not generate a large volume of data matching the condition. Our review revealed the issue was in the data ingested by the SIEM, where incorrect encoding caused the string targeted by the rule to be transformed into a different one. Consequently, all events matched the condition and generated alerts.
When analyzing coverage for a specific source type, we discovered that the SIEM was only monitoring 5% of all such sources deployed in the infrastructure. However, extending that coverage would increase system load and storage requirements. Therefore, besides connecting additional sources, it would be necessary to scale resources for specific modules (storage, collectors, or the correlator).
The effectiveness assessment consists of several stages:
Collect and analyze documentation, if available. This allows assessing SIEM objectives, implementation settings (ideally, the deployment settings at the time of the assessment), associated processes, and so on.
Interview system engineers, analysts, and administrators. This allows assessing current tasks and the most pressing issues, as well as determining exactly how the SIEM is being operated. Interviews are typically broken down into two phases: an introductory interview, conducted at project start to gather general information, and a follow-up interview, conducted mid-project to discuss questions arising from the analysis of previously collected data.
Gather information within the SIEM and then analyze it. This is the most extensive part of the assessment, during which Kaspersky experts are granted read-only access to the system or a part of it to collect factual data on its configuration, detection logic, data flows, and so on.
The assessment produces a list of recommendations. Some of these can be implemented almost immediately, while others require more comprehensive changes driven by process optimization or a transition to a more structured approach to system use.
Issues arising from SIEM operations
The problems we identify during a SIEM effectiveness assessment can be divided into three groups:
Performance issues, meaning operational errors in various system components. These problems are typically resolved by technical support, but to prevent them, it is worth periodically checking system health status.
Efficiency issues – when the system functions normally but seemingly adds little value or is not used to its full potential. This is usually due to the customer using the system capabilities in a limited way, incorrectly, or not as intended by the developer.
Detection issues – when the SIEM is operational and continuously evolving according to defined processes and approaches, but alerts are mostly false positives, and the system misses incidents. For the most part, these problems are related to the approach taken in developing detection logic.
Key observations from the assessment
Event source inventory
When building the inventory of event sources for a SIEM, we follow the principle of layered monitoring: the system should have information about all detectable stages of an attack. This principle enables the detection of attacks even if individual malicious actions have gone unnoticed, and allows for retrospective reconstruction of the full attack chain, starting from the attackers’ point of entry.
Problem: During effectiveness assessments, we frequently find that the inventory of connected source types is not updated when the infrastructure changes. In some cases, it has not been updated since the initial SIEM deployment, which limits incident detection capabilities. Consequently, certain types of sources remain completely invisible to the system.
We have also encountered non-standard cases of incomplete source inventory. For example, an infrastructure contains hosts running both Windows and Linux, but monitoring is configured for only one family of operating systems.
How to detect: To identify the problems described above, determine the list of source types connected to the SIEM and compare it against what actually exists in the infrastructure. Identifying the presence of specific systems in the infrastructure requires an audit. However, this task is one of the most critical for many areas of cybersecurity, and we recommend running it on a periodic basis.
We have compiled a reference sheet of system types commonly found in most organizations. Depending on the organization type, infrastructure, and threat model, we may rearrange priorities. However, a good starting point is as follows:
High Priority – sources associated with:
Remote access provision
External services accessible from the internet
External perimeter
Endpoint operating systems
Information security tools
Medium Priority – sources associated with:
Remote access management within the perimeter
Internal network communication
Infrastructure availability
Virtualization and cloud solutions
Low Priority – sources associated with:
Business applications
Internal IT services
Applications used by various specialized teams (HR, Development, PR, IT, and so on)
Monitoring data flow from sources
Regardless of how good the detection logic is, it cannot function without telemetry from the data sources.
Problem: The SIEM core is not receiving events from specific sources or collectors. Based on all assessments conducted, the average proportion of collectors that are configured with sources but are not transmitting events is 38%. Correlation rules may exist for these sources, but they will, of course, never trigger. It is also important to remember that a single collector can serve hundreds of sources (such as workstations), so the loss of data flow from even one collector can mean losing monitoring visibility for a significant portion of the infrastructure.
How to detect: The process of locating sources that are not transmitting data can be broken down into two components.
Checking collector health. Find the status of collectors (see the support website for the steps to do this in Kaspersky SIEM) and identify those with a status of Offline, Stopped, Disabled, and so on.
Checking the event flow. In Kaspersky SIEM, this can be done by gathering statistics using the following query (counting the number of events received from each collector over a specific time period):
SELECT count(ID), CollectorID, CollectorName FROM `events` GROUP BY CollectorID, CollectorName ORDER BY count(ID)
It is essential to specify an optimal time range for collecting these statistics. Too large a range can increase the load on the SIEM, while too small a range may provide inaccurate information for a one-time check – especially for sources that transmit telemetry relatively infrequently, say, once a week. Therefore, it is advisable to choose a smaller time window, such as 2–4 days, but run several queries for different periods in the past.
Additionally, for a more comprehensive approach, it is recommended to use built-in functionality or custom logic implemented via correlation rules and lists to monitor event flow. This will help automate the process of detecting problems with sources.
Event source coverage
Problem: The system is not receiving events from all sources of a particular type that exist in the infrastructure. For example, the company uses workstations and servers running Windows. During SIEM deployment, workstations are immediately connected for monitoring, while the server segment is postponed for one reason or another. As a result, the SIEM receives events from Windows systems, the flow is normalized, and correlation rules work, but an incident in the unmonitored server segment would go unnoticed.
How to detect: Below are query variations that can be used to search for unconnected sources.
SELECT count(distinct, DeviceAddress), DeviceVendor, DeviceProduct FROM events GROUP BY DeviceVendor, DeviceProduct ORDER BY count(ID)
SELECT count(distinct, DeviceHostName), DeviceVendor, DeviceProduct FROM events GROUP BY DeviceVendor, DeviceProduct ORDER BY count(ID)
We have split the query into two variations because, depending on the source and the DNS integration settings, some events may contain either a DeviceAddress or DeviceHostName field.
These queries will help determine the number of unique data sources sending logs of a specific type. This count must be compared against the actual number of sources of that type, obtained from the system owners.
Retaining raw data
Raw data can be useful for developing custom normalizers or for storing events not used in correlation that might be needed during incident investigation. However, careless use of this setting can cause significantly more harm than good.
Problem: Enabling the Keep raw event option effectively doubles the event size in the database, as it stores two copies: the original and the normalized version. This is particularly critical for high-volume collectors receiving events from sources like NetFlow, DNS, firewalls, and others. It is worth noting that this option is typically used for testing a normalizer but is often forgotten and left enabled after its configuration is complete.
How to detect: This option is applied at the normalizer level. Therefore, it is necessary to review all active normalizers and determine whether retaining raw data is required for their operation.
Normalization
As with the absence of events from sources, normalization issues lead to detection logic failing, as this logic relies on finding specific information in a specific event field.
Problem: Several issues related to normalization can be identified:
The event flow is not being normalized at all.
Events are only partially normalized – this is particularly relevant for custom, non-out-of-the-box normalizers.
The normalizer being used only parses headers, such as syslog_headers, placing the entire event body into a single field, this field most often being Message.
An outdated default normalizer is being used.
How to detect: Identifying normalization issues is more challenging than spotting source problems due to the high volume of telemetry and variety of parsers. Here are several approaches to narrowing the search:
First, check which normalizers supplied with the SIEM the organization uses and whether their versions are up to date. In our assessments, we frequently encounter auditd events being normalized by the outdated normalizer, Linux audit and iptables syslog v2 for Kaspersky SIEM. The new normalizer completely reworks and optimizes the normalization schema for events from this source.
Execute the query:
SELECT count(ID), DeviceProduct, DeviceVendor, CollectorName FROM `events` GROUP BY DeviceProduct, DeviceVendor, CollectorName ORDER BY count(ID)
This query gathers statistics on events from each collector, broken down by the DeviceVendor and DeviceProduct fields. While these fields are not mandatory, they are present in almost any normalization schema. Therefore, their complete absence or empty values may indicate normalization issues. We recommend including these fields when developing custom normalizers.
To simplify the identification of normalization problems when developing custom normalizers, you can implement the following mechanism. For each successfully normalized event, add a Name field, populated from a constant or the event itself. For a final catch-all normalizer that processes all unparsed events, set the constant value: Name = unparsed event. This will later allow you to identify non-normalized events through a simple search on this field.
Detection logic coverage
Collected events alone are, in most cases, only useful for investigating an incident that has already been identified. For a SIEM to operate to its full potential, it requires detection logic to be developed to uncover probable security incidents.
Problem: The mean correlation rule coverage of sources, determined across all our assessments, is 43%. While this figure is only a ballpark figure – as different source types provide different information – to calculate it, we defined “coverage” as the presence of at least one correlation rule for a source. This means that for more than half of the connected sources, the SIEM is not actively detecting. Meanwhile, effort and SIEM resources are spent on connecting, maintaining, and configuring these sources. In some cases, this is formally justified, for instance, if logs are only needed for regulatory compliance. However, this is an exception rather than the rule.
We do not recommend solving this problem by simply not connecting sources to the SIEM. On the contrary, sources should be connected, but this should be done concurrently with the development of corresponding detection logic. Otherwise, it can be forgotten or postponed indefinitely, while the source pointlessly consumes system resources.
How to detect: This brings us back to auditing, a process that can be greatly aided by creating and maintaining a register of developed detection logic. Given that not every detection logic rule explicitly states the source type from which it expects telemetry, its description should be added to this register during the development phase.
If descriptions of the correlation rules are not available, you can refer to the following:
The name of the detection logic. With a standardized approach to naming correlation rules, the name can indicate the associated source or at least provide a brief description of what it detects.
The use of fields within the rules, such as DeviceVendor, DeviceProduct (another argument for including these fields in the normalizer), Name, DeviceAction, DeviceEventCategory, DeviceEventClassID, and others. These can help identify the actual source.
Excessive alerts generated by the detection logic
One criterion for correlation rules effectiveness is a low false positive rate.
Problem: Detection logic generates an abnormally high number of alerts that are physically impossible to process, regardless of the size of the SOC team.
How to detect: First and foremost, detection logic should be tested during development and refined to achieve an acceptable false positive rate. However, even a well-tuned correlation rule can start producing excessive alerts due to changes in the event flow or connected infrastructure. To identify these rules, we recommend periodically running the following query:
SELECT count(ID), Name FROM `events` WHERE Type = 3 GROUP BY Name ORDER BY count(ID)
In Kaspersky SIEM, a value of 3 in the Type field indicates a correlation event.
Subsequently, for each identified rule with an anomalous alert count, verify the correctness of the logic it uses and the integrity of the event stream on which it triggered.
Depending on the issue you identify, the solution may involve modifying the detection logic, adding exceptions (for example, it is often the case that 99% of the spam originates from just 1–5 specific objects, such as an IP address, a command parameter, or a URL), or adjusting event collection and normalization.
Lack of integration with indicators of compromise
SIEM integrations with other systems are generally a critical part of both event processing and alert enrichment. In at least one specific case, their presence directly impacts detection performance: integration with technical Threat Intelligence data or IoCs (indicators of compromise).
A SIEM allows conveniently checking objects against various reputation databases or blocklists. Furthermore, there are numerous sources of this data that are ready to integrate natively with a SIEM or require minimal effort to incorporate.
Problem: There is no integration with TI data.
How to detect: Generally, IoCs are integrated into a SIEM at the system configuration level during deployment or subsequent optimization. The use of TI within a SIEM can be implemented at various levels:
At the data source level. Some sources, such as NGFWs, add this information to events involving relevant objects.
At the SIEM native functionality level. For example, Kaspersky SIEM integrates with CyberTrace indicators, which add object reputation information at the moment of processing an event from a source.
At the detection logic level. Information about IoCs is stored in various active lists, and correlation rules match objects against these to enrich the event.
Furthermore, TI data does not appear in a SIEM out of thin air. It is either provided by external suppliers (commercially or in an open format) or is part of the built-in functionality of the security tools in use. For instance, various NGFW systems can additionally check the reputation of external IP addresses or domains that users are accessing. Therefore, the first step is to determine whether you are receiving information about indicators of compromise and in what form (whether external providers’ feeds have been integrated and/or the deployed security tools have this capability). It is worth noting that receiving TI data only at the security tool level does not always cover all types of IoCs.
If data is being received in some form, the next step is to verify that the SIEM is utilizing it. For TI-related events coming from security tools, the SIEM needs a correlation rule developed to generate alerts. Thus, checking integration in this case involves determining the capabilities of the security tools, searching for the corresponding events in the SIEM, and identifying whether there is detection logic associated with these events. If events from the security tools are absent, the source audit configuration should be assessed to see if the telemetry type in question is being forwarded to the SIEM at all. If normalization is the issue, you should assess parsing accuracy and reconfigure the normalizer.
If TI data comes from external providers, determine how it is processed within the organization. Is there a centralized system for aggregating and managing threat data (such as CyberTrace), or is the information stored in, say, CSV files?
In the former case (there is a threat data aggregation and management system) you must check if it is integrated with the SIEM. For Kaspersky SIEM and CyberTrace, this integration is handled through the SIEM interface. Following this, SIEM event flows are directed to the threat data aggregation and management system, where matches are identified and alerts are generated, and then both are sent back to the SIEM. Therefore, checking the integration involves ensuring that all collectors receiving events that may contain IoCs are forwarding those events to the threat data aggregation and management system. We also recommend checking if the SIEM has a correlation rule that generates an alert based on matching detected objects with IoCs.
In the latter case (threat information is stored in files), you must confirm that the SIEM has a collector and normalizer configured to load this data into the system as events. Also, verify that logic is configured for storing this data within the SIEM for use in correlation. This is typically done with the help of lists that contain the obtained IoCs. Finally, check if a correlation rule exists that compares the event flow against these IoC lists.
As the examples illustrate, integration with TI in standard scenarios ultimately boils down to developing a final correlation rule that triggers an alert upon detecting a match with known IoCs. Given the variety of integration methods, creating and providing a universal out-of-the-box rule is difficult. Therefore, in most cases, to ensure IoCs are connected to the SIEM, you need to determine if the company has developed that rule (the existence of the rule) and if it has been correctly configured. If no correlation rule exists in the system, we recommend creating one based on the TI integration methods implemented in your infrastructure. If a rule does exist, its functionality must be verified: if there are no alerts from it, analyze its trigger conditions against the event data visible in the SIEM and adjust it accordingly.
The SIEM is not kept up to date
For a SIEM to run effectively, it must contain current data about the infrastructure it monitors and the threats it’s meant to detect. Both elements change over time: new systems and software, users, security policies, and processes are introduced into the infrastructure, while attackers develop new techniques and tools. It is safe to assume that a perfectly configured and deployed SIEM system will no longer be able to fully see the altered infrastructure or the new threats after five years of running without additional configuration. Therefore, practically all components – event collection, detection, additional integrations for contextual information, and exclusions – must be maintained and kept up to date.
Furthermore, it is important to acknowledge that it is impossible to cover 100% of all threats. Continuous research into attacks, development of detection methods, and configuration of corresponding rules are a necessity. The SOC itself also evolves. As it reaches certain maturity levels, new growth opportunities open up for the team, requiring the utilization of new capabilities.
Problem: The SIEM has not evolved since its initial deployment.
How to detect: Compare the original statement of work or other deployment documentation against the current state of the system. If there have been no changes, or only minimal ones, it is highly likely that your SIEM has areas for growth and optimization. Any infrastructure is dynamic and requires continuous adaptation.
Other issues with SIEM implementation and operation
In this article, we have outlined the primary problems we identify during SIEM effectiveness assessments, but this list is not exhaustive. We also frequently encounter:
Mismatch between license capacity and actual SIEM load. The problem is almost always the absence of events from sources, rather than an incorrect initial assessment of the organization’s needs.
Lack of user rights management within the system (for example, every user is assigned the administrator role).
Poor organization of customizable SIEM resources (rules, normalizers, filters, and so on). Examples include chaotic naming conventions, non-optimal grouping, and obsolete or test content intermixed with active content. We have encountered confusing resource names like [dev] test_Add user to admin group_final2.
Use of out-of-the-box resources without adaptation to the organization’s infrastructure. To maximize a SIEM’s value, it is essential at a minimum to populate exception lists and specify infrastructure parameters: lists of administrators and critical services and hosts.
Disabled native integrations with external systems, such as LDAP, DNS, and GeoIP.
Generally, most issues with SIEM effectiveness stem from the natural degradation (accumulation of errors) of the processes implemented within the system. Therefore, in most cases, maintaining effectiveness involves structuring these processes, monitoring the quality of SIEM engagement at all stages (source onboarding, correlation rule development, normalization, and so on), and conducting regular reviews of all system components and resources.
Conclusion
A SIEM is a powerful tool for monitoring and detecting threats, capable of identifying attacks at various stages across nearly any point in an organization’s infrastructure. However, if improperly configured and operated, it can become ineffective or even useless while still consuming significant resources. Therefore, it is crucial to periodically audit the SIEM’s components, settings, detection rules, and data sources.
If a SOC is overloaded or otherwise unable to independently identify operational issues with its SIEM, we offer Kaspersky SIEM platform users a service to assess its operation. Following the assessment, we provide a list of recommendations to address the issues we identify. That being said, it is important to clarify that these are not strict, prescriptive instructions, but rather highlight areas that warrant attention and analysis to improve the product’s performance, enhance threat detection accuracy, and enable more efficient SIEM utilization.
If you’re a penetration tester, you know that lateral movement is becoming increasingly difficult, especially in well-defended environments. One common technique for remote command execution has been the use of DCOM objects.
Over the years, many different DCOM objects have been discovered. Some rely on native Windows components, others depend on third-party software such as Microsoft Office, and some are undocumented objects found through reverse engineering. While certain objects still work, others no longer function in newer versions of Windows.
This research presents a previously undescribed DCOM object that can be used for both command execution and potential persistence. This new technique abuses older initial access and persistence methods through Control Panel items.
First, we will discuss COM technology. After that, we will review the current state of the Impacket dcomexec script, focusing on objects that still function, and discuss potential fixes and improvements, then move on to techniques for enumerating objects on the system. Next, we will examine Control Panel items, how adversaries have used them for initial access and persistence, and how these items can be leveraged through a DCOM object to achieve command execution.
Finally, we will cover detection strategies to identify and respond to this type of activity.
COM/DCOM technology
What is COM?
COM stands for Component Object Model, a Microsoft technology that defines a binary standard for interoperability. It enables the creation of reusable software components that can interact at runtime without the need to compile COM libraries directly into an application.
These software components operate in a client–server model. A COM object exposes its functionality through one or more interfaces. An interface is essentially a collection of related member functions (methods).
COM also enables communication between processes running on the same machine by using local RPC (Remote Procedure Call) to handle cross-process communication.
Terms
To ensure a better understanding of its structure and functionality, let’s revise COM-related terminology.
COM interface A COM interface defines the functionality that a COM object exposes. Each COM interface is identified by a unique GUID known as the IID (Interface ID). All COM interfaces can be found in the Windows Registry under HKEY_CLASSES_ROOT\Interface, where they are organized by GUID.
COM class (COM CoClass) A COM class is the actual implementation of one or more COM interfaces. Like COM interfaces, classes are identified by unique GUIDs, but in this case the GUID is called the CLSID (Class ID). This GUID is used to locate the COM server and activate the corresponding COM class.
All COM classes must be registered in the registry under HKEY_CLASSES_ROOT\CLSID, where each class’s GUID is stored. Under each GUID, you may find multiple subkeys that serve different purposes, such as:
InprocServer32/LocalServer32: Specifies the system path of the COM server where the class is defined. InprocServer32 is used for in-process servers (DLLs), while LocalServer32 is used for out-of-process servers (EXEs). We’ll describe this in more detail later.
ProgID: A human-readable name assigned to the COM class.
TypeLib: A binary description of the COM class (essentially documentation for the class).
AppID: Used to describe security configuration for the class.
COM server A COM is the module where a COM class is defined. The server can be implemented as an EXE, in which case it is called an out-of-process server, or as a DLL, in which case it is called an in-process server. Each COM server has a unique file path or location in the system. Information about COM servers is stored in the Windows Registry. The COM runtime uses the registry to locate the server and perform further actions. Registry entries for COM servers are located under the HKEY_CLASSES_ROOT root key for both 32- and 64-bit servers.
Component Object Model implementation
Client–server model
In-process server In the case of an in-process server, the server is implemented as a DLL. The client loads this DLL into its own address space and directly executes functions exposed by the COM object. This approach is efficient since both client and server run within the same process.
In-process COM server
Out-of-process server Here, the server is implemented and compiled as an executable (EXE). Since the client cannot load an EXE into its address space, the server runs in its own process, separate from the client. Communication between the two processes is handled via ALPC (Advanced Local Procedure Call) ports, which serve as the RPC transport layer for COM.
Out-of-process COM server
What is DCOM?
DCOM is an extension of COM where the D stands for Distributed. It enables the client and server to reside on different machines. From the user’s perspective, there is no difference: DCOM provides an abstraction layer that makes both the client and the server appear as if they are on the same machine.
Under the hood, however, COM uses TCP as the RPC transport layer to enable communication across machines.
Distributed COM implementation
Certain requirements must be met to extend a COM object into a DCOM object. The most important one for our research is the presence of the AppID subkey in the registry, located under the COM CLSID entry.
The AppID value contains a GUID that maps to a corresponding key under HKEY_CLASSES_ROOT\AppID. Several subkeys may exist under this GUID. Two critical ones are:
These registry settings grant remote clients permissions to activate and interact with DCOM objects.
Lateral movement via DCOM
After attackers compromise a host, their next objective is often to compromise additional machines. This is what we call lateral movement. One common lateral movement technique is to achieve remote command execution on a target machine. There are many ways to do this, one of which involves abusing DCOM objects.
In recent years, many DCOM objects have been discovered. This research focuses on the objects exposed by the Impacket script dcomexec.py that can be used for command execution. More specifically, three exposed objects are used: ShellWindows, ShellBrowserWindow and MMC20.
ShellWindows
ShellWindows was one of the first DCOM objects to be identified. It represents a collection of open shell windows and is hosted by explorer.exe, meaning any COM client communicates with that process.
In Impacket’s dcomexec.py, once an instance of this COM object is created on a remote machine, the script provides a semi-interactive shell.
Each time a user enters a command, the function exposed by the COM object is called. The command output is redirected to a file, which the script retrieves via SMB and displays back to simulate a regular shell.
Internally, the script runs this command when connecting:
cmd.exe /Q /c cd \ 1> \\127.0.0.1\ADMIN$\__17602 2>&1
This sets the working directory to C:\ and redirects the output to the ADMIN$ share under the filename __17602. After that, the script checks whether the file exists; if it does, execution is considered successful and the output appears as if in a shell.
When running dcomexec.py against Windows 10 and 11 using the ShellWindows object, the script hangs after confirming SMB connection initialization and printing the SMB banner. As I mentioned in my personal blog post, it appears that this DCOM object no longer has permission to write to the ADMIN$ share. A simple fix is to redirect the output to a directory the DCOM object can write to, such as the Temp folder. The Temp folder can then be accessed under the same ADMIN$ share. A small change in the code resolves the issue. For example:
ShellBrowserWindow
The ShellBrowserWindow object behaves almost identically to ShellWindows and exhibits the same behavior on Windows 10. The same workaround that we used for ShellWindows applies in this case. However, on Windows 11, this object no longer works for command execution.
MMC20
The MMC20.Application COM object is the automation interface for Microsoft Management Console (MMC). It exposes methods and properties that allow MMC snap-ins to be automated.
This object has historically worked across all Windows versions. Starting with Windows Server 2025, however, attempting to use it triggers a Defender alert, and execution is blocked.
As shown in earlier examples, the dcomexec.py script writes the command output to a file under ADMIN$, with a filename that begins with __:
OUTPUT_FILENAME = '__' + str(time.time())[:5]
Defender appears to check for files written under ADMIN$ that start with __, and when it detects one, it blocks the process and alerts the user. A quick fix is to simply remove the double underscores from the output filename.
Another way to bypass this issue is to use the same workaround used for ShellWindows – redirecting the output to the Temp folder. The table below outlines the status of these objects across different Windows versions.
Windows Server 2025
Windows Server 2022
Windows 11
Windows 10
ShellWindows
Doesn’t work
Doesn’t work
Works but needs a fix
Works but needs a fix
ShellBrowserWindow
Doesn’t work
Doesn’t work
Doesn’t work
Works but needs a fix
MMC20
Detected by Defender
Works
Works
Works
Enumerating COM/DCOM objects
The first step to identifying which DCOM objects could be used for lateral movement is to enumerate them. By enumerating, I don’t just mean listing the objects. Enumeration involves:
Finding objects and filtering specifically for DCOM objects.
Identifying their interfaces.
Inspecting the exposed functions.
Automating enumeration is difficult because most COM objects lack a type library (TypeLib). A TypeLib acts as documentation for an object: which interfaces it supports, which functions are exposed, and the definitions of those functions. Even when TypeLibs are available, manual inspection is often still required, as we will explain later.
There are several approaches to enumerating COM objects depending on their use cases. Next, we’ll describe the methods I used while conducting this research, taking into account both automated and manual methods.
Automation using PowerShell In PowerShell, you can use .NET to create and interact with DCOM objects. Objects can be created using either their ProgID or CLSID, after which you can call their functions (as shown in the figure below).
Shell.Application COM object function list in PowerShell
Under the hood, PowerShell checks whether the COM object has a TypeLib and implements the IDispatch interface. IDispatch enables late binding, which allows runtime dynamic object creation and function invocation. With these two conditions met, PowerShell can dynamically interact with COM objects at runtime.
Our strategy looks like this:
As you can see in the last box, we perform manual inspection to look for functions with names that could be of interest, such as Execute, Exec, Shell, etc. These names often indicate potential command execution capabilities.
However, this approach has several limitations:
TypeLib requirement: Not all COM objects have a TypeLib, so many objects cannot be enumerated this way.
IDispatch requirement: Not all COM objects implement the IDispatch interface, which is required for PowerShell interaction.
Interface control: When you instantiate an object in PowerShell, you cannot choose which interface the instance will be tied to. If a COM class implements multiple interfaces, PowerShell will automatically select the one marked as [default] in the TypeLib. This means that other non-default interfaces, which may contain additional relevant functionality, such as command execution, could be overlooked.
Automation using C++ As you might expect, C++ is one of the languages that natively supports COM clients. Using C++, you can create instances of COM objects and call their functions via header files that define the interfaces.However, with this approach, we are not necessarily interested in calling functions directly. Instead, the goal is to check whether a specific COM object supports certain interfaces. The reasoning is that many interfaces have been found to contain functions that can be abused for command execution or other purposes.
This strategy primarily relies on an interface called IUnknown. All COM interfaces should inherit from this interface, and all COM classes should implement it.The IUnknown interface exposes three main functions. The most important is QueryInterface(), which is used to ask a COM object for a pointer to one of its interfaces.So, the strategy is to:
Enumerate COM classes in the system by reading CLSIDs under the HKEY_CLASSES_ROOT\CLSID key.
Check whether they support any known valuable interfaces. If they do, those classes may be leveraged for command execution or other useful functionality.
This method has several advantages:
No TypeLib dependency: Unlike PowerShell, this approach does not require the COM object to have a TypeLib.
Use of IUnknown: In C++, you can use the QueryInterface function from the base IUnknown interface to check if a particular interface is supported by a COM class.
No need for interface definitions: Even without knowing the exact interface structure, you can obtain a pointer to its virtual function table (vtable), typically cast as a void*. This is enough to confirm the existence of the interface and potentially inspect it further.
The figure below illustrates this strategy:
This approach is good in terms of automation because it eliminates the need for manual inspection. However, we are still only checking well-known interfaces commonly used for lateral movement, while potentially missing others.
Manual inspection using open-source tools
As you can see, automation can be difficult since it requires several prerequisites and, in many cases, still ends with a manual inspection. An alternative approach is manual inspection using a tool called OleViewDotNet, developed by James Forshaw. This tool allows you to:
List all COM classes in the system.
Create instances of those classes.
Check their supported interfaces.
Call specific functions.
Apply various filters for easier analysis.
Perform other inspection tasks.
Open-source tool for inspecting COM interfaces
One of the most valuable features of this tool is its naming visibility. OleViewDotNet extracts the names of interfaces and classes (when available) from the Windows Registry and displays them, along with any associated type libraries.
This makes manual inspection easier, since you can analyze the names of classes, interfaces, or type libraries and correlate them with potentially interesting functionality, for example, functions that could lead to command execution or persistence techniques.
Control Panel items as attack surfaces
Control Panel items allow users to view and adjust their computer settings. These items are implemented as DLLs that export the CPlApplet function and typically have the .cpl extension. Control Panel items can also be executables, but our research will focus on DLLs only.
Control Panel items
Attackers can abuse CPL files for initial access. When a user executes a malicious .cpl file (e.g., delivered via phishing), the system may be compromised – a technique mapped to MITRE ATT&CK T1218.002.
Adversaries may also modify the extensions of malicious DLLs to .cpl and register them in the corresponding locations in the registry.
Under HKEY_CURRENT_USER:
HKCU\Software\Microsoft\Windows\CurrentVersion\Control Panel\Cpls
Under HKEY_LOCAL_MACHINE:
For 64-bit DLLs:
HKLM\Software\Microsoft\Windows\CurrentVersion\Control Panel\Cpls
For 32-bit DLLs:
HKLM\Software\WOW6432Node\Microsoft\Windows\CurrentVersion\Control Panel\Cpls
These locations are important when Control Panel DLLs need to be available to the current logged-in user or to all users on the machine. However, the “Control Panel” subkey and its “Cpls” subkey under HKCU should be created manually, unlike the “Control Panel” and “Cpls” subkeys under HKLM, which are created automatically by the operating system.
Once registered, the DLL (CPL file) will load every time the Control Panel is opened, enabling persistence on the victim’s system.
It’s worth noting that even DLLs that do not comply with the CPL specification, do not export CPlApplet, or do not have the .cpl extension can still be executed via their DllEntryPoint function if they are registered under the registry keys listed above.
There are multiple ways to execute Control Panel items:
This calls the Control_RunDLL function from shell32.dll, passing the CPL file as an argument. Everything inside the CPlApplet function will then be executed.
However, if the CPL file has been registered in the registry as shown earlier, then every time the Control Panel is opened, the file is loaded into memory through the COM Surrogate process (dllhost.exe):
COM Surrogate process loading the CPL file
What happened was that a Control Panel with a COM client used a COM object to load these CPL files. We will talk about this COM object in more detail later.
The COM Surrogate process was designed to host COM server DLLs in a separate process rather than loading them directly into the client process’s address space. This isolation improves stability for the in-process server model. This hosting behavior can be configured for a COM object in the registry if you want a COM server DLL to run inside a separate process because, by default, it is loaded in the same process.
‘DCOMing’ through Control Panel items
While following the manual approach of enumerating COM/DCOM objects that could be useful for lateral movement, I came across a COM object called COpenControlPanel, which is exposed through shell32.dll and has the CLSID {06622D85-6856-4460-8DE1-A81921B41C4B}. This object exposes multiple interfaces, one of which is IOpenControlPanel with IID {D11AD862-66DE-4DF4-BF6C-1F5621996AF1}.
IOpenControlPanel interface in the OleViewDotNet output
I immediately thought of its potential to compromise Control Panel items, so I wanted to check which functions were exposed by this interface. Unfortunately, neither the interface nor the COM class has a type library.
COpenControlPanel interfaces without TypeLib
Normally, checking the interface definition would require reverse engineering, so at first, it looked like we needed to take a different research path. However, it turned out that the IOpenControlPanel interface is documented on MSDN, and according to the documentation, it exposes several functions. One of them, called Open, allows a specified Control Panel item to be opened using its name as the first argument.
Full type and function definitions are provided in the shobjidl_core.h Windows header file.
Open function exposed by IOpenControlPanel interface
It’s worth noting that in newer versions of Windows (e.g., Windows Server 2025 and Windows 11), Microsoft has removed interface names from the registry, which means they can no longer be identified through OleViewDotNet.
COpenControlPanel interfaces without names
Returning to the COpenControlPanel COM object, I found that the Open function can trigger a DLL to be loaded into memory if it has been registered in the registry. For the purposes of this research, I created a DLL that basically just spawns a message box which is defined under the DllEntryPoint function. I registered it under HKCU\Software\Microsoft\Windows\CurrentVersion\Control Panel\Cpls and then created a simple C++ COM client to call the Open function on this interface.
As expected, the DLL was loaded into memory. It was hosted in the same way that it would be if the Control Panel itself was opened: through the COM Surrogate process (dllhost.exe). Using Process Explorer, it was clear that dllhost.exe loaded my DLL while simultaneously hosting the COpenControlPanel object along with other COM objects.
COM Surrogate loading a custom DLL and hosting the COpenControlPanel object
Based on my testing, I made the following observations:
The DLL that needs to be registered does not necessarily have to be a .cpl file; any DLL with a valid entry point will be loaded.
The Open() function accepts the name of a Control Panel item as its first argument. However, it appears that even if a random string is supplied, it still causes all DLLs registered in the relevant registry location to be loaded into memory.
Now, what if we could trigger this COM object remotely? In other words, what if it is not just a COM object but also a DCOM object? To verify this, we checked the AppID of the COpenControlPanel object using OleViewDotNet.
COpenControlPanel object in OleViewDotNet
Both the launch and access permissions are empty, which means the object will follow the system’s default DCOM security policy. By default, members of the Administrators group are allowed to launch and access the DCOM object.
Based on this, we can build a remote strategy. First, upload the “malicious” DLL, then use the Remote Registry service to register it in the appropriate registry location. Finally, use a trigger acting as a DCOM client to remotely invoke the Open() function, causing our DLL to be loaded. The diagram below illustrates the flow of this approach.
Malicious DLL loading using DCOM
The trigger can be written in either C++ or Python, for example, using Impacket. I chose Python because of its flexibility. The trigger itself is straightforward: we define the DCOM class, the interface, and the function to call. The full code example can be found here.
Once the trigger runs, the behavior will be the same as when executing the COM client locally: our DLL will be loaded through the COM Surrogate process (dllhost.exe).
As you can see, this technique not only achieves command execution but also provides persistence. It can be triggered in two ways: when a user opens the Control Panel or remotely at any time via DCOM.
Detection
The first step in detecting such activity is to check whether any Control Panel items have been registered under the following registry paths:
Although commonly known best practices and research papers regarding Windows security advise monitoring only the first subkey, for thorough coverage it is important to monitor all of the above.
In addition, monitoring dllhost.exe (COM Surrogate) for unusual COM objects such as COpenControlPanel can provide indicators of malicious activity.
Finally, it is always recommended to monitor Remote Registry usage because it is commonly abused in many types of attacks, not just in this scenario.
Conclusion
In conclusion, I hope this research has clarified yet another attack vector and emphasized the importance of implementing hardening practices. Below are a few closing points for security researchers to take into account:
As shown, DCOM represents a large attack surface. Windows exposes many DCOM classes, a significant number of which lack type libraries – meaning reverse engineering can reveal additional classes that may be abused for lateral movement.
Changing registry values to register malicious CPLs is not good practice from a red teaming ethics perspective. Defender products tend to monitor common persistence paths, but Control Panel applets can be registered in multiple registry locations, so there is always a gap that can be exploited.
Bitness also matters. On x64 systems, loading a 32-bit DLL will spawn a 32-bit COM Surrogate process (dllhost.exe *32). This is unusual on 64-bit hosts and therefore serves as a useful detection signal for defenders and an interesting red flag for red teamers to consider.


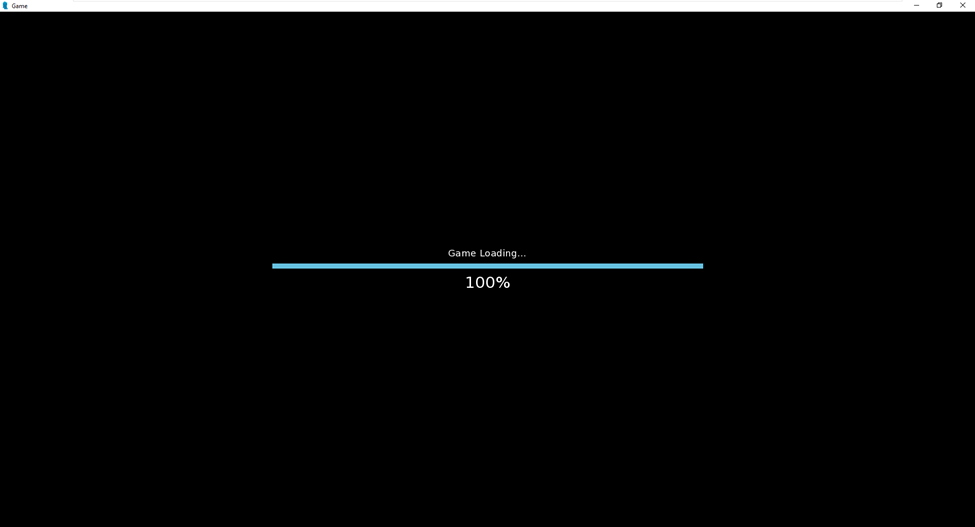
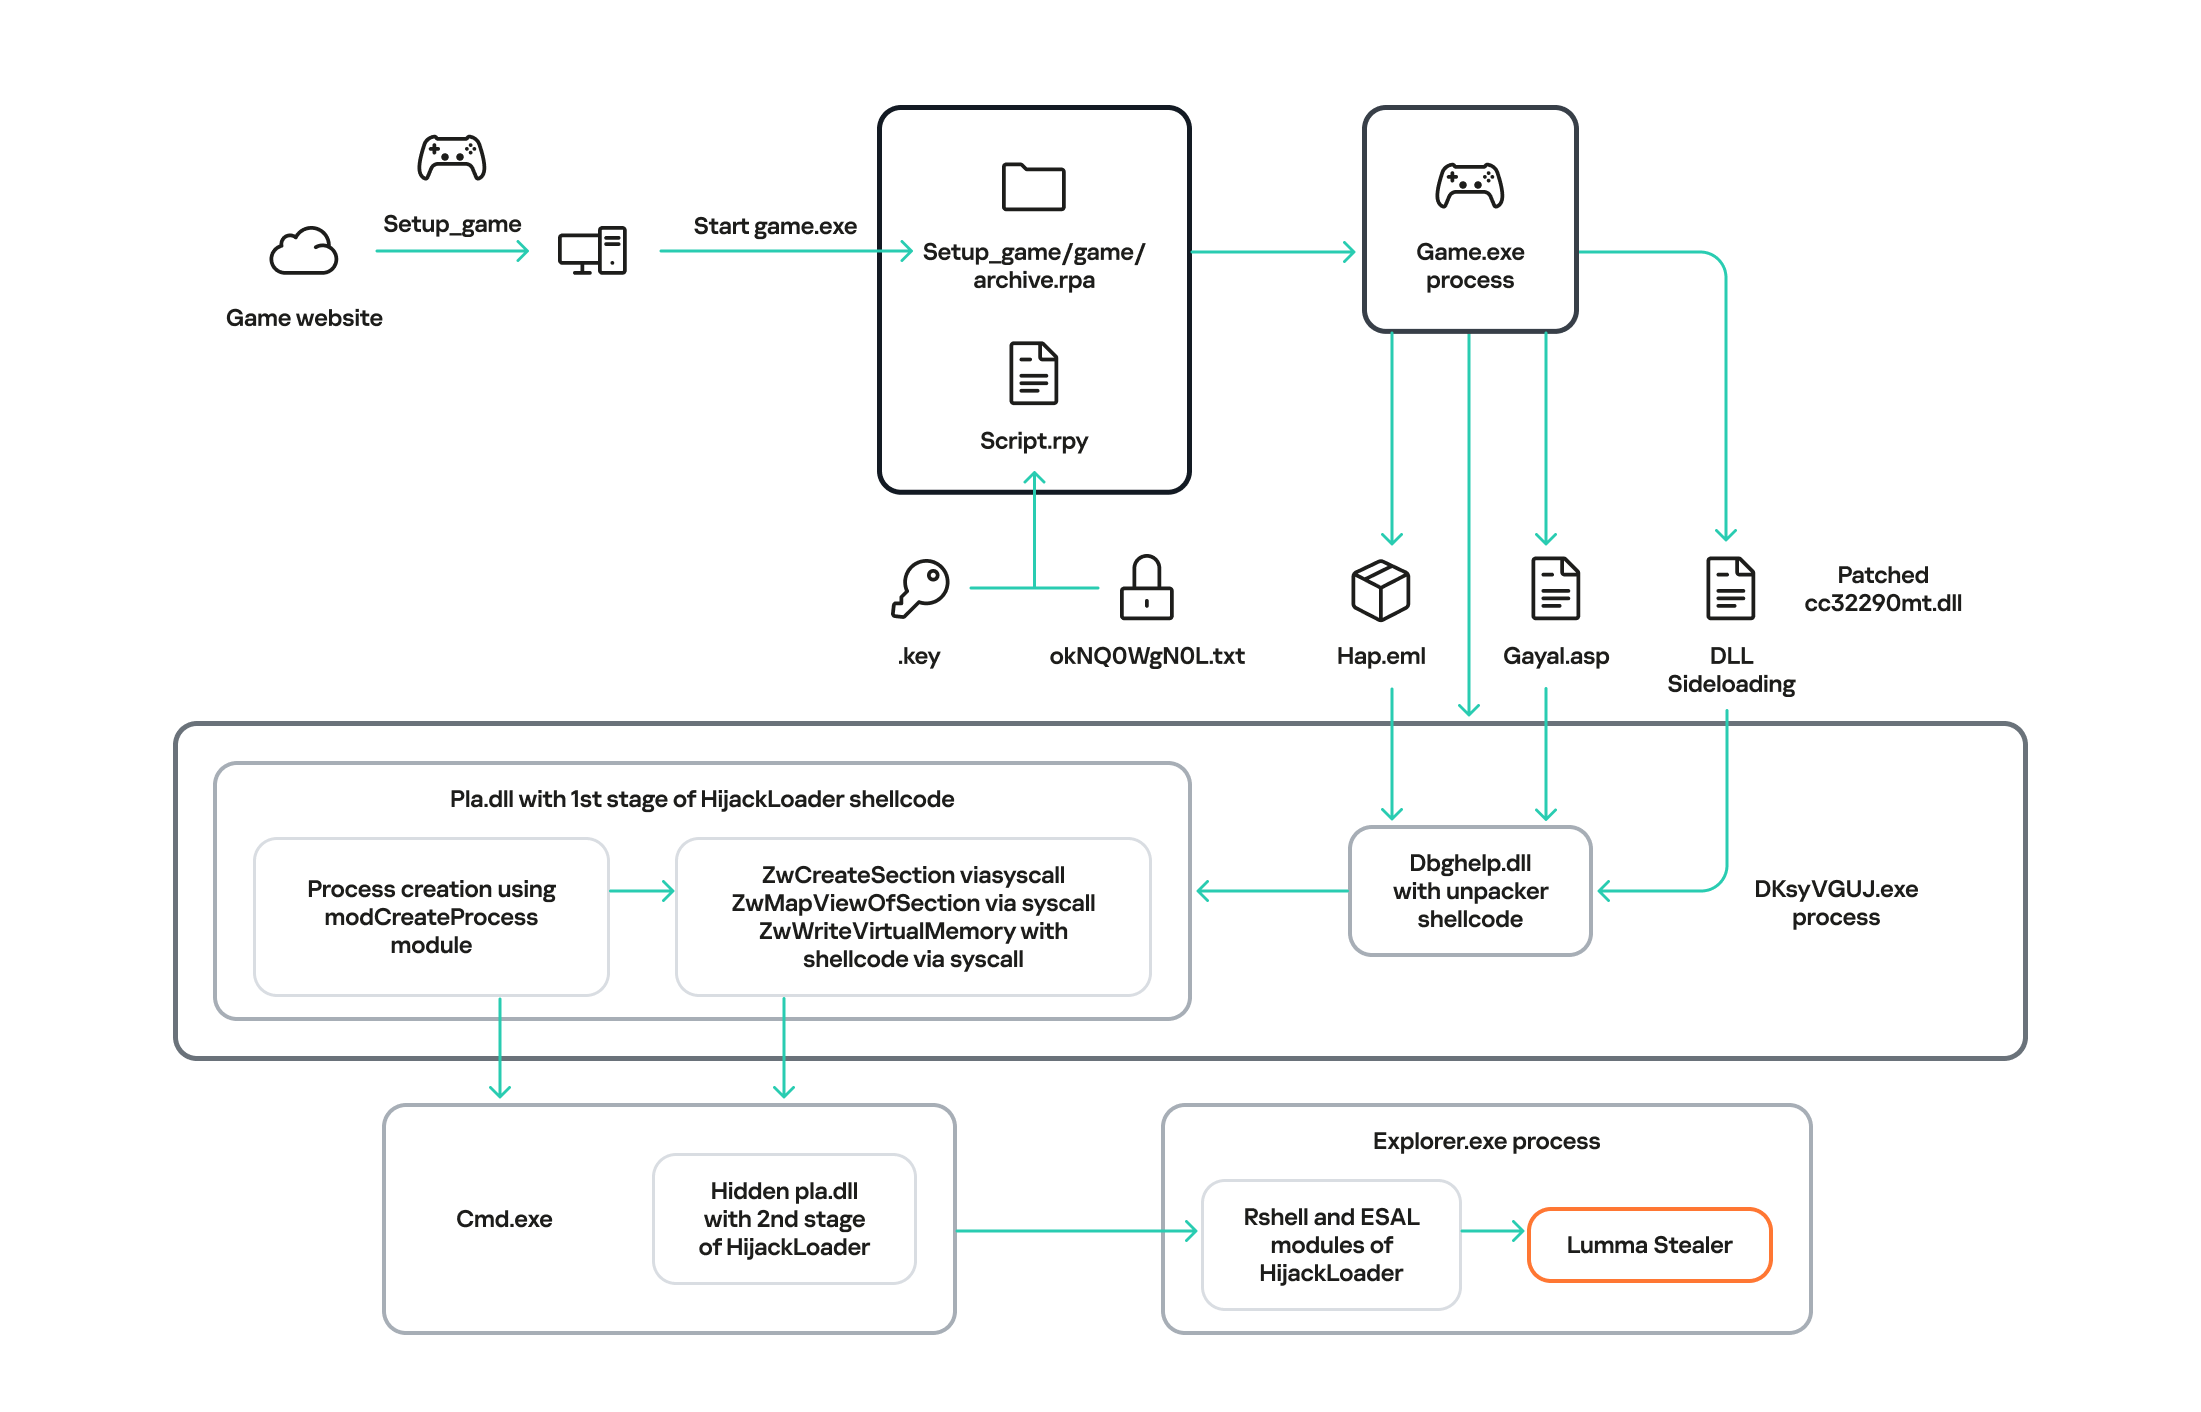
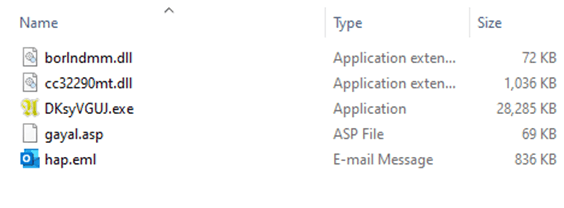
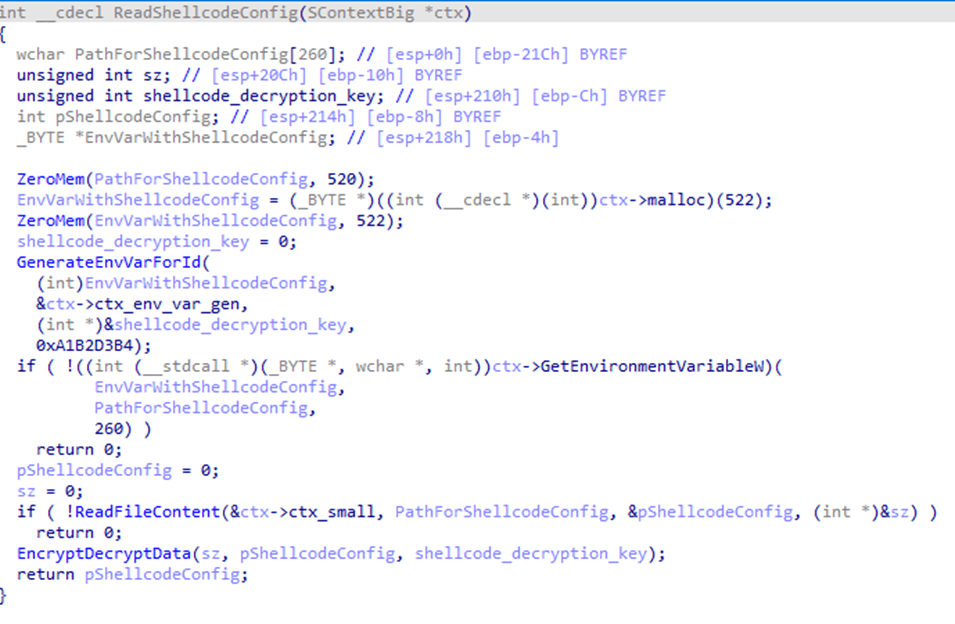
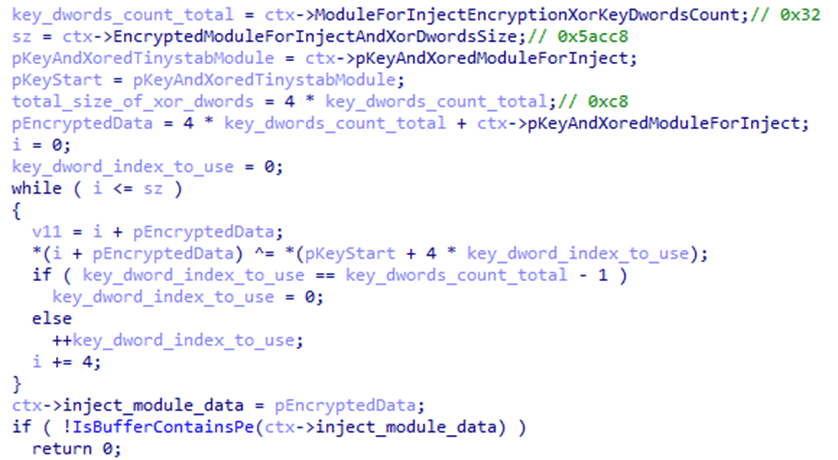
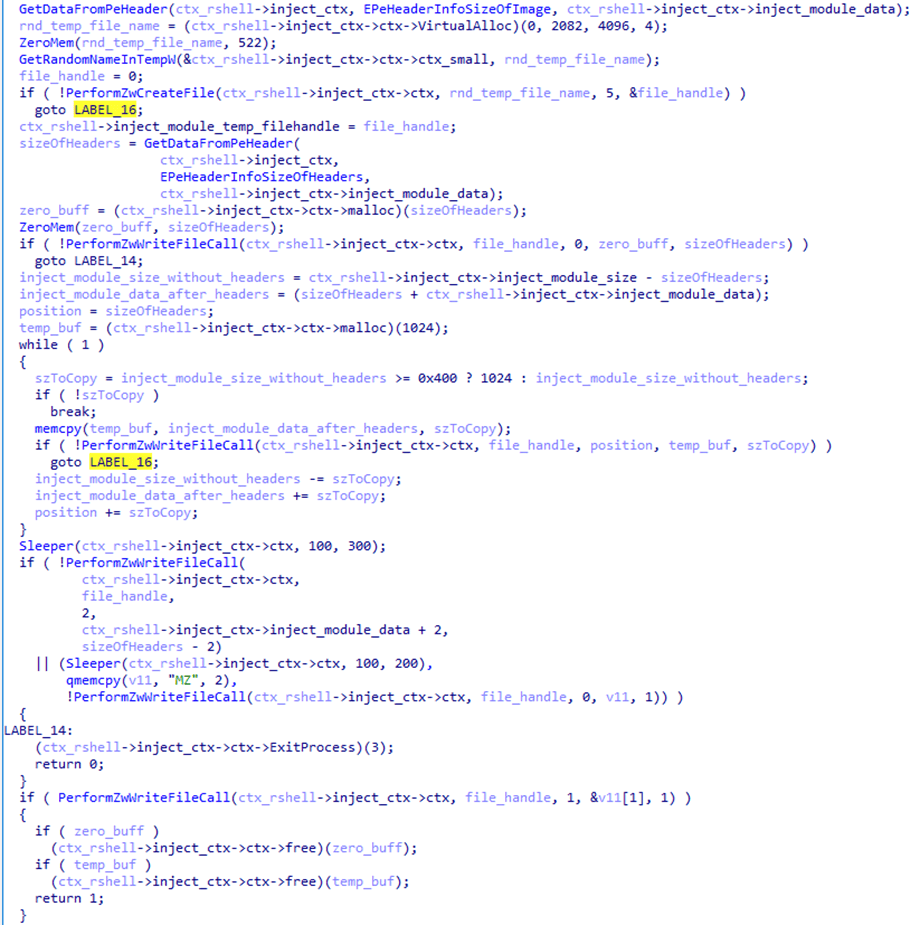
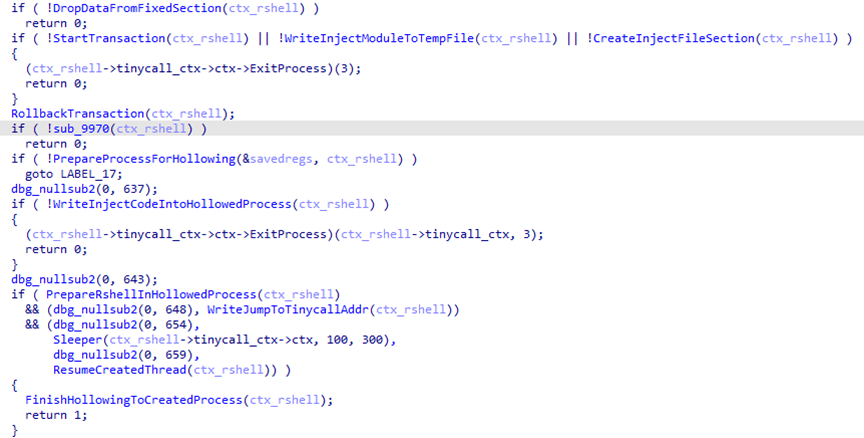
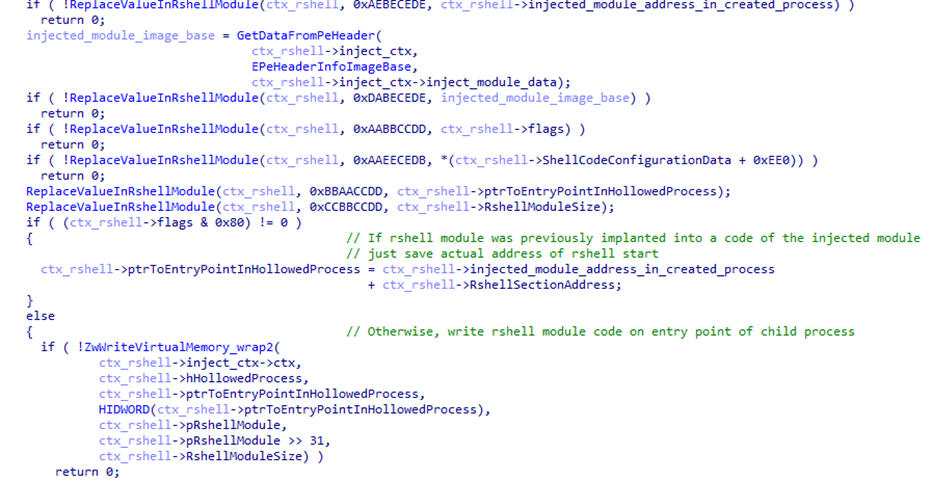


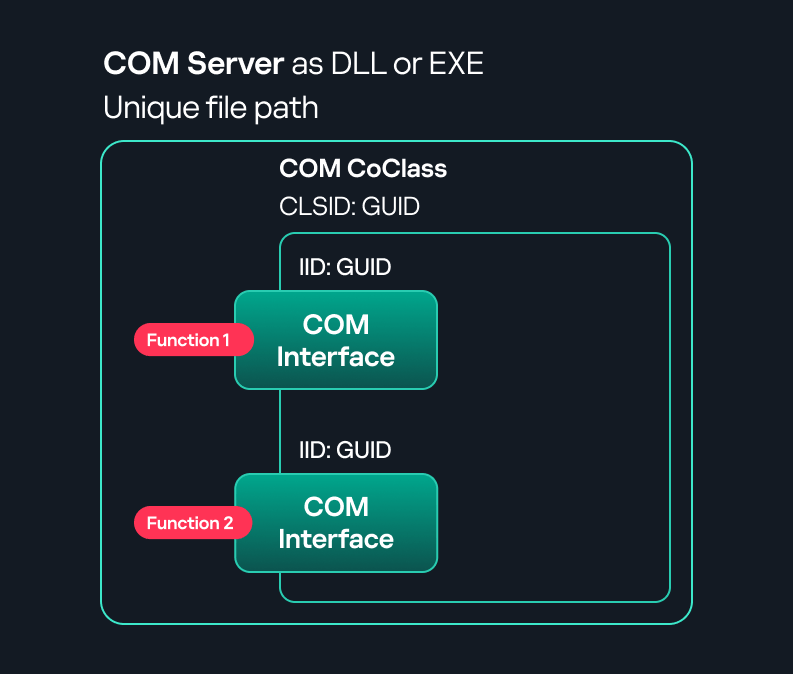


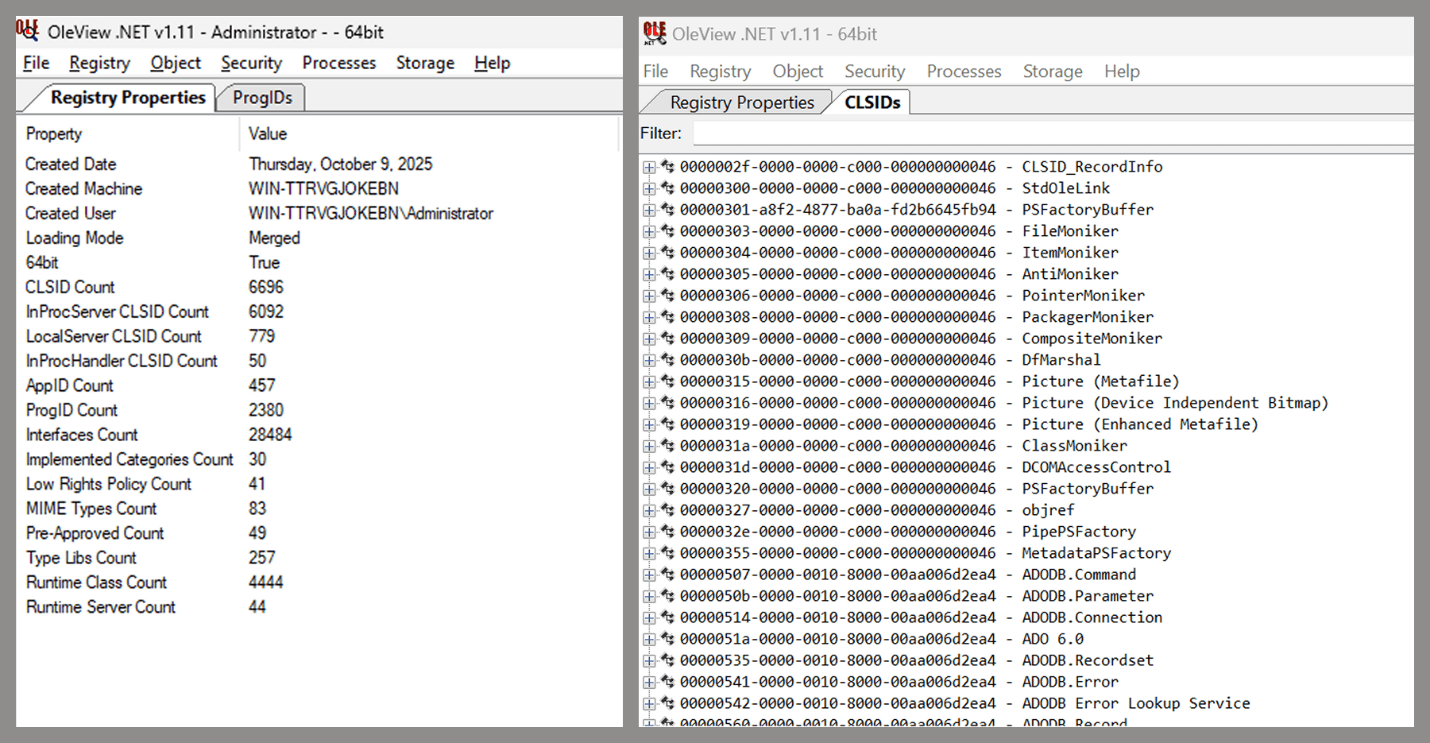


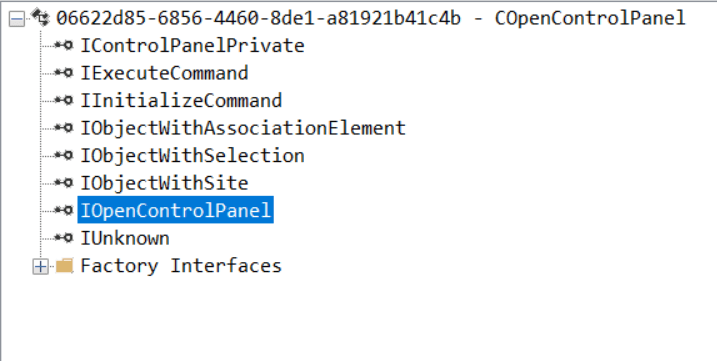
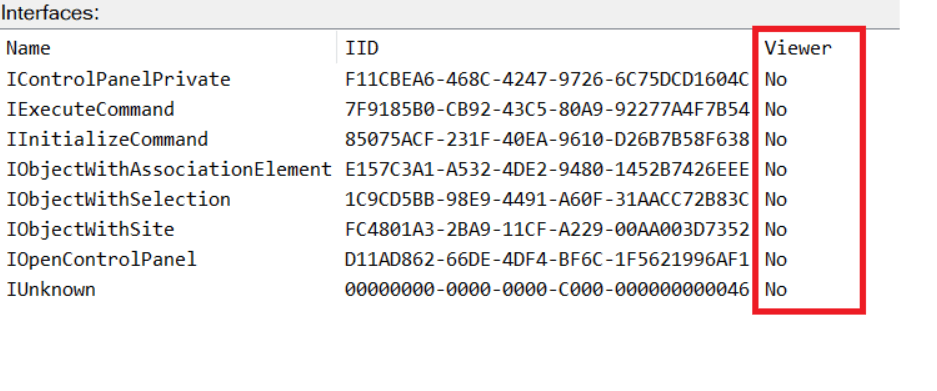
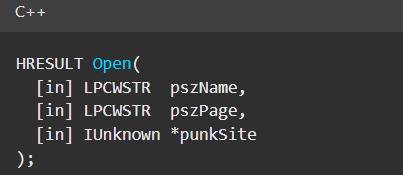
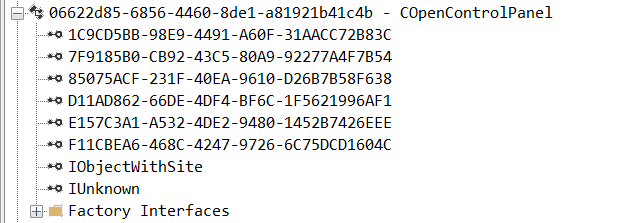
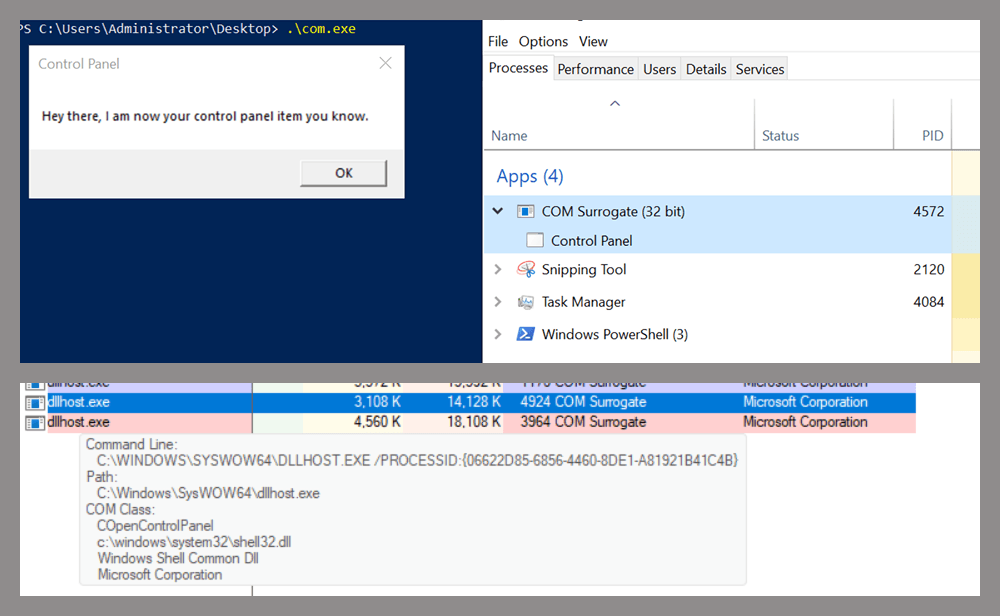
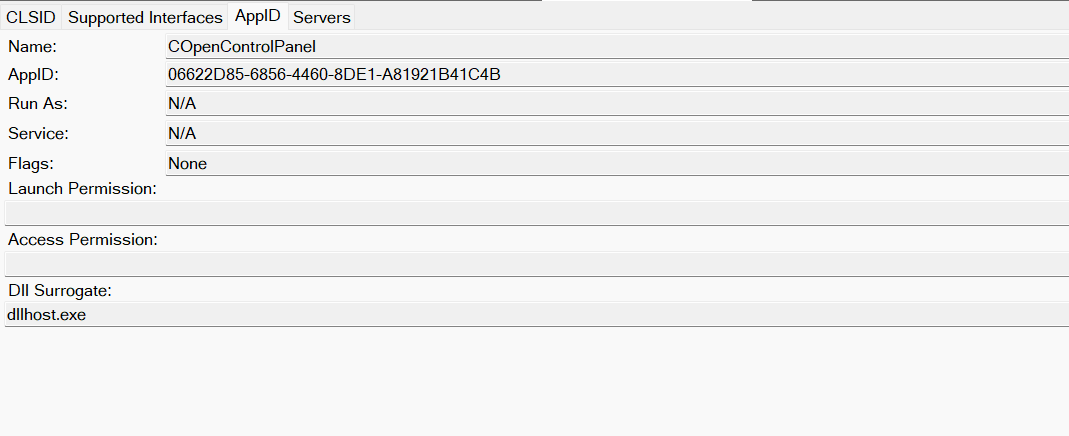
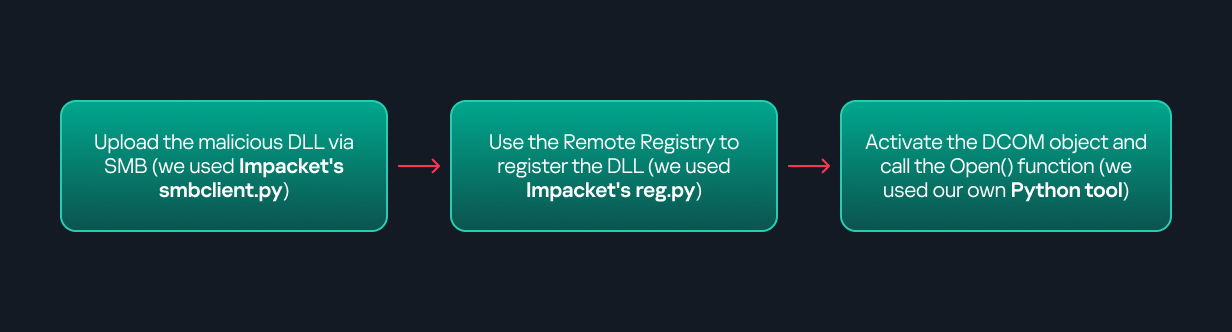


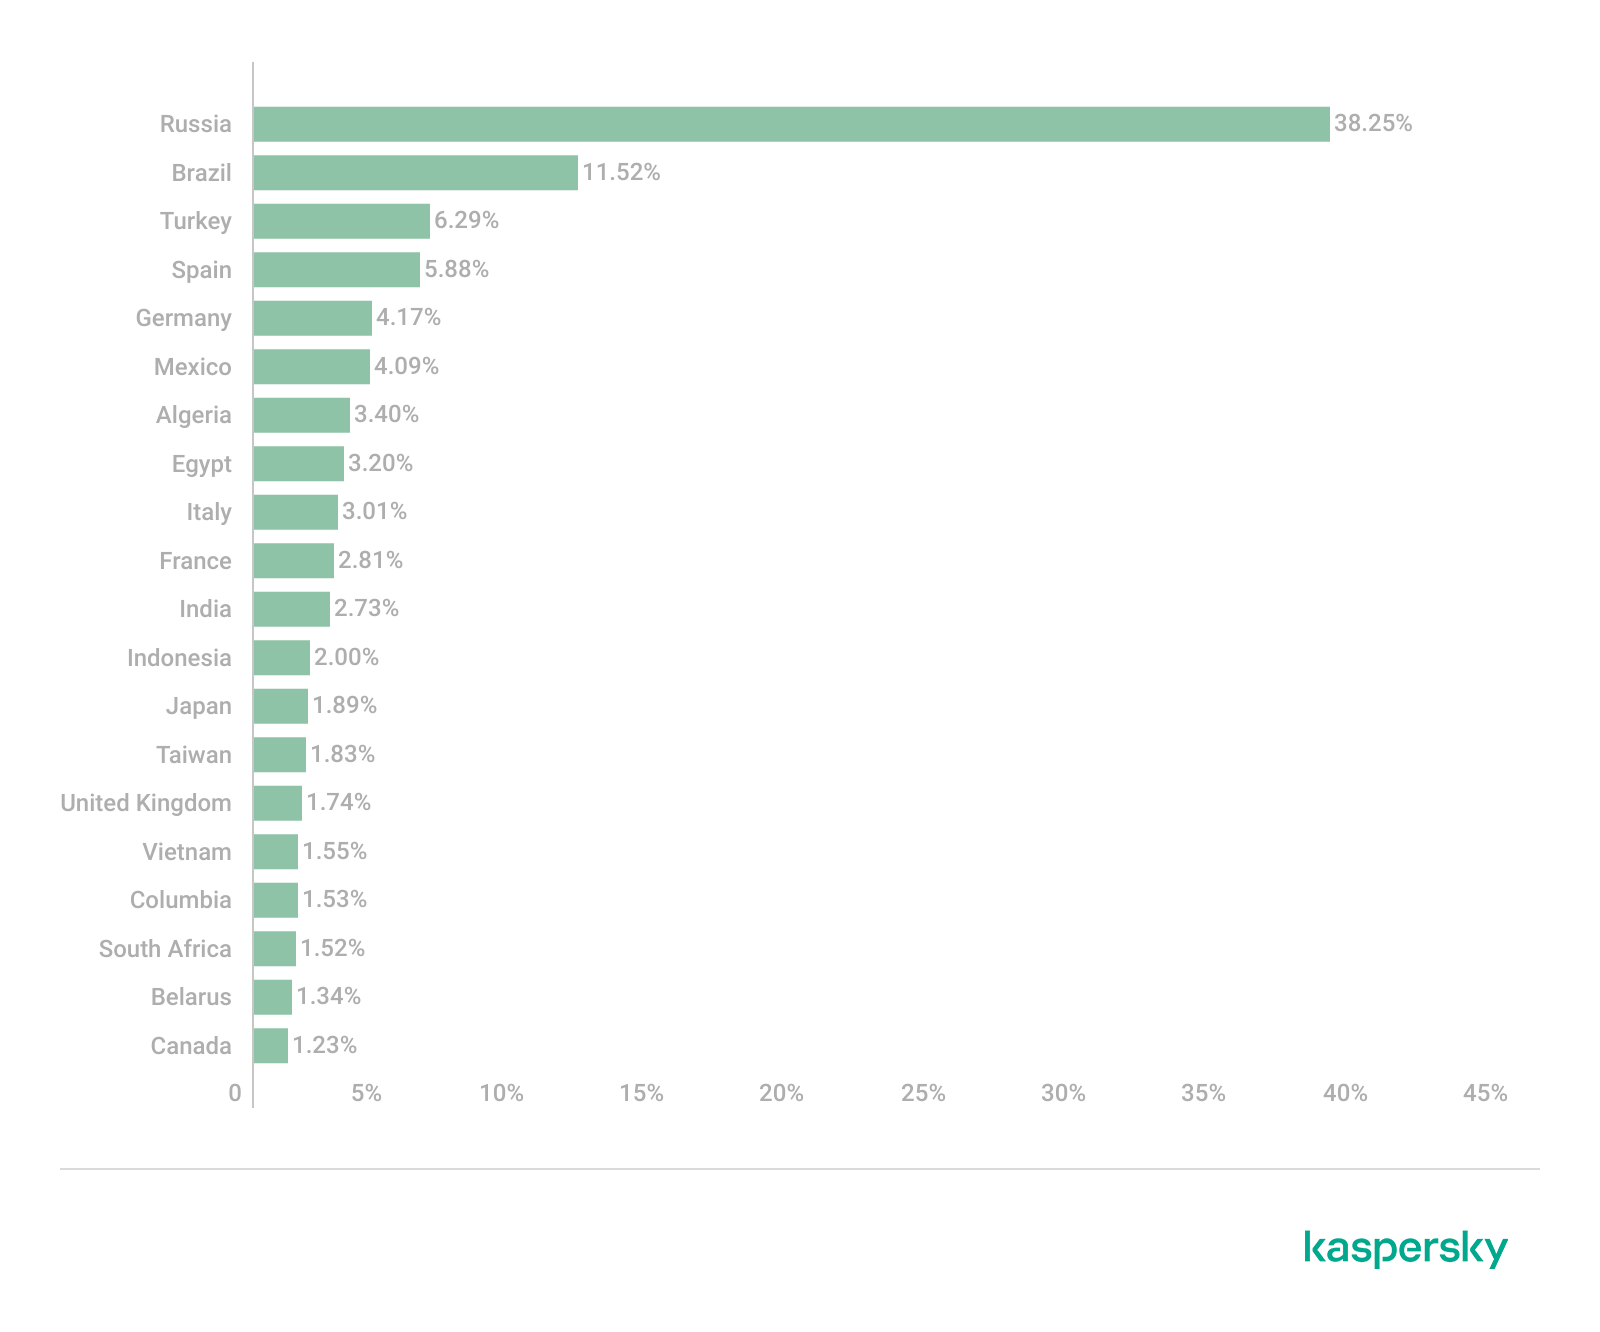