Reading view

Toy Ghouls’ new toy: the GenieLocker ransomware
Introduction

The new GenieLocker ransomware family has been active since March 2026. It has been used in attacks against organizations in the Russian Federation, primarily in the manufacturing sector, and attributed to the Toy Ghouls group by open-source intelligence (link in Russian).

The Toy Ghouls, also known as Bearlyfy, Labubu and Laboo.boo, is a financially motivated extortion group, which previously relied on third-party encryption Trojans like RedAlert, LockBit, and Babuk. GenieLocker, apparently a custom design, upgrades their toolkit and reduces their reliance on third-party software. We discovered multiple samples of this Trojan in two variants: PE builds for Windows and ELF builds for Linux and ESXi.

Technical details

Modus operandi

We described typical TTPs and modus operandi of the Toy Ghouls threat actor in the previous post (link in Russian).

In this article, we aim to thoroughly describe the capabilities of Windows and Linux builds of the custom encryption Trojan GenieLocker. To give more context, we will also provide a brief overview of the attack that took place at the end of March 2026, where GenieLocker was deployed on the victim’s systems.

Initial Access

During the incident, the attackers first entered the environment through an OpenVPN connection originating from an external partner’s network. They likely exploited the trusted relationship with that partner and used stolen, yet still valid, credentials to connect.

Discovery and Credential Access

After breaching the target’s network, the attackers installed additional tools on the compromised hosts, including OpenSSH, socks5.exe, SoftPerfect Network Scanner, and Mimikatz. They employed SoftPerfect Network Scanner for discovery and used Mimikatz to dump credentials. Forensic analysis also shows that they accessed the KeePassXC password manager already installed on several compromised machines, likely attempting to extract the stored credentials from the KeePass databases.

Lateral Movement and Command and Control

Lateral movement was performed by using RDP to reach Windows machines and SSH for Linux servers. The widespread deployment of the encryption Trojan was conducted with the legitimate utilities PsExec and PAExec. Additionally, the attackers established a reverse SSH tunnel to communicate with their command‑and‑control server.

Impact

During the impact phase, the attackers encrypted files on the compromised Windows machines with the PE version of the GenieLocker ransomware. On the compromised Linux and ESXi servers, they stopped active virtual machines and encrypted their disks using the ELF version of GenieLocker.

The tactics, techniques, and procedures seen here match those documented in earlier attacks attributed to the Toy Ghouls group. As in those prior incidents, forensic analysis found no evidence of data exfiltration, which is typical behavior for this threat actor. Toy Ghouls have not employed a double‑extortion model and do not run a data‑leak website.

Encryption Trojan for Windows

The Windows version of GenieLocker (MD5: 5d62c1349b8981c396c9a23f4f8f053c) is primarily written in C, but compiled with the C++ libraries using Microsoft Visual C/C++. The malware incorporates several ransom‑related capabilities, including process termination, service shutdown, debugger evasion, and a sophisticated encryption routine. For its cryptographic operations, it relies on the open‑source libsodium library.

Aligned with the recent trend supported by our expertise, as observed in attacks of some other ransomware strains, GenieLocker doesn’t save the ransom notes on the victim’s system. The Trojan doesn’t contain any attackers’ contact info or negotiation addresses. Instead, the attackers will need to deliver the ransom demands and contacts manually during the attack. This approach may be an attempt by the GenieLocker developers to avoid proactive detection of the ransomware process being triggered by the creation of multiple readme files.
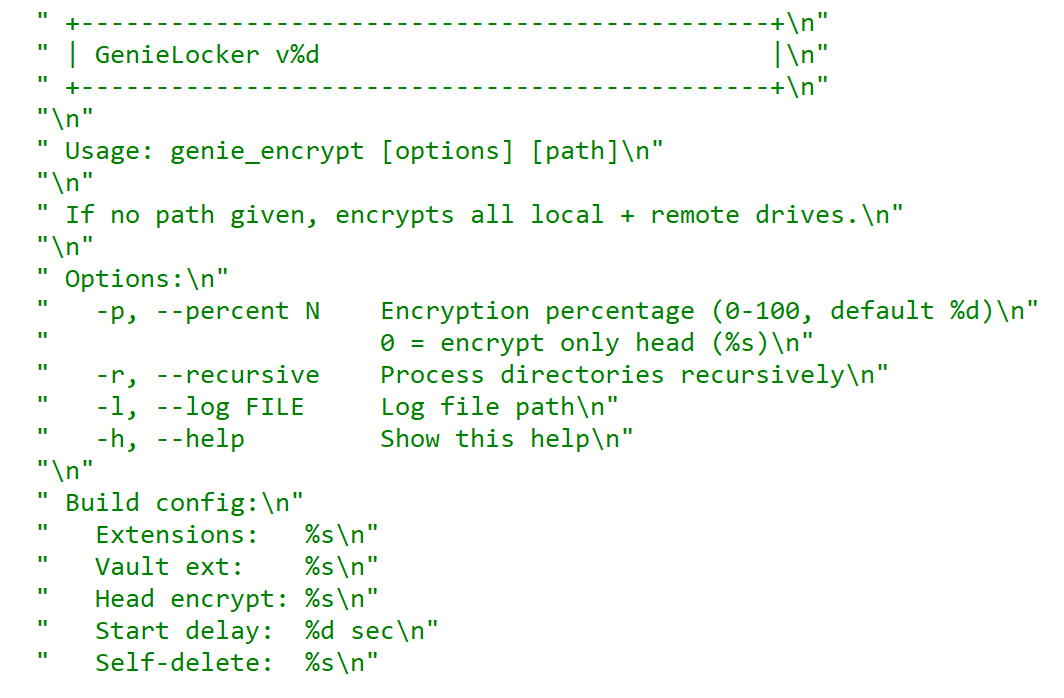
GenieLocker help message

GenieLocker help message

Arguments and launch

GenieLocker supports multiple arguments for configuring its behavior.

Argument Description
First argument “Secret” argument, hex string value
-p, –percent N Percentage of file content to encrypt
-r, –recursive Process directories recursively
-l, –log <filename> Set path for log file
-h, –help Show help message
Last argument Path to encrypt

GenieLocker expects the first argument to be a hex string referred to in the malware code as the “secret argument”, which is required for the ransomware to start. Most likely, the purpose of this is to avoid execution on sandboxes and other automated analysis environments. Another reason may be to prevent unauthorized usage by other threat actors.
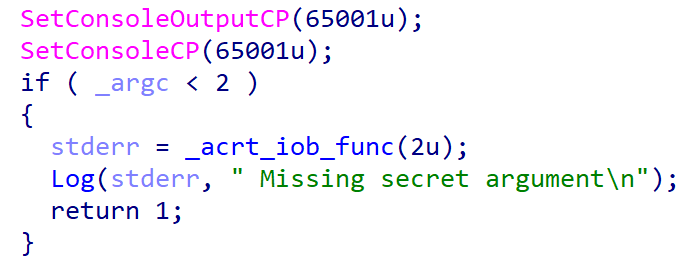
Checking the secret argument

Checking the secret argument

The secret argument is a hex value with a variable size that does not exceed 4096 bytes. This hex string value is converted to bytes and hashed with the SHA‑256 algorithm. The result is compared to a hardcoded value. If they match, the literal string session is appended to the secret value, and the whole string is hashed with BLAKE2b‑256, but the resulting hash is never used. This may be a part of a feature still in development.

Secret value hashing

Secret value hashing

Anti-debugging

GenieLocker contains multiple methods to inspect if its process is under debugging. After launch it makes the first check named Environment check and uses WinAPI functions IsDebuggerPresent and CheckRemoteDebuggerPresent to detect the debugger.
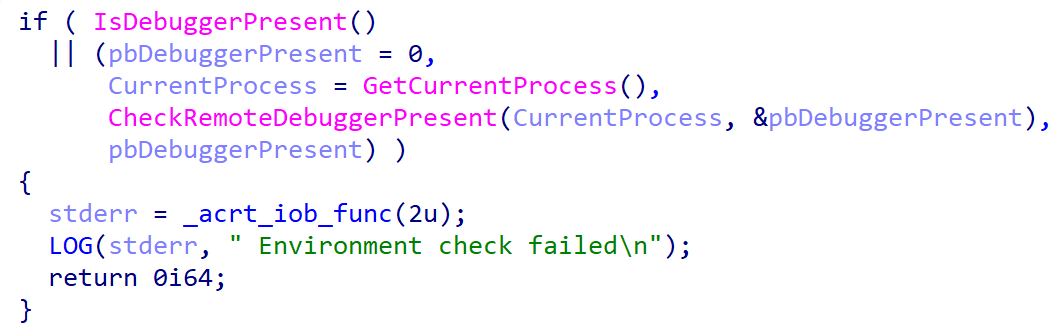
Environment check

Environment check

After the secret argument validation, GenieLocker starts a new parallel thread called watchdog. It runs in an infinite loop that performs a number of checks to detect well-known debuggers every 500 milliseconds. If at least one of the checks fails, the whole GenieLocker process immediately terminates.
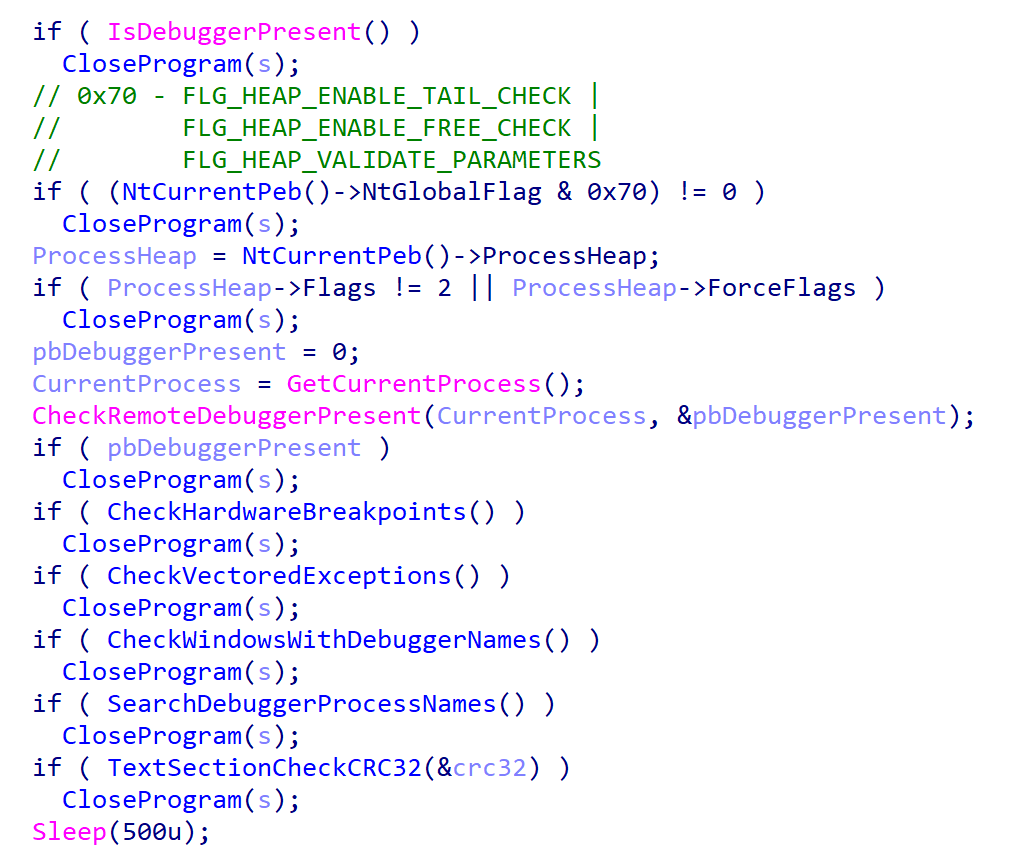
Watchdog checks

Watchdog checks

The only thing worth elaborating on is that the GenieLocker process calculates the CRC32 of its .text section when the watchdog thread is starting, saves the resulting hash, and then recalculates it again in every loop and compares with the initial value. In case the code in this section is modified by the debugger or other program, this method allows the Trojan to detect this modification.

Preparing for encryption

GenieLocker contains multiple exclusion lists. For example, it does not encrypt folders with names from the list below. Among those, there are mostly system folders, which are skipped to avoid corrupting the OS.

$recycle.bin;config.msi;$windows.~bt;$windows.~ws;windows;boot;program files;program files (x86);programdata;system volume information;tor browser;windows.old;intel;msocache;perflogs;x64dbg;public;all users;default;microsoft;appdata

The Trojan also avoids encrypting the following system Windows files.

autorun.inf;boot.ini;bootfont.bin;bootsect.bak;desktop.ini;iconcache.db;ntldr;ntuser.dat;ntuser.dat.log;ntuser.ini;thumbs.db;GDIPFONTCACHEV1.DAT;d3d9caps.dat

The file extensions below are excluded from encryption as well.

386;adv;ani;bat;bin;cab;cmd;com;cpl;cur;deskthemepack;diagcab;diagcfg;diagpkg;dll;drv;exe;hlp;icl;icns;ico;ics;idx;ldf;lnk;mod;mpa;msc;msp;msstyles;msu;nls;nomedia;ocx;prf;ps1;rom;rtp;scr;shs;spl;sys;theme;themepack;wpx;lock;key;hta;msi;pdb;search-ms;MD

Furthermore, the Trojan contains an exclusion list for host names. The malware retrieves the computer name using GetComputerNameA and checks it against this list, but in the sample in question, the list is empty.

Output for whitelisted hosts

Output for whitelisted hosts

If the host name is not excluded, GenieLocker starts to kill processes that could be using the files of interest and therefore prevent the Trojan from encrypting them. These processes are listed below. The Trojan stops them by using the TerminateProcess function.

sql;oracle;ocssd;dbsnmp;synctime;agntsvc;isqlplussvc;xfssvccon;mydesktopservice;ocautoupds;encsvc;firefox;tbirdconfig;mydesktopqos;ocomm;dbeng50;sqbcoreservice;excel;infopath;msaccess;mspub;onenote;outlook;powerpnt;steam;thebat;thunderbird;visio;winword;wordpad;notepad;calc;wuauclt;onedrive;1c;vmwp;vmms;vmcompute;mssqlserver

Additionally, the Trojan stops the following services using ControlService with the SERVICE_CONTROL_STOP control code.

vss;sql;svc$;memtas;mepocs;msexchange;sophos;veeam;backup;GxVss;GxBlr;GxFWD;GxCVD;GxCIMgr;1c;Mssqlserver;vmwp;vmms;vmcompute;mssqlserver;agent_ovpnconnect

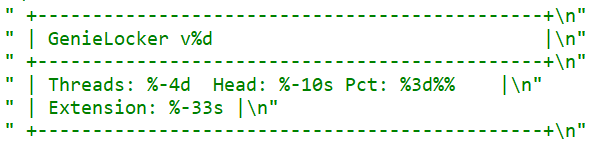
Finally, GenieLocker starts encryption threads and searches for all available drives, including network shares, to encrypt them.
Threads info output

Threads info output

File encryption and cryptography

The extension for the encrypted files is hardcoded in the Trojan’s body. In the sample under review, it is .03ffc1c4a3da0f02. Before starting to encrypt each file, GenieLocker creates two auxiliary files:

  • a lock file: <filename.fileext>.03ffc1c4a3da0f02.lock
  • a journal: <fileext>.03ffc1c4a3da0f02.journal

The lock file helps to protect files from double encryption by other threads or instances. Inside this file, the Trojan stores the current PID obtained from the GetCurrentProcessId function.

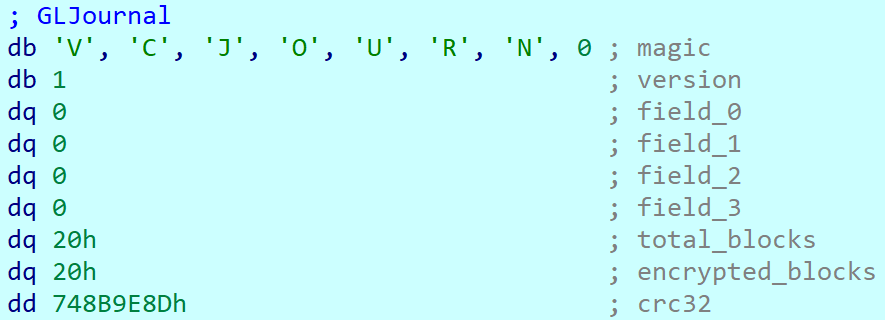
The journal file contains the hardcoded string VCJOURN, value 1 (possibly version), some unused zeroed fields, total blocks to encrypt, and the count of blocks that are actually encrypted. The last field is a CRC32 hash sum for the integrity check of the journal content.
Journal content

Journal content

By default GenieLocker encrypts files using 0x1000000-byte chunks. If the argument -p is passed (it sets the percentage of the file contents to be encrypted), the ransomware calculates how many chunks with 0x1000000 size are necessary to encrypt the specified percentage. Each chunk has a random position inside the file. Regardless of whether the percentage is set, even if it is zero, the first chunk in the beginning of the file will be encrypted anyway.

The Trojan encrypts the file content using the Authenticated Encryption with Associated Data (AEAD) algorithm XChaCha20-Poly1305, with a unique key and nonce for each file. The Trojan also adds a footer that contains the data necessary for future decryption and metadata. The metadata parts are encrypted using the same cipher and key as the file contents, but with a different nonce. The file key is encrypted using the Curve25519-XSalsa20-Poly1305 scheme, with the attackers’ master public key hardcoded in the Trojan’s body.

The metadata of each encrypted file contains the following fields.

Value or name Size (bytes) Description
version 1 Hardcoded byte with value 1, most likely the version.
encryption_percent 1 Percentage of file content to encrypt, value from -p argument.
file_nonce 24 Nonce used during encryption of the file content.
original_filesize 8 Original size of the file before encryption.
total_chunk_count 8 Max count of chunks inside the current file.
chunk_size 4 Size of a single encrypted chunk (by default, 0x1000000 bytes on Windows and 0x400000 on ESXi and Linux).
remain_size 4 The number of bytes remaining after splitting the file content into chunks.
blake2b_digest_of_chunks 32 BLAKE2b-256 hash calculated from the original data of all chunks before they are encrypted. Used for integrity checks.
chunk_count 4 Number of chunks that were encrypted.
extension 64 A string with the additional ransomware extension.
poly1305_tags (array) 16 bytes per chunk Array of Poly1305 tags of encrypted chunks.
bitmask varies, one bit per each chunk Chunks bitmask; if set, the chunk is encrypted; otherwise, it is not.

The chunks bitmask contains as many bits as the maximum number of chunks inside a file at 100%. If a bit at a specific index is set to 1, the chunk is encrypted. The value 0 means that the chunk is not encrypted. Since the Trojan encrypts files based on the percentage value, it needs to know which chunks were encrypted.
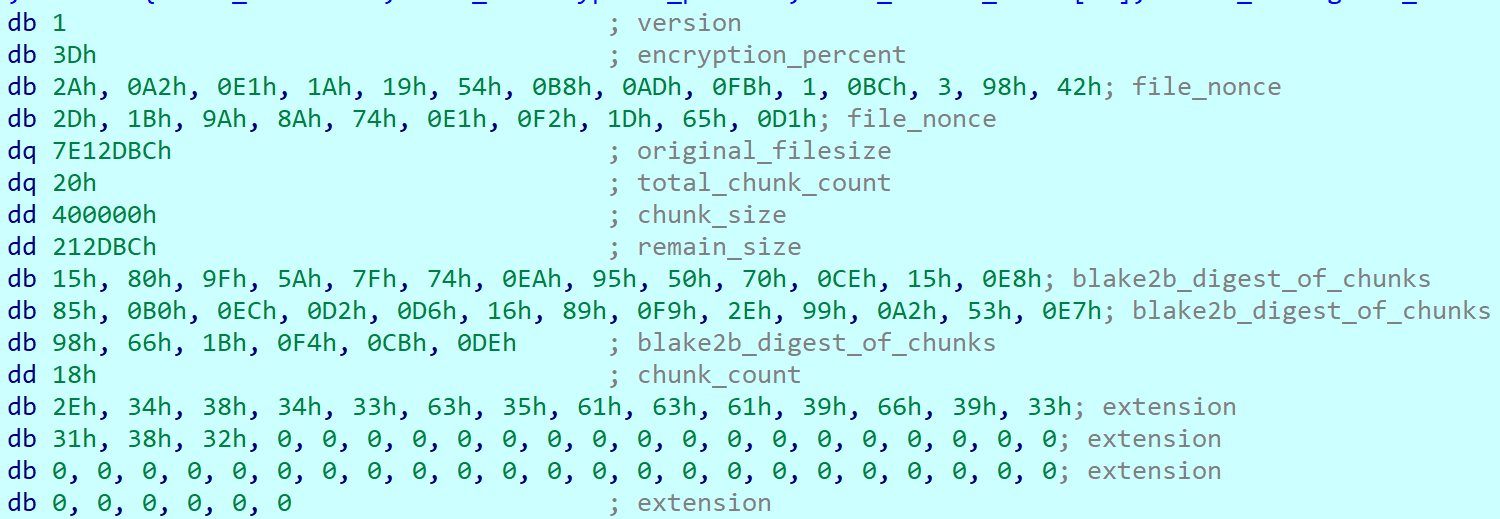
Metadata structure at the end of an encrypted file (without a Poly1305 tags array or bitmask)

Metadata structure at the end of an encrypted file (without a Poly1305 tags array or bitmask)

Encryption Trojan for ESXi and Linux

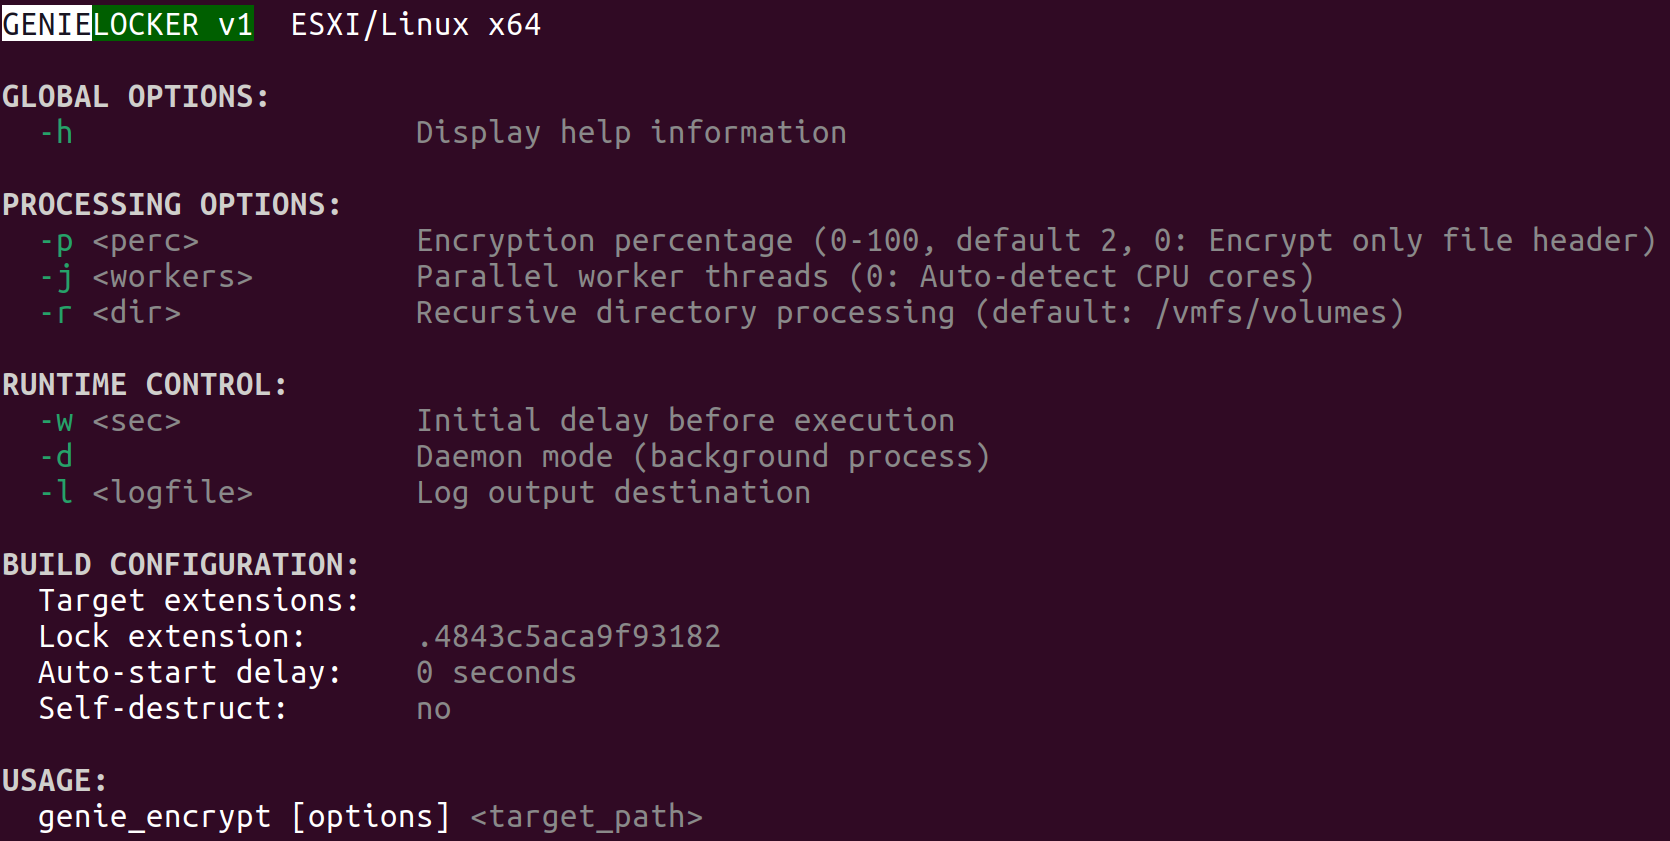
Compared with its Windows counterpart, the Linux and ESXi version of GenieLocker (MD5: 9201e35e2993612612919a3c71302cab) is simpler: there is no secret argument, anti‑debugging techniques, or exclusion lists. However, the sample has ESXi-specific features, such as double‑fork support and the ability to modify the Welcome Message. The sample has the version v1 and, similarly to the Windows version, uses the libsodium library for cryptography.
ESXi version description

ESXi version description

The command‑line help output mirrors LockBit’s styling, reinforcing the theory that GenieLocker’s creators set out to craft a LockBit‑style replacement for their own operations.
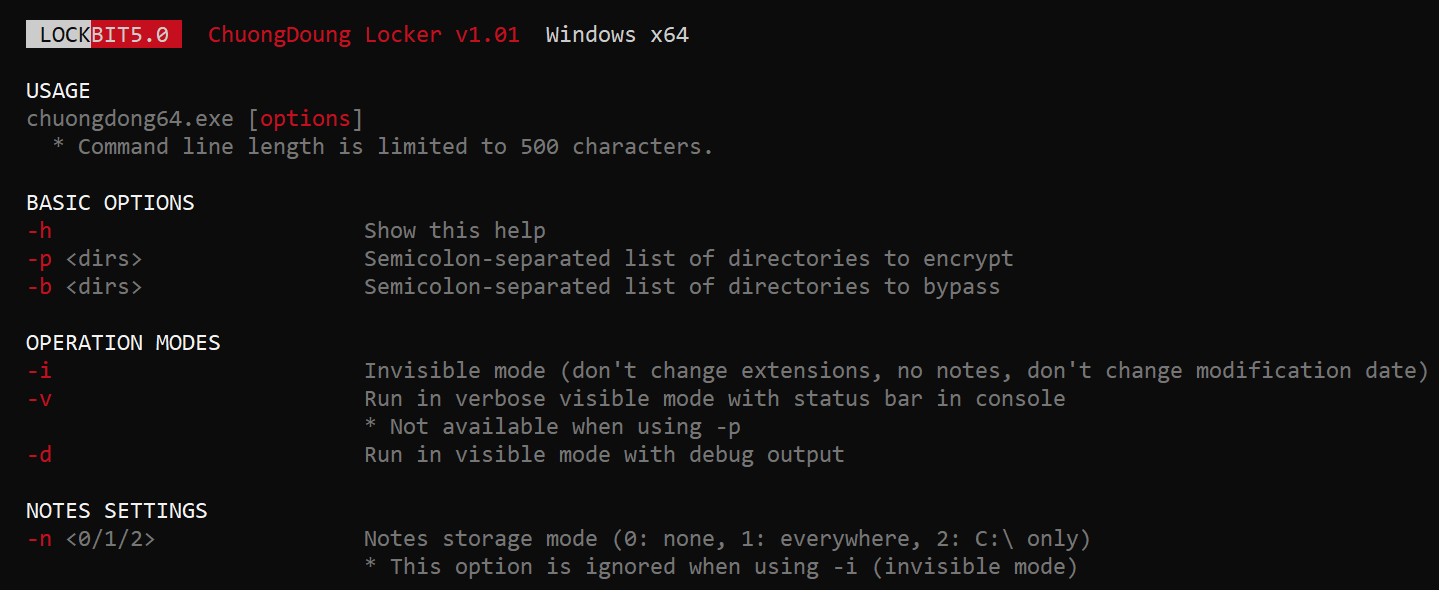
LockBit output design, possibly the source layout for the GenieLocker ESXi variant

LockBit output design, possibly the source layout for the GenieLocker ESXi variant

Based on the default path of the encryption directory /vmfs/volumes, we can assume that this version is intended primarily for ESXi. Nonetheless, it can still be executed on Linux distributions.

Argument Description
-p <perc> Percentage of file content to encrypt
-j <workers> Number of encryption threads
-r <dir> Process directories recursively
-w <sec> Delay before start
-d Daemonizing the process
-l <logfile> Path to log file

ESXi and Linux features

This build allows daemonizing its process with the -d flag, employing the classic double‑fork method so the new process becomes fully detached from its parent.

This variant also modifies the /etc/vmware/welcome file, which contains the Welcome Message (Message of the Day) on the ESXi operating system. On Linux distributions, it does not change anything, because they use different paths for the Message of the Day. In the GenieLocker sample examined here, the message is left empty.

Additionally, the ESXi version supports a few basic features that are not included in the Windows version. For instance, there is a launch‑delay option and the ability to set the number of encryption worker threads. This build also includes several features that already exist in the Windows variant, such as configuring the percentage of a file to encrypt, choosing the target directory, and setting the log file location.

File encryption

The encryption scheme for files is identical to the Windows version. The Trojan uses XChaCha20-Poly1305 to encrypt the file content and metadata, and Curve25519-XSalsa20-Poly1305 for key encryption.
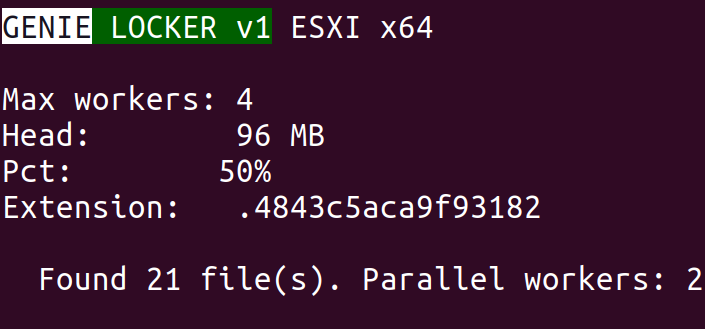
File encryption summary

File encryption summary

Victims

According to KSN telemetry, GenieLocker detections are overwhelmingly concentrated on endpoints located in the Russian Federation. In the March 2026 campaign, the primary sector under siege was manufacturing, with construction trailing closely, followed by financial services, retail, and technology.

Conclusions

Toy Ghouls are ramping up their campaign against Russian enterprises. The rollout of their home‑grown encryption Trojan GenieLocker marks a major upgrade to the group’s ransomware toolkit. By engineering bespoke ransomware that runs natively on Windows, Linux, and ESXi, the actor has cut their dependence on off‑the‑shelf ransomware families and unified the cryptographic backbone across all targeted platforms.

Kaspersky’s products detect this malware as Trojan-Ransom.Win64.Agent.genie, HEUR:TrojanRansom.Win64.Generic, Trojan-Ransom.Linux.Agent.genie.

Indicators of compromise

Additional information about this threat is available to customers of the Kaspersky Threat Intelligence Reporting service. Contact: intelreports@kaspersky.com.

GenieLocker for Windows

A50EAAF514F4F84E61CA2455A8789753 kftd.exe, genie_encrypt.exe
F08F476F26B01D142CA73923DE65FC0C
FD46A80C2F45577263328984EDF7F4DC
DE3CFBB50F66079BFEE20A6F64E59433
780C8F4C6F077DA4DA96582987920362
D87D0B01D95ACC936B7DC47B8F41937A run.exe, genie_encrypt.exe
34A7F28E0BB69B0D49BACC88BDF20AC1 run.exe, run2.exe, genie.exe
5D62C1349B8981C396C9A23F4F8F053C genie_encrypt.exe
A8842616C9057D5CF6E1FE1FA8C3C160
34B8828635F88078735799A3C1AC8E28
D3E06EB34D8EEE7EF92CAC3AD0A20FF5
C68B6862725777651085650DB34947FC consultant.exe
9CD514FF2809CE0B993E3B8649E82A94
824CA1E906CC073EE5B0F3519DF69A8F
25480DAD40152EF3D0C6D38EECC9BD9B
7DAD78584795AA5C160520CC6ACCF260
18F61C6D686CFFD131C9FD3F3437064B tempo.exe, kernel.exe
9969A8221312DBA70DD5CBDDF83A146C
F7B9E36E94163A9A303160945F99267A
B893EAFED0659F70D4AC250F09073723
D661CF666B9ACBAB7CFEAE1127A261A9 genie.exe
3A4479B51890373BFC4A011EF41FE376
58C0DDA52B8F069660166D61FD74F911

GenieLocker for Linux and ESXi

9201E35E2993612612919A3C71302CAB vzdump

C2
89[.]125.66.101

  •  

A new extortion cocktail: office printers, small ransoms, and BitLocker

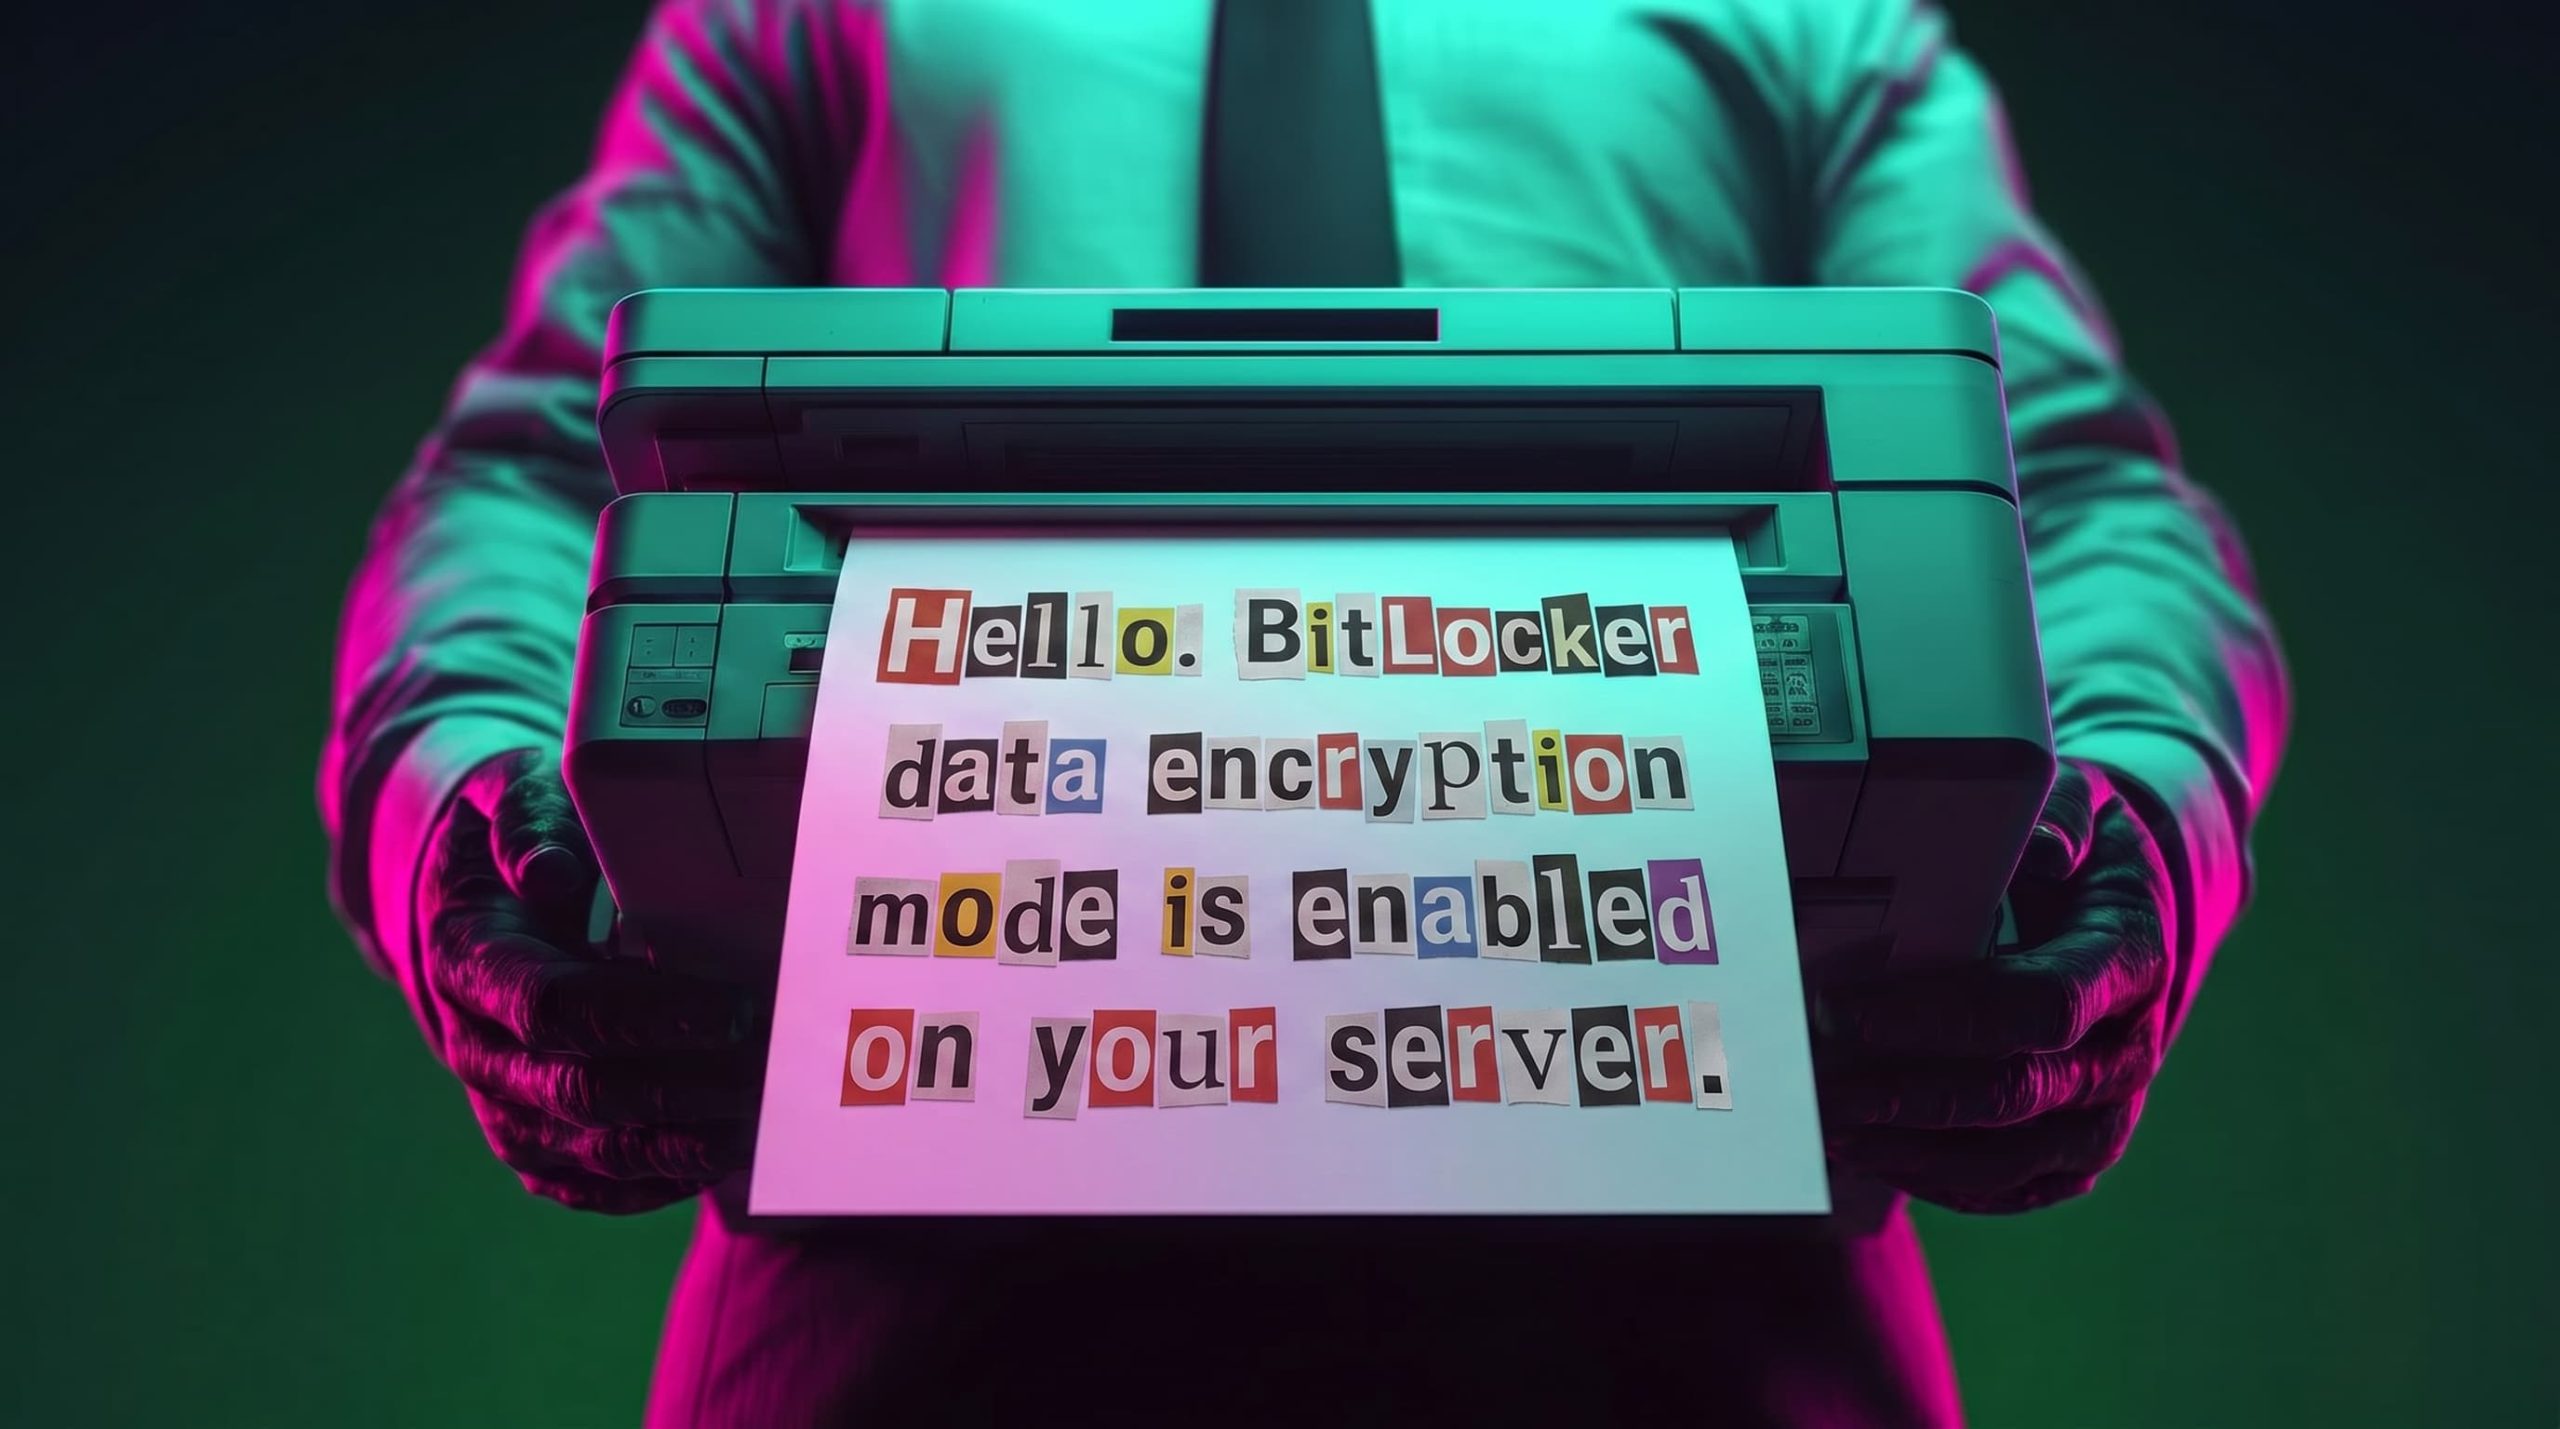
Recently, our teams in Latin America investigated a series of incidents involving misconfiguration, the deployment of BitLocker, and the exploitation of corporate printers. Attackers used the devices to notify organizations that their infrastructure had been compromised and they had to pay a ransom to recover their data.

This article analyzes two incidents that occurred in June in Colombia and in May in Mexico. We highlight the similarities in the attackers’ communications and outline emerging trends in ransom amounts.

Initial sign of an attack

In both cases, the affected users initially noticed a padlock icon next to their drives in Windows Explorer. This indicated that the drive was encrypted with BitLocker, blocking access to its contents.

Drive icon indicating that the drive is locked

Drive icon indicating that the drive is locked

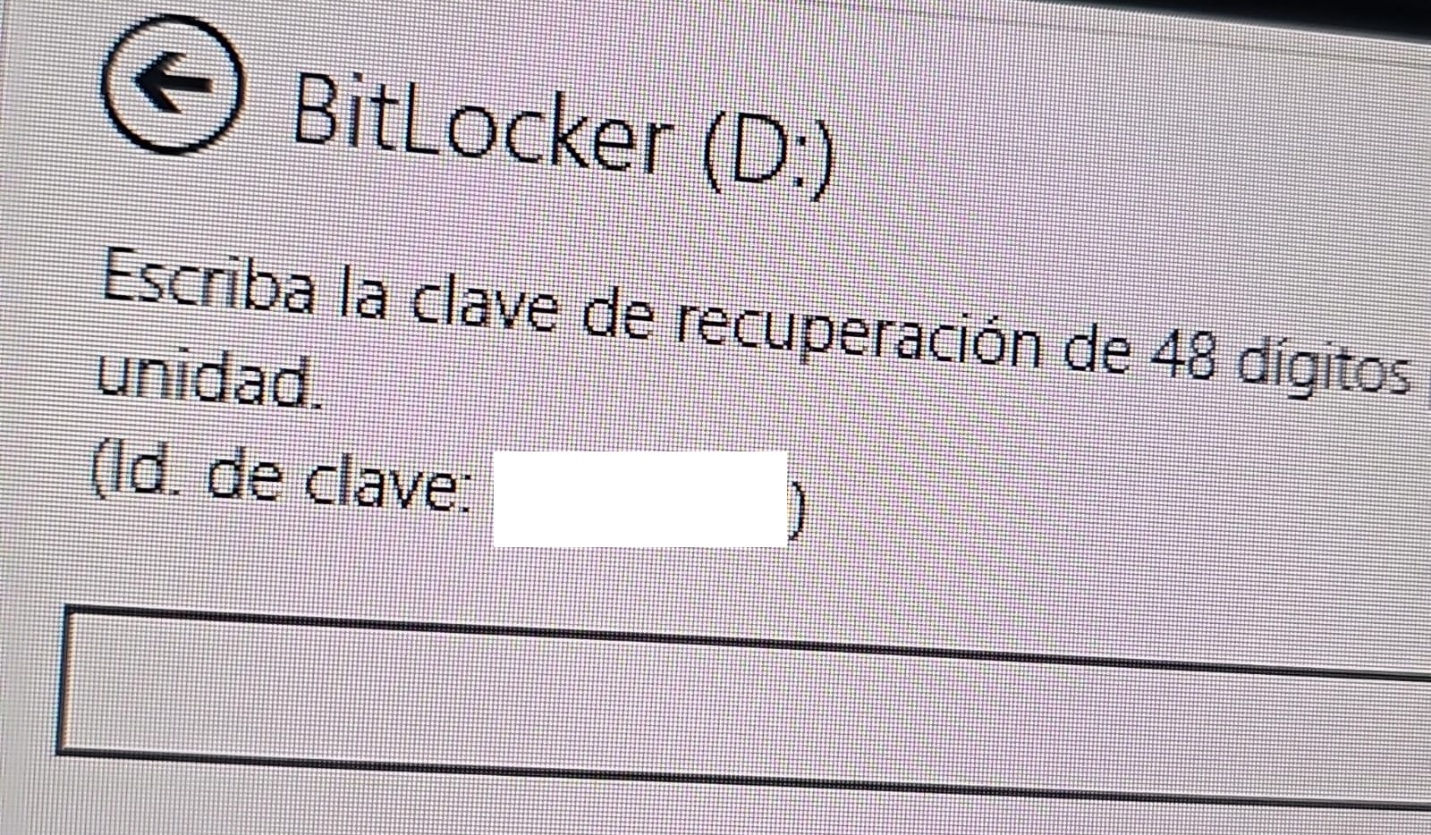
A recovery key was required to unlock the drive.

Attempt to access the disk's contents and the prompt for the BitLocker recovery key

Attempt to access the disk’s contents and the prompt for the BitLocker recovery key

This is not the first time we have seen such threats; a few years ago, our team discovered a threat known as ShrinkLocker, which utilized BitLocker to achieve its goals.

First case: abusing RDP to encrypt data

One of the incidents occurred in Colombia in June. The attackers exploited an internet-exposed RDP service on a machine connected to an 8 TB storage device containing mission-critical data. After taking control of the system and manipulating user credentials, the attackers enabled BitLocker exclusively on the drive that primarily stored financial data. Once the encryption was complete, they locked the drive and used the company’s printers to produce ransom notes.

Ransomware note

Ransomware note

Unfortunately, it was not possible to obtain evidence in the case due to the company’s rush to restore the encrypted disk. The communication with the attackers revealed a demand for just $3,000, and the company considered paying the ransom. After that, the system was restored before the forensic team could take any action, eliminating the evidence needed to assess the incident.

Attacker's reply to the victim's email sent to the address in the printed ransom note

Attacker’s reply to the victim’s email sent to the address in the printed ransom note

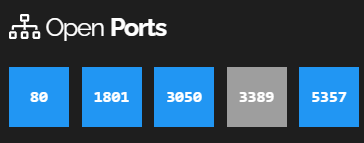
This attack was made possible by an internet-facing remote desktop service (RDP) with additional open ports, which employees used to access corporate information. By exploiting this network exposure and misconfiguration, attackers breached the system, identified an additional drive, and leveraged BitLocker to encrypt the data and demand a ransom payment. Leaving RDP ports open without proper security controls jeopardizes the security of systems and information, as highlighted in the our “Global Report: Anatomy of a Cyber World“.

Exposed ports identified in the system in recent months

Exposed ports identified in the system in recent months

The company confirmed that, due to compatibility issues with applications required for operation, EPP (Endpoint Protection Platform) protection was disabled on the system, making it easier for attackers to validate, enumerate, and execute applications without revealing malicious activity to central monitoring systems.

Second case: meet the XEntry Team

In another incident, which occurred in Mexico in May, our team identified how the threat actor gained initial access to the infrastructure. They exploited a misconfigured MSSQL service. This allowed them to execute commands on the system after obtaining the database login credentials from code insecurely published on GitHub.

XEntry team attack

XEntry team attack

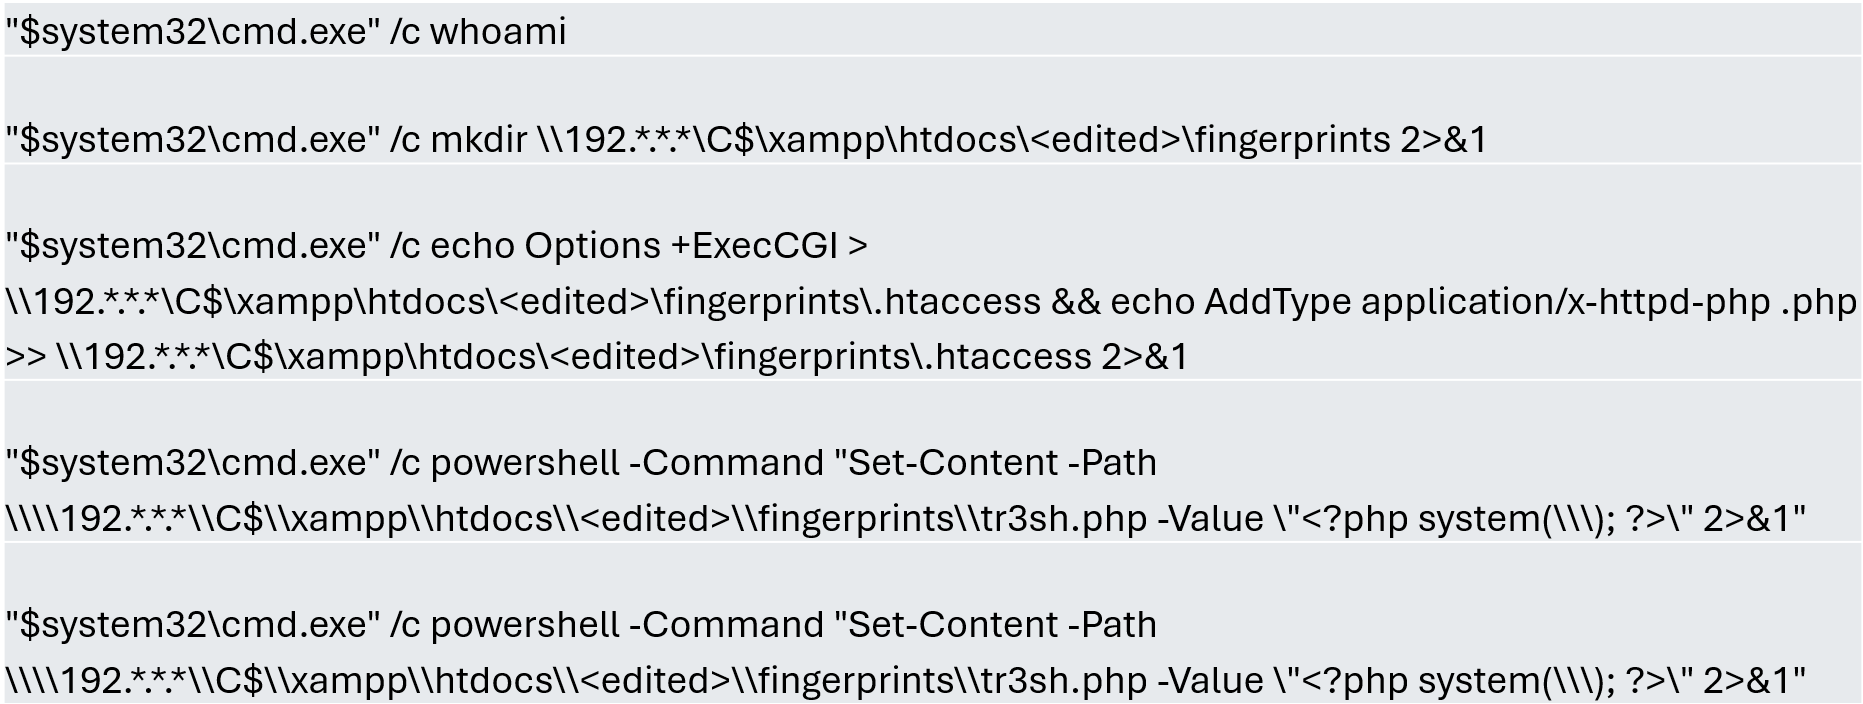
In this incident, the attack began three months prior to detection, with the intruder discovering and verifying their access to the environment. After confirming their access and privilege level within the MSSQL server settings, which extended beyond the DBMS to the underlying operating system, the attackers initially focused on manipulating certain aspects of the web server configuration on the same system. They lowered the server’s security settings and created web shell files in the publicly accessible folders. Many of these attempts to manipulate the service or create malicious files were contained by existing EPP security controls, but despite the alerts, the necessary investigation to address the activity was not conducted.

Commands executed when attempting to manipulate the web server

Commands executed when attempting to manipulate the web server

The attackers subsequently confirmed their ability to execute commands locally and set up their attack infrastructure to transmit data via a communications bridge. By exploiting the MSSQL service, they gained access to each of the organization’s internal systems.

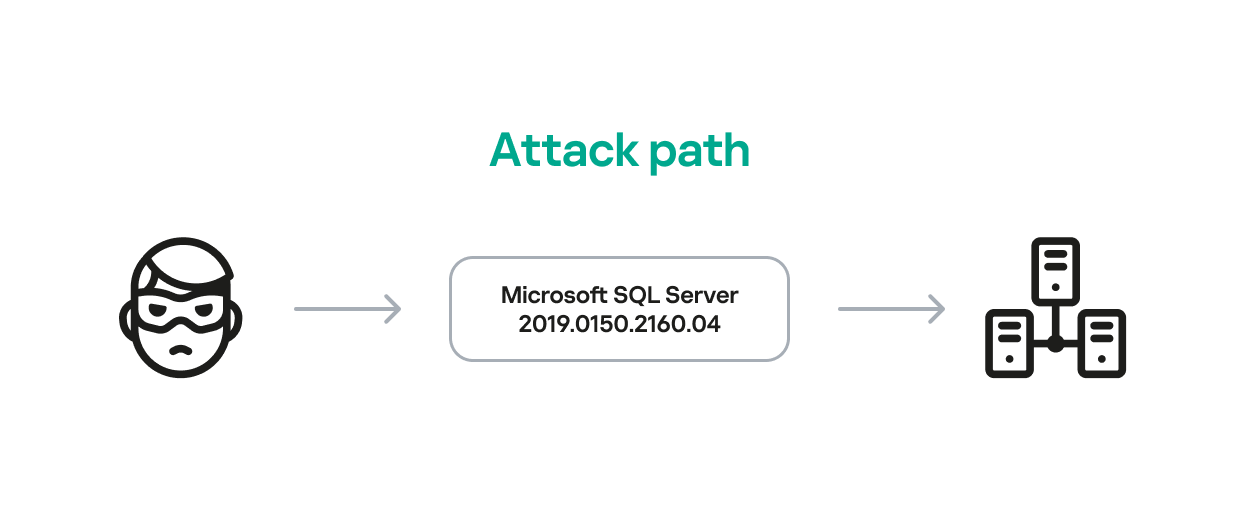
The database engine used by the company was Microsoft SQL Server 2019.0150.2160.04, misconfigured to allow operating system сommand execution via the xp_cmdshell extended stored procedure.

Due to this misconfiguration of an internet-exposed service, the attackers established a channel capable of executing any type of command directed at the server and the local infrastructure within its scope.

Attack path

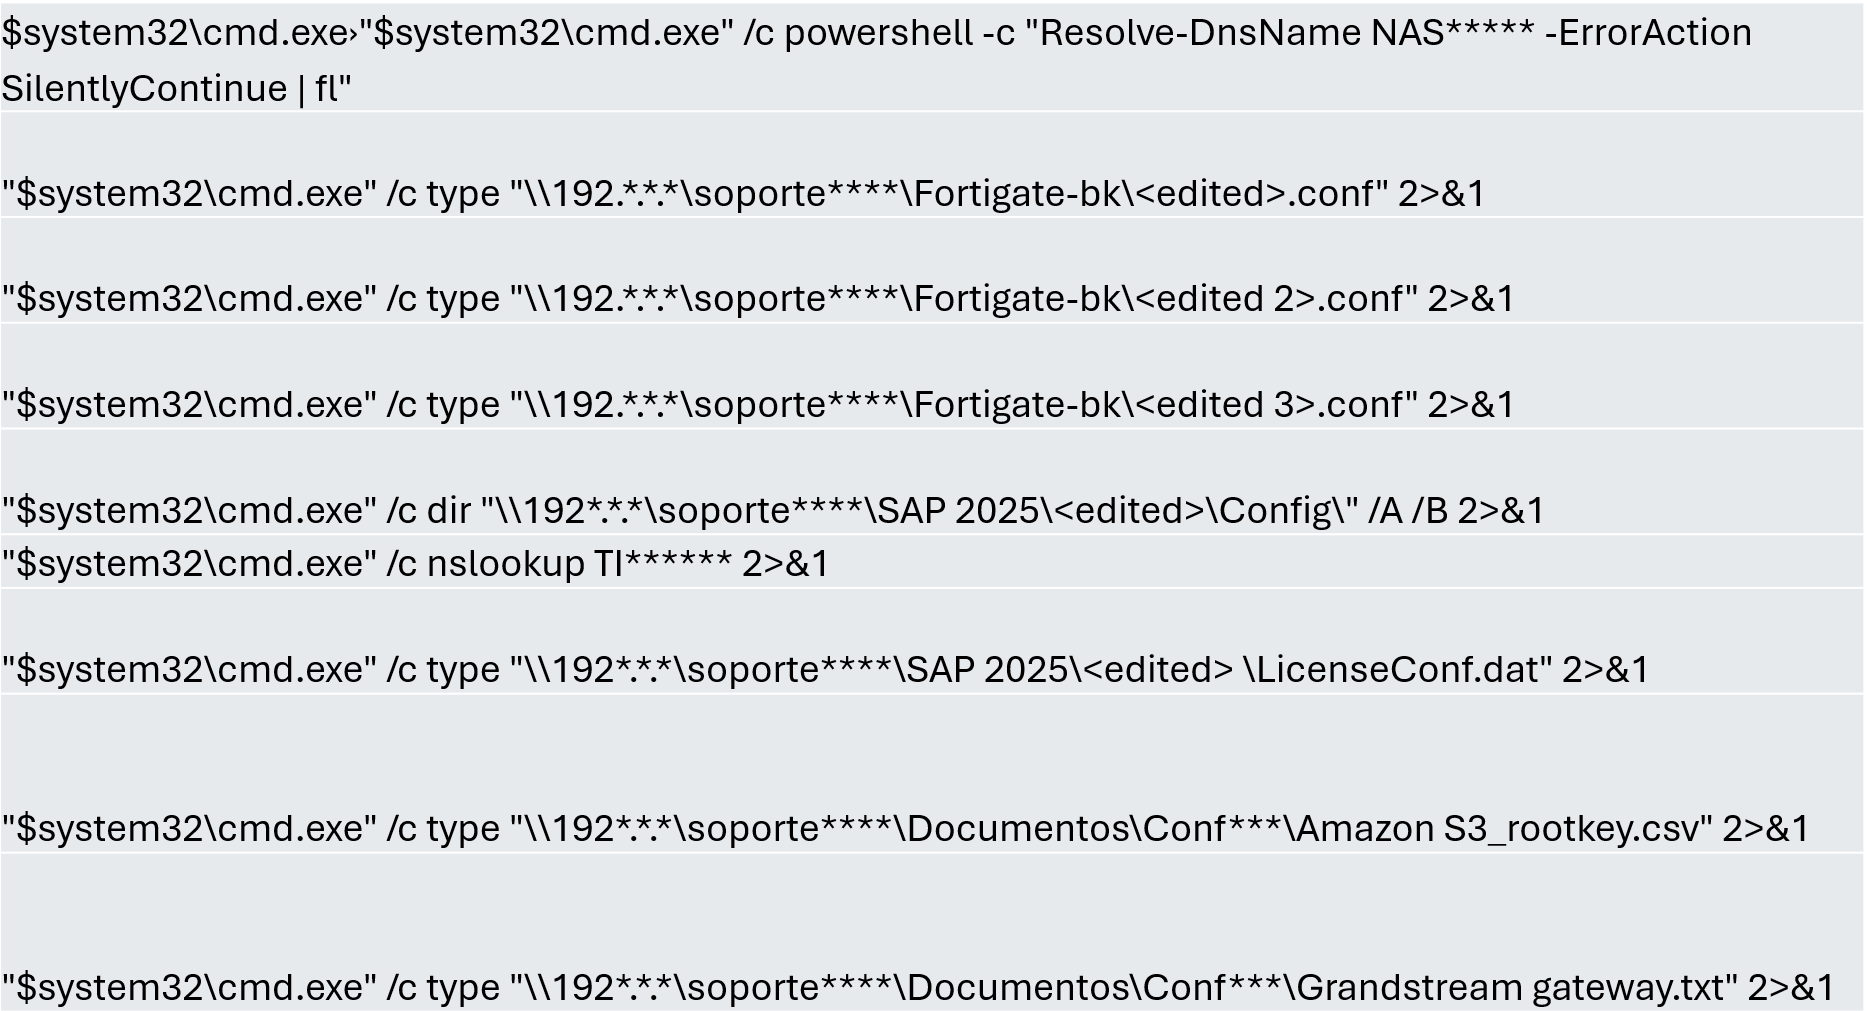
One of the main objectives was to identify shared systems and resources that provided access to critical information. Our analysis confirmed the attackers’ access to systems storing configuration parameters for networking, enterprise management, and cloud services, among others.

A subset of the critical information identified and collected by the attackers

A subset of the critical information identified and collected by the attackers

In early May, the attackers focused on running additional scans and deploying ManageEngine’s Endpoint Central RMM (Remote Monitoring and Management) to establish persistence and begin the final stages of their intrusion.

Scanning and RMM deployment

Scanning and RMM deployment

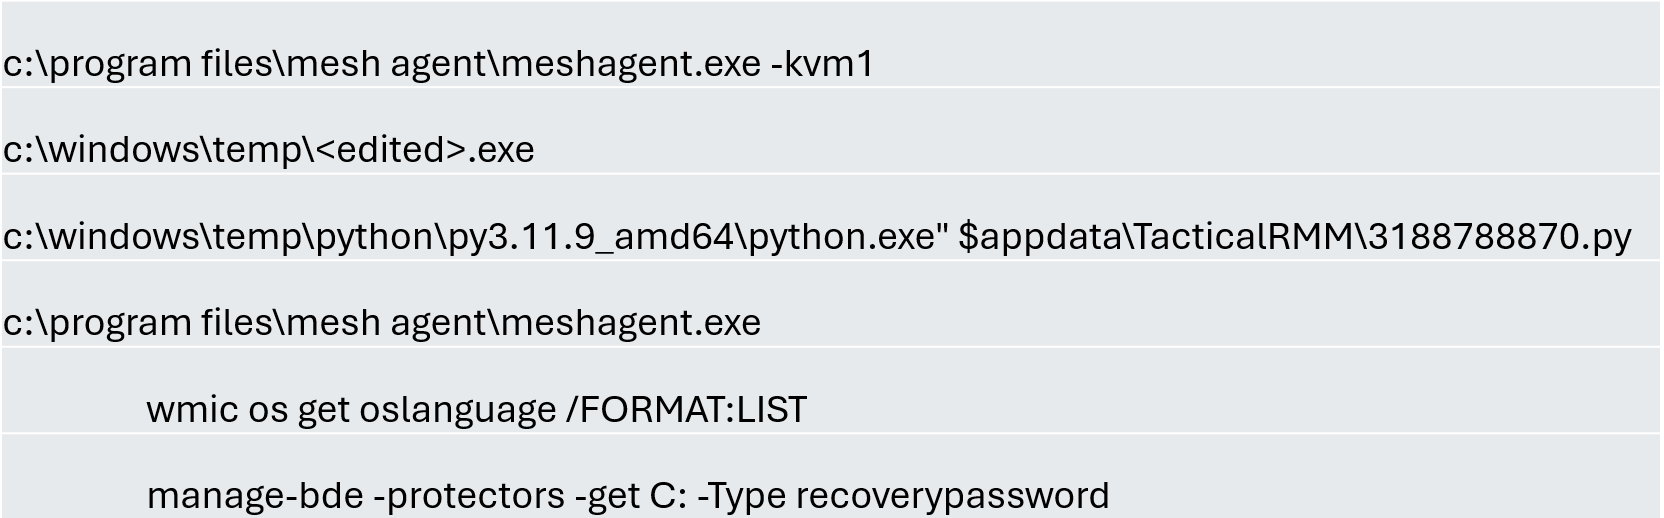
Further RMM-type applications, such as Mesh Agent and Tactical RMM, were installed in the days that followed. These were used to deploy scheduled tasks responsible for enabling the BitLocker service and individually encrypting the infrastructure’s disks, generating a key for each encrypted system.

Commands executed through RMM tools to collect Bitlocker keys

Commands executed through RMM tools to collect Bitlocker keys

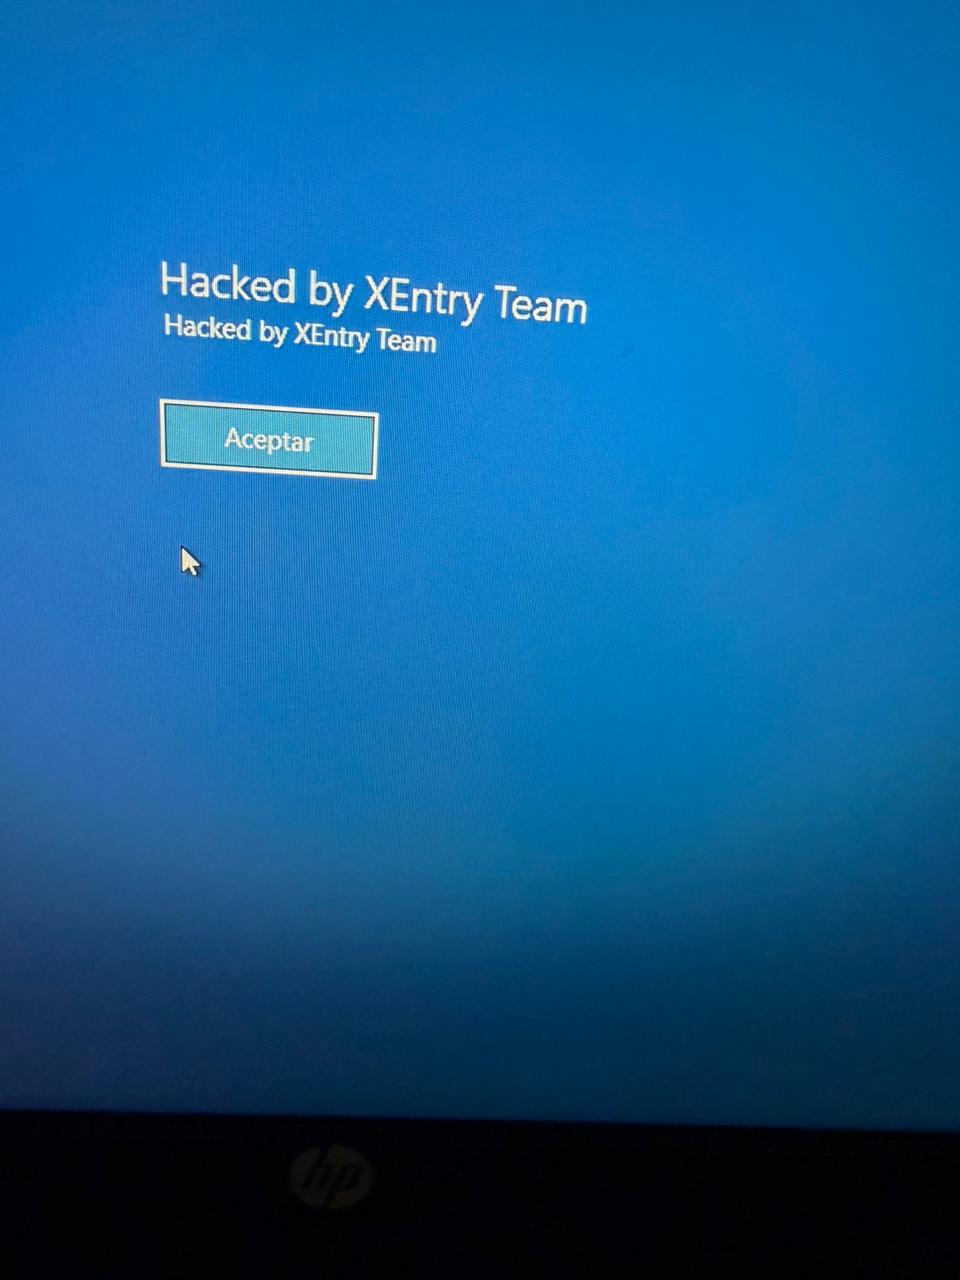
Finally, in mid-May, the attackers managed to execute a Group Policy Object (GPO) used to deploy activation and encryption tasks, as well as other policies responsible for continued deployment of RMM applications via scheduled tasks. The activity initially targeted critical systems but later spread to every system synchronized with the domain controller. Users became aware of the attack when their machines displayed a blue screen with the message “Hacked by XEntry Team”, and their credentials stopped working to access their systems.

A few hours later, ransom notes began emerging from office printers.

Ransom note printed by the XEntry team

Ransom note printed by the XEntry team

These cases confirm that adversary’s objective is to gain access to infrastructure while avoiding investment in or partnership with ransomware groups. Instead, they leverage built-in Microsoft tools to facilitate data encryption and ransom payments. Monitoring and centralizing logs on protected resources, as well as promptly managing alerts, are critical to countering this type of intrusion.

Conclusions

  • Although the systems under review had security measures in place, there was a lack of proper alert management or inadequate decisions regarding application incompatibilities.
  • We strongly recommend configuring the Remote Desktop Protocol (RDP) in strict accordance with cybersecurity best practices to prevent unauthorized access. This is especially critical: according to our Global Report: Anatomy of a Cyber World, more than 13% of incidents are related to policy violations and configuration errors, confirming that misconfigurations continue to pose a significant risk.
  • Organizations should prioritize strict application control policies and active monitoring of network traffic for command-and-control (C2) communications. This is especially critical: according to the same report, more than 20% of incidents involved the abuse of RMM (Remote Monitoring and Management) tools for execution and C2 strategies. The fact that attackers used more than three distinct tools to gain control during a single incident further underscores the urgent need for these measures.

  • Some questions remain unanswered due to a lack of evidence and a hasty system restoration effort that bypassed critical stages of the incident response process. It is important to ensure an adequate incident response procedure, preserving evidence to confirm all related activities, and adjusting or proposing controls to prevent future incidents involving similar TTPs.
  • Although the ransom notes do not reveal a clear connection between the actors, certain words used in the messages, as well as the method of delivery and communication, may confirm a link:

“As a guarantee, we have no negative online reviews about non-fulfillment of our obligations…” (Ransom note from the first case)

“Our reputation is the guarantee that all content will be fulfilled…” (Ransom note from the second case)

Our teams continue to monitor these threats.

Detection signatures

  • Trojan.Multi.Agent.gen
  • Trojan.Win32.GenAutorunMsSqlServerCommandRun.a
  • Trojan.Win32.Generic
  • Exploit.Win32.SCShell.a

  •  

Threat landscape for industrial automation systems. Q1 2026

All threats

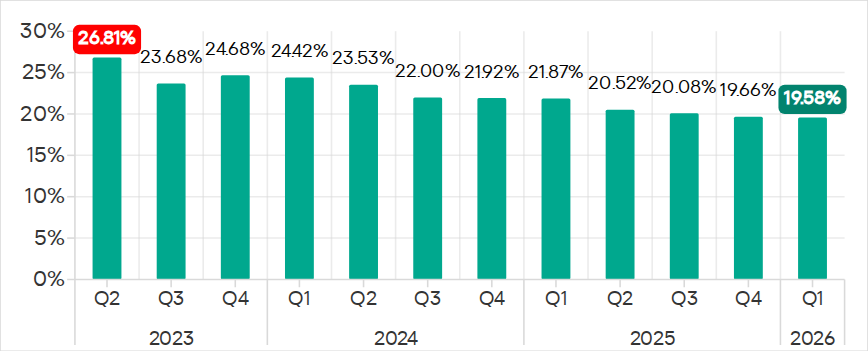
The percentage of ICS computers on which malicious objects were blocked continued to decrease, reaching 19.6% in Q1 2026. This is the lowest value in three years, and it is 1.4 times lower than in Q2 2023.
Percentage of ICS computers on which malicious objects were blocked, Q2 2023–Q1 2026

Percentage of ICS computers on which malicious objects were blocked, Q2 2023–Q1 2026

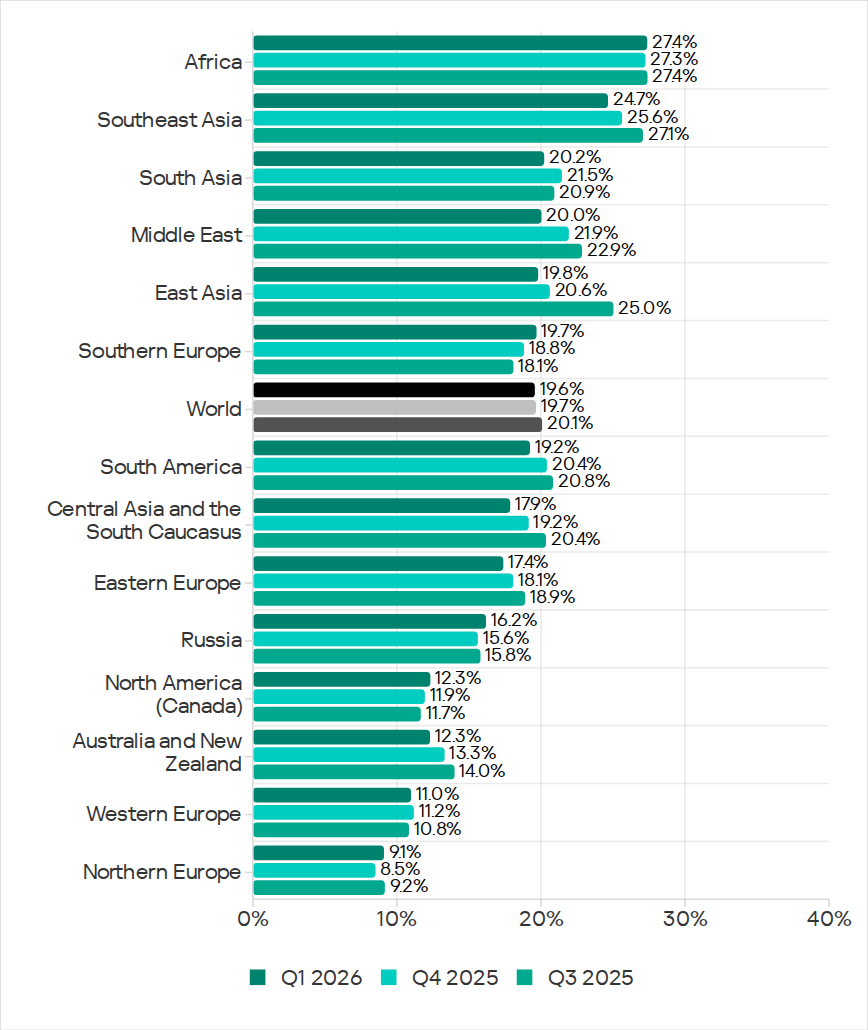
Regionally, the percentages ranged from 9.1% in Northern Europe to 27.4% in Africa.

Regions ranked by percentage of attacked ICS computers

Regions ranked by percentage of attacked ICS computers

The percentage of ICS computers on which malicious objects were blocked increased in five regions over the quarter, most notably in Southern Europe, Northern Europe, and Russia.

In Q1 2026, Southern Europe led the way in growth for internet and email threats. The region also saw the fastest growth in spyware, as well as malicious scripts and phishing pages.

In Russia, the percentage of ICS computers on which malicious objects were blocked exceeded the figures for the previous two quarters. Russia saw an increase in the percentage for threats from the internet, and a slight increase in the figure for threats from email clients (Russia is one of three regions where this figure did not decrease).

Among the threat categories, the greatest increases were observed in the percentages for denylisted internet resources, as well as spyware (distributed in the region via the internet and email clients).

Selected industries

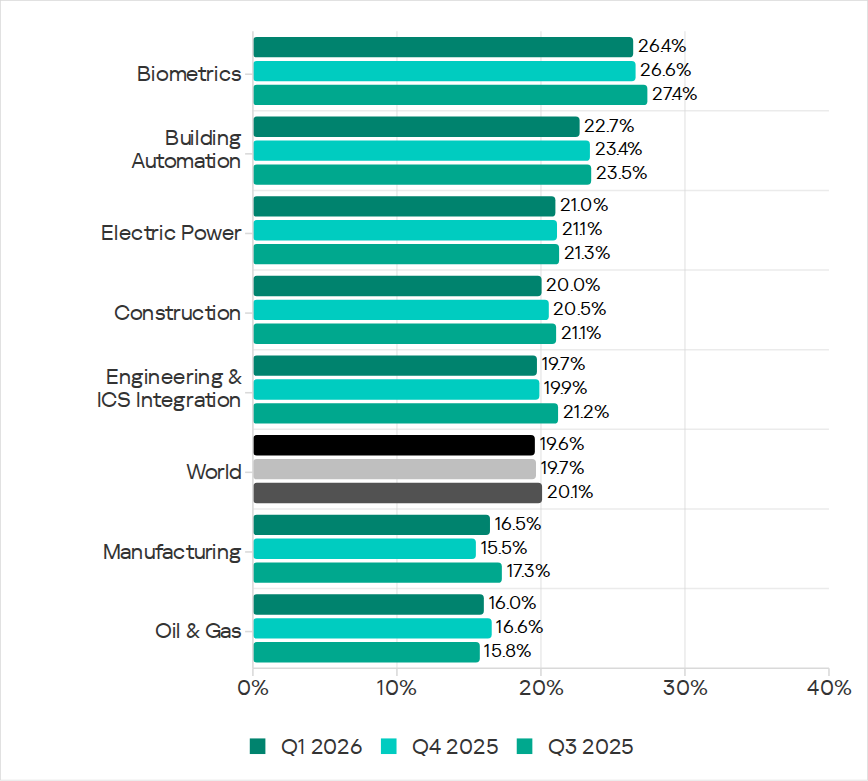
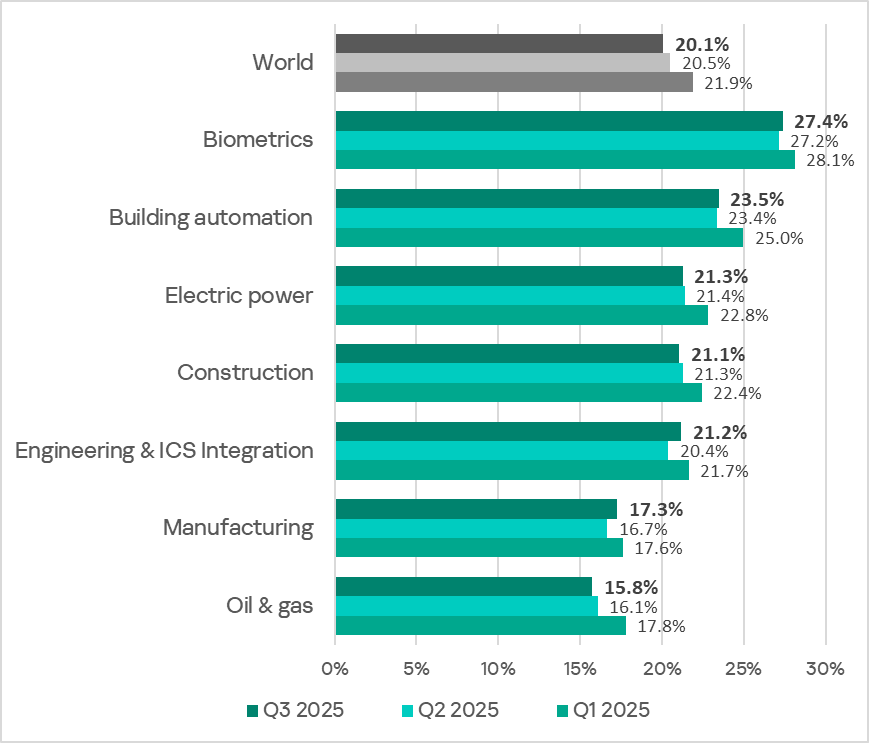
Biometric systems (26.4%) traditionally rank top among the industries and OT infrastructure types covered in this report in terms of the percentage of ICS computers on which malicious objects were blocked. These systems are characterized by internet access, extensive email use for data exchange and approvals (such as access granting), and, in many cases, minimal cybersecurity controls within the organizations that use these systems.

Industries ranked by the percentage of ICS computers on which malicious objects were blocked

Industries ranked by the percentage of ICS computers on which malicious objects were blocked

Biometric systems rank first among industries in terms of email threats. At the same time, unlike other industries, the percentage for email threats in biometric systems exceeds that for internet threats.

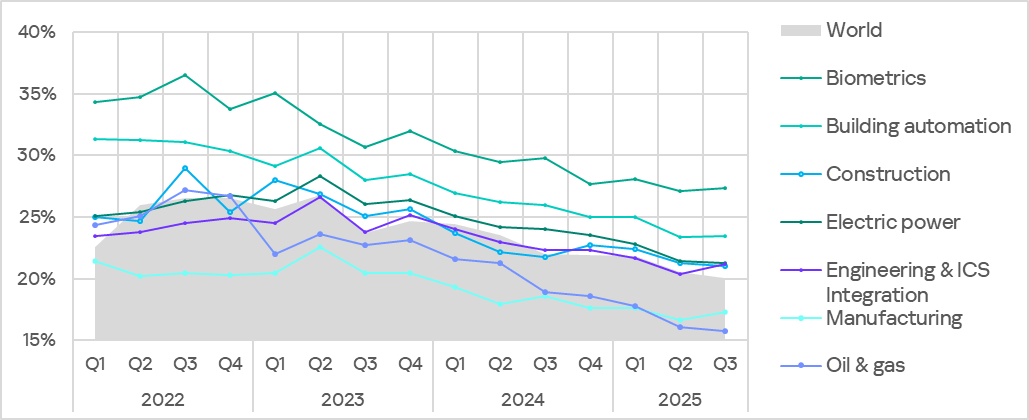
In all selected industries, the global average follows a downward trend. In Q1 2026, the percentage of ICS computers on which malicious objects were blocked increased only in the manufacturing sector — by 1.0 pp. The percentages for this industry increased across 10 regions, with the most notable increases in Western Europe, Northern Europe, and Russia.

Threat categories

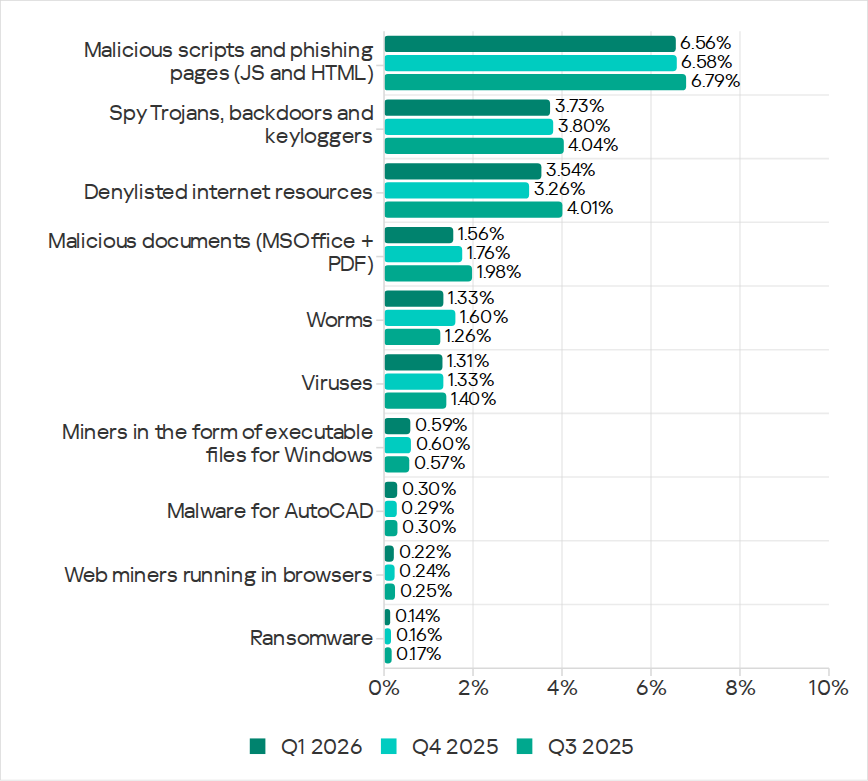
In Q1 2026, Kaspersky security solutions blocked malware from 10,052 different malware families of various categories on industrial automation systems.

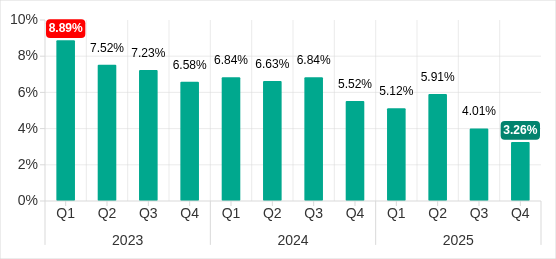
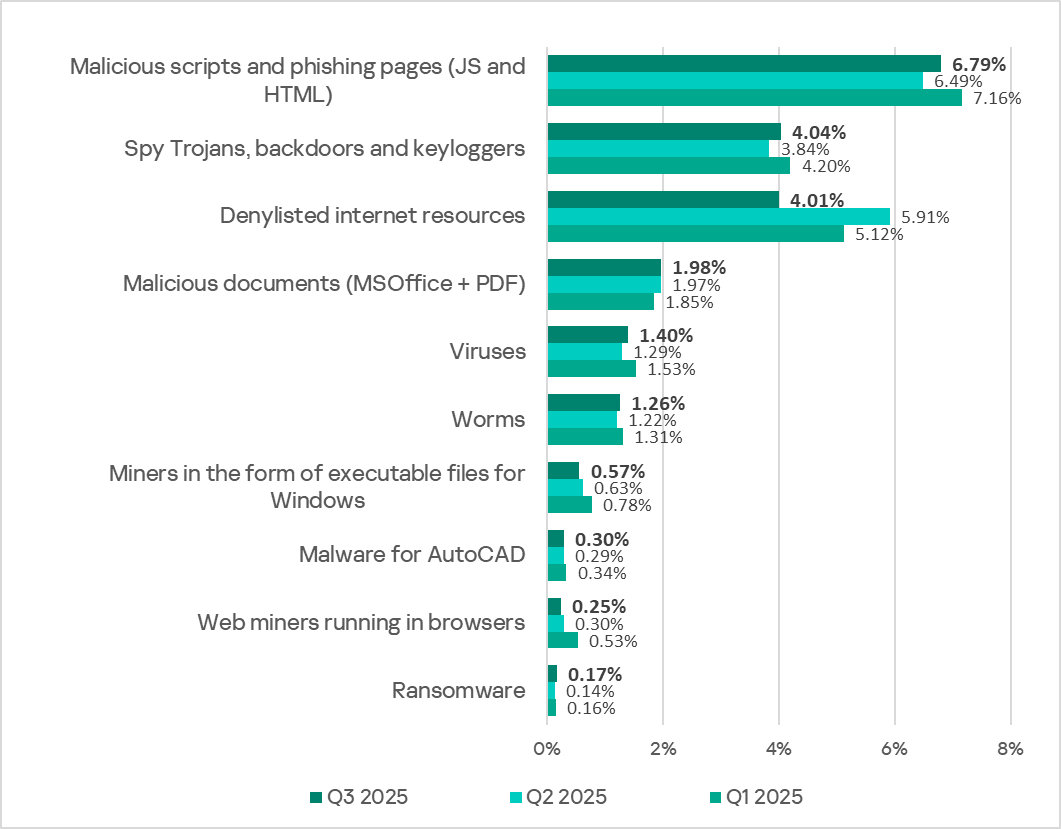
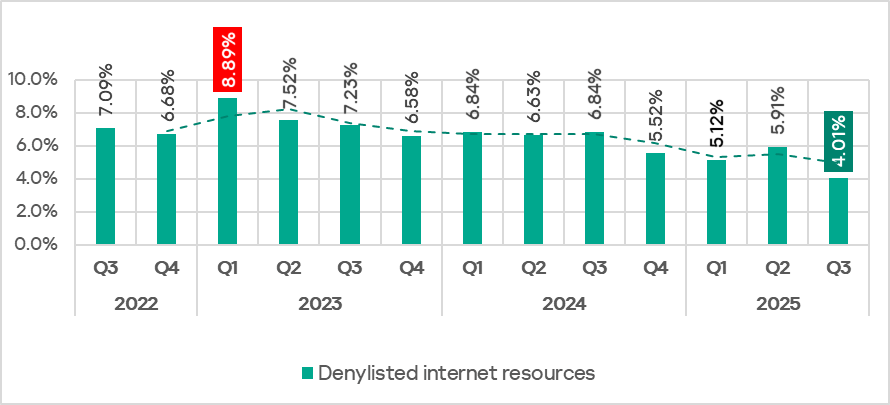
Over the quarter, the percentage of ICS computers on which denylisted internet resources were blocked increased (after decreasing over the previous two quarters), and there was a slight increase in the percentage for AutoCAD malware.

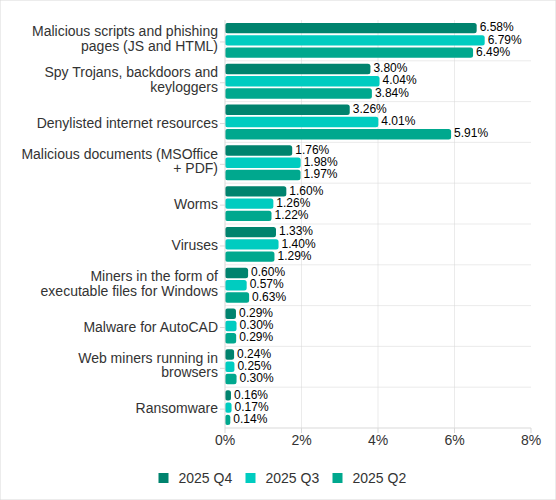
Percentage of ICS computers on which the activity of malicious objects from various categories was prevented

Percentage of ICS computers on which the activity of malicious objects from various categories was prevented

Malicious scripts and phishing pages (JS and HTML)

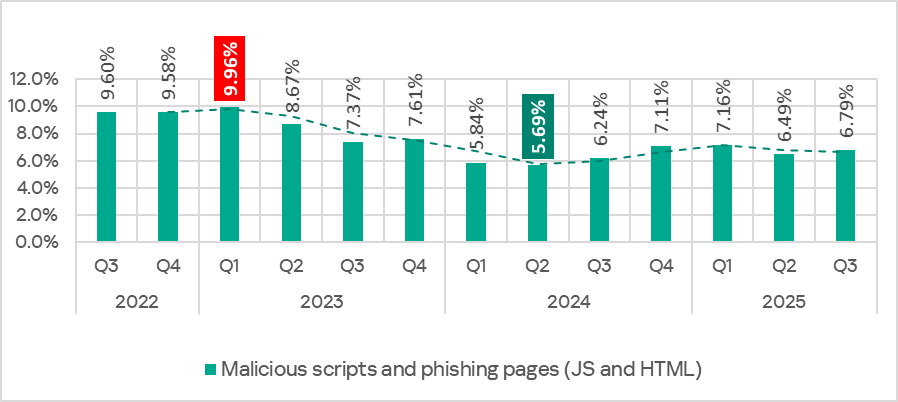
Malicious scripts and phishing pages retained their to spot among threat categories by the percentage of ICS computers on which these threats were blocked. The global average in Q1 2026 was 6.56%.

Over the quarter, the percentages increased in four regions. The most significant change was observed in Southern Europe (9.85%, +0.94 pp). The figures for malicious scripts in the region increased over three consecutive quarters.

Among the selected industries, across all regions, the highest percentages for the malicious scripts and phishing pages category were recorded for biometric systems (19.59%) and building automation (15.43%) in Southern Europe. These same industries lead in similar rankings for malicious documents and spyware.

Spyware

The percentage of ICS computers on which spyware was blocked decreased over two consecutive quarters, dropping to 3.73%. Despite the decline, spyware has ranked second among threat categories by the percentage of attacked computers for three consecutive quarters.

The percentages increased in five regions over the quarter, most notably in Southern Europe (5.46%, +0.35 pp) and Russia (2.84%, +0.24 pp).

In Southern Europe, the percentage of ICS computers on which spyware was blocked increased in all the selected industries except manufacturing. The greatest increase was observed in biometric systems.

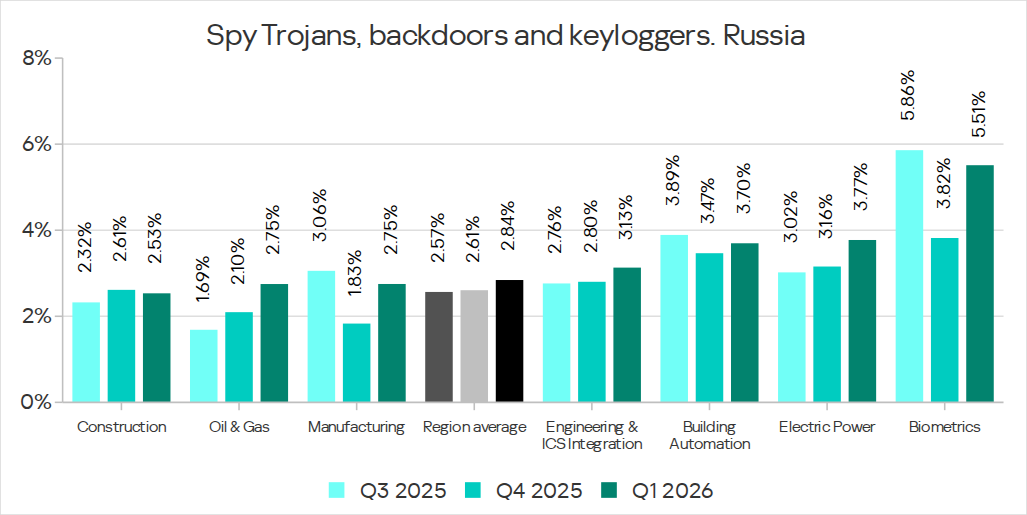
Among the selected industries, the highest percentage of spyware in Russia was recorded in biometric systems. That said, the percentage of ICS computers on which spyware was blocked increased in all industries in the region except construction. The percentage figure has been increasing for two consecutive quarters in the oil and gas industry (by a factor of 1.63 over six months), and for three consecutive quarters in engineering and ICS integration, as well as electric power. In the remaining sectors, the values have been fluctuating.

Percentage of ICS computers on which spyware was blocked in various industries in Russia, Q3 2025–Q1 2026

Percentage of ICS computers on which spyware was blocked in various industries in Russia, Q3 2025–Q1 2026

Denylisted internet resources

The percentage of ICS computers on which denylisted internet resources were blocked increased to 3.54%.

The most notable increase over the quarter occurred in Southeast Asia (4.58%, +0.65 pp). Among the industries in the region, the highest percentage figures for this threat category were recorded in electric power and construction. Over the quarter, the largest increases in percentages figures were observed in the electric power and manufacturing industries.

In North America (Canada), denylisted internet resources (2.14%) showed the greatest increase among all categories — by a factor of 1.22.

Among the selected industries across all regions, the highest percentage figures for the denylisted internet resources category were in the electric power (7.11%) and construction (6.25%) industries in Southeast Asia.

Malicious documents (Microsoft Office + PDF)

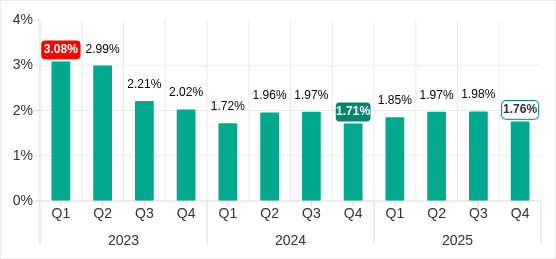
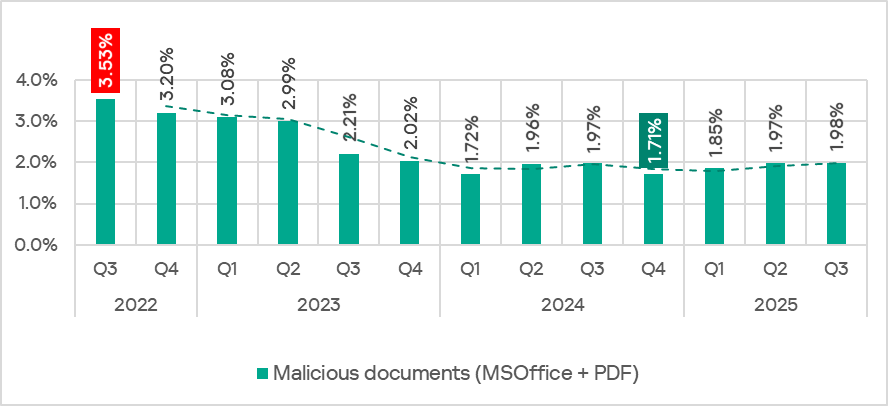
The percentage figure for this category decreased over two consecutive quarters, reaching its lowest value (1.56%) for the entire period of observations in Q1 2026. It increased just in two regions: Australia and New Zealand (1.12%, +0.04 pp), and Russia (0.62%, +0.01 pp).

Among the selected industries across all regions, the highest percentages for malicious documents were recorded for biometric systems (9.02%) and building automation (6.97%) in Southern Europe. These same industries also lead in similar rankings for malicious scripts and spyware.

Ransomware

The percentage of ICS computers on which ransomware was blocked has decreased for two consecutive quarters, dropping to 0.14%. This is the lowest value among all categories.

The percentage increased in two regions: North America (Canada) (0.11%, +0.04 pp) and slightly in Northern Europe (0.06%, +0.01 pp).

Among the selected industries across all regions, the highest percentages for ransomware were recorded in the oil and gas and manufacturing industries (0.92% and 0.65%, respectively) in Central Asia and the South Caucasus, and in biometric systems (0.89%) in Russia.

Miners in the form of executable files for Windows

The percentage of ICS computers on which miners in the form of executable files for Windows were blocked decreased to 0.59%.

The percentage increased in seven regions. The largest increase was observed in Africa (0.63%, +0.16 pp). Among the selected industries, the largest increases in the region were in the manufacturing and oil and gas industries.

Among the selected industries across all regions, the highest percentages for miners in the form of executable files were recorded in construction (1.99%), biometric systems (1.98%), and the oil and gas industry (1.97%) in Central Asia and the South Caucasus.

Web miners

The percentage of ICS computers on which web miners were blocked has been declining for a year, and in Q1 2026, it reached the lowest value for the entire period under review (0.22%).

At the same time, the percentage increased in seven regions. The largest increases were observed in South Asia (0.28%, +0.11 pp), the Middle East (0.31%, +0.09 pp), and Africa (0.34%, +0.08 pp). Despite the increases, the percentages in these regions for Q1 2026 did not exceed those observed in 2023–2024 and in Q1 2025.

Among the selected industries across all regions, the highest percentages for web miners were recorded for biometric systems (0.97%) in Russia. Biometric systems in South Asia (0.79%) ranked second, and the electric power sector in Southeast Asia (0.76%) ranked third.

Worms

The percentage of ICS computers on which worms were blocked decreased to 1.33%.

The percentage decreased across all regions following an increase in the previous quarter (due to a wave of phishing attacks that distributed the Backdoor.MSIL.XWorm backdoor worm across all regions of the world).

Among the selected industries across all regions, the highest percentage figure for worms was recorded for biometric systems (4.80%) in Central Asia and the South Caucasus. Two industries in Africa – biometric systems (4.04%) and electric power (3.53%) – took the second and third spots, respectively.

Viruses

The percentage of ICS computers on which viruses were blocked decreased to 1.31%.

The top 3 regions by this figure remained the same: Southeast Asia (6.11%, first by a wide margin), Africa (4.15%), and East Asia (2.97%). These same regions are also among the leaders by the percentage of systems affected by AutoCAD malware. The largest increase in this figure was observed in Africa (+0.41 pp).

Among the selected industries across all regions, the highest percentages for viruses were recorded in the construction industry (6.35%) and building automation (5.50%) in Southeast Asia.

Malware for AutoCAD

The percentage of ICS computers on which malware for AutoCAD was blocked increased to 0.30%.

The most notable increase over the quarter was observed in Africa, with the region’s percentage figure rising by 0.47 pp, a very significant increase for this category, and almost doubling (to 0.91%).

Among the selected industries across all regions, the highest percentages for AutoCAD malware were recorded in the construction industry in East Asia (5.58%) and Southeast Asia (3.87%).

Main threat sources

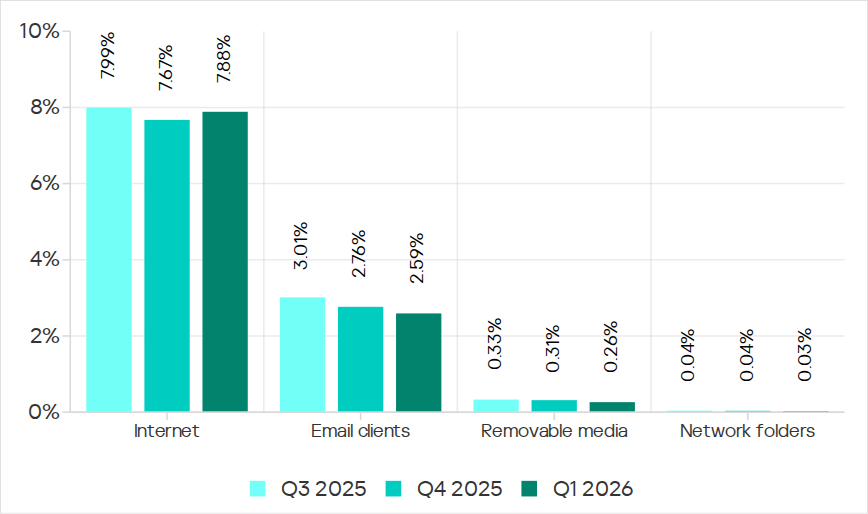
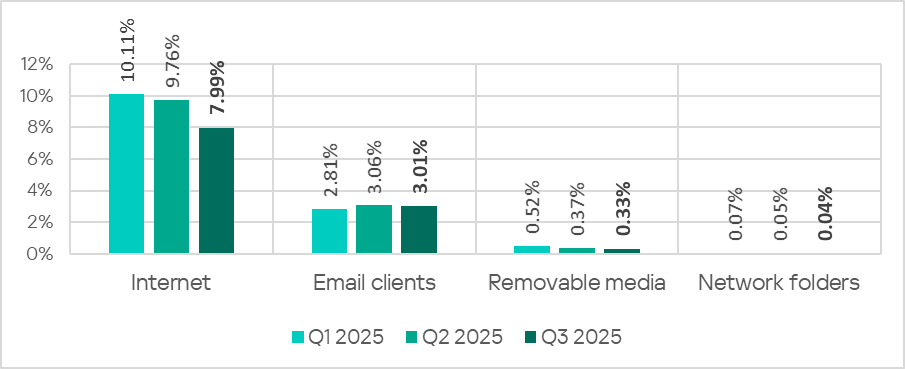
In Q1 2026, the average percentages across all threat sources, except threats from the internet, decreased globally.

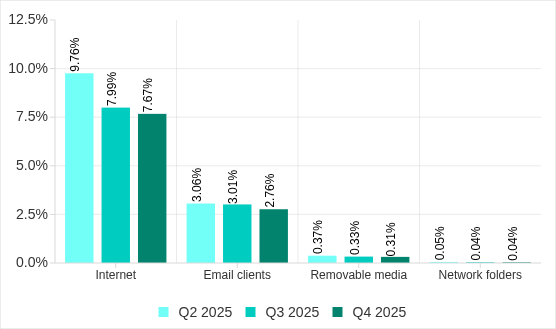
Percentage of ICS computers on which malicious objects from various sources were blocked

Percentage of ICS computers on which malicious objects from various sources were blocked

Internet

The percentage of ICS computers on which threats from the internet were blocked increased to 7.88%. However, over the past three years, the percentage figure for internet threats has followed a downward trend.

The largest increases in the percentages were recorded in Southern Europe (8.59%, +0.59 pp), Southeast Asia (10.16%, +0.55 pp), and Northern Europe (4.47%, +0.51 pp).

Among the selected industries across all regions, the highest percentages for threats from the internet were recorded in electric power (13.16%) and construction (12.55%) in Southeast Asia, and in the engineering and ICS integration sector (12.33%) in South Asia.

Email clients

The percentage of ICS computers on which threats delivered via email clients were blocked decreased to 2.59%. This is a three-year low.

The percentage of this threat source increased in three regions: Southern Europe (6.54%, +0.2 pp), East Asia (1.5%, +0.09 pp), and slightly in Russia (0.7%, +0.04 pp).

Among the selected industries across all regions, the highest percentages for email threats were recorded for biometric systems (19.78%) and building automation (12.34%) in Southern Europe. In these two industries, the percentage of ICS computers on which email threats are blocked is higher than the percentage for threats from the internet. A similar situation was observed in two other instances, both in biometric systems (in South America and Southeast Asia).

Removable media

The percentage of ICS computers on which threats were detected when connecting removable media continued to decrease, reaching its lowest value for the period under review (0.26%).

Among the selected industries across all regions, the highest percentages for removable media threats blocked on ICS computers were observed in the electric power sector in Central Asia and the South Caucasus (1.45%), East Asia (1.34%), and Africa (1.16%).

Network folders

The percentage of ICS computers on which threats are blocked in network folders is steadily decreasing. In Q1 2026, it was the lowest for the period under review (0.029%).

East Asia has traditionally led by a wide margin. The percentage for East Asia (0.135%) is 27 times higher than the lowest regional value (recorded in Northern Europe).

The largest increases in the percentages for threats from network folders were observed in Africa (0.037%, +0.006 pp) and South America (0.013%, +0.006 pp).
Among the selected industries across all regions, the construction industry in East Asia, at 0.36%, holds the top positions in the ranking by the percentage of ICS computers on which threats are blocked in network folders.

For more information on industrial threats see the full version of the report.

  •  

IT threat evolution in Q1 2026. Non-mobile statistics

IT threat evolution in Q1 2026. Non-mobile statistics
IT threat evolution in Q1 2026. Mobile statistics

The statistics in this report are based on detection verdicts returned by Kaspersky products unless otherwise stated. The information was provided by Kaspersky users who consented to sharing statistical data.

Quarterly figures

In Q1 2026:

  • Kaspersky products blocked more than 343 million attacks that originated with various online resources.
  • Web Anti-Virus responded to 50 million unique links.
  • File Anti-Virus blocked nearly 15 million malicious and potentially unwanted objects.
  • 2938 new ransomware variants were detected.
  • More than 77,000 users experienced ransomware attacks.
  • 14% of all ransomware victims whose data was published on threat actors’ data leak sites (DLS) were victims of Clop.
  • More than 260,000 users were targeted by miners.

Ransomware

Quarterly trends and highlights

Law enforcement success

In January 2026, it was reported that the FBI had seized the domains of the RAMP cybercrime forum, a major platform used extensively by ransomware developers to advertise their RaaS programs and to recruit affiliates. There has been no official statement from the FBI, nor is it clear if RAMP servers were seized. In a post on an external website, a RAMP moderator mentioned law enforcement agencies gaining control over the forum. The takedown disrupted a key element of the RaaS ecosystem, creating ripple effects for ransomware operators, affiliates, and initial access brokers.

A man suspected of links to the Phobos group was apprehended in Poland. He was charged with the creation, acquisition, and distribution of software designed for unlawfully obtaining information, including data that facilitates unauthorized access to information stored within a computer system.

In March, a Phobos ransomware administrator pleaded guilty to the creation and distribution of the Trojan, which had been used in international attacks dating back to at least November 2020.

In March, the U.S. Department of Justice charged a man who had acted as a negotiator for ransomware groups. The company he worked for specializes in cyberincident investigations. The prosecution alleges the suspect colluded with the BlackCat threat actor to share privileged insights into the ongoing progress of negotiations. Additionally, the suspect is alleged to have had a prior direct role in BlackCat attacks, serving as an affiliate for the RaaS operation.

In a separate development this March, a U.S. court sentenced an initial access broker associated with the Yanluowang ransomware group to 81 months of imprisonment. According to the U.S. Department of Justice, the convict facilitated dozens of ransomware attacks across the United States, resulting in over $9 million in actual loss and more than $24 million in intended loss.

Vulnerabilities and attacks

The Interlock group has been heavily exploiting the CVE-2026-20131 zero-day vulnerability in Cisco Secure FMC firewall management software since at least January 26, 2026. The vulnerability enabled arbitrary Java code execution with root privileges on the affected device. This campaign demonstrates the ongoing reliance on zero-day vulnerabilities for initial access, a focus on network appliances as high-value entry points, and the rapid weaponization of new vulnerabilities within the ransomware ecosystem.

The most prolific groups

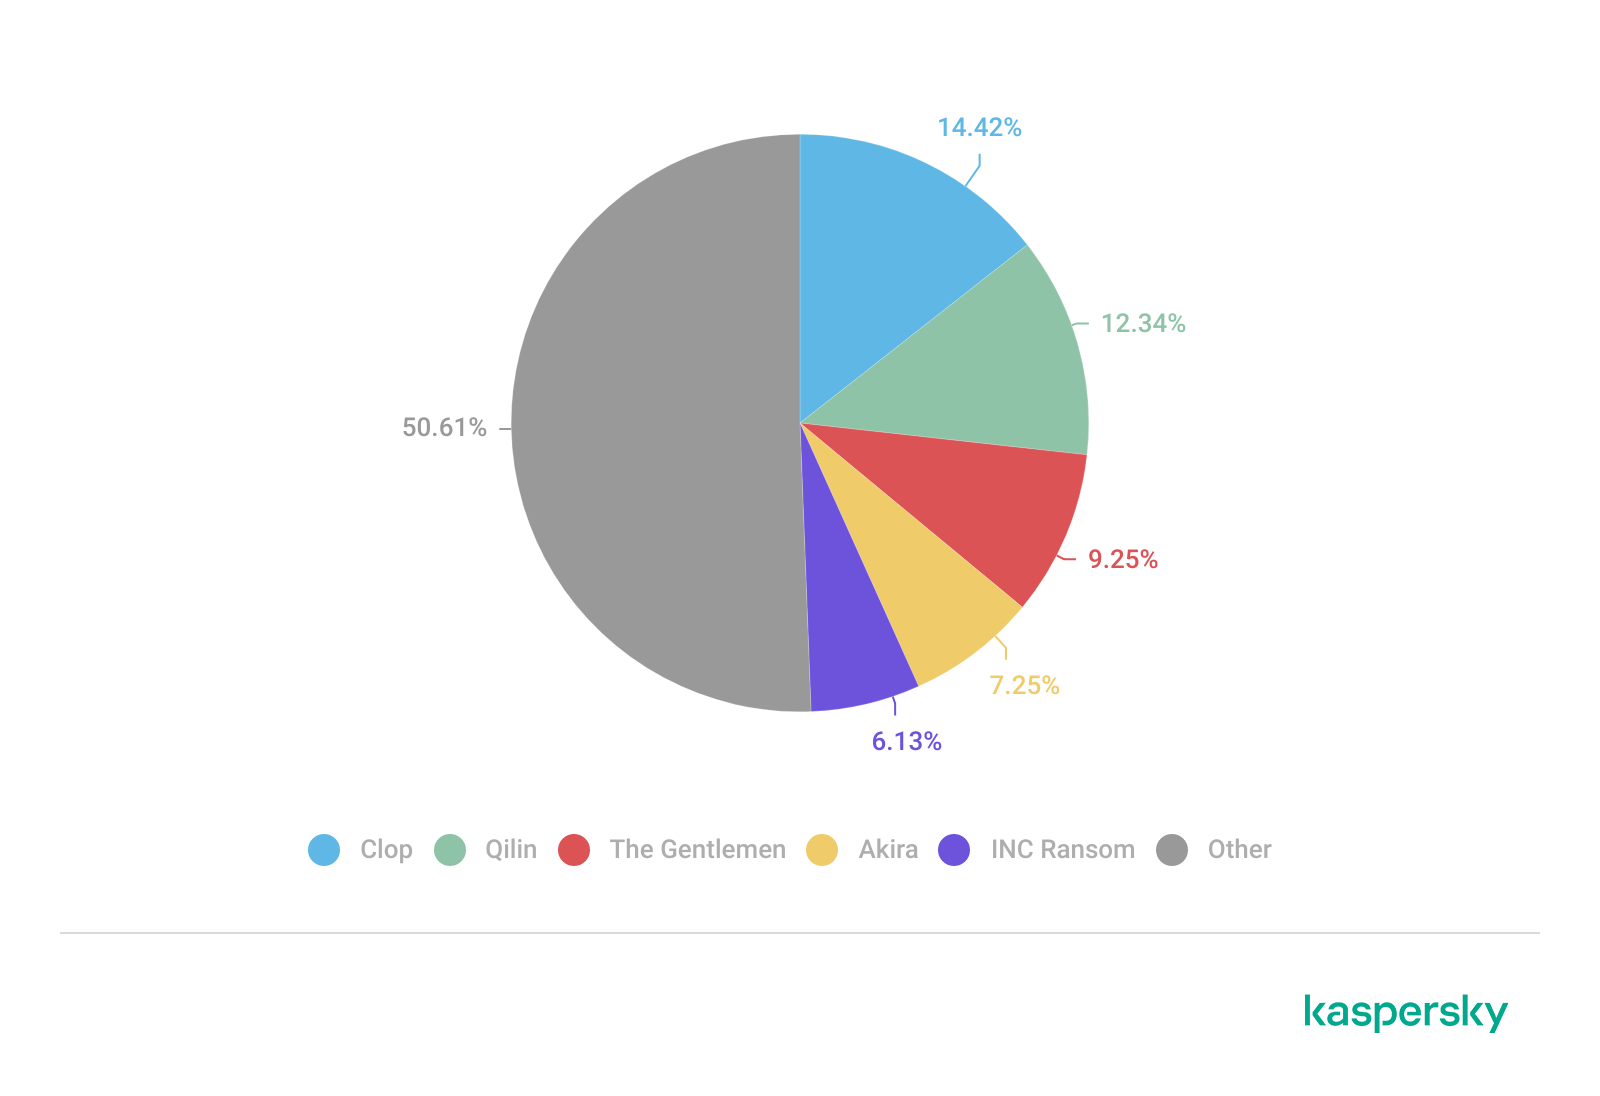
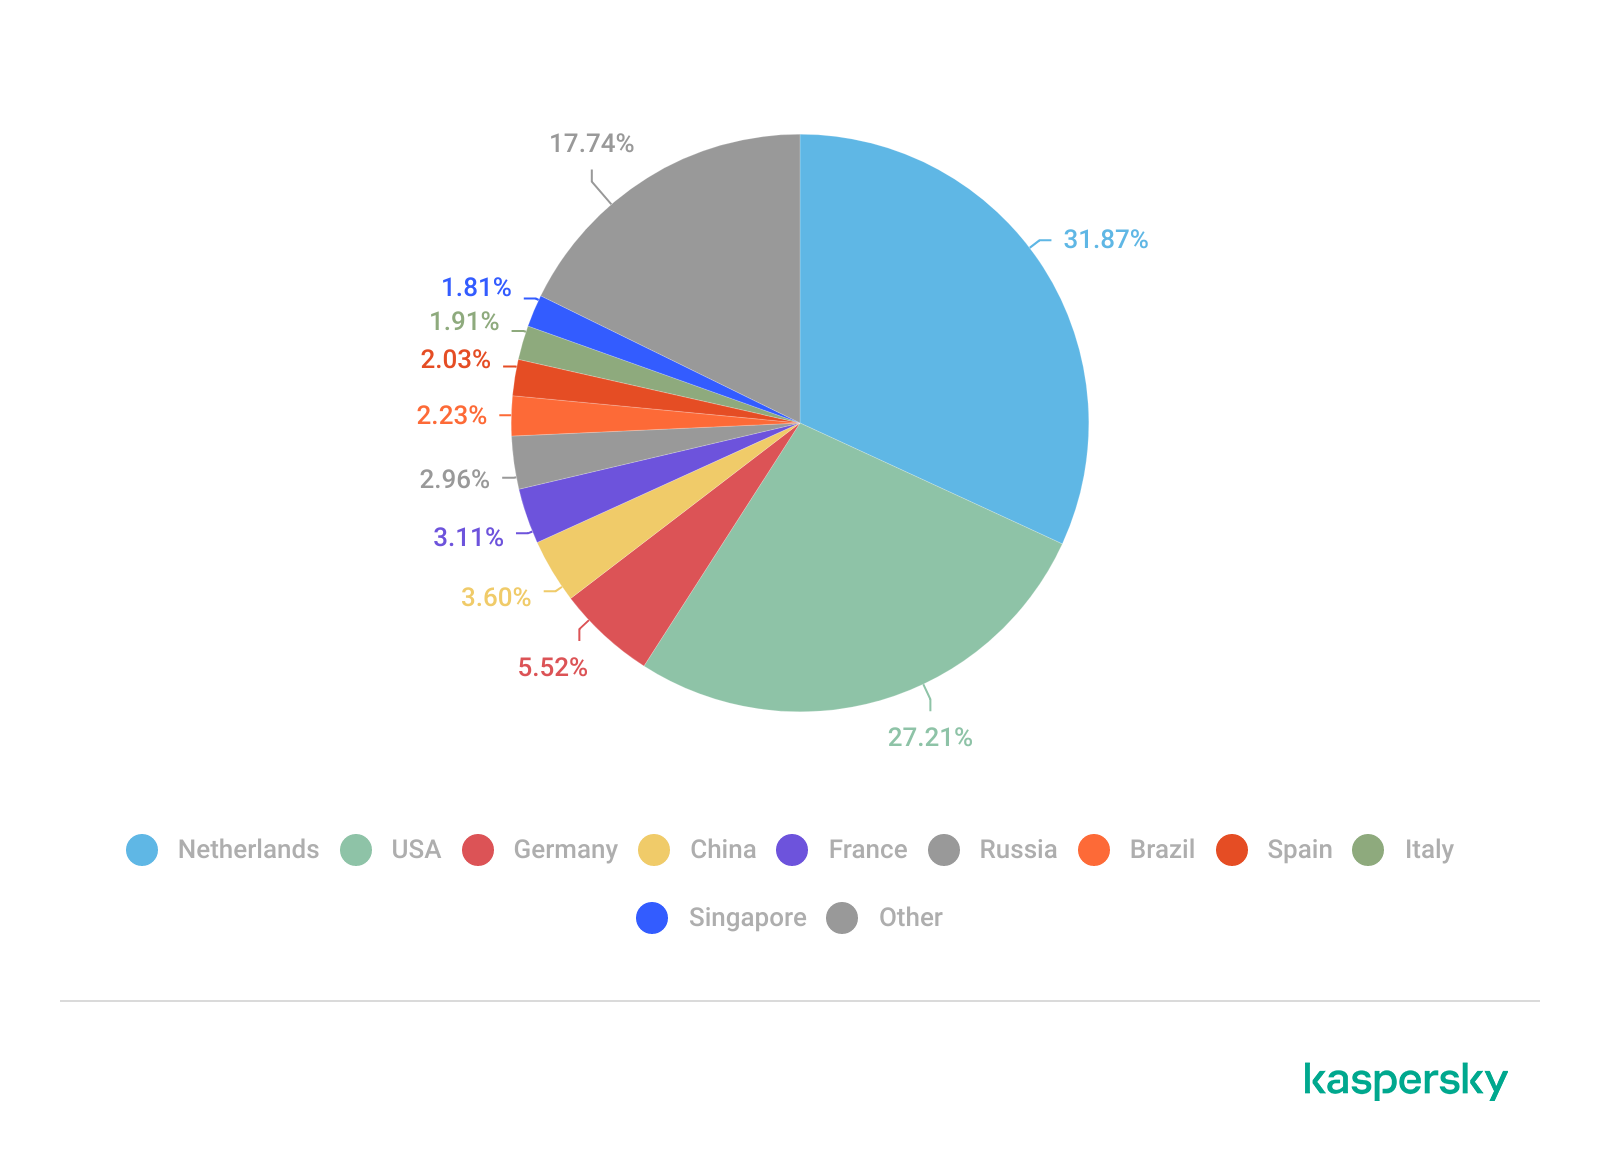
This section highlights the most prolific ransomware gangs by number of victims added to each group’s DLS. This quarter, the Clop ransomware (14.42%) returned to the top of the rankings, displacing Qilin (12.34%), which had held the leading position in the previous reporting period. Following closely is a new threat actor, The Gentlemen (9.25%). Emerging no later than July 2025, the group had already surpassed the activity levels of mainstays such as Akira (7.25%) and INC Ransom (6.13%).

Number of each group’s victims according to its DLS as a percentage of all groups’ victims published on all the DLSs under review during the reporting period (download)

Number of new variants

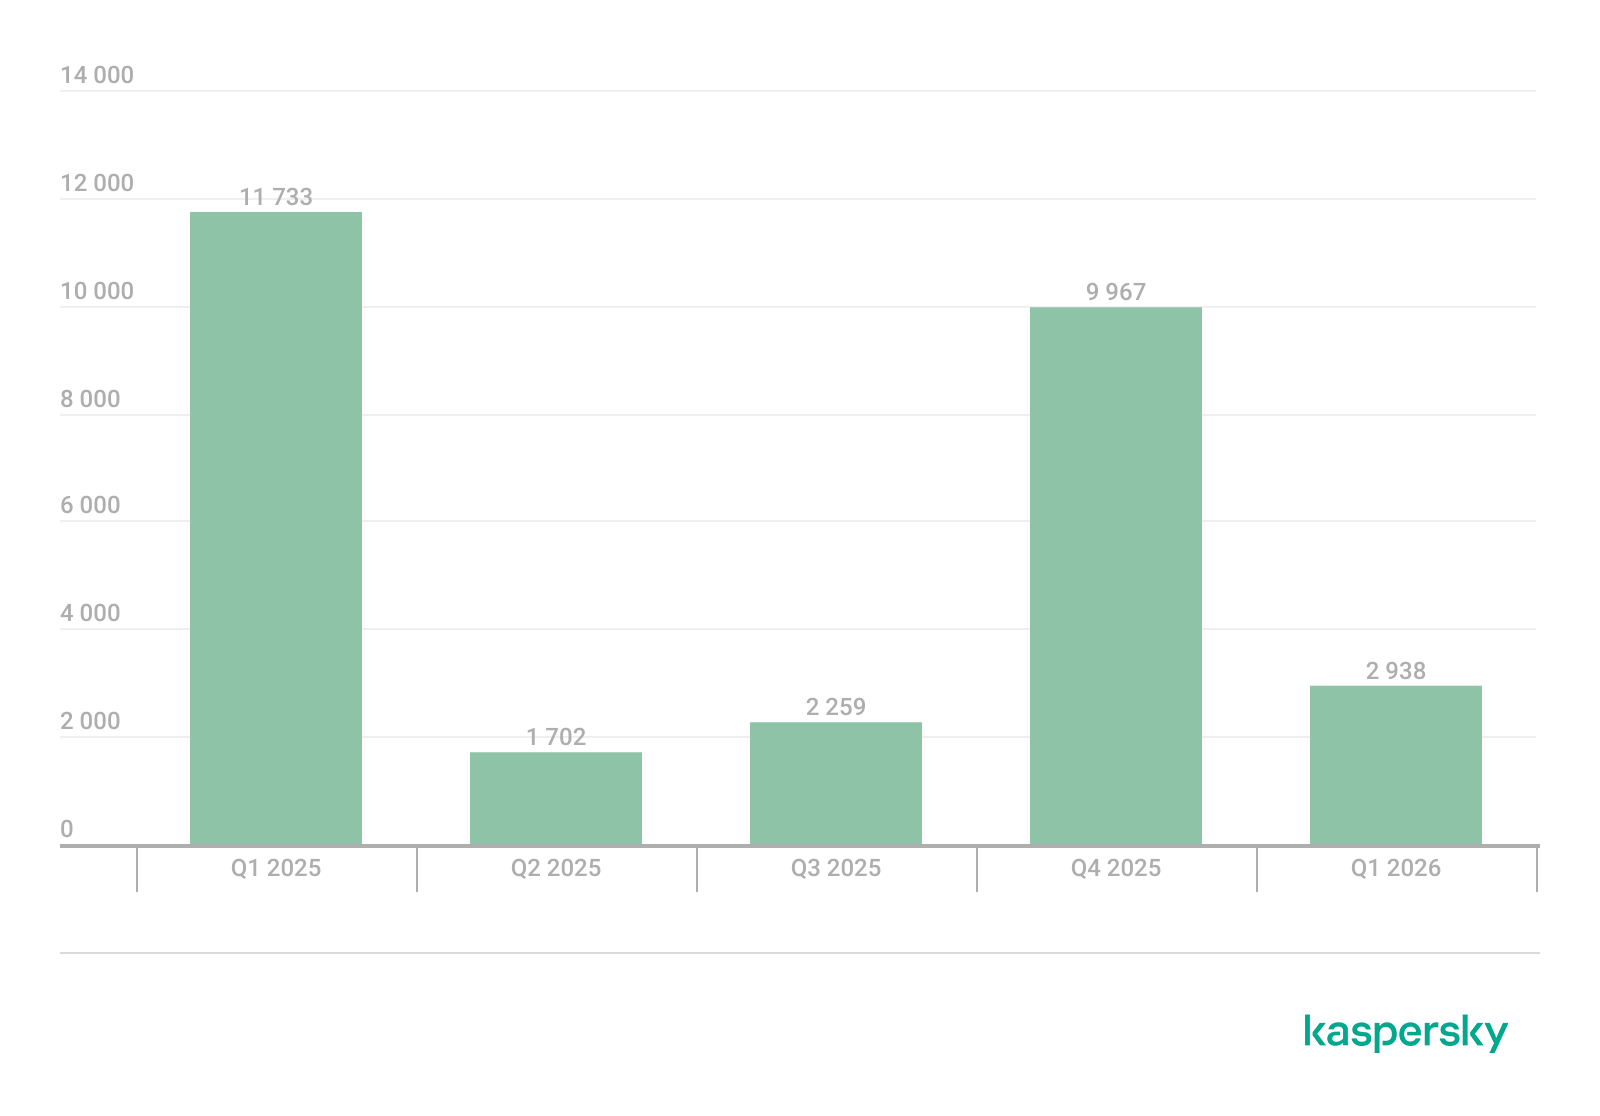
In Q1 2026, Kaspersky solutions detected six new ransomware families and 2938 new modifications. Volumes have returned to Q3 2025 levels following a surge in Q4 2025.

Number of new ransomware modifications, Q1 2025 — Q1 2026 (download)

Number of users attacked by ransomware Trojans

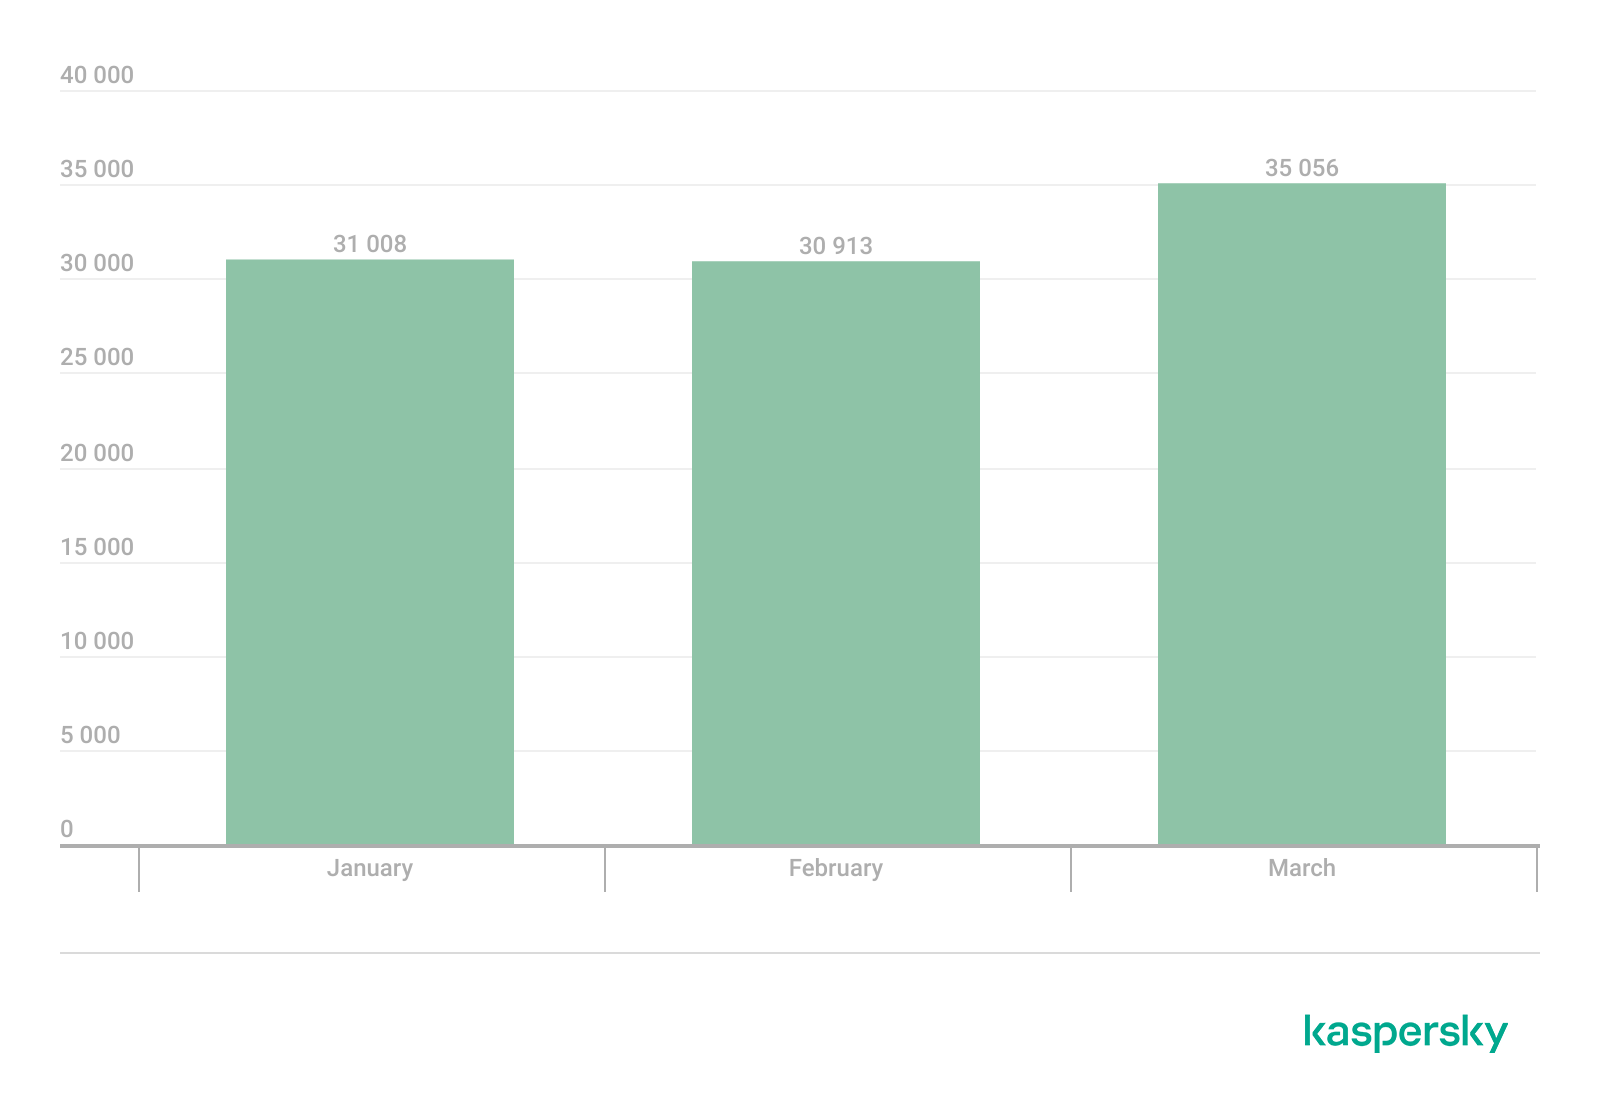
Throughout Q1, our solutions protected 77,319 unique users from ransomware. Ransomware activity was highest in March, with 35,056 unique users encountering such attacks during the month.

Number of unique users attacked by ransomware Trojans, Q1 2026 (download)

Attack geography

TOP 10 countries and territories attacked by ransomware Trojans

Country/territory* %**
1 Pakistan 0.79
2 South Korea 0.64
3 China 0.52
4 Tajikistan 0.40
5 Libya 0.38
6 Turkmenistan 0.36
7 Iraq 0.35
8 Bangladesh 0.33
9 Rwanda 0.30
10 Cameroon 0.28

* Excluded are countries and territories with relatively few (under 50,000) Kaspersky users.
** Unique users whose computers were attacked by ransomware Trojans as a percentage of all unique users of Kaspersky products in the country/territory.

TOP 10 most common families of ransomware Trojans

Name Verdict %*
1 (generic verdict) Trojan-Ransom.Win32.Gen 33.90
2 (generic verdict) Trojan-Ransom.Win32.Crypren 6.38
3 WannaCry Trojan-Ransom.Win32.Wanna 5.87
4 (generic verdict) Trojan-Ransom.Win32.Encoder 4.68
5 (generic verdict) Trojan-Ransom.Win32.Agent 3.80
6 LockBit Trojan-Ransom.Win32.Lockbit 2.80
7 (generic verdict) Trojan-Ransom.Win32.Phny 1.99
8 (generic verdict) Trojan-Ransom.MSIL.Agent 1.96
9 (generic verdict) Trojan-Ransom.Python.Agent 1.93
10 (generic verdict) Trojan-Ransom.Win32.Crypmod 1.89

* Unique Kaspersky users attacked by the specific ransomware Trojan family as a percentage of all unique users attacked by this type of threat.

Miners

Number of new variants

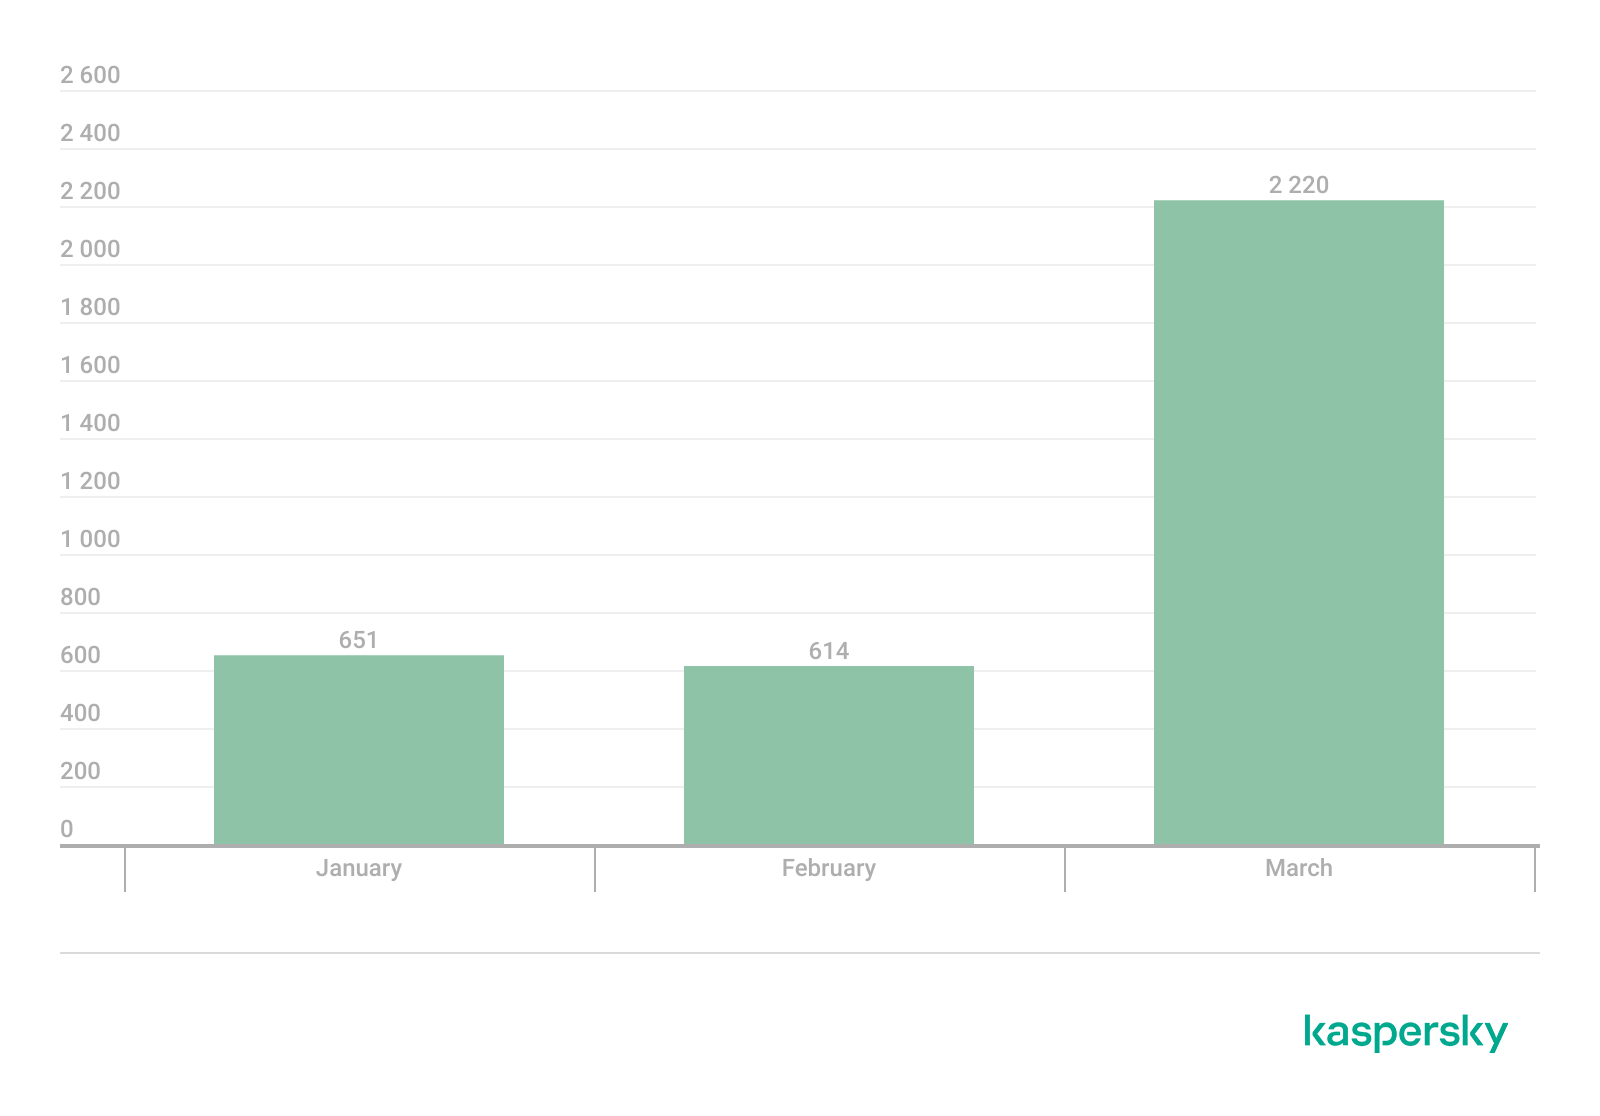
In Q1 2026, Kaspersky solutions detected 3485 new modifications of miners.

Number of new miner modifications, Q1 2026 (download)

Number of users attacked by miners

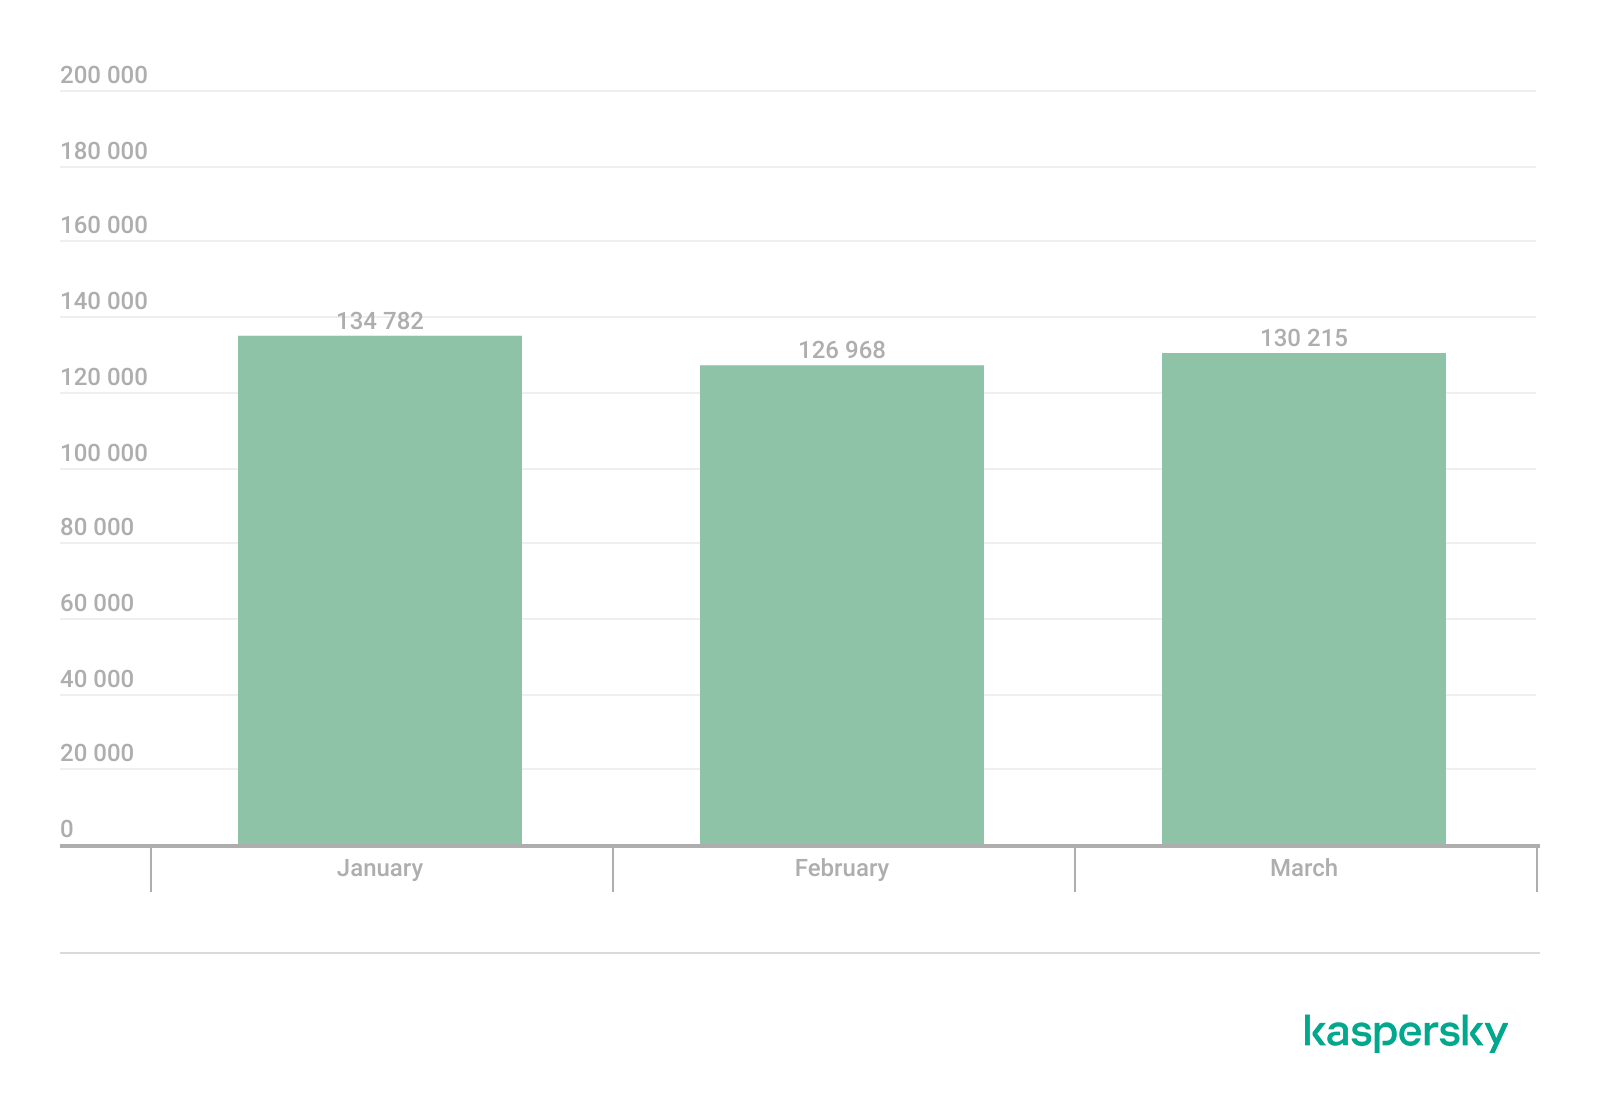
In Q1, we detected attacks using miner programs on the computers of 260,588 unique Kaspersky users worldwide.

Number of unique users attacked by miners, Q1 2026 (download)

Attack geography

TOP 10 countries and territories attacked by miners

Country/territory* %**
1 Senegal 3.19
2 Turkmenistan 3.06
3 Mali 2.63
4 Tanzania 1.62
5 Bangladesh 1.06
6 Ethiopia 0.95
7 Panama 0.88
8 Afghanistan 0.79
9 Kazakhstan 0.77
10 Bolivia 0.75

* Excluded are countries and territories with relatively few (under 50,000) Kaspersky users.
** Unique users whose computers were attacked by miners as a percentage of all unique users of Kaspersky products in the country/territory.

Attacks on macOS

In Q1 2026, Google uncovered a new cryptocurrency theft campaign. The scammers directed victims to a fraudulent video call, prompting them to execute malicious scripts under the guise of technical support fixes for connection problems.

In March, researchers with GTIG and iVerify reported the discovery of an in-the-wild exploit chain targeting both iOS and macOS devices. The exploit kit was apparently marketed on the dark web, providing threat actors with a suite of spyware capabilities alongside specialized cryptocurrency exfiltration modules. The exploit was delivered via drive-by downloads when victims visited various compromised websites. Our analysis confirmed that the toolkit included an updated version of a component previously identified in the Operation Triangulation attack chain.

Devices running macOS were similarly impacted by the high-profile supply chain attack targeting the Axios npm package, a widely used HTTP client for JavaScript. The installation of the infected package led to the deployment of a backdoor on macOS devices.

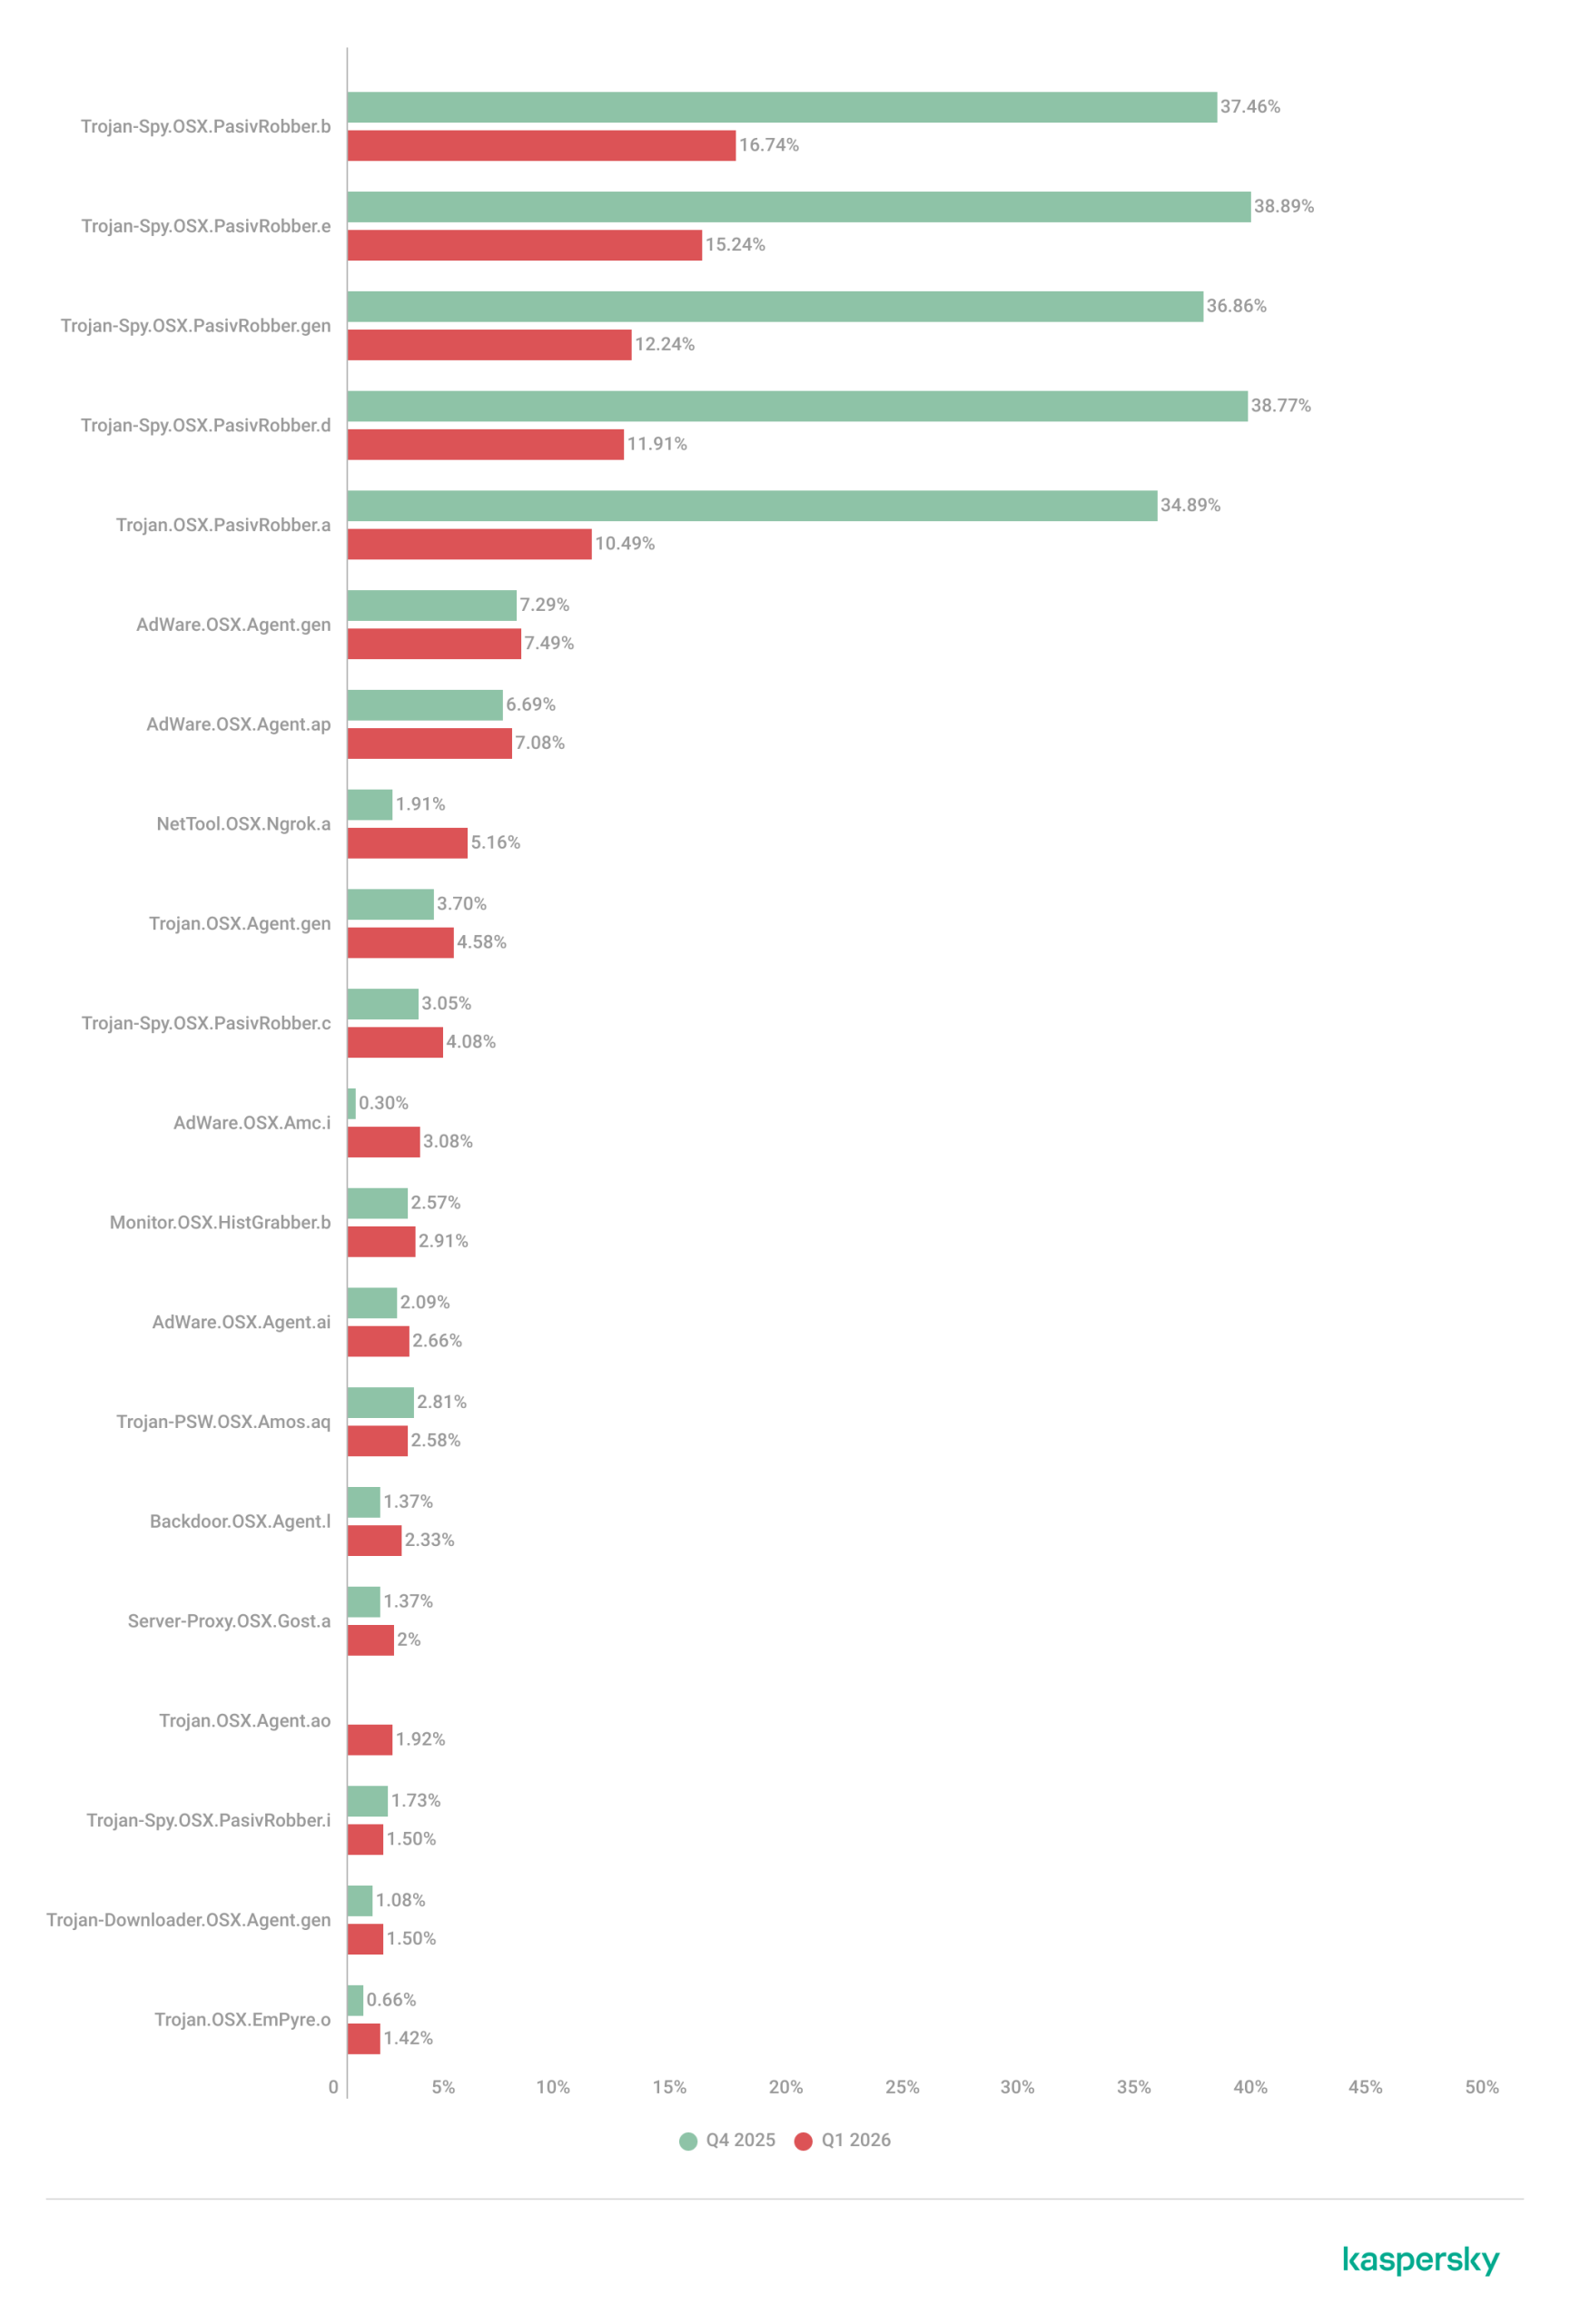
TOP 20 threats to macOS

Unique users* who encountered this malware as a percentage of all attacked users of Kaspersky security solutions for macOS (download)

* Data for the previous quarter may differ slightly from previously published data due to some verdicts being retrospectively revised.

The share of PasivRobber spyware attacks is beginning to decline, giving way to more traditional adware and Monitor-class software capable of tracking user activity. The popular Amos stealer also maintains its presence within the TOP 20.

Geography of threats to macOS

TOP 10 countries and territories by share of attacked users

Country/territory %* Q4 2025 %* Q1 2026
China 1.28 1.97
France 1.18 1.07
Brazil 1.13 0.98
Mexico 0.72 0.52
Germany 0.71 0.45
The Netherlands 0.62 0.75
Hong Kong 0.49 0.53
India 0.42 0.48
Russian Federation 0.34 0.37
Thailand 0.24 0.27

* Unique users who encountered threats to macOS as a percentage of all unique Kaspersky users in the country/territory.

IoT threat statistics

This section presents statistics on attacks targeting Kaspersky IoT honeypots. The geographic data on attack sources is based on the IP addresses of attacking devices.

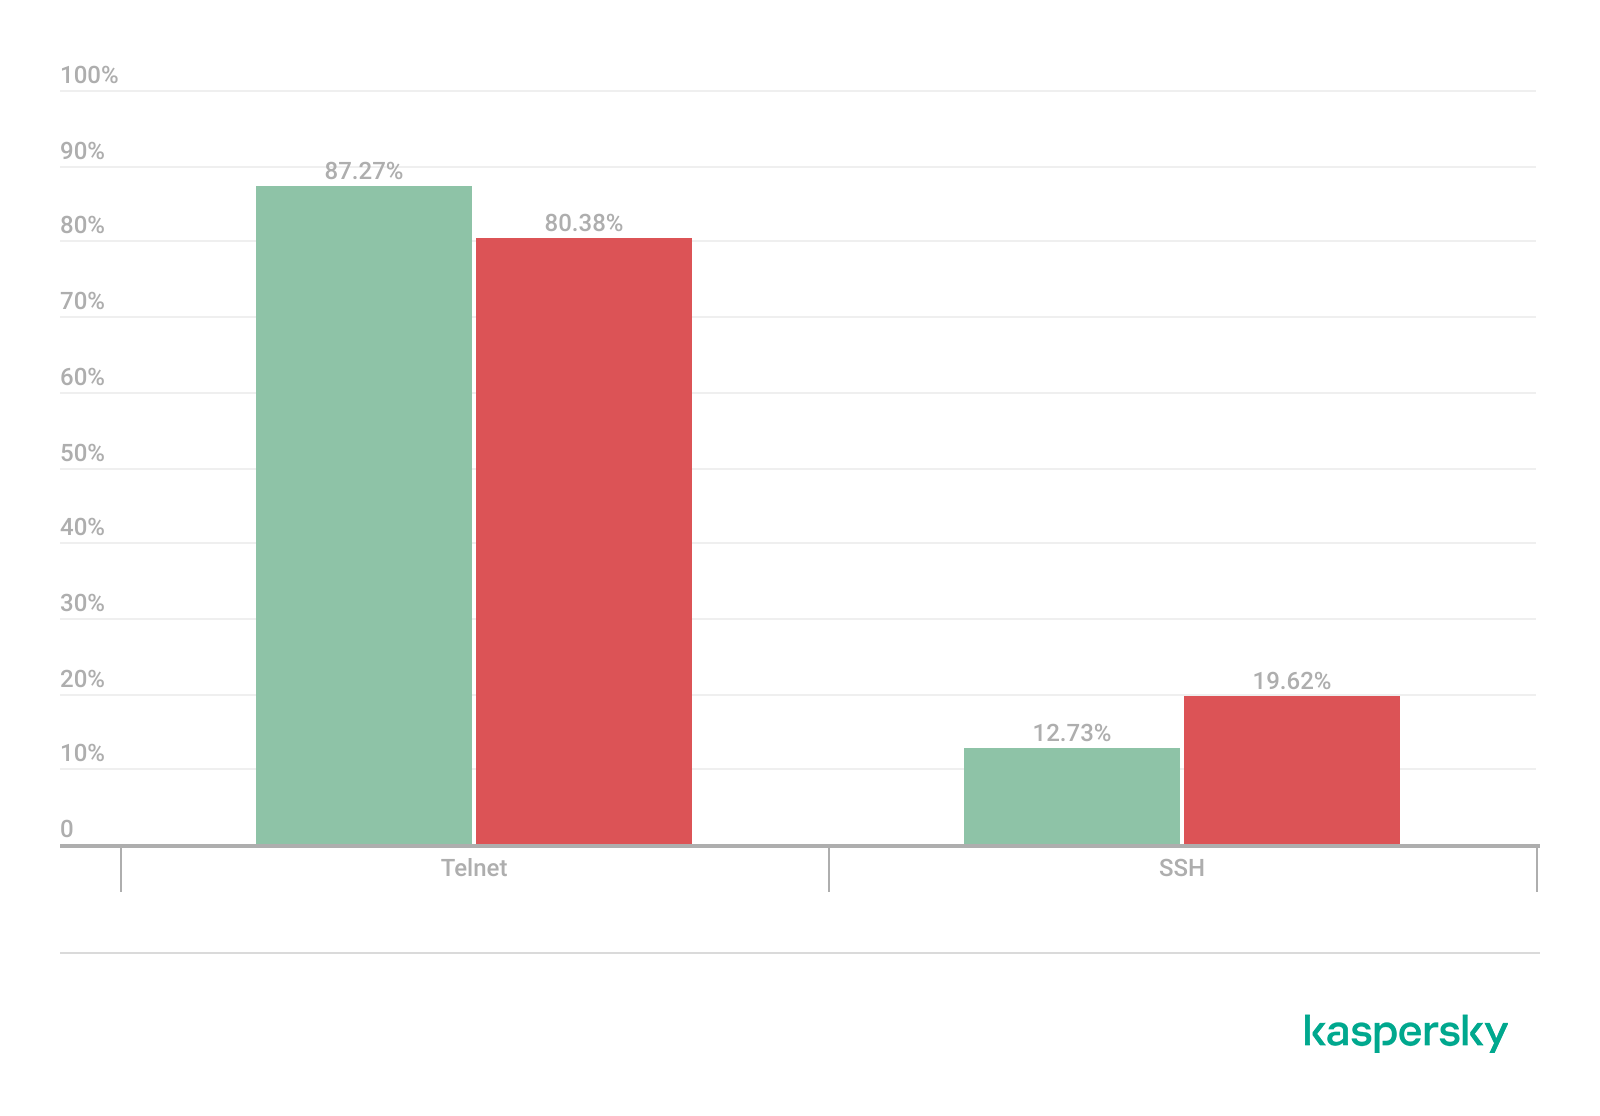
In Q1 2026, the share of devices attacking Kaspersky honeypots via the SSH protocol saw a significant increase compared to the previous reporting period.

Distribution of attacked services by number of unique IP addresses of attacking devices (download)

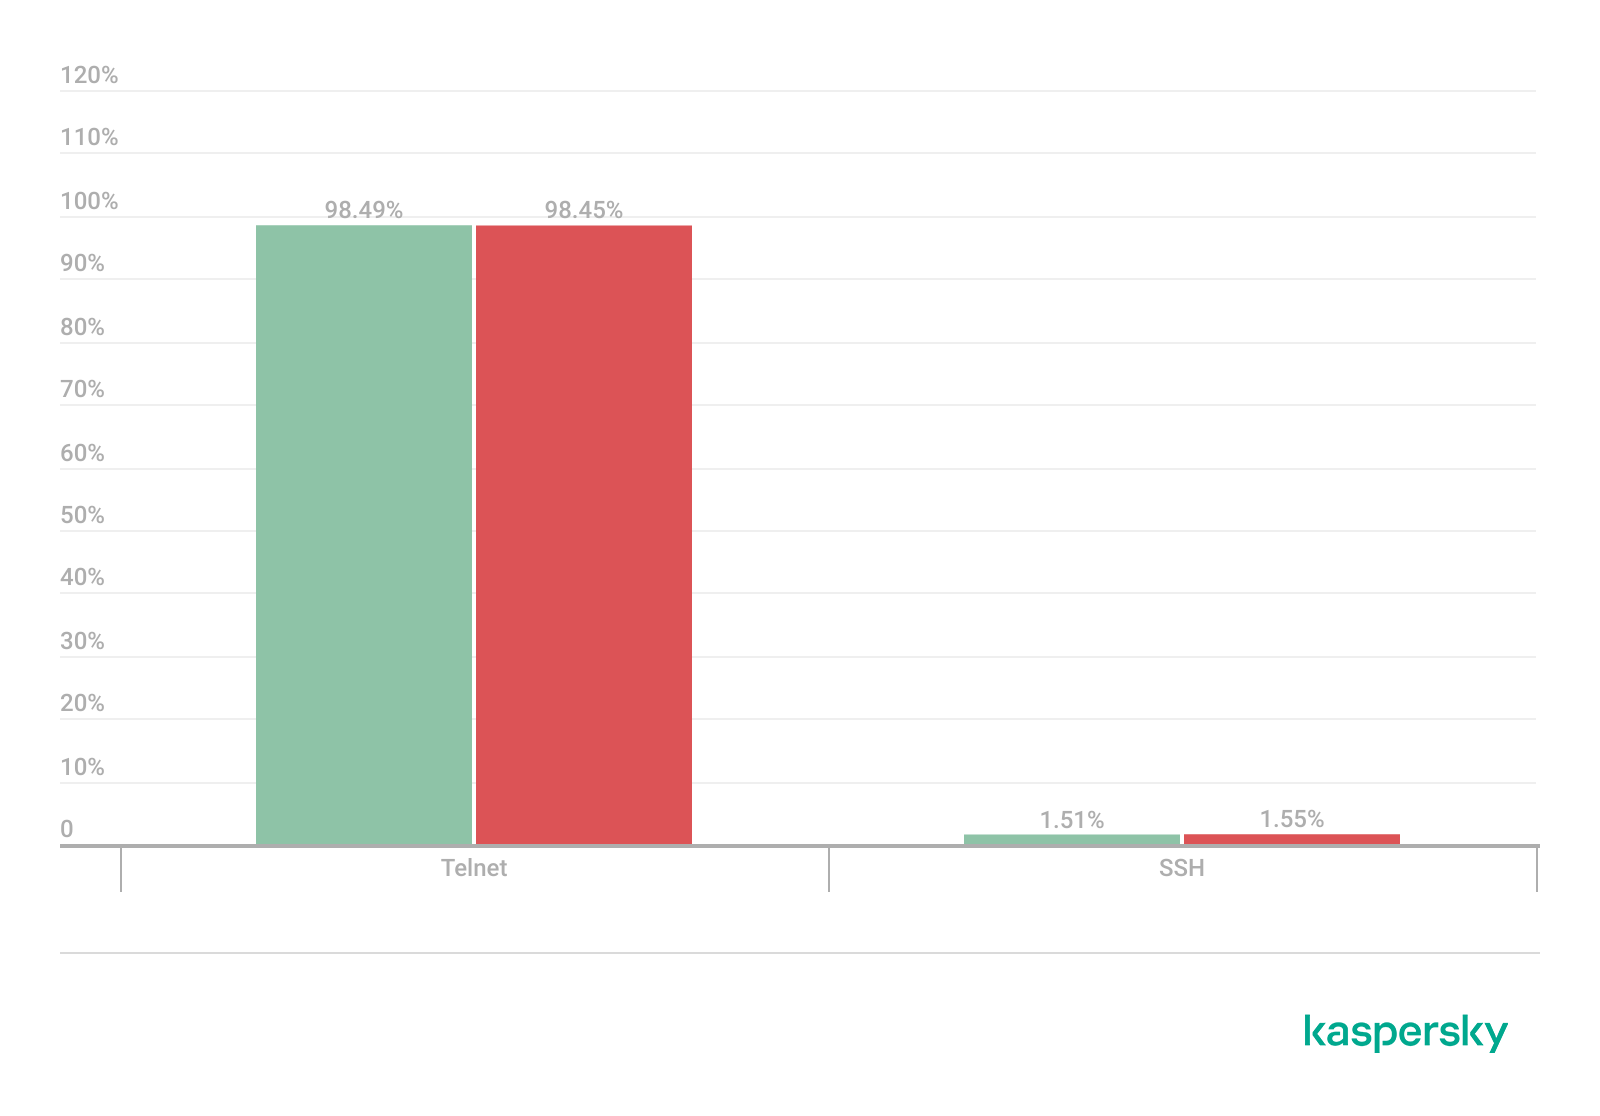
The distribution of attacks between Telnet and SSH maintained the ratio observed in Q4 2025.

Distribution of attackers’ sessions in Kaspersky honeypots (download)

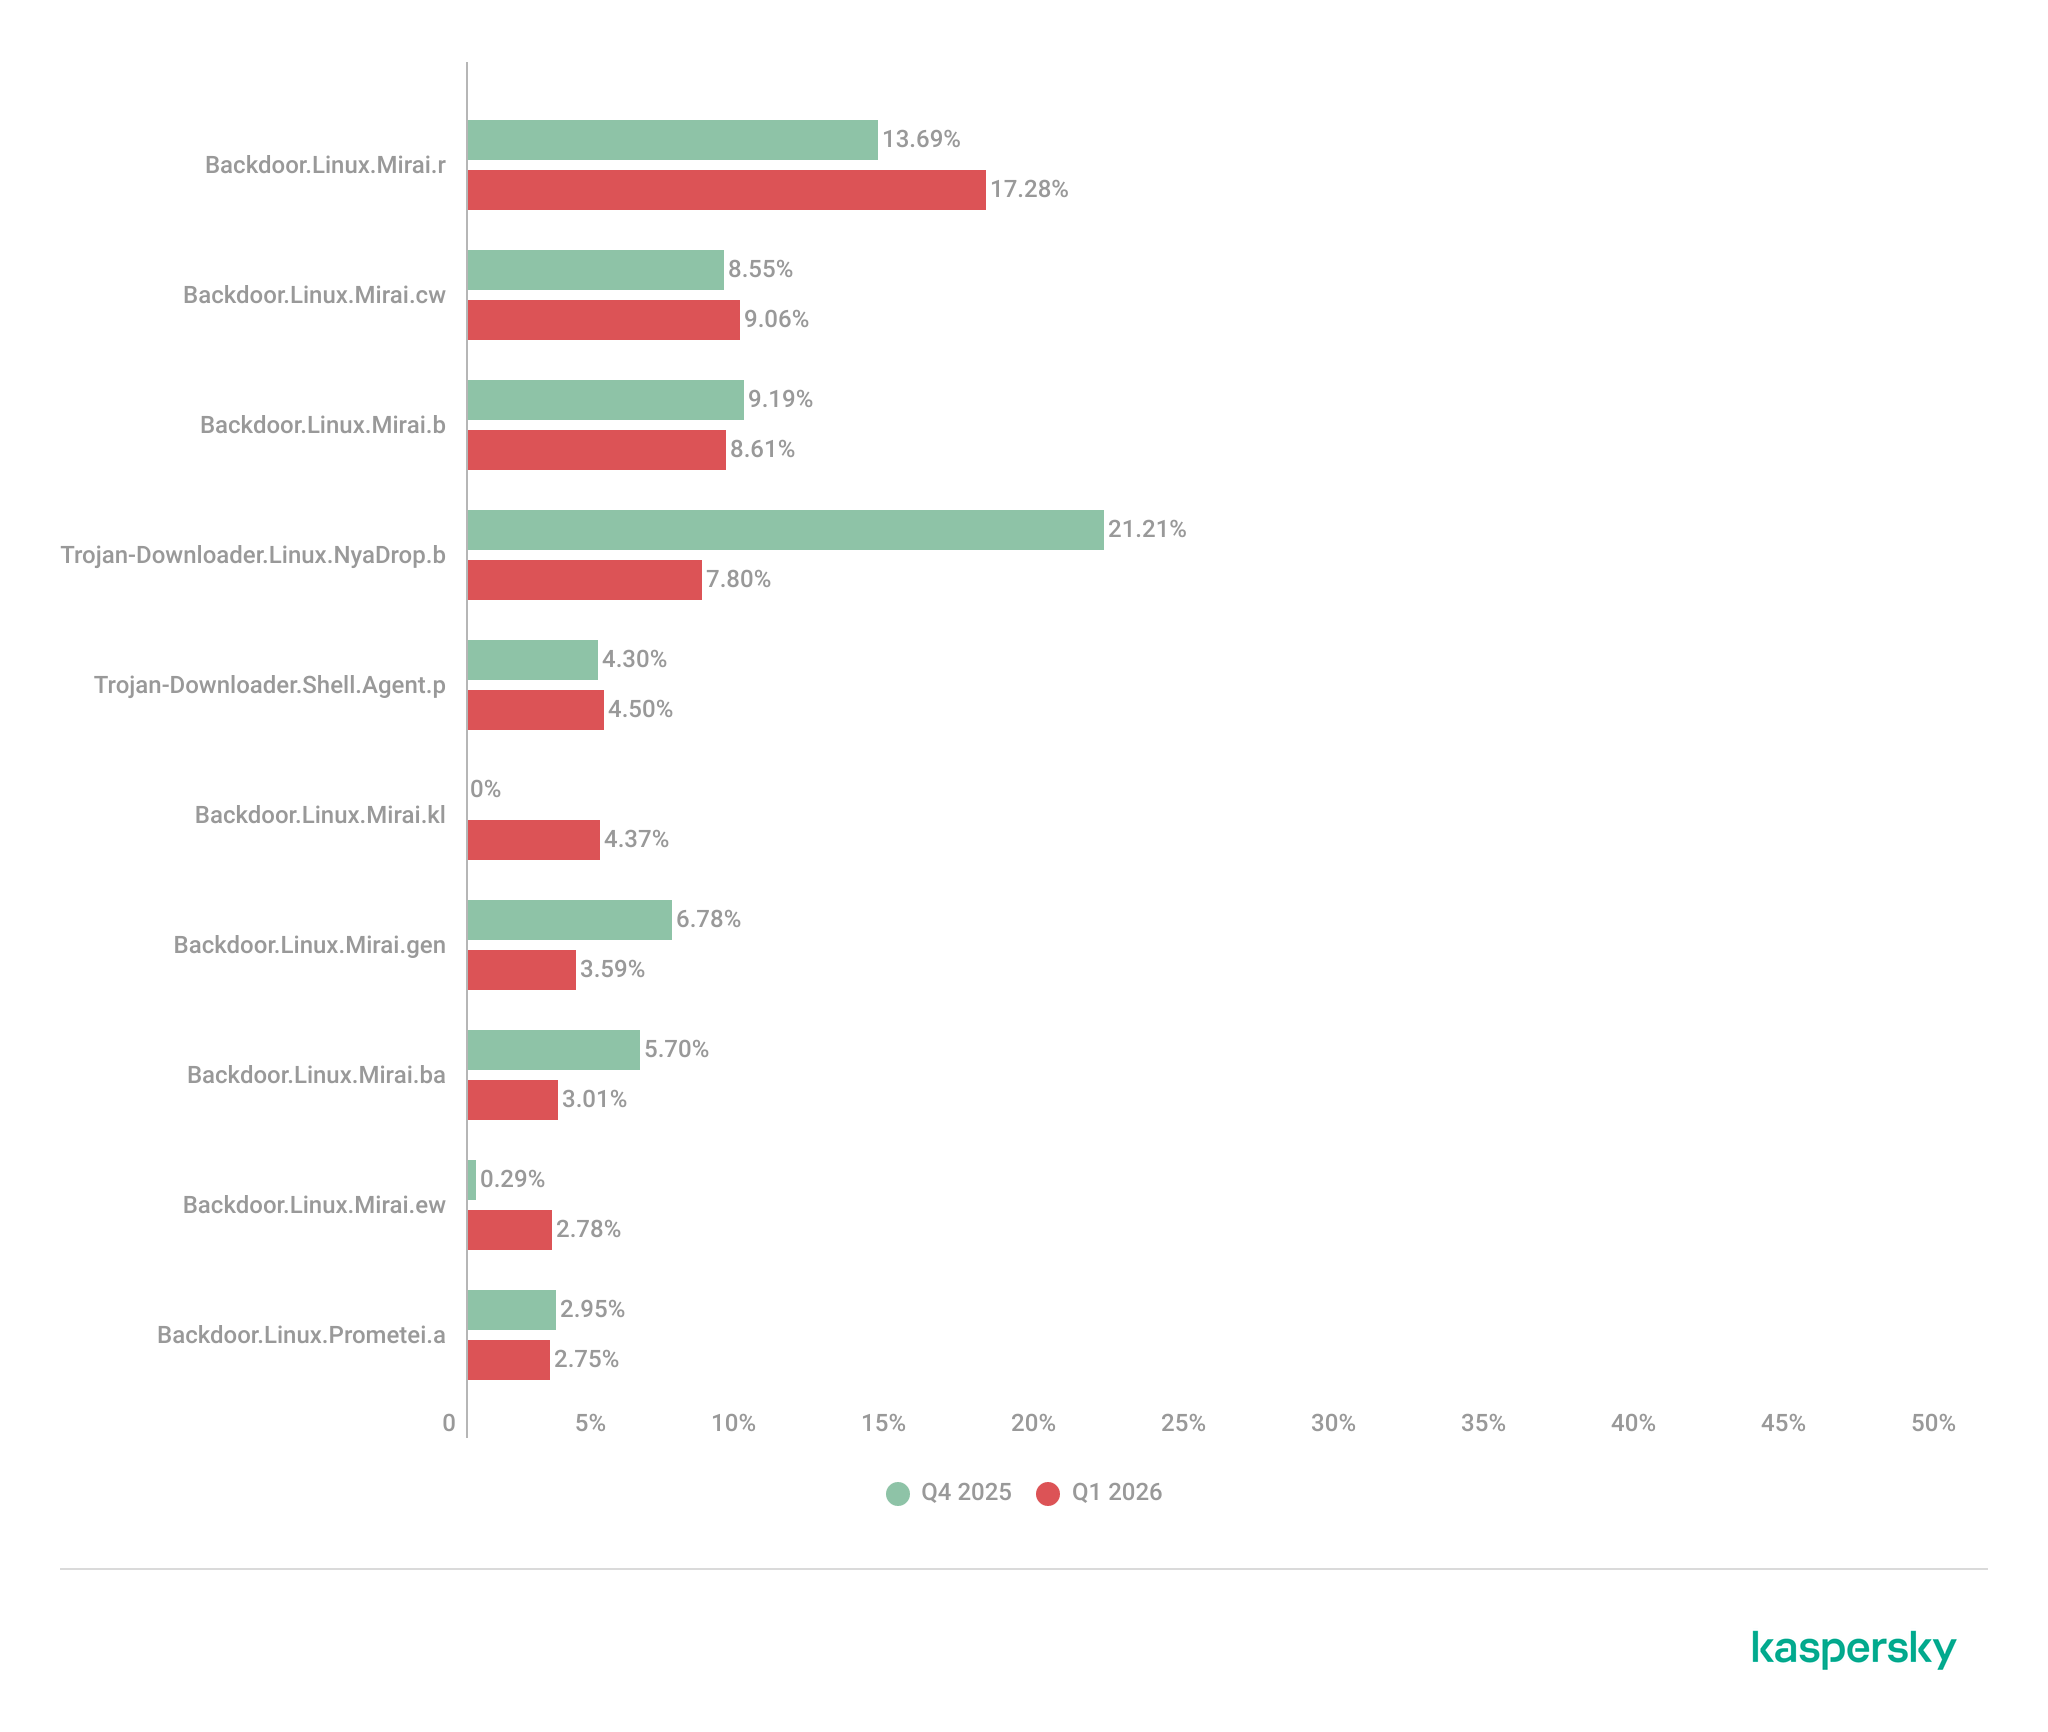
TOP 10 threats delivered to IoT devices

Share of each threat delivered to an infected device as a result of a successful attack, out of the total number of threats delivered (download)

The primary shifts in the IoT threat distribution are linked to the activity of various Mirai botnet variants, although members of this family continue to account for the majority of the list. Furthermore, a new variant, Mirai.kl, surfaced in the rankings. We also observed a significant decline in NyaDrop botnet activity during Q1.

Attacks on IoT honeypots

The United States, the Netherlands, and Germany accounted for the highest proportions of SSH-based attacks during this period.

Country/territory Q4 2025 Q1 2026
United States 16.10% 23.74%
The Netherlands 15.78% 17.57%
Germany 12.07% 10.34%
Panama 7.72% 6.34%
India 5.32% 6.05%
Romania 4.05% 5.82%
Australia 1.62% 4.61%
Vietnam 4.21% 3.50%
Russian Federation 3.79% 2.35%
Sweden 2.25% 2.09%

China continues to account for the largest proportion of Telnet attacks, though there was a marked increase in activity originating from Pakistan.

Country/territory Q4 2025 Q1 2026
China 53.64% 39.54%
Pakistan 14.27% 27.31%
Russian Federation 8.20% 8.25%
Indonesia 8.58% 6.71%
India 4.85% 4.66%
Brazil 0.06% 3.30%
Argentina 0.02% 2.51%
Nigeria 1.22% 1.38%
Thailand 0.01% 0.55%
Sweden 0.54% 0.55%

Attacks via web resources

The statistics in this section are based on detection verdicts by Web Anti-Virus, which protects users when suspicious objects are downloaded from malicious or infected web pages. These malicious pages are purposefully created by cybercriminals. Websites that host user-generated content, such as message boards, as well as compromised legitimate sites, can become infected.

TOP 10 countries and territories that served as sources of web-based attacks

The following statistics show the distribution by country/territory of the sources of internet attacks blocked by Kaspersky products on user computers (web pages redirecting to exploits, sites containing exploits and other malicious programs, botnet C&C centers, and so on). One or more web-based attacks could originate from each unique host.

To determine the geographic source of web attacks, we matched the domain name with the real IP address where the domain is hosted, then identified the geographic location of that IP address (GeoIP).

In Q1 2026, Kaspersky solutions blocked 343,823,407 attacks launched from internet resources worldwide. Web Anti-Virus was triggered by 49,983,611 unique URLs.

Web-based attacks by country/territory, Q1 2026 (download)

Countries and territories where users faced the greatest risk of online infection

To assess the risk of malware infection via the internet for users’ computers in different countries and territories, we calculated the share of Kaspersky users in each location on whose computers Web Anti-Virus was triggered during the reporting period. The resulting data provides an indication of the aggressiveness of the environment in which computers operate in different countries and territories.

This ranked list includes only attacks by malicious objects classified as Malware. Our calculations leave out Web Anti-Virus detections of potentially dangerous or unwanted programs, such as RiskTool or adware.

Country/territory* %**
1 Venezuela 9.33
2 Hungary 8.16
3 Italy 7.58
4 Tajikistan 7.48
5 India 7.21
6 Greece 7.13
7 Portugal 7.10
8 France 7.05
9 Belgium 6.83
10 Slovakia 6.80
11 Vietnam 6.62
12 Bosnia and Herzegovina 6.57
13 Canada 6.56
14 Serbia 6.50
15 Tunisia 6.36
16 Qatar 6.01
17 Spain 5.95
18 Germany 5.95
19 Sri Lanka 5.89
20 Brazil 5.88

* Excluded are countries and territories with relatively few (under 10,000) Kaspersky users.
** Unique users targeted by web-based Malware attacks as a percentage of all unique users of Kaspersky products in the country/territory.

On average during the quarter, 4.73% of users’ computers worldwide were subjected to at least one Malware web attack.

Local threats

Statistics on local infections of user computers are an important indicator. They include objects that penetrated the target computer by infecting files or removable media, or initially made their way onto the computer in non-open form. Examples of the latter are programs in complex installers and encrypted files.

Data in this section is based on analyzing statistics produced by anti-virus scans of files on the hard drive at the moment they were created or accessed, and the results of scanning removable storage media. The statistics are based on detection verdicts from the On-Access Scan (OAS) and On-Demand Scan (ODS) modules of File Anti-Virus and include detections of malicious programs located on user computers or removable media connected to the computers, such as flash drives, camera memory cards, phones, or external hard drives.

In Q1 2026, our File Anti-Virus detected 15,831,319 malicious and potentially unwanted objects.

Countries and territories where users faced the highest risk of local infection

For each country and territory, we calculated the percentage of Kaspersky users whose computers had the File Anti-Virus triggered at least once during the reporting period. This statistic reflects the level of personal computer infection in different countries and territories around the world.

Note that this ranked list includes only attacks by malicious objects classified as Malware. Our calculations leave out File Anti-Virus detections of potentially dangerous or unwanted programs, such as RiskTool or adware.

Country/territory* %**
1 Turkmenistan 47.96
2 Tajikistan 31.48
3 Cuba 31.03
4 Yemen 29.59
5 Afghanistan 28.47
6 Burundi 26.93
7 Uzbekistan 24.81
8 Syria 23.08
9 Nicaragua 21.97
10 Cameroon 21.60
11 China 21.09
12 Mozambique 21.02
13 Algeria 20.64
14 Democratic Republic of the Congo 20.63
15 Bangladesh 20.44
16 Mali 20.35
17 Republic of the Congo 20.23
18 Madagascar 20.00
19 Belarus 19.78
20 Tanzania 19.52

* Excluded are countries and territories with relatively few (under 10,000) Kaspersky users.
** Unique users on whose computers local Malware threats were blocked, as a percentage of all unique users of Kaspersky products in the country/territory.

On average worldwide, Malware local threats were detected at least once on 11.55% of users’ computers during Q1.

Russia scored 11.92% in these rankings.

  •  

State of ransomware in 2026

With International Anti-Ransomware Day taking place on May 12, Kaspersky presents its annual report on the evolving global and regional ransomware cyberthreat landscape.

Ransomware remains one of the most persistent and adaptive cyberthreats. In 2026:

  • New families continue to emerge, adopting post-quantum cryptography ciphers.
  • As ransom payments drop, some groups implement encryptionless extortion attacks.
  • In a constantly changing ecosystem of threat actors, initial access brokers maintain a relevant role in this market, showing increased focus on access to RDWeb as the preferred method of remote access.

Ransomware attacks decline but remain a major threat

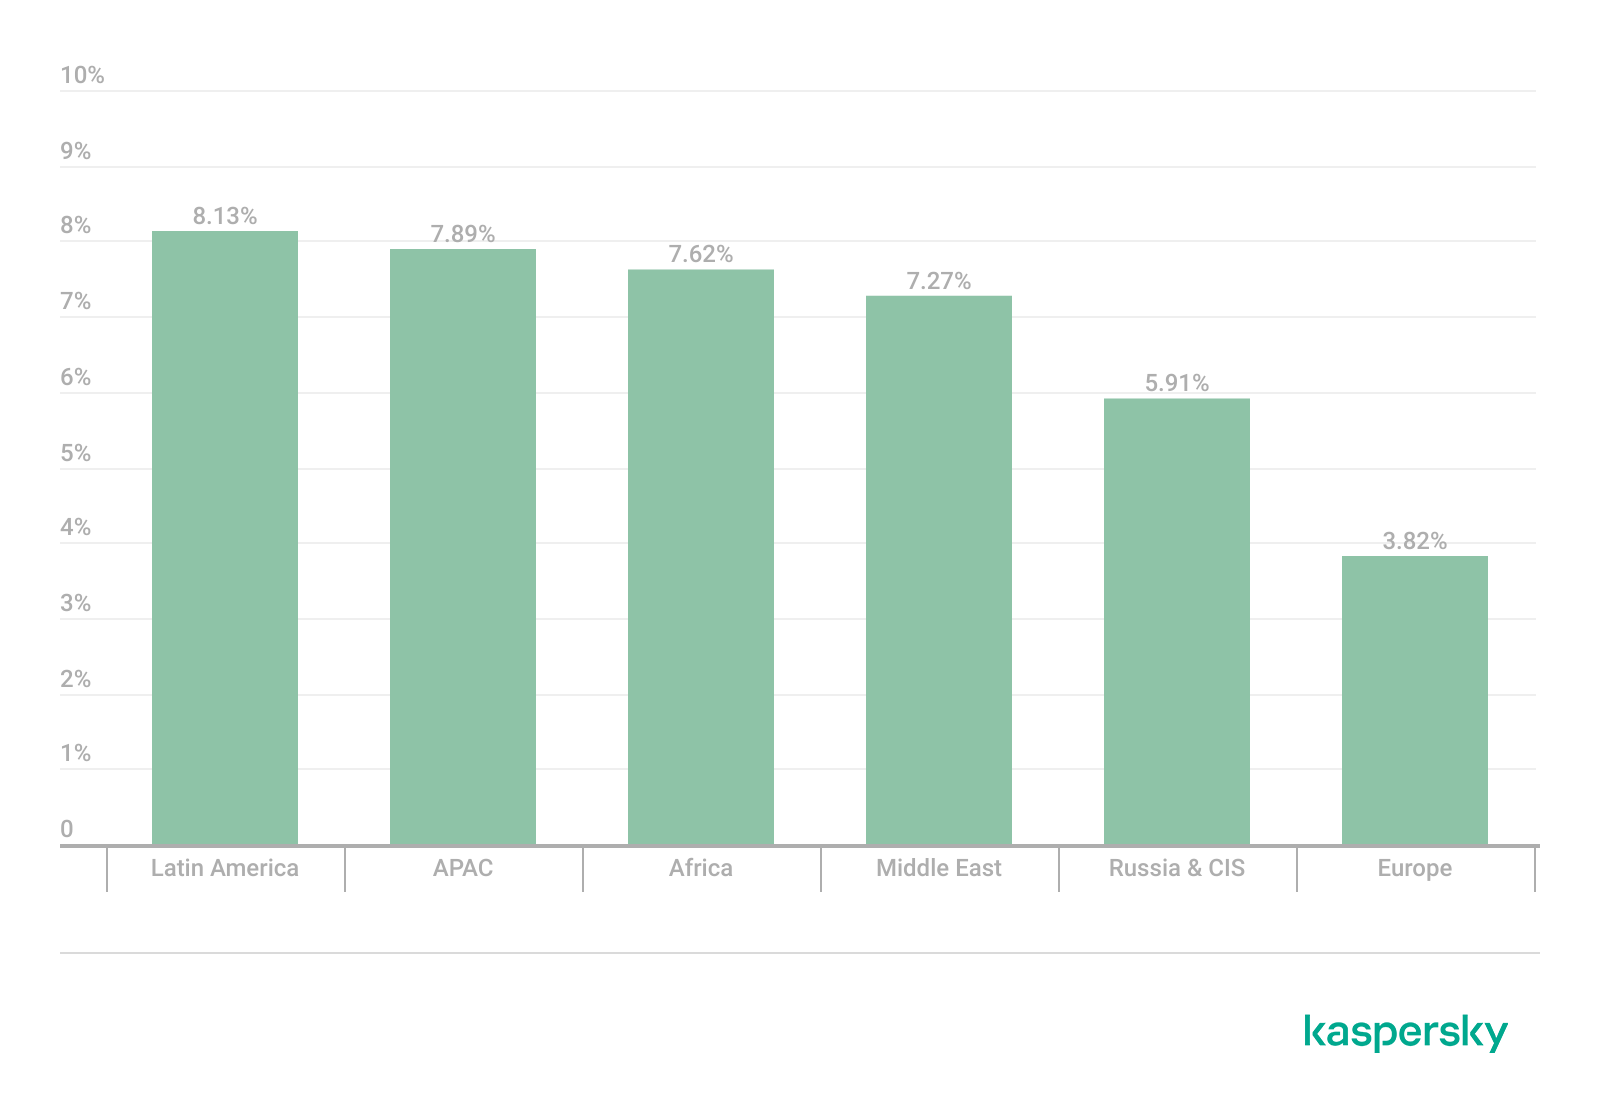
According to Kaspersky Security Network, the share of organizations affected by ransomware decreased in 2025 across all regions compared to 2024.

Percentage of organizations affected by ransomware attacks by region, 2025 (download)

Despite the formal decrease, organizations across all sectors continue to face a high likelihood of attack, as ransomware operators refine their tactics and scale their operations with increasing efficiency. Kaspersky and VDC Research have found that in the manufacturing sector alone, ransomware attacks may have caused over $18 billion in losses in the first three quarters of the year.

The continued rise of EDR killers and defense evasion tooling

In 2026, ransomware operators increasingly prioritize neutralizing endpoint defenses before executing their payloads. Tools commonly referred to as “EDR killers” have become a standard component of attack playbooks. This reflects a continuing trend toward more deliberate and methodical intrusions.

Attackers attempt to terminate security processes and disable monitoring agents, often by exploiting trusted components such as signed drivers. This technique is called Bring Your Own Vulnerable Driver (BYOVD) and allows adversaries to blend into legitimate system activity while gradually degrading defensive visibility.

Thus, evasion is no longer an opportunistic step but a planned and repeatable phase of the attack lifecycle. As a result, organizations are increasingly challenged not just to detect ransomware but also to maintain control in environments where security controls themselves are actively targeted.

The appearance of new families adopting post-quantum cryptography

We predicted that quantum-resistant ransomware would appear in 2025. Looking back at the previous year, we see that advanced ransomware groups indeed started using post-quantum cryptography as quantum computing evolved. The encryption techniques used by this quantum-proof ransomware could be used to resist decryption attempts from both classical and quantum computers, making it nearly impossible for victims to decrypt their data without having to pay a ransom.

One example is the appearance of the PE32 ransomware family (link in Russian); it leverages the cutting-edge ML-KEM (Module-Lattice-Based Key-Encapsulation Mechanism) standard to secure its AES keys. This specific cryptographic framework was recently selected by NIST as the primary standard for post-quantum defense.

Within the PE32 ransomware architecture, this is realized through the Kyber1024 algorithm, a robust mechanism providing Level 5 security, roughly equivalent in strength to AES-256. Its primary function is the secure generation and transmission of shared secrets between parties, specifically engineered to withstand future quantum computing attacks. This shift toward post-quantum readiness is part of a broader industry trend; for instance, TLS 1.3 and QUIC protocols have already adopted the X25519Kyber768 hybrid model, which fuses classical encryption with quantum-resistant security.

The shift to encryptionless extortion

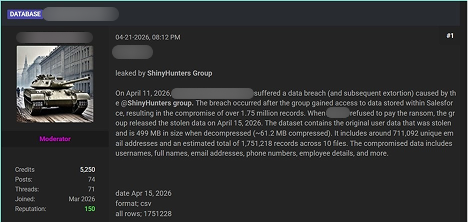
In 2025, the share of ransoms paid dropped to 28%. As a response to this, one of the developments in the 2026 landscape is the growing prevalence of extortion incidents in which no file encryption takes place at all. Instead, attackers leave out the “ware” in “ransomware” and focus on extracting sensitive data and leveraging the threat of public disclosure as their primary means of extortion. ShinyHunters is an excellent example of such a group, using a data leak site to publicize its victims.

By avoiding encryption, attackers may aim at reducing the likelihood of immediate detection, shortening the duration of the attack, and eliminating dependencies on stable encryption routines. Often, this model is used alongside traditional tactics in so-called double extortion schemes, but an increasing number of campaigns rely exclusively on data theft.

For victims, this shift fundamentally changes the nature of the risk. While backups remain effective against encryption-based disruption, they provide no protection against data exposure, regulatory consequences, and reputational damage. Ransomware is therefore evolving from a business continuity issue into a broader data security and compliance challenge.

Industrialization of initial access (Access-as-a-Service)

The ransomware ecosystem continues to evolve toward a highly industrialized and specialized model, with initial access remaining as one of its most critical components. In 2026, many ransomware operators keep relying on IABs (initial access brokers), a network of intermediaries who supply pre-compromised access to corporate environments, aiming to no longer perform full intrusions themselves.

This “access-as-a-service” model is fueled by credential theft operations, and the widespread availability of compromised accounts harvested through infostealers and phishing campaigns.

The primary access vectors offered for sale have not changed: RDP, VPN, and RDWeb are still the top access vectors. Consequently, remote access infrastructure remains the primary attack surface for initial access sales. In response to the measures against public exposure of RDP access points to the internet, attackers are now targeting RDWeb portals, which are frequently vulnerable and occasionally inadequately safeguarded.

The result is a threat landscape where unauthorized access is increasingly commoditized, and the barrier to launching ransomware attacks declines. This means that preventing initial compromise is only part of the challenge; equal emphasis must be placed on detecting misuse of legitimate credentials and limiting lateral movement within already-breached environments.

Ransomware developments on the dark web

Telegram channels and underground forums increasingly function as platforms for the distribution and sale of compromised datasets and access credentials including those that were obtained as a result of ransomware attacks.

Advertisements posted on these resources typically include the nature of the access, a description of the exfiltrated or compromised data, price terms, and contact information for prospective buyers. In addition, some malicious actors mention their collaboration with other ransomware groups. Lesser-known gangs can use this name-dropping to promote themselves

Multiple threat actors not related to ransomware groups distribute datasets downloaded from ransomware blogs on underground forums and Telegram. By re-publishing download links and files, they spread compromised data as well as information on the ransomware attack within the community.

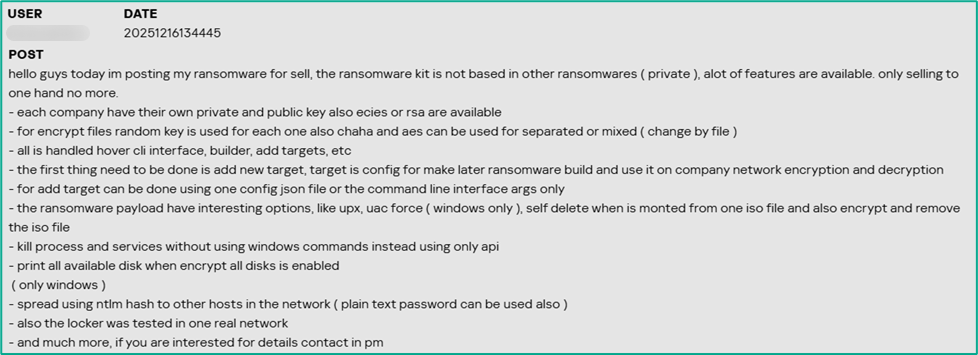
The ransomware itself is also sold or offered for subscription on the dark web platforms. The sellers underscore the uniqueness of their malware, as well as its encryption and defense evasion features.

Law enforcement actions

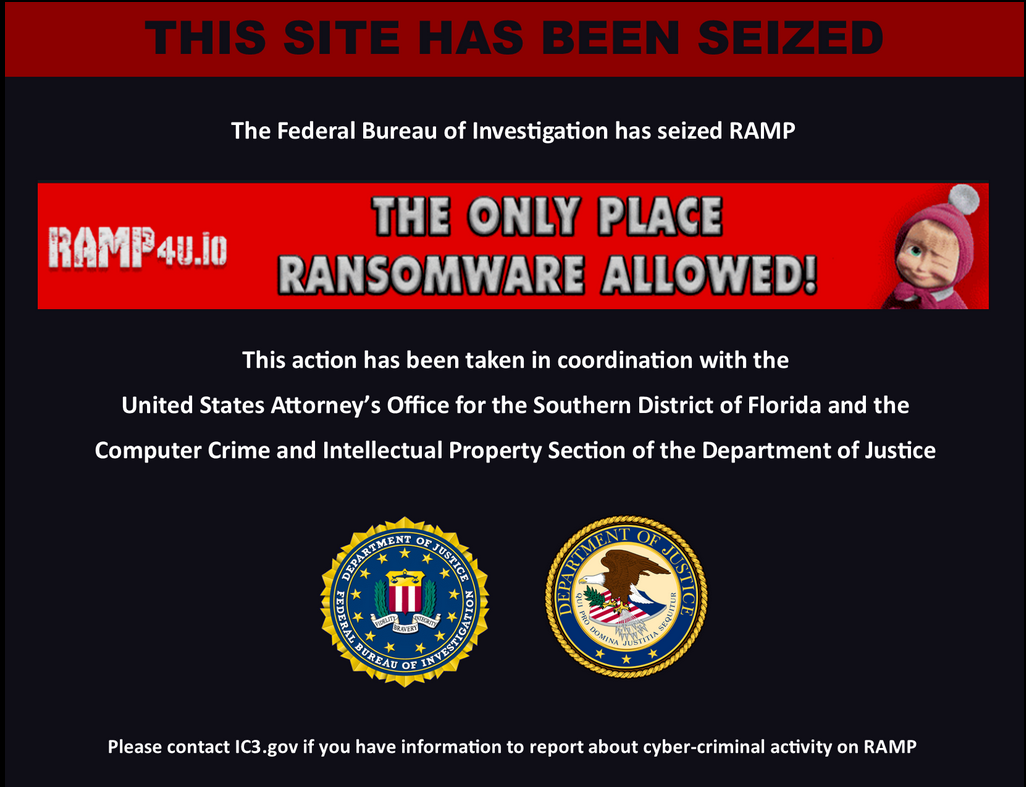
Law enforcement agencies are actively shutting down dark web platforms and ransomware data leak sites. A major underground forum, RAMP, which also functioned as a platform for threat actors to advertise their ransomware services and publish service‑related updates, was seized by authorities in January 2026. Another underground forum, LeakBase, where malicious actors distributed exfiltrated and compromised data, was seized in March 2026. In 2025, law enforcement agencies seized well-known forums like Nulled, Cracked, and XSS. Also in 2025, the DLSs of BlackSuit and 8Base ransomware groups were seized. These takedowns cause inconvenience to ransomware coordination, specifically for initial access brokers and affiliates, though similar forums are expected to fill the void over time.

Top ransomware groups in 2025

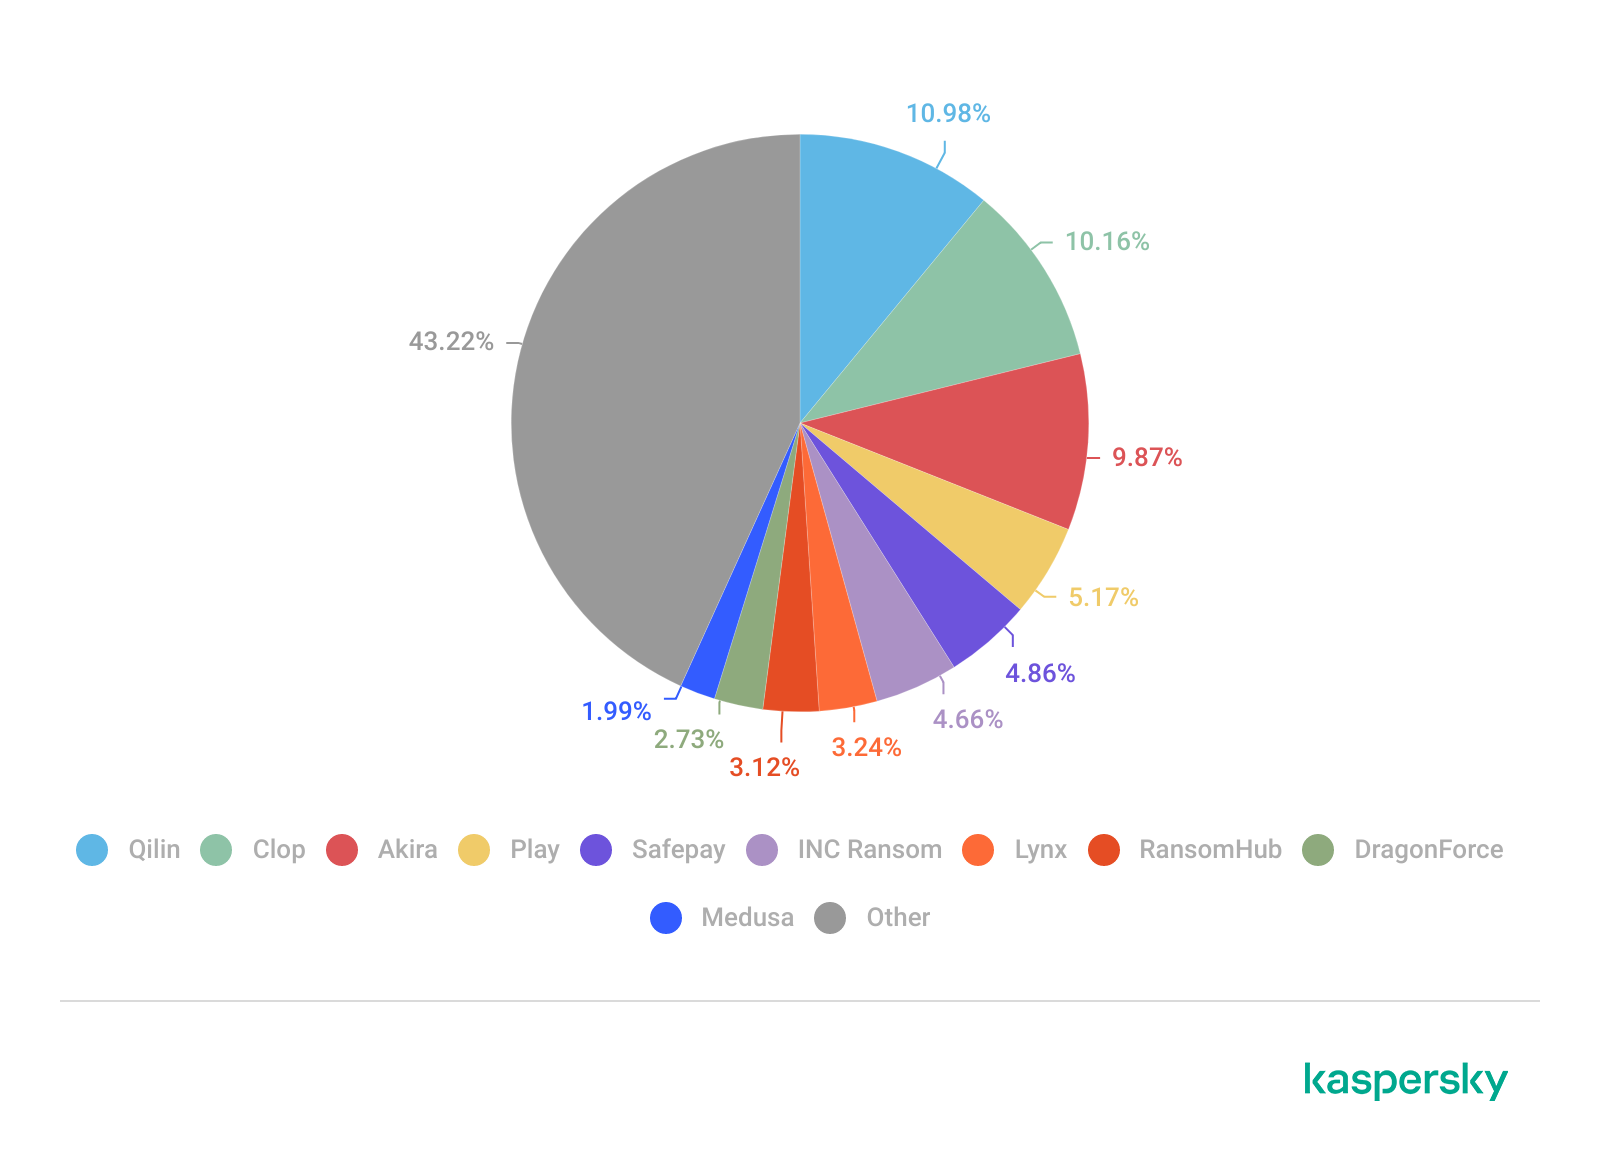
RansomHub’s sudden dormancy in 2025 marked a shift, and Qilin became the dominant player from Q2 onward. According to Kaspersky research, Qilin was the most active group executing targeted attacks in 2025.

Each group’s share of victims according to its data leak site (DLS) as a percentage of all reported victims of all groups during the period under review (download)

Qilin stands out as one of the fastest-growig and dominant RaaS platforms. Its combination of high-volume operations and structured affiliate model positions it as a central player in the current ecosystem.

Clop, the second most active group in 2025, is distinguished through its large-scale, supply-chain-style attacks, exploiting widely used file transfer and enterprise software to compromise hundreds of victims simultaneously. This one-to-many approach sets it apart from more traditional, single-target campaigns.

Third place is occupied by Akira, which remains notable for its consistency and operational stability, maintaining a steady stream of victims without major disruption. Its ability to sustain activity over time makes it one of the most reliable indicators of baseline ransomware threat levels.

Although no longer active, RansomHub stands out for its rapid rise and equally rapid disappearance in 2025, highlighting the volatility of the RaaS market. Its shutdown created a vacuum that significantly reshaped affiliate distribution across other groups.

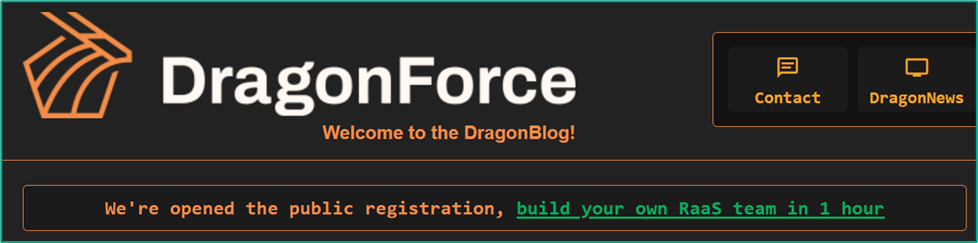
DragonForce is also notable – not just for its own operations, but for its broader influence within the ransomware ecosystem, including reported involvement in infrastructure conflicts and possible links to the disruption of competing groups. Thus, the group claims that RansomHub “has moved to their infrastructure.” This positions it as more than just an operator and potentially an ecosystem-level actor.

New actors in 2026

While emerging actors generally operate on a smaller scale, they provide insight into the continuous churn and low barrier to entry within the ransomware ecosystem.

The Gentlemen group caught our attention in early 2026, as they managed to attack a significant number of victims over a short time. This actor is also notable for reflecting a broader shift toward professionalization and controlled operations within the ransomware ecosystem. Unlike many emerging groups that rely on opportunistic attacks and inconsistent leak activity, The Gentlemen demonstrate a more deliberate approach: structured intrusion workflows, selective targeting, and measured communication with victims. This signals a move away from chaotic, high-noise campaigns toward predictable, business-like execution models that are easier to scale and harder to disrupt. Their TTPs include the massive exploitation of hardware very common on big corporations, such as FortiOS/FortiProxy, SonicWall VPN, and Cisco ASA appliances. The group might be comprised of professional cybercriminals who left other prominent groups.

The group is also notable for its emphasis on data-centric extortion strategies, often prioritizing exfiltration and leverage over purely disruptive encryption. This aligns with one of the defining trends of 2026: ransomware evolving into a form of data breach monetization rather than just system denial. By focusing on controlled pressure and reputational risk instead of immediate operational damage, The Gentlemen exemplify how attackers are adapting to lower ransom payment rates and improved backup practices among victims.
Some other groups to take note of in 2026:

  • Devman appears to be an emerging actor with limited but growing activity, likely leveraging existing tooling rather than developing custom capabilities.
  • MintEye hasn’t been very active yet, with just five known victims, suggesting opportunistic campaigns without a consistent operational tempo.
  • DireWolf is associated with small-scale, targeted attacks, though its overall footprint remains relatively limited compared to larger RaaS groups.
  • NightSpire demonstrates characteristics of an amateur group, such as mistakes during its operations, uncommon communication channels with the victims, and sometimes giving them insufficient time to pay up. Although they both encrypt and leak data, they prioritize publication rather than encryption.
  • Vect shows low-volume activity. It is yet unclear whether they use a completely new codebase or are rather a rebrand of an existing group.
  • Tengu is a less prominent actor, with limited public reporting and no clear distinguishing tactics beyond standard extortion models.
  • Kazu appears to be created by ransomware operators previously engaged with multiple other groups. As of now, they don’t stand out for scale or technique.

Although there is little to say about these groups at the time of writing this report, each of them may be equally likely to disappear from the threat landscape or grow into a prominent threat. That’s why it’s important to track them from their early days. Moreover, collectively, these groups illustrate how dynamic the ransomware landscape is, with new entrants constantly replenishing it.

Conclusion and protection recommendations

Despite the growing effort by law enforcement agencies across the globe to seize and disrupt dark web platforms and threat actor infrastructures, ransomware operations remain stable, with new groups quickly taking the place of those who went silent. In 2026, we see a shift towards encryptionless extortion, with data leaks increasingly becoming the main threat to target organizations. At the same time, data encryption is also upgrading to the next level with the emergence of post-quantum ransomware.

To resist the evolving threat, Kaspersky recommends organizations:

Prioritize proactive prevention through patching and vulnerability management. Many ransomware attacks exploit unpatched systems, so organizations should implement automated patch management tools to ensure timely updates for operating systems, software, and drivers. For Windows environments, enabling Microsoft’s Vulnerable Driver Blocklist is critical to thwarting BYOVD attacks. Regularly scan for vulnerabilities and prioritize high-severity flaws, especially in widely used software.

Strengthen remote access: RDP and RDWeb connections should never be directly exposed to the internet, only through VPN or ZTNA (Zero Trust Network Access). It’s highly recommended to adopt multi-factor authentication on everything; the architecture may require continuous authentication for access, as one valid credential captured is enough to cause a breach. Monitoring the underground for stolen employee credentials is essential. Audit open ports across the entire attack surface. The adoption of the “Principle of Least Privilege” (PoLP), where users, systems, or processes are granted only the minimum access rights, such as read, write, or execute permissions, necessary to perform their specific job functions, is highly recommended.

Strengthen endpoint and network security with advanced detection and segmentation. Deploy robust endpoint detection and response solutions such as Kaspersky NEXT EDR to monitor for suspicious activity like driver loading or process termination. Network segmentation is equally important. Limit lateral movement by isolating critical systems and using firewalls to restrict traffic. Complete and immediate offboarding for employees is necessary as well as periodic permission reviews, with automatic revocation of unused access. Sessions with complete logging for privileged accounts are more than necessary. Monitoring the traffic divergence to new sites or even to legitimate endpoints can help the defenders to spot a new insider threat.

Invest in backups, training, and incident response planning. Maintain offline or immutable backups that are tested regularly to ensure rapid recovery without paying a ransom. Backups should cover critical data and systems and be stored in air-gapped environments to resist encryption or deletion. User education is essential to combatting phishing, which remains one of the top attack vectors. Conduct simulated phishing exercises and train employees to recognize AI-crafted emails. Kaspersky Global Emergency Response Team (GERT) can help develop and test an incident response plan to minimize potential downtime and costs.

The recommendation to avoid paying a ransom remains robust, especially given the risk of unavailable keys due to dismantled infrastructure, affiliate chaos, or malicious intent. By investing in backups, incident response, and preventive measures like patching and training, organizations can avoid funding criminals and mitigate the impact.

Kaspersky also offers free decryptors for certain ransomware families. If you get hit by ransomware, check to see if there’s a decryptor available for the ransomware family used against you.

  •  

Threat landscape for industrial automation systems in Q4 2025

Statistics across all threats

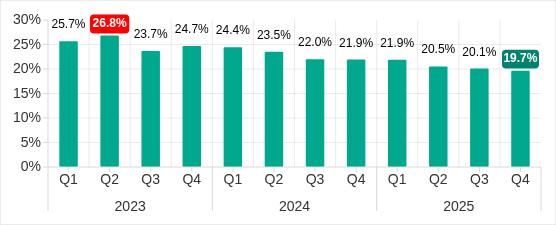
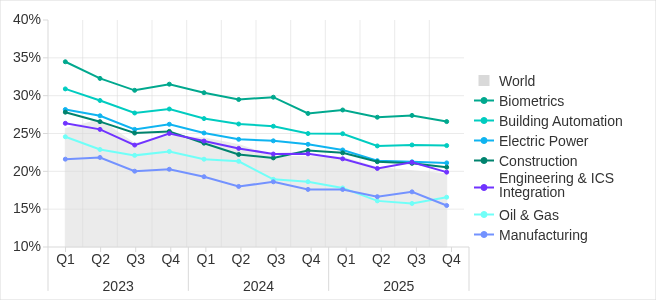
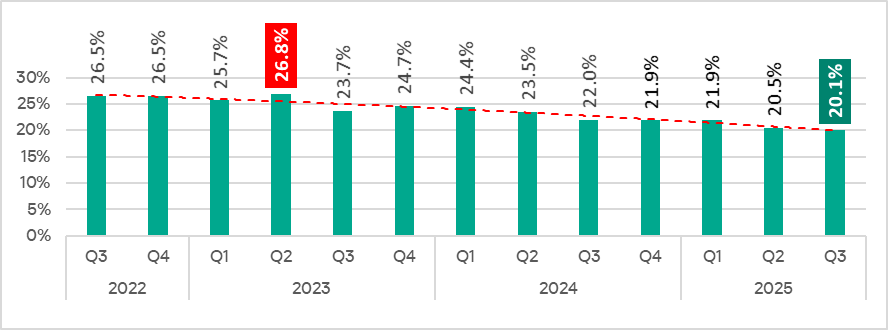
The percentage of ICS computers on which malicious objects were blocked has been decreasing since the beginning of 2024. In Q4 2025, it was 19.7%. Over the past three years, the percentage has decreased by 1.36 times, and by 1.25 times since Q4 2023.

Percentage of ICS computers on which malicious objects were blocked, Q1 2023–Q4 2025

Percentage of ICS computers on which malicious objects were blocked, Q1 2023–Q4 2025

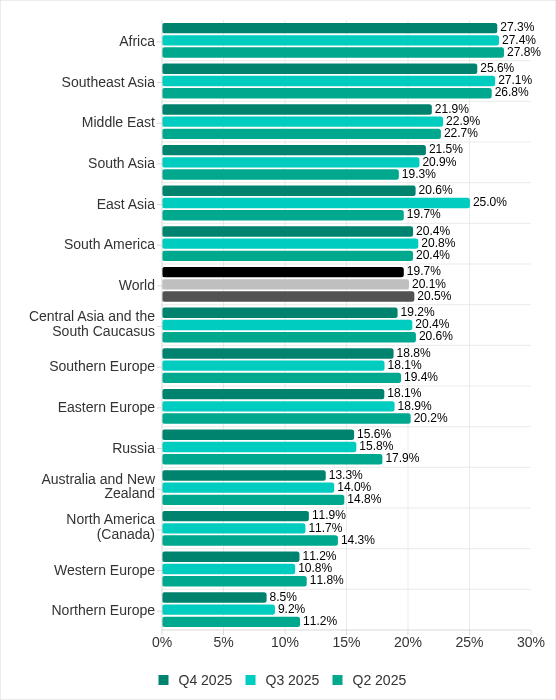
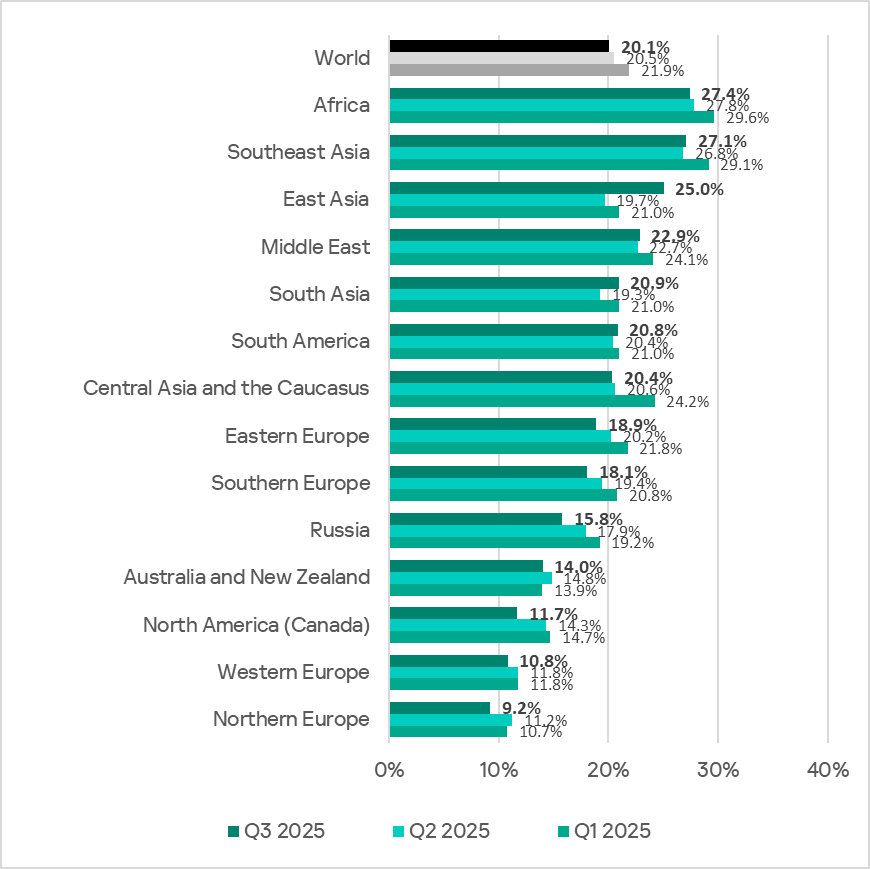
Regionally, in Q4 2025, the percentage of ICS computers on which malicious objects were blocked ranged from 8.5% in Northern Europe to 27.3% in Africa.

Regions ranked by percentage of ICS computers on which malicious objects were blocked

Regions ranked by percentage of ICS computers on which malicious objects were blocked

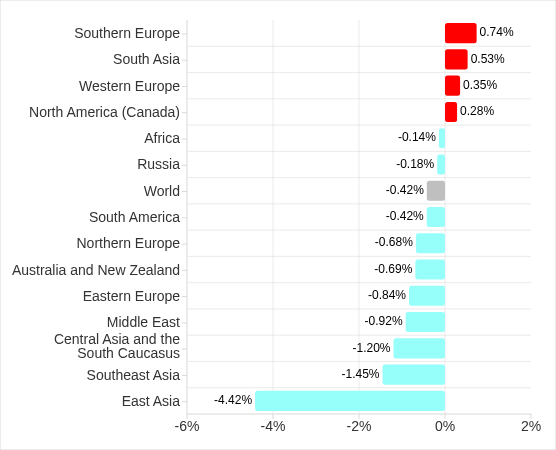
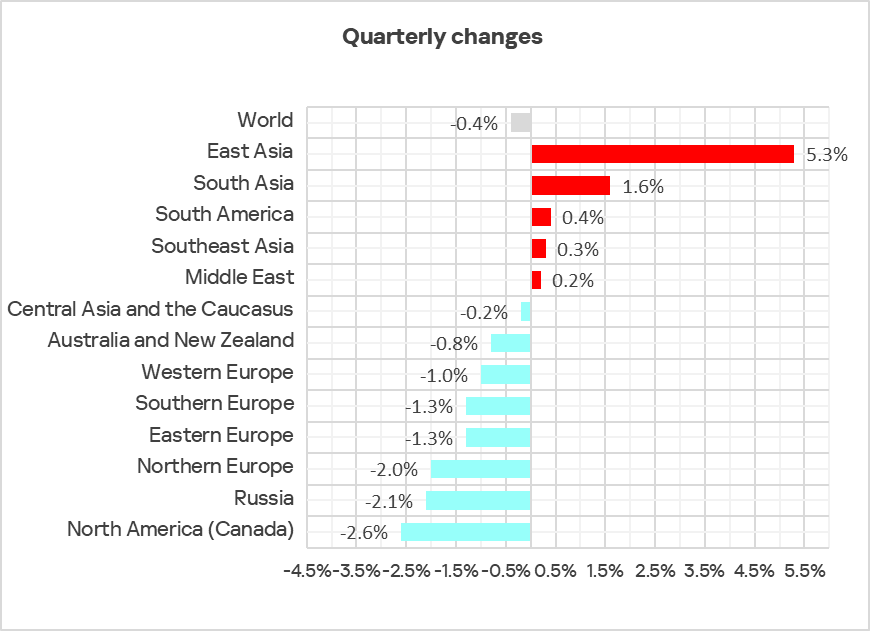
Four regions saw an increase in the percentage of ICS computers on which malicious objects were blocked. The most notable increases occurred in Southern Europe and South Asia. In Q3 2025, East Asia experienced a sharp increase triggered by the local spread of malicious scripts, but the figure has since returned to normal.

Changes in percentage of ICS computers on which malicious objects were blocked, Q4 2025

Changes in percentage of ICS computers on which malicious objects were blocked, Q4 2025

Feature of the quarter: worms in email

In Q4 2025, the percentage of ICS computers on which wormsinemailattachments were blocked increasedinallregions of the world.

Many of the blocked threats were related to the worm Backdoor.MSIL.XWorm. This malware is designed to persist on the system and then remotely control it.

Interestingly, this threat was not detected on ICS computers in the previous quarter, yet it appeared in all regions in Q4 2025.

A study found that the active spread of Backdoor.MSIL.XWorm via phishing emails was likely linked to the use by hackers of another malware obfuscation technique that was actively used during massive phishing campaigns in Q4 2025. These campaigns have been known since 2024 as “Curriculum-vitae-catalina”.

The attackers distributed phishing emails to HR managers, recruiters, and employees responsible for hiring. The messages were disguised as responses from job applicants with subjects such as “Resume” or “Attached Resume” and contained a malicious executable file under the guise of a curriculum vitae. Typically, the file was named Curriculum Vitae-Catalina.exe. When executed, it infected the system.

In Q4 2025, the threat spread across regions in two waves — one in October and another in November. Russia, Western Europe, South America, and North America (Canada) were attacked in October. A spike in Backdoor.MSIL.XWorm blocking was observed in other regions in November. The attack subsided in all regions in December.

The highest percentage of ICS computers on which Backdoor.MSIL.XWorm was blocked was observed in regions where threats from email clients had been historically blocked at high rates on ICS computers: Southern Europe, South America, and the Middle East.

At the same time, in Africa, where USB storage media are still actively used, the threat was also detected when removable devices were connected to ICS computers.

Selected industries

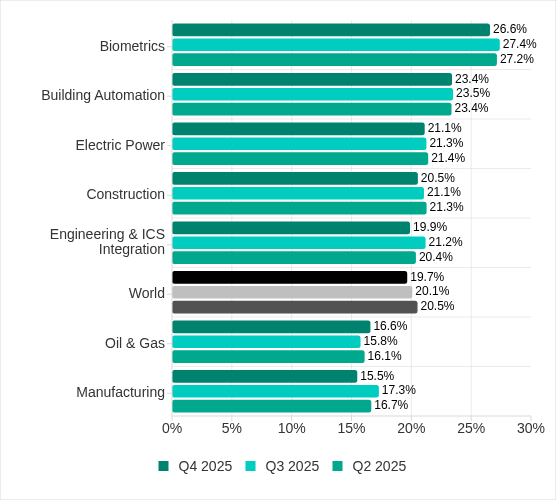
The biometrics sector has historically led the rankings of industries and OT infrastructures surveyed in this report in terms of the percentage of ICS computers on which malicious objects were blocked.

These systems are characterized by accessibility to and from the internet, as well as minimal cybersecurity controls by the consumer organization.

Rankings of industries and OT infrastructure by percentage of ICS computers on which malicious objects were blocked

Rankings of industries and OT infrastructure by percentage of ICS computers on which malicious objects were blocked

In Q4 2025, the percentage of ICS computers on which malicious objects were blocked increased only in one sector: oil and gas. The corresponding figures increased in two regions: Russia, and Central Asia and the South Caucasus.

However, if we look at a broader time span, there is a downward trend in all the surveyed industries.

Percentage of ICS computers on which malicious objects were blocked in selected industries

Percentage of ICS computers on which malicious objects were blocked in selected industries

Diversity of detected malicious objects

In Q4 2025, Kaspersky protection solutions blocked malware from 10,142 different malware families of various categories on industrial automation systems.

Percentage of ICS computers on which the activity of malicious objects from various categories was blocked

Percentage of ICS computers on which the activity of malicious objects from various categories was blocked

In Q4 2025, there was an increase in the percentage of ICS computers on which worms, and miners in the form of executable files for Windows were blocked. These were the only categories that exhibited an increase.

Main threat sources

Depending on the threat detection and blocking scenario, it is not always possible to reliably identify the source. The circumstantial evidence for a specific source can be the blocked threat’s type (category).

The internet (visiting malicious or compromised internet resources; malicious content distributed via messengers; cloud data storage and processing services and CDNs), email clients (phishing emails), and removable storage devices remain the primary sources of threats to computers in an organization’s technology infrastructure.

In Q4 2025, the percentage of ICS computers on which malicious objects from various sources were blocked decreased. All sources except email clients saw their lowest levels in three years.

Percentage of ICS computers on which malicious objects from various sources were blocked

Percentage of ICS computers on which malicious objects from various sources were blocked

The same computer can be attacked by several categories of malware from the same source during a quarter. That computer is counted when calculating the percentage of attacked computers for each threat category, but is only counted once for the threat source (we count unique attacked computers). In addition, it is not always possible to accurately determine the initial infection attempt. Therefore, the total percentage of ICS computers on which various categories of threats from a certain source were blocked can exceed the percentage of computers affected by the source itself.

  • In Q4 2025, the percentage of ICS computers on which threats from the internet were blocked decreased to 7.67% and reached its lowest level since the beginning of 2023. The main categories of internet threats are malicious scripts and phishing pages, and denylisted internet resources. The percentage ranged from 3.96% in Northern Europe to 11.33% in South Asia.
  • The main categories of threats from email clients blocked on ICS computers were malicious scripts and phishing pages, spyware, and malicious documents. Most of the spyware detected in phishing emails was delivered as a password archive or a multi-layered script embedded in office document files. The percentage of ICS computers on which threats from email clients were blocked ranged from 0.64% in Northern Europe to 6.34% in Southern Europe.
  • The main categories of threats that were blocked when removable media was connected to ICS computers were worms, viruses, and spyware. The percentage of ICS computers on which threats from removable media were blocked ranged from 0.05% in Australia and New Zealand to 1.41% in Africa.
  • The main categories of threats that spread through network folders in Q4 2025 were viruses, AutoCAD malware, worms, and spyware. The percentage of ICS computers on which threats from network folders were blocked ranged from 0.01% in Northern Europe to 0.18% in East Asia.

Threat categories

Typical attacks blocked within an OT network are multi-step sequences of malicious activities, where each subsequent step of the attackers is aimed at increasing privileges and/or gaining access to other systems by exploiting the security problems of industrial enterprises, including OT infrastructures.

Malicious objects used for initial infection

In Q4 2025, the percentage of ICS computers on which denylisted internet resources were blocked decreased to 3.26%. This is the lowest quarterly figure since the beginning of 2022, and it has decreased by 1.8 times since Q2 2025.

Percentage of ICS computers on which denylisted internet resources were blocked, Q1 2023–Q4 2025

Percentage of ICS computers on which denylisted internet resources were blocked, Q1 2023–Q4 2025

Regionally, the percentage of ICS computers on which denylisted internet resources were blocked ranged from 1.74% in Northern Europe to 3.93% in Southeast Asia, which displaced Africa from first place. Russia rounded out the top three regions for this indicator.

The percentage of ICS computers on which malicious documents were blocked increased for three consecutive quarters. However, in Q4 2025 it decreased by 0.22 pp to 1.76%.

Percentage of ICS computers on which malicious documents were blocked, Q1 2023–Q4 2025

Percentage of ICS computers on which malicious documents were blocked, Q1 2023–Q4 2025

Regionally, the percentage ranged from 0.46% in Northern Europe to 3.82% in Southern Europe. In Q4 2025, the indicator increased in Eastern Europe, Russia, and Western Europe.

The percentage of ICS computers on which malicious scripts and phishing pages were blocked decreased to 6.58%. Despite the decline, this category led the rankings of threat categories in terms of the percentage of ICS computers on which they were blocked.

Percentage of ICS computers on which malicious scripts and phishing pages were blocked, Q1 2023–Q4 2025

Percentage of ICS computers on which malicious scripts and phishing pages were blocked, Q1 2023–Q4 2025

Regionally, the percentage ranged from 2.52% in Northern Europe to 10.50% in South Asia. The indicator increased in South Asia, South America, Southern Europe, and Africa. South Asia saw the most notable increase, at 3.47 pp.

Next-stage malware

Malicious objects used to initially infect computers deliver next-stage malware — spyware, ransomware, and miners — to victims’ computers. As a rule, the higher the percentage of ICS computers on which the initial infection malware is blocked, the higher the percentage for next-stage malware.

In Q4 2025, the percentage of ICS computers on which spyware, ransomware and web miners were blocked decreased. The rates were:

  • Spyware: 3.80% (down 0.24 pp). For the second quarter in a row, spyware took second place in the rankings of threat categories in terms of the percentage of ICS computers on which it was blocked.
  • Ransomware: 0.16% (down 0.01 pp).
  • Web miners: 0.24% (down 0.01 pp), this is the lowest level observed thus far in the period under review.

The percentage of ICS computers on which miners in the form of executable files for Windows were blocked increased to 0.60% (up 0.03 pp).

Self-propagating malware

Self-propagating malware (worms and viruses) is a category unto itself. Worms and virus-infected files were originally used for initial infection, but as botnet functionality evolved, they took on next-stage characteristics.

To spread across ICS networks, viruses and worms rely on removable media and network folders and are distributed in the form of infected files, such as archives with backups, office documents, pirated games and hacked applications. In rarer and more dangerous cases, web pages with network equipment settings, as well as files stored in internal document management systems, product lifecycle management (PLM) systems, resource management (ERP) systems and other web services are infected.

In Q4 2025, the percentage of ICS computers on which worms were blocked increased by 1.6 times to 1.60%. As mentioned above, this increase is related to a global phishing attack that spread the Backdoor.MSIL.XWorm backdoor worm across all regions of the world. The percentage increased in all regions. The biggest increase (up by 2.16 times) was in Southern Europe. The malware was primary distributed through email clients, and Southern Europe led the way in terms of the percentage of ICS computers on which threats from email clients were blocked.

The percentage of ICS computers on which viruses were blocked decreased to 1.33%.

AutoCAD malware

This category of malware can spread in a variety of ways, so it does not belong to a specific group.

After an increase in the previous quarter, the percentage of ICS computers on which AutoCAD malware was blocked decreased to 0.29% in Q4 2025.

For more information on industrial threats see the full version of the report.

  •  

Threat landscape for industrial automation systems in Q3 2025

Statistics across all threats

In Q3 2025, the percentage of ICS computers on which malicious objects were blocked decreased from the previous quarter by 0.4 pp to 20.1%. This is the lowest level for the observed period.

Percentage of ICS computers on which malicious objects were blocked, Q3 2022–Q3 2025

Percentage of ICS computers on which malicious objects were blocked, Q3 2022–Q3 2025

Regionally, the percentage of ICS computers on which malicious objects were blocked ranged from 9.2% in Northern Europe to 27.4% in Africa.

Regions ranked by percentage of ICS computers on which malicious objects were blocked

Regions ranked by percentage of ICS computers on which malicious objects were blocked

In Q3 2025, the percentage increased in five regions. The most notable increase occurred in East Asia, triggered by the local spread of malicious scripts in the OT infrastructure of engineering organizations and ICS integrators.

Changes in the percentage of ICS computers on which malicious objects were blocked, Q3 2025

Changes in the percentage of ICS computers on which malicious objects were blocked, Q3 2025

Selected industries

The biometrics sector traditionally led the rankings of the industries and OT infrastructures surveyed in this report in terms of the percentage of ICS computers on which malicious objects were blocked.

Rankings of industries and OT infrastructures by percentage of ICS computers on which malicious objects were blocked

Rankings of industries and OT infrastructures by percentage of ICS computers on which malicious objects were blocked

In Q3 2025, the percentage of ICS computers on which malicious objects were blocked increased in four of the seven surveyed industries. The most notable increases were in engineering and ICS integrators, and manufacturing.

Percentage of ICS computers on which malicious objects were blocked in selected industries

Percentage of ICS computers on which malicious objects were blocked in selected industries

Diversity of detected malicious objects

In Q3 2025, Kaspersky protection solutions blocked malware from 11,356 different malware families of various categories on industrial automation systems.

Percentage of ICS computers on which the activity of malicious objects of various categories was blocked

Percentage of ICS computers on which the activity of malicious objects of various categories was blocked

In Q3 2025, there was a decrease in the percentage of ICS computers on which denylisted internet resources and miners of both categories were blocked. These were the only categories that exhibited a decrease.

Main threat sources

Depending on the threat detection and blocking scenario, it is not always possible to reliably identify the source. The circumstantial evidence for a specific source can be the blocked threat’s type (category).

The internet (visiting malicious or compromised internet resources; malicious content distributed via messengers; cloud data storage and processing services and CDNs), email clients (phishing emails), and removable storage devices remain the primary sources of threats to computers in an organization’s technology infrastructure.

In Q3 2025, the percentage of ICS computers on which malicious objects from various sources were blocked decreased.

Percentage of ICS computers on which malicious objects from various sources were blocked

Percentage of ICS computers on which malicious objects from various sources were blocked

The same computer can be attacked by several categories of malware from the same source during a quarter. That computer is counted when calculating the percentage of attacked computers for each threat category, but is only counted once for the threat source (we count unique attacked computers). In addition, it is not always possible to accurately determine the initial infection attempt. Therefore, the total percentage of ICS computers on which various categories of threats from a certain source were blocked can exceed the percentage of threats from the source itself.

  • The main categories of threats from the internet blocked on ICS computers in Q3 2025 were malicious scripts and phishing pages, and denylisted internet resources. The percentage ranged from 4.57% in Northern Europe to 10.31% in Africa.
  • The main categories of threats from email clients blocked on ICS computers were malicious scripts and phishing pages, spyware, and malicious documents. Most of the spyware detected in phishing emails was delivered as a password-protected archive or a multi-layered script embedded in an office document. The percentage of ICS computers on which threats from email clients were blocked ranged from 0.78% in Russia to 6.85% in Southern Europe.
  • The main categories of threats that were blocked when removable media was connected to ICS computers were worms, viruses, and spyware. The percentage of ICS computers on which threats from this source were blocked ranged from 0.05% in Australia and New Zealand to 1.43% in Africa.
  • The main categories of threats that spread through network folders were viruses, AutoCAD malware, worms, and spyware. The percentages of ICS computers where threats from this source were blocked ranged from 0.006% in Northern Europe to 0.20% in East Asia.

Threat categories

Typical attacks blocked within an OT network are multi-step sequences of malicious activities, where each subsequent step of the attackers is aimed at increasing privileges and/or gaining access to other systems by exploiting the security problems of industrial enterprises, including technological infrastructures.

Malicious objects used for initial infection

In Q3 2025, the percentage of ICS computers on which denylisted internet resources were blocked decreased to 4.01%. This is the lowest quarterly figure since the beginning of 2022.

Percentage of ICS computers on which denylisted internet resources were blocked, Q3 2022–Q3 2025

Percentage of ICS computers on which denylisted internet resources were blocked, Q3 2022–Q3 2025

Regionally, the percentage of ICS computers on which denylisted internet resources were blocked ranged from 2.35% in Australia and New Zealand to 4.96% in Africa. Southeast Asia and South Asia were also among the top three regions for this indicator.

The percentage of ICS computers on which malicious documents were blocked has grown for three consecutive quarters, following a decline at the end of 2024. In Q3 2025, it reached 1,98%.

Percentage of ICS computers on which malicious documents were blocked, Q3 2022–Q3 2025

Percentage of ICS computers on which malicious documents were blocked, Q3 2022–Q3 2025

The indicator increased in four regions: South America, East Asia, Southeast Asia, and Australia and New Zealand. South America saw the largest increase as a result of a large-scale phishing campaign in which attackers used new exploits for an old vulnerability (CVE-2017-11882) in Microsoft Office Equation Editor to deliver various spyware to victims’ computers. It is noteworthy that the attackers in this phishing campaign used localized Spanish-language emails disguised as business correspondence.

In Q3 2025, the percentage of ICS computers on which malicious scripts and phishing pages were blocked increased to 6.79%. This category led the rankings of threat categories in terms of the percentage of ICS computers on which they were blocked.

Percentage of ICS computers on which malicious scripts and phishing pages were blocked, Q3 2022–Q3 2025

Percentage of ICS computers on which malicious scripts and phishing pages were blocked, Q3 2022–Q3 2025

Regionally, the percentage of ICS computers on which malicious scripts and phishing pages were blocked ranged from 2.57% in Northern Europe to 9.41% in Africa. The top three regions for this indicator were Africa, East Asia, and South America. The indicator increased the most in East Asia (by a dramatic 5.23 pp) as a result of the local spread of malicious spyware scripts loaded into the memory of popular torrent clients including MediaGet.

Next-stage malware

Malicious objects used to initially infect computers deliver next-stage malware — spyware, ransomware, and miners — to victims’ computers. As a rule, the higher the percentage of ICS computers on which the initial infection malware is blocked, the higher the percentage for next-stage malware.
In Q3 2025, the percentage of ICS computers on which spyware and ransomware were blocked increased. The rates were:

  • spyware: 4.04% (up 0.20 pp);
  • ransomware: 0.17% (up 0.03 pp).

The percentage of ICS computers on which miners of both categories were blocked decreased. The rates were:

  • miners in the form of executable files for Windows: 0.57% (down 0.06 pp), it’s the lowest level since Q3 2022;
  • web miners: 0.25% (down 0.05 pp). This is the lowest level since Q3 2022.

Self-propagating malware

Self-propagating malware (worms and viruses) is a category unto itself. Worms and virus-infected files were originally used for initial infection, but as botnet functionality evolved, they took on next-stage characteristics.

To spread across ICS networks, viruses and worms rely on removable media and network folders in the form of infected files, such as archives with backups, office documents, pirated games and hacked applications. In rarer and more dangerous cases, web pages with network equipment settings, as well as files stored in internal document management systems, product lifecycle management (PLM) systems, resource management (ERP) systems and other web services are infected.

In Q3 2025, the percentage of ICS computers on which worms and viruses were blocked increased to 1.26% (by 0.04 pp) and 1.40% (by 0.11 pp), respectively.

AutoCAD malware

This category of malware can spread in a variety of ways, so it does not belong to a specific group.

In Q3 2025, the percentage of ICS computers on which AutoCAD malware was blocked slightly increased to 0.30% (by 0.01 pp).

For more information on industrial threats see the full version of the report.

  •  
❌