Reading view

Threat landscape for industrial automation systems in Q4 2025

Statistics across all threats

The percentage of ICS computers on which malicious objects were blocked has been decreasing since the beginning of 2024. In Q4 2025, it was 19.7%. Over the past three years, the percentage has decreased by 1.36 times, and by 1.25 times since Q4 2023.
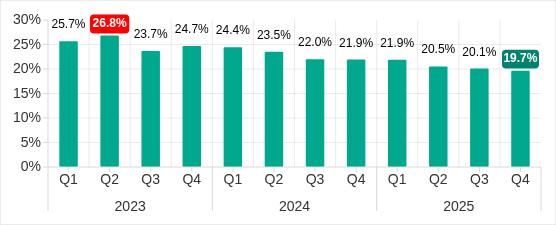
Percentage of ICS computers on which malicious objects were blocked, Q1 2023–Q4 2025

Percentage of ICS computers on which malicious objects were blocked, Q1 2023–Q4 2025

Regionally, in Q4 2025, the percentage of ICS computers on which malicious objects were blocked ranged from 8.5% in Northern Europe to 27.3% in Africa.
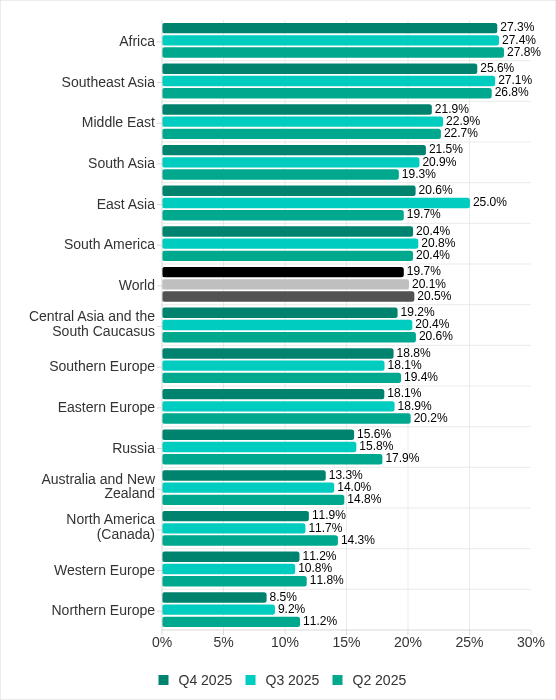
Regions ranked by percentage of ICS computers on which malicious objects were blocked

Regions ranked by percentage of ICS computers on which malicious objects were blocked

Four regions saw an increase in the percentage of ICS computers on which malicious objects were blocked. The most notable increases occurred in Southern Europe and South Asia. In Q3 2025, East Asia experienced a sharp increase triggered by the local spread of malicious scripts, but the figure has since returned to normal.
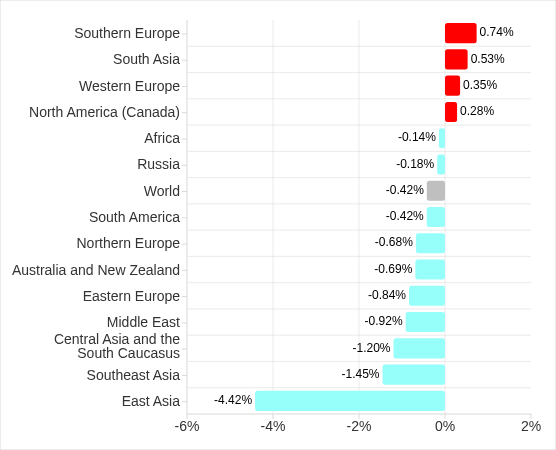
Changes in percentage of ICS computers on which malicious objects were blocked, Q4 2025

Changes in percentage of ICS computers on which malicious objects were blocked, Q4 2025

Feature of the quarter: worms in email

In Q4 2025, the percentage of ICS computers on which wormsinemailattachments were blocked increasedinallregions of the world.

Many of the blocked threats were related to the worm Backdoor.MSIL.XWorm. This malware is designed to persist on the system and then remotely control it.

Interestingly, this threat was not detected on ICS computers in the previous quarter, yet it appeared in all regions in Q4 2025.

A study found that the active spread of Backdoor.MSIL.XWorm via phishing emails was likely linked to the use by hackers of another malware obfuscation technique that was actively used during massive phishing campaigns in Q4 2025. These campaigns have been known since 2024 as “Curriculum-vitae-catalina”.

The attackers distributed phishing emails to HR managers, recruiters, and employees responsible for hiring. The messages were disguised as responses from job applicants with subjects such as “Resume” or “Attached Resume” and contained a malicious executable file under the guise of a curriculum vitae. Typically, the file was named Curriculum Vitae-Catalina.exe. When executed, it infected the system.

In Q4 2025, the threat spread across regions in two waves — one in October and another in November. Russia, Western Europe, South America, and North America (Canada) were attacked in October. A spike in Backdoor.MSIL.XWorm blocking was observed in other regions in November. The attack subsided in all regions in December.

The highest percentage of ICS computers on which Backdoor.MSIL.XWorm was blocked was observed in regions where threats from email clients had been historically blocked at high rates on ICS computers: Southern Europe, South America, and the Middle East.

At the same time, in Africa, where USB storage media are still actively used, the threat was also detected when removable devices were connected to ICS computers.

Selected industries

The biometrics sector has historically led the rankings of industries and OT infrastructures surveyed in this report in terms of the percentage of ICS computers on which malicious objects were blocked.

These systems are characterized by accessibility to and from the internet, as well as minimal cybersecurity controls by the consumer organization.
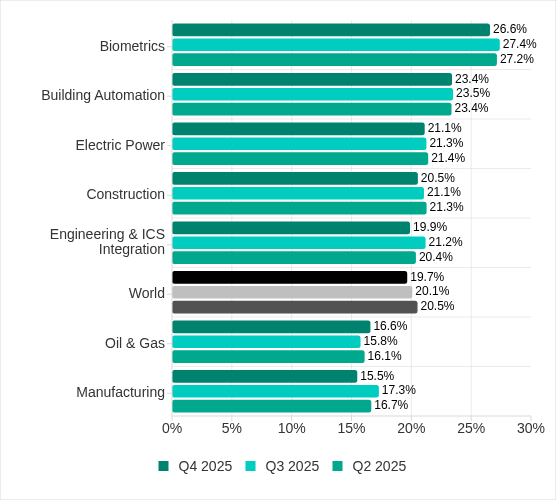
Rankings of industries and OT infrastructure by percentage of ICS computers on which malicious objects were blocked

Rankings of industries and OT infrastructure by percentage of ICS computers on which malicious objects were blocked

In Q4 2025, the percentage of ICS computers on which malicious objects were blocked increased only in one sector: oil and gas. The corresponding figures increased in two regions: Russia, and Central Asia and the South Caucasus.

However, if we look at a broader time span, there is a downward trend in all the surveyed industries.
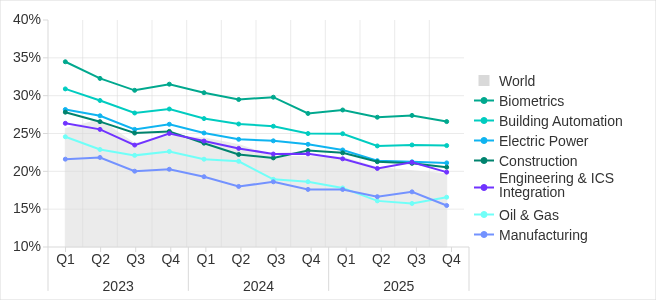
Percentage of ICS computers on which malicious objects were blocked in selected industries

Percentage of ICS computers on which malicious objects were blocked in selected industries

Diversity of detected malicious objects

In Q4 2025, Kaspersky protection solutions blocked malware from 10,142 different malware families of various categories on industrial automation systems.
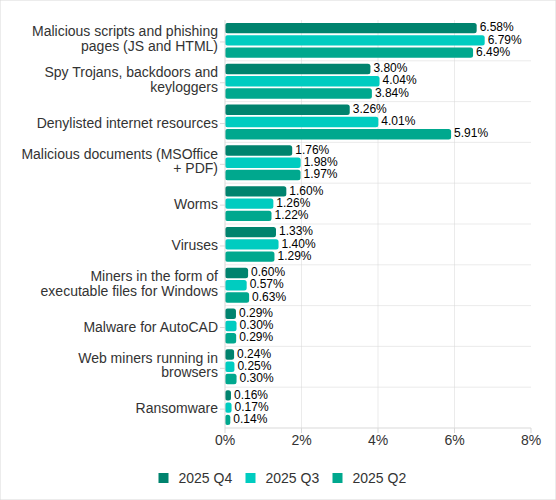
Percentage of ICS computers on which the activity of malicious objects from various categories was blocked

Percentage of ICS computers on which the activity of malicious objects from various categories was blocked

In Q4 2025, there was an increase in the percentage of ICS computers on which worms, and miners in the form of executable files for Windows were blocked. These were the only categories that exhibited an increase.

Main threat sources

Depending on the threat detection and blocking scenario, it is not always possible to reliably identify the source. The circumstantial evidence for a specific source can be the blocked threat’s type (category).

The internet (visiting malicious or compromised internet resources; malicious content distributed via messengers; cloud data storage and processing services and CDNs), email clients (phishing emails), and removable storage devices remain the primary sources of threats to computers in an organization’s technology infrastructure.

In Q4 2025, the percentage of ICS computers on which malicious objects from various sources were blocked decreased. All sources except email clients saw their lowest levels in three years.
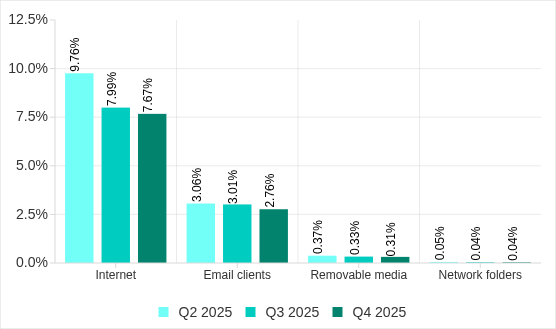
Percentage of ICS computers on which malicious objects from various sources were blocked

Percentage of ICS computers on which malicious objects from various sources were blocked

The same computer can be attacked by several categories of malware from the same source during a quarter. That computer is counted when calculating the percentage of attacked computers for each threat category, but is only counted once for the threat source (we count unique attacked computers). In addition, it is not always possible to accurately determine the initial infection attempt. Therefore, the total percentage of ICS computers on which various categories of threats from a certain source were blocked can exceed the percentage of computers affected by the source itself.

  • In Q4 2025, the percentage of ICS computers on which threats from the internet were blocked decreased to 7.67% and reached its lowest level since the beginning of 2023. The main categories of internet threats are malicious scripts and phishing pages, and denylisted internet resources. The percentage ranged from 3.96% in Northern Europe to 11.33% in South Asia.
  • The main categories of threats from email clients blocked on ICS computers were malicious scripts and phishing pages, spyware, and malicious documents. Most of the spyware detected in phishing emails was delivered as a password archive or a multi-layered script embedded in office document files. The percentage of ICS computers on which threats from email clients were blocked ranged from 0.64% in Northern Europe to 6.34% in Southern Europe.
  • The main categories of threats that were blocked when removable media was connected to ICS computers were worms, viruses, and spyware. The percentage of ICS computers on which threats from removable media were blocked ranged from 0.05% in Australia and New Zealand to 1.41% in Africa.
  • The main categories of threats that spread through network folders in Q4 2025 were viruses, AutoCAD malware, worms, and spyware. The percentage of ICS computers on which threats from network folders were blocked ranged from 0.01% in Northern Europe to 0.18% in East Asia.

Threat categories

Typical attacks blocked within an OT network are multi-step sequences of malicious activities, where each subsequent step of the attackers is aimed at increasing privileges and/or gaining access to other systems by exploiting the security problems of industrial enterprises, including OT infrastructures.

Malicious objects used for initial infection

In Q4 2025, the percentage of ICS computers on which denylisted internet resources were blocked decreased to 3.26%. This is the lowest quarterly figure since the beginning of 2022, and it has decreased by 1.8 times since Q2 2025.
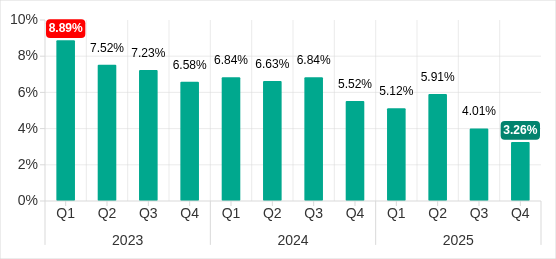
Percentage of ICS computers on which denylisted internet resources were blocked, Q1 2023–Q4 2025

Percentage of ICS computers on which denylisted internet resources were blocked, Q1 2023–Q4 2025

Regionally, the percentage of ICS computers on which denylisted internet resources were blocked ranged from 1.74% in Northern Europe to 3.93% in Southeast Asia, which displaced Africa from first place. Russia rounded out the top three regions for this indicator.

The percentage of ICS computers on which malicious documents were blocked increased for three consecutive quarters. However, in Q4 2025 it decreased by 0.22 pp to 1.76%.
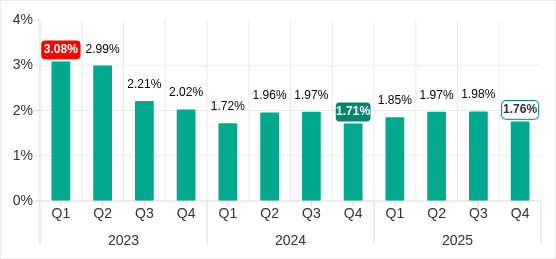
Percentage of ICS computers on which malicious documents were blocked, Q1 2023–Q4 2025

Percentage of ICS computers on which malicious documents were blocked, Q1 2023–Q4 2025

Regionally, the percentage ranged from 0.46% in Northern Europe to 3.82% in Southern Europe. In Q4 2025, the indicator increased in Eastern Europe, Russia, and Western Europe.

The percentage of ICS computers on which malicious scripts and phishing pages were blocked decreased to 6.58%. Despite the decline, this category led the rankings of threat categories in terms of the percentage of ICS computers on which they were blocked.
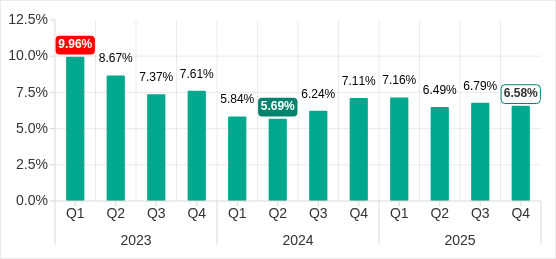
Percentage of ICS computers on which malicious scripts and phishing pages were blocked, Q1 2023–Q4 2025

Percentage of ICS computers on which malicious scripts and phishing pages were blocked, Q1 2023–Q4 2025

Regionally, the percentage ranged from 2.52% in Northern Europe to 10.50% in South Asia. The indicator increased in South Asia, South America, Southern Europe, and Africa. South Asia saw the most notable increase, at 3.47 pp.

Next-stage malware

Malicious objects used to initially infect computers deliver next-stage malware — spyware, ransomware, and miners — to victims’ computers. As a rule, the higher the percentage of ICS computers on which the initial infection malware is blocked, the higher the percentage for next-stage malware.

In Q4 2025, the percentage of ICS computers on which spyware, ransomware and web miners were blocked decreased. The rates were:

  • Spyware: 3.80% (down 0.24 pp). For the second quarter in a row, spyware took second place in the rankings of threat categories in terms of the percentage of ICS computers on which it was blocked.
  • Ransomware: 0.16% (down 0.01 pp).
  • Web miners: 0.24% (down 0.01 pp), this is the lowest level observed thus far in the period under review.

The percentage of ICS computers on which miners in the form of executable files for Windows were blocked increased to 0.60% (up 0.03 pp).

Self-propagating malware

Self-propagating malware (worms and viruses) is a category unto itself. Worms and virus-infected files were originally used for initial infection, but as botnet functionality evolved, they took on next-stage characteristics.

To spread across ICS networks, viruses and worms rely on removable media and network folders and are distributed in the form of infected files, such as archives with backups, office documents, pirated games and hacked applications. In rarer and more dangerous cases, web pages with network equipment settings, as well as files stored in internal document management systems, product lifecycle management (PLM) systems, resource management (ERP) systems and other web services are infected.

In Q4 2025, the percentage of ICS computers on which worms were blocked increased by 1.6 times to 1.60%. As mentioned above, this increase is related to a global phishing attack that spread the Backdoor.MSIL.XWorm backdoor worm across all regions of the world. The percentage increased in all regions. The biggest increase (up by 2.16 times) was in Southern Europe. The malware was primary distributed through email clients, and Southern Europe led the way in terms of the percentage of ICS computers on which threats from email clients were blocked.

The percentage of ICS computers on which viruses were blocked decreased to 1.33%.

AutoCAD malware

This category of malware can spread in a variety of ways, so it does not belong to a specific group.

After an increase in the previous quarter, the percentage of ICS computers on which AutoCAD malware was blocked decreased to 0.29% in Q4 2025.

For more information on industrial threats see the full version of the report.

  •  

Financial cyberthreats in 2025 and the outlook for 2026

In 2025, the financial cyberthreat landscape continued to evolve. While traditional PC banking malware declined in relative prevalence, this shift was offset by the rapid growth of credential theft by infostealers. Attackers increasingly relied on aggregation and reuse of stolen data, rather than developing entirely new malware capabilities.

To describe the financial threat landscape in 2025, we analyzed anonymized data on malicious activities detected on the devices of Kaspersky security product users and consensually provided to us through the Kaspersky Security Network (KSN), along with publicly available data and data on the dark web.

We analyzed the data for

  • financial phishing,
  • banking malware,
  • infostealers and the dark web.

Key findings

Phishing

Phishing activity in 2025 shifted toward e-commerce (14.17%) and digital services (16.15%), with attackers increasingly tailoring campaigns to regional trends and user behavior, making social engineering more targeted despite reduced focus on traditional banking lures.

Banking malware

Financial PC malware declined in prevalence but remained a persistent threat, with established families continuing to operate, while attackers increasingly prioritize credential access and indirect fraud over deploying complex banking Trojans. To the contrary, mobile banking malware continues growing, as we wrote in detail in our mobile malware report.

Infostealers and the dark web

Infostealers became a central driver of financial cybercrime, fueling a growing dark web economy where stolen credentials, payment data, and full identity profiles are traded at scale, enabling widespread and destructive fraud operations.

Financial phishing

In 2025, online fraudsters continued to lure users to phishing and scam pages that mimicked the websites of popular brands and financial organizations. Attackers leveraged increasingly convincing social engineering techniques and brand impersonation to exploit user trust. Rather than relying solely on volume, campaigns showed greater targeting and contextual adaptation, reflecting a maturation of phishing operations.

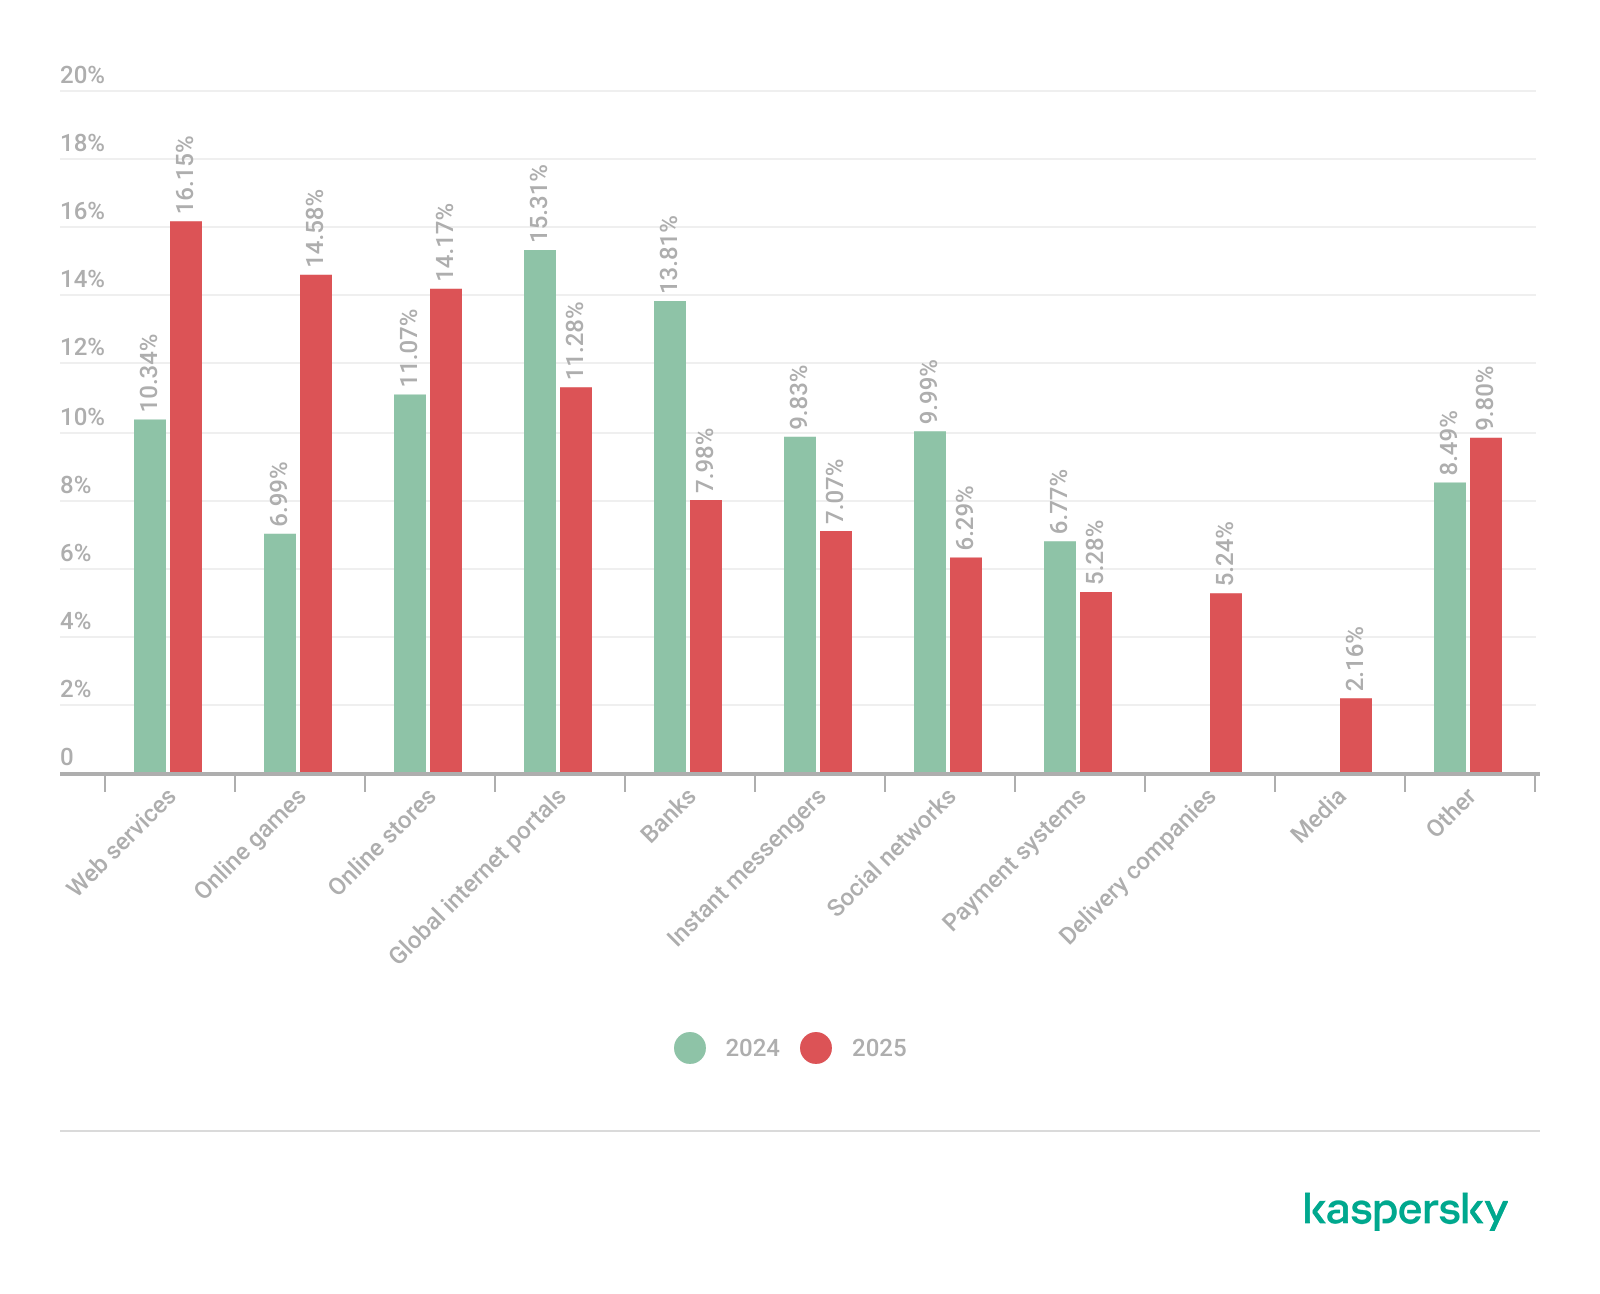
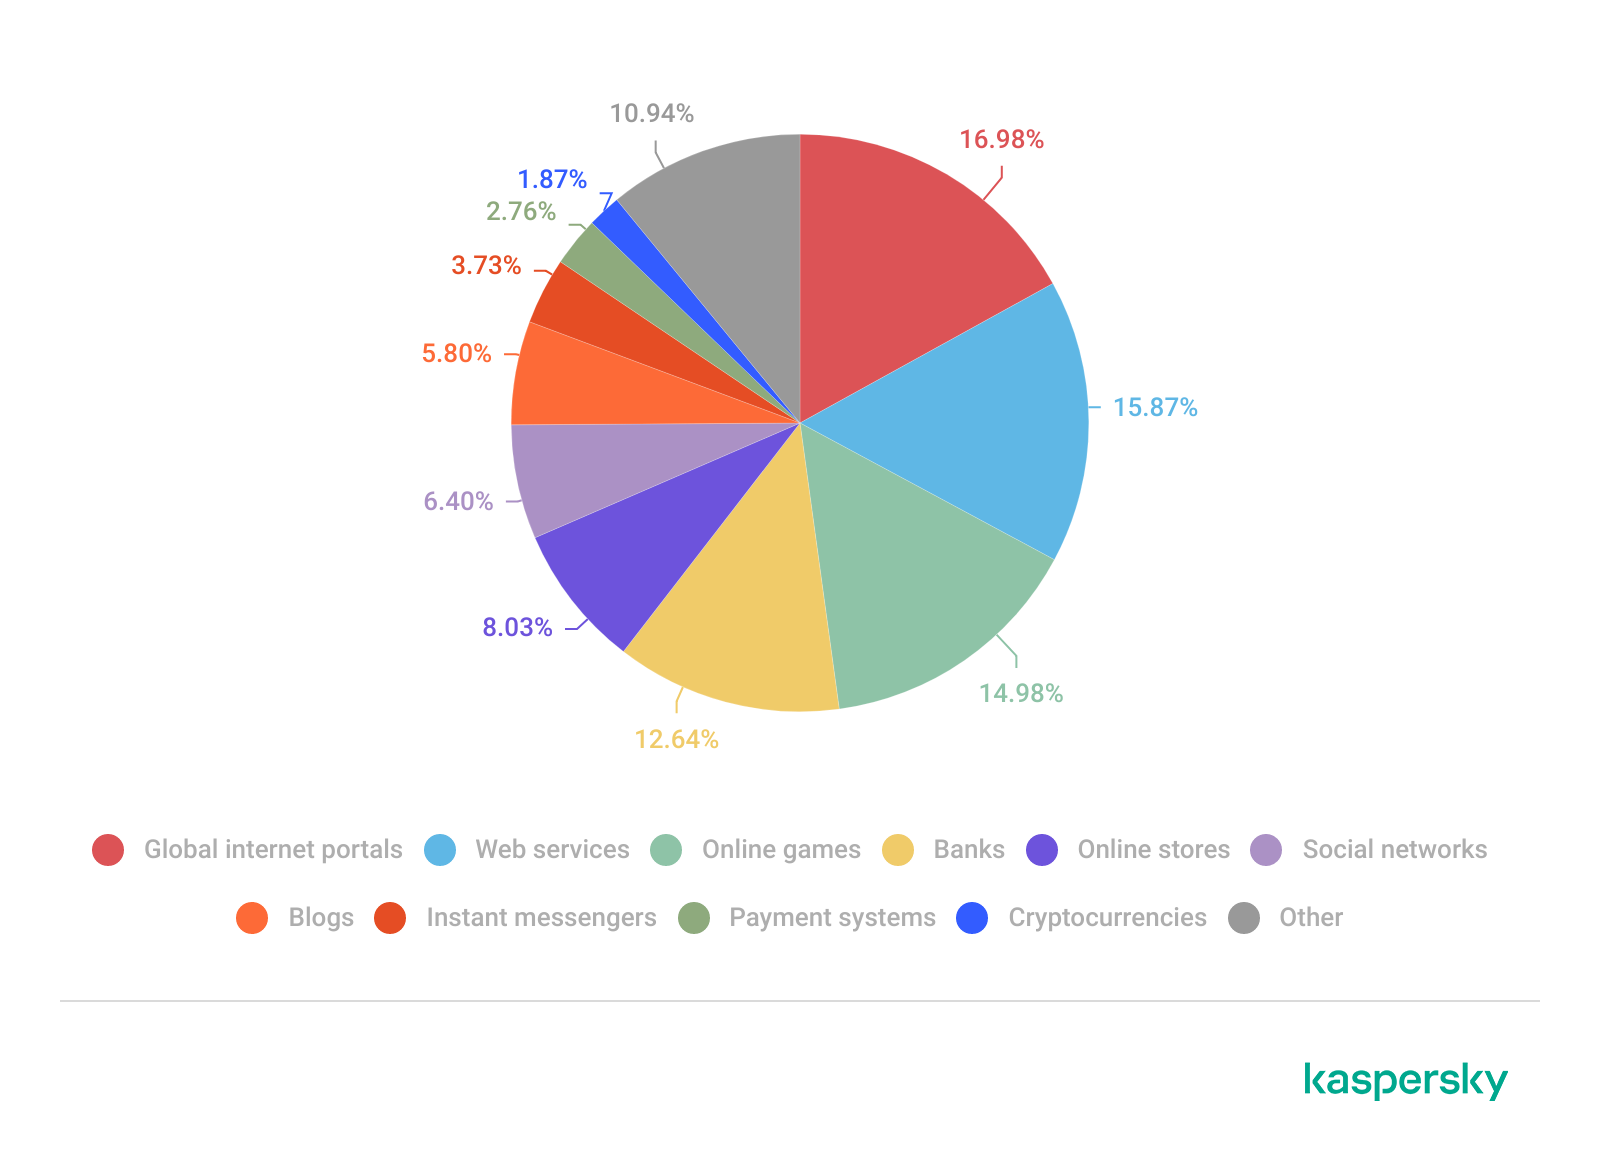
The distribution of top phishing categories in 2025 shows a clear shift toward digital platforms that aggregate multiple user activities, with web services (16.15%), online games (14.58%), and online stores (14.17%) leading globally. Compared to 2024, the rise of online games and the decline of social networks and banks indicate that attackers are increasingly targeting environments where users are more likely to take a risk or engage impulsively. Categories such as instant messaging apps and global internet portals remain significant phishing targets, reflecting their role as communication and access hubs that can be exploited for credential harvesting.

TOP 10 categories of organizations mimicked by phishing and scam pages that were blocked on home users’ devices, 2025 (download)

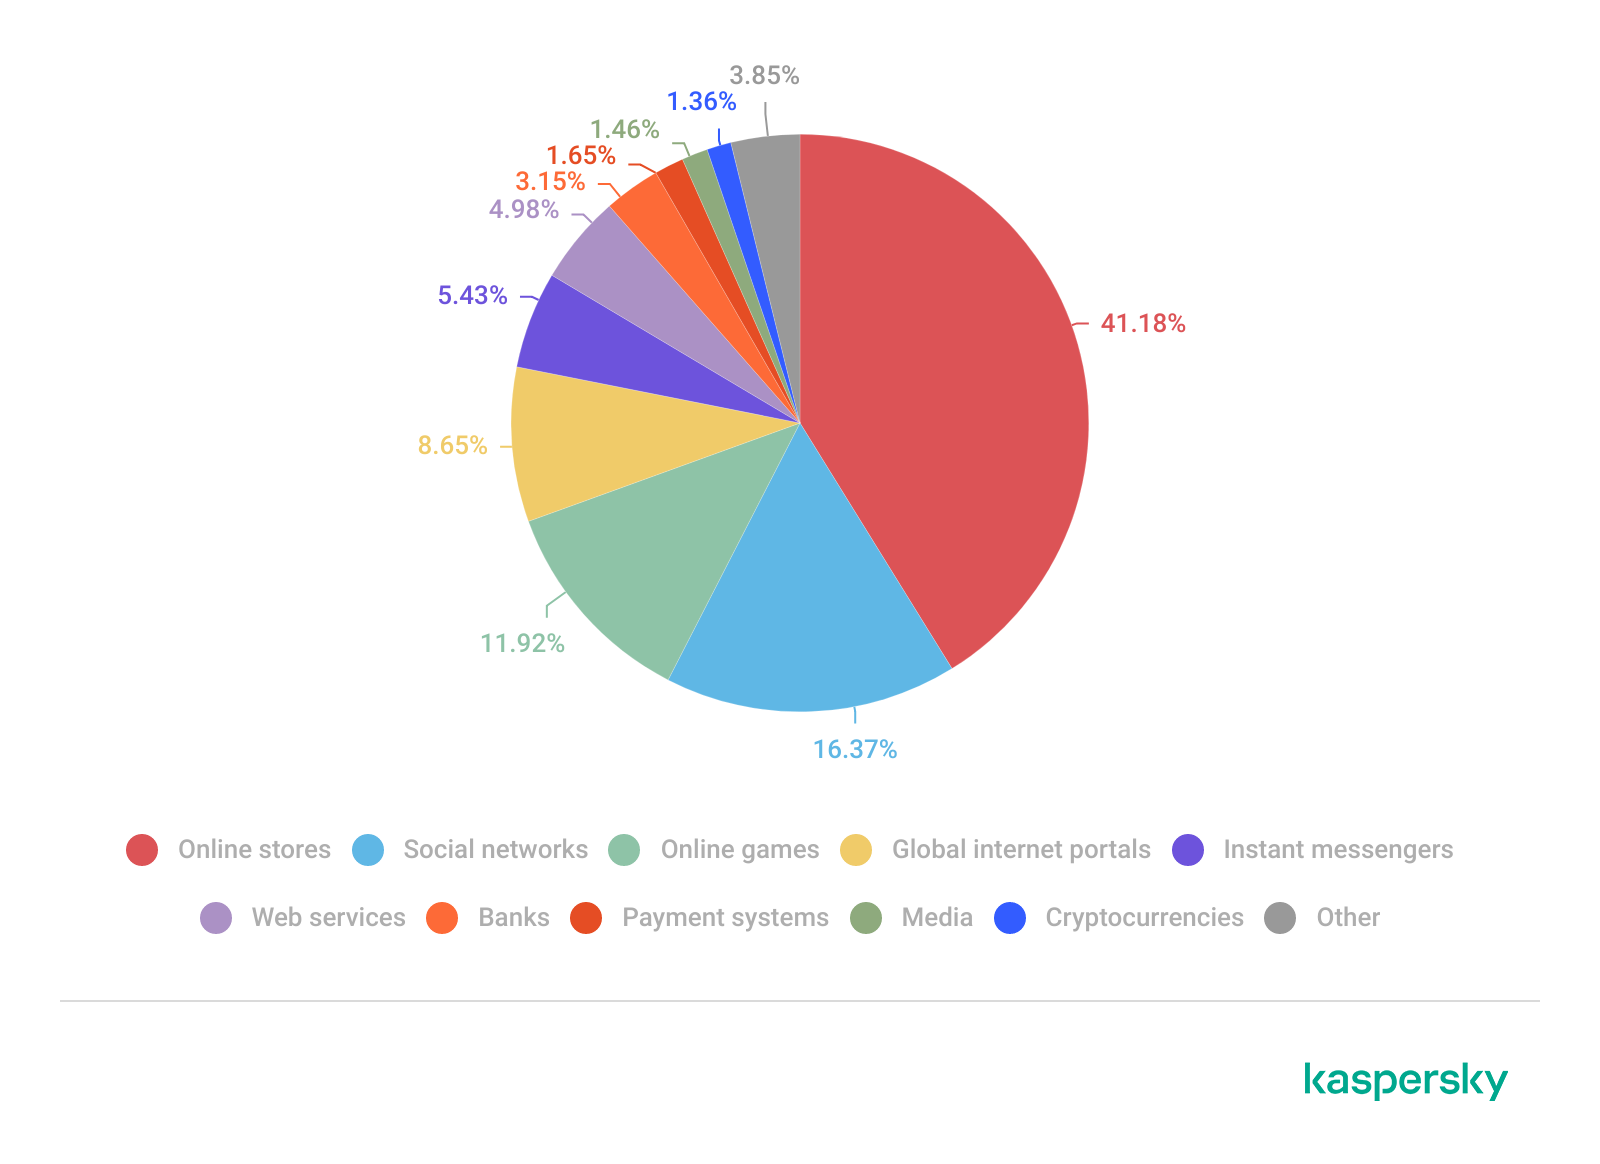
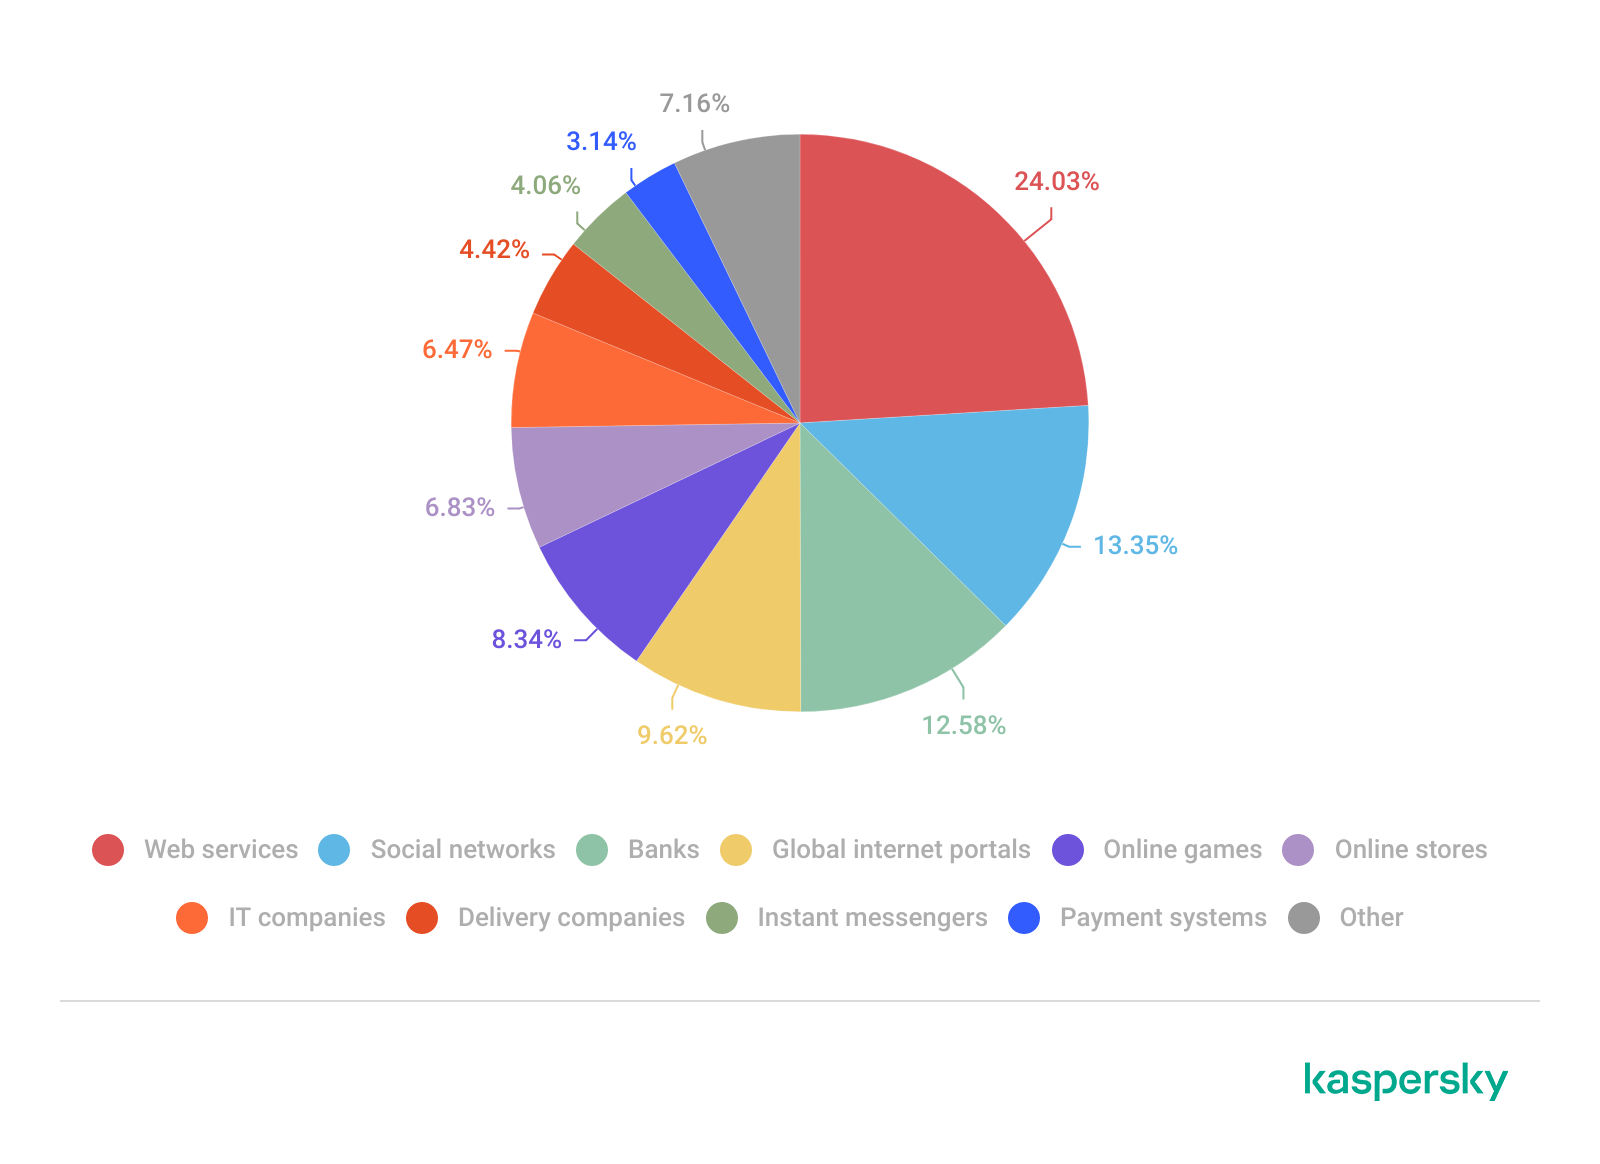
Regional patterns further reinforce the adaptive nature of phishing campaigns, showing that attackers closely align category targeting with local digital habits. For example, online stores dominate heavily in the Middle East.

TOP 10 categories of organizations mimicked by phishing and scam pages that were blocked on home users’ devices in the Middle East, 2025 (download)

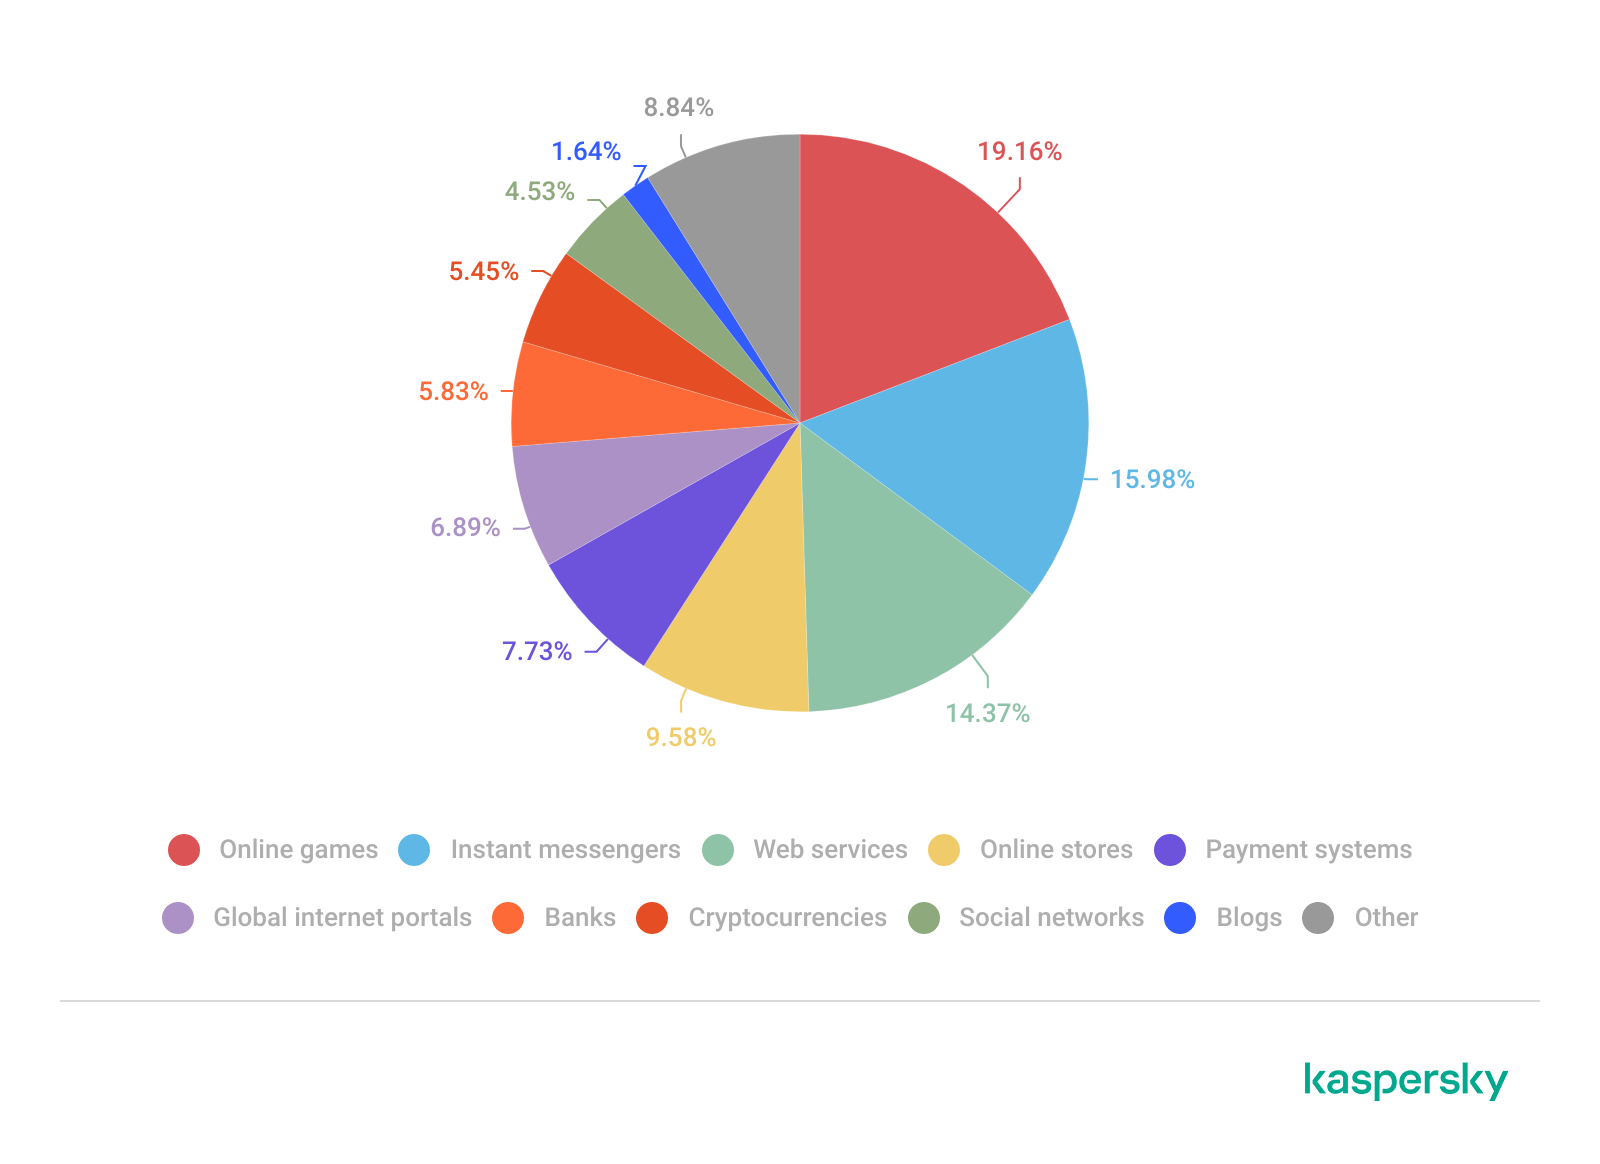
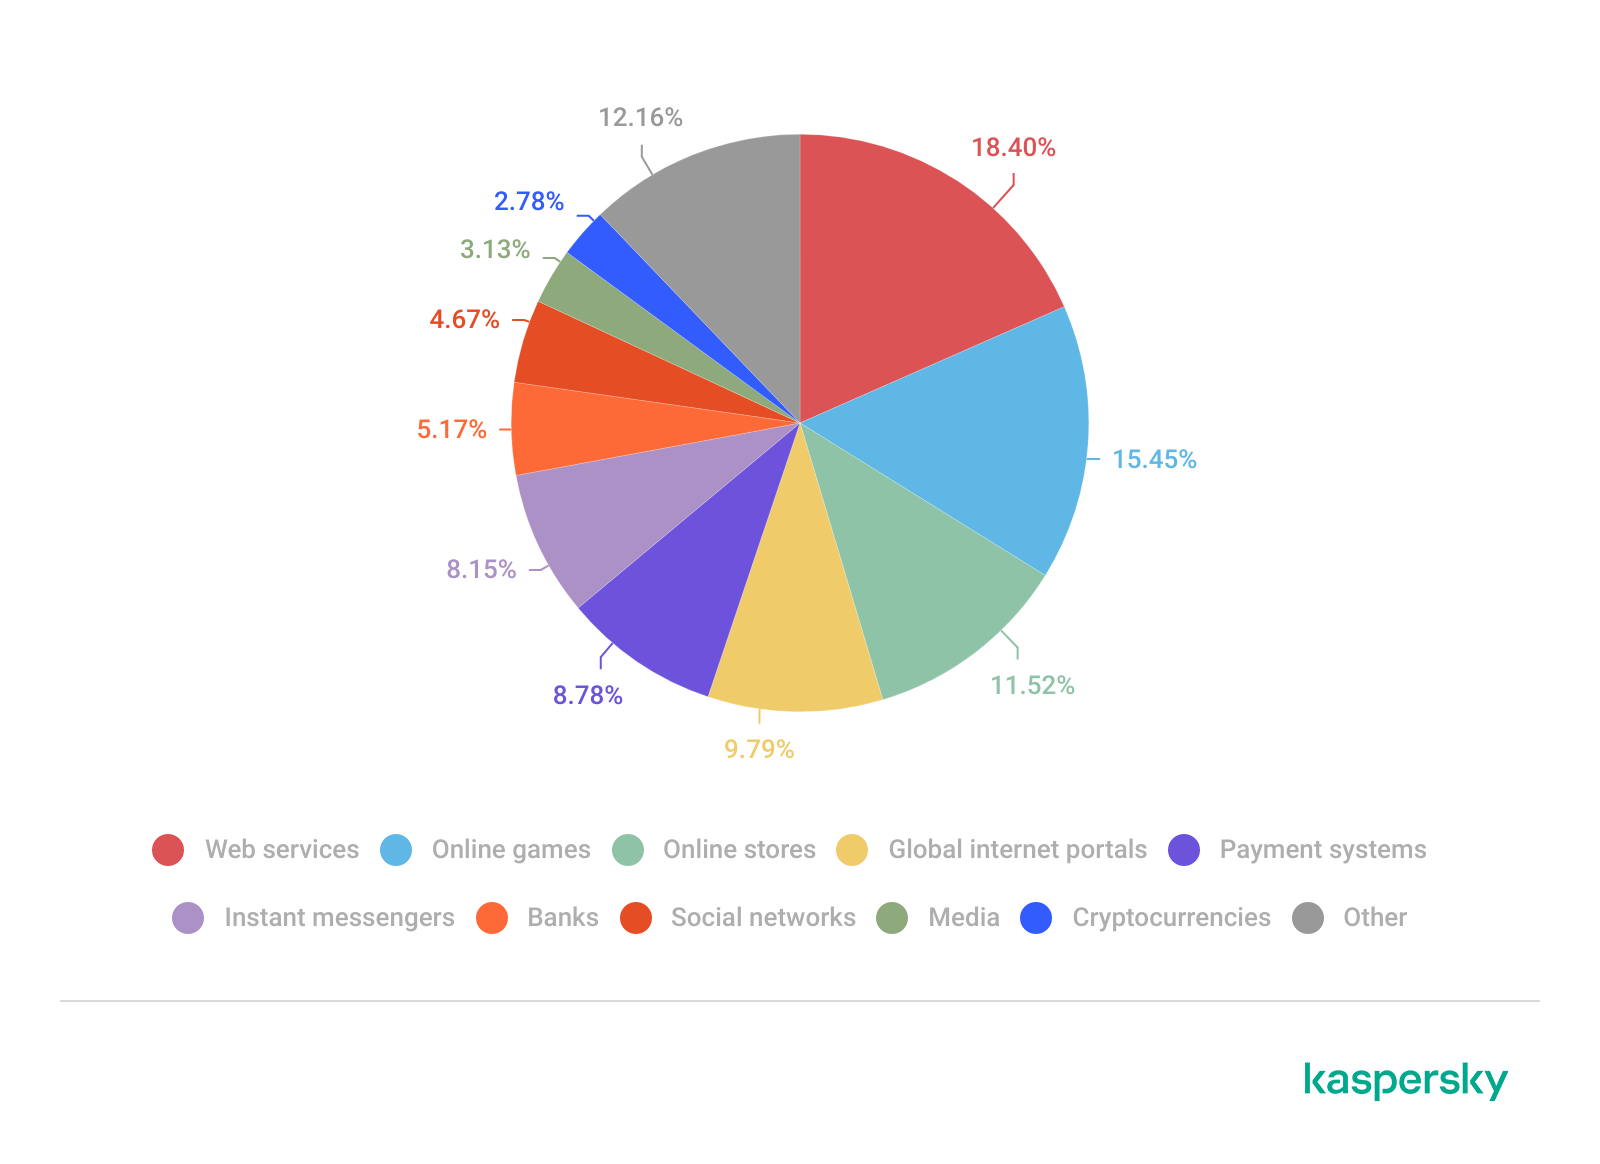
Online games and instant messaging platforms feature more prominently in the CIS, suggesting a focus on younger or highly connected user bases.

TOP 10 categories of organizations mimicked by phishing and scam pages that were blocked on home users’ devices in the CIS, 2025 (download)

APAC demonstrates almost equal shares of online games and banks which signifies a combined approach targeting different users.

TOP 10 categories of organizations mimicked by phishing and scam pages that were blocked on home users’ devices in APAC, 2025 (download)

In Africa, a stronger emphasis on banks reflects the continued importance of traditional financial services. Most likely, this is due to the lower security level of the financial institutions in the region.

TOP 10 categories of organizations mimicked by phishing and scam pages that were blocked on home users’ devices in Africa, 2025 (download)

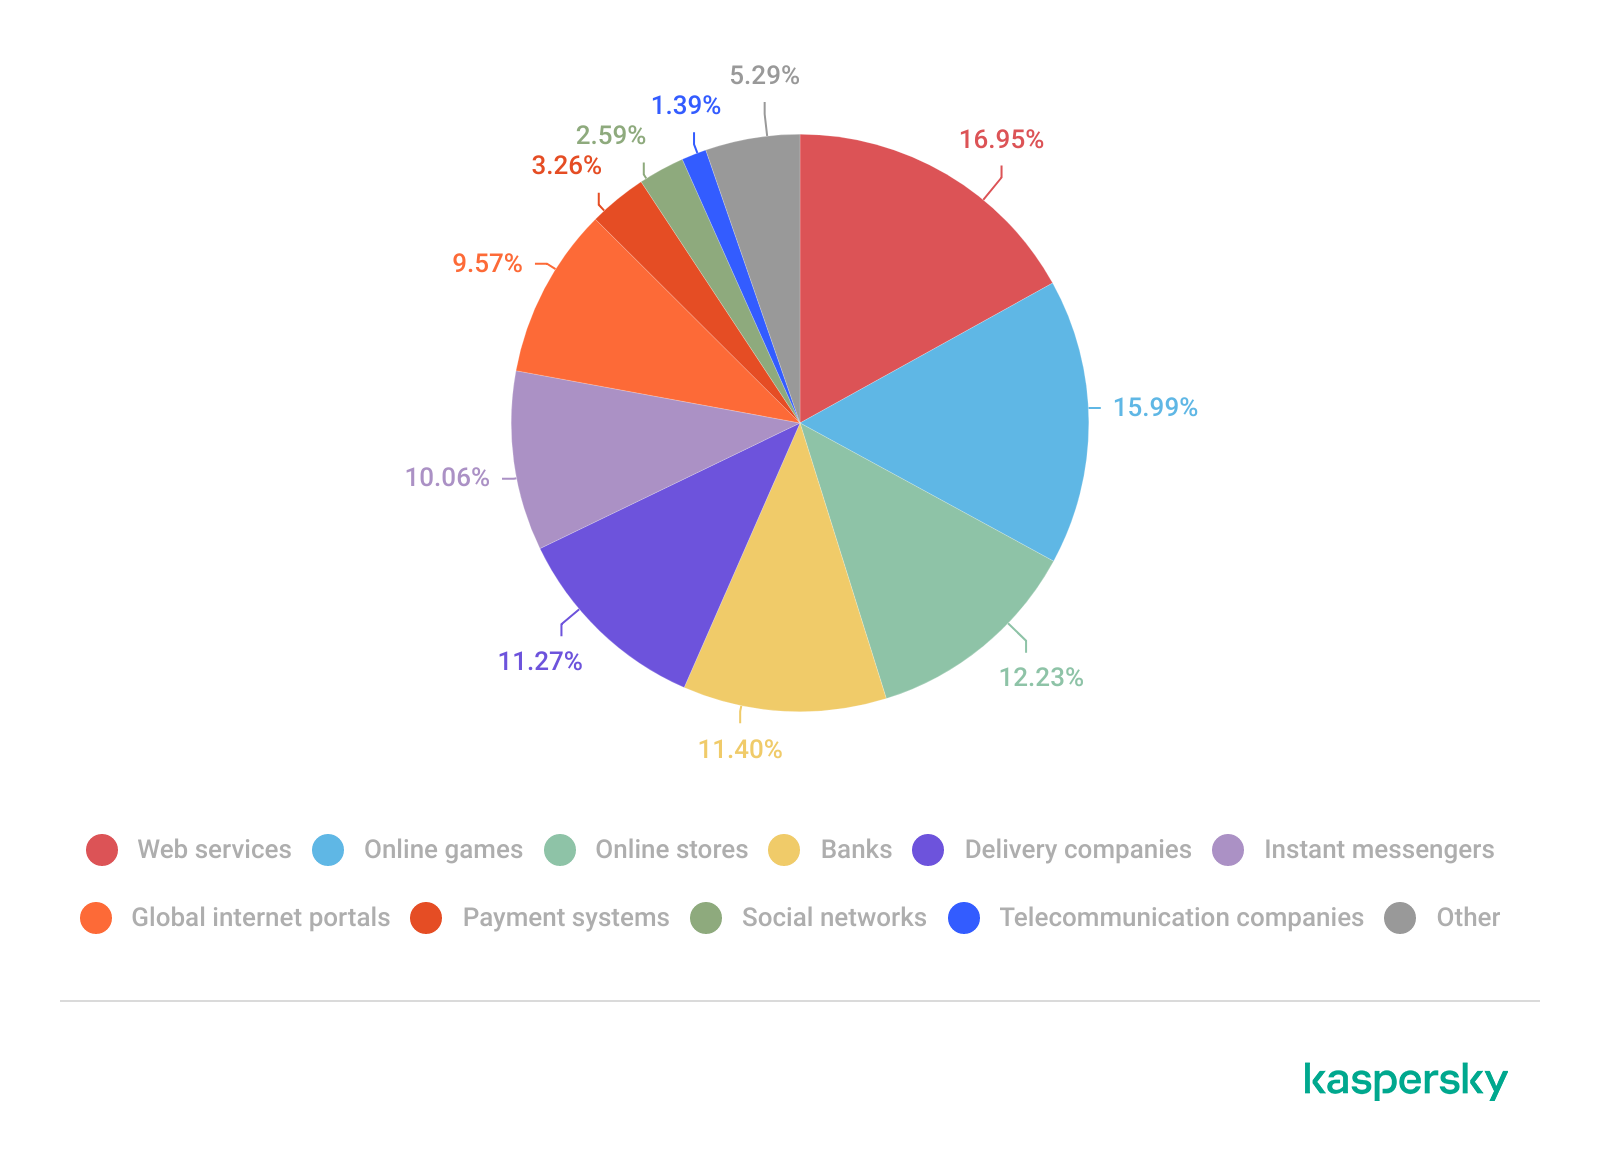
Whereas in LATAM, delivery companies appearing in the top categories indicate attackers exploiting the growth of e-commerce logistics.

TOP 10 categories of organizations mimicked by phishing and scam pages that were blocked on home users’ devices in Latin America, 2025 (download)

Europe presents a more balanced distribution across categories, pointing to diversified attack strategies.

TOP 10 categories of organizations mimicked by phishing and scam pages that were blocked on home users’ devices in Europe, 2025 (download)

Attackers actively localize their tactics to maximize relevance and effectiveness.

The distribution of financial phishing pages by category in 2025 reveals strong regional asymmetries that reflect both user behavior and attacker prioritization.

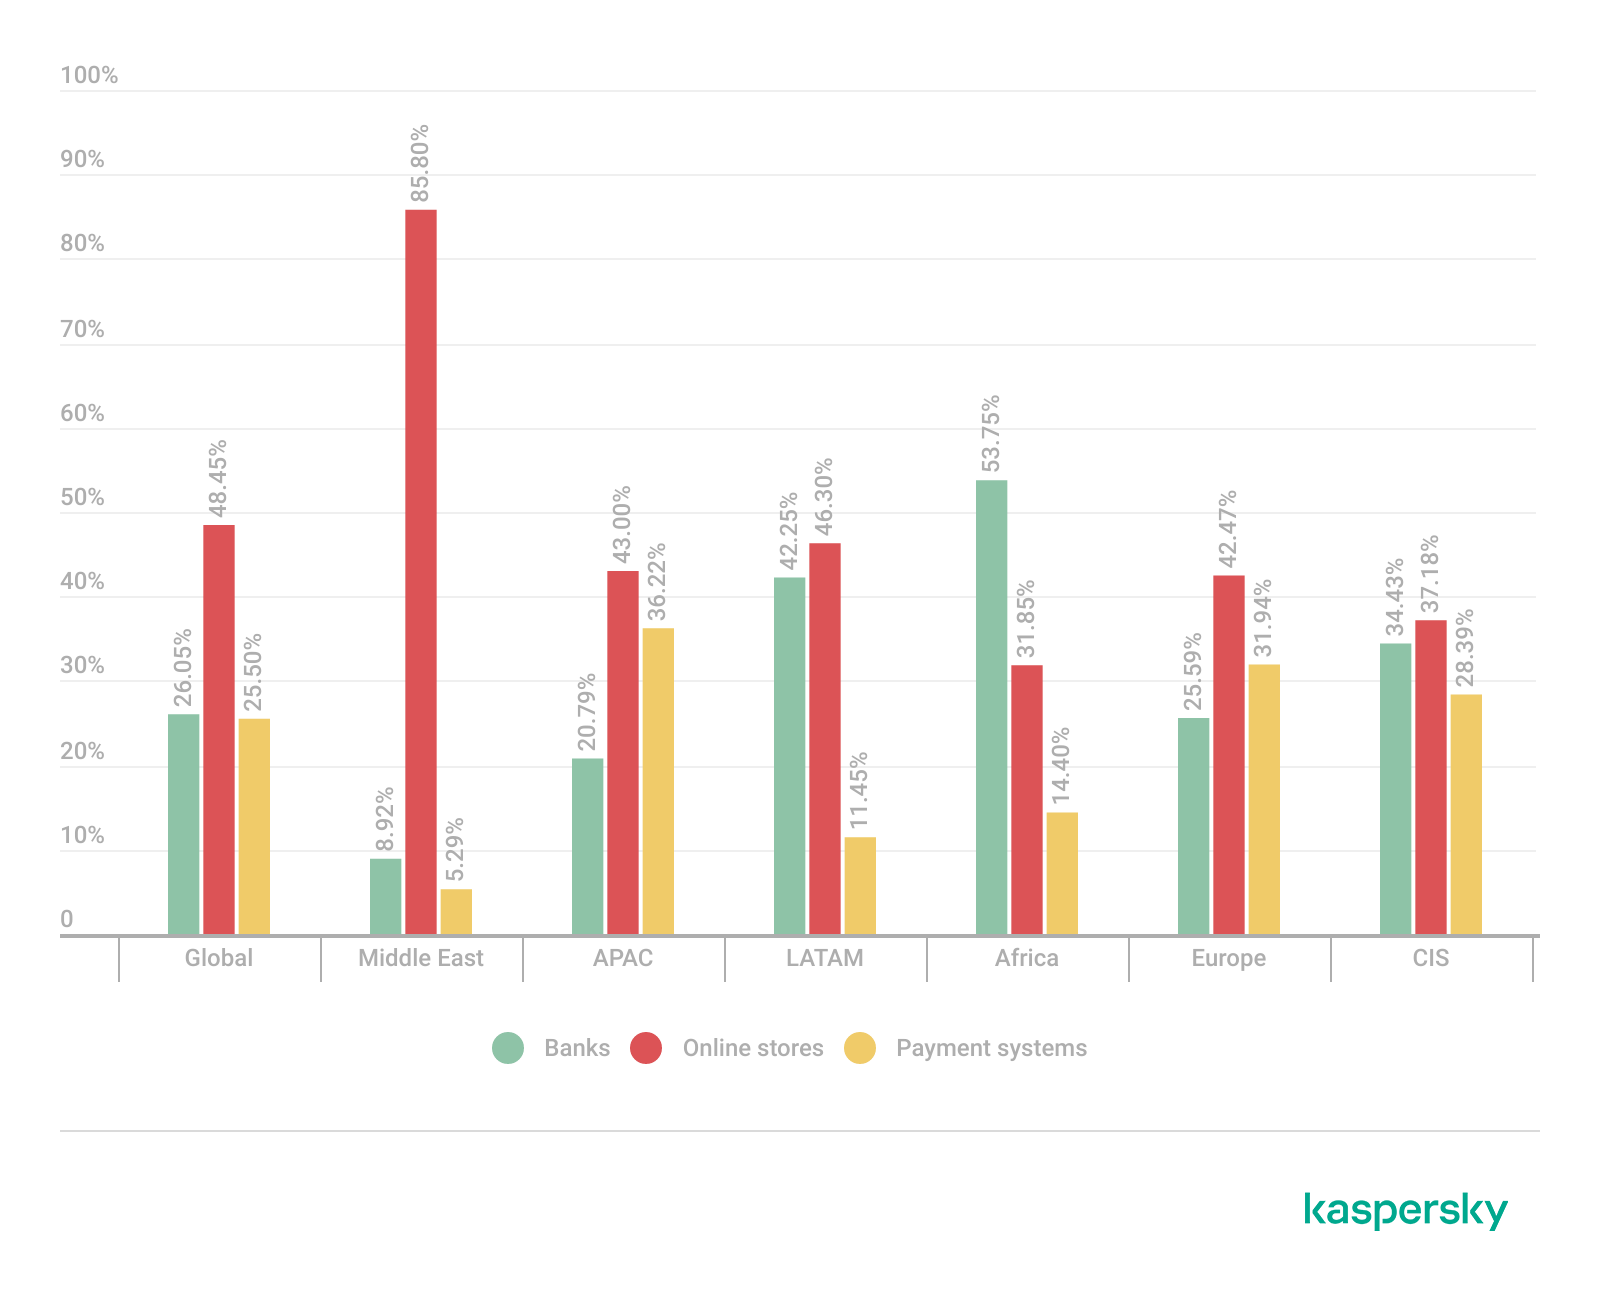
Globally, online stores dominated (48.45%), followed by banks (26.05%) and payment systems (25.50%). The decline in bank phishing may suggest that these services are becoming increasingly difficult to successfully impersonate, so fraudsters are turning to easier ways to access users’ finances.

However, this balance shifts significantly at the regional level.

In the Middle East, phishing is overwhelmingly concentrated on e-commerce (85.8%), indicating a heavy reliance on online retail lures, whereas in Africa, bank-related phishing leads (53.75%), which may indicate that user account security there is still insufficient. LATAM shows a more balanced distribution but with a higher share of online store targeting (46.30%), while APAC and Europe display a more even spread across all three categories, pointing to diversified attack strategies. These variations suggest that attackers are not operating uniformly but are instead adapting campaigns to regional digital habits, payment ecosystems, and trust patterns – maximizing effectiveness by aligning phishing content with the most commonly used financial services in each market.

Distribution of financial phishing pages by category and region, 2025 (download)

Online shopping scams

The distribution of organizations mimicked by phishing and scam pages in 2025 highlights a clear shift toward globally recognized digital service and e-commerce brands, with attackers prioritizing platforms that have large, active user bases and frequent payment interactions.

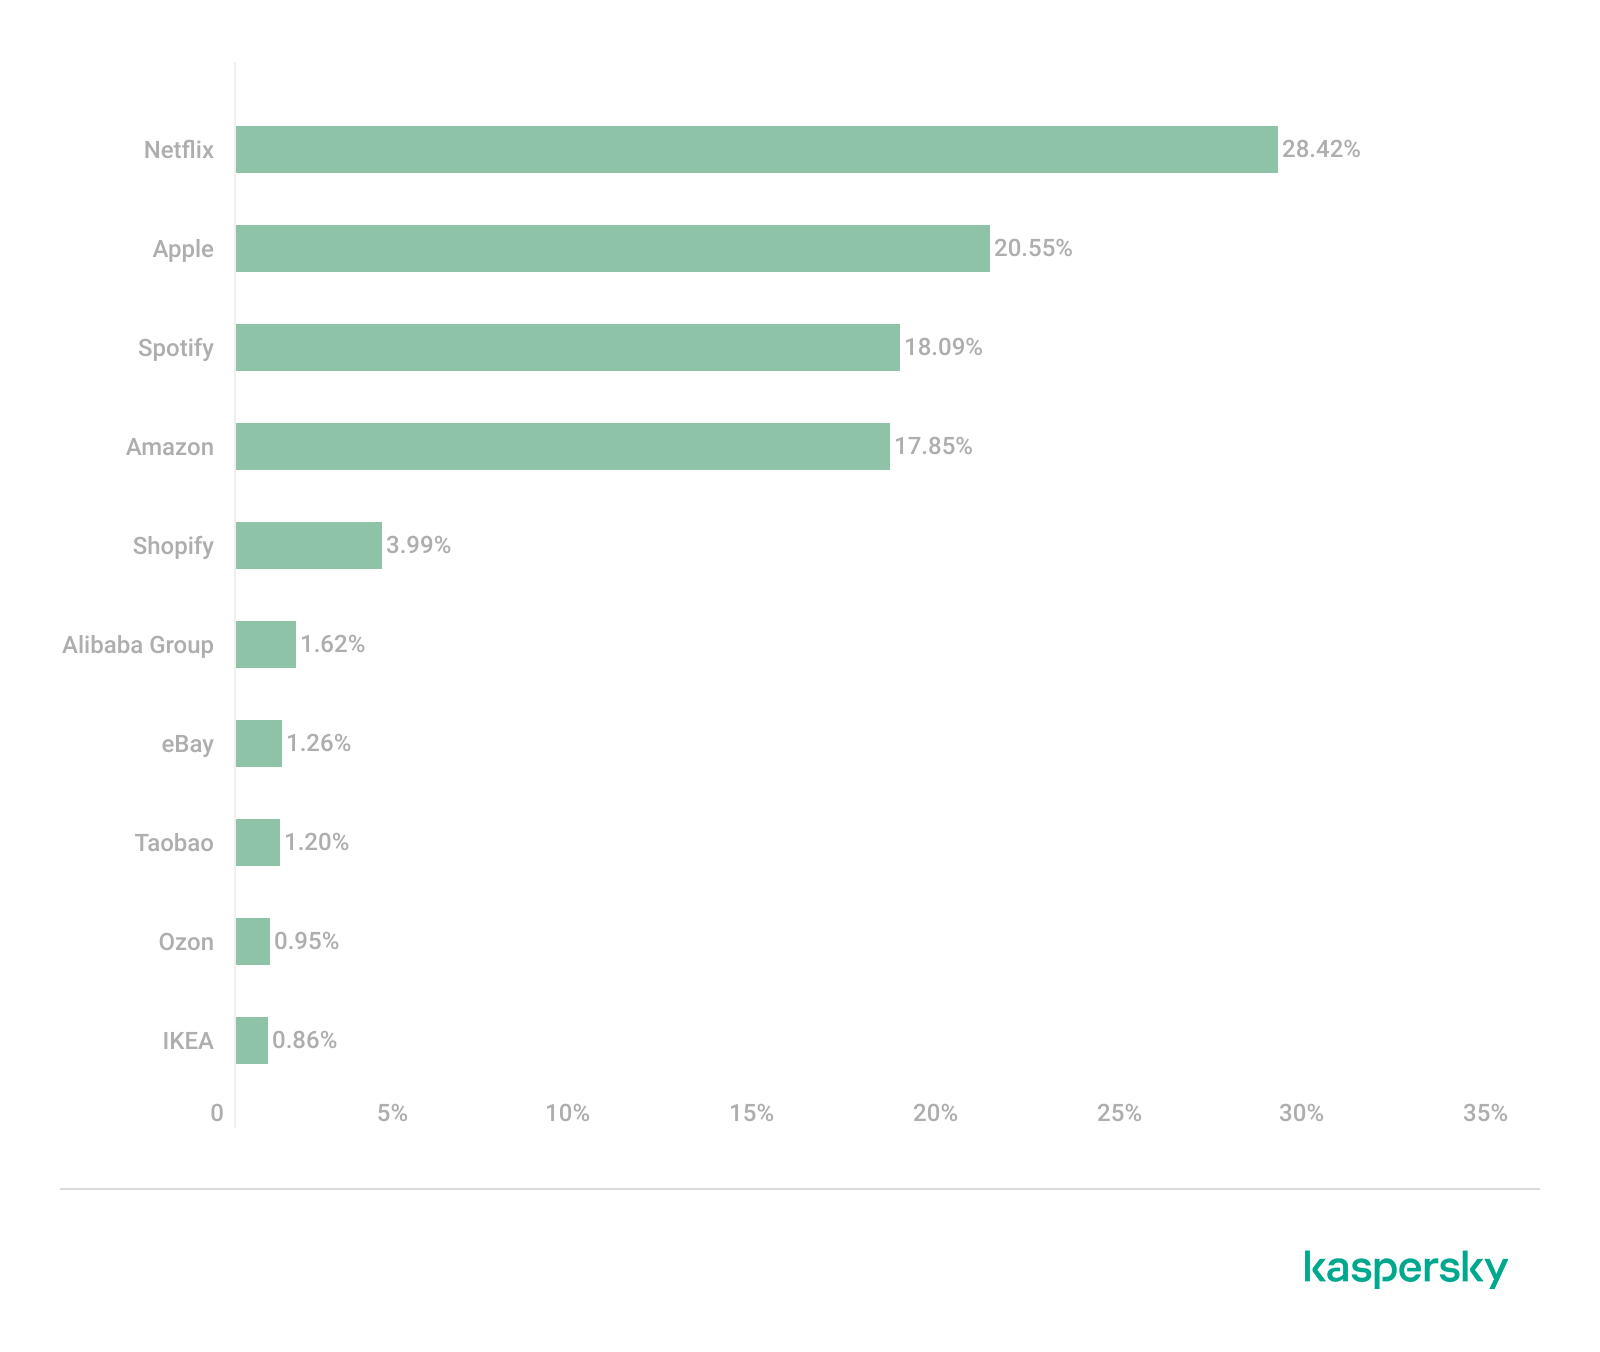
Netflix (28.42%) solidified its ranking as the most impersonated brand, followed by Apple (20.55%), Spotify (18.09%), and Amazon (17.85%). This reflects a move away from traditional retail-only targets toward subscription-based and ecosystem-driven services.

TOP 10 online shopping brands mimicked by phishing and scam pages, 2025 (download)

Regionally, this trend varies: Netflix dominates heavily in the Middle East, Apple leads in APAC, while Spotify ranks first across Europe, LATAM, and Africa. Although most of the top platforms are highly popular across different regions, we may suggest that the attackers tailor brand impersonation to regional popularity and user engagement.

Payment system phishing

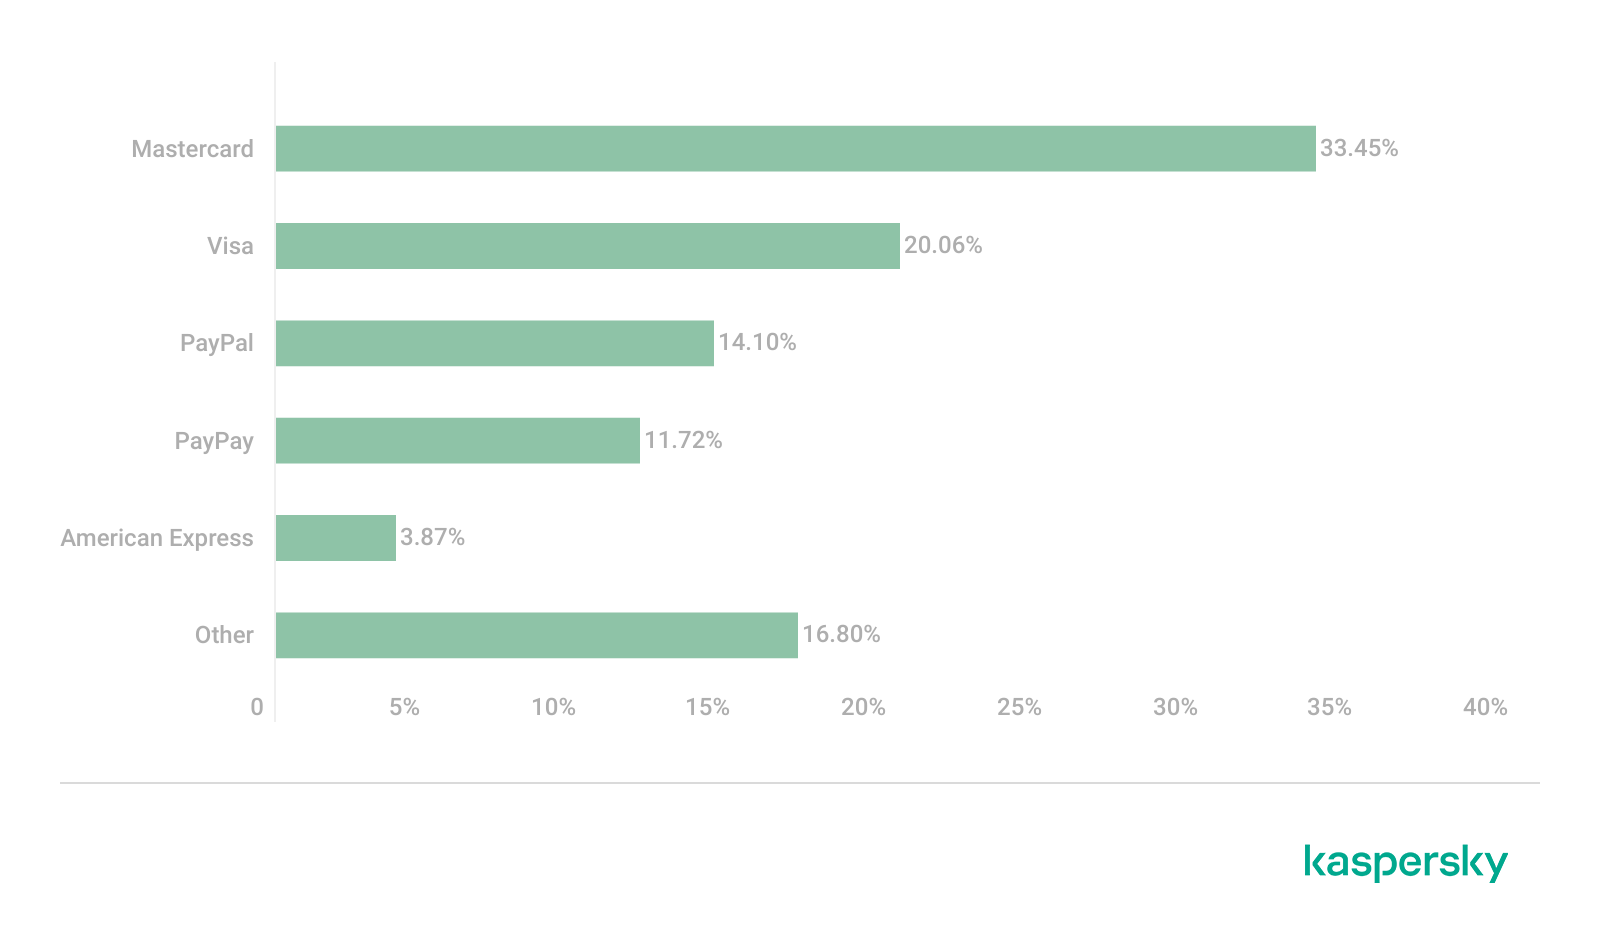
Phishing campaigns are impersonating multiple payment ecosystems to maximize coverage. While PayPal was the most mimicked in 2024 with 37.53%, its share dropped to 14.10% in 2025. Mastercard, on the contrary, attracted cybercriminals’ attention, its share increasing from 30.54% to 33.45%, while Visa accounted for a significant 20.06% (last year, it wasn’t in the TOP 5), reinforcing the growing focus on widely used banking card networks. The continued presence of American Express (3.87%) and the increasing number of pages mimicking PayPay (11.72%) further highlight attacker experimentation and regional adaptation.

TOP 5 payment systems mimicked by phishing and scam pages, 2025 (download)

Financial malware

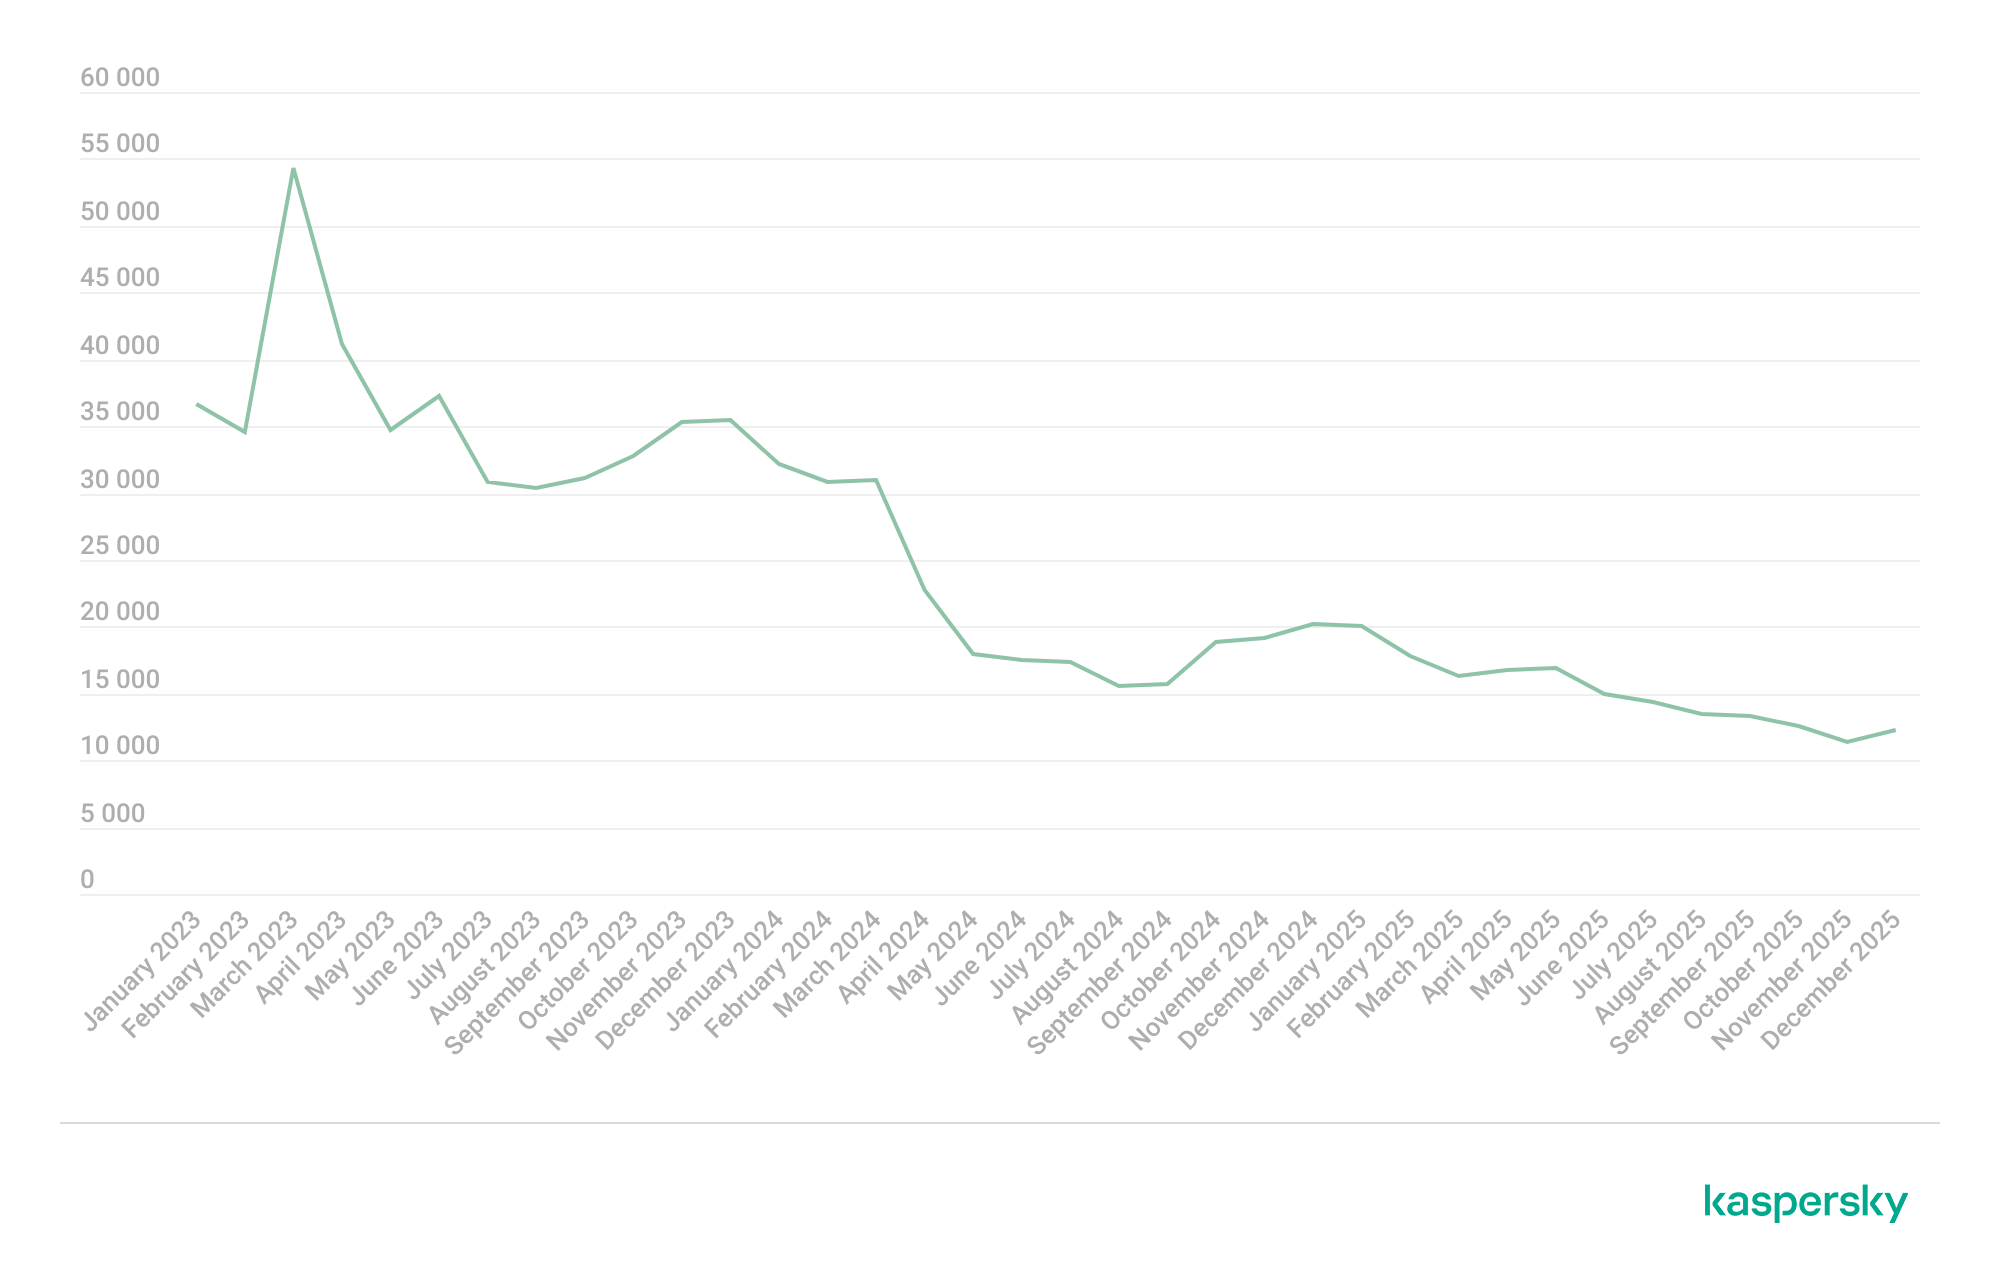
In 2025, the decline in users affected by financial PC malware continued. On the one hand, people continue to rely on mobile devices to manage their finances. On the other hand, some of the most prominent malware families that were initially designed as bankers had not used this functionality for years, so we excluded them from these statistics.

Changes in the number of unique users attacked by banking malware, by month, 2023–2025 (download)

Windows systems remained the primary platform targeted by attackers with financial malware. According to Kaspersky Security Bulletin, overall detections included 1,338,357 banking Trojan attacks globally from November 2024 to October 2025, though this number is also declining due to increasing focus on mobile vectors. Desktop threats continued to be distributed via traditional delivery methods like malicious emails, compromised websites, and droppers.

In 2025, Brazilian-origin families such as Grandoreiro (part of the Tetrade group) stood out for their constant activity and global reach. Despite a major law enforcement disruption in early 2024, Grandoreiro remained active in 2025, re-emerging with updated variants and continuing to operate. Other notable actors included Coyote and emerging families like Maverick, which abused WhatsApp for distribution while maintaining fileless techniques and overlaps with established Brazilian banking malware to steal credentials and enable fraudulent transactions on desktop banking platforms. Besides traditional bankers, other Brazilian malware families are worth mentioning, which specifically target relatively new and highly popular regional payment systems. One of the most prominent threats among these is GoPix Trojan focusing on the users of Brazilian Pix payment system. It is also capable of targeting local Boleto payment method, as well as stealing cryptocurrency.

There was also a surge in incidents in 2025 in which fraudsters targeted organizations through electronic document management (EDM) systems, for example, by substituting invoice details to trick victims into transferring funds. The Pure Trojan was most frequently encountered in such attacks. Attackers typically distribute it through targeted emails, using abbreviations of document names, software titles, or other accounting-related keywords in the headers of attached files. Globally in the corporate segment, Pure was detected 896 633 times over 2025, with over 64 thousand users attacked.

Contrary to PC banking malware, mobile banker attacks grew by 1.5 times in 2025 compared to the previous reporting period, which is consistent with their growth in 2024. They also saw a sharp surge in the number of unique installation packages. More statistics and trends on mobile banking malware can be found in our yearly mobile threat report.

Complementing traditional financial malware, infostealers played a significant role in enabling financial crime both on PCs and mobile devices by harvesting credentials, cookies, and autofill data from browsers and applications, which attackers then used for account takeovers or direct banking fraud. Kaspersky analyses pointed to a surge in infostealer detections (up by 59% globally on PCs), fueling credential-based attacks.

Financial cyberthreats on the dark web

The Kaspersky Digital Footprint Intelligence (DFI) team closely monitors infostealer activity on both PC and mobile devices to analyze emerging trends and assess the evolving tactics of cybercriminals.

Fraudsters especially target financial data such as payment cards, cryptocurrency wallets, login credentials and cookies for banking services, as well as documents stored on the victim’s device. The stolen data is collected in log files and shared on dark web resources, where they are bought, sold, or distributed freely and then used for financial fraud.

With access to financial data, fraudsters can gain control of users’ bank accounts and payment cards, and withdraw funds. Compromised accounts and cards are also frequently used in subsequent activities, turning the victims into intermediaries in a fraud scheme.

Compromised accounts

Kaspersky DFI found that in 2025, over one million online banking accounts (these are not Kaspersky product users) served by the world’s 100 largest banks fell victim to infostealers: their credentials were being freely shared on the dark web.

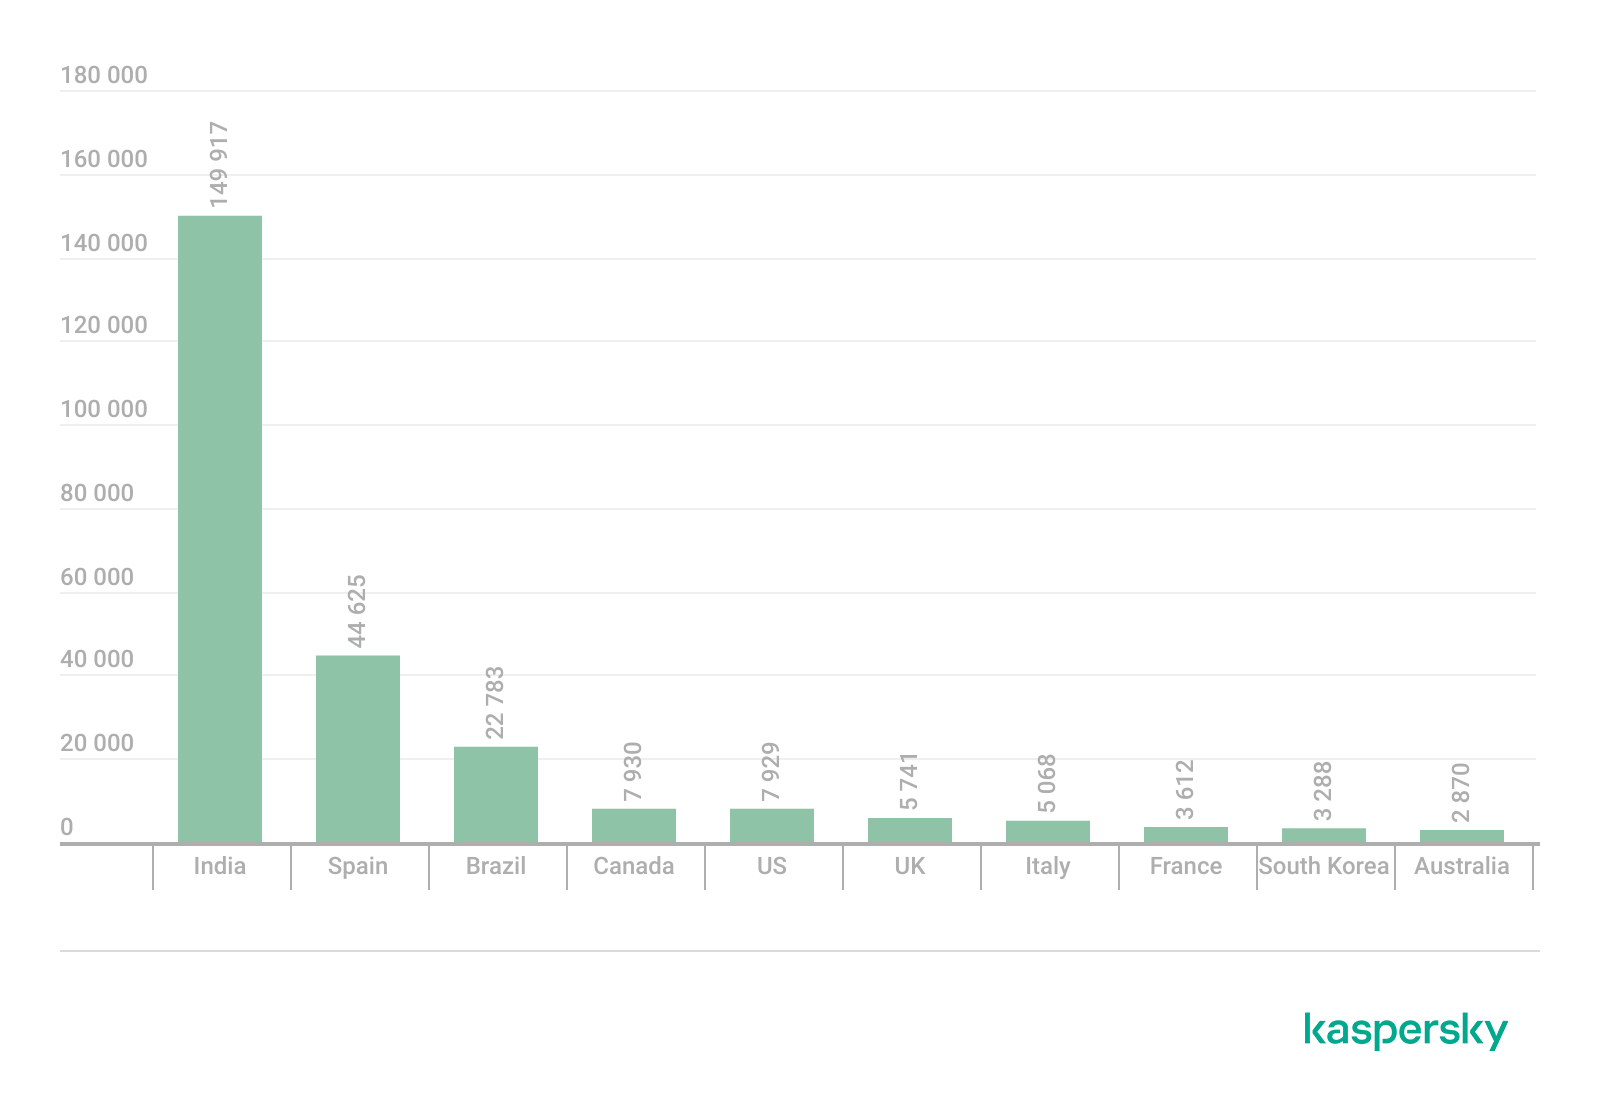
The countries with the highest median number of compromised accounts per bank were India, Spain, and Brazil.

The chart below shows the median number of compromised accounts per bank for the TOP 10 countries.

TOP 10 countries with the highest compromised account median (download)

Compromised payment cards

Seventy-four percent of payment cards that were compromised by infostealer malware, published on dark web resources and identified by the Digital Footprint Intelligence team in 2025, remained valid as of March 2026. This means that attackers could still use the cards that had been stolen months or even years prior.

It should be noted that the number of bank accounts and payment cards known to have been compromised by infostealers in 2025 will continue to rise, because fraudsters do not publish the log files immediately after the compromise but only after a delay of months or even years.

Data breaches

Regardless of the industry in which the target company operates, data breaches often expose users’ financial data, including payment card information, bank account details, transaction histories and other financial information. As a consequence, the compromised databases are sold and distributed on underground resources.

It should be noted that the threat is not limited to the exposure of financial information alone. Various identity documents and even seemingly public data, such as names, phone numbers and email addresses, can become a risk when they are published on the dark web. Such data attracts fraudsters’ attention and can be used in social engineering attacks to gain access to the user’s financial assets.

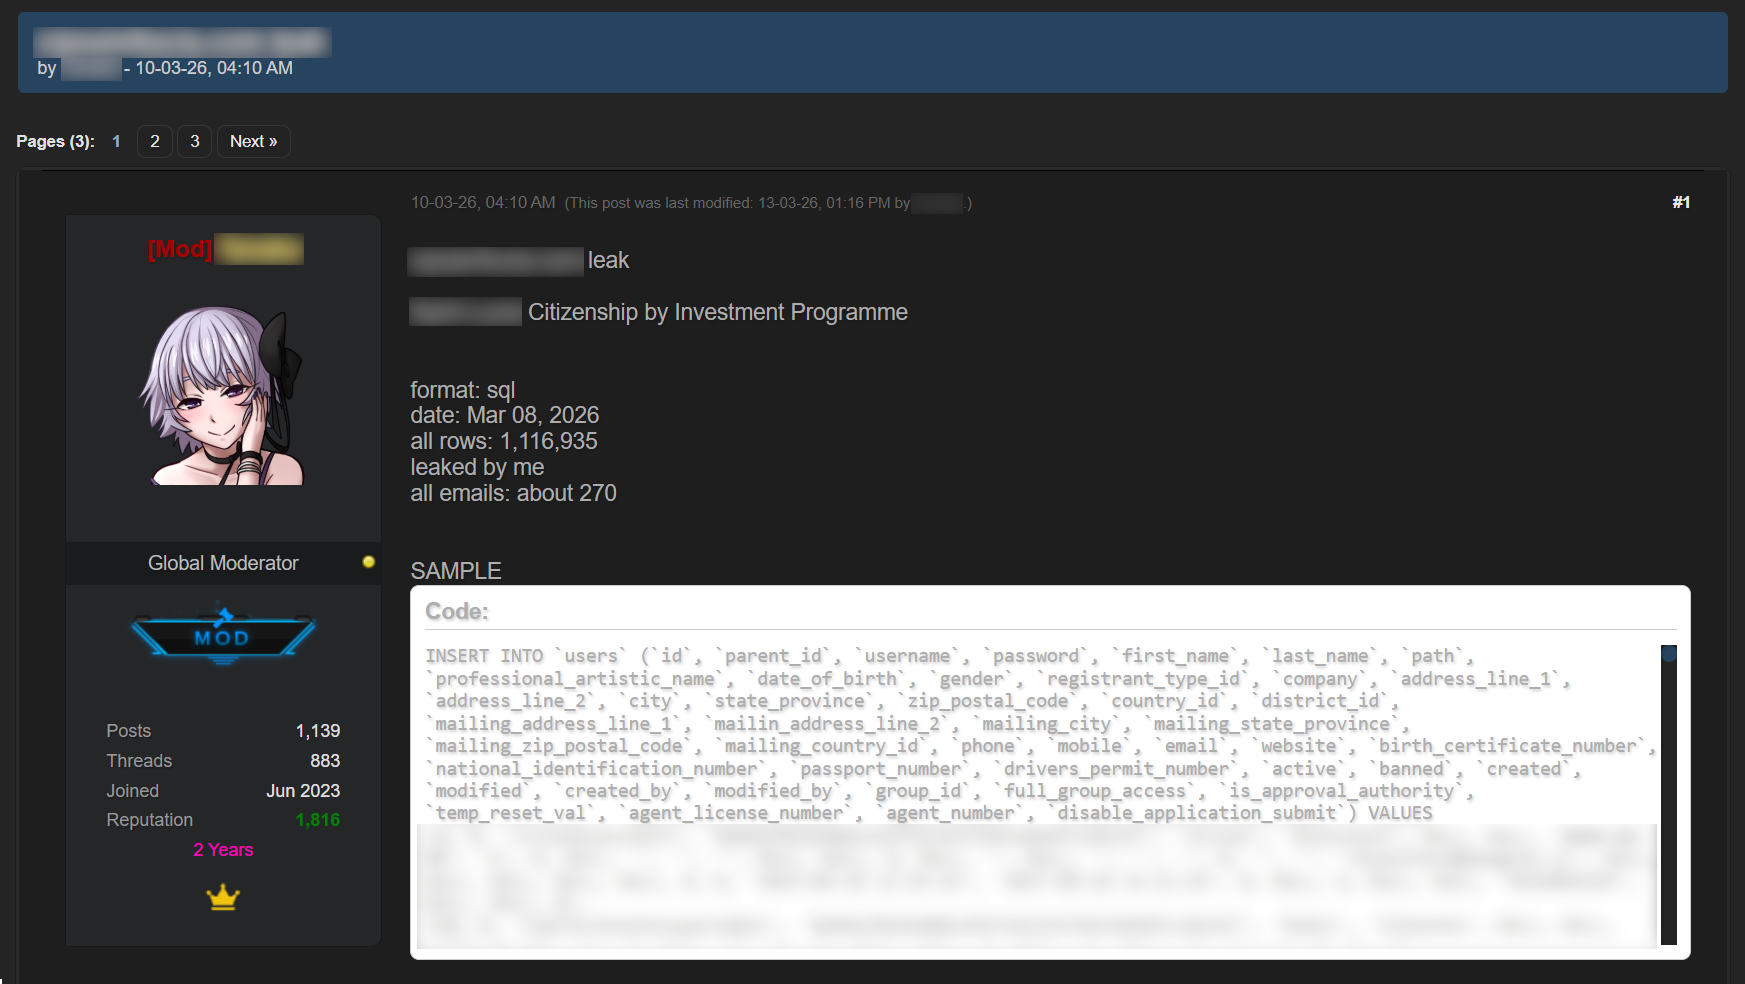
An example of a post offering a database

An example of a post offering a database

Sale of bank accounts and payment cards

The dark web often features services provided by stores that specialize in selling bank accounts and payment cards. Fraudsters typically obtain data for sale from a variety of sources, including infostealer logs and leaked databases, which are first repackaged and then combined.

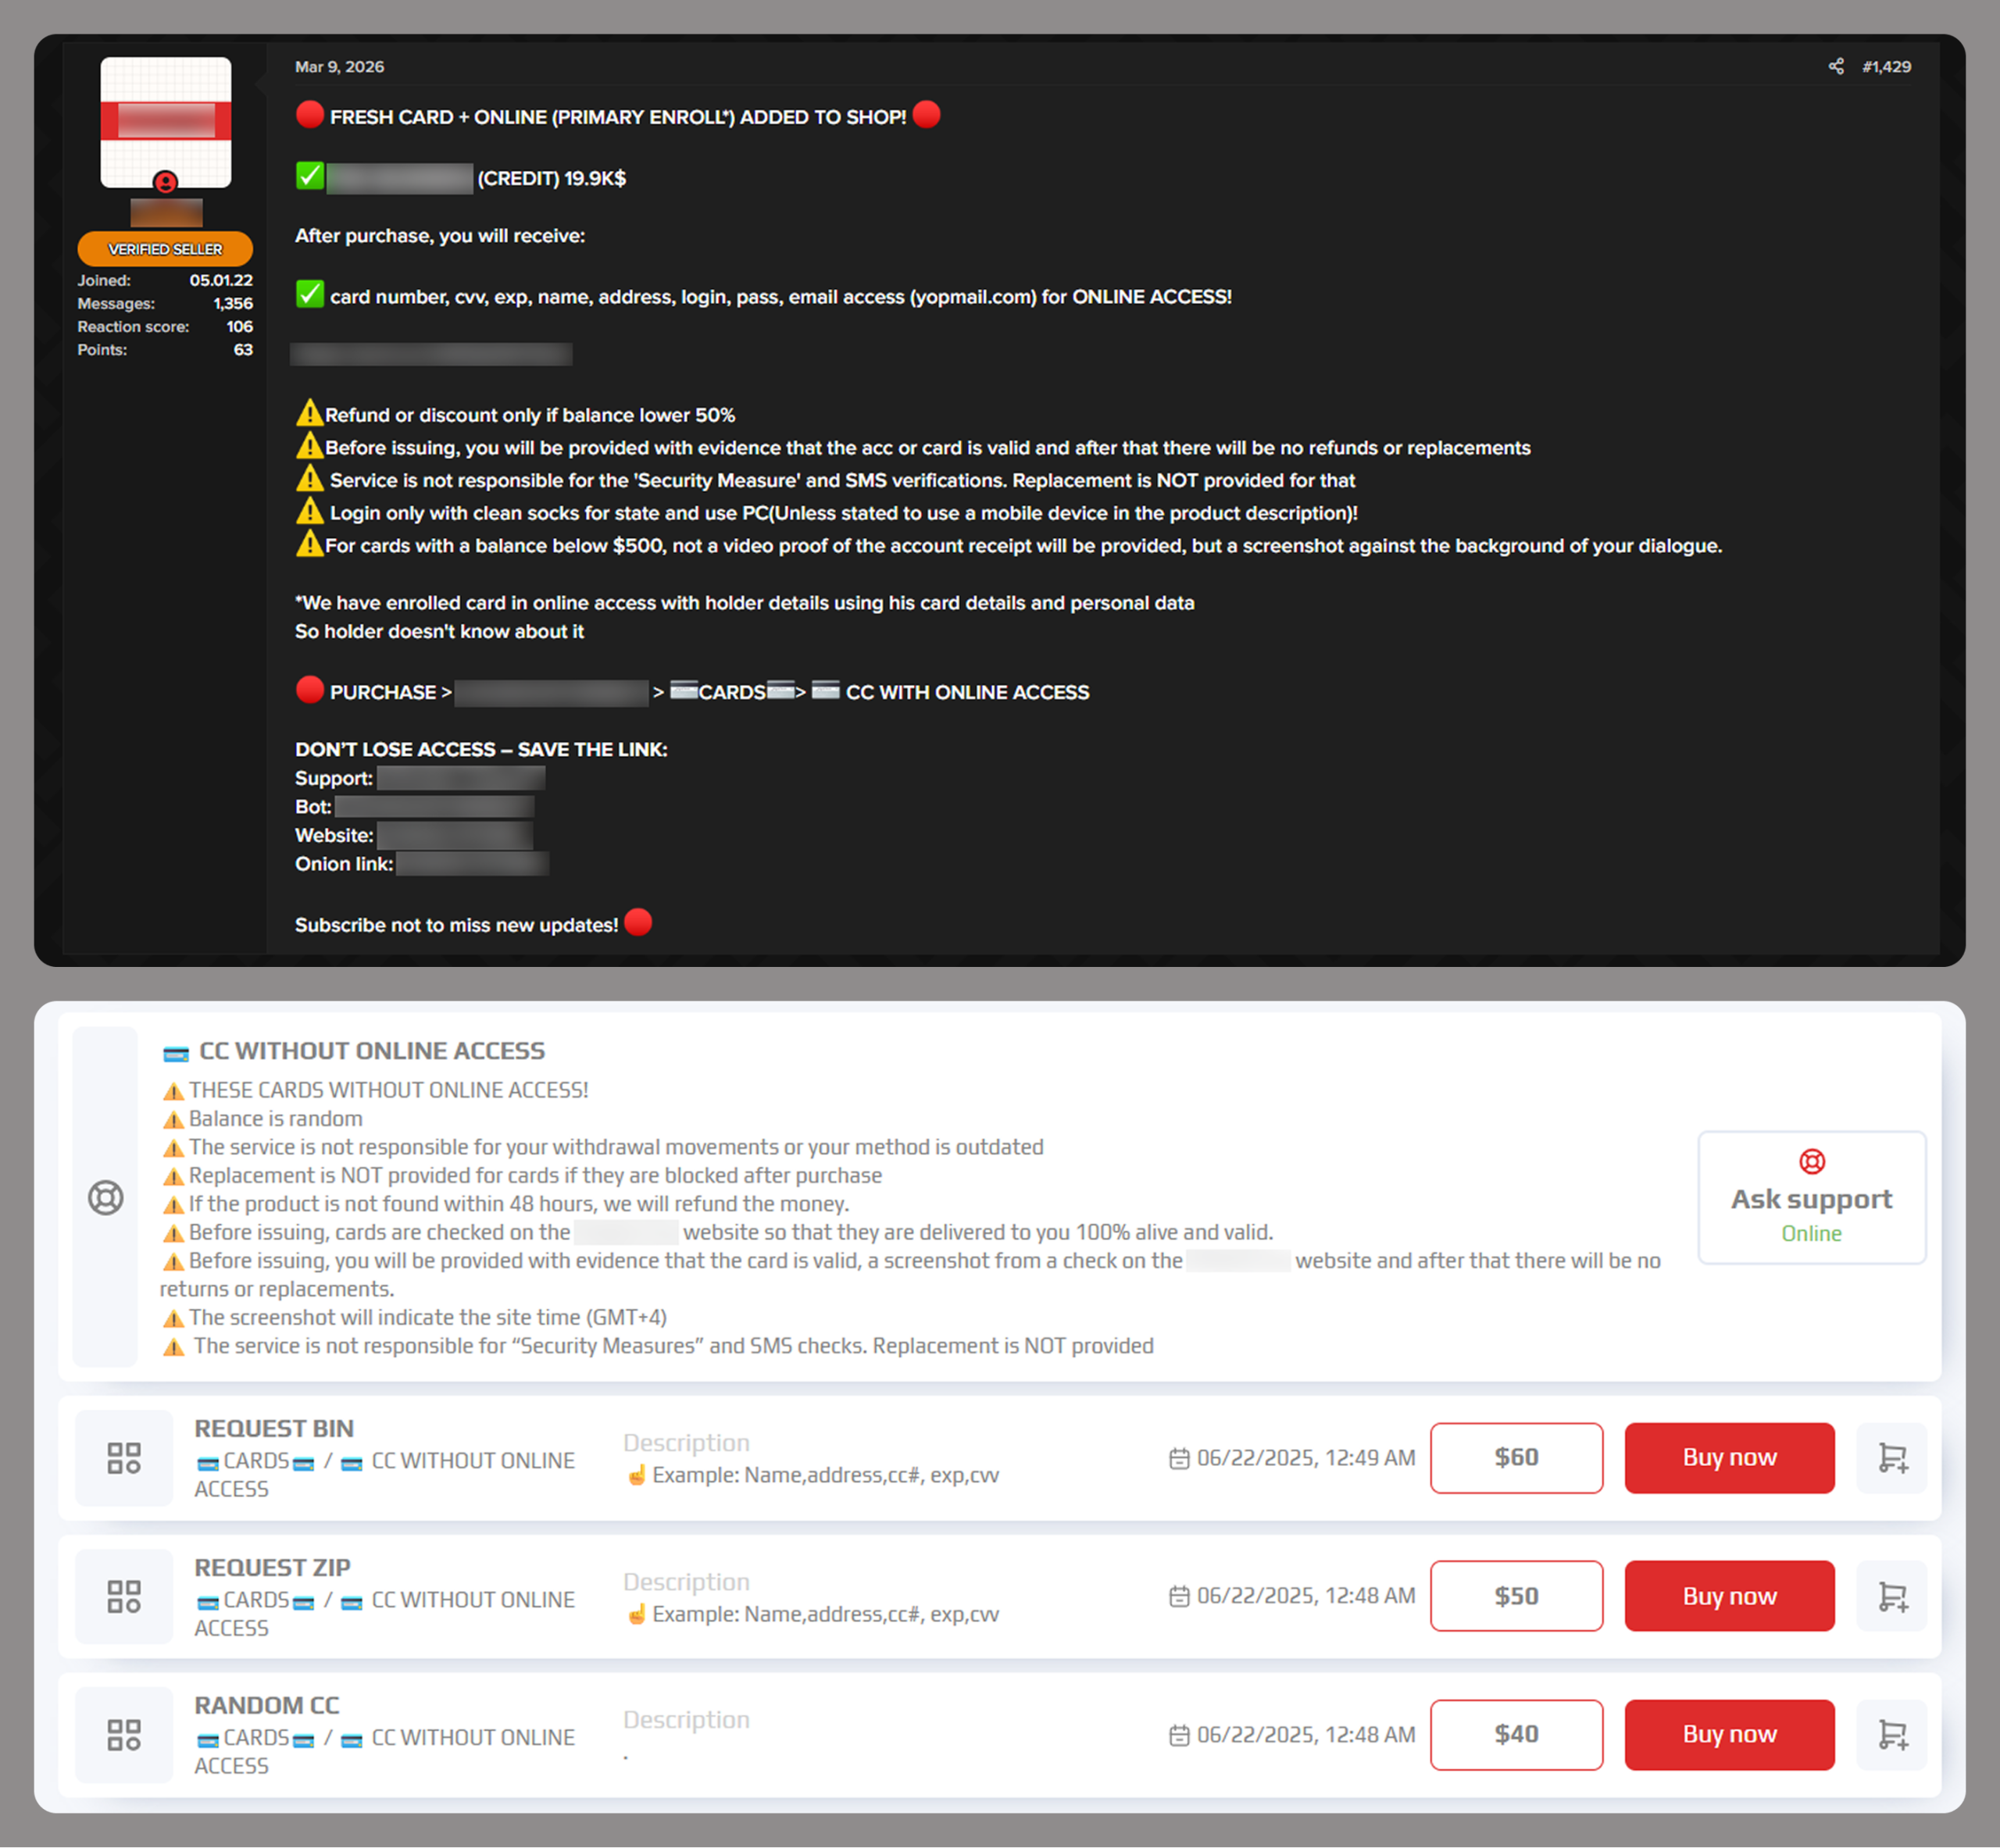
Examples of a post (top) and a site (bottom) offering payment cards

Examples of a post (top) and a site (bottom) offering payment cards

Often, sellers offer complete victim profiles, referred to by fraudsters as “fullz”. These include not only bank accounts or payment cards but also identification documents, dates of birth, residential addresses, and other personal details. A full‑information package is usually more expensive than a payment card or a bank account alone.

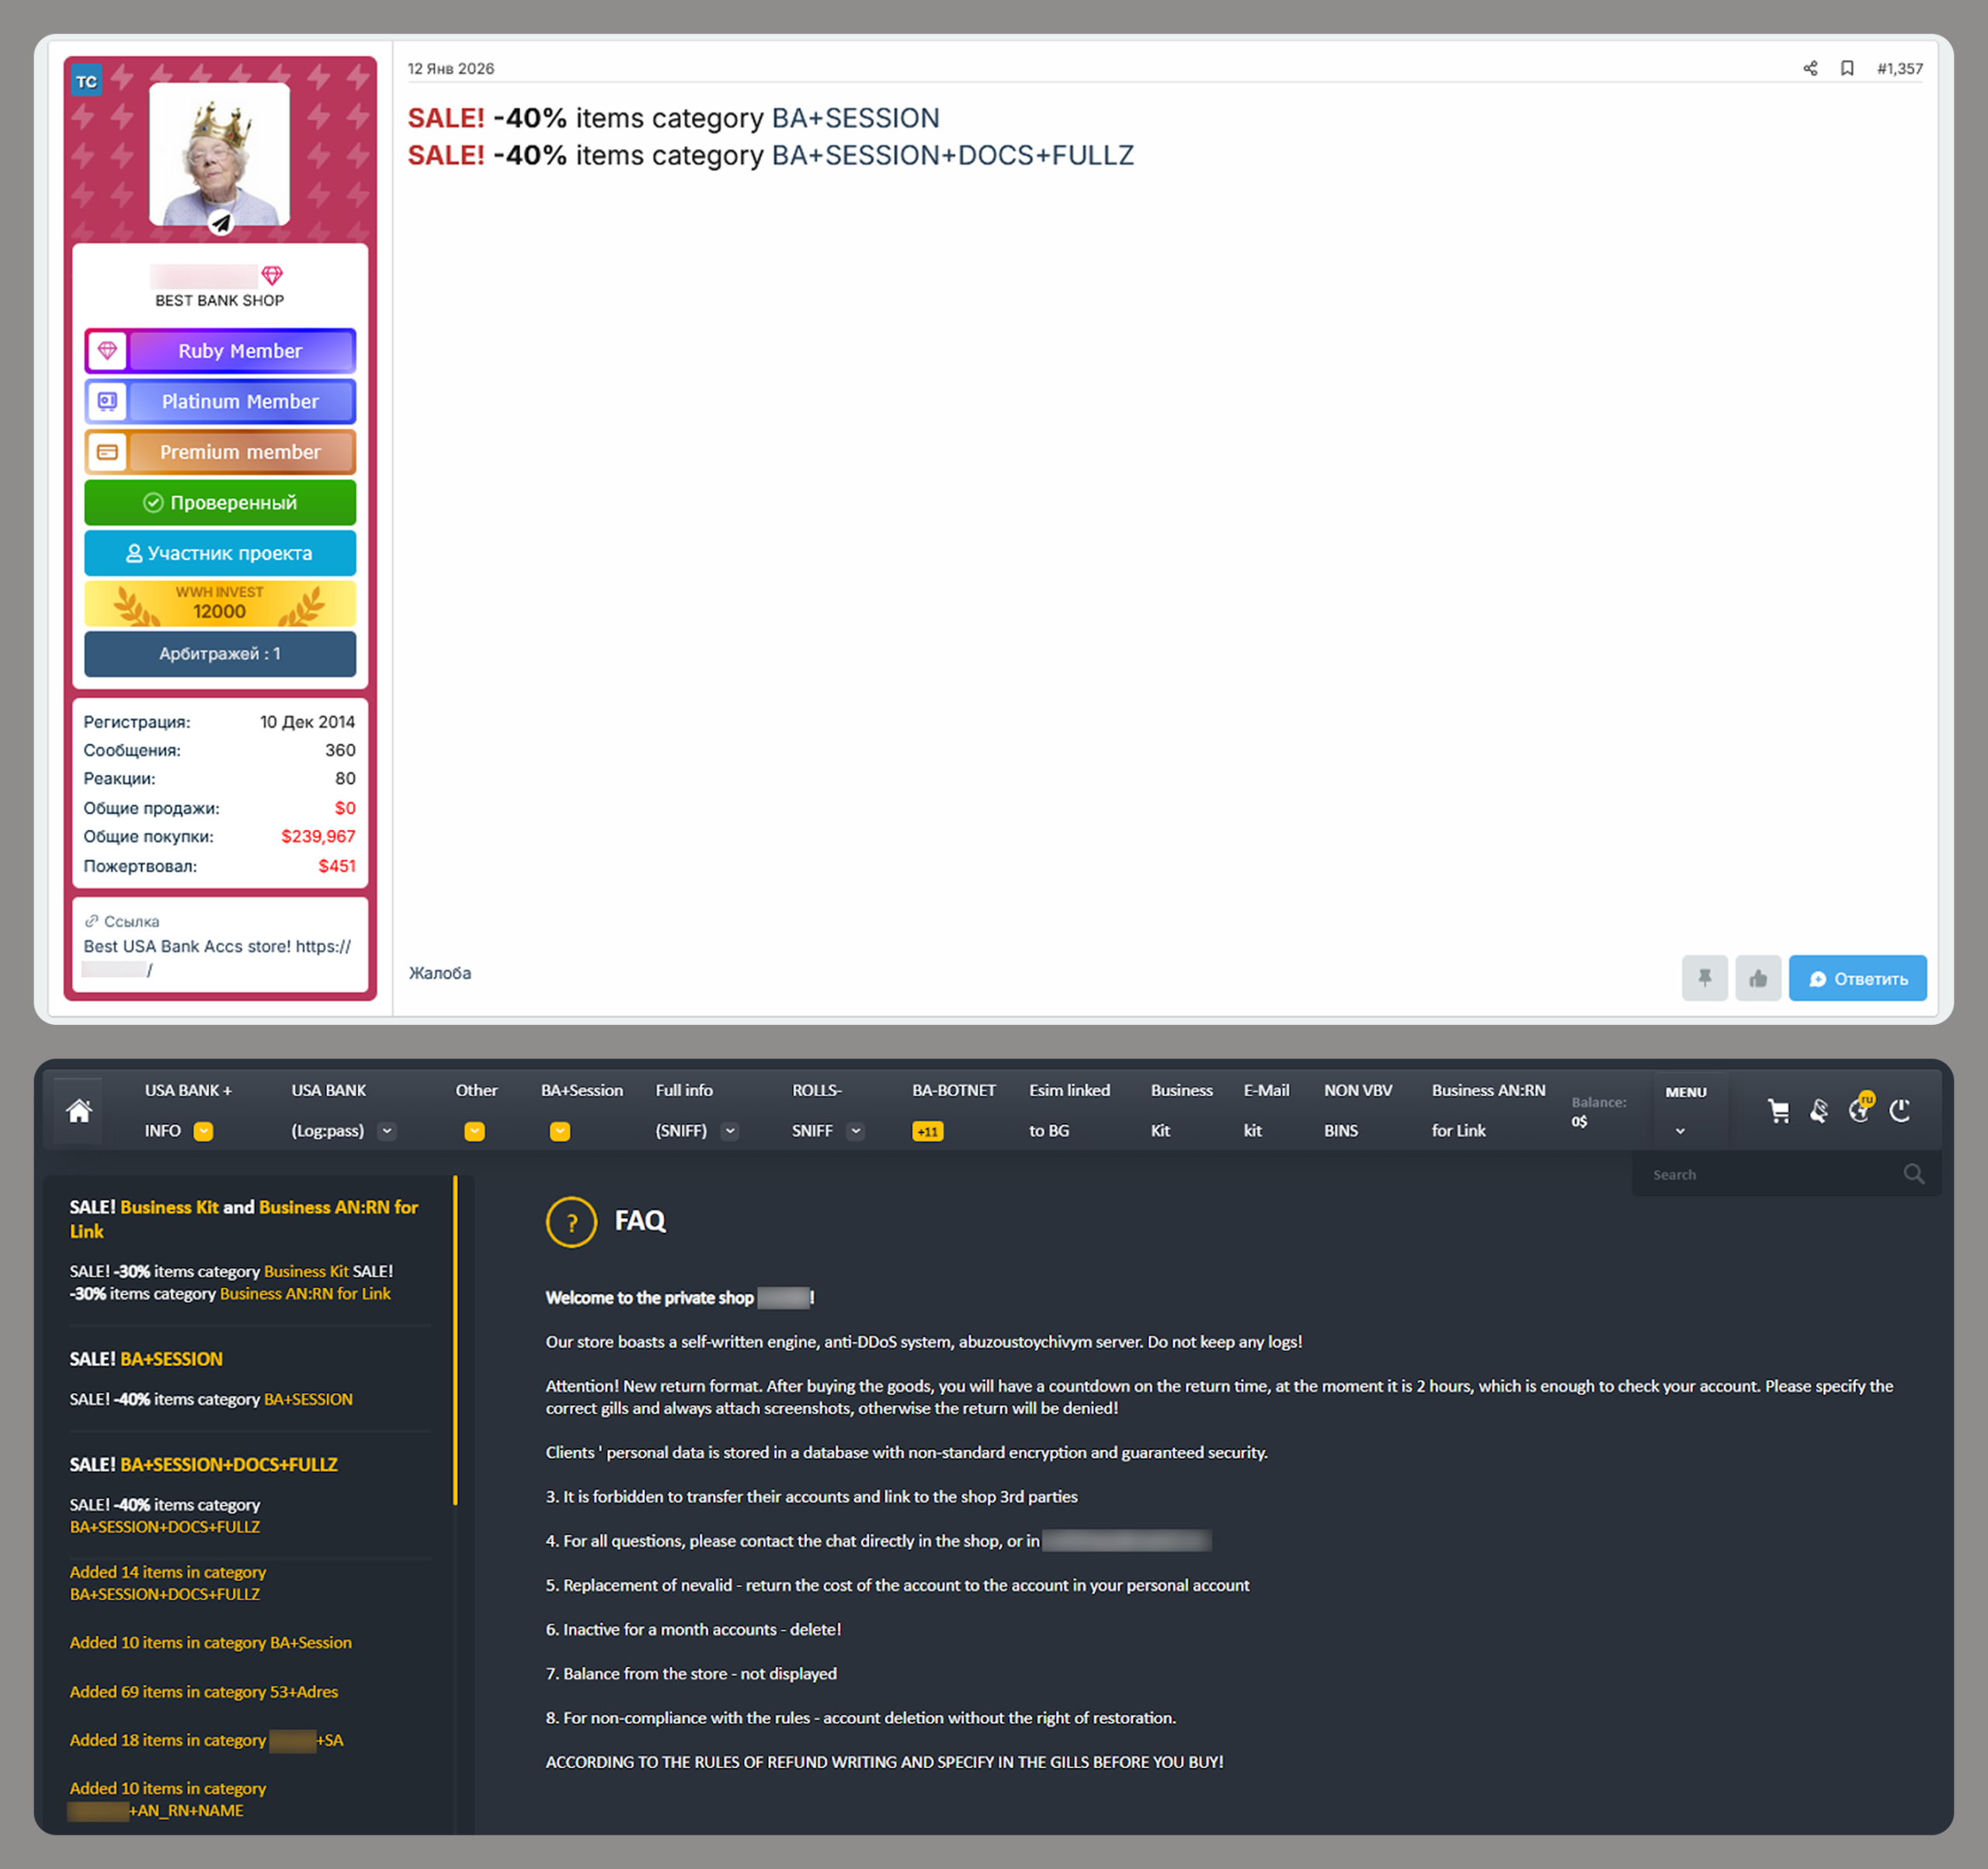
Examples of a post (top) and a site (bottom) offering bank accounts

Examples of a post (top) and a site (bottom) offering bank accounts

Compiled databases

Fraudsters exploit various sources, including previously leaked databases, to compile new, thematic ones. Finance- and, in particular, cryptocurrency-related databases, are among the most popular. Compilations aimed at specific user groups, such as the elderly or wealthy people, are also of interest to cybercriminals.

Usually, thematic databases contain personal information about users, such as names, phone numbers, and email addresses. Fraudsters can use this data to launch social engineering attacks.

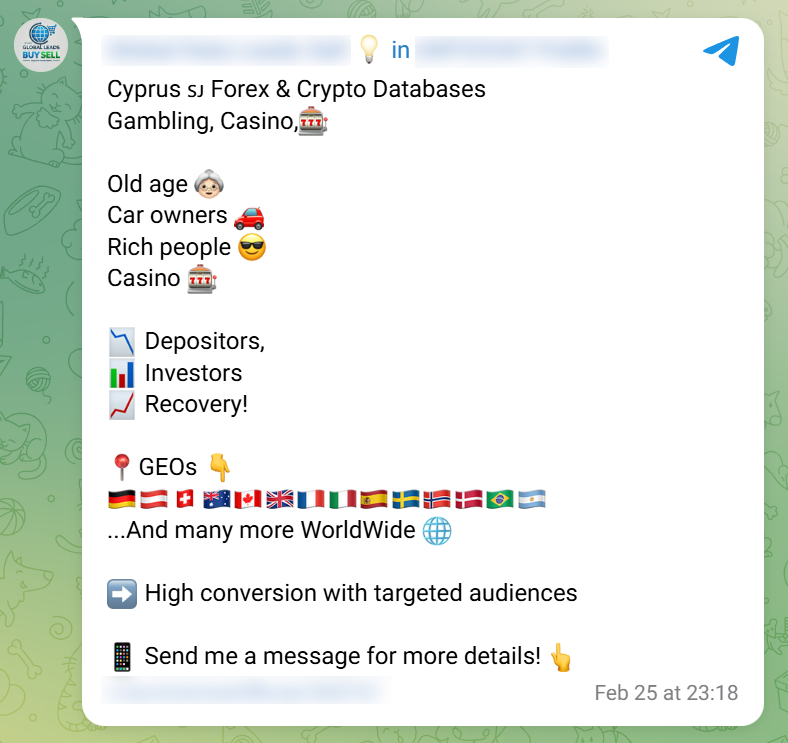
An example of a message offering compiled databases

An example of a message offering compiled databases

Creation of phishing websites

Phishing websites have become a powerful tool for the financial enrichment of fraudsters. Cybercriminals create fraudulent sites that masquerade as legitimate resources of companies operating in various industries. Gambling and retail sites remain among the most popular targets.

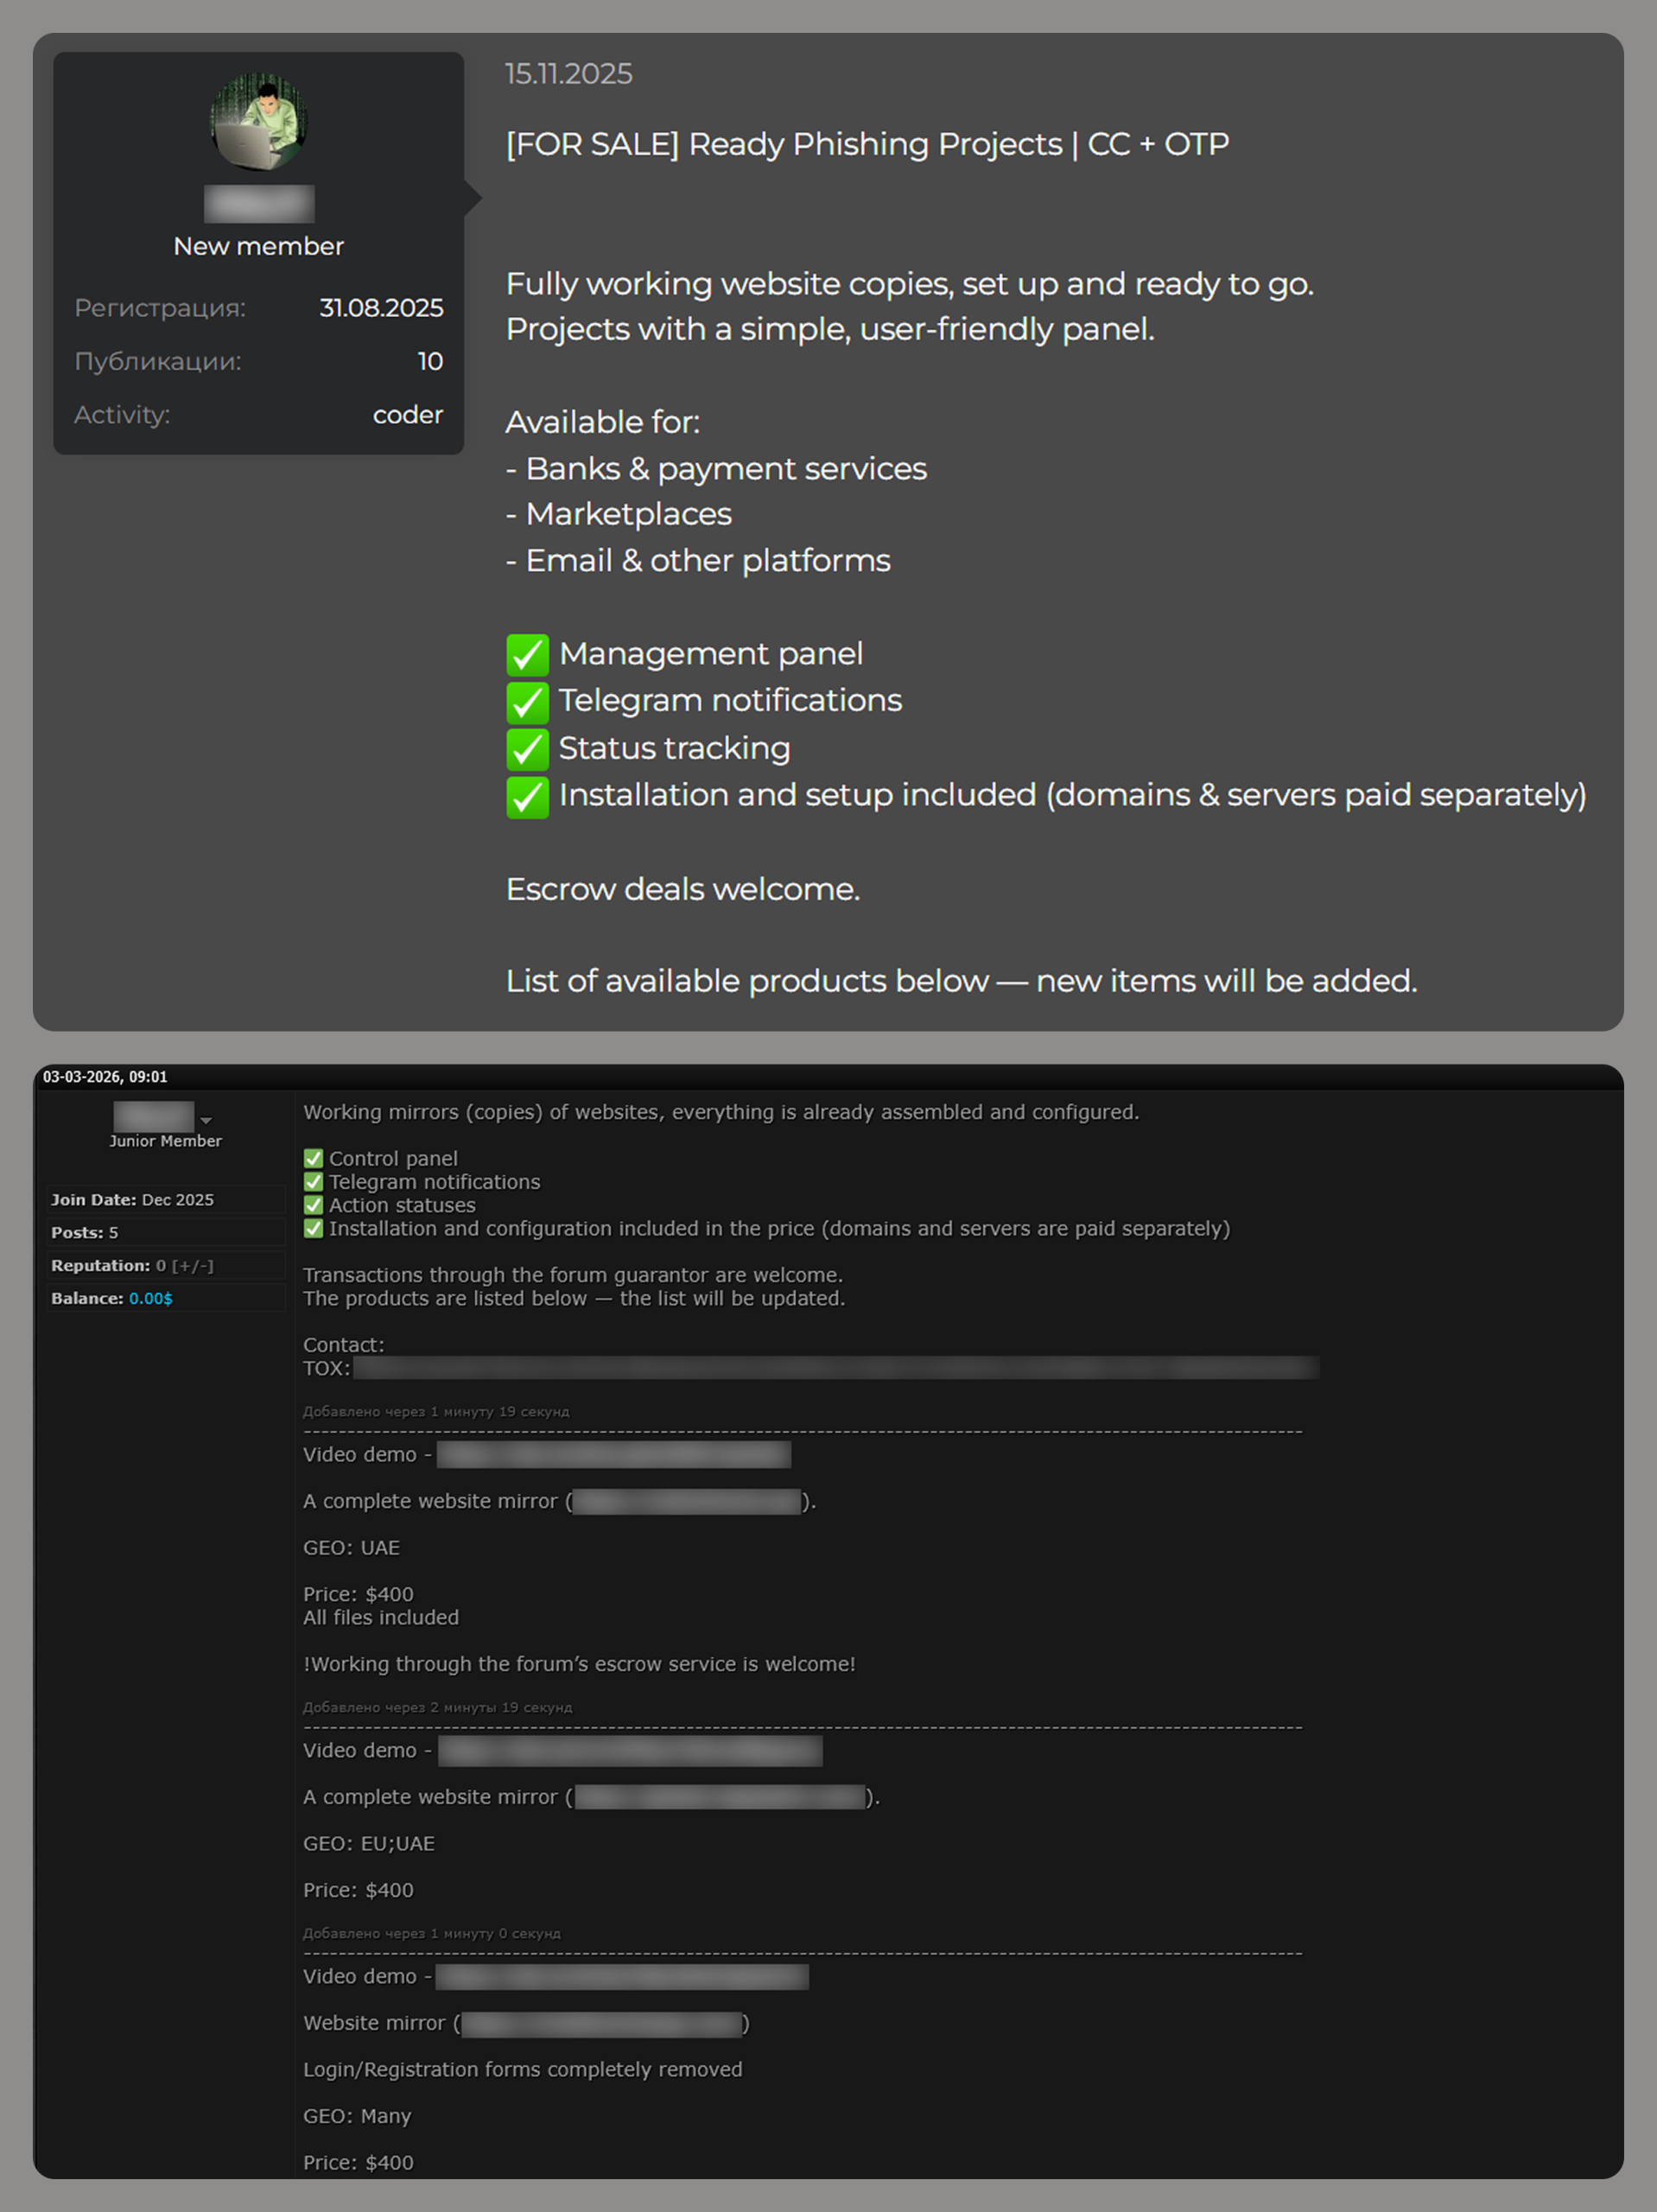
In order to obtain personal and financial information from unsuspecting users, adversaries seek out ways to create such phishing websites. Ready-made layouts and website copies are sold on the dark web and advertised as profitable tools. Moreover, fraudsters offer phishing website creation services.

Examples of posts offering creation of phishing websites

Examples of posts offering creation of phishing websites

Conclusion

The decline of traditional PC banking malware is not an indicator of reduced risk; rather, it highlights a redistribution of attacker effort toward more efficient methods targeting mobile devices, credential theft, and social engineering. Infostealers, in particular, are a force multiplier, enabling widespread compromise at scale.

Looking ahead to 2026, the financial threat landscape is expected to become even more data-driven and automated. Organizations must adapt by focusing on identity protection, real-time monitoring, and cross-channel threat intelligence, while users must remain vigilant against increasingly sophisticated and personalized attack techniques.

  •  

Digital Hopes, Real Power: How the Arab Spring Fueled a Global Surveillance Boom

This is the third installment of a blog series reflecting on the global digital legacy of the 2011 Arab uprisings. You can read the first post here, and the second here.

When people recall the 2011 uprisings across the Middle East and North Africa (MENA), they often picture crowded squares, raised phones, and the feeling that the internet had finally shifted the balance of power toward ordinary people. But the past decade and a half is also a story about how governments, companies, and platforms turned those same tools into the backbone of a powerful state surveillance apparatus.

For activists, journalists, everyday users, that means now living with a constant threat. The phone in your pocket, the platforms you organize on, and the systems you rely on for safety and connection can be weaponized at the flip of a switch. A global surveillance industry has treated repression by many MENA governments as a growth opportunity, and the tactics refined there now shape digital authoritarianism worldwide. This essay traces how that shift unfolded: security agencies upgraded older systems of repression with new surveillance tools and permanent monitoring infrastructure; cybercrime laws and mercenary spyware markets turned digital control into standard operating procedure; and biometrics, facial recognition, and ‘smart city’ projects laid the groundwork for AI‑driven surveillance that now shapes protests, borders, and everyday life far beyond the region. 

Remembering the Arab Spring means seeing the events of 2011 as both a remarkable moment of movement history when people leveraged networked tools in their fight for freedom and the beginning of a long, grinding effort to turn those same tools into mechanisms of state control.

Old‑School Repression, New‑School Tools

Long before Facebook and Twitter, regimes in countries like Egypt and Syria already knew how to crush dissent. They leaned on informant networks, physical surveillance, and wiretaps, backed by emergency laws that let security agencies monitor and detain critics with almost no restraint. Research on the use of surveillance technology in MENA shows that, even before the Arab Spring, states were layering early digital tools like internet monitoring, deep packet inspection, and interception centers on top of that older machinery of control.

At the same time, connectivity was racing ahead. Cheap smartphones and social media suddenly let people share information at scale, coordinate protests, and broadcast abuses in real time. In 2011, EFF described both the excitement around “Facebook revolutions” and the early signs that governments were scrambling to upgrade their capacity to watch and disorganize popular dissent.

After the uprisings, Western critics endlessly debated how much credit to give social media itself. While in the background, security agencies across several MENA states reached a much simpler conclusion: if networked communication can help topple a dictator, then they needed to embed themselves deep inside those networks. Analyses of the rise of digital authoritarianism in MENA show how quickly officials pivoted from being surprised by online organizing to building systems to monitor and pre‑empt it.

In the years after 2011, governments across the region poured money into tools that let them systematically watch what people said and did on major platforms. Foreign vendors set up monitoring centers and interception systems that let security agencies block tens of thousands of sites, scrape and analyze social media at scale, monitor activist pages and online communities, and track activists in real time. They built a new, pre‑emptive model of digital control, one that assumes the state should see as much as possible, as early as possible.

As we noted in 2011, exporting permanent surveillance infrastructure to already‑abusive governments doesn’t “modernize” public safety; it locks in an architecture of control that is primed to abuse dissidents, journalists, and marginalized communities.

Domestic Lawfare and Cyber-Mercenaries

After the uprisings, a number of governments also rewrote the rules that govern online life. Cybercrime laws, “fake news” provisions, and overbroad public‑order and ‘morality’ offences gave prosecutors and security agencies legal cover to act with impunity. Governments in Saudi Arabia, Tunisia, Jordan, and Egypt combined counterterrorism, cybercrime, defamation, and protest laws into a legal thicket designed to make online dissent feel dangerous and costly. Morality laws and cybercrime provisions are used to target queer and trans people based on identity and expression.​

At the United Nations, a new global cybercrime convention now risks baking this logic into international law. The convention was adopted by the UN General Assembly in late 2024, despite serious human rights concerns raised by civil society. Echoing our partners, EFF warned at the time that the UN cybercrime draft convention remained too flawed to adopt and urged states to reject the draft language because it legitimized expansive surveillance powers and criminalized legitimate expression, security research, and everyday digital practices around the world. While on paper, these instruments gesture to “public safety” objectives, in practice they function as pathways for state security agencies to monitor, prosecute, and silence the communities most at risk. For state-targeted communities, that makes being visible online a calculated risk, not a neutral choice.​​

Criminal codes are only half the story; mercenary tech is the other. As governments worldwide looked for ways to outpace their critics, a parallel market emerged to help them infiltrate and take over devices. Companies like NSO Group marketed Pegasus and similar tools as off‑the‑shelf capabilities for governments that wanted to hack a target’s cellphones or other devices to read messages, turn on microphones, and monitor entire social networks while bypassing the courts. 

In 2019, UN Special Rapporteur David Kaye called for a global moratorium on the sale and transfer of private surveillance tools until real, enforceable safeguards exist. Two years later, forensic work by Amnesty and media partners showed how the same spyware used to hack phones of Palestinian human‑rights defenders was used to surveil journalists, activists, lawyers, and political opponents across dozens of countries

Regional groups responded by demanding an end to the sale of surveillance technology to autocratic governments and security agencies, arguing that you cannot keep selling “lawful intercept” tools into systems where law itself is an instrument of repression. Commercial spyware is at the center of digital repression, not at its margins. Surveillance vendors are not neutral suppliers. Safeguards remain weak, fragmented, or nonexistent in most of the countries buying these tools, yet vendors continue seeking new contracts and new militarized “use cases.” Put bluntly, the companies that design, market, and maintain these systems precisely because they enable this kind of control profit from (and help entrench) authoritarian power.

Biometrics, Facial Recognition, and AI‑Powered Surveillance Cities

On top of this rapidly intensifying interception and spyware stack, governments and companies began layering biometrics and face recognition into everyday systems, creating pathways for bulk data collection, automated analysis, and risk profiling. In parts of MENA, national ID schemes, border and migration controls, and centralized biometric databases have been rolled out in environments with weak or captured data‑protection laws, making it easy to link people’s movements, services, and political activity to a single, persistent identifier.​

Humanitarian programs are not exempt from this protocol. In Jordan, Syrian refugees have been required to submit iris scans and biometric data to access cash assistance and food, turning “consent” into a precondition for survival. When access to aid depends on enrollment in centralized biometric systems, any breach, misuse, or repurposing of that data can have severe, life‑altering consequences for people who have no realistic way to opt out. Investigations into surveillance‑tech firms complicit in abuses in MENA show that vendors profit from supplying biometric and surveillance tools for migration management and internal security, even when those tools are used in discriminatory or abusive ways.​

Like elsewhere, mass surveillance technologies in MENA were first piloted on people who were already criminalized or made vulnerable by poverty. But their use quickly expanded from narrow, security‑framed deployments to routine use in city streets. As hardware sensors, cameras, and data storage got cheaper, “smart city” surveillance systems promised seamless security and services, and it became easier and less politically contentious to keep these systems running everywhere, all the time.​

Unlike targeted hacking tools, these broad, city‑wide surveillance infrastructures erase any practical line between people under investigation and the broad public, normalizing bulk, indiscriminate monitoring of public space and everyday movement. In the Gulf, facial recognition and dense sensor networks are increasingly built into high‑profile “smart city” and mega‑project plans that lean heavily on biometric and AI‑driven monitoring. These are security‑first development projects where biometric and sensor infrastructures are designed from the outset to embed policing, migration control, and commercial tracking into the urban fabric. In this vision of the Gulf’s “smart city” future—often sold as seamless services and digital opportunity—“smart” is the branding, and pervasive monitoring is the operating principle.​​

EFF has consistently opposed government use of face recognition and biometric surveillance, in some instances calling for outright bans. In contexts that treat peaceful dissent as a security threat, embedding biometric surveillance into everyday infrastructure locks in a balance of power that favors militarized policing and state control. That infrastructure is now the starting point for a new set of risks. Surveillance systems built over the last decade are being repackaged as the foundation for a new generation of “AI‑enabled” defense and security products. 

Companies that once focused on video management or perimeter security now advertise “defense applications” for AI‑driven situational awareness and threat detection, using computer‑vision models to scan camera feeds, compare against existing watchlists, and flag “suspicious” people or behaviors in real time. Drone and sensor platforms are being upgraded with embedded AI that tracks and classifies targets autonomously and with “drone‑based AI threat detection and intelligent situational awareness,” turning aerial surveillance into a continuous data feed for security agencies and militaries. In smart‑city and defense expos from the Gulf to Europe and North America, similar systems are marketed as neutral efficiency upgrades or tools to “protect critical infrastructure,” even where they are explicitly designed to scale up border enforcement, protest surveillance, and internal security operations.

As these systems are folded into AI‑driven defense products, the line between “civilian” infrastructure and militarized surveillance disappears, turning streets, borders, and aid sites into continuous input for security operations. That is the landscape that human rights and accountability efforts now have to confront.

Templates of Control, Networks of Resistance

The patterns established in heavily securitized MENA states after the Arab Spring now shape how states monitor and crush more recent uprisings, from Iran’s use of location data and facial recognition to track down protesters to long‑running crackdowns elsewhere in the region. This model of “digital authoritarianism” built on spyware, data‑hungry ID systems, platform control, and emergency‑style security laws has emerged everywhere from Latin America to Eastern Europe to here in the United States. As the new UN Cybercrime Convention moves toward implementation, its broad offences and surveillance powers risk turning this ad hoc toolkit into a formal template for cross‑border data‑sharing, repression, and an all‑purpose global surveillance instrument.

For people on the ground, none of this is theoretical. Human‑rights defenders, journalists, and ordinary users across the region face arrest, long prison sentences, and exile based on their digital traces. In that context, commercial spyware is not a marginal issue but part of the core machinery of repression. Pegasus has been used to hack journalists’ phones through zero‑click exploits and compromise human‑rights defenders and watchdog organizations themselves, including staff at Amnesty’s Pegasus Project partners and Human Rights Watch. These deployments give practical effect to the “cybercrime” and “terrorism” frameworks described earlier: person‑by‑person campaigns against particular communities, contacts, and networks, rather than “neutral,” generalized security measures.

Under these conditions, everyday security becomes a second job. People describe carrying multiple phones, keeping one for relatively “clean” uses and others for riskier conversations, splitting identities across platforms, using coded language, and moving their organizing off mainstream services when possible. Pushing this burden onto users is a political choice: states, platforms, and vendors could build systems that are safe by design; instead, they externalize risk to the people they watch and punish.

Even against that backdrop, civil society organizations have refused to capitulate to security agencies and vendors. Regional coalitions have demanded strict export controls and outright bans on selling intrusive surveillance tech to autocratic governments. Advocates have also pushed companies to do more than box‑ticking “due diligence.” Work with surveillance‑tech firms in the context of migration and border control has repeatedly shown that most are still far from serious human‑rights assessments, let alone willing to turn down these lucrative contracts.

Many of the same governments that have been critical of others on the issue of human rights have hosted or licensed companies that build these tools, in some cases buying similar capabilities for their own security agencies. European authorities, for instance, have investigated FinFisher’s export of spyware “made in Germany” to Turkey and other non‑EU governments. Meanwhile, the NSO Group has at least 22 Pegasus contracts with security and law‑enforcement agencies in 12 EU countries. This is a transnational industry, not a localized problem.

Against near impossible odds, people continue finding pathways to freedom. The global surveillance sector reinforces the same hierarchies and violence that people have found ways to survive for generations. Queer activists and others at the sharpest edges of this system have had to develop their own forms of resistance, including against biometric and data‑driven targeting. Encryption, circumvention tools, and security training are not silver bullets, but they remain essential for anyone trying to organize, document abuses, or simply exist online with a bit less risk. Resources like EFF’s Surveillance Self‑Defense are one piece of that ecosystem, alongside trainers and groups who have been doing this work on the ground for years.​

Defending the Future of Digital Dissent

The Arab Spring is often remembered through images of packed squares and hopeful tweets. But contending with its aftermath means confronting the surveillance architecture built in its shadow: laws that turn online speech into a crime, spyware and biometric systems that turn phones and faces into tracking beacons, and platform practices that routinely sacrifice the people most at risk. None of that is inevitable, and none of it is confined to one part of the world.

Accountability has to reach both governments and the companies that profit from arming them with these tools. That means pushing for far stronger limits on how surveillance tech is built, sold, and deployed; demanding meaningful transparency when these systems are used; and defending the tools people rely on to communicate and organize safely, including robust encryption and secure channels. It also means taking direction from the people and communities who have been navigating and resisting this landscape for years.

Surveillance itself is transnational: tools, playbooks, and data moves across borders as easily as money. And so we, too, continue our work, documenting abuses, sharing security knowledge, and collectively organizing against these violent systems.

This is the third installment of a blog series reflecting on the global digital legacy of the 2011 Arab uprisings. Read the rest of the series here.

  •  
❌