March 10, 2026: This post has been updated to note that Amazon Q Detector Library describes the detectors used during code reviews to identify security and quality issues in code.
Enterprise customers face an unprecedented security landscape where sophisticated cyber threats use artificial intelligence to identify vulnerabilities, automate attacks, and evade detection at machine speed. Traditional perimeter-based security models are insufficient when adversaries can analyze millions of attack vectors in seconds and exploit zero-day vulnerabilities before patches are available.
The distributed nature of serverless architectures compounds this challenge—while microservices offer agility and scalability, they significantly expand the attack surface where each API endpoint, function invocation, and data store becomes a potential entry point, and a single misconfigured component can provide attackers the foothold needed for lateral movement. Organizations must simultaneously navigate complex regulatory environments where compliance frameworks like GDPR, HIPAA, PCI-DSS, and SOC 2 demand robust security controls and comprehensive audit trails, while the velocity of software development creates tension between security and innovation, requiring architectures that are both comprehensive and automated to enable secure deployment without sacrificing speed.
The challenge is multifaceted:
Expanded attack surface: Multiple entry points across distributed services requiring protection against distributed denial of service (DDoS) attacks, injection vulnerabilities, and unauthorized access
Identity and access complexity: Managing authentication and authorization across numerous microservices and service-to-service communications
Data protection requirements: Encrypting sensitive data in transit and at rest while securely storing and rotating credentials without compromising performance
Compliance and data protection: Meeting regulatory requirements through comprehensive audit trails and continuous monitoring in distributed environments
Network isolation challenges: Implementing controlled communication paths without exposing resources to the public internet
AI-powered threats: Defending against attackers who use AI to automate reconnaissance, adapt attacks in real-time, and identify vulnerabilities at machine speed
The solution lies in defense-in-depth—a layered security approach where multiple independent controls work together to protect your application.
This article demonstrates how to implement a comprehensive AI-powered defense-in-depth security architecture for serverless microservices on Amazon Web Services (AWS). By layering security controls at each tier of your application, this architecture creates a resilient system where no single point of failure compromises your entire infrastructure, designed so that if one layer is compromised, additional controls help limit the impact and contain the incident while incorporating AI and machine learning services throughout to help organizations address and respond to AI-powered threats with AI-powered defenses.
Architecture overview: A journey through security layers
Let’s trace a user request from the public internet through our secured serverless architecture, examining each security layer and the AWS services that protect it. This implementation deploys security controls at seven distinct layers with continuous monitoring and AI-powered threat detection throughout, where each layer provides specific capabilities that work together to create a comprehensive defense-in-depth strategy:
Layer 1 blocks malicious traffic before it reaches your application
Layer 2 verifies user identity and enforces access policies
Layer 3 encrypts communications and manages API access
Layer 4 isolates resources in private networks
Layer 5 secures compute execution environments
Layer 6 protects credentials and sensitive configuration
Layer 7 encrypts data at rest and controls data access
Continuous monitoring detects threats across layers using AI-powered analysis
Figure 1: Architecture diagram
Layer 1: Edge protection
Before requests reach your application, they traverse the public internet where attackers launch volumetric DDoS attacks, SQL injection, cross-site scripting (XSS), and other web exploits. AWS observed and mitigated thousands of distributed denial of service (DDoS) attacks in 2024, with one exceeding 2.3 terabits per second.
DDos protection: AWS Shield provides managed DDoS protection for applications running on AWS and is enabled for customers at no cost. AWS Shield Advanced offers enhanced detection, continuous access to the AWS DDoS Response Team (DRT), cost protection during attacks, and advanced diagnostics for enterprise applications.
Layer 7 protection: AWS WAFprotects against Layer 7 attacks through managed rule groups from AWS and AWS Marketplace sellers that cover OWASP Top 10 vulnerabilities including SQL injection, XSS, and remote file inclusion. Rate-based rules automatically block IPs that exceed request thresholds, protecting against application-layer DDoS and brute force attacks. Geo-blocking capabilities restrict access based on geographic location, while Bot Control uses machine learning to identify and block malicious bots while allowing legitimate traffic.
AI for security: Amazon GuardDuty uses generative AI to enhance native security services, implementing AI capabilities to improve threat detection, investigation, and response through automated analysis.
AI-powered enhancement: Organizations can build autonomous AI security agents using Amazon Bedrock to analyze AWS WAF logs, reason through attack data, and automate incident response. These agents detect novel attack patterns that signature-based systems miss, generate natural language summaries of security incidents, automatically recommend AWS WAF rule updates based on emerging threats, correlate attack indicators across distributed services to identify coordinated campaigns, and trigger appropriate remediation actions based on threat context. This helps enable more proactive threat detection and response capabilities, reducing mean time to detection and response.
Layer 2: Verifying identity
After requests pass edge protection, you must verify user identity and determine resource access. Traditional username/password authentication is vulnerable to credential stuffing, phishing, and brute force attacks, requiring robust identity management that supports multiple authentication methods and adaptive security responding to risk signals in real time.
Amazon Cognito provides comprehensive identity and access management for web and mobile applications through two components:
User pools offer a fully managed user directory handling registration, sign-in, multi-factor authentication (MFA), password policies, social identity provider integration, SAML and OpenID Connect federation for enterprise identity providers, and advanced security features including adaptive authentication and compromised credential detection.
Identity pools grant temporary, limited-privilege AWS credentials to users for secure direct access to AWS services without exposing long-term credentials.
Amazon Cognito adaptive authentication uses machine learning to detect suspicious sign-in attempts by analyzing device fingerprinting, IP address reputation, geographic location anomalies, and sign-in velocity patterns, then allows sign-in, requires additional MFA verification, or blocks attempts based on risk assessment. Compromised credential detection automatically checks credentials against databases of compromised passwords and blocks sign-ins using known compromised credentials. MFA supports both SMS-based and time-based one-time password (TOTP) methods, significantly reducing account takeover risk.
For advanced behavioral analysis, organizations can use Amazon Bedrock to analyze patterns across extended timeframes, detecting account takeover attempts through geographic anomalies, device fingerprint changes, access pattern deviations, and time-of-day anomalies.
Layer 3: The application front door
An API gateway serves as your application’s entry point. It must handle request routing, throttling, API key management, encryption and it needs to integrate seamlessly with your authentication layer and provide detailed logging for security auditing while maintaining high performance and low latency.
Amazon API Gateway is a fully managed service for creating, publishing, and securing APIs at scale, providing critical security capabilities including SSL/TLS encryption withAWS Certificate Manager (ACM) to automatically handle certificate provisioning, renewal, and deployment. Request throttling and quota management protects backend services through configurable burst and rate limits with usage quotas per API key or client to prevent abuse, while API key management controls access from partner systems and third-party integrations. Request/response validation uses JSON Schema to validate data before reaching AWS Lambda functions, preventing malformed requests from consuming compute resources while seamless integration with Amazon Cognito validates JSON Web Tokens (JWTs) and enforces authentication requirements before requests reach application logic.
GuardDuty provides AI-powered intelligent threat detection by analyzing API invocation patterns and identifying suspicious activity including credential exfiltration using machine learning. For advanced analysis, Amazon Bedrock analyzes API Gateway metrics and Amazon CloudWatch logs to identify unusual HTTP 4XX error spikes (for example, 403 Forbidden) that might indicate scanning or probing attempts, geographic distribution anomalies, endpoint access pattern deviations, time-series anomalies in request volume, or suspicious user agent patterns.
Layer 4: Network isolation
Application logic and data must be isolated from direct internet access. Network segmentation is designed to limit lateral movement if a security incident occurs, helping to prevent compromised components from easily accessing sensitive resources.
Amazon Virtual Private Cloud (Amazon VPC) provides isolated network environments implementing a multi-tier architecture with public subnets for NAT gateways and application load balancers with internet gateway routes, private subnets for Lambda functions and application components accessing the internet through NAT Gateways for outbound connections, and data subnets with the most restrictive access controls. Lambda functions run in private subnets to prevent direct internet access, VPC flow logs capture network traffic for security analysis, security groups provide stateful firewalls following least privilege principles, Network ACLs add stateless subnet-level firewalls with explicit deny rules, and VPC endpoints enable private connectivity to Amazon DynamoDB, AWS Secrets Manager, and Amazon S3 without traffic leaving the AWS network.
GuardDuty provides AI-powered network threat detection by continuously monitoring VPC Flow Logs, CloudTrail logs, and DNS logs using machine learning to identify unusual network patterns, unauthorized access attempts, compromised instances, and reconnaissance activity, now including generative AI capabilities for automated analysis and natural language security queries.
Layer 5: Compute security
Lambda functions executing your application code and often requiring access to sensitive resources and credentials must be protected against code injection, unauthorized invocations, and privilege escalation. Additionally, functions must be monitored for unusual behavior that might indicate compromise.
Lambda provides built-in security features including:
Resource-based policies that control which services and accounts can invoke functions to prevent unauthorized invocations
Environment variable encryption using AWS Key Management Services (AWS KMS) for variables at rest while sensitive data should use Secrets Manager function isolation designed so that each execution runs in isolated environments preventing cross-invocation data access
VPC integration enabling functions to benefit from network isolation and security group controls
Runtime security with automatically patched and updated managed runtimes
Code signing with AWS Signer digitally signing deployment packages for code integrity and cryptographic verification against unauthorized modifications
TheAmazon Q Detector Library describes the detectors used during code reviews to identify security and quality issues in code. Detectors contain rules that are used to identify critical security vulnerabilities like OWASP Top 10 and CWE Top 25 issues, including secrets exposure and package dependency vulnerabilities. They also detect code quality concerns such as IaC best practices and inefficient AWS API usage patterns, helping developers maintain secure and high-quality applications.
Vulnerability management: Amazon Inspector provides automated vulnerability management, continuously scanning Lambda functions for software vulnerabilities and network exposure, using machine learning to prioritize findings and provide detailed remediation guidance.
Layer 6: Protecting credentials
Applications require access to sensitive credentials including database passwords, API keys, and encryption keys. Hardcoding secrets in code or storing them in environment variables creates security vulnerabilities, requiring secure storage, regular rotation, authorized-only access, and comprehensive auditing for compliance.
Secrets Manager protects access to applications, services, and IT resources without managing hardware security modules (HSMs). It provides centralized secret storage for database credentials, API keys, and OAuth tokens in an encrypted repository using AWS KMS encryption at rest.
Automatic secret rotation configures rotation for database credentials, automatically updating both the secret store and target database without application downtime.
Fine-grained access control uses IAM policies to control which users and services access specific secrets, implementing least-privilege access.
Audit trails log secret access in AWS CloudTrail for compliance and security investigations. VPC endpoint support is designed so that secret retrieval traffic doesn’t leave the AWS network.
Lambda integration enables functions to retrieve secrets programmatically at runtime, designed so that secrets aren’t stored in code or configuration files and can be rotated without redeployment.
GuardDuty provides AI-powered monitoring, detecting anomalous behavior patterns that could indicate credential compromise or unauthorized access.
Layer 7: Data protection
The data layer stores sensitive business information and customer data requiring protection both at rest and in transit. Data must be encrypted, access tightly controlled, and operations audited, while maintaining resilience against availability attacks and high performance.
Amazon DynamoDB is a fully managed NoSQL database providing built-in security features including:
Encryption at rest (using AWS-owned, AWS managed, or customer managed KMS keys)
Encryption in transit (TLS 1.2 or higher)
Fine-grained access control through IAM policies with item-level and attribute-level permissions
VPC endpoints for private connectivity
Point-in-Time Recovery for continuous backups
Streams for audit trails
Backup and disaster recovery capabilities
Global Tables for multi-AWS Region, multi-active replication designed to provide high availability and low-latency global access
GuarDuty and Amazon Bedrock provide AI-powered data protection:
GuardDuty monitors DynamoDB API activity through CloudTrail logs using machine learning to detect anomalous data access patterns including unusual query volumes, access from unexpected geographic locations, and data exfiltration attempts.
Amazon Bedrock analyzes DynamoDB Streams and CloudTrail logs to identify suspicious access patterns, correlate anomalies across multiple tables and time periods, generate natural language summaries of data access incidents for security teams, and recommend access control policy adjustments based on actual usage patterns versus configured permissions. This helps transform data protection from reactive monitoring to proactive threat hunting that can detect compromised credentials and insider threats.
Continuous monitoring
Even with comprehensive security controls at every layer, continuous monitoring is essential to detect threats that bypass defenses. Security requires ongoing real-time visibility, intelligent threat detection, and rapid response capabilities rather than one-time implementation.
GuardDuty protects your AWS accounts, workloads, and data with intelligent threat detection.
CloudWatch provides comprehensive monitoring and observability, collecting metrics, monitoring log files, setting alarms, and automatically reacting to AWS resource changes.
CloudTrail provides governance, compliance, and operational auditing by logging all API calls in your AWS account, creating comprehensive audit trails for security analysis and compliance reporting.
AI-powered enhancement with Amazon Bedrock provides automated threat analysis; generating natural language summaries of GuardDuty findings and CloudWatch logs, pattern recognition identifying coordinated attacks across multiple security signals, incident response recommendations based on your architecture and compliance requirements, security posture assessment with improvement recommendations, and automated response through Lambda and Amazon EventBridge that isolates compromised resources, revokes suspicious credentials, or notifies security teams through Amazon SNS when threats are detected.
Conclusion
Securing serverless microservices presents significant challenges, but as demonstrated, using AWS services alongside AI-powered capabilities creates a resilient defense-in-depth architecture that protects against current and emerging threats while proving that security and agility are not mutually exclusive.
Security is an ongoing process—continuously monitor your environment, regularly review security controls, stay informed about emerging threats and best practices, and treat security as a fundamental architectural principle rather than an afterthought.
If you have feedback about this blog post, submit them in the Comments section below. If you have questions about using this solution, start a thread in the EventBridge, GuardDuty, or Security Hub forums, or contact AWS Support.
December 2, 2019: Original publication date of this post.
At AWS, we encourage you to use automation. Not just to deploy your workloads and configure services, but to also help you quickly detect and respond to security events within your AWS environments. In addition to increasing the speed of detection and response, automation also helps you scale your security operations as your workloads in AWS increase and scale as well. For these reasons, security automation is a key principle outlined in the Well-Architected Framework, the AWS Cloud Adoption Framework, and the AWS Security Incident Response Guide.
Security response automation is a broad topic that spans many areas. The goal of this blog post is to introduce you to core concepts and help you get started. You will learn how to implement automated security response mechanisms within your AWS environments. This post will include common patterns that customers often use, implementation considerations, and an example solution. Additionally, we will share resources AWS has produced in the form of the Automated Security ResponseGitHub repo. The GitHub repo includes scripts that are ready-to-deploy for common scenarios.
What is security response automation?
Security response automation is a planned and programmed action taken to achieve a desired state for an application or resource based on a condition or event. When you implement security response automation, you should adopt an approach that draws from existing security frameworks. Frameworks are published materials which consist of standards, guidelines, and best practices in order help organizations manage cybersecurity-related risk. Using frameworks helps you achieve consistency and scalability and enables you to focus more on the strategic aspects of your security program. You should work with compliance professionals within your organization to understand any specific compliance or security frameworks that are also relevant for your AWS environment.
Our example solution is based on the NIST Cybersecurity Framework (CSF), which is designed to help organizations assess and improve their ability to help prevent, detect, and respond to security events. According to the CSF, “cybersecurity incident response” supports your ability to contain the impact of potential cybersecurity events.
Although automation is not a CSF requirement, automating responses to events enables you to create repeatable, predictable approaches to monitoring and responding to threats. When we build automation around events that we know should not occur, it gives us an advantage over a malicious actor because the automation is able to respond within minutes or even seconds compared to an on-call support engineer.
The five main steps in the CSF are identify, protect, detect, respond and recover. We’ve expanded the detect and respond steps to include automation and investigation activities.
Figure 1: The five steps in the CSF
The following definitions for each step in the diagram above are based on the CSF but have been adapted for our example in this blog post. Although we will focus on the detect, automate and respond steps, it’s important to understand the entire process flow.
Identify: Identify and understand the resources, applications, and data within your AWS environment.
Protect: Develop and implement appropriate controls and safeguards to facilitate the delivery of services.
Detect: Develop and implement appropriate activities to identify the occurrence of a cybersecurity event. This step includes the implementation of monitoring capabilities which will be discussed further in the next section.
Automate: Develop and implement planned, programmed actions that will achieve a desired state for an application or resource based on a condition or event.
Investigate: Perform a systematic examination of the security event to establish the root cause.
Respond: Develop and implement appropriate activities to take automated or manual actions regarding a detected security event.
Recover: Develop and implement appropriate activities to maintain plans for resilience and to restore capabilities or services that were impaired due to a security event
Security response automation on AWS
AWS CloudTrail and AWS Config continuously log details regarding users and other identity principals, the resources they interacted with, and configuration changes they might have made in your AWS account. We are able to combine these logs with Amazon EventBridge, which gives us a single service to trigger automations based on events. You can use this information to automatically detect resource changes and to react to deviations from your desired state.
Figure 2: Automated remediation flow
As shown in the diagram above, an automated remediation flow on AWS has three stages:
Monitor: Your automated monitoring tools collect information about resources and applications running in your AWS environment. For example, they might collect AWS CloudTrail information about activities performed in your AWS account, usage metrics from your Amazon EC2 instances, or flow log information about the traffic going to and from network interfaces in your Amazon Virtual Private Cloud (VPC).
Detect: When a monitoring tool detects a predefined condition—such as a breached threshold, anomalous activity, or configuration deviation—it raises a flag within the system. A triggering condition might be an anomalous activity detected by Amazon GuardDuty, a resource out of compliance with an AWS Config rule, or a high rate of blocked requests on an Amazon VPC security group or AWS Web Application Firewall (AWS WAF) web access control list (web-acl).
Respond: When a condition is flagged, an automated response is triggered that performs an action you’ve predefined—something intended to remediate or mitigate the flagged condition.
Examples of automated response actions may include modifying a VPC security group, patching an Amazon EC2 instance, rotating various different types of credentials, or adding an additional entry into an IP set in AWS WAF that is part of a web-acl rule to block suspicious clients who triggered a threshold from a monitoring metric.
You can use the event-driven flow described above to achieve a variety of automated response patterns with varying degrees of complexity. Your response pattern could be as simple as invoking a single AWS Lambda function, or it could be a complex series of AWS Step Function tasks with advanced logic. In this blog post, we’ll use two simple Lambda functions in our example solution.
How to define your response automation
Now that we’ve introduced the concept of security response automation, start thinking about security requirements within your environment that you’d like to enforce through automation. These design requirements might come from general best practices you’d like to follow, or they might be specific controls from compliance frameworks relevant for your business.
Customers start with the run-books they already use as part of their Incident Response Lifecycle. Simple run-books, like responding to an exfiltrated credential, can be quickly mapped to automation especially if your run book calls for the disabling of the credential and the notification of on-call personnel. But it can be resource driven as well. Events such as a new AWS VPC being created might trigger your automation to immediately deploy your company’s standard configuration for VPC flowlog collection.
Your objectives should be quantitative, not qualitative. Here are some examples of quantitative objectives:
Remote administrative network access to servers should be limited.
Server storage volumes should be encrypted.
AWS console logins should be protected by multi-factor authentication.
As an optional step, you can expand these objectives into user stories that define the conditions and remediation actions when there is an event. User stories are informal descriptions that briefly document a feature within a software system. User stories may be global and span across multiple applications or they may be specific to a single application.
For example:
“Remote administrative network access to servers should have limited access from internal trusted networks only. Remote access ports include SSH TCP port 22 and RDP TCP port 3389. If remote access ports are detected within the environment and they are accessible to outside resources, they should be automatically closed and the owner will be notified.”
Once you’ve completed your user story, you can determine how to use automated remediation to help achieve these objectives in your AWS environment. User stories should be stored in a location that provides versioning support and can reference the associated automation code.
You should carefully consider the effect of your remediation mechanisms in order to help prevent unintended impact on your resources and applications. Remediation actions such as instance termination, credential revocation, and security group modification can adversely affect application availability. Depending on the level of risk that’s acceptable to your organization, your automated mechanism can only provide a notification which would then be manually investigated prior to remediation. Once you’ve identified an automated remediation mechanism, you can build out the required components and test them in a non-production environment.
Sample response automation walkthrough
In the following section, we’ll walk you through an automated remediation for a simulated event that indicates potential unauthorized activity—the unintended disabling of CloudTrail logging. Outside parties might want to disable logging to avoid detection and the recording of their unauthorized activity. Our response is to re-enable the CloudTrail logging and immediately notify the security contact. Here’s the user story for this scenario:
“CloudTrail logging should be enabled for all AWS accounts and regions. If CloudTrail logging is disabled, it will automatically be enabled and the security operations team will be notified.”
A note about the sample response automation below as it references Amazon EventBridge: EventBridge was formerly referred to as Amazon CloudWatch Events. If you see other documentation referring to Amazon CloudWatch, you can find that configuration now via the Amazon EventBridge console page.
Additionally, we will be looking at this scenario through the lens of an account that has a stand-alone CloudTrail configuration. While this is an acceptable configuration, AWS recommends using AWS Organizations, which allows you to configure an organizational CloudTrail. These organizational trails are immutable to the child accounts so that logging data cannot be removed or tampered with.
Important: You’ll use AWS CloudTrail to test the sample remediation. Running more than one CloudTrail trail in your AWS account will result in charges based on the number of events processed while the trail is running. Charges for additional copies of management events recorded in a Region are applied based on the published pricingplan. To minimize the charges, follow the clean-up steps that we provide later in this post to remove the sample automation and delete the trail.
Deploy the sample response automation
In this section, we’ll show you how to deploy and test the CloudTrail logging remediation sample. Amazon GuardDuty generates the finding
Stealth:IAMUser/CloudTrailLoggingDisabled when CloudTrail logging is disabled, and AWS Security Hub collects findings from GuardDuty using the standardized finding format mentioned earlier. We recommend that you deploy this sample into a non- production AWS account.
Select the Launch Stack button below to deploy a CloudFormation template with an automation sample in the us-east-1 Region. You can also download the template and implement it in another Region. The template consists of an Amazon EventBridge rule, an AWS Lambda function, and the IAM permissions necessary for both components to execute. It takes several minutes for the CloudFormation stack build to complete.
In the CloudFormation console, choose the Select Template form, and then select Next.
On the Specify Details page, provide the email address for a security contact. For the purpose of this walkthrough, it should be an email address that you have access to. Then select Next.
On the Options page, accept the defaults, then select Next.
On the Review page, confirm the details, then select Create.
While the stack is being created, check the inbox of the email address that you provided in step 2. Look for an email message with the subject AWS Notification – Subscription Confirmation. Select the link in the body of the email to confirm your subscription to the Amazon Simple Notification Service (Amazon SNS) topic. You should see a success message like the one shown in Figure 3:
Figure 3: SNS subscription confirmation
Return to the CloudFormation console. After the Status field for the CloudFormation stack changes to CREATE COMPLETE (as shown in Figure 4), the solution is implemented and is ready for testing.
Figure 4: CREATE_COMPLETE status
Test the sample automation
You’re now ready to test the automated response by creating a test trail in CloudTrail, then trying to stop it.
From the AWS Management Console, choose Services > CloudTrail.
Select Trails, then select Create Trail.
On the Create Trail form:
Enter a value for Trail name and for AWS KMS alias, as shown in Figure 5.
For Storage location, create a new S3 bucket or choose an existing one. For our testing, we create a new S3 bucket.
Figure 5: Create a CloudTrail trail
On the next page, under Management events, select Write-only (to minimize event volume).
Figure 6: Create a CloudTrail trail
On the Trails page of the CloudTrail console, verify that the new trail has started. You should see the status as logging, as shown in Figure 7.
Figure 7: Verify new trail has started
You’re now ready to act like an unauthorized user trying to cover their tracks. Stop the logging for the trail that you just created:
Select the new trail name to display its configuration page.
In the top-right corner, choose the Stop logging button.
When prompted with a warning dialog box, select Stop logging.
Verify that the logging has stopped by confirming that the Start logging button now appears in the top right, as shown in Figure 8.
Figure 8: Verify logging switch is off
You have now simulated a security event by disabling logging for one of the trails in the CloudTrail service. Within the next few seconds, the near real-time automated response will detect the stopped trail, restart it, and send an email notification. You can refresh the Trails page of the CloudTrail console to verify through the Stop logging button at the top right corner.
Within the next several minutes, the investigatory automated response will also begin. GuardDuty will detect the action that stopped the trail and enrich the data about the source of unexpected behavior. Security Hub will then ingest that information and optionally correlate with other security events.
In the AWS Management Console, choose Services > Security Hub.
In the left pane, select Findings.
Select the Add filters field, then select Type.
Select EQUALS, paste TTPs/Defense Evasion/Stealth:IAMUser-CloudTrailLoggingDisabled into the field, then select Apply.
Refresh your browser periodically until the finding is generated.
Figure 9: Monitor Security Hub for your finding
Select the title of the finding to review details. When you’re ready, you can choose to archive the finding by selecting the Archive link. Alternately, you can select a custom action to continue with the response. Custom actions are one of the ways that you can integrate Security Hub with custom partner solutions.
Now that you’ve completed your review of the finding, let’s dig into the components of automation.
How the sample automation works
This example incorporates two automated responses: a near real-time workflow and an investigatory workflow. The near real-time workflow provides a rapid response to an individual event, in this case the stopping of a trail. The goal is to restore the trail to a functioning state and alert security responders as quickly as possible. The investigatory workflow still includes a response to provide defense in depth and uses services that support a more in-depth investigation of the incident.
Figure 10: Sample automation workflow
In the near real-time workflow, Amazon EventBridge monitors for the undesired activity.
When a trail is stopped, AWS CloudTrail publishes an event on the EventBridge bus. An EventBridge rule detects the trail-stopping event and invokes a Lambda function to respond to the event by restarting the trail and notifying the security contact via an Amazon Simple Notification Service (SNS) topic.
In the investigative workflow, CloudTrail logs are monitored for undesired activities. For example, if a trail is stopped, there will be a corresponding log record. GuardDuty detects this activity and retrieves additional data points regarding the source IP that executed the API call. Two common examples of those additional data points in GuardDuty findings include whether the API call came from an IP address on a threat list, or whether it came from a network not commonly used in your AWS account. An AWS Lambda function responds by restarting the trail and notifying the security contact. The finding is imported into AWS Security Hub, where it’s aggregated with other findings for analyst viewing. Using EventBridge, you can configure Security Hub to export the finding to partner security orchestration tools, SIEM (security information and event management) systems, and ticketing systems for investigation.
AWS Security Hub imports findings from AWS security services such as GuardDuty, Amazon Macie and Amazon Inspector, plus from third-party product integrations you’ve enabled. Findings are provided to Security Hub in AWS Security Finding Format (ASFF), which minimizes the need for data conversion. Security Hub correlates these findings to help you identify related security events and determine a root cause. Security Hub also publishes its findings to Amazon EventBridge to enable further processing by other AWS services such as AWS Lambda. You can also create custom actions using Security Hub. Custom actions are useful for security analysts working with the Security Hub console who want to send a specific finding, or a small set of findings, to a response or a remediation workflow.
Deeper look into how the “Respond” phase works
Amazon EventBridge and AWS Lambda work together to respond to a security finding.
Amazon EventBridge is a service that provides real-time access to changes in data in AWS services, your own applications, and Software-as-a-Service (SaaS) applications without writing code. In this example, EventBridge identifies a Security Hub finding that requires action and invokes a Lambda function that performs remediation. As shown in Figure 11, the Lambda function both notifies the security operator via SNS and restarts the stopped CloudTrail.
Figure 11: Sample “respond” workflow
To set this response up, we looked for an event to indicate that a trail had stopped or was disabled. We knew that the GuardDuty finding Stealth:IAMUser/CloudTrailLoggingDisabled is raised when CloudTrail logging is disabled. Therefore, we configured the default event bus to look for this event.
When Security Hub publishes a finding to EventBridge, it includes full details of the finding as discovered by GuardDuty. The finding is published in JSON format. If you review the details of the sample finding, note that it has several fields helping you identify the specific events that you’re looking for. Here are some of the relevant details:
You can build an event pattern using these fields, which an EventBridge filtering rule can then use to identify events and to invoke the remediation Lambda function. Below is a snippet from the CloudFormation template we provided earlier that defines that event pattern for the EventBridge filtering rule:
# pattern matches the nested JSON format of a specific Security Hub finding
      EventPattern:
        source:
        - aws.securityhub
        detail-type:
          - "Security Hub Findings - Imported"
        detail:
          findings:
            Types:
              - "TTPs/Defense Evasion/Stealth:IAMUser-CloudTrailLoggingDisabled"
Once the rule is in place, EventBridge continuously monitors the event bus for events with this pattern.
When EventBridge finds a match, it invokes the remediating Lambda function and passes the full details of the event to the function. The Lambda function then parses the JSON fields in the event so that it can act as shown in this Python code snippet:
# extract trail ARN by parsing the incoming Security Hub finding (in JSON format)
trailARN = event['detail']['findings'][0]['ProductFields']['action/awsApiCallAction/affectedResources/AWS::CloudTrail::Trail']

# description contains useful details to be sent to security operations
description = event['detail']['findings'][0]['Description']
The code also issues a notification to security operators so they can review the findings and insights in Security Hub and other services to better understand the incident and to decide whether further manual actions are warranted. Here’s the code snippet that uses SNS to send out a note to security operators:
#Sending the notification that the AWS CloudTrail has been disabled.
snspublish = snsclient.publish(
	TargetArn = snsARN,
	Message="Automatically restarting CloudTrail logging.  Event description: \"%s\" " %description
	)
While notifications to human operators are important, the Lambda function will not wait to take action. It immediately remediates the condition by restarting the stopped trail in CloudTrail. Here’s a code snippet that restarts the trail to reenable logging:
After the trail has been restarted, API activity is once again logged and can be audited.
This can help provide relevant data for the remaining steps in the incident response process. The data is especially important for the post-incident phase, when your team analyzes lessons learned to help prevent future incidents. You can also use this phase to identify additional steps to automate in your incident response.
How to Enable Custom Action and build your own Automated Response
Unlike how you set up the notification earlier, you may not want fully automate responses to findings. To set up automation that you can manually trigger it for specific findings, you can use custom actions. A custom action is a Security Hub mechanism for sending selected findings to EventBridge that can be matched by an EventBridge rule. The rule defines a specific action to take when a finding is received that is associated with the custom action ID. Custom actions can be used, for example, to send a specific finding, or a small set of findings, to a response or remediation workflow. You can create up to 50 custom actions.
In this section, we will walk you through how to create a custom action in Security Hub which will trigger an EventBridge rule to execute a Lambda function for the same security finding related to CloudTrail Disabled.
Create a Custom Action in Security Hub
Open Security Hub. In the left navigation pane, under Management, open the Custom actions page.
Choose Create custom action.
Enter an Action Name, Action Description, and Action ID that are representative of an action that you are implementing—for example Enable CloudTrail Logging.
Choose Create custom action.
Copy the custom action ARN that was generated. You will need it in the next steps.
Create Amazon EventBridge Rule to capture the Custom Action
In this section, you will define an EventBridge rule that will match events (findings) coming from Security Hub which were forwarded by the custom action you defined above.
Navigate to the Amazon EventBridge console.
On the right side, choose Create rule.
On the Define rule detail page, give your rule a name and description that represents the rule’s purpose (for example, the same name and description that you used for the custom action). Then choose Next.
Security Hub findings are sent as events to the AWS default event bus. In the Define pattern section, you can identify filters to take a specific action when matched events appear. For the Build event pattern step, leave the Event source set to AWS events or EventBridge partner events.
Scroll down to Event pattern. Under Event source, leave it set to AWS Services, and under AWS Service, select Security Hub.
For the Event Type, choose Security Hub Findings – Custom Action.
Then select Specific custom action ARN(s) and enter the ARN for the custom action that you created earlier.
Notice that as you selected these options, the event pattern on the right was updating. Choose Next.
On the Select target(s) step, from the Select a target dropdown, select Lambda function. Then, from the Function dropdown, select SecurityAutoremediation-CloudTrailStartLoggingLamb-xxxx. This lambda function was created as part of the Cloudformation template.
Choose Next.
For the Configure tags step, choose Next.
For the Review and create step, choose Create rule.
Trigger the automation
As GuardDuty and Security Hub have been enabled, after AWS Cloudtrail logging is enabled, you should see a security finding generated by Amazon GuardDuty and collected in AWS Security Hub.
Navigate to the Security Hub Findings page.
In the top corner, from the Actions dropdown menu, select the Enable CloudTrail Logging custom action.
Verify the CloudTrail configuration by accessing the AWS CloudTrail dashboard.
Confirm that the trail status displays as Logging, which indicates the successful execution of the remediation Lambda function triggered by the EventBridge rule through the custom action.
How AWS helps customers get started
Many customers look at the task of building automation remediation as daunting. Many operations teams might not have the skills or human scale to take on developing automation scripts. Because many Incident Response scenarios can be mapped to findings in AWS security services, we can begin building tools that respond and are quickly adaptable to your environment.
Automated Security Response (ASR) on AWS is a solution that enables AWS Security Hub customers to remediate findings with a single click using sets of predefined response and remediation actions called Playbooks. The remediations are implemented as AWS Systems Manager automation documents. The solution includes remediations for issues such as unused access keys, open security groups, weak account password policies, VPC flow logging configurations, and public S3 buckets. Remediations can also be configured to trigger automatically when findings appear in AWS Security Hub.
The solution includes the playbook remediations for some of the security controls defined as part of the following standards:
AWS Foundational Security Best Practices (FSBP) v1.0.0
Center for Internet Security (CIS) AWS Foundations Benchmark v1.2.0
Center for Internet Security (CIS) AWS Foundations Benchmark v1.4.0
Center for Internet Security (CIS) AWS Foundations Benchmark v3.0.0
Payment Card Industry (PCI) Data Security Standard (DSS) v3.2.1
National Institute of Standards and Technology (NIST) Special Publication 800-53 Revision 5
A Playbook called Security Control is included that allows operation with AWS Security Hub’s Consolidated Control Findings feature.
Figure 12: Architecture of the Automated Security Solution
Additionally, the library includes instructions in the Implementation Guide on how to create new automations in an existing Playbook.
You can use and deploy this library into your accounts at no additional cost, however there are costs associated with the services that it consumes.
Clean up
After you’ve completed the sample security response automation, we recommend that you remove the resources created in this walkthrough example from your account in order to minimize the charges associated with the trail in CloudTrail and data stored in S3.
Important: Deleting resources in your account can negatively impact the applications running in your AWS account. Verify that applications and AWS account security do not depend on the resources you’re about to delete.
New accounts can try GuardDuty at no cost for 30 days. You can suspend or disableGuardDuty before the trial period ends to avoid charges.
You can try AWS Security Hub at no cost with a 30-day free trial. You can avoid charges by disabling theservice before the trial period is over.
Summary
You’ve learned the basic concepts and considerations behind security response automation on AWS and how to use Amazon EventBridge, Amazon GuardDuty and AWS Security Hub to automatically re-enable AWS CloudTrail when it becomes disabled unexpectedly. Additionally you got a chance to learn about the AWS Automated Security Response library and how it can help you rapidly get started with automations through Security Hub. As a next step, you may want to start building your own custom response automations and dive deeper into the AWS Security Incident Response Guide, NISTCybersecurity Framework (CSF) or the AWS CloudAdoption Framework (CAF) SecurityPerspective. You can explore additional automatic remediation solutions on the AWS Solution Library. You can find the code used in this example on GitHub.
If you have feedback about this blog post, submit them in the Comments section below. If you have questions about using this solution, start a thread in the EventBridge, GuardDuty or Security Hub forums, or contact AWS Support.
When you enable IAM Identity center, it provides an access portal for workforce users to access their AWS applications and accounts either by signing in to the access portal using a URL or by using a bookmark for the application URL. In either case, the access portal handles user authentication before granting access to applications and accounts. Supporting both IPv4 and IPv6 connectivity to the access portal helps facilitate seamless access for clients, such as browsers and applications, regardless of their network configuration.
The launch of IPv6 support in IAM Identity Center introduces new dual-stack endpoints that support both IPv4 and IPv6, so that users can connect using IPv4, IPv6, or dual-stack clients. Current IPv4 endpoints continue to function with no action required. The dual stack capability offered by Identity Center extends to managed applications. When users access the application dual-stack endpoint, the application automatically routes to the Identity Center dual-stack endpoint for authentication. To use Identity Center from IPv6 clients, you must direct your workforce to use the new dual-stack endpoints, and update configurations on your external identity provider (IdP), if you use one.
In this post, we show you how to update your configuration to allow IPv6 clients to connect directly to IAM Identity Center endpoints without requiring network address translation services. We also show you how to monitor which endpoint users are connecting to. Before diving into the implementation details, let’s review the key phases of the transition process.
Transition overview
To use IAM Identity Center from an IPv6 network and client, you need to use the new dual-stack endpoints. Figure 1 shows what the transition from IPv4 to IPv6 over dual-stack endpoints looks like when using Identity Center. The figure shows:
A before state where clients use the IPv4 endpoints.
The transition phase, when your clients use a combination of IPv4 and dual-stack endpoints.
After the transition is complete, your clients will connect to dual-stack endpoints using their IPv4 or IPv6, depending on their preferences.
Figure 1: Transition from IPv4-only to dual-stack endpoints
Prerequisites
You must have the following prerequisites in place to enable IPv6 access for your workforce users and administrators:
Work with your network administrators to update the configuration of your firewalls and gateways and to verify that your clients, such as laptops or desktops, are ready to accept IPv6 connectivity. If you have already enabled IPv6 connectivity for other AWS services, you might be familiar with these changes. Next, implement the two steps that follow.
Step 1: Update your IdP configuration
You can skip this step If you don’t use an external IdP as your identity source.
In this step, you update the Assertion Consumer Service (ACS) URL from your IAM Identity Center instance into your IdP’s configuration for single sign-on and the SCIM configuration for user provisioning. Your IdP’s capability determines how you update the ACS URLs. If your IdP supports multiple ACS URLs, configure both IPv4 and dual-stack URLs to enable a flexible transition. With that configuration, some users can continue using IPv4-only endpoints while others use dual-stack endpoints for IPv6. If your IdP supports only one ACS URL, to use IPv6 you must update the new dual-stack ACS URL in your IdP and transition all users to using dual-stack endpoints. If you don’t use an external IdP, you can skip this step and go to the next step.
Update both the SAML single sign-on and the SCIM provisioning configurations:
Update the single sign-on settings in your IdP to use the new dual-stack URLs. First, locate the URLs in the AWS Management Console for IAM Identity Center.
Choose Settings in the navigation pane and then select Identity source.
Choose Actions and select Manage authentication.
in Under Manage SAML 2.0 authentication, you will find the following URLs under Service provider metadata:
AWS access portal sign-in URL
IAM Identity Center Assertion Consumer Service (ACS) URL
IAM Identity Center issuer URL
If your IdP supports multiple ACS URLs, then add the dual-stack URL to your IdP configuration alongside existing IPv4 one. With this setting, you and your users can decide when to start using the dual-stack endpoints, without all users in your organization having to switch together.
Figure 2: Dual-stack single sign-on URLs
If your IdP does not support multiple ACS URLs, replace the existing IPv4 URL with the new dual-stack URL, and switch your workforce to use only the dual-stack endpoints.
Update the provisioning endpoint in your IdP. Choose Settings in the navigation pane and under Identity source, choose Actions and select Manage provisioning. Under Automatic provisioning, copy the new SCIM endpoint that ends in api.aws. Update this new URL in your external IdP.
Figure 3: Dual-stack SCIM endpoint URL
Step 2: Locate and share the new dual-stack endpoints
Your organization needs two kinds of URLs for IPv6 connectivity. The first is the new dual-stack access portal URL that your workforce users use to access their assigned AWS applications and accounts. The dual-stack access portal URL is available in the IAM Identity Center console, listed as the Dual-stack in the Settings summary (you might need to expand the Access portal URLs section, shown in Figure 4).
This dual-stack URL ends with app.aws as its top-level domain (TLD). Share this URL with your workforce and ask them to use this dual-stack URL to connect over IPv6. As an example, if your workforce uses the access portal to access AWS accounts, they will need to sign in through the new dual-stack access portal URL when using IPv6 connectivity. Alternately, if your workforce accesses the application URL, you need to enable the dual-stack application URL following application-specific instructions. For more information, see AWS services that support IPv6.
The URLs that administrators use to manage IAM Identity Center are the second kind of URL your organization needs. The new dual-stack service endpoints end in api.aws as their TLD and are listed in the Identity Center service endpoints. Administrators can use these service endpoints to manage users and groups in Identity Center, update their access to applications and resources, and perform other management operations. As an example, if your administrator uses identitystore.{region}.amazonaws.com to manage users and groups in Identity Center, they should now use the dual-stack version of the same service endpoint which is identitystore.{region}.api.aws, so they can connect to service endpoints using IPv6 clients and networks.
If your users or administrators use an AWS SDK to access AWS applications and accounts or manage services, follow Dual-stack and FIPS endpoints to enable connectivity to the dual-stack endpoints.
After completing these two steps, your workforce and administrators can connect to IAM Identity Center using IPv6. Remember, these endpoints also support IPv4, so clients not yet IPv6-capable can continue to connect using IPv4.
Monitoring dual-stack endpoint usage
You can optionally monitor AWS CloudTrail logs to track usage of dual-stack endpoints. The key difference between IPv4-only and dual-stack endpoint usage is the TLD and appears in the clientProvidedHostHeader field. The following example shows the difference between these CloudTrail events for the CreateTokenWithIAM API call.
IAM Identity Center now allows clients to connect over IPv6 natively with no network address translation infrastructure. This post showed you how to transition your organization to use IPv6 with Identity Center and its integrated applications. Remember that existing IPv4 endpoints will continue to function, so you can transition at your own pace. Also, no immediate action is required by you. However, we recommend planning your transition to take advantage of IPv6 benefits and meet compliance requirements. If you have questions, comments, or concerns, contact AWS Support, or start a new thread in the IAM Identity Center re:Post channel.
If you have feedback about this post, submit comments in the Comments section below. If you have questions about this post, contact AWS Support.
With CloudHSM, you can manage and access your keys on FIPS 140-3 Level 3 validated hardware, protected with customer-owned, single-tenant hardware security module (HSM) instances that run in your own virtual private cloud (VPC). This PCI PIN attestation gives you the flexibility to deploy your regulated workloads with reduced compliance overhead. CloudHSM might be suitable when operations supported by the service are integrated into a broader solution that requires PCI-PIN compliance. For payment operations, such as PIN translation, we encourage you to consider AWS Payment Cryptography as a fully managed alternative for PCI-PIN compliance.
The PCI PIN compliance report package for AWS CloudHSM includes two key components:
PCI PIN Attestation of Compliance (AOC) – demonstrating that AWS CloudHSM was successfully validated against the PCI PIN standard with zero findings
PCI PIN Responsibility Summary – provides guidance to help AWS customers understand their responsibilities in developing and operating a highly secure environment for handling PIN-based transactions
AWS was evaluated by Coalfire, a third-party Qualified Security Assessor (QSA). Customers can access the PCI PIN Attestation of Compliance (AOC) and PCI PIN Responsibility Summary reports through AWS Artifact.
To learn more about our PCI program and other compliance and security programs, see the AWS Compliance Programs page. As always, we value your feedback and questions; reach out to the AWS Compliance team through the Contact Us page.
If you have feedback about this post, submit comments in the Comments section below. If you have questions about this post, contact AWS Support.
With AWS Payment Cryptography, your payment processing applications can use payment hardware security modules (HSMs) that are PCI PIN Transaction Security (PTS) HSM certified and fully managed by AWS, with PCI PIN-compliant key management. This attestation gives you the flexibility to deploy your regulated workloads with reduced compliance overhead.
The PCI PIN compliance report package for AWS Payment Cryptography includes two key components:
PCI PIN Attestation of Compliance (AOC) – demonstrating that AWS Payment Cryptography was successfully validated against the PCI PIN standard with zero findings
PCI PIN Responsibility Summary – provides guidance to help AWS customers understand their responsibilities in developing and operating a highly secure environment for handling PIN-based transactions
AWS was evaluated by Coalfire, a third-party Qualified Security Assessor (QSA). Customers can access the PCI PIN Attestation of Compliance (AOC) and PCI PIN Responsibility Summary reports through AWS Artifact.
To learn more about our PCI programs and other compliance and security programs, visit the AWS Compliance Programs page. As always, we value your feedback and questions; reach out to the AWS Compliance team through the Compliance Support page.
If you have feedback about this post, submit comments in the Comments section below. If you have questions about this post, contact AWS Support.
Amazon Web Services (AWS) is pleased to announce a successful completion of the 2025 Cloud Computing Compliance Criteria Catalogue (C5) attestation cycle with 183 services in scope. This alignment with C5 requirements demonstrates our ongoing commitment to adhere to the heightened expectations for cloud service providers. AWS customers in Germany and across Europe can run their applications in the AWS Regions that are in scope of the C5 report with the assurance that AWS aligns with C5 criteria.
The C5 attestation scheme is backed by the German government and was introduced by the Federal Office for Information Security (BSI) in 2016. AWS has adhered to the C5 requirements since their inception. C5 helps organizations demonstrate operational security against common cybersecurity threats when using cloud services.
Independent third-party auditors evaluated AWS for the period of October 1, 2024, through September 30, 2025. The C5 report illustrates the compliance status of AWS for both the basic and additional criteria of C5. Customers can download the C5 report through AWS Artifact, a self-service portal for on-demand access to AWS compliance reports. Sign in to AWS Artifact in the AWS Management Console or learn more at Getting Started with AWS Artifact.
AWS has added the following five services to the current C5 scope:
The following AWS Regions are in scope of the 2025 C5 attestation: Europe (Frankfurt), Europe (Ireland), Europe (London), Europe (Milan), Europe (Paris), Europe (Stockholm), Europe (Spain), Europe (Zurich), and Asia Pacific (Singapore). For up-to-date information, see the C5 page of our AWS Services in Scope by Compliance Program.
Security and compliance is a shared responsibility between AWS and the customer. When customers move their computer systems and data to the cloud, security responsibilities are shared between the customer and the cloud service provider. For more information, see the AWS Shared Security Responsibility Model.
To learn more about our compliance and security programs, see AWS Compliance Programs. As always, we value your feedback and questions; reach out to the AWS Compliance team through the Contact Us page.
Reach out to your AWS account team if you have questions or feedback about the C5 report. If you have feedback about this post, submit comments in the Comments section below.
Hacktivist group Anna’s Archive claims to have scraped almost all of Spotify’s catalog and is now seeding it via BitTorrent, effectively turning a streaming platform into a roughly 300 TB pirate “preservation archive.”
“A while ago, we discovered a way to scrape Spotify at scale. We saw a role for us here to build a music archive primarily aimed at preservation.”
Spotify insists that the hacktivists obtained no user data. Still, the incident highlights how large‑scale scraping, digital rights management (DRM) circumvention, and weak abuse controls can turn major content platforms into high‑value targets.
Anna’s Archive claims it obtained metadata for around 256 million tracks and audio files for roughly 86 million songs, totaling close to 300 TB. Reportedly, this represents about 99.9% of Spotify’s catalog and roughly 99.6% of all streams.
Spotify says it has “identified and disabled the nefarious user accounts that engaged in unlawful scraping” and implemented new safeguards.
From a security perspective, this incident is a textbook example of how scraping can escalate beyond “just metadata” into industrial‑scale content theft. By combining public APIs, token abuse, rate‑limit evasion, and DRM bypass techniques, attackers can extract protected content at scale. If you can create or compromise enough accounts and make them appear legitimate, you can chip away at content protections over time.
The “Spotify scrape” will likely be framed as a copyright story. But from a security angle, it serves as a reminder: if a platform exposes content or metadata at scale, someone will eventually automate access to it, weaponize it, and redistribute it.
And hiding behind violations of terms and conditions—which have never stopped criminals—is not effective security control.
How does this affect you?
There is currently no indication that passwords, payment details, or private playlists were exposed. This incident is purely about content and metadata, not user databases. That said, scammers may still claim otherwise. Be cautious of messages alleging your account data was compromised and asking for your login details.
Some general Spotify security tips, to be on the safe side:
If you have reused your Spotify password elsewhere or shared your credentials, consider changing your password for peace of mind.
Regularly review active sessions on streaming services and revoke anything you do not recognize. Spotify does not offer per-device session management, but you can sign out of all devices via Account > Settings and privacy on the Spotify website.
Avoid unofficial downloaders, converters, or “Spotify mods” that ask for your login or broad OAuth permissions. These tools often rely on the same kind of scraping infrastructure—or worse, function as credential-stealing malware.
We don’t just report on threats – we help protect your social media
Back in 2022 Fox-IT decided to open source its proprietary incident response tooling known as Dissect. Since then it has been adopted by many different companies in their regular workflow. For those of you who are not yet familiar with Dissect, it is an incident response framework built with incident response engagements of any scale in mind. It allows you to extract artifacts from a variety of data formats and export them to a format of your choosing. Ever since Dissect has been open sourced a large number of individuals and institutions have contributed to the Dissect framework, culminating in the first Dissect partner day earlier in 2024.
One of the most popular requests has been the capability to use Dissect in combination with common disk encryption methods like Microsoft’s BitLocker or its Linux equivalent LUKS. Internally at Fox-IT we were able to already use these capabilities. With the release of Dissect version 3.17 these capabilities are now also available to the community at large.
Of course, a blog post is not complete without a demo. In this scenario a data acquisition has been performed against a disk protected with BitLocker. We are interested in a specific file located on the user’s desktop. During this scenario, a virtual machine was created with VMware Fusion which uses the .vmwarevm file format. Dissect can parse this format thanks to its associated loader.
First, we use Dissect to examine the disk properties:
$ target-info "Windows 11 x64.vmwarevm" -v
2024-11-27T11:57:18.474060Z [error    ] Failed to open an encrypted volume <Volume name='Basic data partition' size=67921509888 fs=None> with volume manager bitlocker: Failed to unlock BDE volume [dissect.target.volume]
2024-11-27T11:57:18.634092Z [warning  ] <Target Windows 11 x64.vmwarevm>: Can't identify filesystem: <Volume name='Microsoft reserved partition' size=16776704 fs=None> [dissect.target.target]
2024-11-27T11:57:19.416120Z [warning  ] <Target Windows 11 x64.vmwarevm>: Failed to find OS plugin, falling back to default [dissect.target.target]
<Target Windows 11 x64.vmwarevm>


Disks
- <Disk type="VmdkContainer" size="68719476736">


Volumes
- <Volume name="Basic data partition" size="104857088" fs="FatFilesystem">
- <Volume name="Microsoft reserved partition" size="16776704" fs="NoneType">
- <Volume name="Basic data partition" size="67921509888" fs="NoneType">
- <Volume name="part_fd7c00000" size="673185280" fs="NtfsFilesystem">


Hostname       : None
Domain         : None
Ips            :
Os family      : default
Os version     : None
Architecture   : None
Language       :
Timezone       : None
Install date   : 1970-01-01T00:00:00.000000+00:00
Last activity  : None
It seems the disk is encrypted, now we can use the latest version of BitLocker to decrypt the information. Dissect supports three different types of decryption capabilities. An analyst can either use the user’s passphrase, the recovery key or can use a BitLocker file. Please check the updated documentation on the Dissect Docs page for more information. For now we have created a keychain CSV file with the following information:
Now we can browse through the decrypted filesystem and view the file on the user’s desktop:
$ target-shell "Windows 11 x64.vmwarevm" -Kv 395791-328042-677721-279895-554466-214599-232023-709148 -q

SECRETDATAVM:/$ cat c:/Users/Staff/Desktop/SuperSecretFile.txt
Lorem ipsum dolor sit amet, consectetur adipiscing elit, sed do eiusmod tempor incididunt ut labore et dolore magna aliqua. Ut enim ad minim veniam, quis nostrud exercitation ullamco laboris nisi ut aliquip ex ea commodo consequat. Duis aute irure dolor in reprehenderit in voluptate velit esse cillum dolore eu fugiat nulla pariatur. Excepteur sint occaecat cupidatat non proident, sunt in culpa qui officia deserunt mollit anim id est laborum.
As you can imagine this also works with Linux in the exact same manner. This time we use a LUKS passphrase in conjunction with Dissect:
$ target-info "Ubuntu 64-bit 24.04.1.vmwarevm" -Kv glad-design-paper-airplane
2024-11-27T11:48:07.224355Z [warning  ] Failed to decode raw key as hex, ignoring: glad-design-paper-airplane [dissect.target.helpers.keychain]
2024-11-27T11:48:08.910029Z [warning  ] <Target Ubuntu 64-bit 24.04.1.vmwarevm>: Can't identify filesystem: <Volume name='part_00100000' size=1048064 fs=None> [dissect.target.target]
2024-11-27T11:48:09.826056Z [warning  ] <Target Ubuntu 64-bit 24.04.1.vmwarevm>: Unsupported mount device: /dev/disk/by-id/dm-uuid-LVM-YZiSLhoYFljS62k2vIjl3IcTwSkd0QguADKOf0a8t9am1jNdm9J1zerrDU7SWWFd / [dissect.target.target]
<Target Ubuntu 64-bit 24.04.1.vmwarevm>
2024-11-27T11:48:13.916382Z [warning  ] No timestamp found in one of the lines in /var/log/syslog! [dissect.target.helpers.utils]
2024-11-27T11:48:13.925913Z [warning  ] Timestamp '27 2024 12:40:57' does not match format '%b %d %H:%M:%S', skipping line. [dissect.target.helpers.utils]
2024-11-27T11:48:13.936096Z [warning  ] Timestamp 'Nov 2024 11:40:35' does not match format '%b %d %H:%M:%S', skipping line. [dissect.target.helpers.utils]
2024-11-27T11:48:13.936416Z [warning  ] Timestamp 'Nov 2024 11:40:35' does not match format '%b %d %H:%M:%S', skipping line. [dissect.target.helpers.utils]
2024-11-27T11:48:13.944841Z [warning  ] Timestamp 'Nov 2024 11:40:15' does not match format '%b %d %H:%M:%S', skipping line. [dissect.target.helpers.utils]
2024-11-27T11:48:13.950083Z [warning  ] Timestamp 'Nov 2024 11:40:11' does not match format '%b %d %H:%M:%S', skipping line. [dissect.target.helpers.utils]
2024-11-27T11:48:13.985809Z [warning  ] Timestamp 'Nov 2024 11:40:04' does not match format '%b %d %H:%M:%S', skipping line. [dissect.target.helpers.utils]
2024-11-27T11:48:14.037897Z [warning  ] <Target Ubuntu 64-bit 24.04.1.vmwarevm>: Could not match cloud-init log line in file: /var/log/cloud-init.log [dissect.target.target]
2024-11-27T11:48:14.037992Z [warning  ] <Target Ubuntu 64-bit 24.04.1.vmwarevm>: Could not match cloud-init log line in file: /var/log/cloud-init.log [dissect.target.target]
2024-11-27T11:48:14.038056Z [warning  ] <Target Ubuntu 64-bit 24.04.1.vmwarevm>: Could not match cloud-init log line in file: /var/log/cloud-init.log [dissect.target.target]

Disks
- <Disk type="VmdkContainer" size="21474836480">

Volumes
- <Volume name="part_00100000" size="1048064" fs="NoneType">
- <Volume name="part_00200000" size="1902116352" fs="ExtFilesystem">
- <Volume name="part_71800000" size="19569573376" fs="NoneType">
- <Volume name="part_71800000" size="19552796160" fs="NoneType">
- <Volume name="ubuntu--vg-ubuntu--lv" size="19549650944" fs="ExtFilesystem">

Hostname       : personnel-VMware-Virtual-Platform
Domain         : None
Ips            :
Os family      : linux
Os version     : Ubuntu 24.04.1 LTS (Noble Numbat)
Architecture   : x86_64-linux
Language       : en_US, en_US
Timezone       : Europe/Amsterdam
Install date   : 2024-11-27T11:33:29.665213+00:00
Last activity  : 2024-11-27T11:45:34.821181+00:00
We can use the same technique to extract another file from the Ubuntu desktop:
$ target-shell "Ubuntu 64-bit 24.04.1.vmwarevm" -K keychain.csv -v
2024-11-27T11:59:52.227142Z [info     ] Registered key Key(key_type=<KeyType.PASSPHRASE: 'passphrase'>, value='glad-design-paper-airplane', provider='luks', identifier=None, is_wildcard=False) [dissect.target.helpers.keychain]
2024-11-27T11:59:52.227562Z [info     ] Registered key Key(key_type=<KeyType.RECOVERY_KEY: 'recovery_key'>, value='395791-328042-677721-279895-554466-214599-232023-709148', provider='bitlocker', identifier=None, is_wildcard=False) [dissect.target.helpers.keychain]
2024-11-27T11:59:53.719915Z [info     ] Volume <Volume name='part_71800000' size=19569573376 fs=None> unlocked with Key(key_type=<KeyType.PASSPHRASE: 'passphrase'>, value='glad-design-paper-airplane', provider='luks', identifier=None, is_wildcard=False) (keyslot: 0) [dissect.target.volumes.luks]
2024-11-27T11:59:53.922164Z [warning  ] <Target Ubuntu 64-bit 24.04.1.vmwarevm>: Can't identify filesystem: <Volume name='part_00100000' size=1048064 fs=None> [dissect.target.target]
2024-11-27T11:59:54.733524Z [info     ] <Target Ubuntu 64-bit 24.04.1.vmwarevm>: Found compatible OS plugin: DebianPlugin [dissect.target.target]
2024-11-27T11:59:54.770648Z [info     ] <Target Ubuntu 64-bit 24.04.1.vmwarevm>: Found compatible OS plugin: LinuxPlugin [dissect.target.target]
2024-11-27T11:59:54.791479Z [info     ] <Target Ubuntu 64-bit 24.04.1.vmwarevm>: Found compatible OS plugin: UnixPlugin [dissect.target.target]
2024-11-27T11:59:54.802888Z [warning  ] <Target Ubuntu 64-bit 24.04.1.vmwarevm>: Unsupported mount device: /dev/disk/by-id/dm-uuid-LVM-YZiSLhoYFljS62k2vIjl3IcTwSkd0QguADKOf0a8t9am1jNdm9J1zerrDU7SWWFd / [dissect.target.target]

personnel-VMware-Virtual-Platform:/$ cat /home/personnel/Desktop/secretLinuxfile
"Lorem ipsum dolor sit amet, consectetur adipiscing elit, sed do eiusmod tempor incididunt ut labore et dolore magna aliqua. Ut enim ad minim veniam, quis nostrud exercitation ullamco laboris nisi ut aliquip ex ea commodo consequat. Duis aute irure dolor in reprehenderit in voluptate velit esse cillum dolore eu fugiat nulla pariatur. Excepteur sint occaecat cupidatat non proident, sunt in culpa qui officia deserunt mollit anim id est laborum."
Last but not least, Dissect also contains the fve-dd utility. fve-dd can be used to decrypt an entire disk which allows a wider range of external tools to be used. fve-dd works on any supported Dissect containers. The individual VMDK files can be extracted from the .vmwarevm container:
As defensive security products improve, attackers must refine their craft. Gone are the days of executing malicious binaries from disk, especially ones well known to antivirus and Endpoint Detection and Reponse (EDR) vendors. Now, attackers focus on in-memory payload execution for both native and managed applications to evade defensive products. Meanwhile, defensive technologies are becoming increasingly sophisticated, which is forcing attackers to further adapt. In times of such an arms race, how does an attacker stay ahead? And how can malware be future-proofed to evade the sophisticated EDR systems that currently exist and are actively being developed?
This blog post reviews the evolution of one of Fox-IT’s evasive tools, designed to aid in payload delivery during Red Teaming engagements. We will touch on the tool’s history and its future potential in the face of offensive and defensive progress.
Historical Perspective
The core of the arms race between malware and antimalware is as follows: antimalware must classify arbitrary programs, in memory or at-rest, as either benign or malicious while operating under a set of constraints. The products are constrained by the amount of performance a user or customer is prepared to surrender in terms of CPU time, memory or bandwidth while the classification takes place, and by how many false-positives the product generates. If the product is too resource intensive, a customer will complain it is slow. If it quarantines important documents, it potentially does more harm than good. These constraints shape and limit each step in the evolution of antimalware products. Not only AV vendors need to worry about performance when writing tools. Malware authors need to take execution speed, or other system changes, into account when deploying malware. Take for example the recently uncovered XZ1 backdoor that was spotted by a software engineer due to an increase in login time from 0.2 to 0.8 seconds. Had the authors of this piece of code not observably changed the behavior of the system, the backdoor would have likely been deployed successfully.
Since the early days of viruses circulating on floppy disks, writing undetected malware has been a cat-and-mouse game between attackers and defenders. Originally, antivirus software focused strictly on true-positive detection of viruses on the basis of signatures and patterns in a program’s instructions. Absent a mistake in the signature database, a unique signature match guarantees a true-positive match of a malicious sample after which the malicious file can be removed or quarantined. This method of detection strongly adheres to the constraints placed on antimalware products, because simple pattern matches are performant and true-positive detection is almost guaranteed.
For malware authors, the solution was simple: to evade detection, the virus must be made impossible to detect through a unique pattern. This may be achieved by changing the code, or by encrypting the code and decrypting it at runtime. If you automate this, you get what is called a packer: a tool that encrypts, compresses or otherwise changes a virus to evade detection. A packer changes the majority of the code in the virus and adds a stub to the code. This stub is often the first piece of code that is executed when the program is launched. Its job is to undo all changes previously made to the original code (e.g. compression or encryption). After all changes are reverted, execution will be passed to the original code. This stub can also make use of anti-reversing/anti-tampering code that attempts to protect the original code from prying eyes.
This reduces the amount of “attack surface” for signature creation for samples that are on the disk or otherwise stored at rest. This method is also used to compress binaries for distribution, allowing for smaller release packages. Therefore, not all compressed binaries can be marked as malicious.
However, even very small unpacker stubs may match a signature that can be uniquely tied to the packer itself. Combining this signature with some rules related to the amount of entropy in a file, a packer can still be detected with a high degree of accuracy. At this point, the antimalware solution has evolved to utilize metadata about a file, such as entropy, obtaining the ability to detect packed files but at the cost of a higher false-positive rate.
The next step in the arms race for malware authors is to eliminate the potential for a signature match in the unpacker stub. This means that the stub must consist of different instructions each time a new sample is created. An important insight is that “what the code does” and “how the code looks” are not 1:1 mappings. There are infinitely many ways to write down computer code to achieve a certain effect or result. There are therefore infinitely many ways in which a particular unpacking algorithm can be written. A packer that is designed to create the unpacking stub that looks different each time can be called polymorphic. The algorithm or code that performs the changes is called a polymorphic engine2.
Combining a packer with a polymorphic engine eliminates the “attack surface” for simple signature matches of malware at-rest. Fox-IT has written and maintained two polymorphic packers like this since 2015. Although they still produce good results against modern EDR, even these tools are getting more and more difficult to sneak past defenses. That’s because there’s a conceptual flaw in the polymorphic packer: the original malicious code is still decrypted at some point in order to execute. If antimalware products can time the moment to start scanning for malicious patterns when the packer has finished decoding the malicious code, then detecting malware becomes easy again.
Modern operating systems and processors try to ensure that not all data in a computer’s memory can be executed as code for safety reasons3. Particularly, systems are typically designed to prevent the execution of code from writable pages. Therefore, a virus or malware sample that wants to decrypt and/or decompress its own code must first make the changes in writable memory pages. After, the virus changes the page protection to readable and executable and transfers control to the newly modified executable memory. Antimalware products equipped to analyze the behavior of other programs at runtime make use of behavioral patterns like this to decide when to scan the memory of a process for malicious patterns. Because the memory, once decrypted, cannot be changed anymore due to the aforementioned limitations, scanning a process after making memory executable is the ideal time to spot malicious patterns.
Antimalware products that are equipped with rules that generate additional signals to determine if a program is malicious or not, are said to employ “heuristics”. Conceptually, antimalware products have achieved a comprehensive set of features to detect malware execution. The evolutions we’ve seen since the early days of these feature complete products can all be understood as attempts to loosen or lift the constraints set out above: “Cloud-based protection” runs resource intensive heuristics on someone else’s computer; adding human oversight, the “R” in “EDR” lowers the impact of a false-positive and brings humans into the detection and response loop.
How then, can a Red Team smuggle their malware past these new and advanced defenses? In the past, a virus writer might employ what is called a “metamorphic” engine4. This is an algorithm designed to re-write the entire virus each time it infects a new file, including the entire metamorphic engine itself. Using it ensures that there is never one ‘true’ virus sample that can be detected with a static signature; each copy of the virus is completely different. With a tool like this you would not need a packer, because there are no static patterns that can ever be uniquely tied to your virus. However, the explosion in modern software complexity and the requirement for malware to work on a variety of systems
Hiding From Analysis: Virtualisation
To hide from both static and dynamic analysis of payloads, the generated sample must be resilient to code inspection and code flow analysis. If the real instructions are not revealed to an observer, hardly any conclusions can be drawn from the outer shell. If this is achieved, defensive products would be met with the following limitations when inspecting the payload:
Difficult to observe instruction patterns;
Difficult to patch instructions;
Difficult to ignore instructions;
Difficult to predict behavior.
Hiding instructions is not something new. Products like VMProtect5 cloak parts of the code by embedding a virtual machine and generate unique instructions to be executed on this VM. Code that is to be virtualized must be identified either by a marker added to the source code or by the presence of a PDB file containing the symbols. This requirement is something that cannot always be met when using third-party tools. Additionally, this type of protection is aimed at protecting specific functions, like license key checking algorithms, limiting the use for an adversary. Lastly, using existing tools can have a negative impact on the detection ratio, as these products are heavily researched and can contain static signatures like hardcoded section names.
Considering the benefits of a virtualisation layer, however, it is clear that this technique is very powerful.
Creating a Custom Virtualisation Layer
It was decided that a virtualisation layer should be created. This layer consists of a virtual machine implementing opcodes6, and bytecode7 executing on the virtual machine. The virtualisation layer that was to be created must match the following requirements and limitations:
Bytecode instructions are executed sequentially;
Bytecode instructions are hidden before and after execution;
The instruction set supports basic x86-64 instructions only;
The virtual machine must provide an interface to the system API;
The virtual machine implementation must be simple and position independent to support morphing;
The virtualisation layer must work without access to source code or debug symbols.
Creating a virtualisation layer started with a design of the instructions to be executed, the virtual machine, and the supported instruction set. Additionally, the layout of the final payload was created where all data must be present in a position independent format and could be executed like shellcode. This allows the payload to be embedded in other executable formats (e.g. executables or DLLs), and allows for dynamic execution when staging malware.
For example, the following layout would allow for the above functionality. In this example, the virtual machine must start with a correcting stub that correctly sets the virtual machine argument registers to their respective values:
Example of a data structure containing all required building blocks within position independent code.
The Anatomy of an Instruction
To keep the virtual machine architecture simple, an instruction format was created to be consistent in length between instruction and operand types. This design decision allows the omission of a Length Disassembler Engine (LDE)8, and can simply use the instruction pointer as an index to the current instruction. All information present in normal, non-SSE9/AVX10 x86 instructions must be included.
At its core, an instruction identifies the operation that must be performed, and optionally what data is provided in the form of operands. An operand can be one of three types:
Immediate value: a constant value embedded in the instruction;
Memory location: a memory location pointed to by the instruction;
Register: a register, or part of one, identified by the instruction.
In order to obtain data from an operand, a generic format must be created that encompasses the different operand types. It was decided that a single 64-bit field could be used to hold the different types of operands, as all of the necessary data of the aforementioned types can be embedded into 64 bits.
The structures below show the layout of each operand type:
This file contains hidden or bidirectional Unicode text that may be interpreted or compiled differently than what appears below. To review, open the file in an editor that reveals hidden Unicode characters.
Learn more about bidirectional Unicode characters
Note: The Value type of the immediate operand is a simple union with (u)int8_t to (u)int64_t members. This makes it trivial to index the correct data during implementation of opcodes.
To indicate the instruction’s opcode, a single 1-byte value can be used. This provides 256 unique opcodes, which should be enough to implement basic behavior. Lastly, the type of each operand must be embedded within the instruction format, as opcode implementations must be able to interrogate these types.
This file contains hidden or bidirectional Unicode text that may be interpreted or compiled differently than what appears below. To review, open the file in an editor that reveals hidden Unicode characters.
Learn more about bidirectional Unicode characters
To meet requirement two, “Instructions are hidden before and after execution”, instructions are protected using encryption. Many encryption algorithms can be used to hide instructions. However, it is required for the instruction size to remain the same, as the instruction will be decrypted and encrypted in-place and will not be moved to a temporary buffer. This removes the necessity for dynamic memory allocation from within the virtual machine. Additionally, the chosen encryption scheme must be trivial to implement, as the code will be located in the virtual machine and thus create an ‘attack surface’ for signature detection. Implementing complex algorithms is detrimental to the ability to effectively manipulate the code using a polymorphic engine.
The Anatomy of the Virtual Machine
The virtual machine resembles a virtual CPU, implementing all the available opcodes. Furthermore, the available registers, CPU flags, and stack are part of the virtual machine object. Lastly, the virtual machine holds a pointer to the bytecode buffer necessary for execution. An added benefit of implementing the virtual machine is that the real stack is also abstracted away. Heuristics that attempt to spot malicious behavior from the stack will not succeed.
This file contains hidden or bidirectional Unicode text that may be interpreted or compiled differently than what appears below. To review, open the file in an editor that reveals hidden Unicode characters.
Learn more about bidirectional Unicode characters
Functions to initialize the virtual machine context, to obtain the current instruction, and to load and store values based on the instruction operands were created to aid in the implementation of opcodes within the virtual machine.
Once initialized, the virtual machine can enter its dispatch loop. This loop consists of obtaining the current instruction and executing the opcode identified by the opcode field in the instruction object. The instruction is decrypted before execution and is encrypted after. A dispatch function could be implemented as follows:
This file contains hidden or bidirectional Unicode text that may be interpreted or compiled differently than what appears below. To review, open the file in an editor that reveals hidden Unicode characters.
Learn more about bidirectional Unicode characters
An attentive reader may have noticed the construction of the temporary variable ip, which is used in further operations. This originates from the fact that any instructions modifying the instruction pointer, like jcc, call, and ret, will result in a modified instruction pointer when the opcode is finished. Therefore, the instruction pointer can no longer be used to re-encrypt the original instruction that was executed.
Implementation of a Basic Opcode
The following function implements the bit test (bt) opcode11:
This file contains hidden or bidirectional Unicode text that may be interpreted or compiled differently than what appears below. To review, open the file in an editor that reveals hidden Unicode characters.
Learn more about bidirectional Unicode characters
Initially, all bytecode created to execute in the virtual environment was written in assembly by hand. This provided the control needed to make sure specific opcodes and operand types were used, and as a test a PE loader was implemented in bytecode. As this limitation came at a major cost in development time and flexibility, a new method of generating bytecode was used: compiling and transpiling of C/C++ programs. This was chosen over using output directly from the assembler, as parsing these text files proved to be cumbersome and error-prone. Instead, the resulting linked binary was fed to a disassembler.
The disassembling of a binary is performed using the iced-x86 library12. This library allows for the conversion of x86 instructions to the custom format -described in the earlier section: The Anatomy of an Instruction– by checking the opcode of the instruction, the types of operand(s) and its value(s). Eventually, once all the x86 instructions are converted, the now transpiled bytecode can be interpreted by the virtual machine.
The bytecode generation process from source code to eventual bytecode.
The implementation of the transpiler instantly enabled us to support a large amount of existing tools, and made writing new tools easier. Most Position-independent Code (PIC)13 tools that compile from C/C++, including some BOFs14, can also be ported to execute on the virtual machine with relative ease.
Limitations to Bytecode Implementation
One of the limitations of the virtual machine implementation is shared with that of the bytecode. PIC must be created in order to generate valid bytecode that executes on the VM. In practice, this means that everything is relative to the current instruction pointer, and no references to other libraries or parts of other sections can exist:
No static variables;
No global variables;
No strings;
No static dependencies on libraries.
Supporting Native API Calls
To allow interfacing with the OS layer, bytecode must be able to perform native API calls. A translation layer must exist between the bytecode and native environment. The call instruction is used by compilers to invoke APIs, requiring the virtual machine’s call implementation to support this translation. Unfortunately, once a call instruction is encountered, no information is known to the virtual machine related to the number of arguments that must be forwarded. To resolve this problem, the bytecode can prepend the number of arguments when calling an API, giving the virtual machine layer enough information to translate the call into native execution. To programmatically perform this task, variadic arguments in C++ templates can be used to automatically deduce the amount of arguments passed:
This file contains hidden or bidirectional Unicode text that may be interpreted or compiled differently than what appears below. To review, open the file in an editor that reveals hidden Unicode characters.
Learn more about bidirectional Unicode characters
As specified in Microsoft’s x64 __stdcall15 calling convention, the first four integer or pointer arguments are passed using the registers rcx, rdx, r8 and r9, with the remaining arguments being passed on the stack. This means that at the time of executing the call instruction, rcx holds the number of arguments that must be passed to the API. The virtual machine can extract and inspect this value, and use it to correctly perform the call:
This file contains hidden or bidirectional Unicode text that may be interpreted or compiled differently than what appears below. To review, open the file in an editor that reveals hidden Unicode characters.
Learn more about bidirectional Unicode characters
The real values of the arguments are stored in rdx, r8, r9 and on the stack. When extracting the arguments from the stack, one must remember to keep the shadow space16 in mind.
Visually, the process looks like this:
A virtualized call instruction invokes ntdll!NtAllocateVirtualMemory. This call is translated to a native call and the API is invoked. The resulting value is returned to the VM.
Supporting Bytecode Function Callbacks
Keeping in mind the porting of existing programs to the bytecode architecture, one cannot omit the support for function callbacks within code. Take for example a simple linked list implementation, with a list_search function taking a predicate callback:
This file contains hidden or bidirectional Unicode text that may be interpreted or compiled differently than what appears below. To review, open the file in an editor that reveals hidden Unicode characters.
Learn more about bidirectional Unicode characters
However, a problem arises: how does the virtual machine differentiate between a normal bytecode function call, a native API call, and a function callback? The difference between the first two is clear: the bytecode function call is a call to an address within the bytecode and is known at compile time, where the API call is a dynamic call, meaning a call to a function pointer stored in a register or memory location. Given that a callback within bytecode is a dynamic call, too, the virtual machine must be provided with information about the type of call being made.
To load a function pointer as an argument, a lea17 instruction is generated with its right operand referencing a memory address. This referenced memory address uses the instruction pointer (rip) register as the base field of the memory operand. When transpiling, such cases can be identified. To store this information, a new type of operand can be added to the already existing three types -listed in “The Anatomy of an Instruction”– (e.g. Function). When the virtual machine executes the lea instruction, it can check for the type of operand. If this operand’s type is Function, a tag can be added to the high 32 bits of the value, for example 0xDEADBEEF.
This file contains hidden or bidirectional Unicode text that may be interpreted or compiled differently than what appears below. To review, open the file in an editor that reveals hidden Unicode characters.
Learn more about bidirectional Unicode characters
Once the call instruction is invoked, the value of the operand can be interrogated. If this value contains the previously added tag, a callback is requested. To perform the call, the tag is stripped from the value and the instruction pointer can be set accordingly.
Supporting User-Defined Arguments
Depending on the type of program that is executing, user-defined arguments are required. Take for example a program that simply sleeps for a period of time. How long should this program sleep for? Hardcoding these values is not always an option. Early on in the development of the project, a simple data structure was defined which could be provided to the bytecode’s entry point:
This file contains hidden or bidirectional Unicode text that may be interpreted or compiled differently than what appears below. To review, open the file in an editor that reveals hidden Unicode characters.
Learn more about bidirectional Unicode characters
Accompanying this, each bytecode project contained a script that packaged data in a way that could be understood by the bytecode. However, there was no consistency between these scripts and the method of extraction. For example, extracting two 4-byte integers is simpler than extracting two strings due to their variable size.
To standardize this process, and to include it into the building step itself instead of running a random script, a key-value solution was created in combination with an API that can interrogate the type and value of each argument. This is different from parameter packing that Cobalt Strike uses in its BOFs18, as default arguments, or arguments that are not strictly required are supported. Additionally, each argument is encrypted separately. This allows for a PE packer to extract domain-keying information before extracting the PE data.
The following API is defined:
This file contains hidden or bidirectional Unicode text that may be interpreted or compiled differently than what appears below. To review, open the file in an editor that reveals hidden Unicode characters.
Learn more about bidirectional Unicode characters
The signature of the bytecode’s entry point is updated to incorporate this change:
This file contains hidden or bidirectional Unicode text that may be interpreted or compiled differently than what appears below. To review, open the file in an editor that reveals hidden Unicode characters.
Learn more about bidirectional Unicode characters
Executables and DLLs are very similar in the way they look and in the way they execute. Both have an entry point to which execution is passed, and both return a value. However, the execution flow of an executable starts at the entry point, and does not reach its function’s end until the program stops. DLLs often perform very limited initialization within their entry point, and return execution to the loader to not lock the loader threads. Additionally, the entry point of the DLL is called more than once: on process startup and shutdown, and on thread creation and destruction. The reason for calling the entry point is passed by the loader in the second, dwReason, argument. This allows the code inside of the DllMain function to differentiate between the reasons the entry point was invoked, and can act accordingly.
This file contains hidden or bidirectional Unicode text that may be interpreted or compiled differently than what appears below. To review, open the file in an editor that reveals hidden Unicode characters.
Learn more about bidirectional Unicode characters
To allow our shellcode to be embedded within DLLs, both the virtual machine and its bytecode must be made aware of the reason for invocation. This requires the entry point of the virtual machine and bytecode to match that of a DLL, automatically receiving the reason by the OS loader. This does not interfere with the entry point used by a normal executable, as the default entry point of any executable does not take any arguments directly, but instead the arguments argc and argv are resolved by the C runtime, which is not linked against.
On initialization, the virtual machine sets the bytecode’s rdx register to the value of its reason argument, passing the value to the entry point as the second argument. The programmer must decide if this value is to be inspected within the bytecode and should not use the value when writing bytecode to be embedded in an executable.
Deceiving Behavioral Analysis: Multi-VM Execution
Earlier, the method of detection based on behavior was discussed. This dynamic form of inspecting an application’s execution flow regardless of static patens is difficult for attackers to rid their malware of. Opening Lsass.exe and reading its memory could be marked as malicious, even if the process looks like calc.exe. Often, defensive products receive events by kernel callbacks, such as PsSetCreateProcessNotifyRoutine19 or PsSetLoadImageNotifyRoutine20, API/syscall hooks in the local process or by using Event Tracing for Windows (ETW)21 consumers.
Patching hooks in the local process along with local ETW functions that provide events is trivial. This rids the process of intrusive monitoring by antivirus or EDR solutions, and stops the process from creating events. However, some events are still generated, mostly by the ETW providers present in the kernel, along with the kernel callbacks. Additionally, events created during patching could still be monitored. Lastly, blinding defensive products could have a negative effect, as failure to receiving check-ins could be considered an error and a signal of malicious behavior by itself.
As an attacker, generating arbitrary events along with ones that might cause detection could be a method of thwarting dynamic detection rules based on behavior. Adding code to generate events in between regular instructions would require manipulation of source code, and is not preferred. Creating a new thread that generates random events could be in vain, as events are registered per unique thread in the process.
The virtual machine was extended to support vmcalls. These types of call instructions made by the bytecode notify the virtual machine layer that a task needs to be performed. Among multiple different supported calls, most noteworthy are the following:
vminit: Initialize the virtual machine object with bytecode and arguments
vmexec: Execute N cycles on the virtual machine
The combination of these two calls allows bytecode to create a new virtual machine, and execute a predetermined number of instructions:
This file contains hidden or bidirectional Unicode text that may be interpreted or compiled differently than what appears below. To review, open the file in an editor that reveals hidden Unicode characters.
Learn more about bidirectional Unicode characters
Because both sets of bytecode execute within the same virtual machine, and therefore on the same thread, no distinction can be made between the origin of each event. The OS, and any event consumers will observe a single thread generating multiple events, both benign and possibly malicious. Most importantly for an attacker, this could break patterns of behavior being monitored for.
As an additional benefit of these added instructions, bytecode can now be obtained and executed at runtime. This proved to be an extremely useful feature during payload development, as instead of staging shellcode during Command and Control, bytecode can be provided. This removes the necessity for allocating executable memory regions (or changing memory protection at a later stage) to execute shellcode in, in turn removing the opportunity for defensive products to inspect buffers used for dynamic code execution often leveraged by attackers.
For example, the following behavior could be implemented to create a simple polling implant, requesting bytecode every 10 seconds:
This file contains hidden or bidirectional Unicode text that may be interpreted or compiled differently than what appears below. To review, open the file in an editor that reveals hidden Unicode characters.
Learn more about bidirectional Unicode characters
At this point, we have defeated most detection measures that we are aware of, and set out to defeat. However, the VM shares a fundamental weakness with the original packers: static patterns in the native-code VM. Throughout its development, the VM was kept as simple as possible, adhering to constraints set out to enable support for a polymorphic engine to be executed on the VM’s binary code. This made the development significantly more cumbersome, but, given a sufficiently strong polymorphic engine, does close the detection loop fully. The polymorphic engine we developed has been battle tested over several years of use against modern EDR, and antimalware. Despite the fact that the code of the engine was designed years ago, and has not significantly changed since, it still manages to mutate malicious code to the extent that it becomes undetected at runtime and scan time.
Due to the way the universe works, the engine cannot support arbitrary programs. The largest constraint is that dynamic control flow is not supported. This means that indirect function calls, indirect jumps and the ret instruction could all potentially break the mutated code. Our engine assumes you know what you’re doing, and won’t complain when such instructions are encountered, but the resulting code will likely not work as intended.
The polymorphic engine supports several different mutation techniques, including:
Instruction substitution: replacing instructions with semantically equivalent ones. For example: mov eax, 0 can be replaced with xor eax, eax;
Basic block reordering: changing the order of basic blocks in the code;
Basic block creation: inserting new basic blocks into the code, through jumps and push rets;
NOP instruction insertion: inserting NOP instructions to change the code’s layout.
The most important feature is that the output of the engine can be fed back into the engine again. This allows for multiple iterations of mutation, which leads to virtually incomprehensible disassembly. This is especially useful when the input is a small piece of code, like a shellcode loader. Sufficient numbers of mutation will double, or quadruple the size of the output, further muddying the waters for defenders.
Conclusion
Due to the ever-changing security landscape, both attackers and defenders must stay on their toes. Defensive security products continue to improve over time, making it more difficult for attackers to remain undetected, or even execute malicious code at all. Detection of payloads has shifted from static analysis to a combination of heuristics and signatures, rendering some tools obsolete.
In this blog post, we have described a tool that was written to tackle both static and dynamic analysis by way of virtualisation. This technique, along with employing a custom polymorphic engine attempts to evade these types of analysis by layers of obfuscation. To bypass heuristic analysis, support for multiple virtual machines to run concurrently was added, disrupting patterns in created events. As an added bonus, reverse engineering a sample without prior knowledge could be a daunting task. Analysts would have to reverse not only the morphed virtual machine itself, but extract morphed bytecode for further analysis. This does not remediate the issue of reverse engineering payloads for an attacker, but does significantly slow down the process, providing the attacker with more time.
In practice, this project has allowed attacks to remain undetected during Red Teaming and TIBER exercises in some of the most heavily monitored environments, making use of state of the art EDR solutions. Moreover, due to the addition of a transpiler converting compiled binaries into custom bytecode, both the speed and ease of development of custom payloads was greatly improved.
The following is a non-exhaustive list of payloads that were created during a recent Red Teaming exercise, successfully evading detection:
Multiple persistence modules;
Multiple lateral movement modules;
Shellcode and bytecode executor;
Antivirus and EDR patchers;
HTTP(s) and DNS beacons;
Tools querying Active Directory information.
Porting of additional tools is taking place, and we expect to have virtualized versions of most tools used in a Red Team exercise in the near future.
Looking Forward
The motivations for this blog post are two-fold. Firstly, we wanted to share what we think is exciting research with the community. We learned what we did from openly shared blog post and articles, and want to give back to the community. We use all the knowledge we gained to improve the security of our customers through offensive security testing, and we hope that this blog post will help and inspire others to do the same.
Secondly, although security products have advanced tremendously, we want to show that there is still room for improvement. We have noticed a tendency to “slap an EDR on it and call it a day” in certain niches of the security industry. Although that might work for some time, because a modern EDR truly adds a strong layer of security, the door is still open for attackers to bypass these products. As the landscape evolves, and general cyber security knowledge increases, the skill and sophistication of cyber criminal elements will rise. Consider this blog post, and the technique explained within, as a warning and a call to action. We hope security vendors will think about how they can detect these types of payloads, and how they can improve their products to stay ahead of the curve, as they are right now.
This blog is part of a series written by various Dutch cyber security firms that have collaborated on the Cactus ransomware group, which exploits Qlik Sense servers for initial access. To view all of them please check the central blog by Dutch special interest group Cyberveilig Nederland [1]
The effectiveness of the public-private partnership called Melissa [2] is increasingly evident. The Melissa partnership, which includes Fox-IT, has identified overlap in a specific ransomware tactic. Multiple partners, sharing information from incident response engagements for their clients, found that the Cactus ransomware group uses a particular method for initial access. Following that discovery, NCC Group’s Fox-IT developed a fingerprinting technique to identify which systems around the world are vulnerable to this method of initial access or, even more critically, are already compromised.
Qlik Sense vulnerabilities
Qlik Sense, a popular data visualisation and business intelligence tool, has recently become a focal point in cybersecurity discussions. This tool, designed to aid businesses in data analysis, has been identified as a key entry point for cyberattacks by the Cactus ransomware group.
The Cactus ransomware campaign
Since November 2023, the Cactus ransomware group has been actively targeting vulnerable Qlik Sense servers. These attacks are not just about exploiting software vulnerabilities; they also involve a psychological component where Cactus misleads its victims with fabricated stories about the breach. This likely is part of their strategy to obscure their actual method of entry, thus complicating mitigation and response efforts for the affected organizations.
For those looking for in-depth coverage of these exploits, the Arctic Wolf blog [3] provides detailed insights into the specific vulnerabilities being exploited, notably CVE-2023-41266, CVE-2023-41265 also known as ZeroQlik, and potentially CVE-2023-48365 also known as DoubleQlik.
Threat statistics and collaborative action
The scope of this threat is significant. In total, we identified 5205 Qlik Sense servers, 3143 servers seem to be vulnerable to the exploits used by the Cactus group. This is based on the initial scan on 17 April 2024. Closer to home in the Netherlands, we’ve identified 241 vulnerable systems, fortunately most don’t seem to have been compromised. However, 6 Dutch systems weren’t so lucky and have already fallen victim to the Cactus group. It’s crucial to understand that “already compromised” can mean that either the ransomware has been deployed and the initial access artifacts left behind were not removed, or the system remains compromised and is potentially poised for a future ransomware attack.
Since 17 April 2024, the DIVD (Dutch Institute for Vulnerability Disclosure) and the governmental bodies NCSC (Nationaal Cyber Security Centrum) and DTC (Digital Trust Center) have teamed up to globally inform (potential) victims of cyberattacks resembling those from the Cactus ransomware group. This collaborative effort has enabled them to reach out to affected organisations worldwide, sharing crucial information to help prevent further damage where possible.
Identifying vulnerable Qlik Sense servers
Expanding on Praetorian’s thorough vulnerability research on the ZeroQlik and DoubleQlik vulnerabilities [4,5], we found a method to identify the version of a Qlik Sense server by retrieving a file called product-info.json from the server. While we acknowledge the existence of Nuclei templates for the vulnerability checks, using the server version allows for a more reliable evaluation of potential vulnerability status, e.g. whether it’s patched or end of support.
This JSON file contains the release label and version numbers by which we can identify the exact version that this Qlik Sense server is running.
Figure 1: Qlik Sense product-info.json file containing version information
Keep in mind that although Qlik Sense servers are assigned version numbers, the vendor typically refers to advisories and updates by their release label, such as “February 2022 Patch 3”.
The following cURL command can be used to retrieve the product-info.json file from a Qlik server:
Note that we specify ?.ttf at the end of the URL to let the Qlik proxy server think that we are requesting a .ttf file, as font files can be accessed unauthenticated. Also, we set the Host header to localhost or else the server will return 400 - Bad Request - Qlik Sense, with the message The http request header is incorrect.
Retrieving this file with the ?.ttf extension trick has been fixed in the patch that addresses CVE-2023-48365 and you will always get a 302 Authenticate at this location response:
> GET /resources/autogenerated/product-info.json?.ttf HTTP/1.1
> Host: localhost
> Accept: */*
>
< HTTP/1.1 302 Authenticate at this location
< Cache-Control: no-cache, no-store, must-revalidate
< Location: https://localhost/internal_forms_authentication/?targetId=2aa7575d-3234-4980-956c-2c6929c57b71
< Content-Length: 0
<
Nevertheless, this is still a good way to determine the state of a Qlik instance, because if it redirects using 302 Authenticate at this location it is likely that the server is not vulnerable to CVE-2023-48365.
An example response from a vulnerable server would return the JSON file:
We utilised Censys and Google BigQuery [6] to compile a list of potential Qlik Sense servers accessible on the internet and conducted a version scan against them. Subsequently, we extracted the Qlik release label from the JSON response to assess vulnerability to CVE-2023-48365.
Our vulnerability assessment for DoubleQlik / CVE-2023-48365 operated on the following criteria:
The release label corresponds to vulnerability statuses outlined in the original ZeroQlik and DoubleQlik vendor advisories [7,8].
The release label is designated as End of Support (EOS) by the vendor [9], such as “February 2019 Patch 5”.
We consider a server non-vulnerable if:
The release label date is post-November 2023, as the advisory states that “November 2023” is not affected.
The server responded with HTTP/1.1 302 Authenticate at this location.
Any other responses were disregarded as invalid Qlik server instances.
As of 17 April 2024, and as stated in the introduction of this blog, we have detected 5205 Qlik Servers on the Internet. Among them, 3143 servers are still at risk of DoubleQlik, indicating that 60% of all Qlik Servers online remain vulnerable.
Figure 2: Qlik Sense patch status for DoubleQlik CVE-2023-48365
The majority of vulnerable Qlik servers reside in the United States (396), trailed by Italy (280), Brazil (244), the Netherlands (241), and Germany (175).
Figure 3: Top 20 countries with servers vulnerable to DoubleQlik CVE-2023-48365
Identifying compromised Qlik Sense servers
Based on insights gathered from the Arctic Wolf blog and our own incident response engagements where the Cactus ransomware was observed, it’s evident that the Cactus ransomware group continues to redirect the output of executed commands to a True Type font file named qle.ttf, likely abbreviated for “qlik exploit”.
Below are a few examples of executed commands and their output redirection by the Cactus ransomware group:
In addition to the qle.ttf file, we have also observed instances where qle.woff was used:
Figure 4: Directory listing with exploitation artefacts left by Cactus ransomware group
It’s important to note that these font files are not part of a default Qlik Sense server installation.
We discovered that files with a font file extension such as .ttf and .woff can be accessed without any authentication, regardless of whether the server is patched. This likely explains why the Cactus ransomware group opted to store command output in font files within the fonts directory, which in turn, also serves as a useful indicator of compromise.
Our scan for both font files, found a total of 122 servers with the indicator of compromise. The United States ranked highest in exploited servers with 49 online instances carrying the indicator of compromise, followed by Spain (13), Italy (11), the United Kingdom (8), Germany (7), and then Ireland and the Netherlands (6).
Figure 5: Top 20 countries with known compromised Qlik Sense servers
Out of the 122 compromised servers, 46 were not vulnerable anymore.
When the indicator of compromise artefact is present on a remote Qlik Sense server, it can imply various scenarios. Firstly, it may suggest that remote code execution was carried out on the server, followed by subsequent patching to address the vulnerability (if the server is not vulnerable anymore). Alternatively, its presence could signify a leftover artefact from a previous security incident or unauthorised access.
While the root cause for the presence of these files is hard to determine from the outside it still is a reliable indicator of compromise.
Responsible disclosure by the DIVD We shared our fingerprints and scan data with the Dutch Institute of Vulnerability Disclosure (DIVD), who then proceeded to issue responsible disclosure notifications to the administrators of the Qlik Sense servers.
Call to action
Ensure the security of your Qlik Sense installations by checking your current version. If your software is still supported, apply the latest patches immediately. For systems that are at the end of support, consider upgrading or replacing them to maintain robust security.
Additionally, to enhance your defences, it’s recommended to avoid exposing these services to the entire internet. Implement IP whitelisting if public access is necessary, or better yet, make them accessible only through secure remote working solutions.
If you discover you’ve been running a vulnerable version, it’s crucial to contact your (external) security experts for a thorough check-up to confirm that no breaches have occurred. Taking these steps will help safeguard your data and infrastructure from potential threats.

 Login

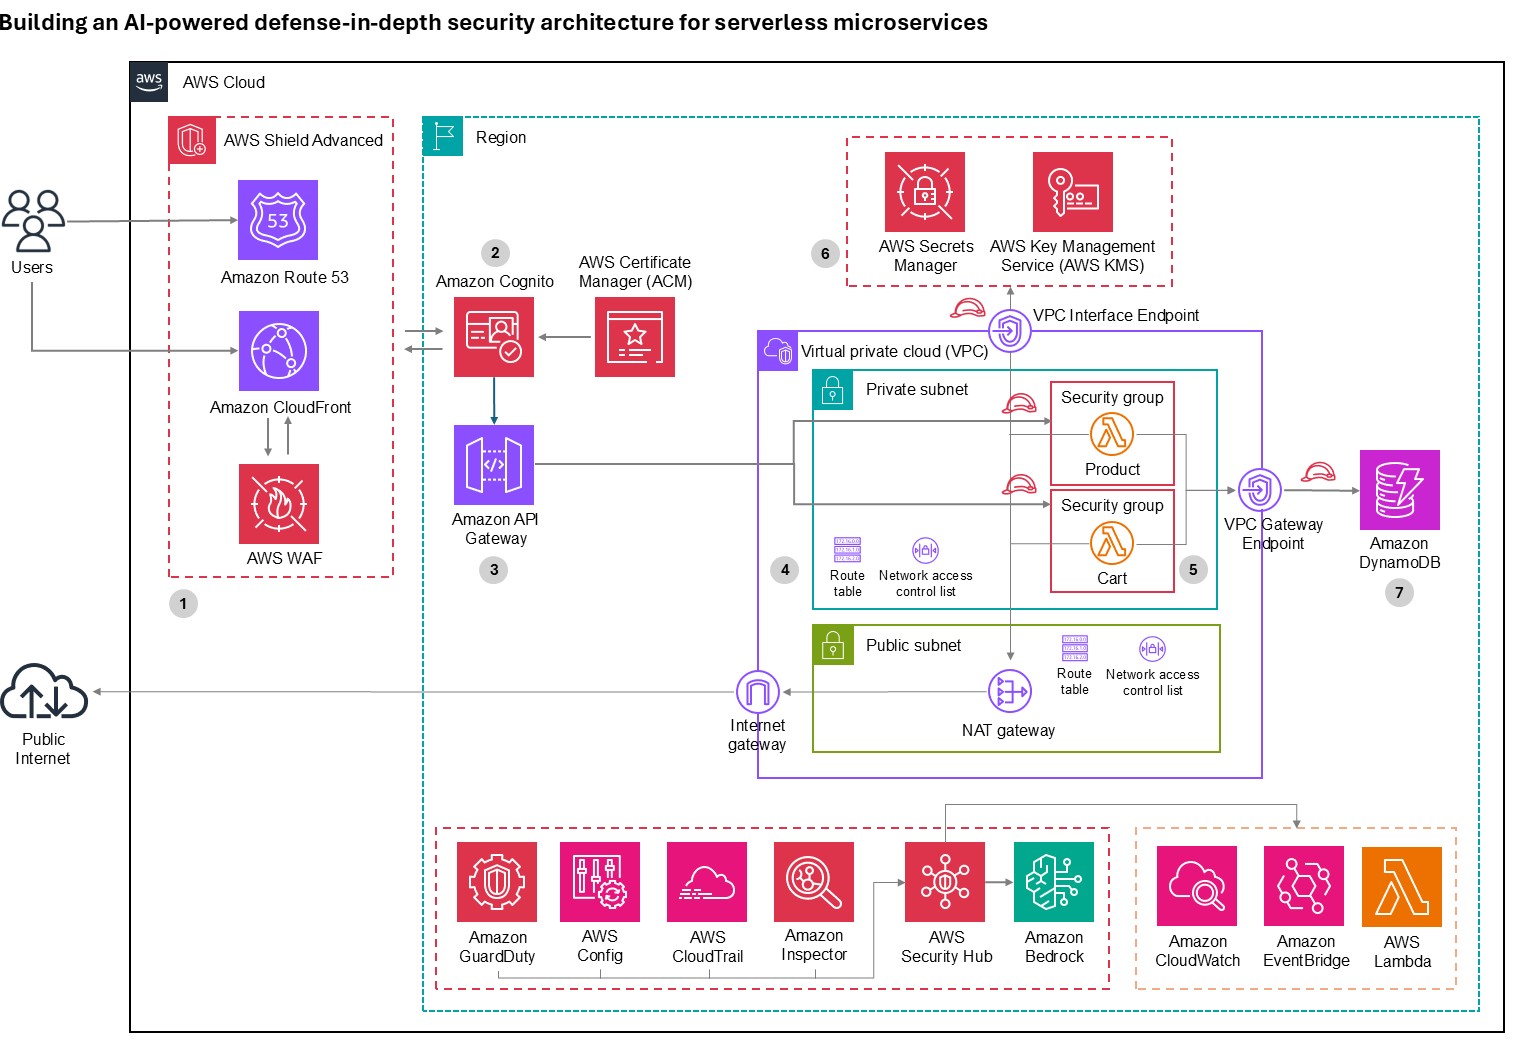
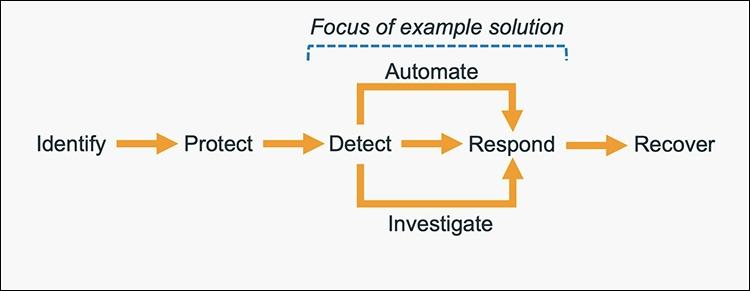
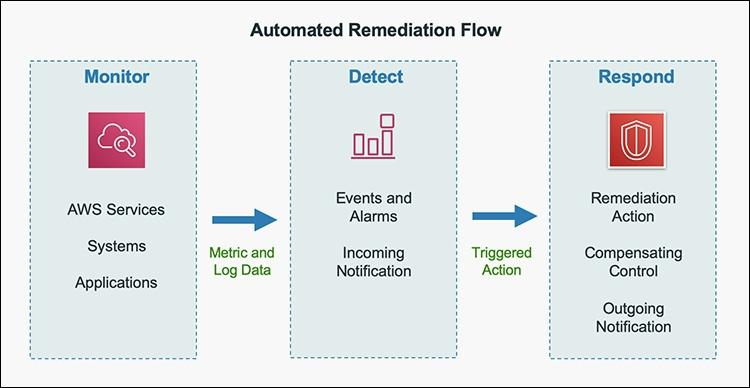

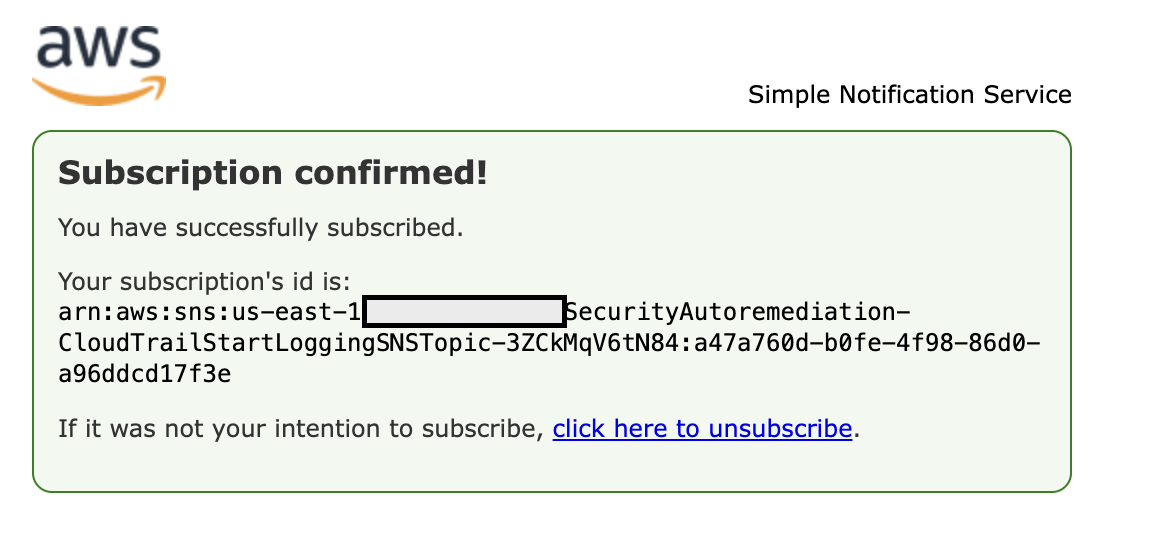
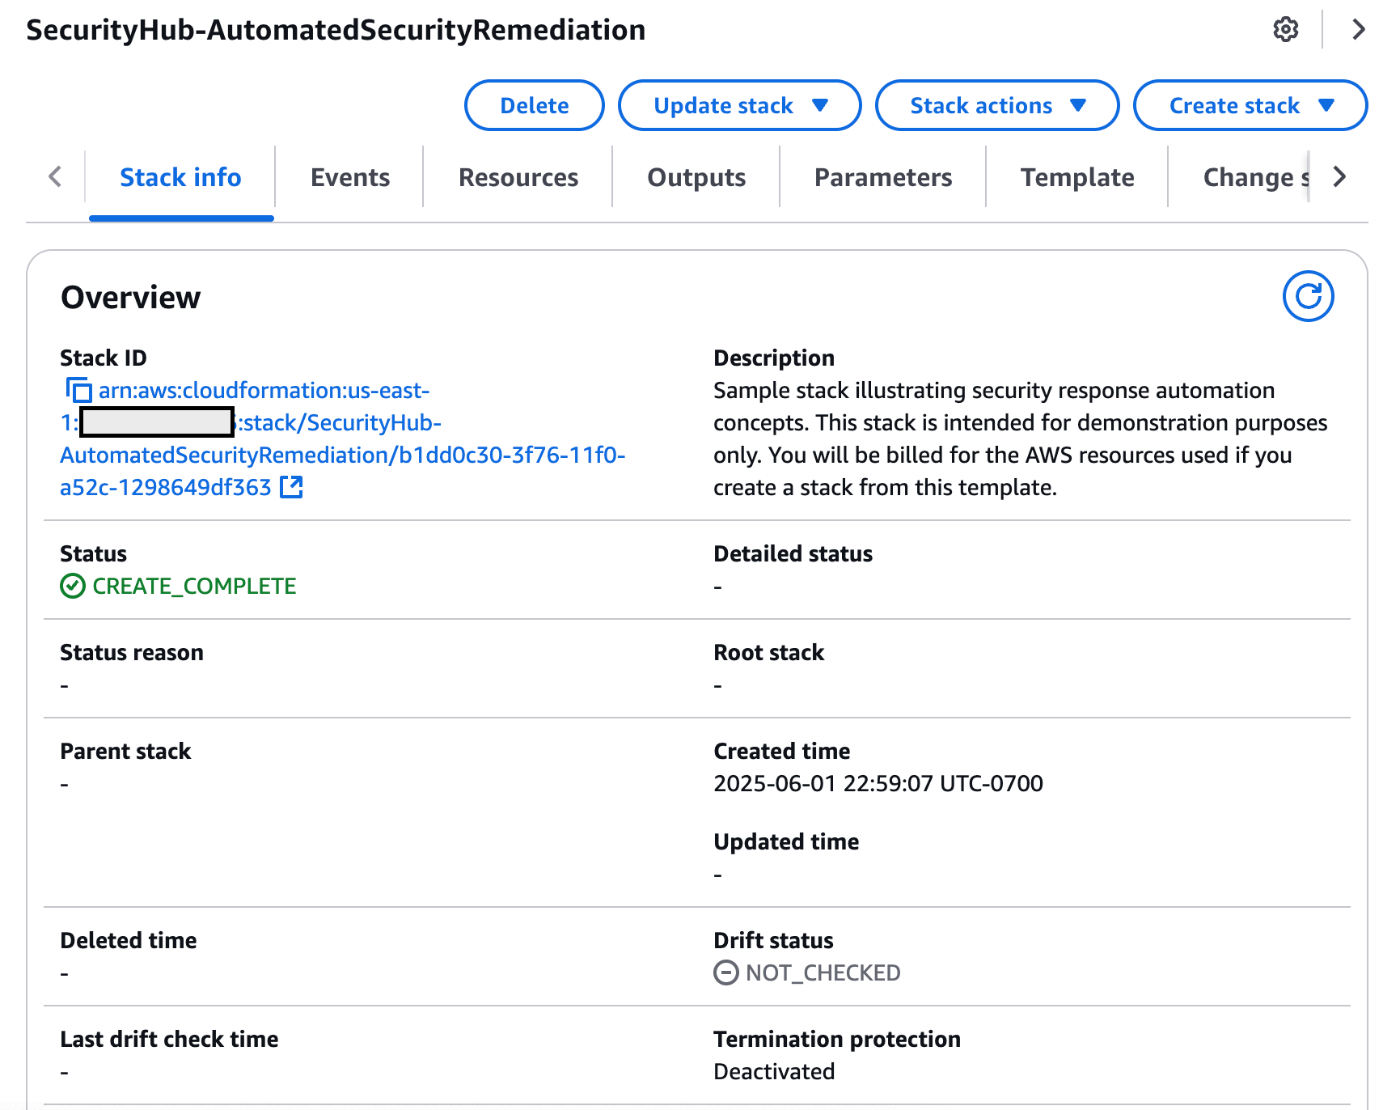
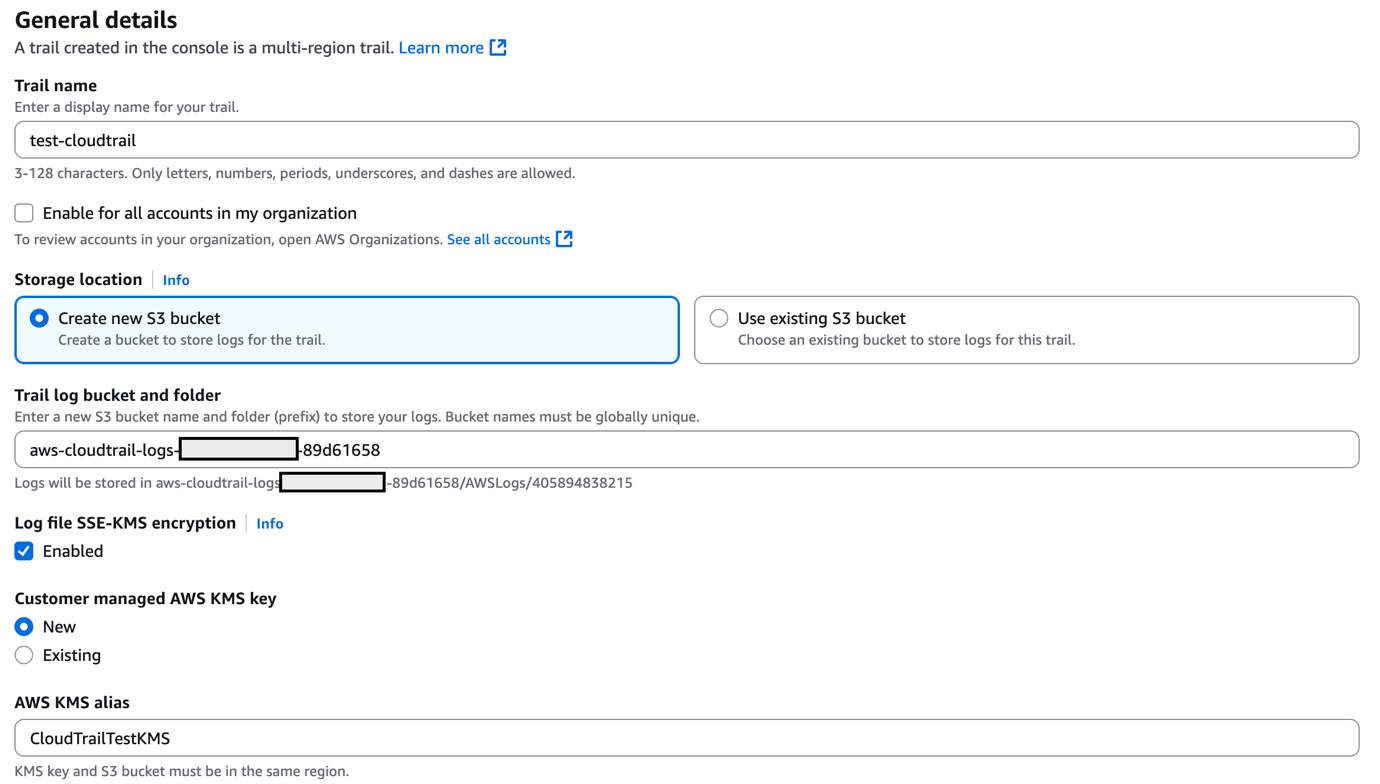
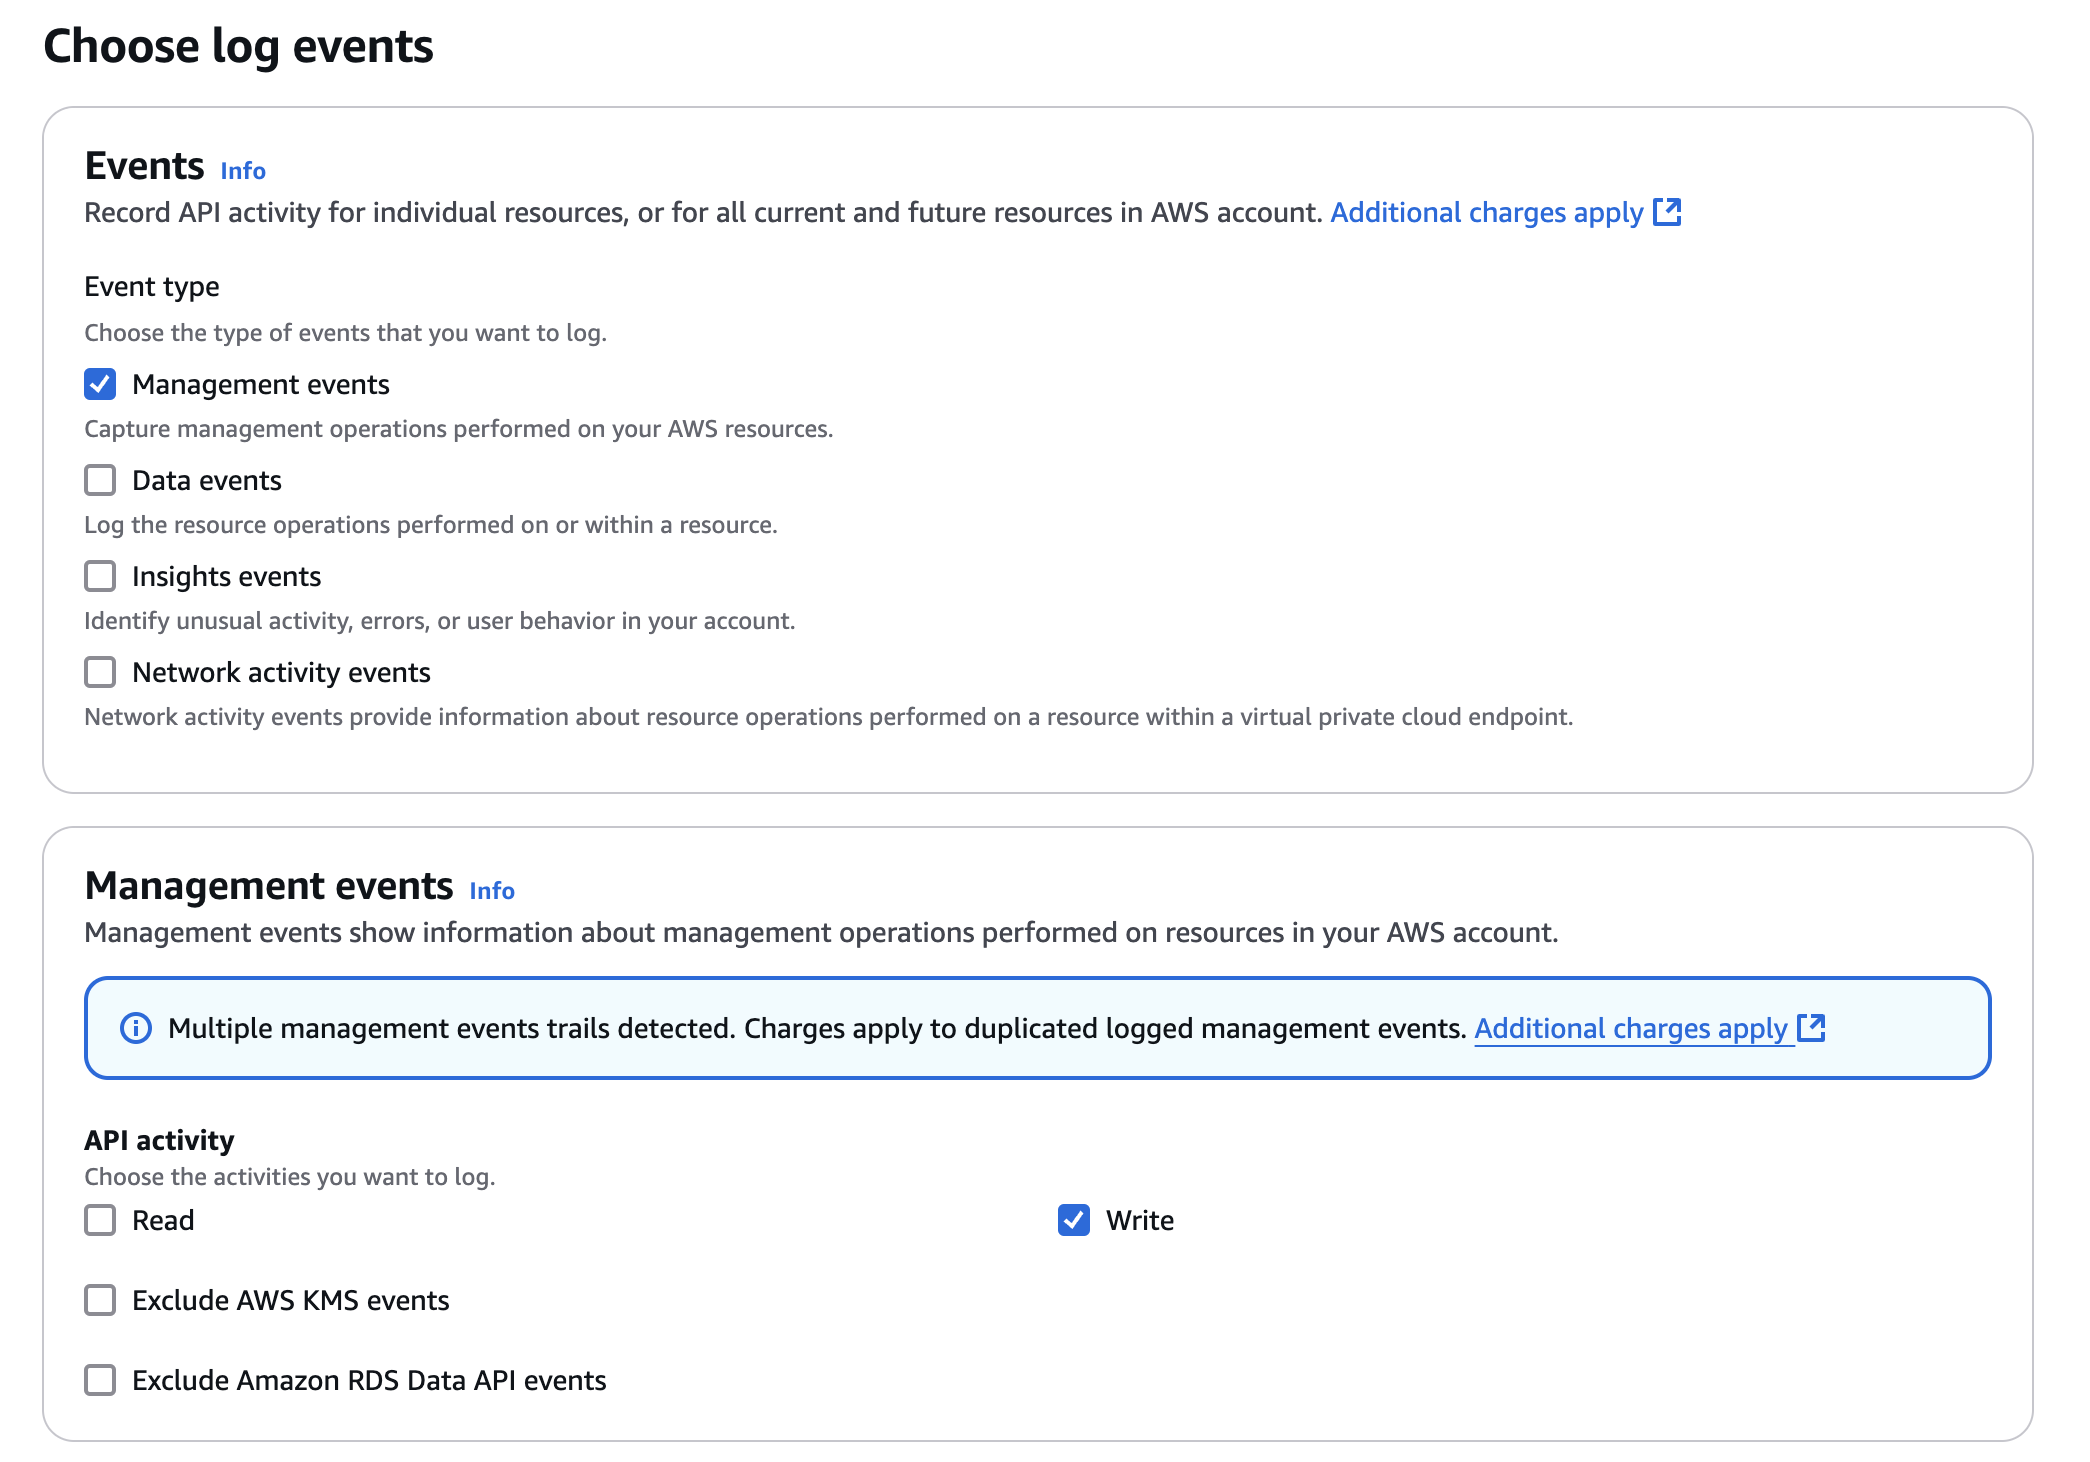
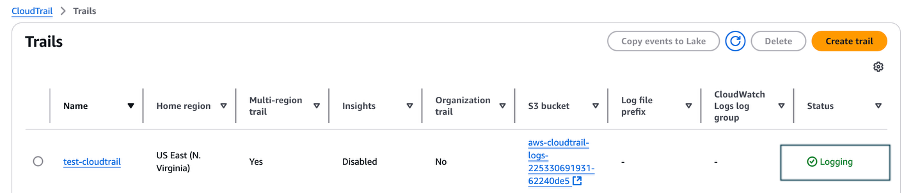
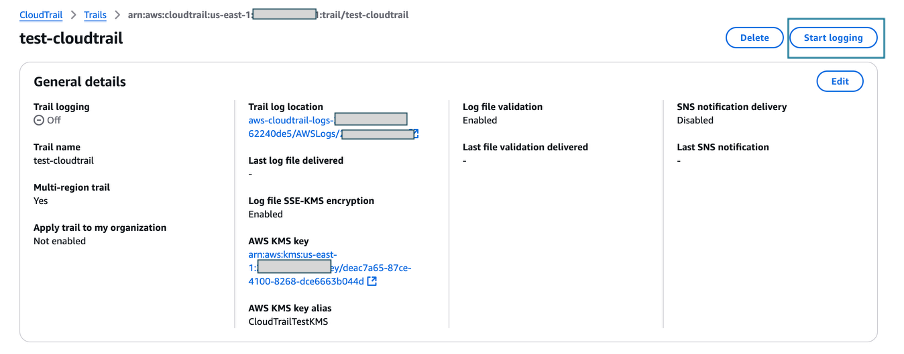
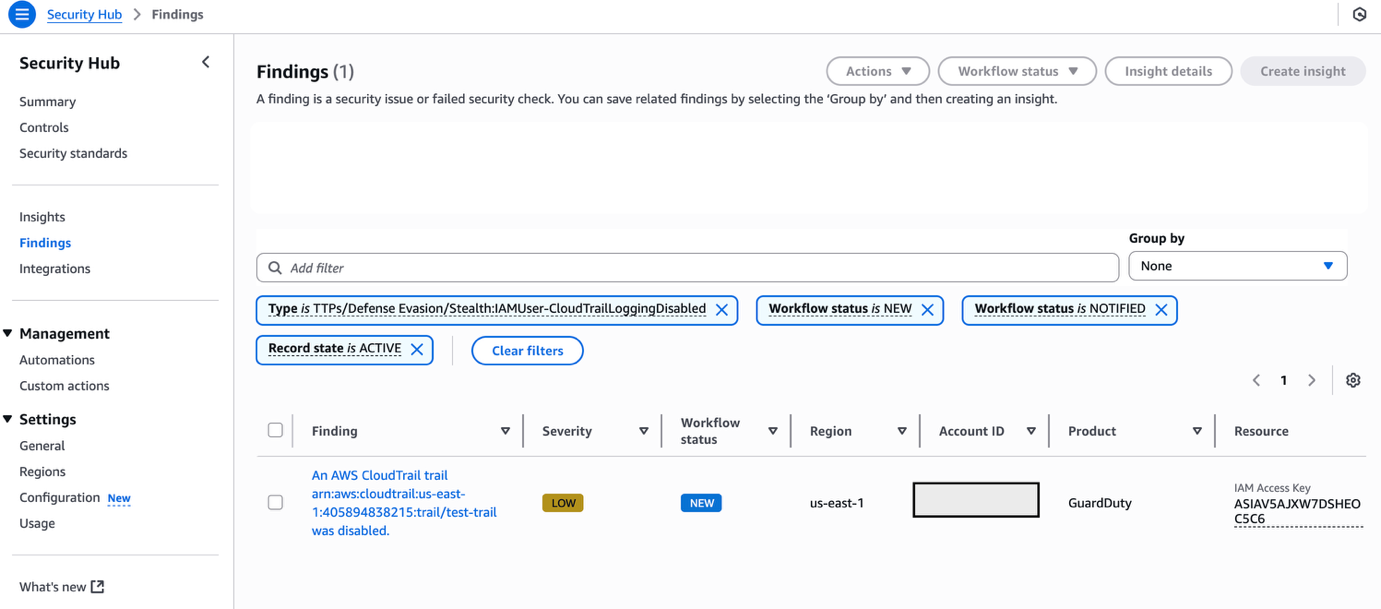
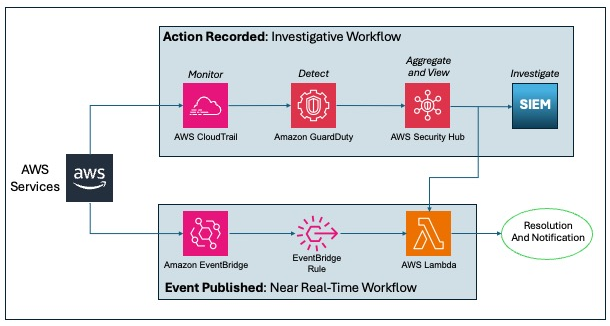
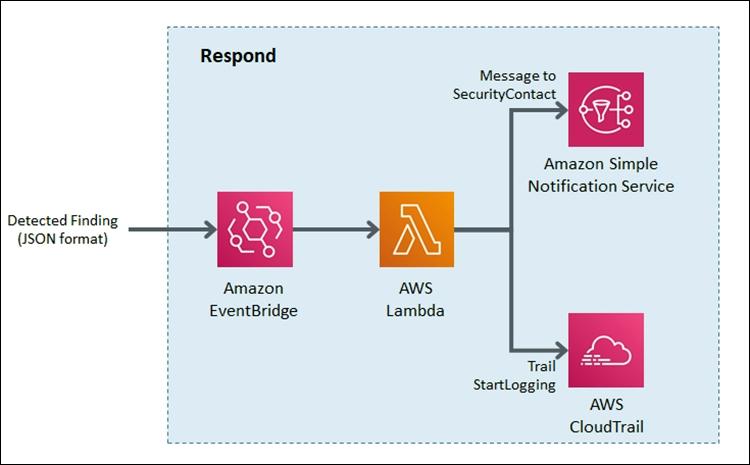
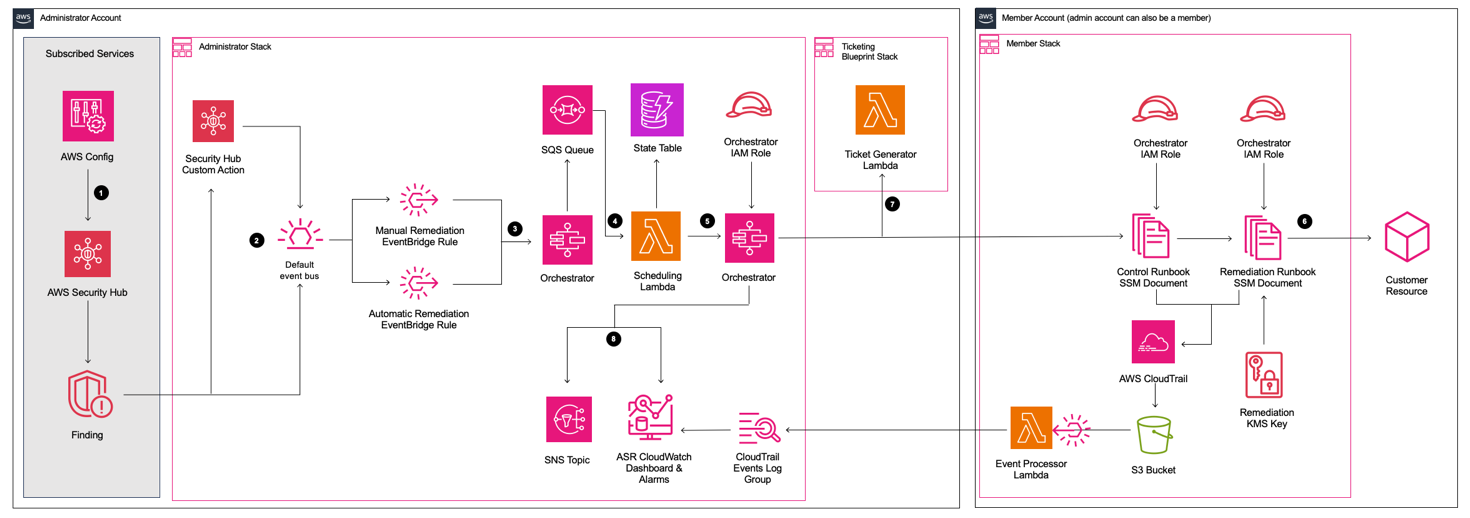
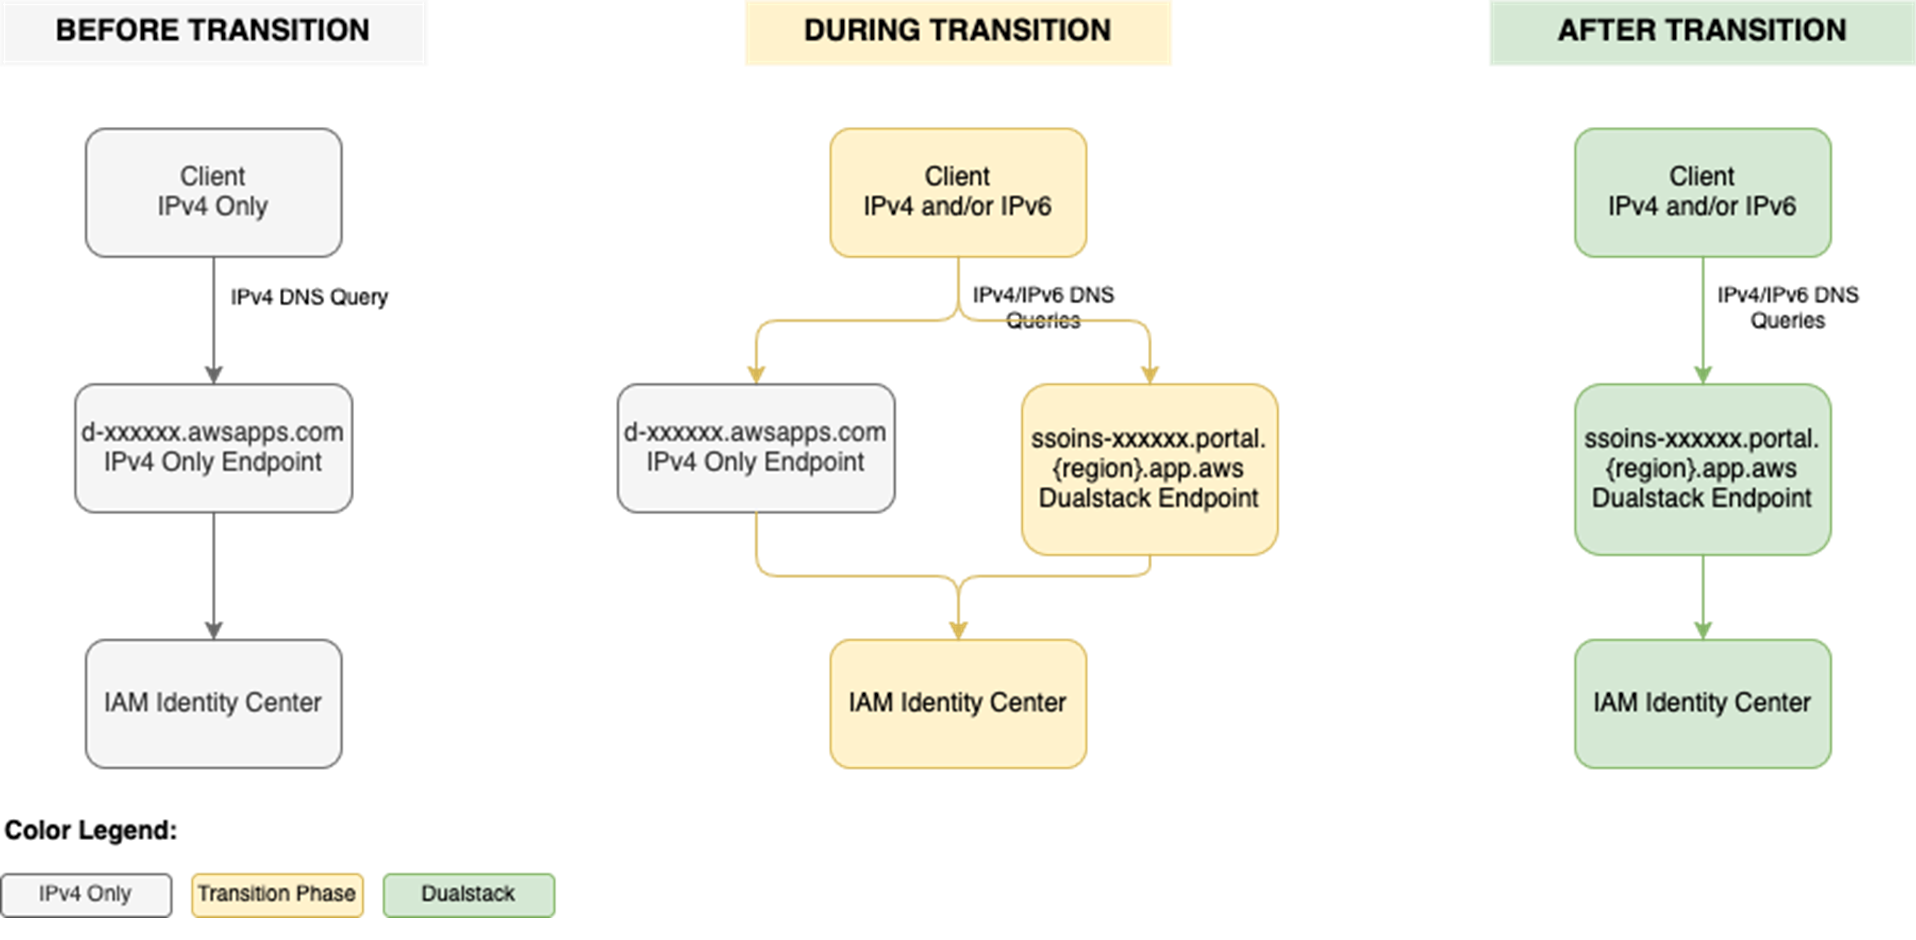
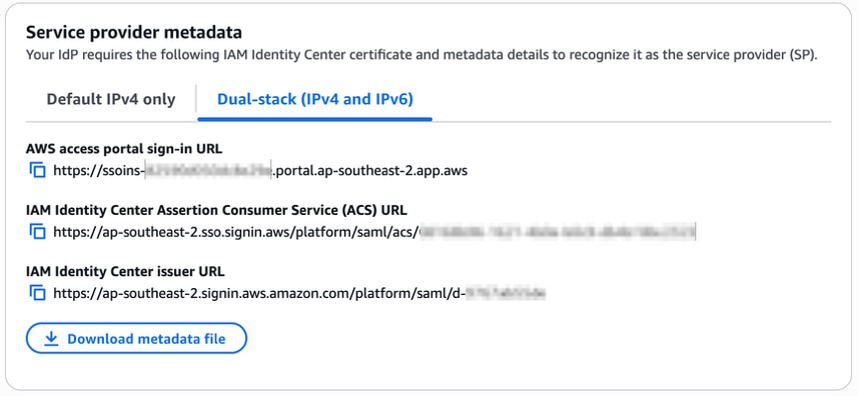
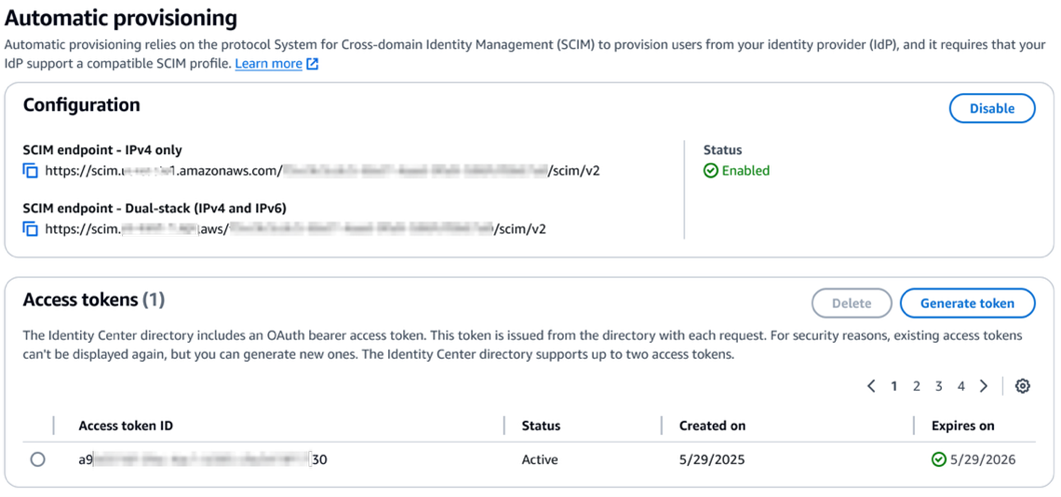
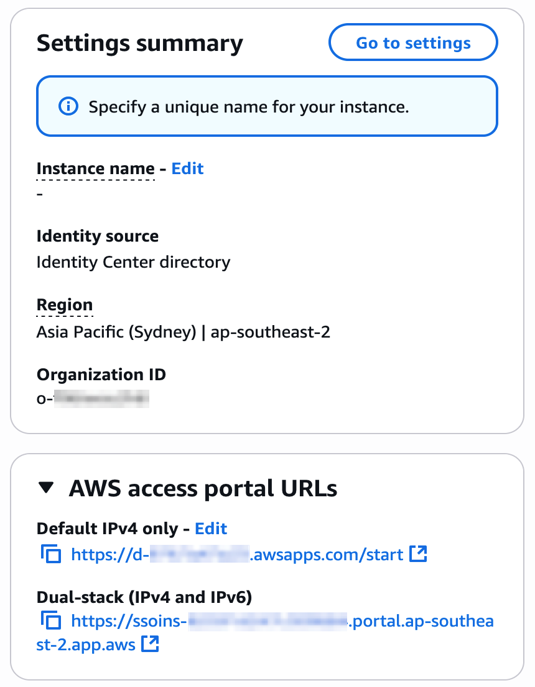


 ︎


