If you use and install packages from npm or PyPI, the first hours after a package is published are the riskiest because scanners can’t analyze packages before publication. Recent supply chain events affecting NodeJS and Python packages have been detected and removed within hours. However, while those packages were available to the general public, it’s possible that they were installed by users, creating the potential for a security incident. As you will see from the data that follows, if users had waited 1 day before accessing those packages, none of the recent supply chain security events would have had an impact.
In this post, I show you a one-line configuration that you can use to eliminate this exposure in your environment: a dependency cooldown for npm and pip. This change tells your package manager to skip versions published in the last 24 hours, giving the security community time to detect and remove unexpected packages before they reach your systems. These settings secure the default setup. There’s another use case of package updates: receiving security fixes to address security risks. This process involves updating packages to a more recent version. I also show you how to override the cooldown configuration so you can install the latest security patches while newly installed package updates are delayed. We recommend that you assess the severity of code defects and apply security fixes if there’s known risk. Handling security fixes based on their severity—and how to specify SLAs for these fixes based on severity—is beyond the scope of this blog post.
Background: Two risks pull in opposite directions
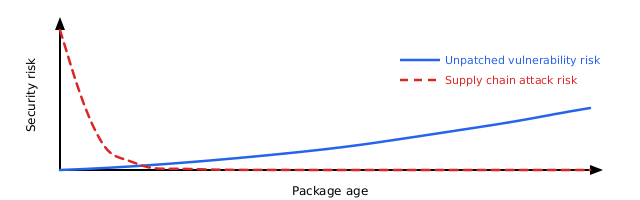
Software delivered by Amazon Linux packages go through review by Amazon package maintainers and pass guardrails before release. Open source software is developed and maintained with similar processes and guardrails. The npm and PyPI registries have open publishing access and don’t enforce reviews. Unexpected packages are potentially added to the registries because of risks like impersonation or stolen credentials. You’re caught between two risks: older software accumulates unpatched vulnerabilities, while new packages potentially contain unexpected vulnerabilities that haven’t been detected yet. The best approach is to stay current without adopting the newest releases immediately, while applying recommended security fixes. The following diagram illustrates the relation between the two types of risks in an abstract way, where the supply chain risk is highest immediately after a package is published, because unexpected updates can potentially bypass guardrails. After a package is published, auditing can review it and identify potential defects over time. If no security fixes are applied, the risk of all the code defects adds up.
Figure 1: Software risk over lifetime. Unpatched vulnerabilities risk increases over time. Very recent software also carries more supply chain risk.
The problem: The first day presents the highest risk
Supply chain events follow a consistent pattern. An unexpected author publishes an unexpected package or package version and waits for automated systems and users to pull it in. Security researchers and automated scanners typically detect and remove these packages within hours, but by then, systems have been exposed to the risk.
Datadog’s 2026 State of DevSecOps report found that 54% of JavaScript applications install at least one dependency within a day of its release. That’s the time window that presents the highest supply chain risk. Recent events show how fast detection happens:
Event
Exposure window
Nx s1ngularity (Aug 2025)
4–5 hours
axios (Mar 2026)
2–3 hours
Bitwarden CLI (Apr 2026)
93 minutes
TanStack (May 2026)
30 minutes
node-ipc (May 2026)
less than 24 hours
The solution: Skip packages published today
A dependency cooldown tells your package manager to skip recently published versions. If a version hasn’t existed on the registry for the configured timespan, for example, 1 day, it won’t be installed, giving the security community time to detect and remove unexpected versions.
A 1-day cooldown blocks each event listed in the preceding table. Notably, several of these events produced valid provenance attestations and passed build verification. These provenance checks alone didn’t stop them. A cooldown works independently of authorization mechanisms, because it blocks by age rather than by trust.
Both npm (v11.10.0+) and pip (v26.1+) support cooldowns . Amazon Linux 2023 ships these packages in NodeJS 24 and Python 3.14 since release 2023.11.20260608.
If you use lockfile-based installations through npm ci or pip install -r requirements.txt with pinned versions, you won’t pull latest package updates. The cooldown doesn’t apply to those installations. The cooldown only affects resolution of new or updated packages. See the Lockfile-based installs and the cooldown section for details.
Prerequisites
To implement the following solution, you first need to have the following prerequisites in place:
Node.js 24 with npm 11.10.0 or later (in nodejs24-24.14.1-1.amzn2023.0.1 or later).
Python 3.14 with pip 26.1 (in python3.14-pip-26.1.1-1.amzn2023.0.1 or later)
pip-audit (tool to scan python packages required for defect-based override scripts). Use python3.14 -m pip install pip-audit to install.
Future versions of Node.js and Python will bring new commands. The following tool commands work for Amazon Linux 2023 with Node.js 24 and Python 3.14. The provided commands target specific package versions. Adjust the commands if you use later releases.
To set up the npm cooldown
Create the global configuration directory, depending on your NodeJS version. sudo mkdir -p /usr/lib/nodejs24/etc
Add the npm configuration file with the cooldown setting. sudo npm-24 config set min-release-age 1 --location=global
Check that the cooldown is active by running the next command. npm-24 config list
You will see before = "<timestamp from 24 hours ago>" in the output, confirming npm converted the 1-day cooldown into a date filter. For more information, see the npm min-release-age documentation.
To set up the pip cooldown
Create the system-wide pip configuration file with the cooldown setting. sudo python3.14 -m pip config set --global global.uploaded-prior-to P1D
Verify the configuration (for Python 3.14 and pip 26.1+). python3.14 -m pip config list
You will see global.uploaded-prior-to='P1D' in the output.
This configuration is safe to deploy immediately, because older pip versions (25.x) silently ignore the setting.
To install a package’s latest version without cooldown
What if you want to install the latest version of a package, for example to receive security fixes? The following sections describe how to override the flag using the tool command line. To identify which packages need urgent updates, run the appropriate audit command for your package manager.
npm auditor python3.14 -m pip_audit
For npm packages
Install the package with the cooldown override. npm-24 install <package-name> --min-release-age=0
For pip packages
Install the package with the cooldown override. python3.14 -m pip install <package-name> --uploaded-prior-to="P0D"
Update packages that need urgent updates
We recommend that you apply security fixes for packages that have known security risks. You don’t need to turn off the cooldown entirely to apply security fixes. Use the audit tools to identify packages with known issues, then override the cooldown for only these packages.
Prerequisites: Ensure you have Python 3 and pip-audit installed (python3.14 -m pip install pip-audit).
Important: These scripts demonstrate the concept. For production use, add error handling, logging, and testing. Review packages before updating them in automated pipelines.
For npm packages
The following script demonstrates the required steps to identify npm packages with a known security fix. The npm audit command prints these packages as JSON. Next, packages in this list are updated with an npm install command, where their cooldown is overridden so that the latest version is picked up.
npm audit --json | python3 -c "
import json, sys, subprocess
data = json.load(sys.stdin)
for pkg in data.get('vulnerabilities', {}):
    subprocess.run(['npm-24', 'install', f'{pkg}@latest', '--min-release-age=0'])
"
For pip packages
The following script demonstrates the required steps to identify pip packages with a known security fix. The pip_audit command prints these packages as JSON. Next, all packages in this list are updated with an pip install command that overrides the cooldown so that the latest version can be picked up.
python3.14 -m pip_audit --format=json | python3.14 -c "
import json, sys, subprocess
from packaging.version import Version
data = json.load(sys.stdin)
for dep in data.get('dependencies', []):
    pkg = dep['name']
    vulns = dep.get('vulns', [])
    if not vulns:
        continue
    fix_versions = [v for vuln in vulns for v in vuln.get('fix_versions', [])]
    if not fix_versions:
        print(f'{pkg}: vulnerable but no fix published, skipping')
        continue
    fix = max(fix_versions, key=Version)
    print(f'Updating {pkg} -> {fix}')
    subprocess.run(['python3.14', '-m', 'pip', 'install', f'{pkg}=={fix}', '--uploaded-prior-to=P0D'])
"
Lockfile-based installs and the cooldown
If you use npm ci or pip install -r requirements.txt with pinned versions, the cooldown doesn’t apply. These commands install what the lockfile specifies, regardless of package age. The cooldown only affects resolution of new or updated packages.
Industry adoption: Cooldowns are now used across PyPI and NodeJS
Major package managers and enterprises have started to adopt dependency cooldowns. As of May 2026, several popular package management tools now include cooldown features: pnpm (a fast Node.js package manager), Renovate (an automated dependency update tool), and StepSecurity (a supply chain security platform).
pnpm 11 ships with minimumReleaseAge enabled by default. It’s one of the first major package manager to make cooldowns opt-out rather than opt-in.
Renovate’sconfig best-practices preset has included a 3-day npm cooldown since 2025 and is widely adopted across enterprises.
StepSecurity Secure Registry uses a configurable cooldown period for enterprise customers. StepSecurity recommends a 10 day delay as default.
How AWS is helping protect the open source supply chain
AWS scans upstream package registries to catch unexpected packages before they reach customers.
Amazon Inspector, a security management service that continuously scans workloads for software vulnerabilities and network exposure, uses AI-assisted detection rules to scan upstream package registries. In 2025, Amazon Inspector researchers identified over 150,000 unexpected npm packages linked to a token farming campaign.
Unexpected packages are typically caught within hours of publication. A 1-day cooldown ensures you don’t install them during that detection window.
Recommendations
To secure your Amazon Linux 2023 configuration:
Set a 1-day cooldown for npm and pip as shown in the preceding sections. External registries don’t have human review, so give the defenders time to catch problems.
Override when needed for urgent security patches using the per-command flags.
Run npm audit or pip_audit regularly to identify packages that need immediate attention.
Set up the cooldown with one line of configuration, and the protection is immediate.
Conclusion
By implementing the solutions presented in the post, you secure your npm and PyPI environment from most instances of unexpected code. The update delay of 1 day protects your environment, while still allowing to apply the latest security fixes. To learn about how to protect your environment further, see the following resources:
When an administrator introduces a rule change in AWS Network Firewall and network connectivity is disrupted, pinpointing the cause requires inspecting multiple points in the traffic path. The firewall gives you stateless and stateful rule engines, domain rules, and routing to the firewall endpoint inside your Amazon Virtual Private Cloud (Amazon VPC). A network drop looks the same from the workload no matter where it started. Isolating the cause means correlating the alert and flow logs with the firewall configuration, route tables, and recent API calls in AWS CloudTrail that might have changed them. That manual correlation is exactly where AWS DevOps Agent helps, accelerating root cause analysis so you can restore connectivity in minutes instead of hours.
AWS DevOps Agent does that correlation for you. As your always-available operations teammate, it resolves and proactively prevents operational issues across AWS, multicloud, and on-premises environments. When an Amazon CloudWatch alarm triggers, it reaches the agent through a webhook. The agent then reads the firewall configuration and logs through AWS APIs, ties the drop to recent API activity, and returns a root cause with a mitigation plan you review before you apply it.
This post connects CloudWatch monitoring to DevOps Agent. It walks through three Network Firewall failures from end to end. The first is a domain deny list blocking a legitimate endpoint. The second is a stateless rule priority misconfiguration. The third is an asymmetric cross Availability Zone (AZ) routing drop. Each maps to a different layer, so each leads down a different investigation path. An AWS Cloud Development Kit (AWS CDK) app deploys the whole environment in your own account so you can reproduce each failure and follow along.
The sample workload
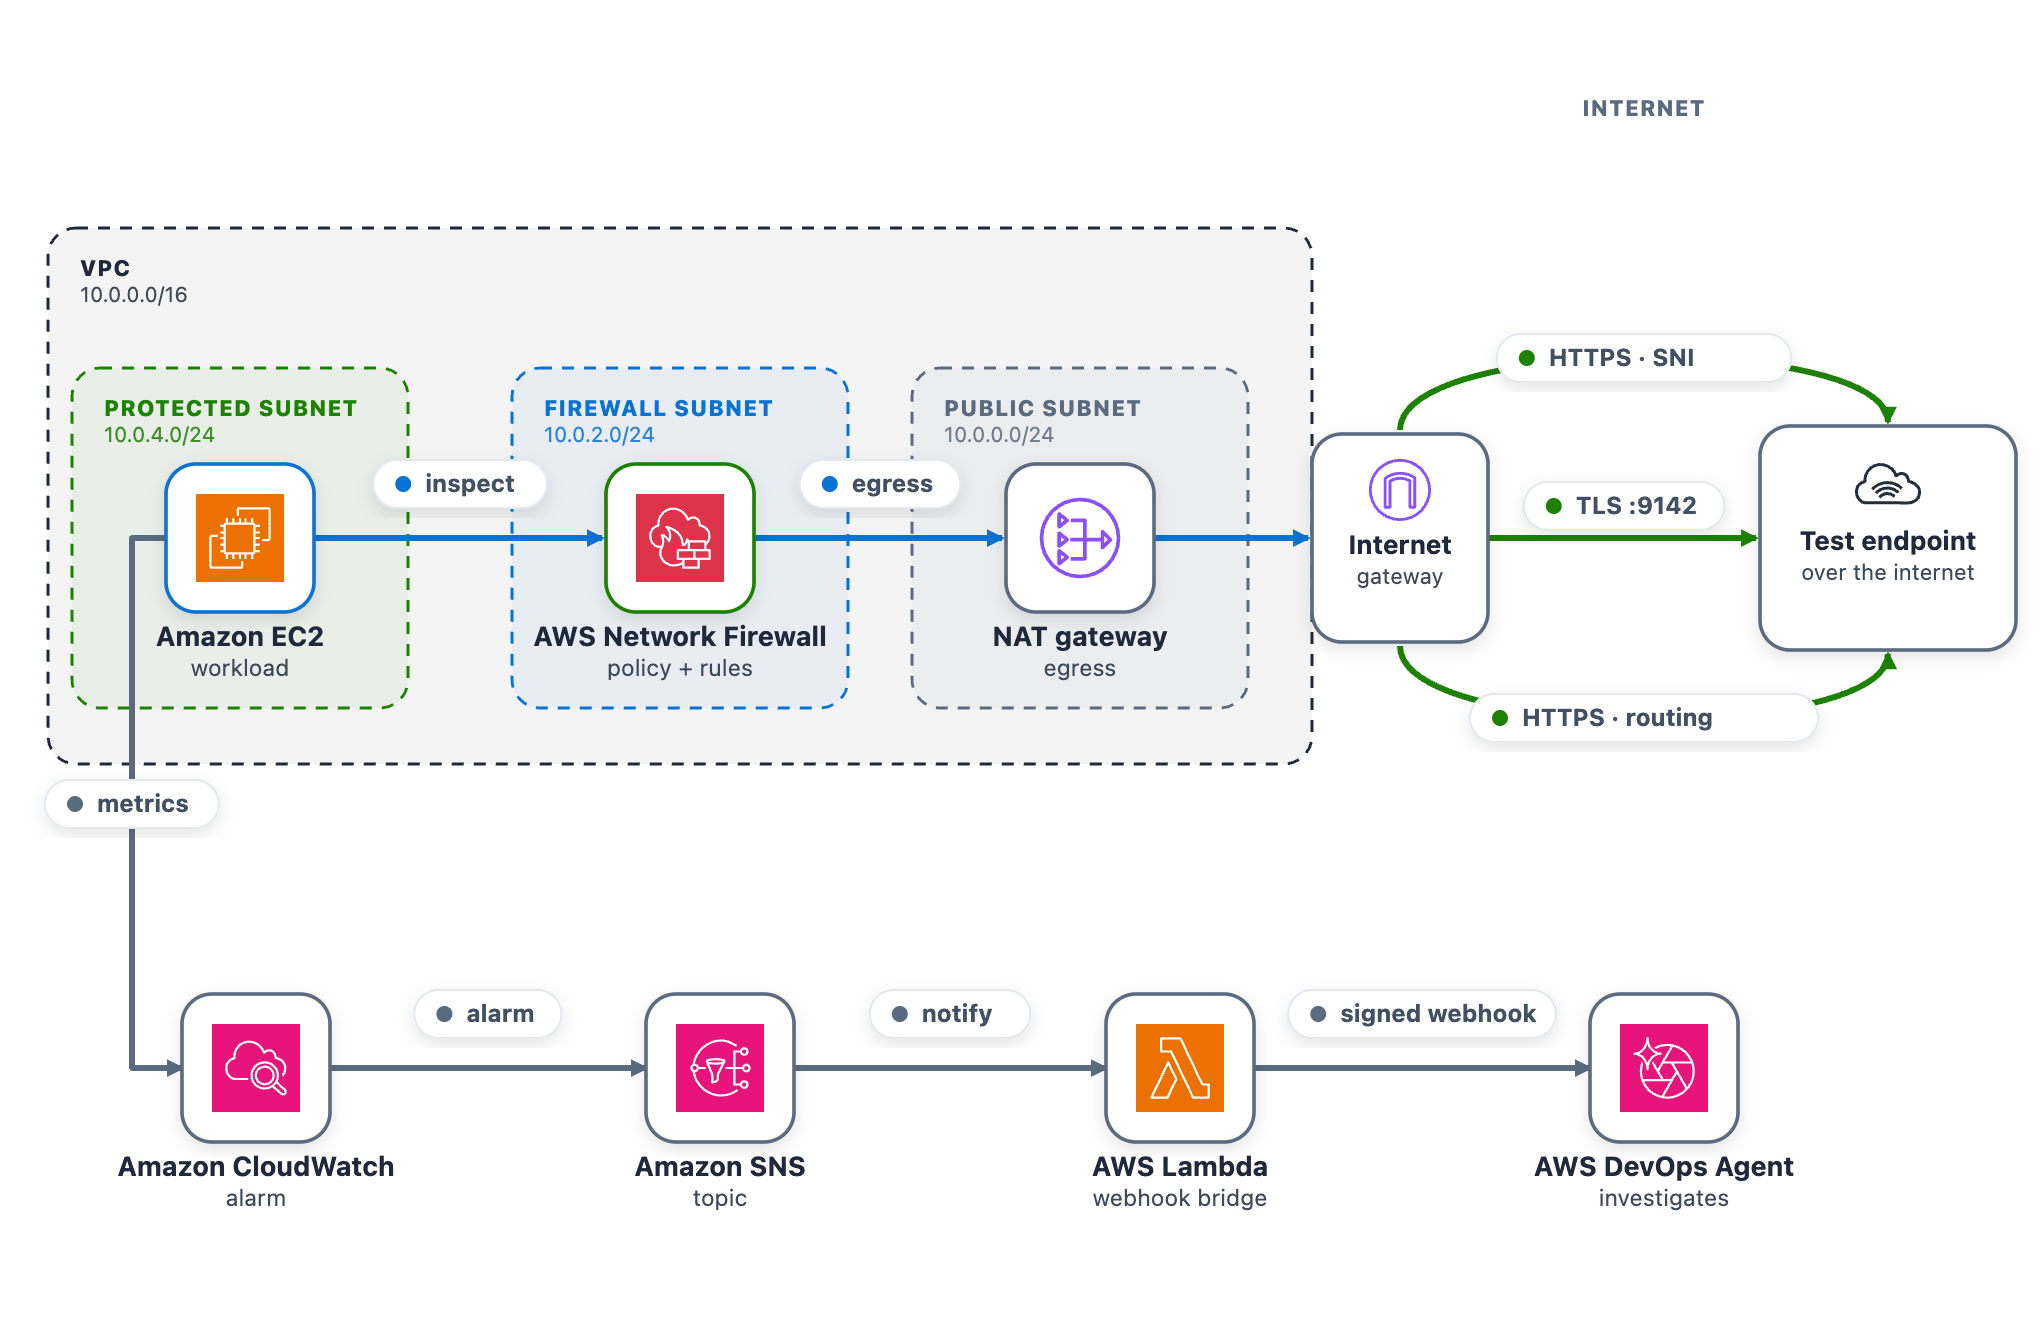
As part of this blog post, we provide a CDK stack that deploys both the AWS DevOps Agent Space and a sample workload used to walk through three separate troubleshooting scenarios. A single t3.micro instance in a protected subnet checks its connectivity to a test endpoint on a continuous loop and publishes results to CloudWatch. Traffic takes the internet egress path through Network Firewall, the NAT gateway, and the internet gateway, so the firewall can intercept or drop it. After completing the walkthrough, you can apply the same troubleshooting techniques with DevOps Agent against your own Network Firewall deployments.
The test endpoint runs in a separate VPC deployed by the same CDK app. It serves HTTPS on port 443 and TCP on port 9142, giving each scenario a different protocol layer to exercise: Scenario 1 targets a TLS connection on 443 (matched by Server Name Indication), Scenario 2 targets a TCP connection on 9142, and Scenario 3 exercises the whole egress path.
A live status page shows one card per scenario plus the network topology. The whole stack deploys from a single CDK app across two Availability Zones, each with a firewall endpoint and NAT gateway, which is what makes Scenario 3 possible.
As shown in the following figure, the egress data path runs from the workload through Network Firewall and the NAT and internet gateways to the test endpoint. The alarm pipeline runs from CloudWatch through Amazon Simple Notification Service (Amazon SNS) and the webhook AWS Lambda function to DevOps Agent.
Figure 1: The sample workload
To use this with your own workload, you need a CloudWatch alarm that detects the connectivity problem and the webhook pipeline (SNS topic and Lambda function) that delivers it to DevOps Agent. The agent reads your firewall configuration, logs, and CloudTrail through AWS APIs, so no additional instrumentation is needed on the firewall side.
AWS CDK 2.x is required. You can use it through the project’s npx dependency, or install it globally:
npm install -g aws-cdk
Deploy the sample workload
Clone the project and deploy it into us-east-1 with one command (set awsRegion to use another AWS Region).
git clone https://github.com/aws-samples/sample-accelerating-aws-network-firewall-troubleshooting-with-aws-devops-agent.git
cd sample-accelerating-aws-network-firewall-troubleshooting-with-aws-devops-agent
bash scripts/deploy.sh
The script checks prerequisites, installs dependencies, compiles and tests, and bootstraps the CDK if needed. It then deploys all the stacks from a clean baseline and prints the outputs, including the status-page URL and sign-in details.
Open the status-page link (an https://<random-id>.cloudfront.net address).
Sign in using the username and password provided from the CDK output and confirm all three cards show the green Healthy status.
Keep the page open while you run the scenarios.
Connect AWS DevOps Agent
To connect AWS DevOps Agent to the alarm pipeline
In the AWS DevOps Agent console, open the nf-devops-agent-space Agent Space created by the CDK deployment.
On the status page, choose Configure webhook, paste the URL and signing secret, and save. The page writes them to the nf-devops-agent-webhook-credentialsAWS Secrets Manager secret, so there is no AWS CLI or console step. Until you set it, the bridge Lambda function sees a placeholder and skips delivery.
Verify the path before you run a scenario. In the Lambda console, open nf-devops-agent-webhook and use the Test tab with this event.
{
  "Records": [
    {
      "Sns": {
        "Message": "{\"AlarmName\":\"TEST-webhook-verification\",\"AlarmDescription\":\"[TEST] Webhook integration test - not a real alarm.\",\"NewStateValue\":\"ALARM\",\"NewStateReason\":\"[TEST] Manual webhook connectivity test. Safe to ignore.\",\"Region\":\"us-east-1\"}"
      }
    }
  ]
}
A 200 response confirms the path, and a test investigation appears in the DevOps Agent Operator Web App view.
How the alarm pipeline works
Every scenario reaches DevOps Agent the same way. A CloudWatch alarm moves to ALARM and notifies the SNS topic. Amazon SNS invokes a Lambda function. The function reads the webhook URL and signing secret from Secrets Manager, signs an alarm payload, and POSTs it to the DevOps Agent webhook (as shown in Figure 1). Amazon SNS also provides delivery retries, fan-out to other subscribers, and cross-account publishing.
Prebuilt Network Firewall metric (Scenario 1) – Alarm-1 watches the DroppedPackets metric, summed across the stateful streams, and triggers when drops rise above a baseline threshold. This requires no workload or custom metric and works on an already-deployed firewall. However, it only tells you that the firewall is dropping packets, not which rule is responsible.
Application health metric (Scenarios 2 and 3) – Alarm-2 and Alarm-3 watch a custom metric from a connectivity check. Use this for an alarm tied to user-facing impact or to tell one traffic path from another, which requires running a component that emits the metric.
Alarm
Source
Triggers when
Alarm-1
Native AWS/NetworkFirewall DroppedPackets
The firewall’s dropped-packet count rises above the baseline
Alarm-2
Custom application health metric
The port 9142 (TCP) connectivity check to the test endpoint is being dropped
Alarm-3
Custom application health metric
The cross Availability Zone connectivity check is being dropped
Run the scenarios
Work through each of the scenarios one at a time, following the same cycle. Interrupt network connectivity, watch the alarm trigger, let DevOps Agent investigate, apply the recommended fix, and confirm recovery before moving on.
The status-page cards follow the live CloudWatch alarm state. A card shows a green dot and the word Healthy when its alarm is clear, and a red dot and the word DROPPED when its alarm triggers. In the DROPPED state the card also adds a Condition: line describing what’s being dropped, which isn’t shown when the card is healthy. Network Firewall applies changes to new flows, so a change shows within a minute or two. Recovery comes from the mitigation DevOps Agent recommends, which you review and apply.
Scenario 1. Domain deny list blocking a legitimate endpoint
At baseline, the rg-domain Suricata domain rule group denies only an unused placeholder, so the test endpoint stays reachable. The rule group inspects the TLS Server Name Indication (SNI) on each outbound connection and drops any that matches a denied domain. The exact rule syntax and console steps follow.
In the navigation pane, under Network Firewall, choose Network Firewall rule groups.
Choose the rg-domain rule group to open its details page.
In the Rules section, choose Edit.
The rules box already contains two baseline placeholder rules (they match blocked.placeholder.invalid, so nothing real is denied). Leave those in place. Find the <app-endpoint-dns> value for Scenario 1 in the deployment script output (a Nework Load Balancer (NLB) DNS name such as NfTest-AppNl-a1b2C3dEf4G5-1234abcd5678efgh.elb.us-east-1.amazonaws.com). On a new line below the existing rules, add a drop rule that matches that DNS name on the TLS SNI, then choose Save.
drop tls $HOME_NET any -> $EXTERNAL_NET any (ssl_state:client_hello; tls.sni; content:"<app-endpoint-dns>"; startswith; nocase; endswith; msg:"S1 domain denylist"; flow:to_server, established; sid:2000002; rev:1;)
After saving, the rules box holds all three lines. The two placeholders remain, plus the new drop rule for the endpoint DNS name (note the distinct sid 2000002).
What happens. The workload’s HTTPS check to the test endpoint times out, the “AWS/NetworkFirewall DroppedPackets metric climbs above baseline, and Alarm-1 moves to ALARM. The Scenario 1 card reads DROPPED (with the condition Firewall dropping the monitored domain on its allow/deny rules), while the Scenario 2 and Scenario 3 cards stay Healthy (Figure 3). On the topology, the alarm pipeline from CloudWatch through Amazon SNS and Lambda to DevOps Agent and the workload-to-firewall inspect lines both turn amber, which the legend defines as collateral / alarm active, because the packets are now dropped at the firewall. To demonstrate the resulting failure, the HTTPS · SNI line from the internet gateway to the test endpoint is shown in red, which the legend defines as dropped (root cause).
Figure 3: Scenario 1 active – Traffic blocked at the firewall
Let DevOps Agent investigate. The agent runs several lines of investigation in parallel and correlates them:
Reads the DroppedPackets metric and correlates the spike with a simultaneous drop in passed packets, confirming the firewall is actively blocking traffic.
Reads the ALERT log and finds the workload’s TLS connections to the test endpoint blocked by the S1 domain denylist rule.
Compares the current state against a baseline window, where the same endpoint was reachable with no alerts, which shows the block is new.
Searches CloudTrail and surfaces the UpdateRuleGroup call that added the deny rule, identifying the user, role, and timestamp approximately one minute before the drops began.
Reports the root cause as that manual rule-group change. Recommends removing the deny entry or adding an allow exception and enabling FirewallPolicyChangeProtection to prevent unauthorized changes.
Presents this as a plan you review and apply, not an automatic change.
In the DevOps Agent Operator Web App view, the agent first restates the Alarm-1 trigger and confirms the firewall is dropping packets above the threshold (Figure 4).
Figure 4: Scenario 1 – The symptom
Next, the agent identifies the root cause: a manual update to the rg-domain rule group that added a domain deny rule (SID 2000002) shortly before the alarm fired, blocking TLS connections to the ELB endpoint (Figure 5).
Figure 5: Scenario 1 – The root cause
Finally, the agent presents a mitigation plan, recommending you remove the problematic deny rule (SID 2000002) to restore connectivity (Figure 6).
Figure 6: Scenario 1 – The mitigation plan
Note: In a real-world environment, this type of rule typically exists for a reason. Before removing it, verify whether it was intentional but scoped too broadly. If so, refine the rule to block only unauthorized endpoints rather than removing it entirely.
Confirm recovery. Apply the change the agent recommends. After the deny entry is gone, DroppedPackets falls back to baseline, Alarm-1 clears, and the card returns to green. Move on to Scenario 2.
At baseline, the rg-stateless-priority stateless rule group keeps the allow rule at priority 100 and the drop rule at 200 for the test class, TCP destination port 9142. The workload opens a TCP connection to the test endpoint on this port. Lower priority numbers evaluate first, so the allow rule wins. This scenario uses port 9142 instead of 443 to demonstrate a stateless rule, which matches on the packet’s 5-tuple (protocol, ports, addresses) rather than application content.
Introduce the change. Invert the two rule priorities so the drop rule evaluates before the allow rule. This is the kind of change a rushed rule edit can introduce.
In the navigation pane, under Network Firewall, choose Network Firewall rule groups.
Choose the rg-stateless-priority rule group to open its details page.
In the Rules section, choose Edit.
Raise the (Action: Pass) rule’s priority number so it sits after the (Action: Drop) rule, then choose Save. For example, change the (Action: Pass) rule from 100 to 300 (any number higher than the drop rule’s 200 works). You only need to move one rule, and using 300 avoids a clash with the drop rule that already sits at 200. Network Firewall evaluates the lowest priority number first, so the (Action: Drop) rule at 200 now wins for this traffic class, ahead of the (Action: Pass) rule at 300.
Figure 7: Scenario 2 – Rule priority change blocking the traffic class
What happens. The drop rule now wins, the TCP connection to the test endpoint on port 9142 times out, the StatelessRuleFailures metric climbs above baseline, and Alarm-2 moves to ALARM. The Scenario 2 card reads DROPPED (with the condition Stateless rules dropping the monitored traffic class), while the Scenario 1 and Scenario 3 cards stay Healthy (Figure 8). On the topology, the alarm pipeline from CloudWatch through Amazon SNS and Lambda to DevOps Agent and the workload-to-firewall inspect lines both turn amber, which the legend defines as collateral / alarm active, because the packets are now dropped at the firewall. To demonstrate the resulting failure, the TLS :9142 line from the internet gateway to the test endpoint is shown in red, which the legend defines as dropped (root cause).
Figure 8: Scenario 2 active
Let DevOps Agent investigate. A stateless drop happens before traffic reaches the stateful inspection engine, so it produces no ALERT log entries. The agent turns to configuration and flow logs instead:
Reads the stateless rule group state and finds the drop rule at the lower priority number, ahead of the pass rule, so the drop evaluates first.
Reads the flow logs and sees passed packets drop to zero within a minute of the change.
Searches CloudTrail and surfaces the UpdateRuleGroup call that inverted the priorities, identifying the user, role, and timestamp about a minute before the alarm.
Reports the root cause as that priority inversion. Recommends removing the redundant drop rule and managing the rule group through infrastructure-as-code (IaC) to prevent manual misconfigurations.
Presents this as a plan you review and apply, not an automatic change.
In the DevOps Agent Operator Web App view, the agent first restates the Alarm-2 trigger and confirms that a workload connectivity health check is failing because the firewall’s stateless rules are dropping egress (Figure 9).
Figure 9: Scenario 2 – The symptom
Next, the agent identifies the root cause, using the rule-group state and CloudTrail to pinpoint the conflicting DROP/PASS rules, where the new DROP rule’s lower priority number makes it match first (Figure 10).
Figure 10: Scenario 2 – The root cause
Finally, the agent presents a mitigation plan, recommending you remove the conflicting DROP rule at priority 200 to restore traffic flow (Figure 11).
Figure 11: Scenario 2 – The mitigation plan
Confirm recovery. Apply the change the agent recommends. After the allow rule is ahead of the drop rule again, Alarm-2 clears and the card returns to green. Move on to Scenario 3.
Scenario 3. Asymmetric cross Availability Zone routing drop
At baseline, the protected subnet in each Availability Zone routes its egress through the firewall endpoint in that same Availability Zone , and the matching return route uses that same endpoint. One endpoint sees both directions of the flow, so the stateful engine completes the handshake. The workload runs in the protected subnet in us-east-1a (CIDR 10.0.4.0/24), so at baseline its egress and its return both use the us-east-1a firewall endpoint.
Introduce the change. Make the flow asymmetric by sending egress out one Availability Zone endpoint while the return comes back through the other. This takes two route edits, and both are required. With only the first edit the flow can still complete, so the alarm will not trigger until both are saved. It makes no firewall-policy change, mirroring a real multi-Availability-Zone routing mistake.
To create asymmetric cross Availability Zone routing
Go to the Amazon VPC console and choose Route tables in the navigation pane.
Flip the egress. Select the NfNetworkStack/SampleVpc/protectedSubnet1 route table (the us-east-1a protected subnet, where the workload runs). On the Routes tab, choose Edit routes. Its 0.0.0.0/0 route currently targets the us-east-1a firewall endpoint. For the target, choose Gateway Load Balancer Endpoint and select the us-east-1b firewall endpoint, then choose Save changes.
Move the return. Select the NfNetworkStack/SampleVpc/publicSubnet2 route table (the us-east-1b public subnet, where egress now exits). Choose Edit routes, then Add route. For the destination enter the workload CIDR 10.0.4.0/24. For the target, choose Gateway Load Balancer Endpoint and select the us-east-1a firewall endpoint. Choose Save changes.
After both edits, a flow’s egress leaves through the us-east-1b endpoint while its return is directed to the us-east-1a endpoint. Neither endpoint sees the whole flow.
Figure 12: Scenario 3 routing change breaking the flow’s symmetry
What happens. A new connection leaves through one endpoint. Its return arrives at the other endpoint, which never saw the connection open, so the handshake fails. Unlike Scenarios 1 and 2, this affects the whole subnet, so all egress stops and Alarm-2 and Alarm-3 both move to ALARM. The AWS/NetworkFirewall DroppedPackets alarm (Alarm-1) stays quiet because no endpoint is making a drop decision. The flow is lost to asymmetric routing rather than counted as a firewall drop. This is why monitoring application connectivity matters. A routing fault is invisible to the firewall’s own drop counter. On the status page, the Scenario 2 card reads DROPPED (with the condition “Stateless rules dropping the monitored traffic class”) and the Scenario 3 card reads DROPPED (with the condition Return traffic dropped by asymmetric cross-Availability-Zone routing), while the Scenario 1 card stays Healthy (Figure 13). On the topology, the alarm pipeline from CloudWatch through Amazon SNS and Lambda to DevOps Agent and the workload-to-firewall inspect lines both turn amber, which the legend defines as collateral / alarm active, while the egress path from the firewall through the NAT gateway and the TLS :9142 and HTTPS · routing lines to the test endpoint turn red, which the legend defines as dropped (root cause).
Figure 13: Scenario 3 – The status page during a path-wide outage
Let DevOps Agent investigate. Both Alarm-2 and Alarm-3 fire in the same datapoint. DevOps Agent recognizes them as linked and merges them into a single investigation:
Reads the flow logs and sees bidirectional TLS connections stop abruptly, with only one-way traffic remaining and no flows reaching the established state.
Reads the firewall metrics and sees received and passed packets shift from one Availability Zone to the other at the moment of the change.
Calls DescribeRouteTables and finds the egress route pointing at one Availability Zone firewall endpoint while the return route points at the other.
Searches CloudTrail and surfaces the ReplaceRoute and CreateRoute calls by the same user, about a minute before both alarms fired.
Reports the root cause as that asymmetric routing change. Recommends restoring symmetric same-Availability-Zone routing so egress and return traverse the same endpoint.
Presents this as a plan you review and apply, not an automatic change.
A mitigation plan is a recommendation you review, not an automatic change, and the right fix depends on the intended design. Restoring symmetric routing can mean sending the workload subnet’s egress back through its own-Availability-Zone firewall endpoint (this sample’s architecture) or, in a design that doesn’t inspect this path, back through a NAT gateway. The agent infers a plausible target from what it can observe, so review the specific route it proposes against your intended topology before you apply it. (Connecting your pipeline or infrastructure-as-code, covered in the next section, lets the agent recommend the target that matches your design.)
In the DevOps Agent Operator Web App view, the agent restates the Alarm-3 (AsymmetricFlowFailures) trigger and confirms the workload’s egress to a monitored endpoint is being blocked by the Network Firewall (Figure 14).
Figure 14: Scenario 3 – The symptom
Next, the agent identifies the root cause: manual route table changes that created cross-AZ asymmetric routing through the network firewall, breaking its symmetric routing requirement (Figure 15)
Figure 15: Scenario 3 – The root cause
Finally, the agent presents a mitigation plan, recommending you restore symmetric routing by pointing protectedSubnet1‘s default route back to the same Availability Zone firewall endpoint, so one endpoint sees both directions of the flow again (Figure 16).
Figure 16: Scenario 3 – The mitigation plan
Confirm recovery. Apply the change the agent recommends, after checking the route target matches your intended design. After the workload subnet’s egress and return use the same Availability Zone firewall endpoint again, the control probe recovers, the alarms clear, and every card returns to green.
Further considerations
In production a single change can trigger several alarms at the same time, as Scenario 3 shows. DevOps Agent links related investigations and works them as one, so you review a single root cause. You can validate the linked findings or unlink an alarm to investigate it independently. If you would rather collapse alarms before they reach the agent, you can add correlation logic in the bridge Lambda function, buffering and grouping by firewall. You can also add email, Amazon Simple Queue Service (Amazon SQS), or HTTP subscribers to the SNS topic, or add the webhook Lambda function to a topic you already run. DevOps Agent produces a mitigation plan but does not change your environment on its own.
You can also give the agent more to work with. DevOps Agent connects to source repositories and CI/CD pipelines, integrating with GitHub (including GitHub Enterprise Server and GitLab Self-Managed through a private connection). It can associate AWS resources with deployments of AWS CloudFormation, AWS CDK, Amazon Elastic Container Registry (Amazon ECR) images, and Terraform. With deployed configuration and recent deployment events in view, the agent correlates the disruption against the change that introduced it and recommends a fix matching your intended design. For this sample, that means recommending the workload subnet’s own Availability Zone firewall endpoint rather than a generic symmetric path.
DevOps Agent also supports proactive incident prevention. It analyzes patterns across past investigations and delivers recommendations to prevent similar issues from recurring, including governance recommendations that strengthen deployment processes and pipeline controls. For Network Firewall rule changes, this means the agent can recommend guardrails for your CI/CD pipeline based on the classes of misconfigurations it has already resolved. You can access these recommendations through the Improvements page in the DevOps Agent Operator Web App.
Clean up
Clean up the environment with one command.
bash scripts/destroy.sh
It reverts any active scenario, runs cdk destroy for all stacks, and sweeps for stragglers by the Project = nf-devops-agent tag. The main cost drivers are the two Network Firewall endpoints, the NAT gateways (one in the main VPC for each Availability Zone, one in the test-endpoint VPC), and the test endpoint’s load balancers. Each of these bills at an hourly rate for as long as it’s provisioned, whether or not traffic is flowing, so a stack left running continues to accrue charges around the clock even while idle. Running the scenarios and tearing the stack down the same day limits the cost to a few active hours rather than days of idle hourly charges.
Conclusion
In this post, we showed you how AWS DevOps Agent accelerates troubleshooting for three common network firewall connectivity issues. The first was a domain deny list. The second was a stateless priority inversion. The third was an asymmetric cross-AZ routing drop. For each one, DevOps Agent investigated the drop and returned a root cause with a mitigation plan you approve before applying. The first scenario triggered on a prebuilt Network Firewall metric, and the other two on application health metrics. That shows both ways to alarm on a firewall problem through one pipeline.
AWS WAF classifies web traffic by attaching metadata to each request it evaluates. Managed rule groups such as AWS WAF Bot Control and AWS WAF Fraud Control account takeover prevention (ATP) attach labels that describe what they found. A label can record that a request came from a known bot category or that it matched a credential-stuffing pattern. You can forward that metadata to your origin as request headers, which gives your backend visibility into the decisions AWS WAF made at the edge. You can also use labels to build tiered policies: a low-confidence bot signal might trigger a CAPTCHA challenge, whereas a high-confidence signal blocks the request outright.
With the AWS WAF AI Activity Dashboard, launched February 24, 2026, Bot Control now identifies more than 650 bots and agents, including search engine crawlers, data collectors, AI assistants, and large language model (LLM) training crawlers, which is ever increasing over time. In an earlier post, we showed how to group Bot Control labels into confidence levels and use them to drive adaptive user experiences in your application. That approach works well when you can list the labels you care about. After the catalog grows past what you can reasonably enumerate, writing a rule for each label becomes a maintenance burden and consumes rule capacity you’d rather spend elsewhere.
With dynamic label interpolation, you can reference labels by namespace instead of by individual name, so a single rule resolves to whichever labels matched during evaluation with no requirement to enumerate each one. You write a ${namespace:} clause in a header value or custom response body, and AWS WAF substitutes the matched values at evaluation time. The feature also gives you synthetic labels you can embed directly in responses, including the client IP address, request JA3 and JA4 fingerprints, and WAF request ID. The rest of this post explains how interpolation resolves labels by referencing four scenarios: forwarding classification data to your application, building custom block and challenge pages, redirecting traffic to a verification step, and segmenting Amazon CloudFront caches by bot category.
Interpolation syntax and behavior
Dynamic label interpolation uses a ${namespace:} syntax that resolves label values at evaluation time. You can use it in three places:
Where
What it does
Syntax
Custom request headers
Inserts resolved label values into headers that AWS WAF forwards to your origin. For example, set X-Bot-Category to so your application receives the matched bot category directly.
in the header value field
Custom response bodies
Embeds label values and synthetic labels (such as client IP or request ID) in block pages, challenge pages, and other custom responses.
in the response body Content field
Custom response headers
Insert label values into response headers (for example, Location for redirects).
in the response header Value field
In each case, AWS WAF reads the labels attached to the request and substitutes the resolved values into the string you provide.
The interpolation syntax
Include a ${namespace:} clause anywhere you would normally put a header value or custom response body. The trailing colon is what signals interpolation, telling AWS WAF to resolve every label in that namespace rather than match a single named label. AWS WAF evaluates each clause against the labels on the request and follows three rules:
Single match – The clause resolves to the label’s terminal value. If the request carries awswaf:managed:aws:bot-control:bot:category:scraping, then ${awswaf:managed:aws:bot-control:bot:category:} resolves to scraping.
Multiple matches – AWS WAF strips the namespace prefix and returns the values as a comma-separated list, such as scraping,advertising.
No match – The clause resolves to an empty string.
This is backward compatible. AWS WAF only interpolates a value when it contains a ${...} clause, so anything else passes through unchanged. There are no new API fields to set because the syntax is written directly into your existing string values. AWS WAF label namespaces are already colon-delimited (for example, awswaf:managed:aws:bot-control:bot:category:), meaning the required trailing colon won’t collide with header values that don’t follow that pattern.
Synthetic labels
Not every value you might want comes from a rule match. Synthetic labels are derived from the request itself, such as the client’s IP address, the AWS WAF request ID, or the TLS fingerprint, and you interpolate them with the same syntax.
Synthetic label
Description
${awswaf:request_id:}
The unique AWS WAF request identifier
${awswaf:ip:}
The client IP address
${awswaf:ja3:}
The JA3 TLS fingerprint
${awswaf:ja4:}
The JA4 TLS fingerprint
Because synthetic labels work everywhere ${namespace:} interpolation does, you can mix them with namespace-based labels in a single value and pass both to your origin in whatever format suits your application.
The following examples use Bot Control labels, but interpolation isn’t limited to them. It works with most namespaces including labels from other AWS Managed Rules, such as account takeover prevention, account creation fraud prevention, and the IP reputation and anonymous IP lists, as well as labels from AWS Marketplace managed rule groups. This works with labels you custom define based on your own requirements in your own rules.
The same applies to custom labels you define in your own rules. Consider a configuration that classifies requests into tiers based on an API key header, where one rule applies the label and a second interpolates the namespace to forward the result. The first rule matches requests whose x-api-key header begins with pk_enterprise_ and applies the label app:tier:enterprise.
In rule_labels, you use the short label name, app:tier:enterprise, and AWS WAF prefixes it with the web ACL context to produce the fully qualified label awswaf:ACCOUNT_ID:webacl:WEBACL_NAME:app:tier:enterprise. A label match statement accepts the short namespace (app:tier:) however an interpolation reference must use the fully qualified the account and web access control list (ACL) context. The payoff is that you can add app:tier:standard, app:tier:trial, or other tiers later, and the forwarding rule picks them up with no changes.
Interpolation also reaches namespaces that the static model never could. Values like the browser fingerprint (awswaf:managed:token:fingerprint) and the unique browser ID (awswaf:managed:token:id) change from request to request, so you can’t write a rule for each one. With interpolation you forward them as ${awswaf:managed:token:fingerprint:} and ${awswaf:managed:token:id:}, which means you can perform in real time device-level tracking, session correlation, and fraud detection that depend on these token-derived signals.
Application signaling
An application signaling pattern uses the labels and forwards them to the origin as customer request headers. After the headers arrive, your application can see how AWS WAF classified the request and decide what to do with that verdict.
Enumerating each label individually doesn’t scale. The common protection level of Bot Control alone tracks more than 650 self-identifying bots and agents, from crawlers to AI data collectors to monitoring services, and targeted protection adds behavioral and machine learning (ML) detection for bots that don’t announce themselves. Mapping only the known bot:category namespace to headers would take hundreds of rules, each one identical except for a hardcoded value. If you followed steps in the blog post How to use AWS WAF Bot Control for Targeted Bots signals and mitigate evasive bots with adaptive user experience, you’ve already mapped labels to confidence levels this way.
The following example forwards the advertising bot category as a header, one of the hundreds you would write to cover the namespace.
Interpolation collapses that into a single rule. The scope changes from LABEL to NAMESPACE, and the value uses a ${...} clause instead of a hardcoded string. When a request matches, each header resolves to whatever the managed rule group actually applied, whether that is advertising, scraping, or a category that doesn’t exist yet.
This rule matches on the bot:category namespace, then forwards several related namespaces alongside it as separate headers. A more detailed analysis of The x-waf-bot-signals header shows multi-value resolution: the signal: namespace can hold several labels at one time, such as non_browser_user_agent and automated_browser, and they resolve to a comma-separated list. The x-waf-fingerprint and x-waf-token-id headers carry token-derived values unique to each device, which your origin can use for session correlation and fraud detection. And x-waf-client-ip uses a synthetic label to pass the client IP as AWS WAF sees it.
Using these headers, your application can make decisions that AWS WAF can’t make on its own. A signed-in customer flagged with a bot signal might get a simplified page or a different backend, whereas an anonymous session carrying the same signal is blocked outright. A request with several bot signals during a flash sale might be pushed down a queue rather than rejected. A load balancer or API gateway can read the headers and route to different origin pools, sending search_engine traffic, for instance, to a rendering service tuned for crawlers.
These headers are also available to Amazon CloudFront Functions so you can configure custom logic before the request ever reaches your origin.
AWS WAF supplies the signal, and your application supplies the judgment with AWS planning to keep extending this pattern with more detection signals at the edge and more ways to act on them in your application.
Custom block and challenge pages with debug information
False positives are an unavoidable cost of bot mitigation, and the harder problem is usually diagnosing them after they have occurred. Synthetic labels assist with this by embedding the client IP and the AWS WAF request ID in a custom response body, and you give blocked or challenged users a concrete reference to quote when they report a problem. The same approach works for a block page, a CAPTCHA challenge, or a silent challenge because each one supports interpolation in its response body.
{
  "CustomResponseBodies": {
    "BlockPage": {
      "Content": "Your request was blocked.\n\nIP: ${awswaf:ip:}\nRequestID: ${awswaf:request_id:}\n\nIfyou believe this is an error, contact support with the Request ID above.",
      "ContentType": "TEXT_PLAIN"
    }
  }
}
This helps your support workflow because a user who reports they’re blocked can give you the request ID from the page. You search the AWS WAF logs for that ID, look at the rules and labels that matched, and decide whether it was a false positive. There’s no requirement to go back to the user and ask them to reproduce the issue or guess when it happened. For applications where a wrongful block is costly, that shortcut between the user’s screen and your logs is worth building in.
Verification redirects with embedded context
Sometimes the right response isn’t a block but a detour sending suspicious traffic to a verification page before letting it continue. You can build this with AWS WAF by interpolating the client IP and request ID into the redirect target, which is shown in the following example.
The Location header resolves to an example such as /verify?ip=203.0.113.42&rid=a1b2c3d4-.... The verification endpoint can use the IP for a geo or rate-limit check and the request ID to align the visit with your AWS WAF logs, then send the user on when they pass. Because the redirect is constructed in AWS WAF, you get this behavior without touching the origin application.
CloudFront cache segmentation with AWS WAF labels
When AWS WAF is used in front of Amazon CloudFront, a header that a rule inserts is available to CloudFront when it computes the cache key, which means you can configure and segment your cache by classification. You can interpolate the bot category into a custom header to instruct CloudFront to include that header in the cache key and keep a separate cached response per category. The x-waf-bot-category header from the example forwarding rule above performs this action.
To put this into context, a search_engine request gets a pre-rendered, edge-cached version of the page built for crawling, and if there is a request with no bot label, this request gets the full dynamic page. A scraping request gets a minimal response, also from cache. Crawlers receive indexable content, scrapers stop consuming origin capacity, and human visitors notice no difference. After the first request in each category, all subsequent requests are served from the edge.
You can run the same approach at the origin instead for finer control over freshness. Configure your application to read the classification header and set Cache-Control accordingly and use no-store for unlabeled human traffic to provide fresh content, and longer TTLs for bot-targeted responses so they stay at the edge and off your origin. Which layer you choose depends on how much of this logic you want in CloudFront compared to your own code.
Conclusion
Dynamic label interpolation doesn’t change how labels work, it changes how much rule configuration you need to act on them. A namespace that used to take one rule per value now takes one rule total, and it keeps working as the Bot Control catalog grows past its current 650-plus entries. Along the way, you pick up request-specific block pages, redirects that carry their own context, and cache segmentation keyed on classification. None of these capabilities is dramatic on its own, but when you put them together, you can pair edge classification with judgment in your application.
The feature fits AWS WAF the same way you already use it, with no breaking changes, making adoption a matter of editing rule configurations rather than rebuilding anything. AWS will improve these features in the future by adding detection signals and interpolation capabilities. If you build something with this or would like to see a use case covered in a future post, let us know. You can contribute examples to the AWS Samples repository, start a discussion on AWS re:Post, or leave a comment.
Using the URL of this post, you can enter the following examples as prompts in your coding assistant to use this new feature in your preferred environment.
“Using the patterns in the blog post, review my current AWS WAF configuration and identify which static label-to-header mappings can be replaced with dynamic interpolation rules.”
“Create a minimal WAF WebACL (CDK or AWS CloudFormation) with one rule that forwards Bot Control labels to the origin as request headers using `${namespace:}` syntax.”
“Using the AWS Sample referenced in this post, add a new rule that demonstrates dynamic label interpolation with a different managed rule group such as account takeover prevention.”
“My `${namespace:}` interpolation resolves to an empty string. Walk me through the debugging steps: verify the label namespace, check rule priority ordering, and confirm the fully qualified namespace for custom labels.”
“Design a CloudFront cache segmentation strategy using WAF dynamic label interpolation. Include the WAF rule and the origin-side Cache-Control header approach.”
If you have feedback about this post, submit comments in the Comments section below.
The new Amazon GuardDuty investigation agent (now in public preview) investigates security findings across your Amazon Web Services (AWS) environment, reducing investigation time from hours to minutes.
GuardDuty is our managed threat detection service that continuously monitors your AWS accounts and workloads for suspicious, potentially malicious activity, and unauthorized behavior, delivering detailed security findings for visibility and remediation.
Whether you’re investigating a single suspicious finding or assessing security posture across your entire organization, the investigation agent provides structured assessments providing risk levels, confidence scores, and actionable recommendations.
Security teams can spend hours investigating security findings and correlating data across multiple tools. The GuardDuty investigation agent automates this correlation, providing actionable intelligence, built directly into GuardDuty and accessible on demand through the AWS Management Console, AWS Command Line Interface (AWS CLI), AWS APIs, or AWS SDKs.
This post shows you how to:
Enable the investigation agent in your GuardDuty console.
Create your first investigation through the console or AWS CLI.
Use the investigation agent with the AWS MCP server for AI-assisted security operations
Key features of the GuardDuty investigation agent
The GuardDuty investigation agent provides APIs using the same patterns you already know from GuardDuty. Each completed investigation returns a risk level, confidence assessment, MITRE ATT&CK®technique mapping, resource mapping, and prioritized recommendations.
You can scope investigations from the console for a specific finding, an account, or all accounts across your organization. Alternatively, the AWS CLI and API accept a free-form trigger prompt of up to 2,048 characters, so you can describe what to investigate in natural language and guide the analysis of the agent by specifying areas of concern, suspected root causes, or priorities for the investigation.
The investigation agent APIs are also available through the official AWS MCP server, part of the Agent Toolkit for AWS, enabling integration into your existing security toolchains and AI-powered workflows. You don’t need to manage or interact with the agent directly. Call API endpoints, and the agent investigates findings, correlates evidence, and delivers an assessment without the overhead of managing complex configurations.
How the investigation agent analyzes findings
When you create an investigation, the agent uses cross-Region inference to process your findings based on scope and produces a structured output.
Cross-Region inference – GuardDuty investigation uses the Cross-Region Inference Service (CRIS), which selects the optimal AWS Region within your geography to process the investigation assessment. Your data remains stored only in the Region where the investigation request originates. However, investigation data and summary results might be processed outside that Region. Data is transmitted encrypted across the secure network provided by Amazon.
For more information about which inference Regions your request might be routed to see the Cross-Region inference routing table located in the investigation section of the Amazon GuardDuty User Guide.
Investigation output – Each completed investigation produces the following insights: Risk level (Info, Low, Medium, High, or Critical), Confidence (Unknown, Low, Medium, or High), Summary (description of findings and key observations), Investigation Details (additional context), and Recommended Actions (detailed actions including AWS CLI commands).
Account scoping – Account specification is required only when investigating a specific member account. For broaderscopes such as your entire organization, no account ID is needed. The agent will only investigate findings within accounts you’re authorized to access per the authorization model that follows.
Prerequisites
Before you get started, make sure you have the following prerequisites in place:
Amazon GuardDuty enabled in your account
AWS account in a supported Region (see Availability section)
Required IAM permissions
You will need three new permissions: guardduty:CreateInvestigation to start new investigations, guardduty:GetInvestigation to retrieve results, and guardduty:ListInvestigations to view investigations for a given detector.
Administrator accounts can create investigations, retrieve results, and view investigation lists for themselves and their member accounts. Member accounts can only retrieve results and view investigation lists for their own account. Member accounts can’t create investigations and can’t access investigations belonging to other accounts or the administrator account. Account specification is required only when investigating a specific member account. For your own account or accounts across your organization, no account ID is needed.
To enable and create your first investigation
Before you begin, verify you have the required IAM permissions as described in the prerequisites .
Open the AWS Management Console in the desired supported Region and navigate to Amazon GuardDuty.
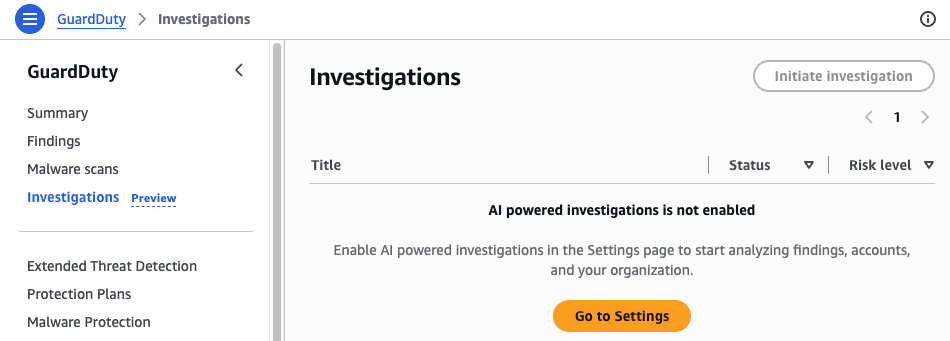
In the navigation pane, choose Investigations.
Figure 1: GuardDuty investigation dashboard
If investigations aren’t enabled choose Go to Settings and then enable investigations by choosing Enable.
After investigations are enabled, navigate back to the investigations page.
In the navigation pane, choose Initiate Investigation.
Figure 3: GuardDuty initiate investigation
Select a scope for your investigation:
Enter a GuardDuty Finding ID: Use when you want to investigate a specific GuardDuty finding in depth
Enter an AWS Account ID: Use when you want to assess the overall security posture of a specific AWS account
All accounts: Use for organization-wide security assessment or when investigating potential lateral movement
Choose Initiate investigation.
Figure 4: GuardDuty investigation setup
Wait for the investigation to complete (typically 2–5 minutes for account level and 10–12 minutes for specific finding investigations during preview). The status updates automatically.
When the investigation completes, select the investigation title to view the full assessment.
Figure 5: GuardDuty investigation completed menu
The investigation assessment contains detailed information about the investigation including general information, a summary of the investigation, mapping, assessment of the threat, and recommended actions.
The General Information section displays the investigation ID, status, triggered-by account, and creation timestamp.
Figure 6: General information section of the assessment
The summary section provides a narrative of key observations and findings.
Figure 7: Summary section of the assessment
The mapping section shows attack techniques and affected AWS resources.
Figure 8: MITRE ATT&CK mapping section of the assessment
The Threat Assessment section displays the risk level, confidence score, and detailed threat analysis.
Figure 9: Threat assessment section
The Recommended Actions section lists prioritized remediation steps.
Figure 10: Recommended actions section of the assessment
Investigations can also be conducted with the AWS CLI or SDK using the following API endpoints:
CreateInvestigation – Initiates a GuardDuty investigation that automatically analyzes security findings, correlates related activity, performs account-level analysis, and produces a structured investigation summary with recommended next steps.
GetInvestigation – Retrieve the status and results of a specific investigation, including the assessment from the agent, correlated evidence, and recommended actions when completed.
ListInvestigations – View investigations across your environment with filtering and pagination.
To run investigations using the AWS CLI
Investigations are asynchronous because the agent queries multiple data sources, correlates findings across services, and performs AI-based analysis. After creating an investigation, you’ll need to check its status periodically until it completes.
Step 1: Find your detector ID
Each GuardDuty deployment has a unique detector ID per-account and per-Region that identifies your specific GuardDuty configuration. You will need this for all AWS CLI operations, especially if you have GuardDuty enabled in multiple Regions. You can find your detector ID in the GuardDuty console under Settings, or by running the following command and specifying the Region. For example, if the GuardDuty detector of interest were in the us-east-1 (N. Virginia) Region
To investigate findings across an entire organization:
aws guardduty create-investigation –-region=us-east-1 \
--detector-id 12abc34d567e8fa901bc2d34eexample \
--trigger-prompt “Investigate findings across my AWS Organization”
Step 3: Check investigation status
Check the status of the investigation shown here using the AWS CLIquery command to filter and list only the Status section of the output for simplicity:
Timing –Investigation times can very. Checking status every 30 seconds should be sufficient to yield results.
If status shows FAILED –Review the error message in the response and verify your permissions match the authorization model requirements.
To list all investigations for a given detector run the following, the max-results command is optional but useful to filter the number of returned results.
Beyond running investigations manually, the API-first design addresses a common customer pattern: sending GuardDuty findings to third-party tools. You can now add automated investigation to those existing pipelines, so your team receives enriched, prioritized intelligence rather than raw alerts.
Consider a customer that routes GuardDuty findings through Amazon EventBridge to their Security Information and Event Management (SIEM) platform, where analysts manually investigate each alert. With the investigation agent, an AWS Lambda function can be placed into the pipeline that calls CreateInvestigation with the finding ID, waits for completion, and forwards the enriched results (risk level, confidence score, MITRE ATT&CK mapping, and recommended actions) to their SIEM alongside the original finding. Critical findings route directly to the customer incident response queue for further analysis or automation. Low-risk findings with high confidence get auto-closed or batched for weekly review. The analyst’s time shifts from repetitive log correlation to validating assessments and acting on confirmed threats.
This pattern works with SIEMs, ticketing systems, or automation platforms that can be customized to use the API or EventBridge messaging. The investigation agent fits into the pipeline as a processing step, not a destination.
The agent is fine-tuned on investigating GuardDuty findings. It’s distinct from other AWS frontier agents such as the AWS Security Agent and AWS DevOps Agent. The scope of the investigation agent is focused to deliver specialized analysis of GuardDuty findings.
Integration with the AWS MCP server
The Model Context Protocol (MCP) is an open standard that allows AI assistants to securely connect to external data sources and tools. Because the AWS MCP server implements this standard for AWS services, you can use it to add GuardDuty investigations into AI-powered workflows using tools like Kiro, Anthropic’s Claude, or other MCP-compatible clients.
To configure the AWS MCP server
Configure your MCP client to connect to the AWS MCP server.
Use natural language to invoke investigations (for example,“Investigate the recent Unauthorized Access finding for account 123456789012″).
Review the investigation results returned through your MCP client. These results can vary depending on the model or agent being used, configuration, and the non-deterministic nature of AI.
Integrate the results into your existing agent automation or take manual action based on the findings.
Additional usage examples
“Investigate the latest high-severity finding in my production account”
“Create an investigation for finding ID abc123 in account 987654321098 and summarize what happened”
“List investigations from the last 24 hours and flag those that need human review”
How the investigation agent relates to AWS Security Incident Response
At re:Invent 2024, AWS launched AWS Security Incident Response (AWS SIR), a managed service that you can use to quickly prepare for, respond to, and recover from security incidents. AWS SIR and the GuardDuty investigation agent address different stages of your security workflow. The GuardDuty investigation agent provides an on-demand assessment capability. When your team needs deeper context on a specific finding, an account security posture, or the overall security posture of your organization. You create an investigation and receive a structured assessment with risk levels, confidence scores, MITRE ATT&CK® technique mappings, and actionable recommendations. Security analysts can use this to quickly understand the scope and severity of what GuardDuty has detected.
When you create an AWS-supported case through AWS SIR, a SIR investigation agent activates, working in parallel with AWS Security Incident Response engineers to gather evidence and deliver an investigation summary within minutes. AWS SIR is purpose-built for active security events where you need both AI-powered automation and human expertise to coordinate containment and recovery.
Security teams can use these capabilities to assess and prioritize findings on demand using the GuardDuty investigation agent, escalate confirmed issues to stakeholders with supporting evidence, and create or update an AWS-supported case to accelerate involvement from the AWS SIR team when additional support is needed.
Availability and pricing
Public preview of the GuardDuty investigation agent is available in 10 AWS Regions including US East (N. Virginia), US East (Ohio), US West (Oregon), Canada (Central), Europe (Frankfurt), Europe (Ireland), Europe (London), Europe (Paris), Europe (Stockholm), and Asia Pacific (Tokyo).
During public preview, the investigation agent is available at no charge. Usage is limited to 10 investigations per account per day, with a cumulative limit of 100 investigations per account during the preview period. Failed investigations do not count toward these quotas.
Start investigating findings today
The Amazon GuardDuty investigation agent reduces investigation time from hours to minutes, letting your security team focus on confirmed security events rather than manual correlation.
Get started by:
Enabling the investigation agent in your GuardDuty console
Creating your first investigation using a recent GuardDuty finding
Reviewing the structured assessment, including risk level and recommended next steps
For organizations using the AWS MCP server, you can also invoke investigations through natural language in your AI assistant of choice.

 Login
Login