The HIPAA Security Rule’s Technical Safeguards (§164.312) define five standards and nine implementation specifications covering access control, audit controls, integrity, authentication, and transmission security.
The guidance also covers the 2025 NPRM proposed changes,including encryption at rest and in transit becoming required, multi-factor authentication (MFA) becoming mandatory for all electronic Personal Health Information (ePHI) access, and new specifications for network segmentation, configuration management, anti-malware protection, patch management, software removal, incident response and breach notification.
Key topics included
Shared responsibility for HIPAA on AWS – A responsibility matrix mapping each §164.312 specification to what AWS manages nd what the customer must configure and operate.
ePHI boundary architecture – Guidance on establishing a defined ePHI boundary
ePHI data flow and encryption – A reference architecture tracing ePHI with the applicable §164.312 specification
Foundation checklist – Prerequisite recommendation before configuring individual Technical Safeguard controls.
This guidance is written for cloud architects, security engineers, CISOs, and compliance teams at covered entities and business associates building or operating AWS healthcare workloads. It assumes familiarity with AWS services and is intended as a practical implementation reference, not a legal or regulatory interpretation. This guidance focuses exclusively on Technical Safeguards.
HHS published a Notice of Proposed Rulemakingin January 2025, proposing significant updates to the HIPAA Security Rule—including eliminating the Addressable designation, making encryption, MFA, and asset inventory mandatory, and introducing new technical requirements not present in the current rule. As of June 2026, the final rule has not been published. This guidance covers both the current rule and the proposed changes and recommends treating all specifications as Required for new workloads.
For questions about HIPAA readiness on AWS, including Administrative Safeguards, Physical Safeguards, risk analysis, and assessment preparation, contact the AWS Security Assurance Services teamor your AWS account representative.
This guidance is provided by AWS Security Assurance Services, LLC, a HITRUST External Assessor Firm and PCI-QSAC along with contribution from AWS HCLS, AWS Compliance teams. It is for informational and guidance purposes only and does not constitute legal, regulatory, or compliance advice. Recipients are solely responsible for determining applicability to their specific environments and legal obligations.
If you have feedback about this post, submit comments in the Comments section below.
Amazon Inspector is an automated vulnerability management service that continually scans Amazon Web Services (AWS) workloads for software vulnerabilities. The vulnerability management capabilities of Amazon Inspector are powered by an asset inventory engine known as the Amazon Inspector SBOM Generator (inspector-sbomgen), a standalone command-line tool that produces a software bill of materials (SBOM) from container images, directories, archives, local systems, compiled binaries, and more. Over the past two years, we’ve expanded inspector-sbomgen’s coverage across dozens of programming language ecosystems, operating systems, and widely deployed applications.
We’re pleased to announce a new capability for builders using inspector-sbomgen: a plugin system for writing your own custom package collectors that you can use right away, without requiring source code compilation nor waiting for an official release.
In this post, we walk you through what the inspector-sbomgen plugin system does, why we built it, and how you can write your first plugin in a few minutes. Along the way, we also cover how plugin-generated package components integrate with Amazon Inspector for vulnerability scanning, and we explore the plugin safety model, which helps ensure security-hardened and predictable plugin behavior.
Why we built a plugin system
Software ecosystems are dynamic. New language package managers, lockfile formats, and end user applications ship constantly, and many are adopted quickly, in some cases with little security scrutiny. That leaves security teams with a visibility gap: production workloads running software that their SBOM tooling doesn’t yet recognize. Customers have asked us to inventory many of these ecosystems directly, and until recently, the only path to support was to open a feature request and wait for the inspector-sbomgen team to onboard the ecosystem and deploy a new release.
The inspector-sbomgen plugin system changes that. With plugins, you can:
Onboard ecosystems that inspector-sbomgen doesn’t support out of the box. New open source ecosystems, niche or fast-moving package formats, and internal or proprietary tooling can all be inventoried without modifying inspector-sbomgen.
Prototype detection for an ecosystem quickly. We designed a plugin system that is friendly to developers and AI coding assistants alike. Plugins are written in Lua, loaded at runtime, and require no Go toolchain nor compilation. You can use the built in test harness to iterate on a plugin and see results immediately.
Build on a stable foundation. The plugin API abstracts away artifact-type differences, so you write your detection logic once and it works seamlessly across container images, archives, local systems, and more. And because plugins stay decoupled from the internals of sbomgen, the core tool’s regression surface stays small.
Internally, we’ve used the plugin system to ship new ecosystem coverage faster than before. In our 1.13 release, more than 20 ecosystems that were previously implemented in Go, including Apache Tomcat, NGINX, MySQL, Redis, WordPress, and the OpenSSH toolchain, are now embedded as plugins inside the sbomgen binary. The same release also added more than ten brand-new ecosystems as plugins, including Apache Cassandra, Apache Struts, Conda, Swift packages, and AI-agent collectors (Amazon Q Developer, Kiro CLI, Claude Code, GitHub Copilot, and Ollama).
How inspector-sbomgen plugins work
Sbomgen plugins follow a two-step pipeline:
Discovery – Scan the artifact’s file system to identify files that contain installed package metadata.
Collection –Open each discovered file, parse file contents, and publish findings into the SBOM.
Under the hood, an event bus connects discovery and collection plugins. Discovery plugins publish events listing discovered files, and one or more collection plugins subscribe to these events, triggering package collection. Developers might recognize this behavior as the observer pattern.
This decoupling lets a single discovery plugin feed multiple collectors, for example, one extracting package metadata, another scanning for secrets, and another checking policy. Each collection plugin works from the same file list without re-walking the artifact filesystem, a computationally expensive operation.
Write your first plugin in 5 minutes
Inspector-sbomgen makes it straightforward to bootstrap a plugin environment. The plugin new command tells sbomgen to create a new plugin workspace, and the —-with-example flag populates the workspace with a discovery-collection plugin pair, that you can run immediately.
inspector-sbomgen plugin new --with-example
After invoking the preceding command, you will be prompted to provide a plugin name and a directory that will contain your plugin workspace. You can provide custom values or use the default values:
Plugin name (identifies the software ecosystem your plugin will inventory, e.g. debian-dpkg, rhel-rpm, python-pip, cmake) [my-custom-ecosystem]: <enter>
Project directory [my-sbomgen-plugins]: <enter>

Created plugin "my-custom-ecosystem" in my-sbomgen-plugins/
Note that you can skip interactive prompts by specifying the plugin name and directory using the corresponding command line interface (CLI) arguments:
After creating your plugin workspace, inspector-sbomgen will display a next steps screen, which guides developers and AI code assistants to the source files they need to change and to supporting documentation:
Next steps:

  Get started:
    1. Open plugin folder in a code editor (VS Code recommended)
    2. Add test files that your plugin will discover and parse
       (e.g., config files, lockfiles, binaries, etc.):
       my-sbomgen-plugins/discovery/cross-platform/extra-ecosystems/my-custom-ecosystem/_testdata/

  Develop:
    3. Edit discovery:    my-sbomgen-plugins/discovery/cross-platform/extra-ecosystems/my-custom-ecosystem/init.lua
    4. Edit collection:   my-sbomgen-plugins/collection/cross-platform/extra-ecosystems/my-custom-ecosystem/init.lua

  Test:
    5. Write unit tests:  my-sbomgen-plugins/discovery/cross-platform/extra-ecosystems/my-custom-ecosystem/init_test.lua
    6. Run unit tests:    inspector-sbomgen plugin test --path my-sbomgen-plugins

  Deploy:
    7. Distribute your plugin directory wherever you run inspector-sbomgen:
       inspector-sbomgen <arguments> --plugin-dir /path/to/my-sbomgen-plugins

       Example:
       inspector-sbomgen container --image alpine:latest -o /tmp/sbom.json --plugin-dir /path/to/my-sbomgen-plugins

For code completion, install the VS Code Lua language server extension:
  https://luals.github.io/#vscode-install

For more information:
  - Plugin guide:    my-sbomgen-plugins/docs/sbomgen-plugin-developer-guide.md
  - Testing guide:   my-sbomgen-plugins/docs/sbomgen-plugin-testing-guide.md
  - API reference:   my-sbomgen-plugins/docs/sbomgen-plugin-api-reference.md
  - Documentation:   https://docs.aws.amazon.com/inspector/latest/user/sbom-generator.html
Now that you have a plugin workspace, let’s explore its contents in greater detail:
The scaffolded project includes a working discovery and collection plugin pair, passing unit tests with test fixtures under _testdata/, a .vscode/settings.json for integrated development environment (IDE) integration, and a local copy of the developer documentation.
The scaffolding is deliberately succinct and complete, so it reads well for both humans and AI coding assistants. Every file has clear comments that explain what each function does and what the plugin author needs to fill in.
To test a plugin, you first need something to scan, such as a package lock file or a compiled binary. The example plugin inventories a fictional example.lock with the following contents:
The provided discovery plugin knows how to look for instances of example.lock within the artifact file system:
-- my-custom-ecosystem discovery plugin
-- Discovers example.lock files in the artifact file list.

function discover()
    return sbomgen.find_files_by_name({"example.lock"})
end
And the provided collection plugin knows how to parse the contents of example.lock and publish package findings to the output SBOM.
-- my-custom-ecosystem collection plugin
-- Parses example.lock files and extracts package name and version.

function collect(file_path)
    local content = sbomgen.read_file(file_path)
    if content == nil then
        return
    end

    for line in content:gmatch("[^\n]+") do
        local name, ver = line:match("^(.+)==(.+)$")
        if name and ver then
            sbomgen.push_package({
                name = name,
                version = ver,
                purl_type = "generic",
                namespace = "my-custom-ecosystem",
                component_type = sbomgen.component_types.APPLICATION,
            })
        end
    end
end
Run the tests
Plugins ship with a built-in test framework so you can validate your logic before scanning a real artifact. Tests are written in Lua, live next to the plugin in init_test.lua, and reference fixture data in _testdata/:
function test_discovers_packages()
    local result = testing.scan_directory("_testdata")
    testing.assert_equals(3, #result.findings)
    testing.assert_equals("my-package-alpha", result.findings[1].name)
    testing.assert_equals("1.0.0", result.findings[1].version)
end

function test_no_findings_for_empty_directory()
    local result = testing.scan_directory("_testdata/empty")
    testing.assert_equals(0, #result.findings)
end
Run the tests with the following command:
inspector-sbomgen plugin test --path my-sbomgen-plugins -v

=== RUN   my-custom-ecosystem/discovery/init_test/test_discovers_packages
--- PASS: my-custom-ecosystem/discovery/init_test/test_discovers_packages (0.04s)
=== RUN   my-custom-ecosystem/discovery/init_test/test_no_findings_for_empty_directory
--- PASS: my-custom-ecosystem/discovery/init_test/test_no_findings_for_empty_directory (0.04s)
ok    2 tests passed
This is the tightest development loop we could design: no Go toolchain, no rebuild, no container spin-up. Write a test, run it, iterate.
Scan a real artifact
For plugins to produce findings, inspector-sbomgen needs an artifact that contains the files your plugin looks for. For the example plugin, any directory with an example.lock file works. The fixture we generated earlier is a good stand-in:
The --plugin-dir flag tells inspector-sbomgen where to load your Lua plugins from. The resulting SBOM contains a CycloneDX component for each of the three packages in example.lock, for example:
Every plugin-generated component carries an amazon:inspector:sbom_generator:source_path property that records the file the component was collected from, so you can always trace a component back to the artifact that produced it.
Vulnerability scanning with Amazon Inspector
Plugin-generated findings are first-class SBOM components. They work with every downstream consumer that reads CycloneDX SBOMs, including Amazon Inspector. To send an SBOM to Amazon Inspector for vulnerability analysis, add the --scan-sbom flag (this requires an active AWS account):
An important caveat when you onboard a brand-new ecosystem: Plugin authors can inventory arbitrary ecosystems, but Amazon Inspector can only report vulnerabilities for components it has advisories for. When you point Amazon Inspector at a component whose ecosystem isn’t in its advisory feeds yet, Inspector will return the component with a property, Component skipped: no supported rules found. For example:
This is expected behavior, not an error. The SBOM is still generated correctly, the component is still tracked, and the source_path tells you exactly which file produced it. If and when Amazon Inspector adds advisory coverage for the ecosystem, the same SBOM will start producing vulnerability findings without any change to your plugin. For ecosystems Inspector already supports, plugin-generated components are indistinguishable from components produced by built-in scanners.
First class IDE support
We care about productivity and efficiency when writing plugins. Writing Lua without modern conveniences such as autocomplete isn’t fun, so every plugin project scaffolded with the plugin new command ships with a library/sbomgen.lua definition file and a .vscode/settings.json that automatically wires it up to the Lua Language Server extension for VS Code.
For code completion and IDE support, first install the sumneko.lua extension, open your plugin project in VS Code, and every sbomgen.* function will get:
Parameter hints with types.
Hover documentation.
Autocomplete for constants (sbomgen.component_types.*, sbomgen.groups.*, sbomgen.platform.*).
Type checking on function calls.
Inline warnings when required fields are missing from push_package().
The same definition file makes plugin development work well with AI coding assistants. The types and documentation are embedded in a form that tools can read, so assistants can generate correct plugin code with far less monitoring than writing against a raw language would require.
A safe foundation
Plugins run real code inside the same process as inspector-sbomgen, so we designed the execution environment to keep that code stable and security-hardened. Every Lua plugin runs in an isolated sandbox. Every Lua virtual machine (VM) has access to a restricted subset of the Lua standard library to ensure only safe operations are permitted:
No direct filesystem access. The Lua io library isn’t loaded. All file operations go through sbomgen.* functions, which route through sbomgen’s internals so your plugin behaves identically whether it’s scanning a directory on disk, a container image, a compressed archive, or a mounted volume.
No subprocess execution or environment mutation. The Lua os library is blocked, so plugins can’t spawn processes, modify environment variables, or touch files outside the artifact.
No VM introspection. The Lua debug library is blocked.
No unbounded code loading.dofile, loadfile, and loadstring are removed. require() is available but restricted to the plugin’s own directory tree, so plugins can share helper modules with themselves but cannot load code from other plugins or system paths.
If a plugin raises an unhandled Lua error, inspector-sbomgen logs a warning and continues with the next file or plugin; one faulty plugin does not prevent other plugins from running. Plugins never override inspector-sbomgen’s built-in package collectors. Every plugin must declare a unique name. If a custom plugin uses a name that’s already claimed by an official built-in plugin, the custom plugin is skipped with a warning. Built-in plugins always take precedence, so a custom plugin can never silently replace or shadow the tool’s own detection behavior.
Whether you’re adding support for an internal lockfile format, prototyping detection for a new open source ecosystem, or replacing a home-grown scanner with something your whole organization can run at scale, the plugin system is designed to make the path from idea to working SBOM as short as possible. We can’t wait to see what you build with it. If you have feedback about this post, submit comments in the Comments section below. If you have questions about this post, contact AWS Support.
If you use and install packages from npm or PyPI, the first hours after a package is published are the riskiest because scanners can’t analyze packages before publication. Recent supply chain events affecting NodeJS and Python packages have been detected and removed within hours. However, while those packages were available to the general public, it’s possible that they were installed by users, creating the potential for a security incident. As you will see from the data that follows, if users had waited 1 day before accessing those packages, none of the recent supply chain security events would have had an impact.
In this post, I show you a one-line configuration that you can use to eliminate this exposure in your environment: a dependency cooldown for npm and pip. This change tells your package manager to skip versions published in the last 24 hours, giving the security community time to detect and remove unexpected packages before they reach your systems. These settings secure the default setup. There’s another use case of package updates: receiving security fixes to address security risks. This process involves updating packages to a more recent version. I also show you how to override the cooldown configuration so you can install the latest security patches while newly installed package updates are delayed. We recommend that you assess the severity of code defects and apply security fixes if there’s known risk. Handling security fixes based on their severity—and how to specify SLAs for these fixes based on severity—is beyond the scope of this blog post.
Background: Two risks pull in opposite directions
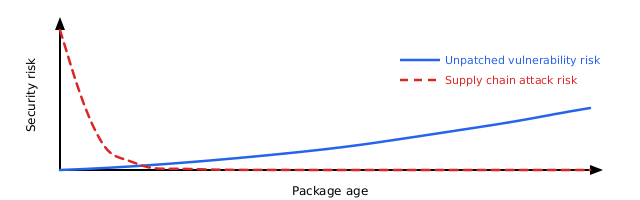
Software delivered by Amazon Linux packages go through review by Amazon package maintainers and pass guardrails before release. Open source software is developed and maintained with similar processes and guardrails. The npm and PyPI registries have open publishing access and don’t enforce reviews. Unexpected packages are potentially added to the registries because of risks like impersonation or stolen credentials. You’re caught between two risks: older software accumulates unpatched vulnerabilities, while new packages potentially contain unexpected vulnerabilities that haven’t been detected yet. The best approach is to stay current without adopting the newest releases immediately, while applying recommended security fixes. The following diagram illustrates the relation between the two types of risks in an abstract way, where the supply chain risk is highest immediately after a package is published, because unexpected updates can potentially bypass guardrails. After a package is published, auditing can review it and identify potential defects over time. If no security fixes are applied, the risk of all the code defects adds up.
Figure 1: Software risk over lifetime. Unpatched vulnerabilities risk increases over time. Very recent software also carries more supply chain risk.
The problem: The first day presents the highest risk
Supply chain events follow a consistent pattern. An unexpected author publishes an unexpected package or package version and waits for automated systems and users to pull it in. Security researchers and automated scanners typically detect and remove these packages within hours, but by then, systems have been exposed to the risk.
Datadog’s 2026 State of DevSecOps report found that 54% of JavaScript applications install at least one dependency within a day of its release. That’s the time window that presents the highest supply chain risk. Recent events show how fast detection happens:
Event
Exposure window
Nx s1ngularity (Aug 2025)
4–5 hours
axios (Mar 2026)
2–3 hours
Bitwarden CLI (Apr 2026)
93 minutes
TanStack (May 2026)
30 minutes
node-ipc (May 2026)
less than 24 hours
The solution: Skip packages published today
A dependency cooldown tells your package manager to skip recently published versions. If a version hasn’t existed on the registry for the configured timespan, for example, 1 day, it won’t be installed, giving the security community time to detect and remove unexpected versions.
A 1-day cooldown blocks each event listed in the preceding table. Notably, several of these events produced valid provenance attestations and passed build verification. These provenance checks alone didn’t stop them. A cooldown works independently of authorization mechanisms, because it blocks by age rather than by trust.
Both npm (v11.10.0+) and pip (v26.1+) support cooldowns . Amazon Linux 2023 ships these packages in NodeJS 24 and Python 3.14 since release 2023.11.20260608.
If you use lockfile-based installations through npm ci or pip install -r requirements.txt with pinned versions, you won’t pull latest package updates. The cooldown doesn’t apply to those installations. The cooldown only affects resolution of new or updated packages. See the Lockfile-based installs and the cooldown section for details.
Prerequisites
To implement the following solution, you first need to have the following prerequisites in place:
Node.js 24 with npm 11.10.0 or later (in nodejs24-24.14.1-1.amzn2023.0.1 or later).
Python 3.14 with pip 26.1 (in python3.14-pip-26.1.1-1.amzn2023.0.1 or later)
pip-audit (tool to scan python packages required for defect-based override scripts). Use python3.14 -m pip install pip-audit to install.
Future versions of Node.js and Python will bring new commands. The following tool commands work for Amazon Linux 2023 with Node.js 24 and Python 3.14. The provided commands target specific package versions. Adjust the commands if you use later releases.
To set up the npm cooldown
Create the global configuration directory, depending on your NodeJS version. sudo mkdir -p /usr/lib/nodejs24/etc
Add the npm configuration file with the cooldown setting. sudo npm-24 config set min-release-age 1 --location=global
Check that the cooldown is active by running the next command. npm-24 config list
You will see before = "<timestamp from 24 hours ago>" in the output, confirming npm converted the 1-day cooldown into a date filter. For more information, see the npm min-release-age documentation.
To set up the pip cooldown
Create the system-wide pip configuration file with the cooldown setting. sudo python3.14 -m pip config set --global global.uploaded-prior-to P1D
Verify the configuration (for Python 3.14 and pip 26.1+). python3.14 -m pip config list
You will see global.uploaded-prior-to='P1D' in the output.
This configuration is safe to deploy immediately, because older pip versions (25.x) silently ignore the setting.
To install a package’s latest version without cooldown
What if you want to install the latest version of a package, for example to receive security fixes? The following sections describe how to override the flag using the tool command line. To identify which packages need urgent updates, run the appropriate audit command for your package manager.
npm auditor python3.14 -m pip_audit
For npm packages
Install the package with the cooldown override. npm-24 install <package-name> --min-release-age=0
For pip packages
Install the package with the cooldown override. python3.14 -m pip install <package-name> --uploaded-prior-to="P0D"
Update packages that need urgent updates
We recommend that you apply security fixes for packages that have known security risks. You don’t need to turn off the cooldown entirely to apply security fixes. Use the audit tools to identify packages with known issues, then override the cooldown for only these packages.
Prerequisites: Ensure you have Python 3 and pip-audit installed (python3.14 -m pip install pip-audit).
Important: These scripts demonstrate the concept. For production use, add error handling, logging, and testing. Review packages before updating them in automated pipelines.
For npm packages
The following script demonstrates the required steps to identify npm packages with a known security fix. The npm audit command prints these packages as JSON. Next, packages in this list are updated with an npm install command, where their cooldown is overridden so that the latest version is picked up.
npm audit --json | python3 -c "
import json, sys, subprocess
data = json.load(sys.stdin)
for pkg in data.get('vulnerabilities', {}):
    subprocess.run(['npm-24', 'install', f'{pkg}@latest', '--min-release-age=0'])
"
For pip packages
The following script demonstrates the required steps to identify pip packages with a known security fix. The pip_audit command prints these packages as JSON. Next, all packages in this list are updated with an pip install command that overrides the cooldown so that the latest version can be picked up.
python3.14 -m pip_audit --format=json | python3.14 -c "
import json, sys, subprocess
from packaging.version import Version
data = json.load(sys.stdin)
for dep in data.get('dependencies', []):
    pkg = dep['name']
    vulns = dep.get('vulns', [])
    if not vulns:
        continue
    fix_versions = [v for vuln in vulns for v in vuln.get('fix_versions', [])]
    if not fix_versions:
        print(f'{pkg}: vulnerable but no fix published, skipping')
        continue
    fix = max(fix_versions, key=Version)
    print(f'Updating {pkg} -> {fix}')
    subprocess.run(['python3.14', '-m', 'pip', 'install', f'{pkg}=={fix}', '--uploaded-prior-to=P0D'])
"
Lockfile-based installs and the cooldown
If you use npm ci or pip install -r requirements.txt with pinned versions, the cooldown doesn’t apply. These commands install what the lockfile specifies, regardless of package age. The cooldown only affects resolution of new or updated packages.
Industry adoption: Cooldowns are now used across PyPI and NodeJS
Major package managers and enterprises have started to adopt dependency cooldowns. As of May 2026, several popular package management tools now include cooldown features: pnpm (a fast Node.js package manager), Renovate (an automated dependency update tool), and StepSecurity (a supply chain security platform).
pnpm 11 ships with minimumReleaseAge enabled by default. It’s one of the first major package manager to make cooldowns opt-out rather than opt-in.
Renovate’sconfig best-practices preset has included a 3-day npm cooldown since 2025 and is widely adopted across enterprises.
StepSecurity Secure Registry uses a configurable cooldown period for enterprise customers. StepSecurity recommends a 10 day delay as default.
How AWS is helping protect the open source supply chain
AWS scans upstream package registries to catch unexpected packages before they reach customers.
Amazon Inspector, a security management service that continuously scans workloads for software vulnerabilities and network exposure, uses AI-assisted detection rules to scan upstream package registries. In 2025, Amazon Inspector researchers identified over 150,000 unexpected npm packages linked to a token farming campaign.
Unexpected packages are typically caught within hours of publication. A 1-day cooldown ensures you don’t install them during that detection window.
Recommendations
To secure your Amazon Linux 2023 configuration:
Set a 1-day cooldown for npm and pip as shown in the preceding sections. External registries don’t have human review, so give the defenders time to catch problems.
Override when needed for urgent security patches using the per-command flags.
Run npm audit or pip_audit regularly to identify packages that need immediate attention.
Set up the cooldown with one line of configuration, and the protection is immediate.
Conclusion
By implementing the solutions presented in the post, you secure your npm and PyPI environment from most instances of unexpected code. The update delay of 1 day protects your environment, while still allowing to apply the latest security fixes. To learn about how to protect your environment further, see the following resources:
July 29, 2026: We’ve updated this post to clarify the AWS Firewall Manager migration path.
Application-layer distributed denial of service (DDoS) attacks are difficult to detect because they closely resemble legitimate traffic. HTTP request floods are now among the most common vectors targeting web applications, using valid-looking requests that blend in with normal user activity.
In June 2025, AWS launched the AWS WAF Anti-DDoS managed rule group, built specifically for application-layer (L7) DDoS protection. AWS Shield Advanced is adopting it as the default application-layer protection, and in time as the only one. On July 27, AWS Shield Advanced begins adding the Anti-DDoS managed rule group to eligible web access control lists (ACLs) in Count mode. It will not cause any interruption to your traffic alongside your existing L7 automatic mitigation and WAF rules. In this blog post, we provide details regarding the Anti-DDoS managed rule group and when the change is expected to reach your web ACLs. You will understand the phases and steps that you need to take before the finish date, including how the monitoring and metrics will change.
Anti-DDoS managed rule group features
The Anti-DDoS managed rule group builds on what Shield Advanced automatic mitigation already provides. It profiles your traffic, learns what normal traffic looks like for your application, and establishes a baseline in minutes rather than hours. When an attack starts, it reacts within seconds and there are no health checks to configure. The rule group adds a Challenge action to the Block and Count actions you already use. Challenge decisions are driven by the AMR labels that mark the suspicion level of each inspected request. One option is a silent browser challenge, which has a background verification that runs in the visitor’s browser with no interstitial page, so legitimate users are never interrupted while automated traffic is filtered out. You can also exclude workload paths that don’t support Challenge, which fall back to Block mitigations instead. Sensitivity is configurable to Low, Medium, or High, and you set it separately for Block and Challenge. Block and Challenge are tuned independently; meaning you can run Challenge at high sensitivity to catch more suspicious traffic while keeping Block low to avoid dropping legitimate requests or reverse it for a stricter posture.
The rest is about cost and visibility:
It uses less capacity than before. The rule group needs 50 web ACL capacity units (WCUs), down from the 150 the previous protection required, providing you with capacity for the rest of your rules.
The dashboard ships in the AWS Management Console for AWS WAF. It’s there now, showing live DDoS events, match metrics, and the top URIs, geographies, and IP addresses driving traffic.
It labels everything it inspects. Requests get labels for event-detected, graduated suspicion levels, and specific rules. Match on those labels in your own AWS WAF rules when you need logic the rule group doesn’t cover.
You don’t pay for the attack traffic. During active mitigation, blocked DDoS requests drop out of your monthly count. That exclusion covers AWS WAF request fees, Anti-DDoS managed rule group request fees, and Shield Advanced request charges.
AWS Shield Advanced isn’t required to use any of these features. Shield Advanced subscribers get the rule group included with AWS WAF and any customer can turn it on independently. See AWS WAF pricing for more information on costs.
Implementation details
Shield Advanced upgrades application-layer DDoS protection in five phases. The following dates are when AWS will act automatically, not the earliest date when you can act. After the rule group is deployed in Count mode on July 27, 2026, you can begin migrating right away rather than waiting for the October auto-upgrade. There’s no window where protection lapses. Your current automatic mitigation stays active through every phase until the Anti-DDoS managed rule group takes over. That handoff happens in a single operation, with no cutover window and no gap for your traffic flows.
Phase 1: Anti-DDoS managed rule group deployed in Count mode (rolling out July 27–August 7, 2026)
AWS adds the Anti-DDoS managed rule group in Count mode to every web ACL eligible for this rollout. Eligible means any Shield Advanced web ACL with at least one resource using application-layer automatic mitigation that isn’t already running the Anti-DDoS rule group. This is a broader set than the web ACLs eligible for the October auto-upgrade (Phase 3), which applies a stricter test. The deployment rolls out gradually, starting July 27 and expected to finish by August 7, 2026, so different web ACLs might be updated on different days. There’s no impact to your traffic because the rule group watches and labels requests without acting on them while your existing automatic mitigation keeps running. Throughout the evaluation period, you receive DDoS events, metrics, and AWS WAF labels at no additional charge.
Phase 2: Free evaluation period (July 27–September 30, 2026)
The existing automatic mitigation and the Anti-DDoS managed rule group run side by side each detecting independently. Automatic mitigation continues to protect your resources while the rule group operates in Count mode. To compare their detection results, use the DDoSAttackRequests metric, AWS WAF labels, and the Anti-DDoS dashboard. All Anti-DDoS managed rule group charges are waived during this period, including the subscription fee, per-request fees, and WCU consumption costs for the eligible web ACLs from phase 1.
Phase 3: Auto-upgrade begins (October 1, 2026)
For eligible web ACLs, the auto-upgrade mirrors your existing automatic mitigation configuration. The rule group inherits your current setting, so a Block configuration comes up in Block mode and a Count configuration comes up in Count mode in a single, atomic operation. The rule group takes over in the same step that disables automatic mitigation, so protection never drops for an instant. This is a handoff rather than a cutover with no window where your resources are unprotected. If you’d rather not upgrade you can opt out by contacting AWS Support before the auto-upgrade date.
Phase 4: Guided migration (available July 27–December 31, 2026)
You don’t have to wait for the October auto-upgrade to migrate. As soon as the rule group is deployed in Count mode between July 27 and August 7, 2026, you can move to it on your own schedule. This is the path to use for web ACLs that aren’t eligible for the Phase 3 auto-upgrade, meaning mixed-mode web ACLs or ones with resources that don’t have automatic mitigation enabled. Work with your AWS account team and AWS Support at any point in this window to plan and complete the migration. Eligible web ACLs are also upgraded automatically starting October 1 (Phase 3), so guided migration is mainly for the web ACLs the auto-upgrade can’t cover.
As of January 1, 2027, the Shield Advanced application-layer automatic mitigation feature will no longer be available. Resources that haven’t migrated to the Anti-DDoS managed rule group will lose automatic application-layer DDoS mitigation.
The existing automatic mitigation and the Anti-DDoS managed rule group use separate Amazon CloudWatch namespaces and metric structures. The rule group gives you three tiers of observability: tier 1 tells you an attack is happening, tier 2 shows which requests it flagged and why, and tier 3 shows what it did about them. You don’t need all three on day 1 because most customer teams start at tier 1 to confirm detection is working, then add the others as they tune.
Tier 1: Event detection alarms
You can detect DDoS events using two CloudWatch metrics, each with its own namespace.
DDoSDetected (Shield)
DDoSAttackRequests (Anti-DDoS managed rule group)
Namespace
AWS/DDoSProtection
AWS/WAFV2
Requires Shield Advanced
Yes
No
Scope
L3, L4, and L7 events
L7 events only
Value during event
Binary (0 or 1)
Count of requests observed
Value outside event
Reported once daily (keeps metric alive)
Absent (no data points)
Dimensions
ResourceArn
Resource, ResourceType
What this means for your existing alarms:
After the application-layer automatic mitigation feature is sunset, DDoSDetected still fires for infrastructure layer 3 and layer 4 events, so your existing network layer and transport layer alarms remain valid. For the full list, see AWS Shield Advanced metrics.
DDoSAttackRequests is the Anti-DDoS managed rule group equivalent for application-layer event detection. Alarm on Sum >= 1 to detect any event, or set a volume threshold (for example, more than 10,000 requests per minute) for severity-based alerting.
During the evaluation period, both metrics fire independently and you can validate detection parity before migrating your application-layer alarms.
Because DDoSAttackRequests is absent when there are no active DDoS events, set treat-missing-data to missing or notBreaching for alarms on this metric.
Tier 2: Detection labels for custom monitoring
Every request the Anti-DDoS managed rule group evaluates gets a label. Where tier 1 tells you an attack started, tier 2 shows which requests looked suspicious and how confident the rule group was. The labels surface as AWS WAF metrics in the AWS/WAFV2 namespace: AllowedRequests, BlockedRequests, and CountRuleMatch. Each carries the LabelName and LabelNamespace dimensions under the awswaf:managed:aws:anti-ddos: namespace.
event-detected – Requests observed during a detected DDoS event
ddos-request – Requests identified as part of the attack
challengeable-request – Requests eligible for browser challenge
Chart suspicion-level trends on a CloudWatch dashboard to see how an attack builds. Match on the labels in your own AWS WAF rules or dig into them in your AWS WAF logs with CloudWatch Logs Insights or Amazon Athena when you need to understand a specific event after the fact.
Tier 3: Mitigation action metrics
Where tier 2 shows what the rule group flagged, tier 3 shows what it did about those requests during an event. You’ll find these metrics as ChallengeRequests, BlockedRequests, and CountRuleMatch, each scoped by the rule label that produced it.
ChallengeAllDuringEvent – Requests challenged during an active event
ChallengeDDoSRequests – Suspected DDoS requests challenged based on suspicion level
DDoSRequests – Requests blocked (or counted in Count mode)
Watch these during a live event to see whether mitigation is keeping up. If you’re challenging far more requests than you’re blocking, your configuration might be too cautious, and you can raise the sensitivity level after you trust the numbers.
Observability summary
Tier
Automatic mitigation
Anti-DDoS managed rule group
Event alarm
DDoSDetected in AWS/DDoSProtection (binary, L3/L4/L7)
DDoSAttackRequests in AWS/WAFV2 (request count, L7)
Your Shield Advanced subscription includes the Anti-DDoS managed rule group for up to 50 billion requests per month, counted across your whole organization at the payer account level. For most customers that ceiling is well above normal traffic, so you won’t see a line item here unless you’re operating at very high volume. For the exact rates, see AWS WAF pricing and Shield Advanced pricing.
You aren’t charged for DDoS traffic while the Anti-DDoS managed rule group is actively mitigating, which means Block or Challenge mode rather than Count. This applies to AWS WAF request fees, Anti-DDoS managed rule group request fees, and Shield Advanced request charges. Leaving the rule group in Count mode past the evaluation period costs you the protection without the billing relief, so avoid staying in Count mode longer than you need to validate.
During the evaluation period (July 27 to September 30, 2026), the eligible web ACLs AWS auto-enrolled don’t incur per-request fees or WCU consumption, even when configured in Count mode.
The Anti-DDoS managed rule group works at the web ACL level, so every resource you associate with a web ACL shares that coverage. Before assuming a single resource accounts for the whole cost, look at how many resources sit behind each web ACL. A web ACL fronting 20 resources bills differently from one fronting 2, so check that count first and familiarize yourself with the workload protected by each web ACL.
Adding the Anti-DDoS managed rule group to a web ACL yourself isn’t part of the upgrade path, so standard pricing applies from the moment you enable it. The same is true for any resource that was already running the rule group before the rollout. To get the free evaluation, let the automatic rollout reach your web ACLs rather than adding the rule group ahead of it. There’s no penalty for adding it yourself; you just don’t receive the waiver on that web ACL.
Update your infrastructure as code
If you manage web ACLs with AWS CloudFormation, AWS Cloud Development Kit (AWS CDK), Terraform, or other infrastructure as code (IaC), the auto-upgrade changes your infrastructure configuration outside your templates. Your code is still the source of truth, so you need to do two things. First, change where the protection is declared. Today you enable application-layer automatic mitigation through the Shield API (EnableApplicationLayerAutomaticResponse), configured per protected resource. The Anti-DDoS managed rule group is configured through the AWS WAF API instead (CreateWebACL and UpdateWebACL), as a managed rule group statement inside the web ACL, scoped per web ACL rather than per resource. In IaC terms, you remove the Shield automatic-response block (for example, Terraform’s aws_shield_application_layer_automatic_response) and add the WAF managed rule group statement shown in the following section. Second, pull the upgraded web ACL back into your tooling before your next deploy, or your pipeline will try to revert the change.
For the full statement in Terraform, CloudFormation, and the AWS CDK, plus how to sync state after the auto-upgrade (terraform plan, CloudFormation drift detection, cdk diff), see the iac-webacl-examples helper.
Update your AWS Firewall Manager policy
If you’re currently running a Shield Advanced policy in AWS Firewall Manager, check its Automatic application layer DDoS mitigation setting before you start, because that setting decides how much of this section applies to you. Where it reads Ignore or Disable, the policy isn’t managing that mitigation at all: whatever mitigation your resources have was enabled on the resources themselves, or through Shield, and that’s where you turn it off when the time comes.
If the Shield Advanced policy reads Enable, you first need to add or reuse an AWS WAF Firewall Manager policy, put the Anti-DDoS managed rule group in it and scope that policy to the same accounts and resources your Shield Advanced policy covers.
Keep the Shield Advanced policy in place throughout the process. Don’t remove accounts or resources from its scope, and don’t delete it. Firewall Manager revokes the Shield Advanced protections it created for anything that leaves scope, which ends L3 and L4 coverage, along with the application-layer mitigation you’re replacing. Instead, use a setting change to retire the older mitigation: when the new rule group is live and you’ve compared the two, set Automatic application layer DDoS mitigation to Disable on the Shield Advanced policy that currently reads Enable.
Set up the AWS WAF Firewall Manager policy
You can make this change in the console or as code. If you manage your Firewall Manager policies as code, don’t edit them in the console: add a new AWS WAF policy or update an existing one in your templates with the Anti-DDoS managed rule group included, and deploy it using the following Firewall Manager policies using IaC steps. Otherwise, use the console.
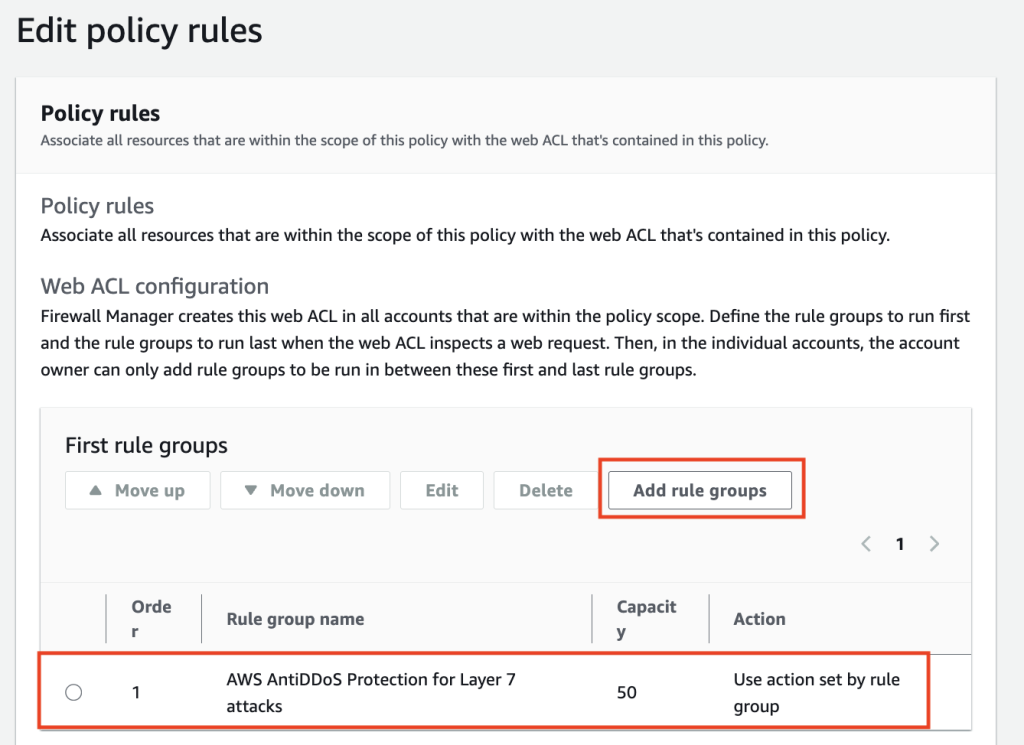
In the console, follow Creating an AWS Firewall Manager policy for AWS WAF to create the policy and reach the Edit policy rules page. Add the Anti-DDoS rule group, listed there as AWS AntiDDoS Protection for Layer 7 attacks (AWSManagedRulesAntiDDoSRuleSet), as a new rule group under First rule groups so it evaluates before your other managed groups, but below any Allow custom rules you use to fast-path known-good traffic.
If you protect CloudFront distributions, make this change in your Global policy, and repeat it in each AWS Regional policy for regional resources. Save the policy, and Firewall Manager rolls the change out to in-scope accounts, which can take a few minutes.
After being added, the rule group appears as the first rule group in the policy, as shown in the following screenshot:
Figure 1: AntiDDoS enabled
Firewall Manager policies using IaC
If you manage Firewall Manager policies as code, make the change in your template instead of the console. The Anti-DDoS managed rule group goes into the AWS WAF policy’s ManagedServiceData, a WAFV2 policy definition carried as a JSON string, added to the first rule groups so it evaluates early. For the ManagedServiceData JSON with CloudFormation, Terraform, and AWS CDK examples, see the firewall-manager-examples helper.
Whichever path you take, scope the policy to the same accounts and resources your Shield Advanced policy already covers, so no resource loses application-layer protection during the move.
Getting started
Between July 27 and August 7, 2026, AWS will add the Anti-DDoS managed rule group in Count mode to Shield Advanced web ACLs that have resources using application layer automatic mitigation but not yet the Anti-DDoS rule group. After it reaches your web ACL, you can evaluate it, and migrate whenever you’re ready, without waiting for the October auto-upgrade.
Review the Anti-DDoS dashboard in the AWS WAF console. The dashboard shows real-time DDoS events, match metrics, and top traffic sources.
Compare event detection side by side. During Count mode, both systems detect independently. Check the DDoSDetected metric in AWS/DDoSProtection alongside DDoSAttackRequests in AWS/WAFV2 to validate detection parity for your resources. You can deploy the CloudWatch comparison dashboard from the AWS Samples repository to view both systems on a single dashboard.
Explore AWS WAF labels. Enable AWS WAF logging and query for labels in the awswaf:managed:aws:anti-ddos: namespace. Look at suspicion levels (low-suspicion-ddos-request, medium-suspicion-ddos-request, high-suspicion-ddos-request), event-detected, and challengeable-request to see per-request visibility into detected events.
Start with Low sensitivity for Block actions during evaluation to minimize false positive risk. Tune up as you gain confidence from the Anti-DDoS dashboard and AWS WAF label data.
Plan your configuration. Review sensitivity levels, URI exemptions for non-HTML paths, and web ACL priority placement. The Anti-DDoS managed rule group should run at the highest priority in your web ACL, or right below any custom rules with the Allow action.
Sync your IaC templates. After the auto-upgrade adds the Anti-DDoS managed rule group to your web ACL, fetch the current state into your IaC tooling (Terraform refresh, CloudFormation drift detection, AWS CDK import) before your next deployment.
Conclusion
The Anti-DDoS managed rule group profiles your traffic within minutes and mitigates within seconds, where the automatic mitigation it builds on established its baseline over hours, and it gives you granular visibility into what it’s doing. The evaluation period exists so you can watch both systems run on your own traffic before anything changes. Spend the first few weeks in Count mode confirming the new detection matches what you see today, then move your alarms over and pick a sensitivity level you’re comfortable with. If you run a web ACL across several resources, or you manage rules through AWS Firewall Manager, contact AWS Support before you start so you don’t have to unwind anything later. The Shield Advanced application-layer automatic mitigation feature retires on January 1, 2027, and anything still relying on it needs to be migrated by then.
The new Amazon GuardDuty investigation agent (now in public preview) investigates security findings across your Amazon Web Services (AWS) environment, reducing investigation time from hours to minutes.
GuardDuty is our managed threat detection service that continuously monitors your AWS accounts and workloads for suspicious, potentially malicious activity, and unauthorized behavior, delivering detailed security findings for visibility and remediation.
Whether you’re investigating a single suspicious finding or assessing security posture across your entire organization, the investigation agent provides structured assessments providing risk levels, confidence scores, and actionable recommendations.
Security teams can spend hours investigating security findings and correlating data across multiple tools. The GuardDuty investigation agent automates this correlation, providing actionable intelligence, built directly into GuardDuty and accessible on demand through the AWS Management Console, AWS Command Line Interface (AWS CLI), AWS APIs, or AWS SDKs.
This post shows you how to:
Enable the investigation agent in your GuardDuty console.
Create your first investigation through the console or AWS CLI.
Use the investigation agent with the AWS MCP server for AI-assisted security operations
Key features of the GuardDuty investigation agent
The GuardDuty investigation agent provides APIs using the same patterns you already know from GuardDuty. Each completed investigation returns a risk level, confidence assessment, MITRE ATT&CK®technique mapping, resource mapping, and prioritized recommendations.
You can scope investigations from the console for a specific finding, an account, or all accounts across your organization. Alternatively, the AWS CLI and API accept a free-form trigger prompt of up to 2,048 characters, so you can describe what to investigate in natural language and guide the analysis of the agent by specifying areas of concern, suspected root causes, or priorities for the investigation.
The investigation agent APIs are also available through the official AWS MCP server, part of the Agent Toolkit for AWS, enabling integration into your existing security toolchains and AI-powered workflows. You don’t need to manage or interact with the agent directly. Call API endpoints, and the agent investigates findings, correlates evidence, and delivers an assessment without the overhead of managing complex configurations.
How the investigation agent analyzes findings
When you create an investigation, the agent uses cross-Region inference to process your findings based on scope and produces a structured output.
Cross-Region inference – GuardDuty investigation uses the Cross-Region Inference Service (CRIS), which selects the optimal AWS Region within your geography to process the investigation assessment. Your data remains stored only in the Region where the investigation request originates. However, investigation data and summary results might be processed outside that Region. Data is transmitted encrypted across the secure network provided by Amazon.
For more information about which inference Regions your request might be routed to see the Cross-Region inference routing table located in the investigation section of the Amazon GuardDuty User Guide.
Investigation output – Each completed investigation produces the following insights: Risk level (Info, Low, Medium, High, or Critical), Confidence (Unknown, Low, Medium, or High), Summary (description of findings and key observations), Investigation Details (additional context), and Recommended Actions (detailed actions including AWS CLI commands).
Account scoping – Account specification is required only when investigating a specific member account. For broaderscopes such as your entire organization, no account ID is needed. The agent will only investigate findings within accounts you’re authorized to access per the authorization model that follows.
Prerequisites
Before you get started, make sure you have the following prerequisites in place:
Amazon GuardDuty enabled in your account
AWS account in a supported Region (see Availability section)
Required IAM permissions
You will need three new permissions: guardduty:CreateInvestigation to start new investigations, guardduty:GetInvestigation to retrieve results, and guardduty:ListInvestigations to view investigations for a given detector.
Administrator accounts can create investigations, retrieve results, and view investigation lists for themselves and their member accounts. Member accounts can only retrieve results and view investigation lists for their own account. Member accounts can’t create investigations and can’t access investigations belonging to other accounts or the administrator account. Account specification is required only when investigating a specific member account. For your own account or accounts across your organization, no account ID is needed.
To enable and create your first investigation
Before you begin, verify you have the required IAM permissions as described in the prerequisites .
Open the AWS Management Console in the desired supported Region and navigate to Amazon GuardDuty.
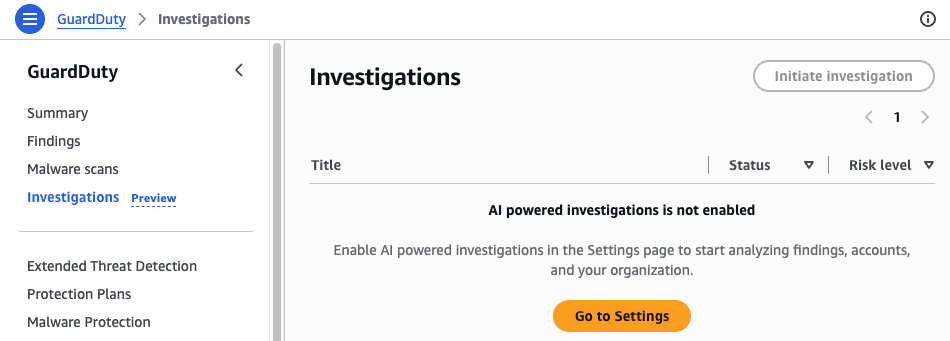
In the navigation pane, choose Investigations.
Figure 1: GuardDuty investigation dashboard
If investigations aren’t enabled choose Go to Settings and then enable investigations by choosing Enable.
After investigations are enabled, navigate back to the investigations page.
In the navigation pane, choose Initiate Investigation.
Figure 3: GuardDuty initiate investigation
Select a scope for your investigation:
Enter a GuardDuty Finding ID: Use when you want to investigate a specific GuardDuty finding in depth
Enter an AWS Account ID: Use when you want to assess the overall security posture of a specific AWS account
All accounts: Use for organization-wide security assessment or when investigating potential lateral movement
Choose Initiate investigation.
Figure 4: GuardDuty investigation setup
Wait for the investigation to complete (typically 2–5 minutes for account level and 10–12 minutes for specific finding investigations during preview). The status updates automatically.
When the investigation completes, select the investigation title to view the full assessment.
Figure 5: GuardDuty investigation completed menu
The investigation assessment contains detailed information about the investigation including general information, a summary of the investigation, mapping, assessment of the threat, and recommended actions.
The General Information section displays the investigation ID, status, triggered-by account, and creation timestamp.
Figure 6: General information section of the assessment
The summary section provides a narrative of key observations and findings.
Figure 7: Summary section of the assessment
The mapping section shows attack techniques and affected AWS resources.
Figure 8: MITRE ATT&CK mapping section of the assessment
The Threat Assessment section displays the risk level, confidence score, and detailed threat analysis.
Figure 9: Threat assessment section
The Recommended Actions section lists prioritized remediation steps.
Figure 10: Recommended actions section of the assessment
Investigations can also be conducted with the AWS CLI or SDK using the following API endpoints:
CreateInvestigation – Initiates a GuardDuty investigation that automatically analyzes security findings, correlates related activity, performs account-level analysis, and produces a structured investigation summary with recommended next steps.
GetInvestigation – Retrieve the status and results of a specific investigation, including the assessment from the agent, correlated evidence, and recommended actions when completed.
ListInvestigations – View investigations across your environment with filtering and pagination.
To run investigations using the AWS CLI
Investigations are asynchronous because the agent queries multiple data sources, correlates findings across services, and performs AI-based analysis. After creating an investigation, you’ll need to check its status periodically until it completes.
Step 1: Find your detector ID
Each GuardDuty deployment has a unique detector ID per-account and per-Region that identifies your specific GuardDuty configuration. You will need this for all AWS CLI operations, especially if you have GuardDuty enabled in multiple Regions. You can find your detector ID in the GuardDuty console under Settings, or by running the following command and specifying the Region. For example, if the GuardDuty detector of interest were in the us-east-1 (N. Virginia) Region
To investigate findings across an entire organization:
aws guardduty create-investigation –-region=us-east-1 \
--detector-id 12abc34d567e8fa901bc2d34eexample \
--trigger-prompt “Investigate findings across my AWS Organization”
Step 3: Check investigation status
Check the status of the investigation shown here using the AWS CLIquery command to filter and list only the Status section of the output for simplicity:
Timing –Investigation times can very. Checking status every 30 seconds should be sufficient to yield results.
If status shows FAILED –Review the error message in the response and verify your permissions match the authorization model requirements.
To list all investigations for a given detector run the following, the max-results command is optional but useful to filter the number of returned results.
Beyond running investigations manually, the API-first design addresses a common customer pattern: sending GuardDuty findings to third-party tools. You can now add automated investigation to those existing pipelines, so your team receives enriched, prioritized intelligence rather than raw alerts.
Consider a customer that routes GuardDuty findings through Amazon EventBridge to their Security Information and Event Management (SIEM) platform, where analysts manually investigate each alert. With the investigation agent, an AWS Lambda function can be placed into the pipeline that calls CreateInvestigation with the finding ID, waits for completion, and forwards the enriched results (risk level, confidence score, MITRE ATT&CK mapping, and recommended actions) to their SIEM alongside the original finding. Critical findings route directly to the customer incident response queue for further analysis or automation. Low-risk findings with high confidence get auto-closed or batched for weekly review. The analyst’s time shifts from repetitive log correlation to validating assessments and acting on confirmed threats.
This pattern works with SIEMs, ticketing systems, or automation platforms that can be customized to use the API or EventBridge messaging. The investigation agent fits into the pipeline as a processing step, not a destination.
The agent is fine-tuned on investigating GuardDuty findings. It’s distinct from other AWS frontier agents such as the AWS Security Agent and AWS DevOps Agent. The scope of the investigation agent is focused to deliver specialized analysis of GuardDuty findings.
Integration with the AWS MCP server
The Model Context Protocol (MCP) is an open standard that allows AI assistants to securely connect to external data sources and tools. Because the AWS MCP server implements this standard for AWS services, you can use it to add GuardDuty investigations into AI-powered workflows using tools like Kiro, Anthropic’s Claude, or other MCP-compatible clients.
To configure the AWS MCP server
Configure your MCP client to connect to the AWS MCP server.
Use natural language to invoke investigations (for example,“Investigate the recent Unauthorized Access finding for account 123456789012″).
Review the investigation results returned through your MCP client. These results can vary depending on the model or agent being used, configuration, and the non-deterministic nature of AI.
Integrate the results into your existing agent automation or take manual action based on the findings.
Additional usage examples
“Investigate the latest high-severity finding in my production account”
“Create an investigation for finding ID abc123 in account 987654321098 and summarize what happened”
“List investigations from the last 24 hours and flag those that need human review”
How the investigation agent relates to AWS Security Incident Response
At re:Invent 2024, AWS launched AWS Security Incident Response (AWS SIR), a managed service that you can use to quickly prepare for, respond to, and recover from security incidents. AWS SIR and the GuardDuty investigation agent address different stages of your security workflow. The GuardDuty investigation agent provides an on-demand assessment capability. When your team needs deeper context on a specific finding, an account security posture, or the overall security posture of your organization. You create an investigation and receive a structured assessment with risk levels, confidence scores, MITRE ATT&CK® technique mappings, and actionable recommendations. Security analysts can use this to quickly understand the scope and severity of what GuardDuty has detected.
When you create an AWS-supported case through AWS SIR, a SIR investigation agent activates, working in parallel with AWS Security Incident Response engineers to gather evidence and deliver an investigation summary within minutes. AWS SIR is purpose-built for active security events where you need both AI-powered automation and human expertise to coordinate containment and recovery.
Security teams can use these capabilities to assess and prioritize findings on demand using the GuardDuty investigation agent, escalate confirmed issues to stakeholders with supporting evidence, and create or update an AWS-supported case to accelerate involvement from the AWS SIR team when additional support is needed.
Availability and pricing
Public preview of the GuardDuty investigation agent is available in 10 AWS Regions including US East (N. Virginia), US East (Ohio), US West (Oregon), Canada (Central), Europe (Frankfurt), Europe (Ireland), Europe (London), Europe (Paris), Europe (Stockholm), and Asia Pacific (Tokyo).
During public preview, the investigation agent is available at no charge. Usage is limited to 10 investigations per account per day, with a cumulative limit of 100 investigations per account during the preview period. Failed investigations do not count toward these quotas.
Start investigating findings today
The Amazon GuardDuty investigation agent reduces investigation time from hours to minutes, letting your security team focus on confirmed security events rather than manual correlation.
Get started by:
Enabling the investigation agent in your GuardDuty console
Creating your first investigation using a recent GuardDuty finding
Reviewing the structured assessment, including risk level and recommended next steps
For organizations using the AWS MCP server, you can also invoke investigations through natural language in your AI assistant of choice.

 Login
Login