Normal view

Argamal: Malware hidden in hentai games

3 June 2026 at 11:00

In April 2026, we discovered a new malware campaign targeting players of “hentai” games. Once launched, the infected games install a previously unknown malicious implant on the user’s machine. After a few days, the implant downloads and executes a Trojan, resulting in full system compromise and broad remote control capabilities for the attackers. We dubbed this malware family “Argamal”.

The malware uses COM hijacking to persist on the victim’s machine, replacing the InprocServer32 entry for Windows Color System Calibration Loader DLL. This task is triggered when the user logs in, effectively allowing the malware to run at startup.

Kaspersky solutions detect this threat as Trojan.Win32.Termixia.*, Trojan.Win32.Agent.*, HEUR:Trojan.Win32.Argamal.gen and HEUR:Trojan-Downloader.Win32.Argamal.gen.

Technical details

Background

In April, as part of our ongoing monitoring of telemetry data, we found some suspicious DLLs. Further analysis revealed that various versions of these DLLs have existed since at least 2024.

The DLLs were spawned by different games written using various game engines and programming languages, including RenPy (Python) and RPG Maker MV (JavaScript), among others. However, they all had one thing in common: they were all hentai games. We searched for the distribution sources and found a number of websites hosting game screenshots and download links. These links redirected users to PixelDrain, a free file transfer service.

Adult games catalogue

Adult games catalogue

In addition to these websites, the trojanized games have also been distributed via different torrent trackers, including AniRena.
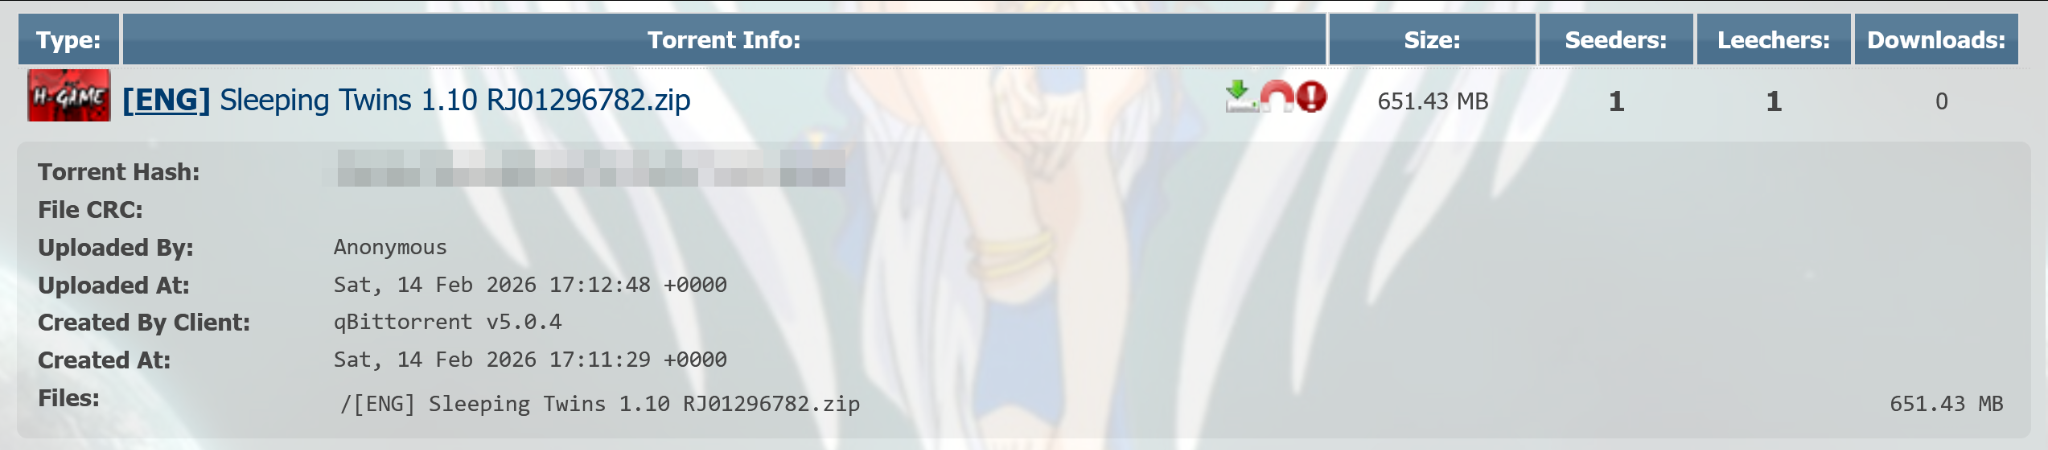
Malicious game torrent in AniRena

Malicious game torrent in AniRena

Delivery

Both the dedicated websites and torrents delivered an archive containing the infected game.
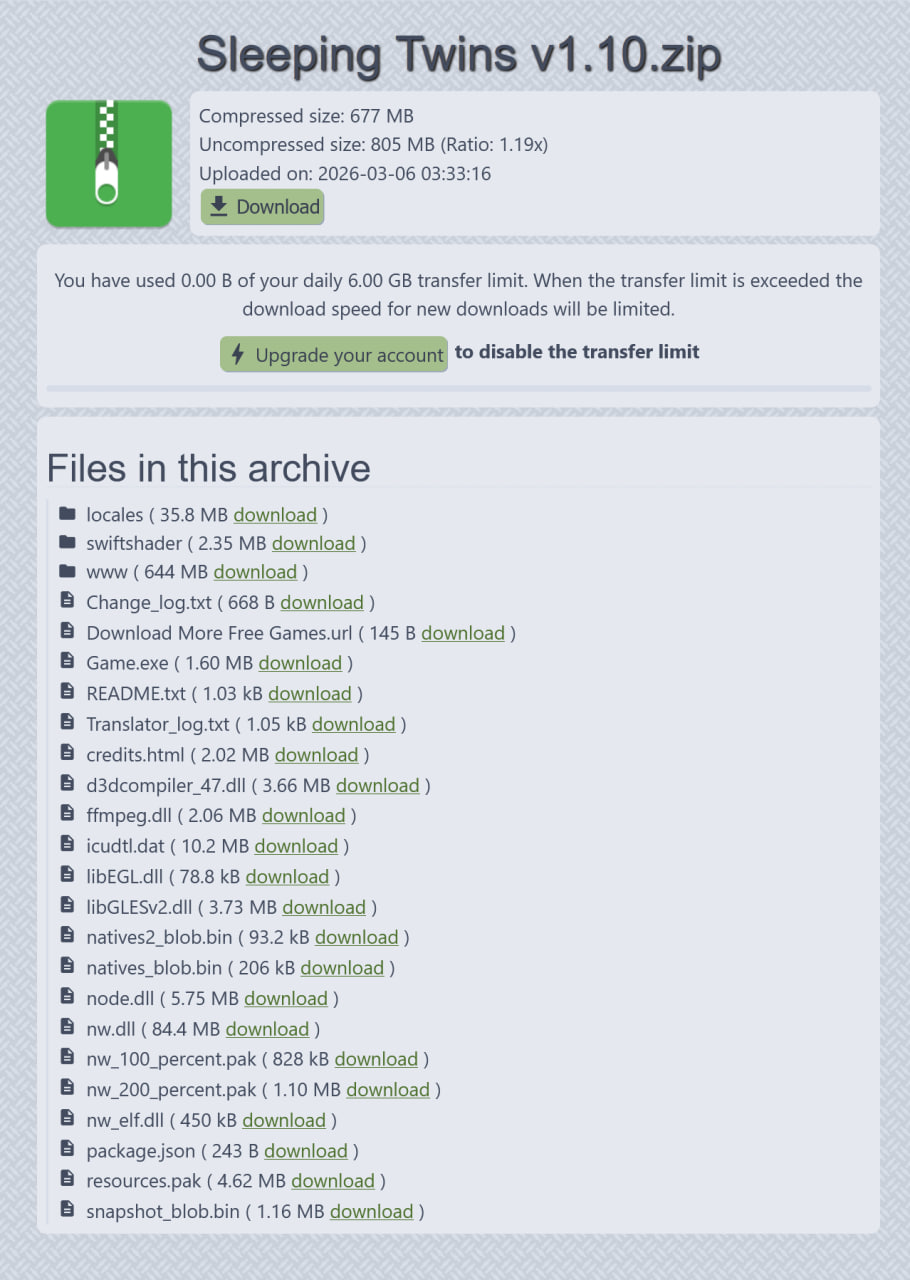
Contents of the game archive

Contents of the game archive

This archive contained fully functional, legitimate game files, as well as a modified FFmpeg DLL (SHA1: 42add9475e67a1ccc6a6af94b5475d3defc01b85), that imported the DllGetClassObject function from a file called natives2_blob.bin. Since the game needs ffmpeg.dll to run properly, the library loads as soon as the user starts the game.

Script executor

The natives2_blob.bin (SHA1: edce72f59e4c1d136cd1946af70d334c19df858d) file is a DLL that executes a Base64-encoded PowerShell script when loaded.
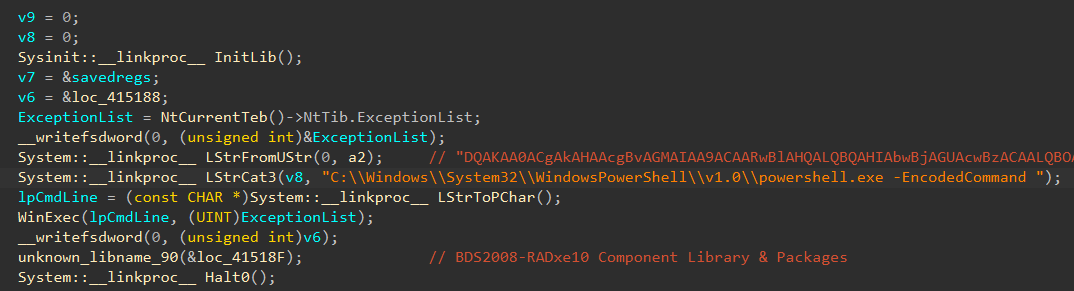
The natives2_blob.bin file code

The natives2_blob.bin file code

This PowerShell script, which we’ll call Stage1, performs basic checks for controlled environments. For example, it checks for the Sandboxie folder in Program Files and Procmon64 in the process list. If all the checks indicate that the process is not running in a controlled environment, it proceeds to establish persistence.

Stage1 sets the MI_V environment variable (and also MI_V2 in the new versions of malware) for the current user to another Base64-encoded PowerShell script, which we’ll call Stage2. After that, it sets the InprocServer32 registry key at HKCU\SOFTWARE\Classes\CLSID\{722D0F89-B69C-4700-AE8C-4A44350E4876} to a random DLL file name in a random subdirectory of %USER%\AppData\Local, as well as the ShellFolder subkey to another random DLL file name in the same location. Stage1 also creates a scheduled task that will execute three days later. This task executes Stage2 and runs once.

Stage2 is a payload downloader script. It takes previously generated DLL filenames from the registry and downloads an encrypted payload called zaesdl.dat from GitHub using bitsadmin.exe. The downloaded payload is saved in the settings.dat file in the randomly chosen subdirectory of %USER%\AppData\Local. Stage2 decrypts it using AES-CBC with the key zbcd1j9234r670eh and an IV equal to the key. The decrypted payload is then saved in the DLL file specified in the ShellFolder registry subkey.

The decrypted payload is set as InprocServer32 at HKCU\SOFTWARE\Classes\CLSID\{B210D694-C8DF-490D-9576-9E20CDBC20BD}, which is a COM object used by the \Microsoft\Windows\WindowsColorSystem\Calibration Loader scheduled task. This task runs every time a user logs in, allowing the malware to run during every user session.

Before quitting, Stage2 also removes the changes made under the HKCU\SOFTWARE\Classes\CLSID\{722D0F89-B69C-4700-AE8C-4A44350E4876} registry key, unsets the MI_V environment variable (and MI_V2 in newer versions), and removes the scheduled task that launched Stage2.

Malicious agent

Early payload versions decrypted themselves using the 0xB0C1D4E9 rolling XOR key, where the decryption key for the i + 1 block is the encrypted content of the i block (each encrypted block being four bytes long). The most recent agent versions don’t do that.

The samples we found had string encryption; they use a simple substitution with a key that corresponds position-by-position to the following alphabet: ABCDEFGHIJKLMNOPQRSTUVWXYZabcdefghijklmnopqrstuvwxyz0123456789@#$./:<>*&~. The decryption process involves finding the position of each symbol of the encrypted strings in the key, and replacing it with the symbol that occupies the same position in the alphabet.
During our investigation, we found the following keys were used:

  • 17htUno/I3L&fK2H#yapE@b5NqZ$Q4xmeF.s96uB>jkdWCPvAgD*XwO:iR~TMrV0YGl8z<JSc
  • 71htUno/I3L&fK2H#aypE@b5NqZ$Q4xmeF.s96uB>jdkWCPvAgD*XwO:iR~TMrV0YGl8z<JSc
  • E1hUtno/IL3&fK2H#ypa7@b5NqZ$Q4xmeF.s69uB>jkdWCvPAgD*XwO:iR~TrMV0YGl8z<JcS

All symbols not used in the key remain unchanged.
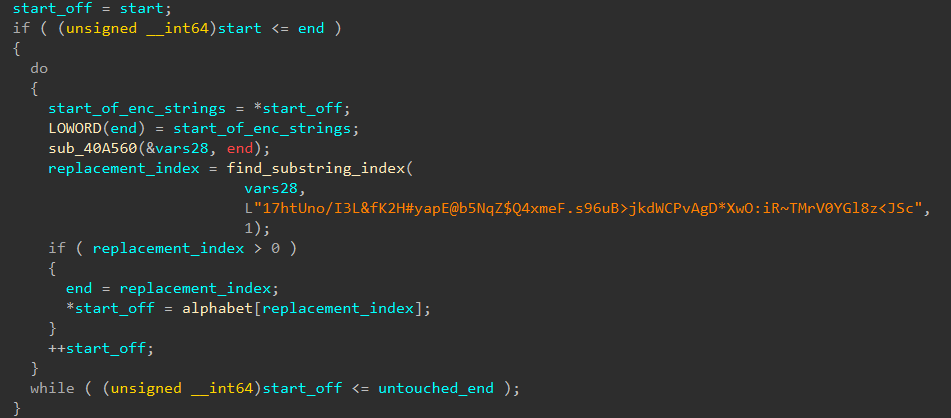
String decryption

String decryption

The payload checks for the presence of the following security solutions using the output of the tasklist command:

  • Kaspersky
  • Avast
  • McAfee
  • BitDefender
  • MalwareBytes
  • +36 other solutions
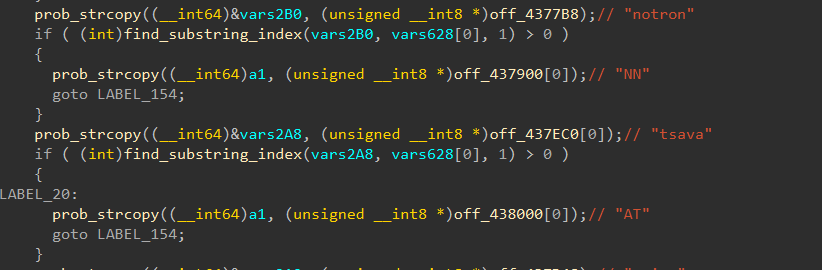
Security solution detection logic

Security solution detection logic

The payload itself is a RAT with broad functionality. The default C2 server is asper1[.]freeddns[.]org for earlier versions and Winst0[.]kozow[.]com for the latest versions of the payload. Both domains point to 186[.]158.223.35. We also saw another IP address for the first C2 in pDNS records, though we haven’t actually seen it in use. The C2 address can change based on a C2 reply or when certain conditions are met. For example, if the user’s default locale is set to “zh-CN”, the RAT sets its C2 address to country1[.]ignorelist[.]com. During most of our investigation, this domain pointed to 127[.]0.0.1, but starting April 26, it has been pointing to 186[.]158.223.35 as well.

The payload sends UDP heartbeats to port 57441 of the C2 server. These heartbeats contain information about detected security solutions, system startup time, time since last input activity, architecture info, machine IP address and username.

The C2 may respond to the heartbeat. Based on this response, the payload can perform different actions. Below is the full list of available commands.

Response first byte Description
0x31 Run DLL on the system
0x57 Send UDP request to the specified address
0x55 Open file or link from the response
0x50 Collect information about the infected system (e.g. process list and architecture)
0x53 Execute command from the response using ShellExecuteW
0x52 Run the file specified in the response using WinExec
0x42 Delete the file specified in the response
0x41 Update C2 domain
0x59 Get new payload: connect to C2 port 63559/UDP, get new DLL and update COM path in the registry

The C2 can also set a flag in the response that will turn on the extended RAT mode. In this mode, the payload communicates with the C2 server using the 3747/tcp port.

TCP communications are encrypted using a simple substitution cipher. Each character is replaced using a fixed mapping defined by the key:

koP]Y4Os-_t?cB',aK.Wm>QM2[U!^C`*@Ff:X\6Dp8H%ATydE<e(#G&LhwRZ5znjJqgNrl)I7V$3=910"+Svxi/;ub

This key corresponds position-by-position to the standard ASCII character sequence:

!"#$%&'()*+,-./0123456789:;<=>?@ABCDEFGHIJKLMNOPQRSTUVWXYZ[\\]^_`abcdefghijklmnopqrstuvwxyz{|}

In other words, each character in the ASCII set is replaced by the corresponding character in the key string.

C2 requests and responses are divided into two parts by the first space character. The first part is a command and the second part is usually an argument.
After connecting and before receiving information from the C2, the malware sends metadata about the infected machine using the NOOP command. This metadata includes a run cycle counter, mounted drive metadata, time since the last input activity and data about the display settings.

Based on the C2 command, the malware can execute commands on the infected machine, perform reboot and shutdown actions, control the cursor, take screenshots, compress files into archives, and send files to other specified servers. In short, it can fully control the machine. The full list of commands is as follows:

System control

  • KILL REBOOT: Reboots the infected system
  • KILL POWER: Shuts down the infected system
  • KILL SELF: Same as the QUIT command (described below)
  • KILL ME: Exits process running the malware

Surveillance

  • SCREEN / SCREEN9: makes a screenshot, saves it to the ~wra1269.tmp file and sends it to the C2

File operations

  • DELETE <filename>: deletes specified file
  • DELDIR <dirname>: deletes specified directory
  • REN <file path 1>#<file path 2>: moves specified file
  • MAKDIR <path>: creates directory
  • ZIPFILE <file or folder name> / ZIPFOLDER <file or folder name>: compresses specified file/folder into a .zip archive
  • TAR <file or folder name> / TAR2 <file or folder name>: compresses specified file/folder into a .tar archive
  • GETFILEDATE <filename>: sends file’s last modification date
  • SETFILEDATE <filename>: sets file’s last modification date
  • GETFILEACC <filename>: sends file’s last access date
  • DWLOAD <filename>: sends file to the C2
  • UPLOAD <filename>#<C2 address>: uploads file to the specified C2 server

Reconnaissance

  • USER: sends username
  • KALIVE: sends run cycle counter
  • IDLE: sends number of seconds passed since last input activity
  • DRIVES: sends information about mounted drives
  • FOLDEX <folder type>: sends full path to a directory of the specified type:
  • – type = 0x63: temporary directory
  • – type = 0x64: \Google\Chrome\User Data\Default\ in AppData\Local folder
  • – type = 0x65: \Downloads\ in user home directory
  • – type = 0x66: \Microsoft\Excel\XLSTART\ in AppData folder
  • – type = 0x67: AppData folder
  • LFILES <folder path>: lists and sends paths to all files in the directory
  • OSVER: sends information about user, hostname, OS architecture and version
  • COMPILERDATE: sends constant hardcoded in the RAT, e.g., 25.10.2025

Generic control

  • DSOCKE: recreates TCP keep-alive socket
  • QUIT: notifies the C2 about quitting, closes the socket and stops the process
  • RUNHID <command> / RUN <command>: runs specified command inside ShellExecuteW
  • RUNDOS <command>: runs specified command inside CreateProcessW
  • RUNTASK <command>: creates, runs and deletes task that executes specified command
  • SKEY <key code>: presses specified key
  • MOUSE FREEZE: freezes mouse movement
  • MOUSE <command>: clicks the specified mouse button or sets the cursor position to the specified coordinates

Other delivery methods

During our research, we also observed other delivery methods for the RAT. Instead of patching FFmpeg and downloading the payload from GitHub, the attackers included the main payload as libpython64.dat or another file with a similar name in the lib\py3-windows-x86_64 directory of the game. This .dat file was loaded by one of the libraries used in the game, which was patched for this purpose.

In another case, the threat actor posted their malicious DLL file (payload downloader) on a gaming forum, disguising it as a cheat.

Infrastructure

Our research revealed the following infrastructure was used in this attack.

Domain IP First seen ASN
asper1[.]freeddns[.]org 181[.]116.218.56 September 16, 2024 11664
186[.]158.223.35 July 01, 2025 11664
country1[.]ignorelist[.]com 186[.]158.223.35 September 10, 2025 11664
127[.]0.0.1 November 11, 2025
Winst0.kozow[.]com 186[.]158.223.35 April 26, 2026 11664

Victims

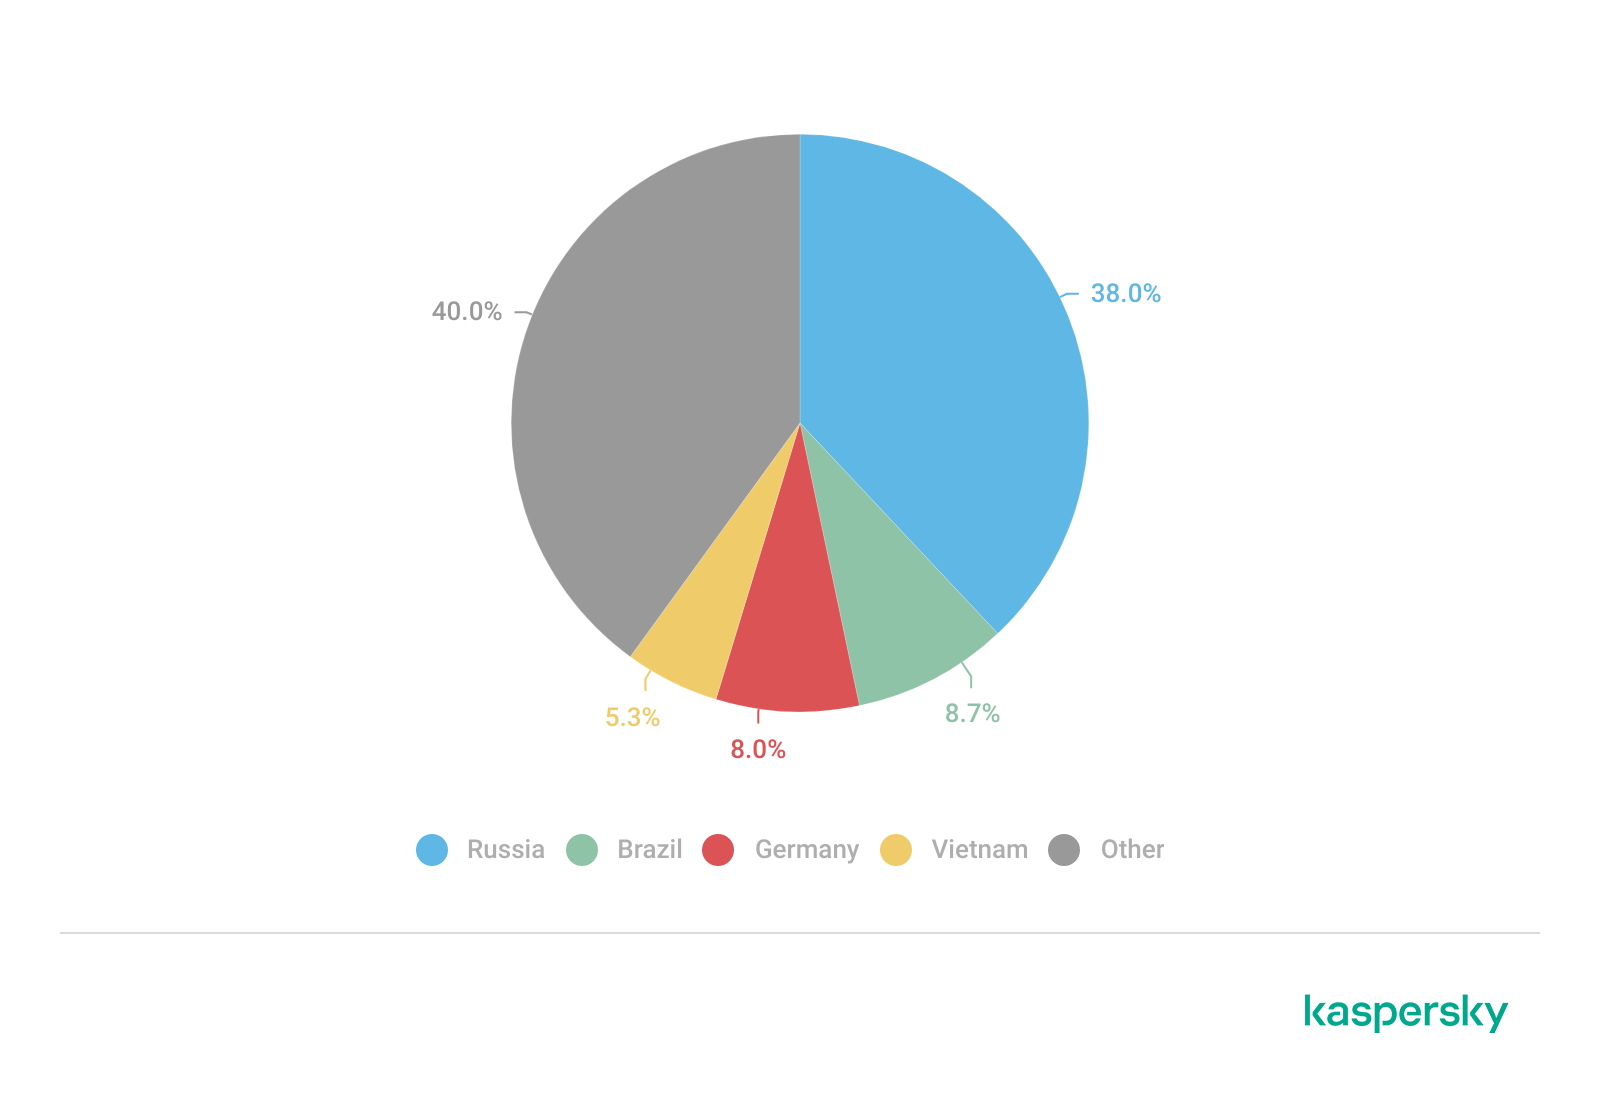
According to our telemetry, hundreds of individuals were infected with this malware. The majority of the victims were located in Russia, Brazil, Germany and Vietnam.

Distribution of victims (download)

Attribution

Based on the language of the comments in the code, infrastructure data and other facts we assess with medium confidence that the developer of the downloader chain speaks Spanish.

The actor behind this attack uses Spanish in variable names and comments. For example, the Base64-decoded delivery script contains the following lines:
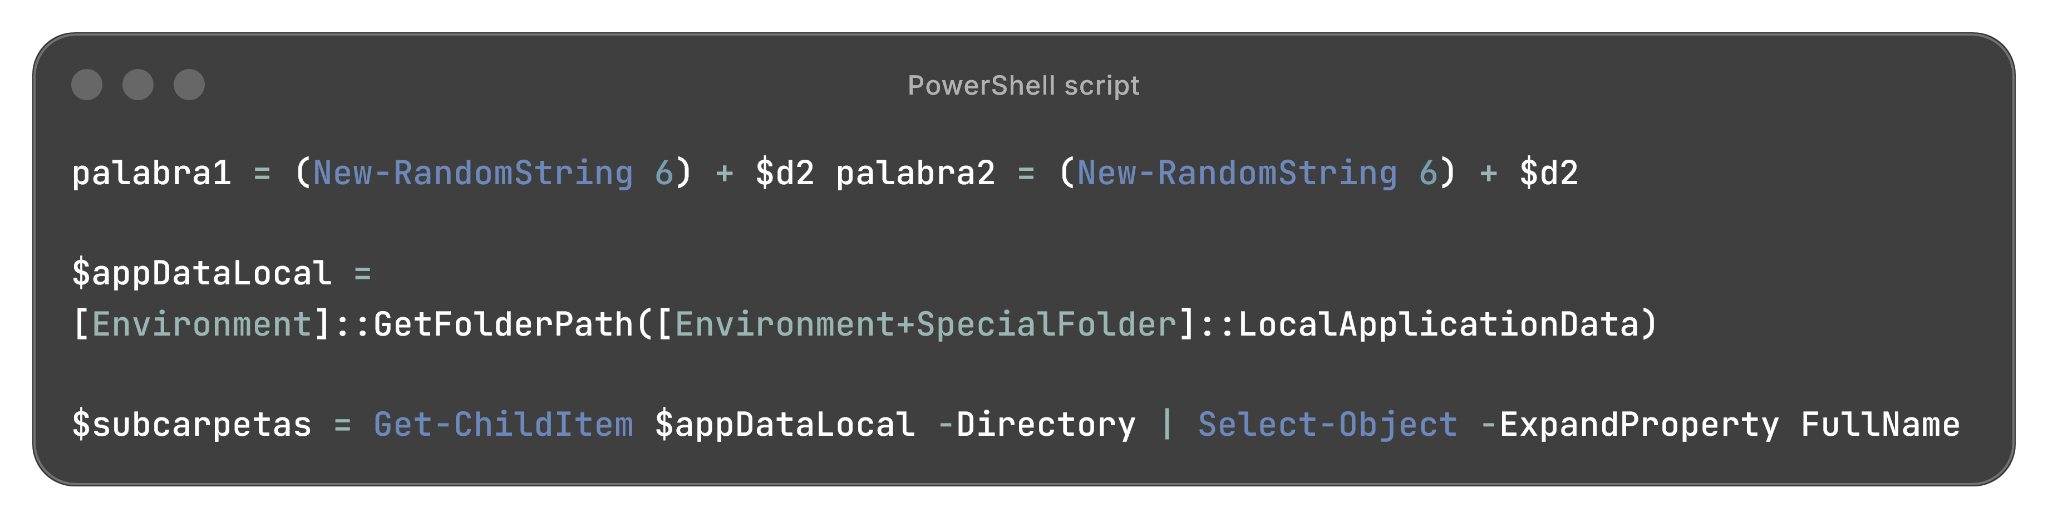
Part of the PowerShell script used in the payload delivery

Part of the PowerShell script used in the payload delivery

In addition, the JavaScript code from the website distributing infected games contains variable names, function names and comments in Spanish:
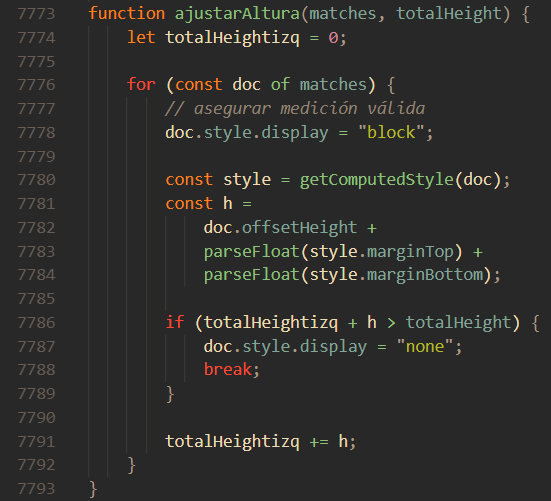
JavaScript code from the malicious site

JavaScript code from the malicious site

Notably, the malware payloads used in this attack had previously chosen 127.0.0.1 as their C2 server when the victim’s default locale is set to “zh-CN”, thus not targeting Chinese users. This may indicate that the attacker is associated with a Chinese-speaking threat actor or uses payloads developed by a Chinese-speaking threat actor. However, we still believe it’s unlikely that the developer of these delivery chains is Chinese-speaking.

Conclusions

The Argamal Trojan is a new RAT targeting individuals who seek adult games. During our analysis, we observed a steady stream of updates to the payload, including the addition of new features and fixes for various bugs, as well as changes to the infrastructure. This leads us to believe that the threat actor behind this malware will continue to develop and enhance it. The campaign’s goal is likely data and credential theft; however, the RAT enables the attacker to take full control of the device and execute any malicious activity they want.

Creating malware in today’s development landscape has become significantly easier thanks to the wide availability of detailed guides, tooling, and automation resources. As a result, it is crucial not only to detect known malware but also to identify new and evolving threats as they emerge. Kaspersky solutions prevented the malicious activity in the earliest stages of the attack. The solutions help ensure device security by identifying not only known threats but also the behavior of the software and its actions, providing comprehensive protection against malware.

Indicators of Compromise

File hashes
RAT payloads:
76253fb55aed707440e808ea78e7101318436b1c
1405a3c5e0aeb08012484134e16cdec4ab29b4a4
535f4337f261b6da20a3c614eb13270bed2d533a
d2cb0d7a9ad2b5d4ea7c2da8aec62beb37cf36d6
e05f1767c2a337910ed75e90288838d6d0541164
dad26f61da7b8bccc78364411812be74c025b475
29f1d346a6e71774c7dad25b90f446b2974393df
e815a9b418d09c2d4bcd074c2c0bc21406eeb22f
17f8f8f34dfa737f36182fed7ff9e9814a114058
954722b0c9c678b1313d1f8b204e102842dc5889
69331cfdac792dc79240e6a6bb6e803eabd70beb
901cfa97b1baaf908fd4a02bb52d970f576c4193
5f1f3689bcf23de1b280b5f35712946da0f7978f
c2d9d48b3b10bd58cdf5df9463e3ffcd60533ff3
2423a5bf0fa7cb9ec09211630a5488629499691b
ae4601a19d28332a3ec6ac31b385cdf53be53450

Trojan downloaders:
9803604ec45f31f9ef75bcca1e1310d8ac1fc3a6
edce72f59e4c1d136cd1946af70d334c19df858d
02819d200d1424882af81cb504b3e8614b32397a

Domains and IPs
asper1[.]freeddns[.]org
Winst0[.]kozow[.]com
Country1[.]ignorelist[.]com
186[.]158.223.35

GitHub repositories used in the campaign
hxxps://github[.]com/gmz159/u
hxxps://github[.]com/DnyP/files
hxxps://github[.]com/mgzv/p

Argamal: Malware hidden in hentai games

3 June 2026 at 11:00

In April 2026, we discovered a new malware campaign targeting players of “hentai” games. Once launched, the infected games install a previously unknown malicious implant on the user’s machine. After a few days, the implant downloads and executes a Trojan, resulting in full system compromise and broad remote control capabilities for the attackers. We dubbed this malware family “Argamal”.

The malware uses COM hijacking to persist on the victim’s machine, replacing the InprocServer32 entry for Windows Color System Calibration Loader DLL. This task is triggered when the user logs in, effectively allowing the malware to run at startup.

Kaspersky solutions detect this threat as Trojan.Win32.Termixia.*, Trojan.Win32.Agent.*, HEUR:Trojan.Win32.Argamal.gen and HEUR:Trojan-Downloader.Win32.Argamal.gen.

Technical details

Background

In April, as part of our ongoing monitoring of telemetry data, we found some suspicious DLLs. Further analysis revealed that various versions of these DLLs have existed since at least 2024.

The DLLs were spawned by different games written using various game engines and programming languages, including RenPy (Python) and RPG Maker MV (JavaScript), among others. However, they all had one thing in common: they were all hentai games. We searched for the distribution sources and found a number of websites hosting game screenshots and download links. These links redirected users to PixelDrain, a free file transfer service.

Adult games catalogue

Adult games catalogue

In addition to these websites, the trojanized games have also been distributed via different torrent trackers, including AniRena.

Malicious game torrent in AniRena

Malicious game torrent in AniRena

Delivery

Both the dedicated websites and torrents delivered an archive containing the infected game.

Contents of the game archive

Contents of the game archive

This archive contained fully functional, legitimate game files, as well as a modified FFmpeg DLL (SHA1: 42add9475e67a1ccc6a6af94b5475d3defc01b85), that imported the DllGetClassObject function from a file called natives2_blob.bin. Since the game needs ffmpeg.dll to run properly, the library loads as soon as the user starts the game.

Script executor

The natives2_blob.bin (SHA1: edce72f59e4c1d136cd1946af70d334c19df858d) file is a DLL that executes a Base64-encoded PowerShell script when loaded.

The natives2_blob.bin file code

The natives2_blob.bin file code

This PowerShell script, which we’ll call Stage1, performs basic checks for controlled environments. For example, it checks for the Sandboxie folder in Program Files and Procmon64 in the process list. If all the checks indicate that the process is not running in a controlled environment, it proceeds to establish persistence.

Stage1 sets the MI_V environment variable (and also MI_V2 in the new versions of malware) for the current user to another Base64-encoded PowerShell script, which we’ll call Stage2. After that, it sets the InprocServer32 registry key at HKCU\SOFTWARE\Classes\CLSID\{722D0F89-B69C-4700-AE8C-4A44350E4876} to a random DLL file name in a random subdirectory of %USER%\AppData\Local, as well as the ShellFolder subkey to another random DLL file name in the same location. Stage1 also creates a scheduled task that will execute three days later. This task executes Stage2 and runs once.

Stage2 is a payload downloader script. It takes previously generated DLL filenames from the registry and downloads an encrypted payload called zaesdl.dat from GitHub using bitsadmin.exe. The downloaded payload is saved in the settings.dat file in the randomly chosen subdirectory of %USER%\AppData\Local. Stage2 decrypts it using AES-CBC with the key zbcd1j9234r670eh and an IV equal to the key. The decrypted payload is then saved in the DLL file specified in the ShellFolder registry subkey.

The decrypted payload is set as InprocServer32 at HKCU\SOFTWARE\Classes\CLSID\{B210D694-C8DF-490D-9576-9E20CDBC20BD}, which is a COM object used by the \Microsoft\Windows\WindowsColorSystem\Calibration Loader scheduled task. This task runs every time a user logs in, allowing the malware to run during every user session.

Before quitting, Stage2 also removes the changes made under the HKCU\SOFTWARE\Classes\CLSID\{722D0F89-B69C-4700-AE8C-4A44350E4876} registry key, unsets the MI_V environment variable (and MI_V2 in newer versions), and removes the scheduled task that launched Stage2.

Malicious agent

Early payload versions decrypted themselves using the 0xB0C1D4E9 rolling XOR key, where the decryption key for the i + 1 block is the encrypted content of the i block (each encrypted block being four bytes long). The most recent agent versions don’t do that.

The samples we found had string encryption; they use a simple substitution with a key that corresponds position-by-position to the following alphabet: ABCDEFGHIJKLMNOPQRSTUVWXYZabcdefghijklmnopqrstuvwxyz0123456789@#$./:<>*&~. The decryption process involves finding the position of each symbol of the encrypted strings in the key, and replacing it with the symbol that occupies the same position in the alphabet.
During our investigation, we found the following keys were used:

  • 17htUno/I3L&fK2H#yapE@b5NqZ$Q4xmeF.s96uB>jkdWCPvAgD*XwO:iR~TMrV0YGl8z<JSc
  • 71htUno/I3L&fK2H#aypE@b5NqZ$Q4xmeF.s96uB>jdkWCPvAgD*XwO:iR~TMrV0YGl8z<JSc
  • E1hUtno/IL3&fK2H#ypa7@b5NqZ$Q4xmeF.s69uB>jkdWCvPAgD*XwO:iR~TrMV0YGl8z<JcS

All symbols not used in the key remain unchanged.

String decryption

String decryption

The payload checks for the presence of the following security solutions using the output of the tasklist command:

  • Kaspersky
  • Avast
  • McAfee
  • BitDefender
  • MalwareBytes
  • +36 other solutions
Security solution detection logic

Security solution detection logic

The payload itself is a RAT with broad functionality. The default C2 server is asper1[.]freeddns[.]org for earlier versions and Winst0[.]kozow[.]com for the latest versions of the payload. Both domains point to 186[.]158.223.35. We also saw another IP address for the first C2 in pDNS records, though we haven’t actually seen it in use. The C2 address can change based on a C2 reply or when certain conditions are met. For example, if the user’s default locale is set to “zh-CN”, the RAT sets its C2 address to country1[.]ignorelist[.]com. During most of our investigation, this domain pointed to 127[.]0.0.1, but starting April 26, it has been pointing to 186[.]158.223.35 as well.

The payload sends UDP heartbeats to port 57441 of the C2 server. These heartbeats contain information about detected security solutions, system startup time, time since last input activity, architecture info, machine IP address and username.

The C2 may respond to the heartbeat. Based on this response, the payload can perform different actions. Below is the full list of available commands.

Response first byte Description
0x31 Run DLL on the system
0x57 Send UDP request to the specified address
0x55 Open file or link from the response
0x50 Collect information about the infected system (e.g. process list and architecture)
0x53 Execute command from the response using ShellExecuteW
0x52 Run the file specified in the response using WinExec
0x42 Delete the file specified in the response
0x41 Update C2 domain
0x59 Get new payload: connect to C2 port 63559/UDP, get new DLL and update COM path in the registry

The C2 can also set a flag in the response that will turn on the extended RAT mode. In this mode, the payload communicates with the C2 server using the 3747/tcp port.

TCP communications are encrypted using a simple substitution cipher. Each character is replaced using a fixed mapping defined by the key:

koP]Y4Os-_t?cB',aK.Wm>QM2[U!^C`*@Ff:X\6Dp8H%ATydE<e(#G&LhwRZ5znjJqgNrl)I7V$3=910"+Svxi/;ub

This key corresponds position-by-position to the standard ASCII character sequence:

!"#$%&'()*+,-./0123456789:;<=>?@ABCDEFGHIJKLMNOPQRSTUVWXYZ[\\]^_`abcdefghijklmnopqrstuvwxyz{|}

In other words, each character in the ASCII set is replaced by the corresponding character in the key string.

C2 requests and responses are divided into two parts by the first space character. The first part is a command and the second part is usually an argument.
After connecting and before receiving information from the C2, the malware sends metadata about the infected machine using the NOOP command. This metadata includes a run cycle counter, mounted drive metadata, time since the last input activity and data about the display settings.

Based on the C2 command, the malware can execute commands on the infected machine, perform reboot and shutdown actions, control the cursor, take screenshots, compress files into archives, and send files to other specified servers. In short, it can fully control the machine. The full list of commands is as follows:

System control

  • KILL REBOOT: Reboots the infected system
  • KILL POWER: Shuts down the infected system
  • KILL SELF: Same as the QUIT command (described below)
  • KILL ME: Exits process running the malware

Surveillance

  • SCREEN / SCREEN9: makes a screenshot, saves it to the ~wra1269.tmp file and sends it to the C2

File operations

  • DELETE <filename>: deletes specified file
  • DELDIR <dirname>: deletes specified directory
  • REN <file path 1>#<file path 2>: moves specified file
  • MAKDIR <path>: creates directory
  • ZIPFILE <file or folder name> / ZIPFOLDER <file or folder name>: compresses specified file/folder into a .zip archive
  • TAR <file or folder name> / TAR2 <file or folder name>: compresses specified file/folder into a .tar archive
  • GETFILEDATE <filename>: sends file’s last modification date
  • SETFILEDATE <filename>: sets file’s last modification date
  • GETFILEACC <filename>: sends file’s last access date
  • DWLOAD <filename>: sends file to the C2
  • UPLOAD <filename>#<C2 address>: uploads file to the specified C2 server

Reconnaissance

  • USER: sends username
  • KALIVE: sends run cycle counter
  • IDLE: sends number of seconds passed since last input activity
  • DRIVES: sends information about mounted drives
  • FOLDEX <folder type>: sends full path to a directory of the specified type:
  • – type = 0x63: temporary directory
  • – type = 0x64: \Google\Chrome\User Data\Default\ in AppData\Local folder
  • – type = 0x65: \Downloads\ in user home directory
  • – type = 0x66: \Microsoft\Excel\XLSTART\ in AppData folder
  • – type = 0x67: AppData folder
  • LFILES <folder path>: lists and sends paths to all files in the directory
  • OSVER: sends information about user, hostname, OS architecture and version
  • COMPILERDATE: sends constant hardcoded in the RAT, e.g., 25.10.2025

Generic control

  • DSOCKE: recreates TCP keep-alive socket
  • QUIT: notifies the C2 about quitting, closes the socket and stops the process
  • RUNHID <command> / RUN <command>: runs specified command inside ShellExecuteW
  • RUNDOS <command>: runs specified command inside CreateProcessW
  • RUNTASK <command>: creates, runs and deletes task that executes specified command
  • SKEY <key code>: presses specified key
  • MOUSE FREEZE: freezes mouse movement
  • MOUSE <command>: clicks the specified mouse button or sets the cursor position to the specified coordinates

Other delivery methods

During our research, we also observed other delivery methods for the RAT. Instead of patching FFmpeg and downloading the payload from GitHub, the attackers included the main payload as libpython64.dat or another file with a similar name in the lib\py3-windows-x86_64 directory of the game. This .dat file was loaded by one of the libraries used in the game, which was patched for this purpose.

In another case, the threat actor posted their malicious DLL file (payload downloader) on a gaming forum, disguising it as a cheat.

Infrastructure

Our research revealed the following infrastructure was used in this attack.

Domain IP First seen ASN
asper1[.]freeddns[.]org 181[.]116.218.56 September 16, 2024 11664
186[.]158.223.35 July 01, 2025 11664
country1[.]ignorelist[.]com 186[.]158.223.35 September 10, 2025 11664
127[.]0.0.1 November 11, 2025
Winst0.kozow[.]com 186[.]158.223.35 April 26, 2026 11664

Victims

According to our telemetry, hundreds of individuals were infected with this malware. The majority of the victims were located in Russia, Brazil, Germany and Vietnam.

Distribution of victims (download)

Attribution

Based on the language of the comments in the code, infrastructure data and other facts we assess with medium confidence that the developer of the downloader chain speaks Spanish.

The actor behind this attack uses Spanish in variable names and comments. For example, the Base64-decoded delivery script contains the following lines:

Part of the PowerShell script used in the payload delivery

Part of the PowerShell script used in the payload delivery

In addition, the JavaScript code from the website distributing infected games contains variable names, function names and comments in Spanish:

JavaScript code from the malicious site

JavaScript code from the malicious site

Notably, the malware payloads used in this attack had previously chosen 127.0.0.1 as their C2 server when the victim’s default locale is set to “zh-CN”, thus not targeting Chinese users. This may indicate that the attacker is associated with a Chinese-speaking threat actor or uses payloads developed by a Chinese-speaking threat actor. However, we still believe it’s unlikely that the developer of these delivery chains is Chinese-speaking.

Conclusions

The Argamal Trojan is a new RAT targeting individuals who seek adult games. During our analysis, we observed a steady stream of updates to the payload, including the addition of new features and fixes for various bugs, as well as changes to the infrastructure. This leads us to believe that the threat actor behind this malware will continue to develop and enhance it. The campaign’s goal is likely data and credential theft; however, the RAT enables the attacker to take full control of the device and execute any malicious activity they want.

Creating malware in today’s development landscape has become significantly easier thanks to the wide availability of detailed guides, tooling, and automation resources. As a result, it is crucial not only to detect known malware but also to identify new and evolving threats as they emerge. Kaspersky solutions prevented the malicious activity in the earliest stages of the attack. The solutions help ensure device security by identifying not only known threats but also the behavior of the software and its actions, providing comprehensive protection against malware.

Indicators of Compromise

File hashes
RAT payloads:
76253fb55aed707440e808ea78e7101318436b1c
1405a3c5e0aeb08012484134e16cdec4ab29b4a4
535f4337f261b6da20a3c614eb13270bed2d533a
d2cb0d7a9ad2b5d4ea7c2da8aec62beb37cf36d6
e05f1767c2a337910ed75e90288838d6d0541164
dad26f61da7b8bccc78364411812be74c025b475
29f1d346a6e71774c7dad25b90f446b2974393df
e815a9b418d09c2d4bcd074c2c0bc21406eeb22f
17f8f8f34dfa737f36182fed7ff9e9814a114058
954722b0c9c678b1313d1f8b204e102842dc5889
69331cfdac792dc79240e6a6bb6e803eabd70beb
901cfa97b1baaf908fd4a02bb52d970f576c4193
5f1f3689bcf23de1b280b5f35712946da0f7978f
c2d9d48b3b10bd58cdf5df9463e3ffcd60533ff3
2423a5bf0fa7cb9ec09211630a5488629499691b
ae4601a19d28332a3ec6ac31b385cdf53be53450

Trojan downloaders:
9803604ec45f31f9ef75bcca1e1310d8ac1fc3a6
edce72f59e4c1d136cd1946af70d334c19df858d
02819d200d1424882af81cb504b3e8614b32397a

Domains and IPs
asper1[.]freeddns[.]org
Winst0[.]kozow[.]com
Country1[.]ignorelist[.]com
186[.]158.223.35

GitHub repositories used in the campaign
hxxps://github[.]com/gmz159/u
hxxps://github[.]com/DnyP/files
hxxps://github[.]com/mgzv/p
Wardriving assessment across Mexico: Preparing for the 2026 World Cup

2 June 2026 at 14:00

Introduction

Mexico is one of the host countries for the 2026 FIFA World Cup, with matches to be played in three major cities: Mexico City, Monterrey, and Guadalajara. These locations are expected to see a large influx of international visitors, increasing the potential security risks. Many of those risks arise from users connecting to public wireless networks.

To better understand the wireless environments that visitors may encounter, we at Kaspersky GReAT conducted a wardriving assessment in the three host cities. The aim of the study was to analyze characteristics, deployment patterns, security configurations and potential exposure risks of public Wi-Fi infrastructure in urban wireless environments.

The information collected during the assessment was used exclusively for passive observation and infrastructure analysis. No attempts were made to authenticate, intercept communications, exploit systems or interact with the detected wireless networks beyond the publicly broadcast management information.

During processing of the collected data, one step involved filtering out networks belonging to cars or cell phones categorized as mobile hotspots because they do not represent networks that can be considered part of the assessment.

Research scope

The cities included in the study have high population density and extensive wireless infrastructure deployments. We chose areas with the most prominent wireless network activity and highly concentrated public access points. We carried out wardriving research in Monterrey back in 2008, but the city’s hotspot landscape has changed since then.

We chose the following analysis areas for each of the cities:

  1. Mexico City: México City Stadium, Mexico City International Airport, Zócalo, Paseo de la Reforma, Colonia Roma, La Condesa, Polanco, and Coyoacán.
  2. Guadalajara: Guadalajara Stadium, Guadalajara International Airport, the city center, Zapopan, Providencia, Avenida Chapultepec, Colonia Americana, Tlaquepaque, and the area around Andares.
  3. Monterrey: Monterrey Stadium, Monterrey International Airport, Fundidora Park, Cintermex Monterrey, the downtown area, Barrio Antiguo, MacroPlaza, and the San Pedro financial district.

The wireless information was collected using passive wireless reconnaissance techniques. The collected information included:

  • SSID analysis and information exposure, including BSSID-derived SSIDs
  • Default router configurations and ISP deployments
  • Frequency and signal characteristics
  • Channel congestion and spectrum usage
  • Wireless security configurations, including:
    • Open and insecure wireless networks
    • WPS-enabled networks
    • Secure networks (WPA2/WPA3) with WPS enabled

We performed a wireless infrastructure analysis in Mexico City, Guadalajara, and Monterrey. We drove through the areas surrounding the World Cup stadiums, tourist zones, and other places where fan concentrations are likely to be largest. Our goal was to evaluate the security status, deployment characteristics and operational exposure of detected wireless networks.

In total, we recorded 84,588 signals with 69,473 unique Service Set Identifiers (SSIDs) in busy locations and World Cup zones across the three cities. Mexico City accounted for 61.4% of the signals, Guadalajara for 23.6%, and Monterrey for 14.8%. Approximately 82% of the signals had a single SSID (81.9%, 81.34%, and 84% respectively). Notably, they all operate under the IEEE 802.11 standard protocol.

Particular attention was given to identifying standard deployment patterns, legacy configurations, default vendor settings and information disclosure through publicly broadcast wireless identifiers.

The following sections present the results that were obtained by analyzing wireless infrastructure across the three locations.

Our findings

SSID analysis and information exposure

SSID analysis was conducted to evaluate naming conventions, deployment standardization and potential information exposure.

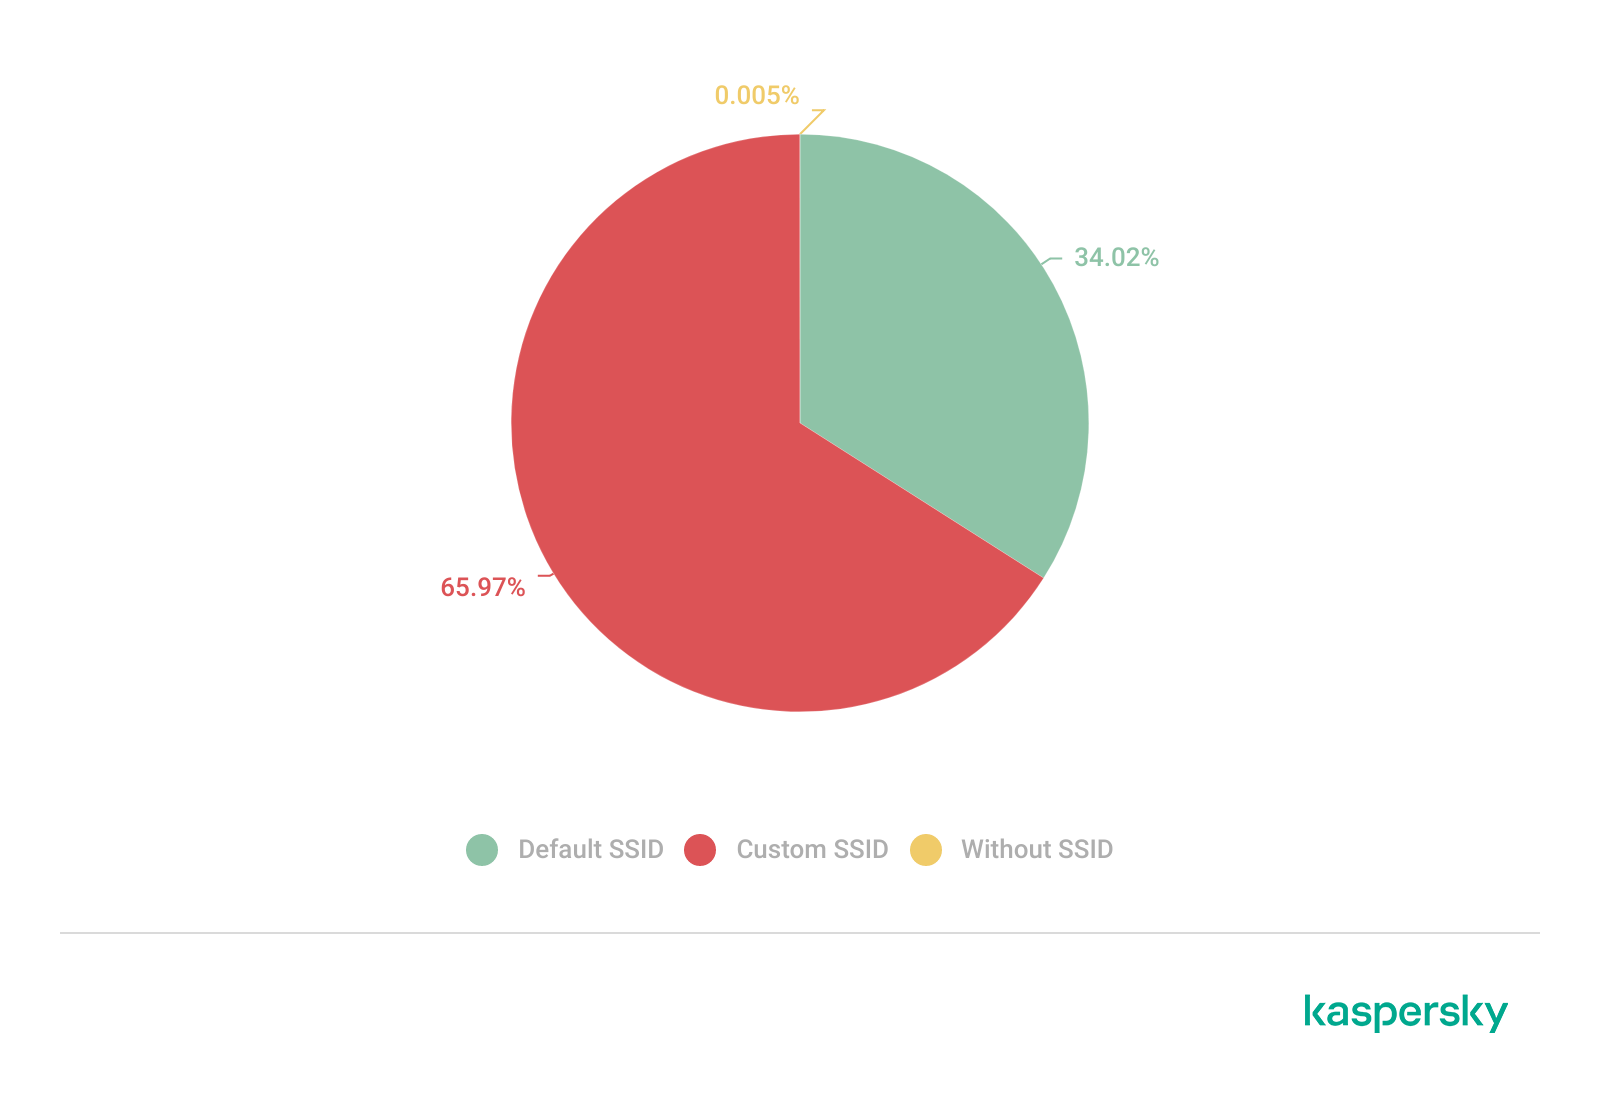
Only a few networks (0.0047%) have an invisible SSID, meaning the names of these networks are not broadcast. Some users prefer to hide the SSID for various reasons, such as the network’s purpose, the profile of its users, internal policies, etc. In contrast, the rest of the networks maintained active SSID broadcasting.

SSID structures may unintentionally disclose operational details about internet service providers (ISPs), device manufacturers, deployment practices, organizational ownership or user identity. The repeated presence of default SSID naming patterns across the analyzed locations indicates a significant degree of infrastructure homogeneity and reuse of default wireless configurations. It may also facilitate passive infrastructure profiling by revealing standard characteristics in use.

Approximately 34% of the detected networks retained the default SSID naming conventions provided by the manufacturer or ISP, while 66% used customized identifiers.

Distribution of SSID naming conventions (download)

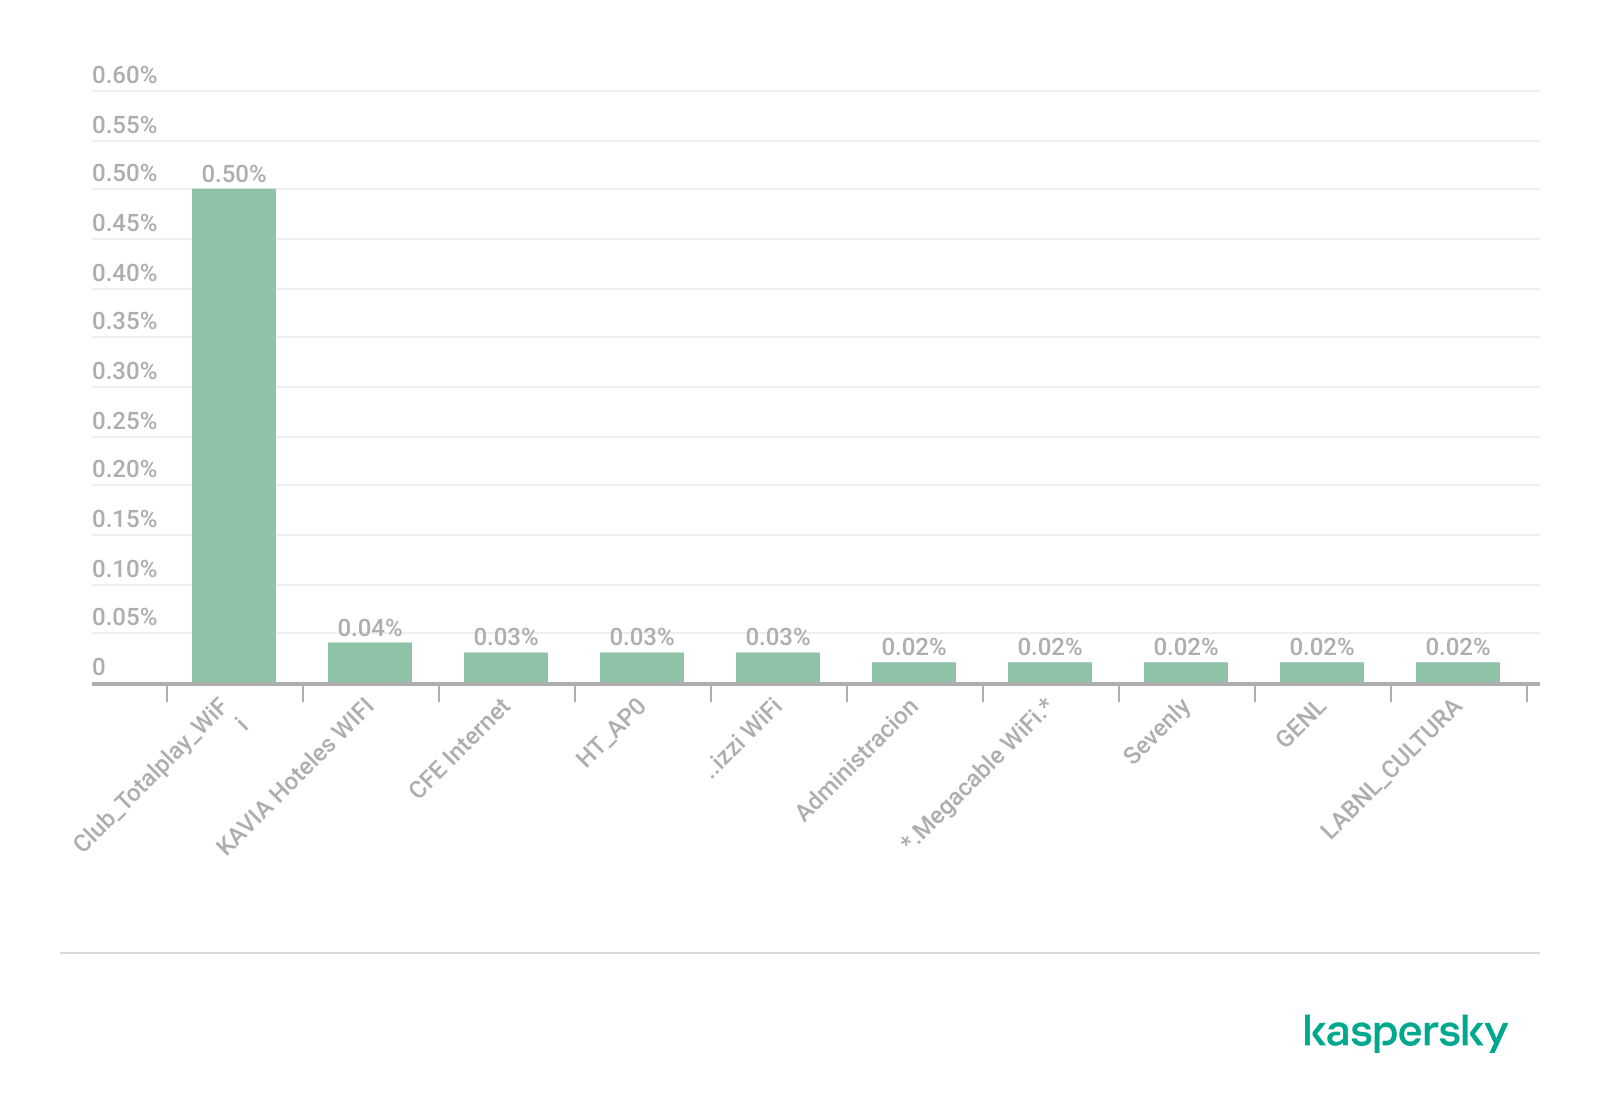
Several recurring SSID naming conventions associated with ISP-provided deployments were identified in the three cities. The most frequently observed patterns include identifiers such as “Club_Totalplay_WiFi”, “izzi WiFi”, and “Megacable WiFi”, which suggests extensive standardization of wireless infrastructure deployment. Additionally, we observed distinctive location-specific SSIDs in each area of analysis, such as “XXXX-Internet para Todos-CDMX” or “RED JALISCO”.

Most frequently observed SSID patterns (download)

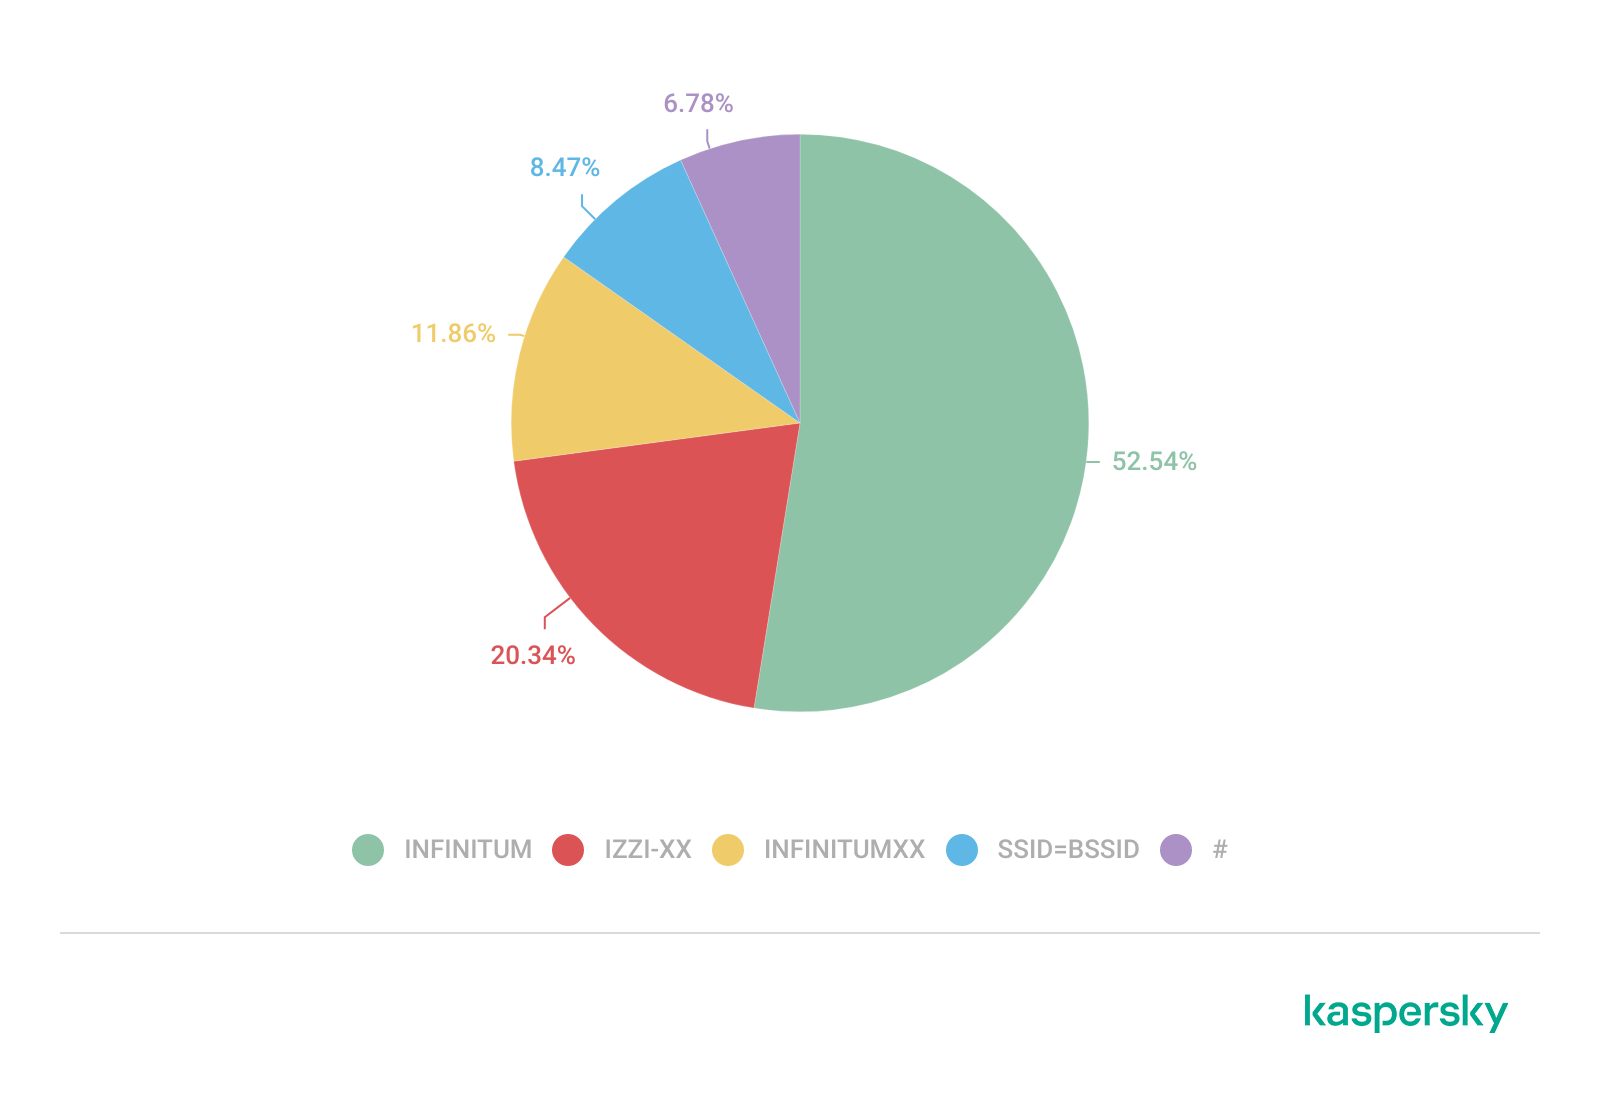
Sequential SSID naming structures were also identified during the analysis. Patterns such as “INFINITUMXX” and “IZZI-XX” suggest automated ISP deployment and large-scale deployment strategies.

We identified 33 unique sequential naming structures among the 137 sequential SSIDs in total, representing approximately 0.16% of the detected wireless networks.

The following graph shows the top five sequential SSID patterns found in the largest number of networks:

Five most frequently observed sequential patterns (download)

Several customized SSIDs contained personal or organizational identifiers, including family names, professions, addresses or internal department references. Although personalized SSIDs may simplify local network identification for users, they may also expose sensitive information that could be useful for social engineering, physical targeting, or organizational profiling.

BSSID-derived SSID

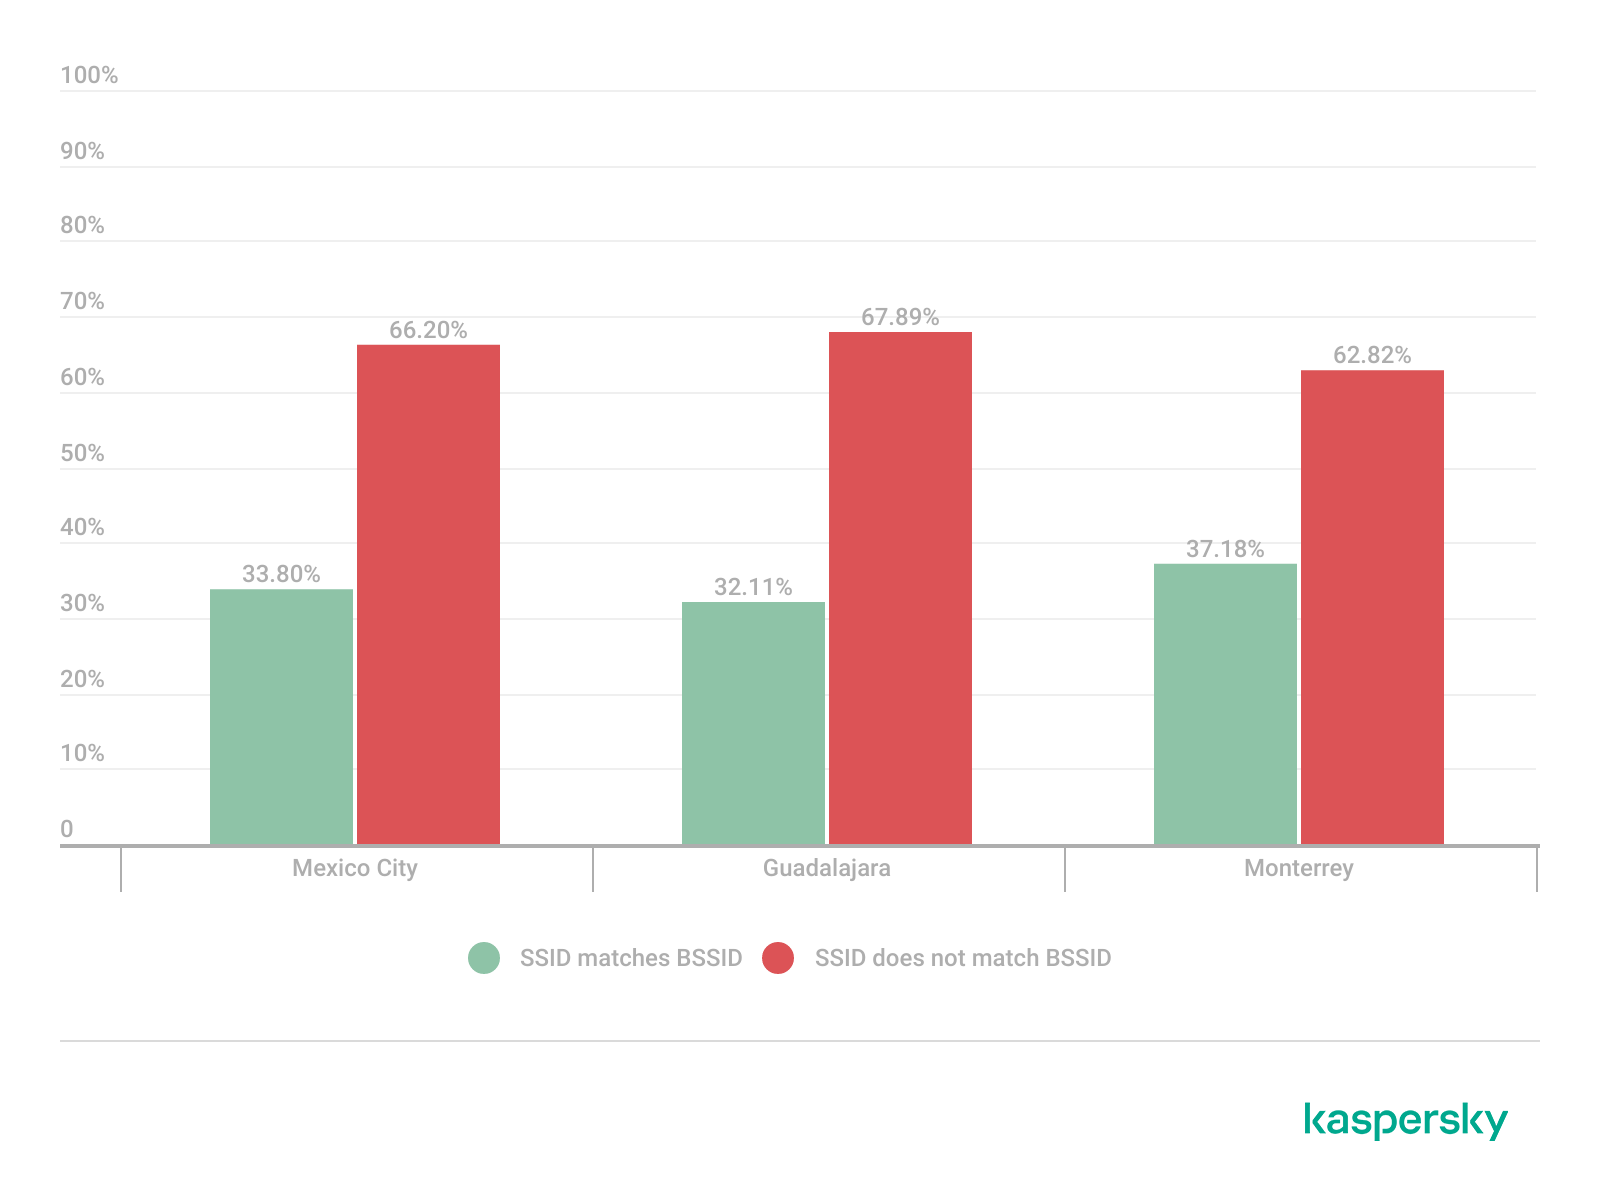
During the analysis, multiple networks were identified that used the physical MAC address of a Wi-Fi access point (BSSID) as the visible SSID. This practice exposes hardware-level information that could facilitate vendor fingerprinting and targeted reconnaissance activities.

The organizationally unique identifier (OUI) contained in the first bytes of the BSSID identifies the equipment manufacturer. Threat actors can correlate exposed manufacturers with device-specific vulnerabilities.

BSSID-derived SSID by city (download)

Notably, we found that more than 30% of networks in all three cities reuse the MAC address as the SSID.

Default router configurations and ISP deployments

We performed wireless infrastructure profiling to identify the most common wireless equipment manufacturers and ISP deployments across the three locations.

Large-scale ISP deployments frequently use standardized wireless configurations and vendor-specific hardware platforms. Identifying dominant manufacturers and ISP naming conventions can provide insight into infrastructure and deployment practices facilitating the mapping of standardized attack surfaces.

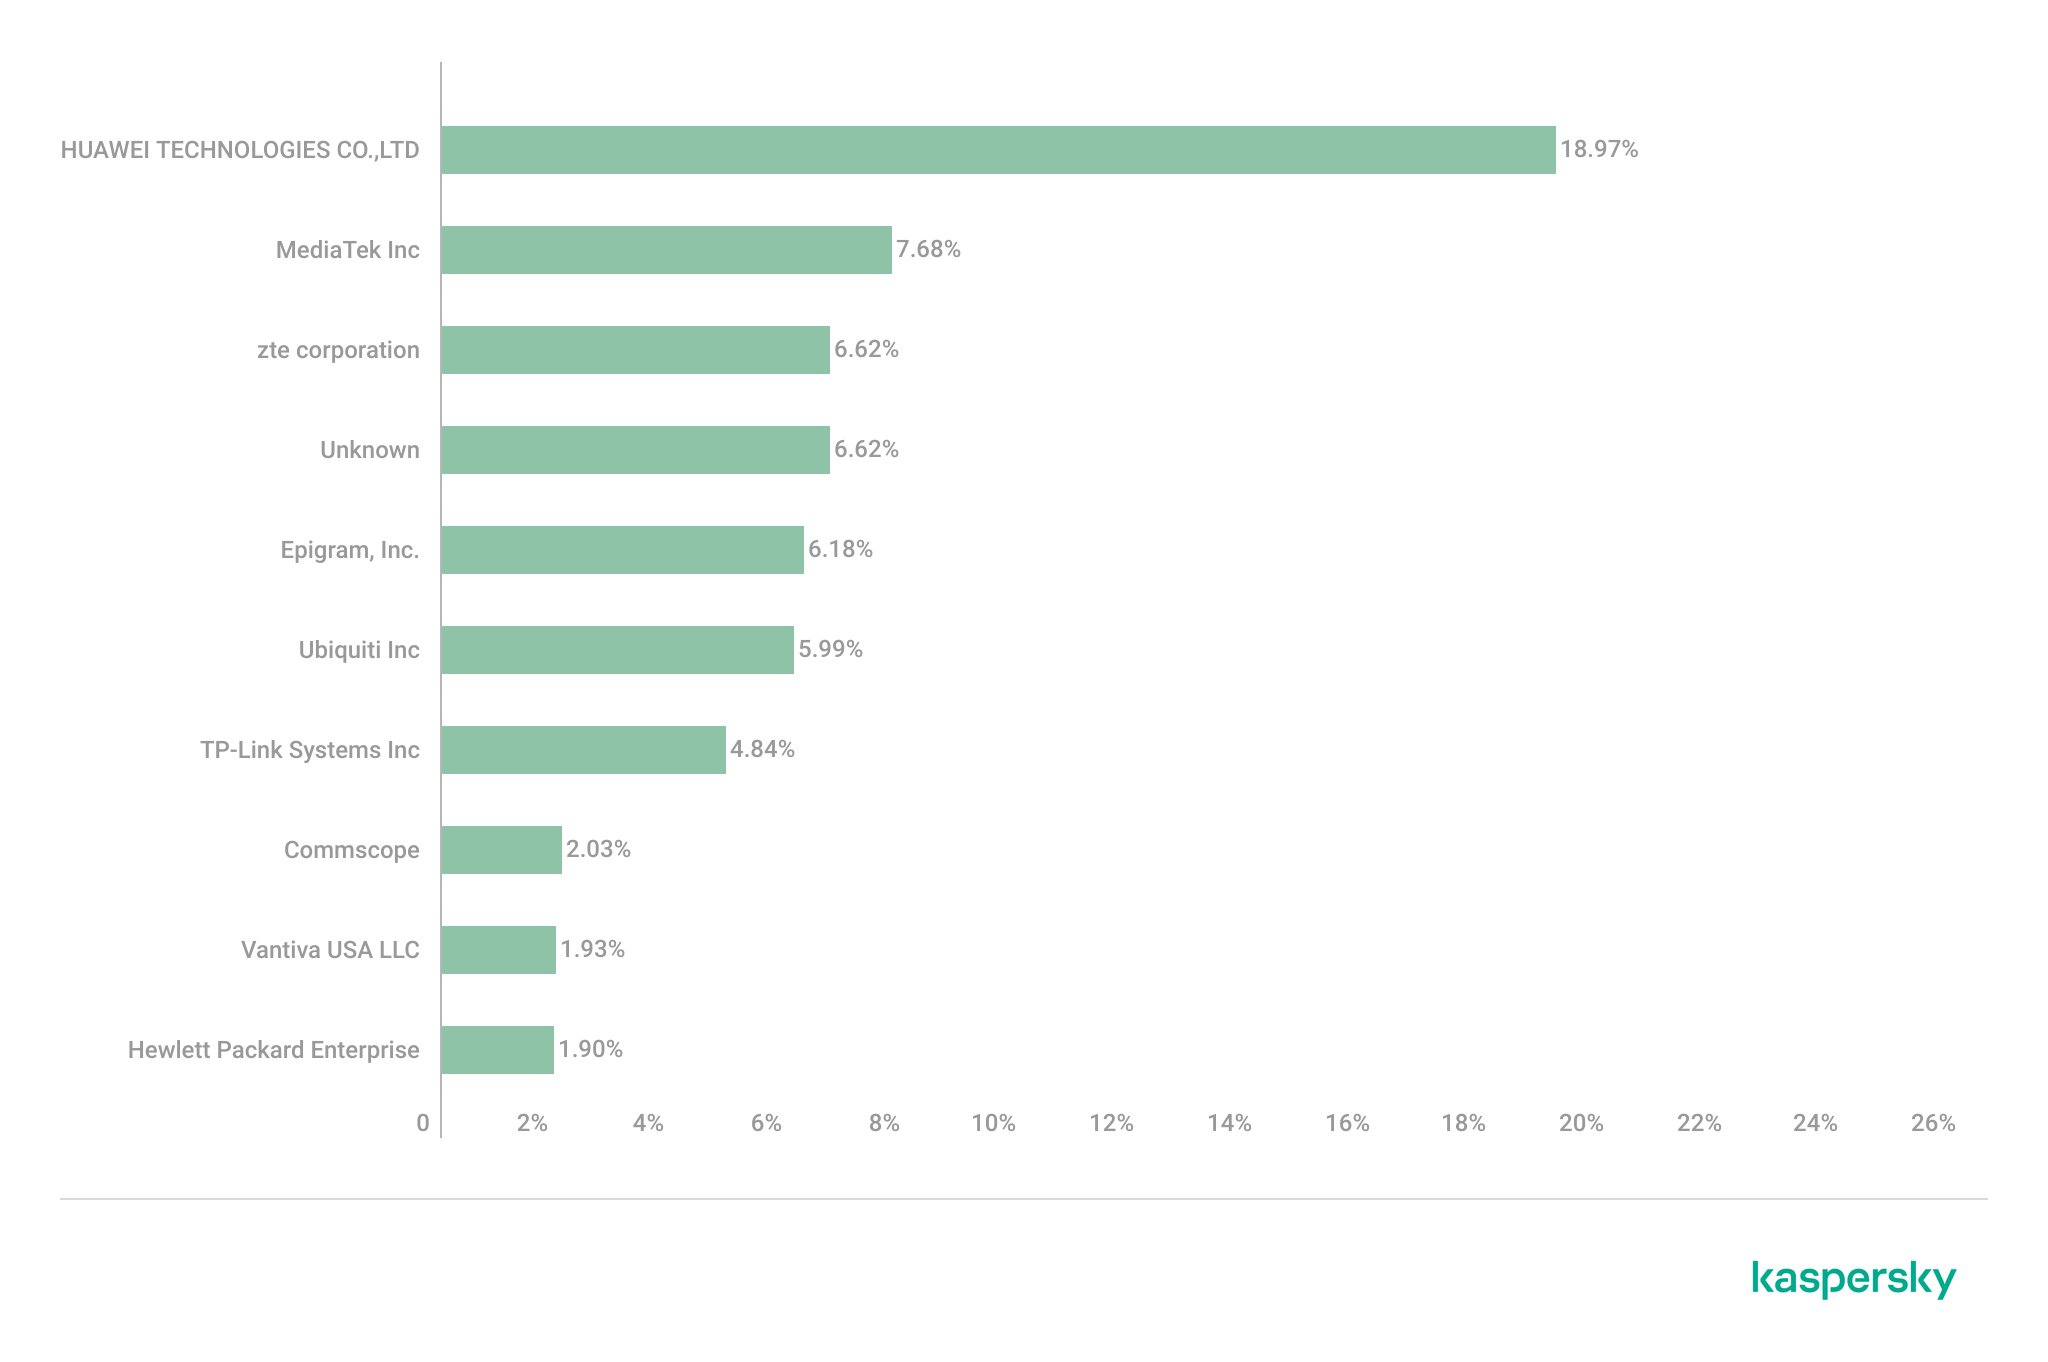
The following figure shows the distribution of the most commonly used manufacturers.

Most frequently observed wireless equipment manufacturers (download)

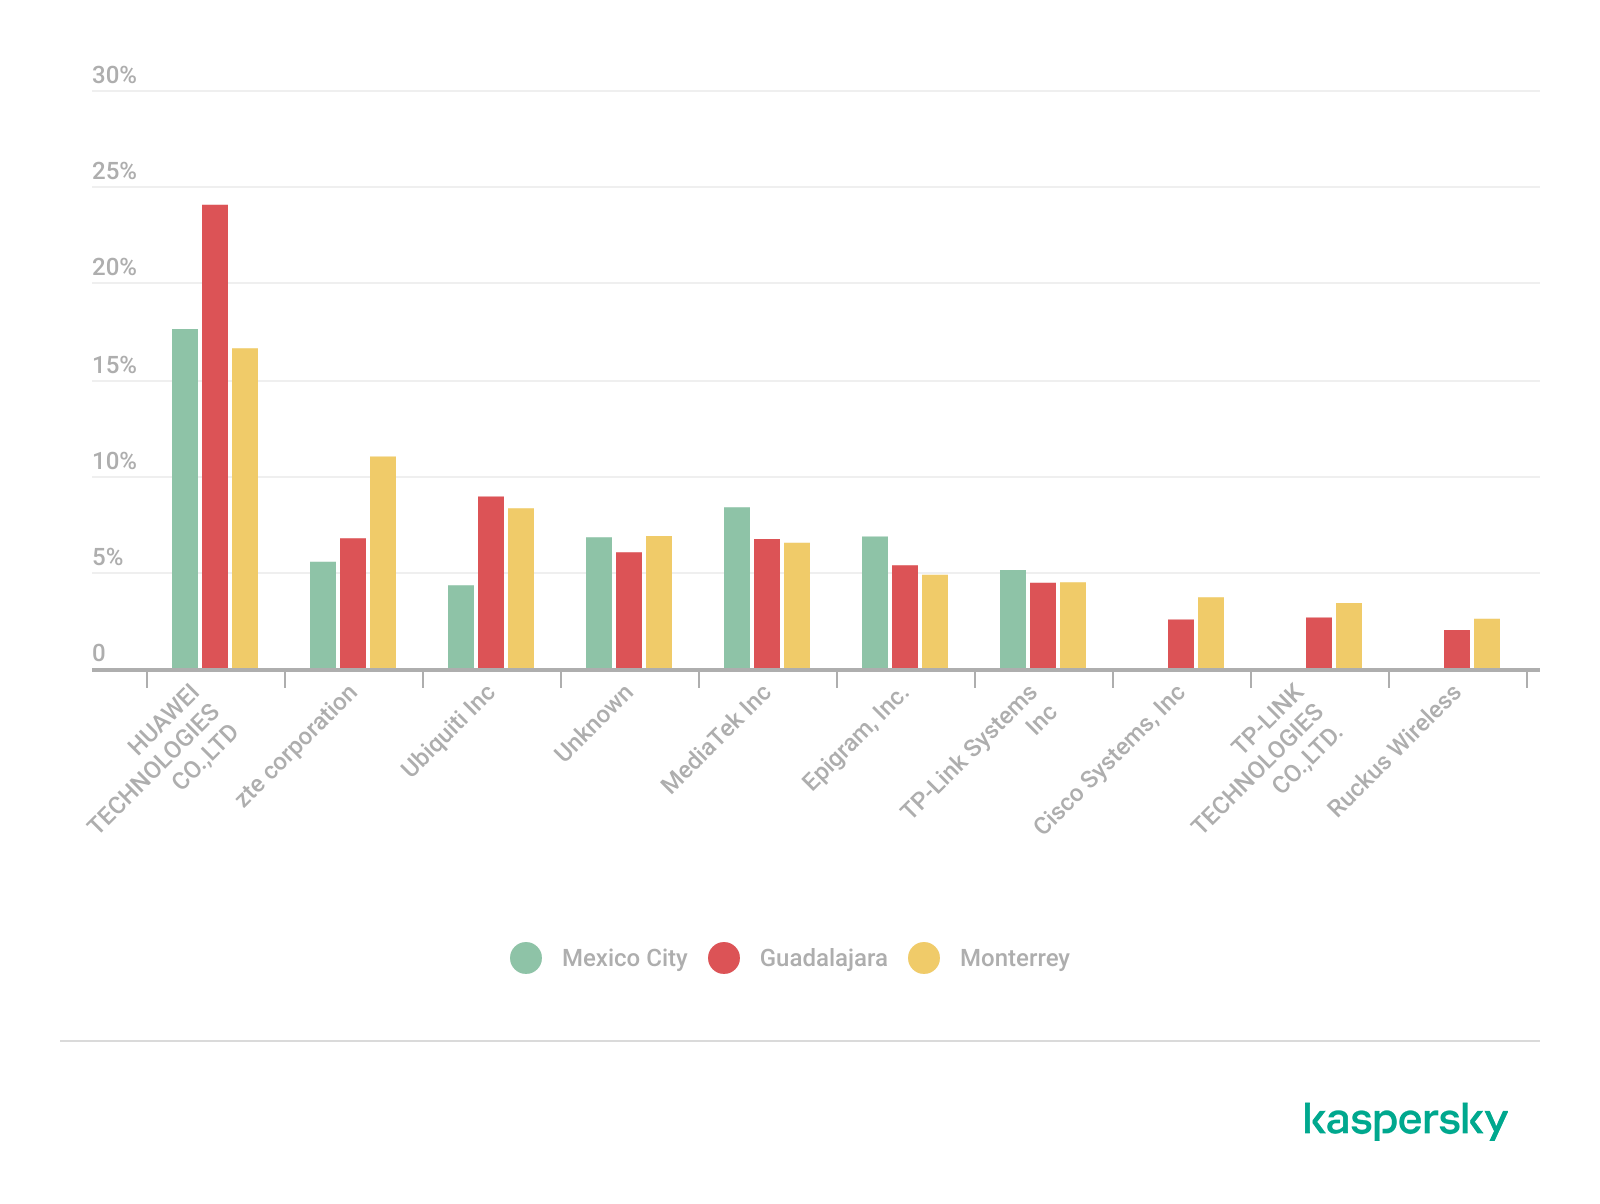
The manufacturer analysis revealed a strong concentration of wireless infrastructure among a limited number of vendors. Across the three locations, Huawei Technologies, MediaTek-based devices, and other manufacturers’ equipment that is distributed through ISP channels represented a significant portion of the detected deployments. Mexico City had the most diverse infrastructure, while Monterrey and Guadalajara had a greater concentration of wireless equipment known as SOHO (small office/home office) or residential-grade hardware. The widespread presence of standard vendor platforms may facilitate infrastructure fingerprinting and large-scale targeting of known device-specific vulnerabilities.

Most frequently observed wireless equipment manufacturers across the three cities (download)

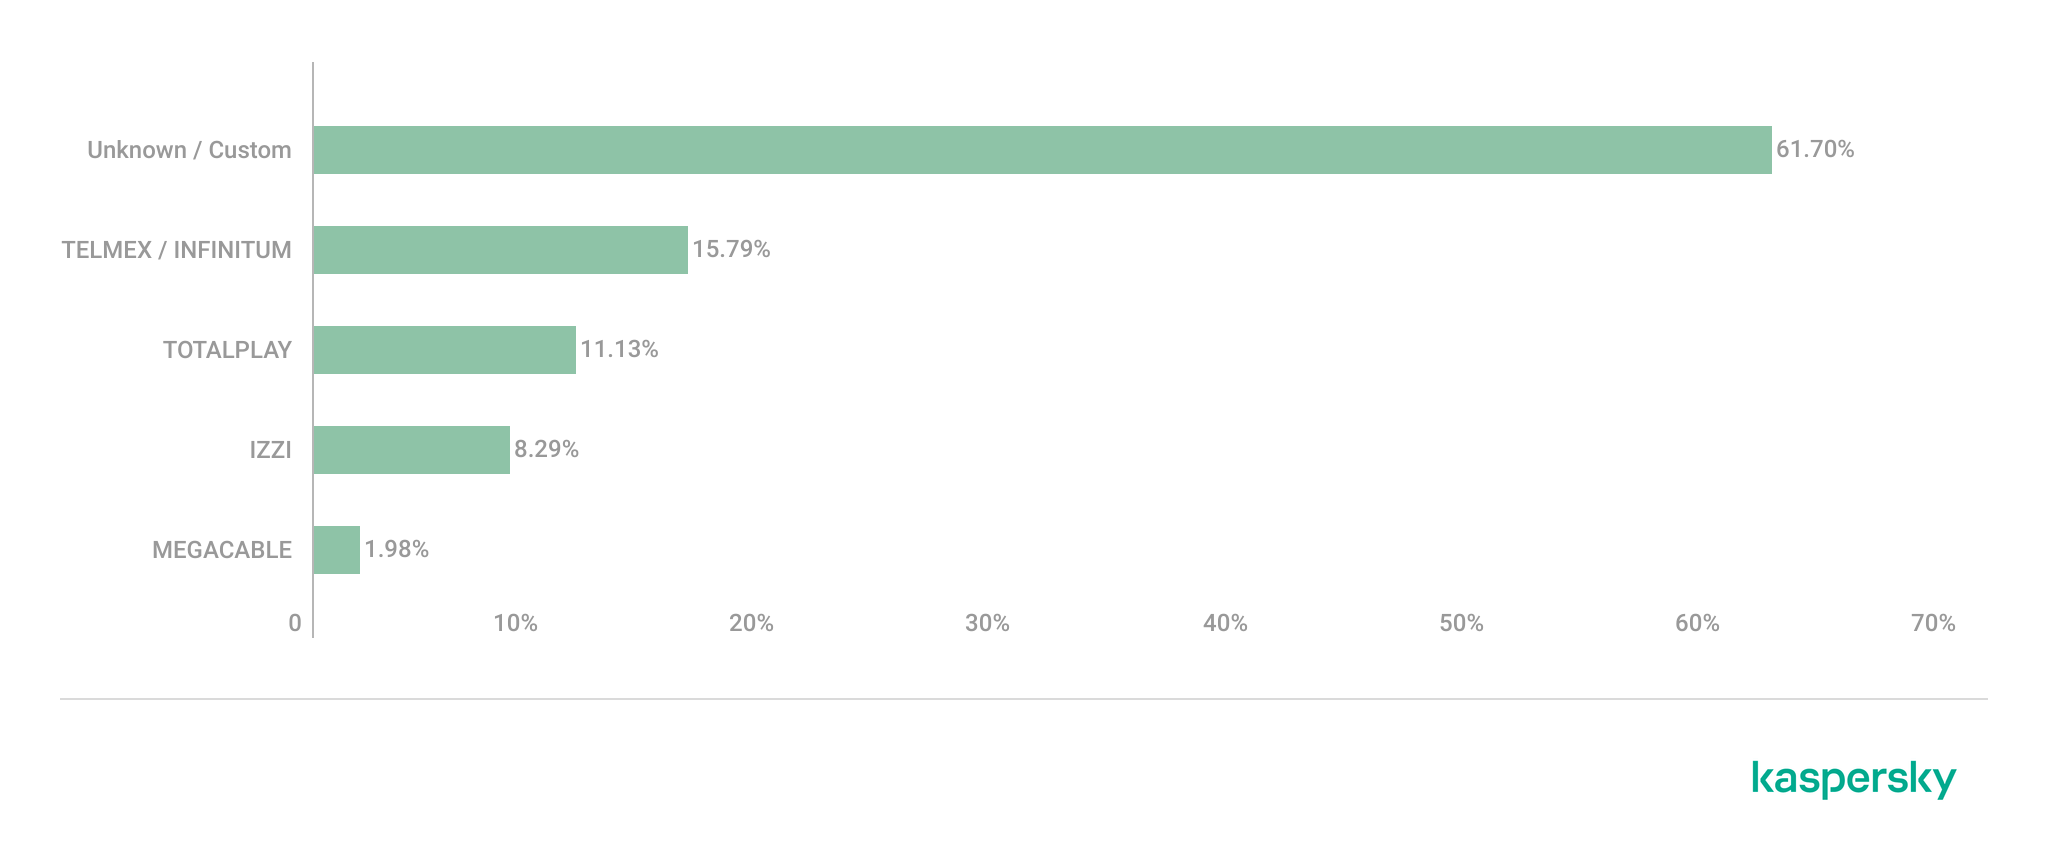
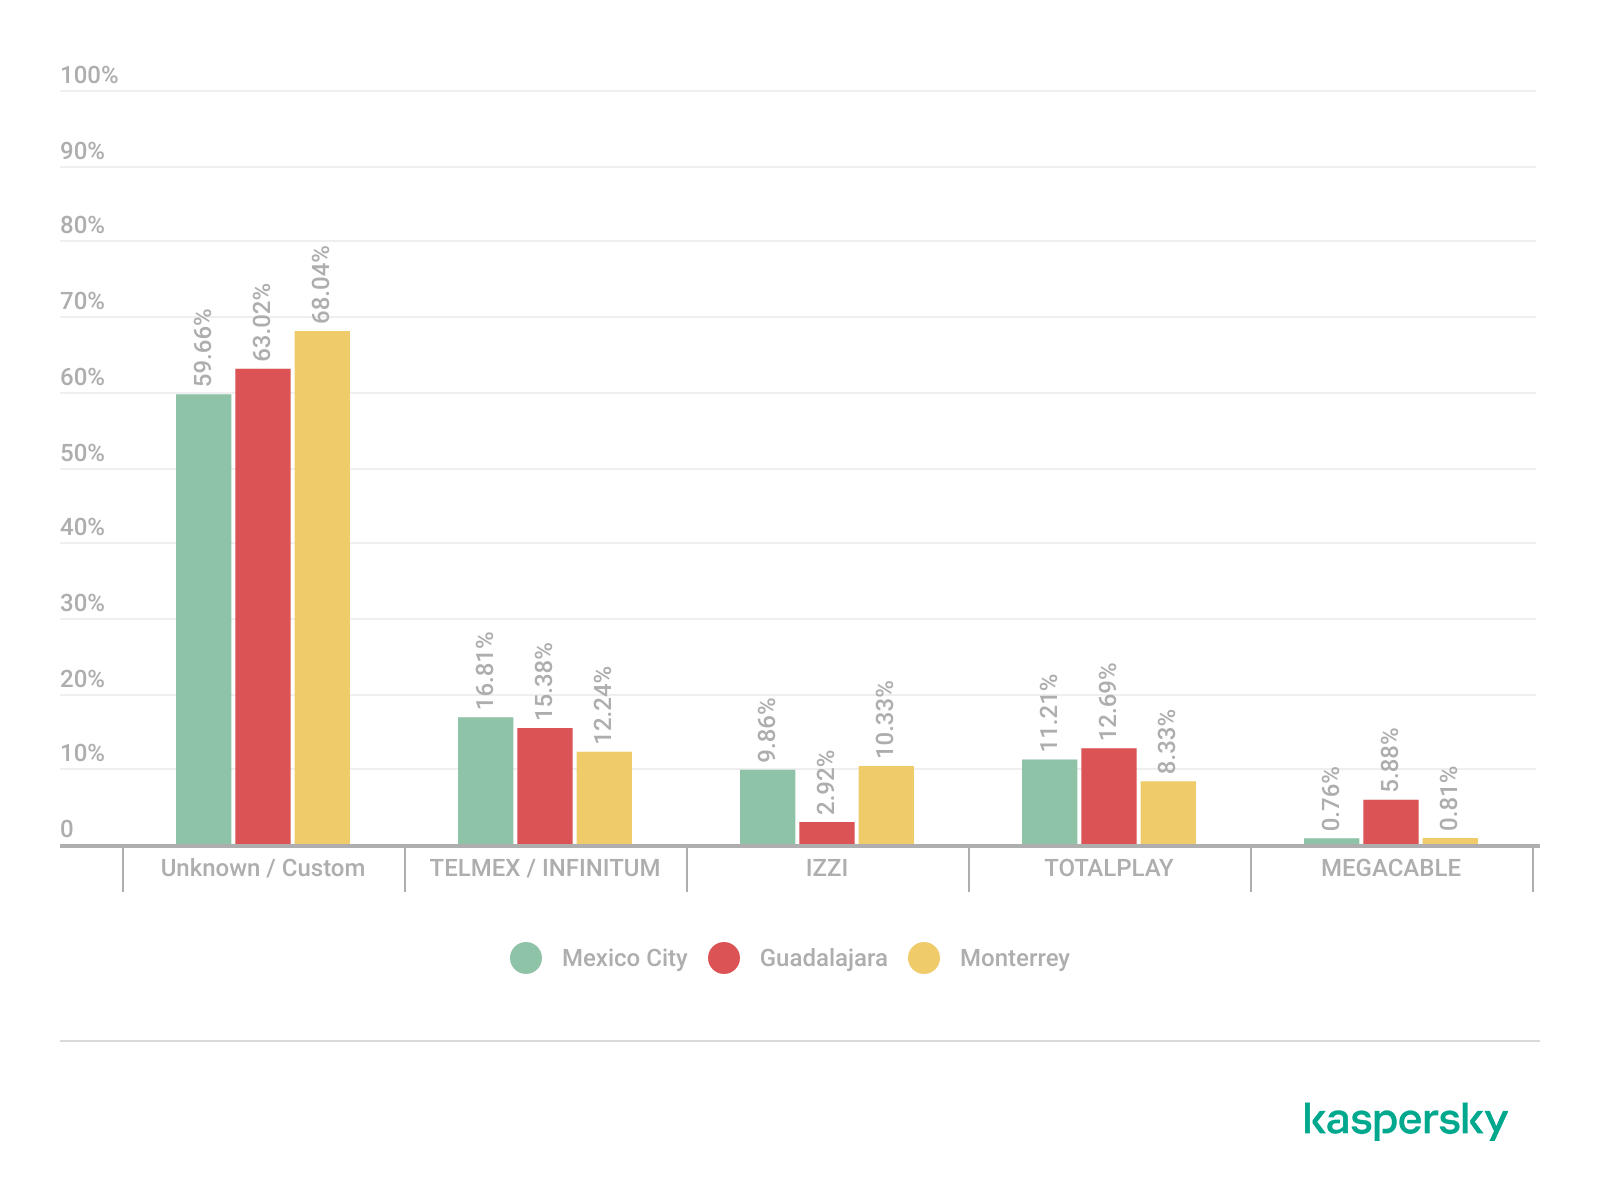
ISP deployments frequently exhibited standardized configuration patterns and recurring manufacturer identifiers. Our ISP deployment analysis revealed a high concentration of access points associated with major residential internet providers. Deployments associated with Infinitum, Totalplay and Izzi represented a substantial portion of the detected wireless infrastructure across all locations. These findings suggest a high degree of deployment standardization across networks associated with major residential internet providers. This observation was supported by the repeated presence of ISP-associated SSIDs such as “Infinitum”, “Totalplay”, and “Izzi”, combined with manufacturer identifiers frequently associated with consumer equipment, including Huawei, ZTE and other residential wireless equipment vendors.

It is important to note that, for this analysis, ISPs were primarily inferred from SSID naming conventions and manufacturer fingerprint data. A significant portion of the detected wireless networks fell into the “UNKNOWN/CUSTOM” category. This classification includes custom hotspots and networks whose naming conventions did not expose identifiable ISP-associated patterns. The findings suggest that many users and organizations (as we saw previously, approximately 66%) use custom network names, limiting direct provider attribution.

The following figure illustrates the distribution of ISP-associated wireless deployments in general.

Most frequently observed ISPs (download)

To better understand this distribution, we took the most frequently observed ISPs by city.

Most frequently observed ISPs across the three cities (download)

Frequency and signal characteristics

We also analyzed wireless signal characteristics to evaluate coverage quality, signal strength, and frequency band utilization in the three cities. In dense urban environments, signal quality and frequency spectrum distribution can affect wireless reliability, client connectivity, roaming performance, and overall network efficiency.

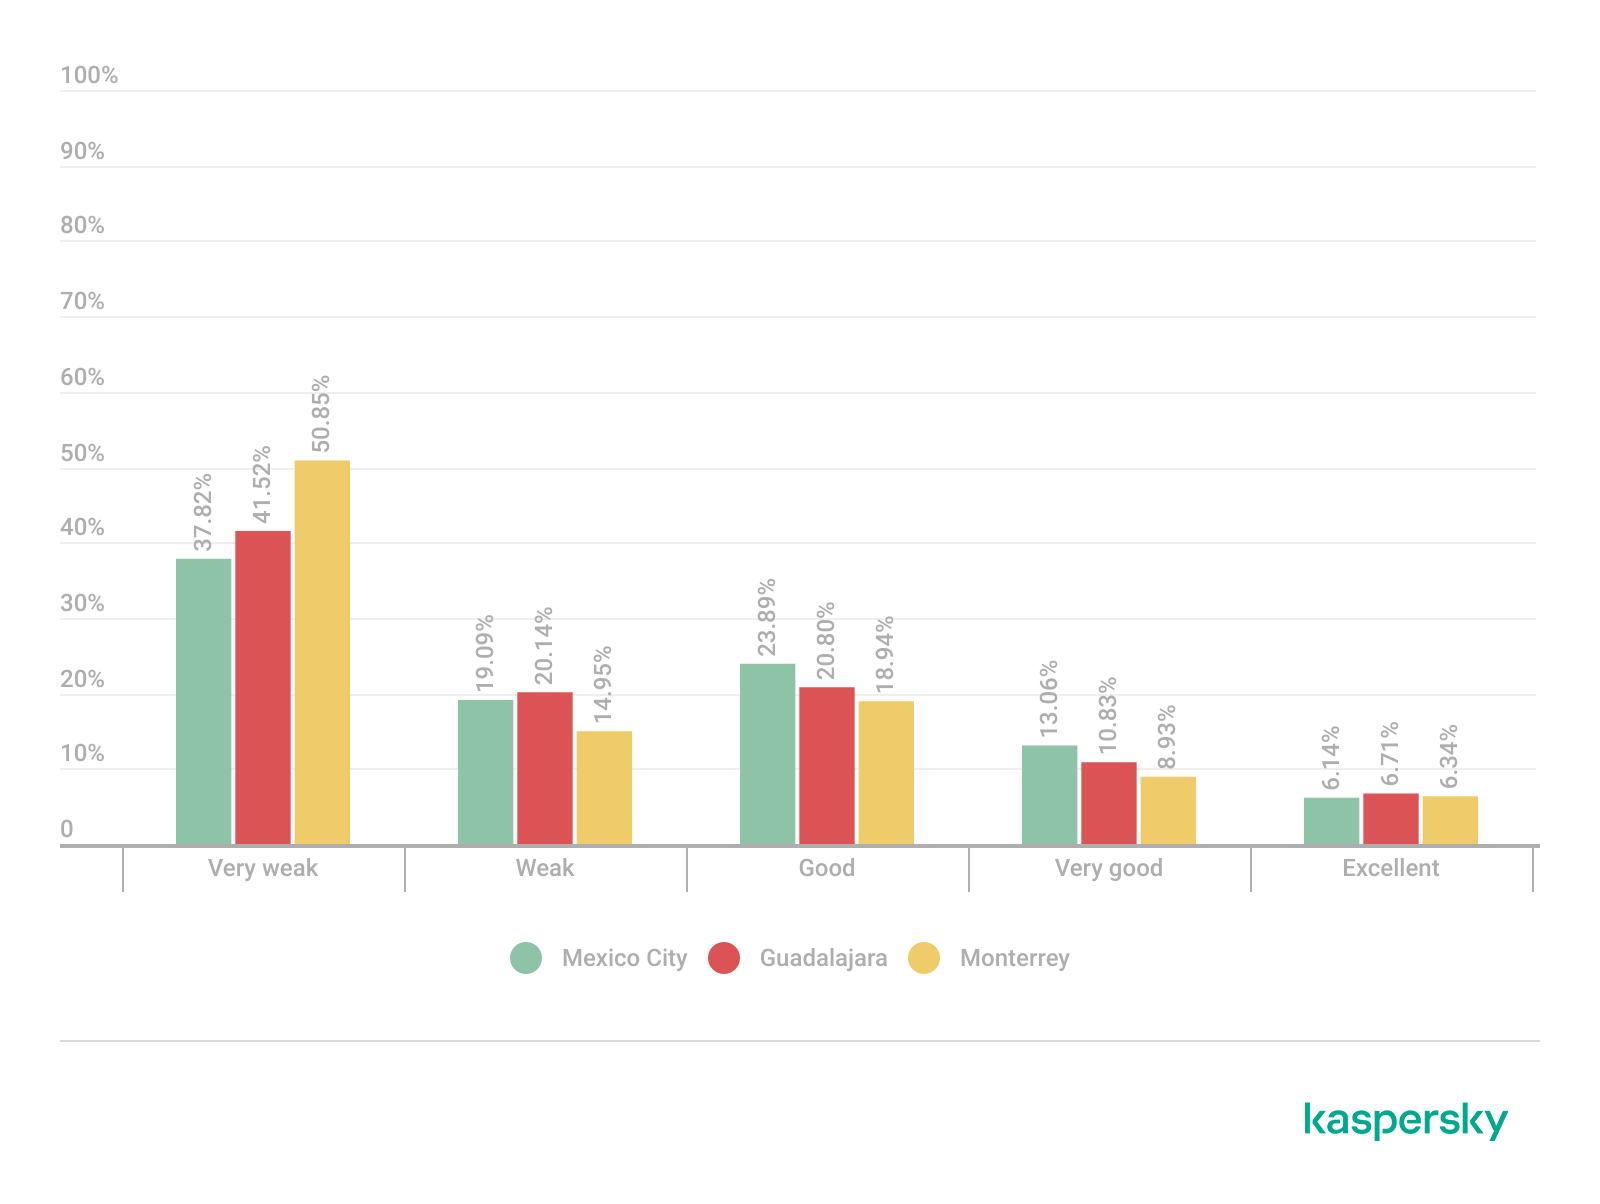
Signal quality analysis revealed that a substantial portion of the detected access points operated under weak or very weak signal conditions. Monterrey had the highest percentage of very weak signals, with approximately 50% of detected deployments. Similar patterns were observed in Guadalajara and Mexico City, suggesting high-density wireless environments with overlapping coverage areas. Only a limited percentage of networks were classified within the very good or excellent signal categories across the three locations.

Signal quality distribution by city (download)

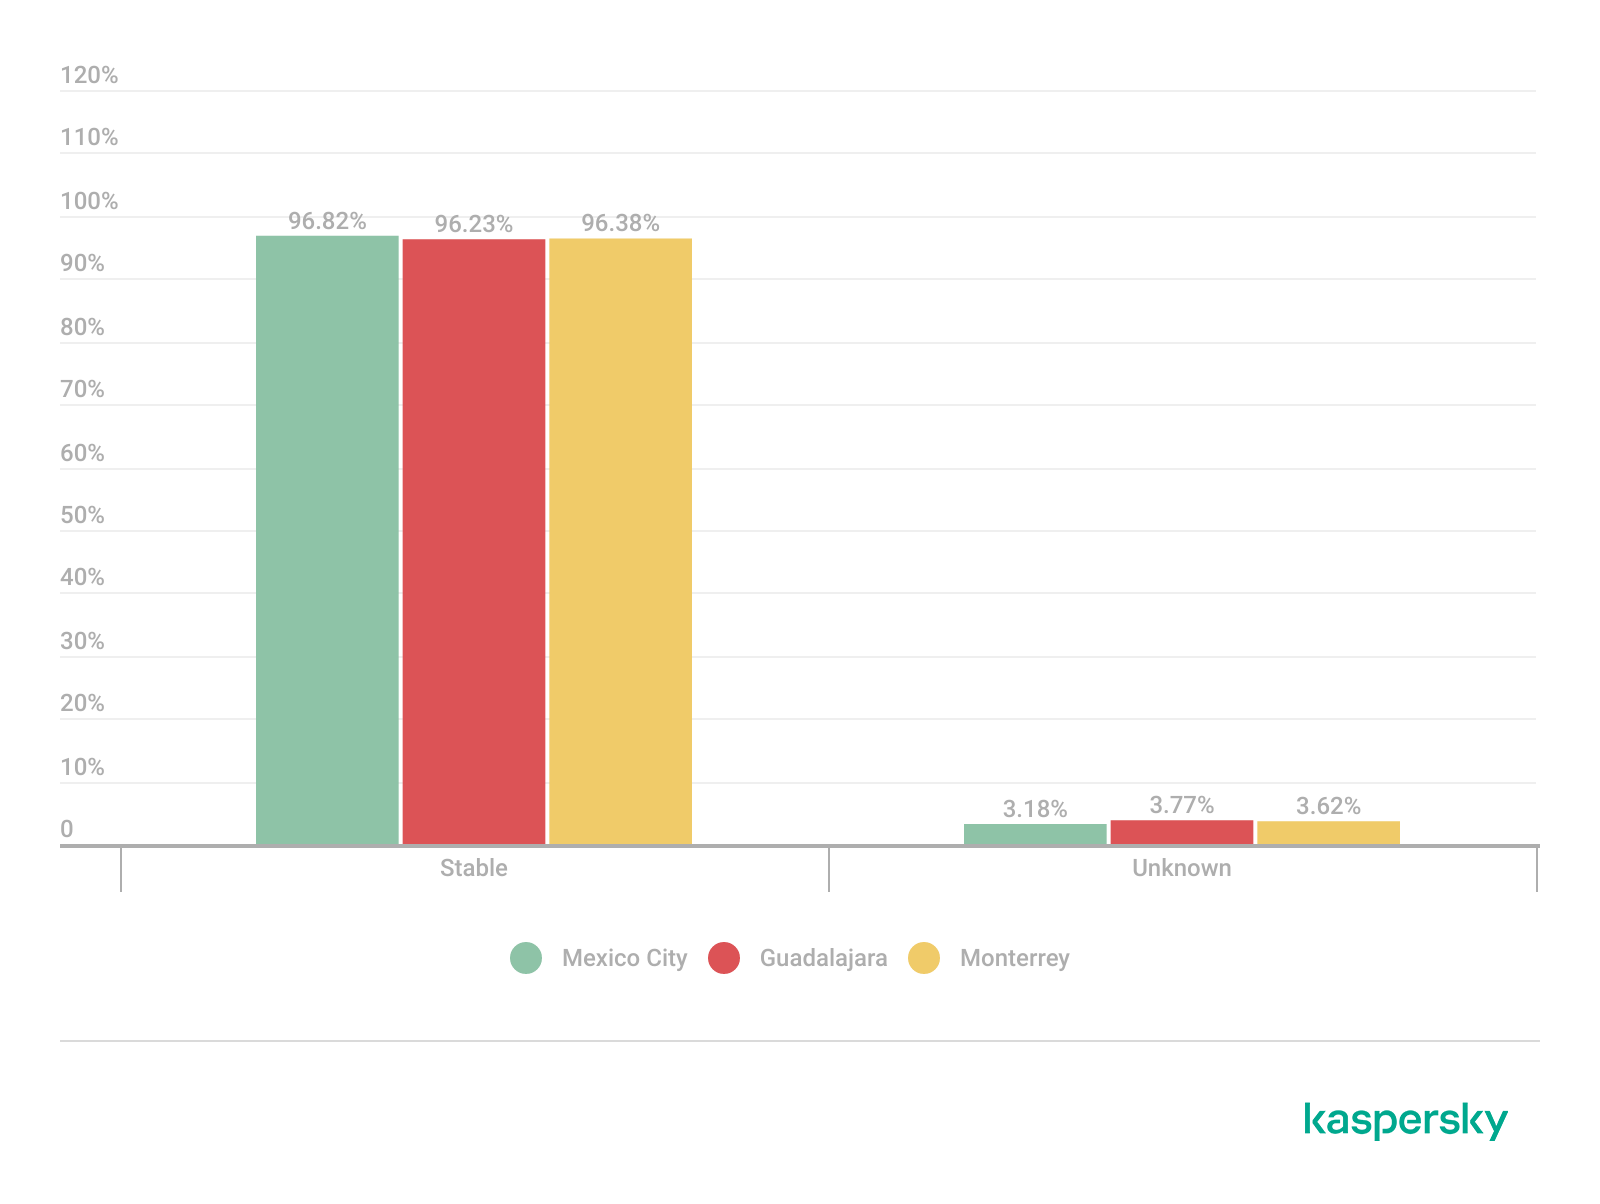
Signal stability analysis revealed that most detected wireless deployments exhibited stable beacon transmission behavior. More than 96% of the detected access points across all locations were classified as stable, while only a small percentage exhibited unstable or indeterminate signal behavior.

These findings imply that the majority of the wireless infrastructure observed during the assessment corresponded to permanently deployed access points rather than transient or intermittent wireless devices.

Signal stability status (download)

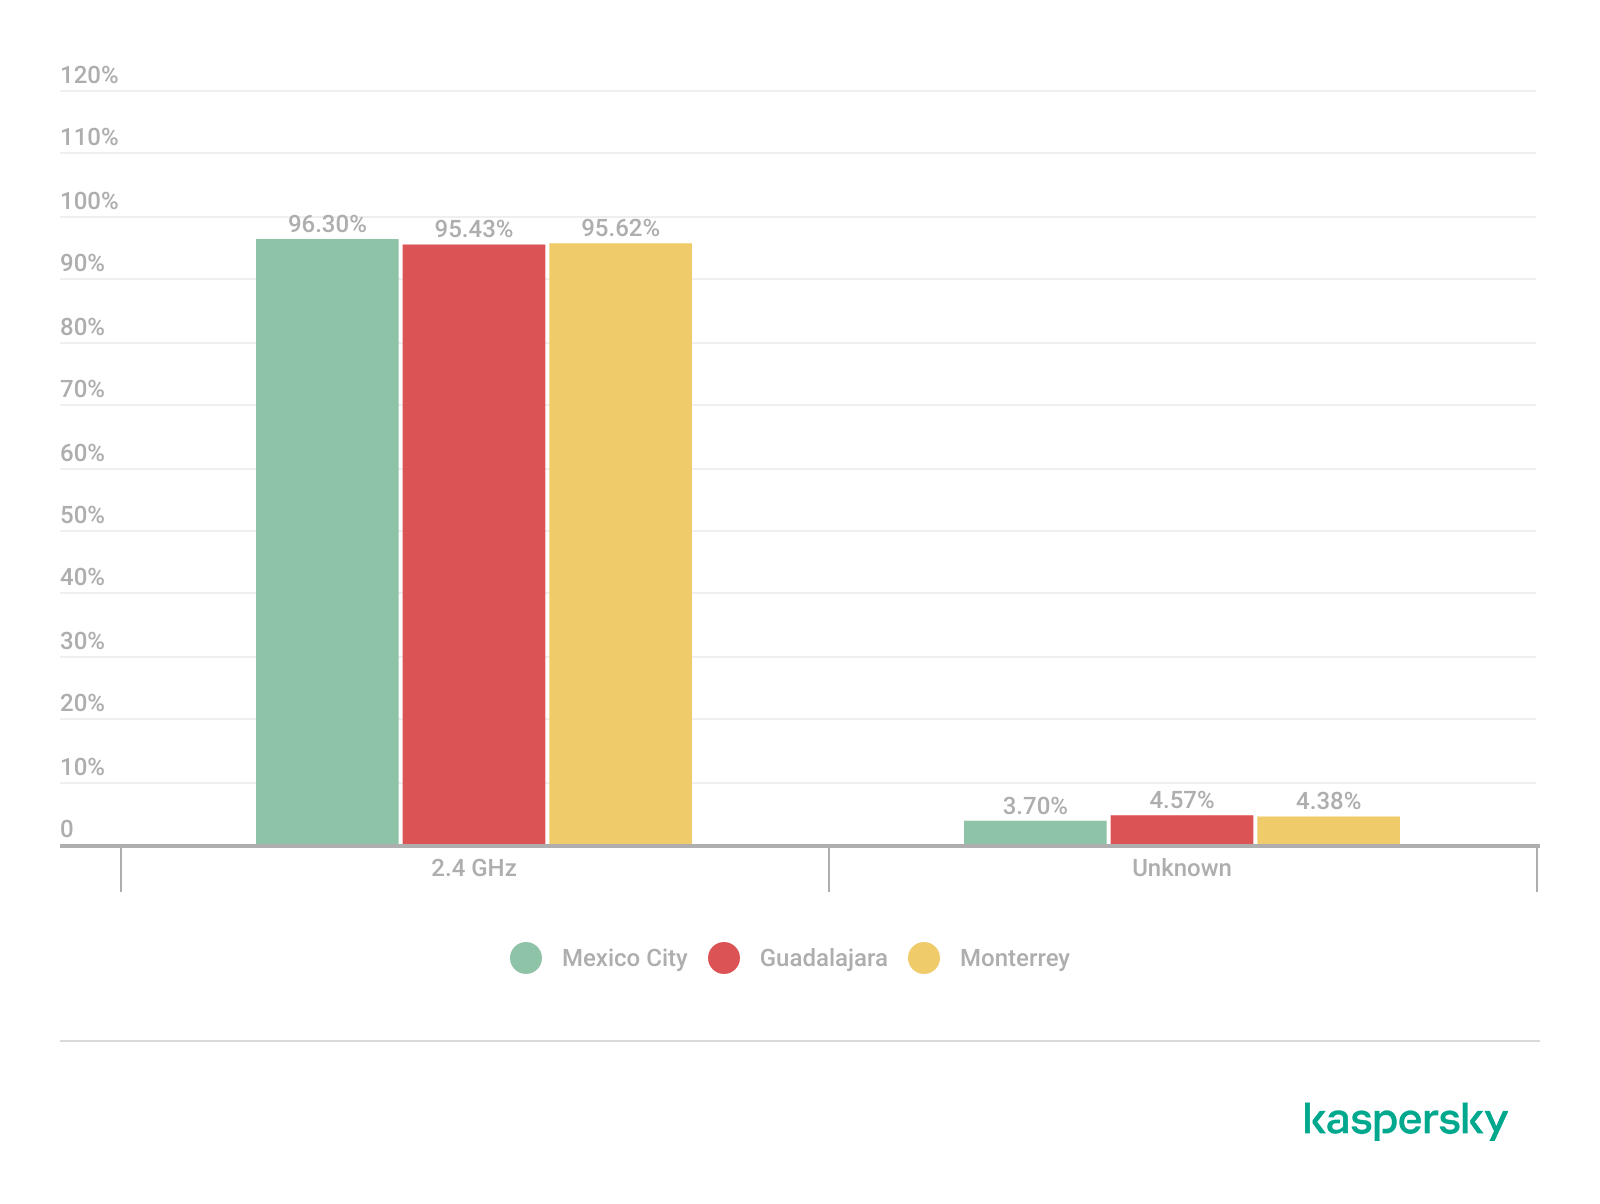
Frequency band analysis revealed the strong prevalence of 2.4 GHz wireless deployments across the three locations. More than 95% of the detected wireless networks operated within the 2.4 GHz spectrum, while only a small percentage of deployments were classified under the unknown or non-standard frequency categories. This uneven distribution reflects the continued prevalence of legacy-compatible wireless infrastructure and SOHO deployments.

Frequency band utilization (download)

These findings are consistent with dense urban wireless environments with large numbers of access points in restricted spectrum allocations.

Channel congestion and spectrum usage

Next, we analyzed wireless channel utilization to evaluate frequency spectrum congestion and channel allocation patterns across the three cities. Our analysis focused on the 2.4 GHz spectrum, where channel overlap and high access point density commonly produce interference and degraded wireless performance. In densely populated wireless environments, an excessive concentration of access points on a limited number of channels can lead to co-channel interference, packet collisions, reduced throughput, and degraded network stability.

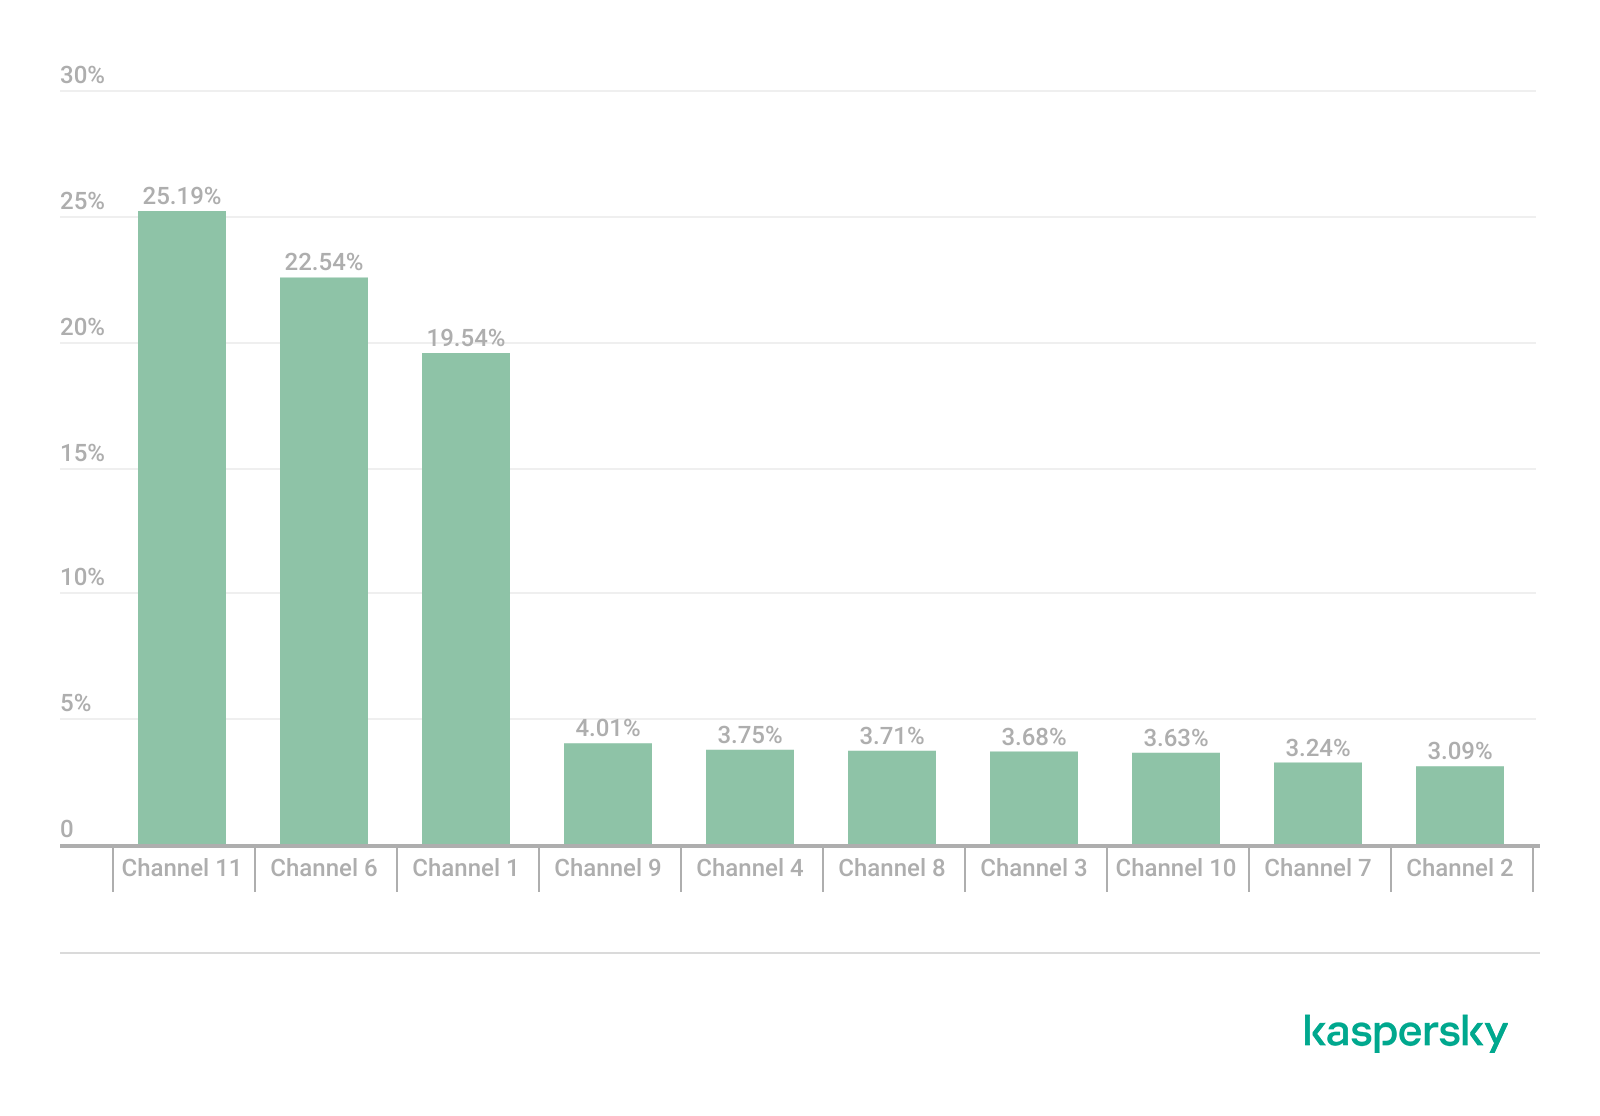
Spectrum congestion analysis revealed that the 2.4 GHz band consistently experienced elevated congestion levels across the three cities. The detailed results showed a strong concentration of deployments on channels 11, 6 and 1, which are traditionally recommended as non-overlapping channels within the 2.4 GHz spectrum. Channel 11 was the most utilized channel, accounting for 25.2% of the detected access points, followed by channel 6 with 22.5% and channel 1 with 19.5%. This distribution indicates that most wireless deployments adhere to standard channel allocation practices for 2.4 GHz Wi-Fi environments.

The following figure illustrates the overall distribution of the most frequently utilized wireless channels.

Most utilized wireless channels (download)

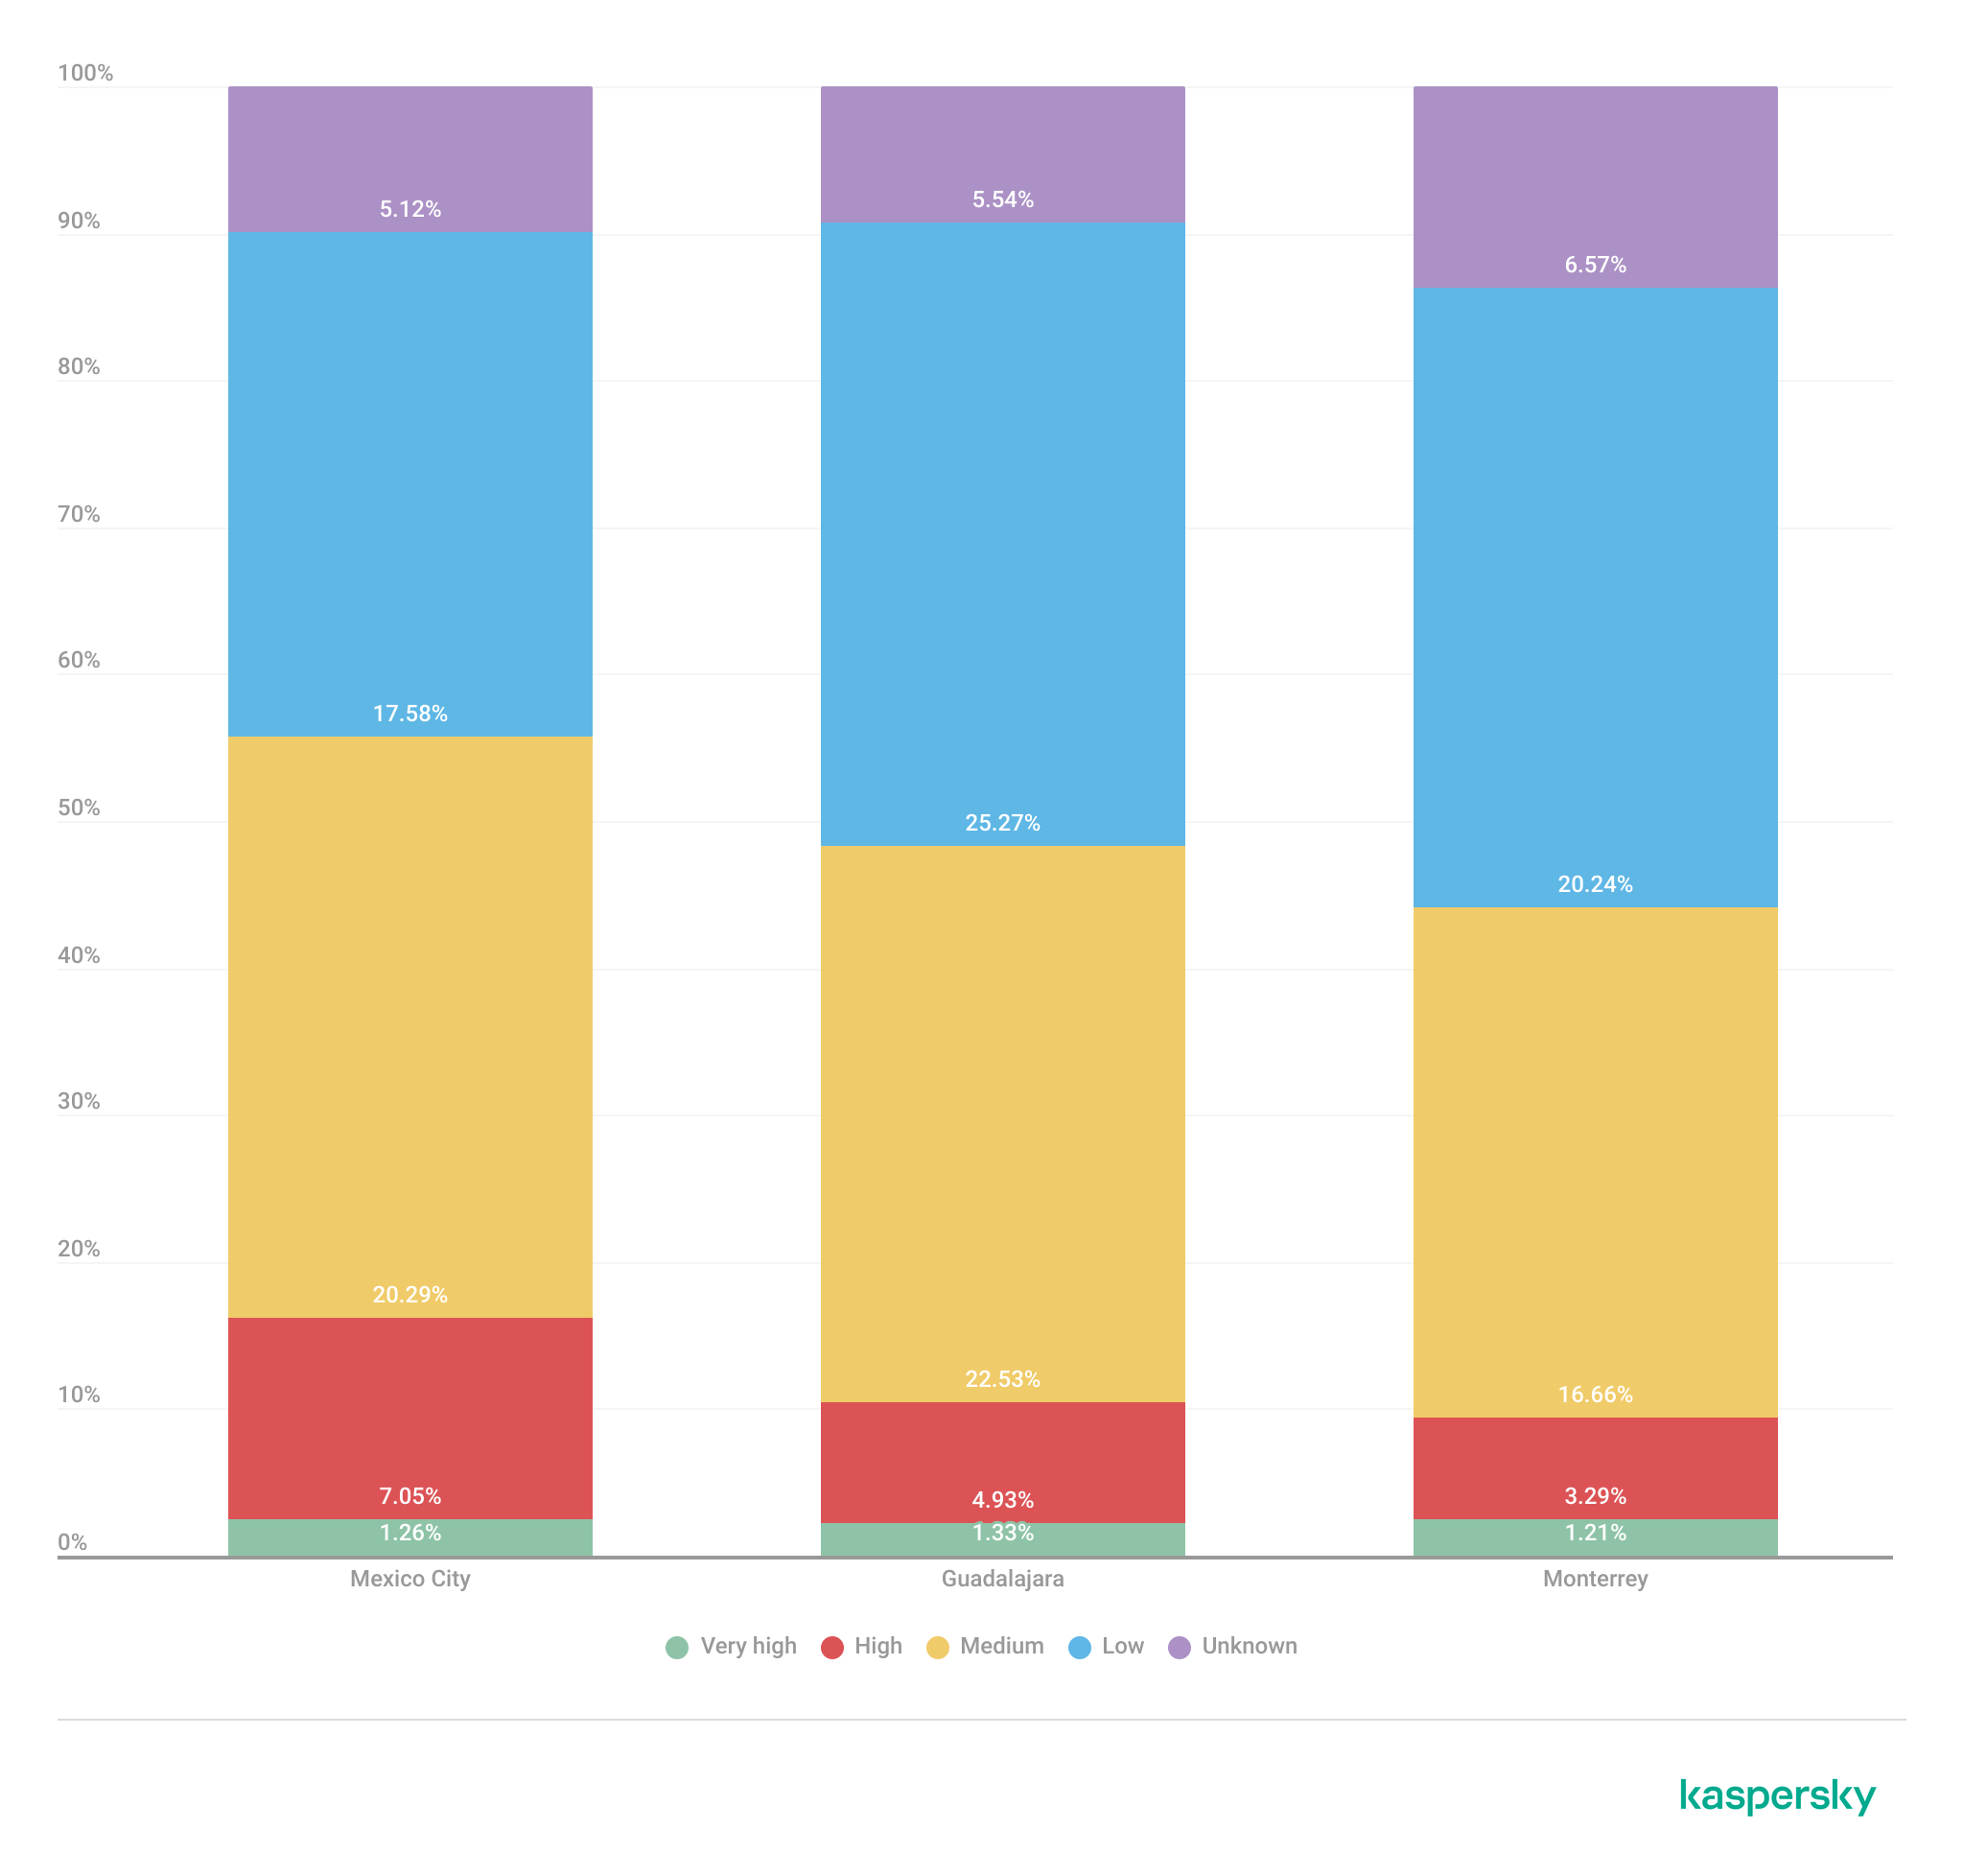
To further assess wireless spectrum saturation, the detected access points were grouped according to channel congestion levels: VERY_HIGH, HIGH, UNKNOWN, MEDIUM, LOW and NONE.

Mexico City had the highest proportion of heavily congested wireless channels, with approximately 7% of detected access points operating under HIGH congestion conditions. Guadalajara followed with nearly 5% of deployments categorized as HIGH congestion, while Monterrey had the lowest percentage at approximately 3.29%.

These findings suggest that wireless spectrum saturation increases proportionally with urban infrastructure density and access point concentration. Despite the presence of congested deployments, most detected access points were categorized as LOW or MEDIUM congestion, suggesting severe spectrum saturation was localized rather than uniformly distributed.

Channel congestion by city (download)

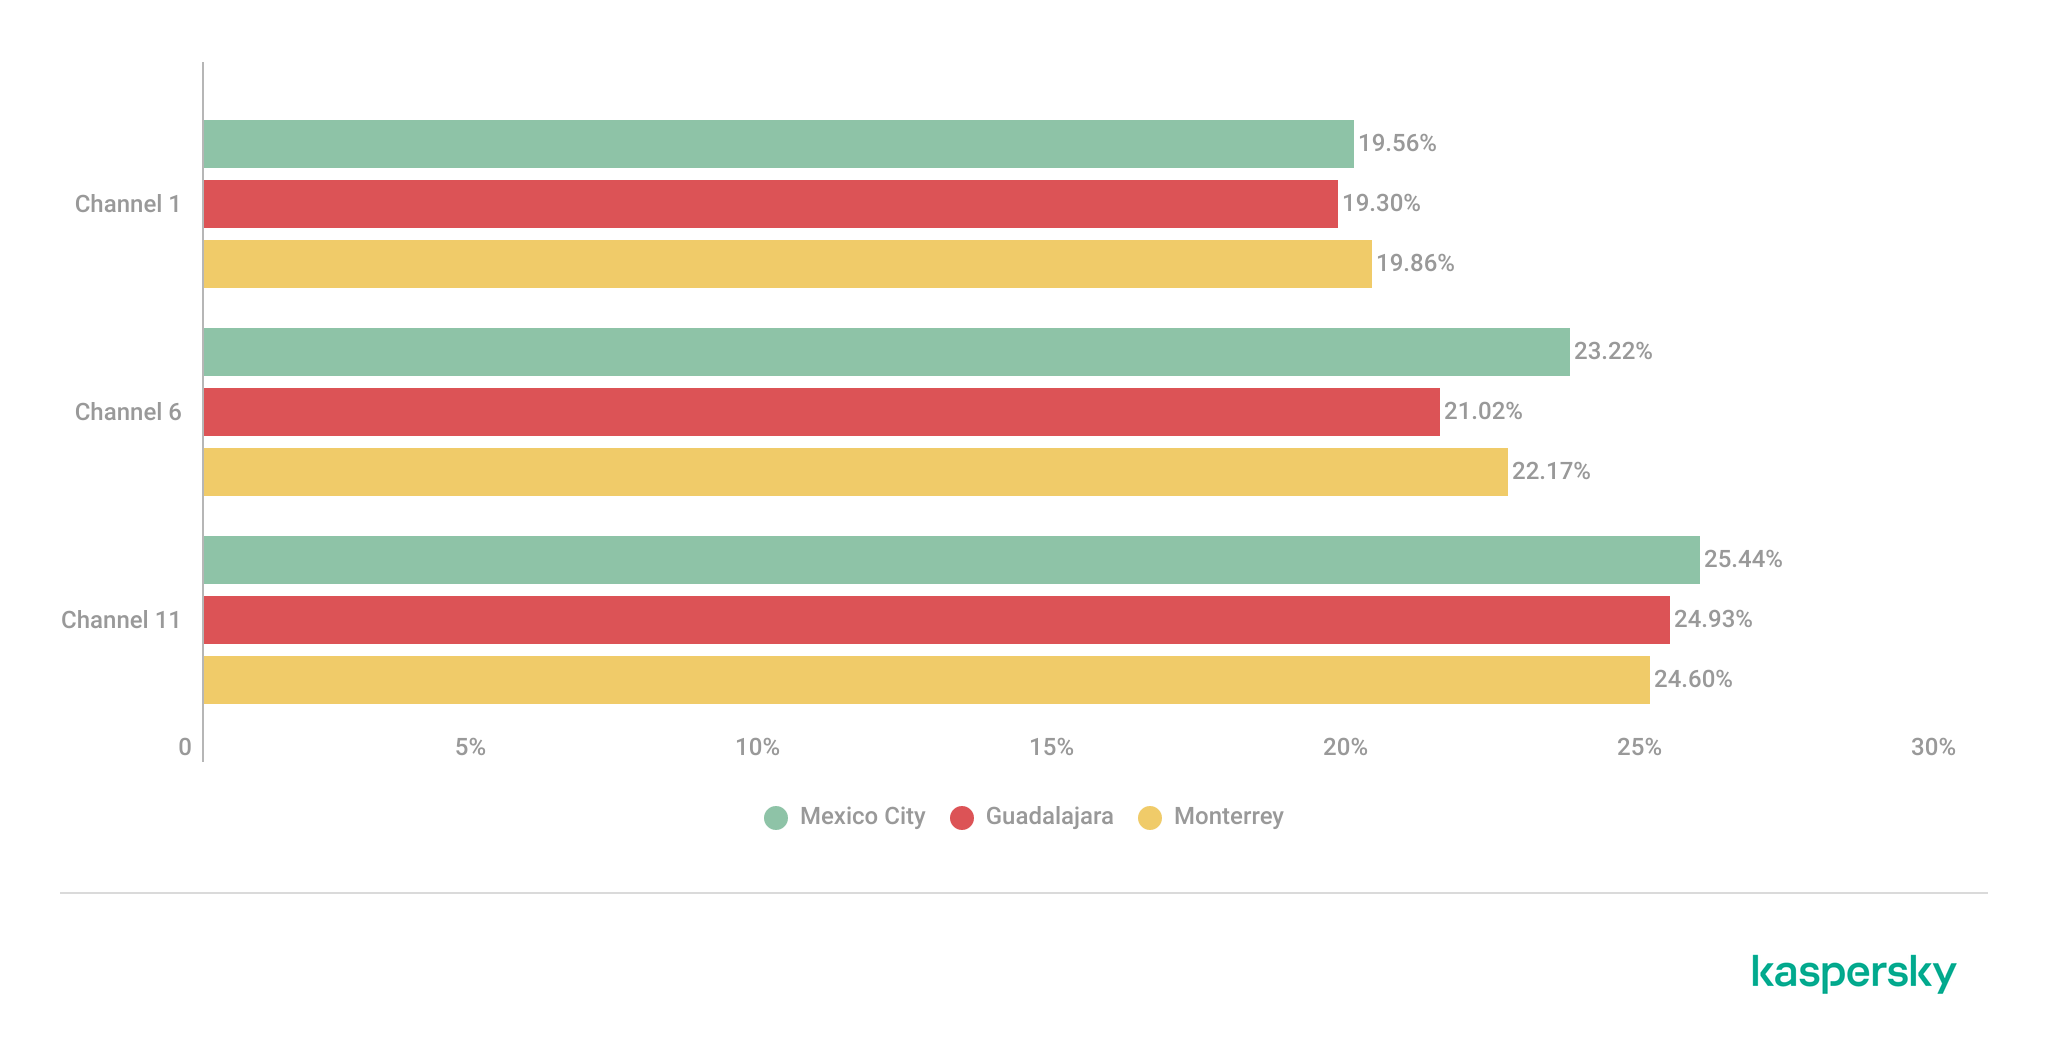
A thorough analysis of individual channel utilization revealed that channels 11, 6 and 1 consistently experienced the highest congestion levels across the three cities, which correlates with our previous findings. These channels accounted for the majority of VERY_HIGH congestion classifications, particularly within the 2.4 GHz band.

In Mexico City, channel 11 alone accounted for more than 25% of detected deployments and consistently exhibited VERY_HIGH congestion levels.

This behavior reflects the limited availability of non-overlapping channels within the 2.4 GHz spectrum and the widespread reliance on default wireless configurations.

Most congested channels by city (download)

Overall, the channel utilization analysis showed that wireless deployments are concentrated heavily within the traditional, non-overlapping 2.4 GHz channels. While this strategy reduces adjacent-channel interference, excessive access point density on the same channels can still produce significant co-channel contention and poor wireless performance in high-density urban environments.

Wireless security configurations

The next thing we evaluated was the security posture of the detected wireless networks. We analyzed the wireless security configurations advertised by access points in each of the locations.

Overall security configuration distribution

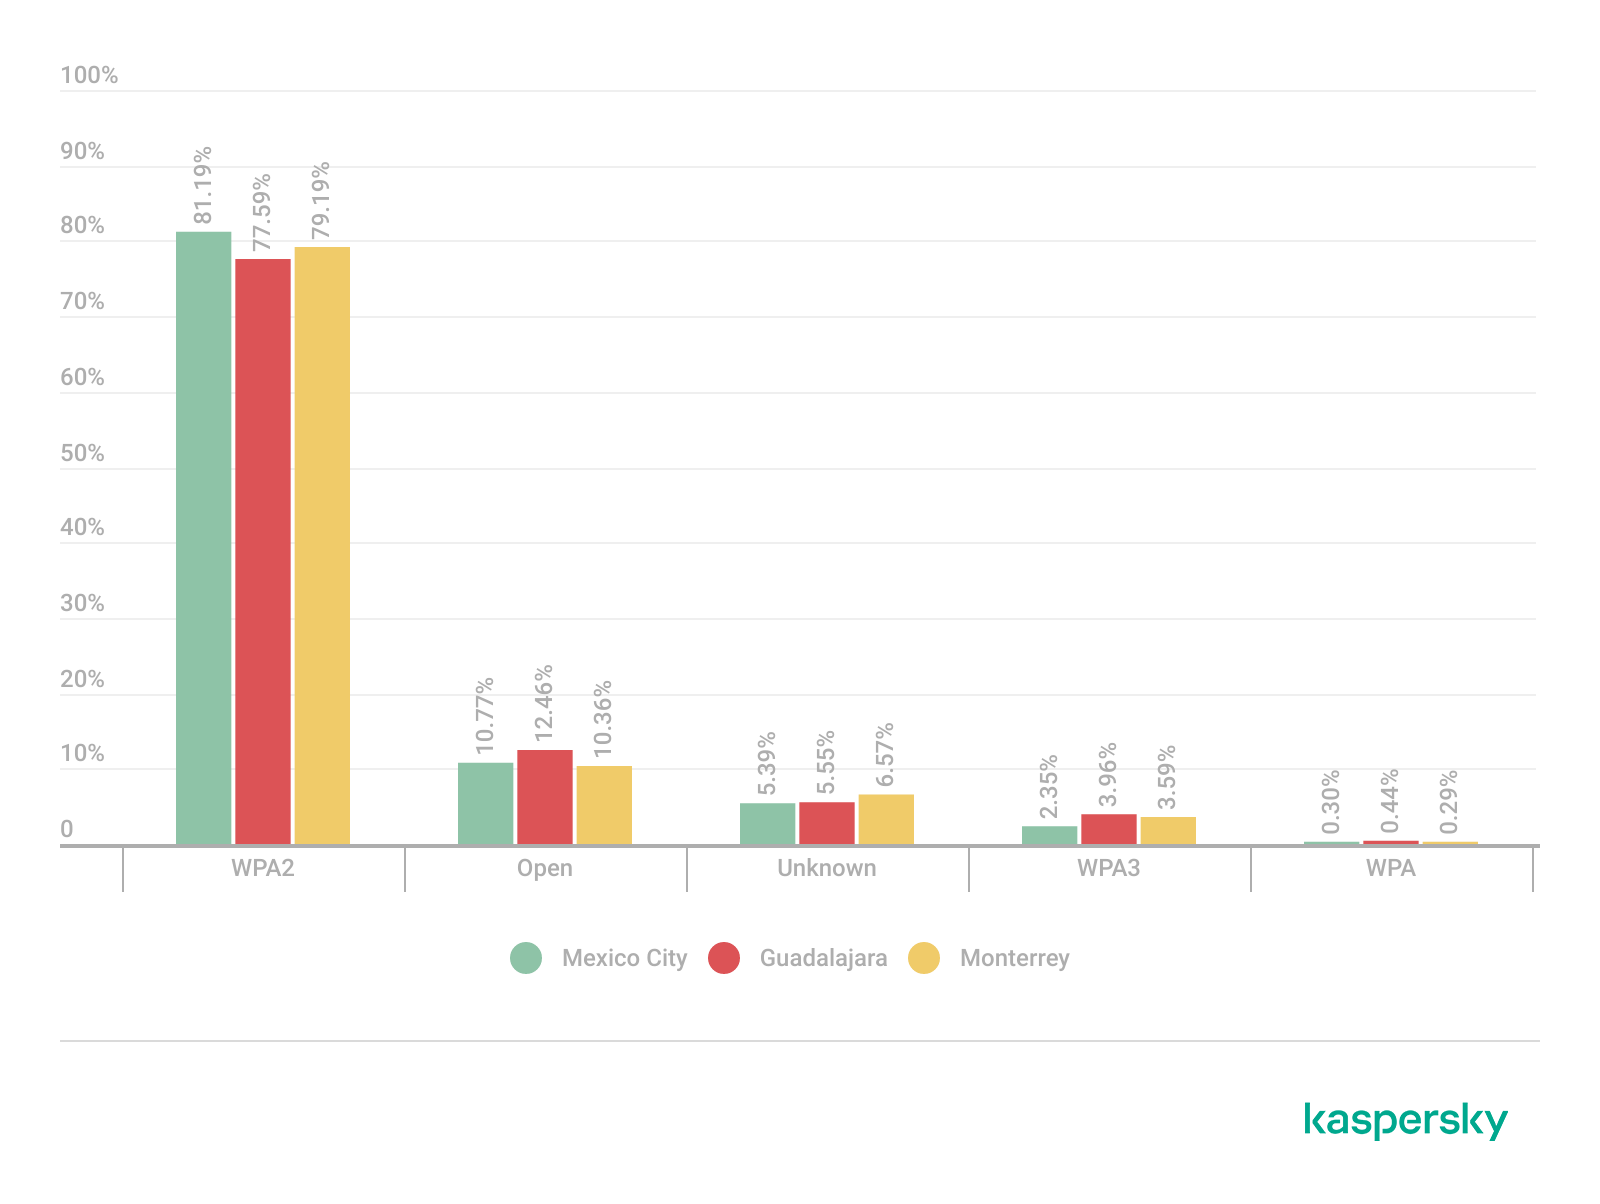
The analysis revealed that WPA2 was the dominant wireless authentication mechanism across the three cities. Mexico City had the highest WPA2 adoption rate at 81.19%, followed by Monterrey at 79.19% and Guadalajara at 77.59%.

The study found that every 6th open access point (17%) was unsafe, namely 16.5% in Mexico City, 18.5% in Guadalajara, and 17.2% in Monterrey. Open wireless deployments were consistently present across all locations, ranging between 10% and 12% of detected access points. These findings show that despite the widespread deployment of modern wireless security standards, encryption adoption remains incomplete.

Distribution of wireless authentication mechanisms across the three locations (download)

To simplify the interpretation of wireless security posture, we grouped detected networks into four categories:

  • Secure (WPA2/WPA3)
  • Insecure (Open/WEP)
  • Weak (WPA)
  • Unknown

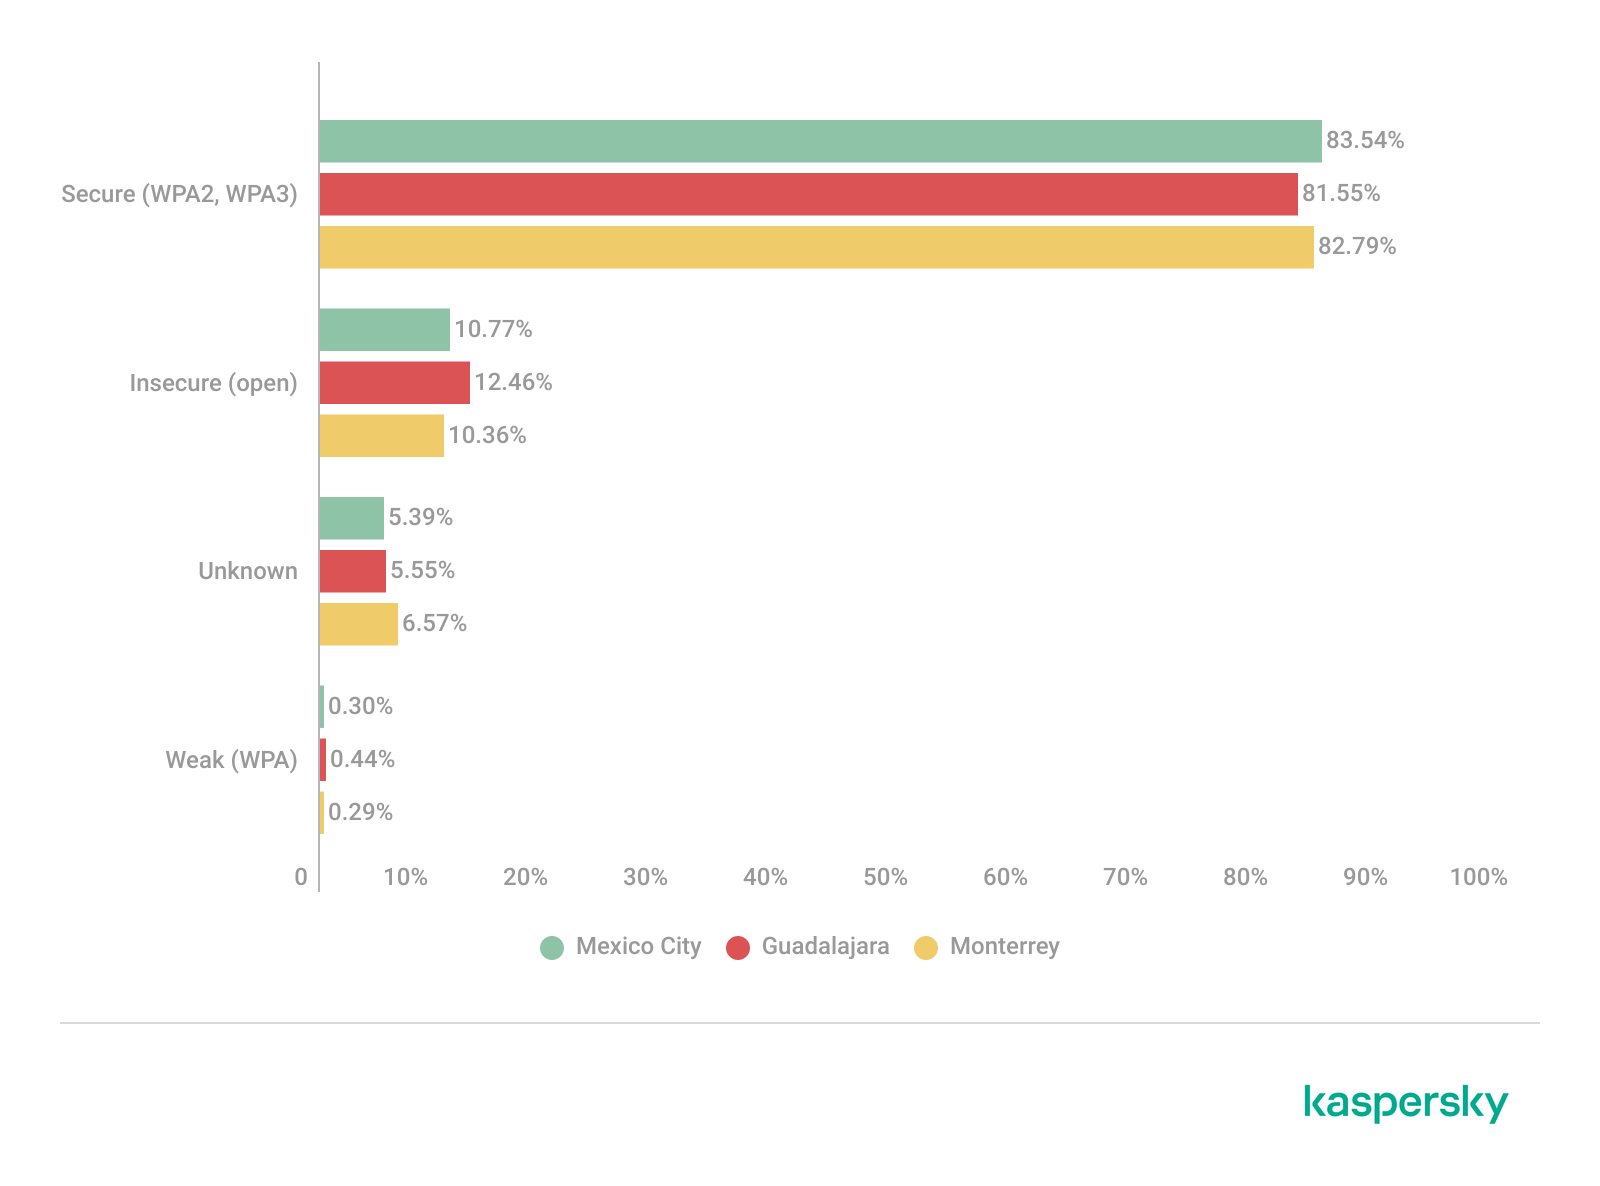
Across the three locations, secure networks comprised most of detected deployments, accounting for approximately 82% of all access points. However, insecure open networks still account for between 10% and 12% of detected wireless infrastructure, consistent with our previous findings. It is important to mention that networks within the unknown category are not considered secure.

Mexico City had the highest percentage of secure deployments at 83.54%, while Guadalajara had the highest percentage of insecure open networks at 12.46%. Although Monterrey had the lowest percentage of insecure networks, open deployments still accounted for more than 10% of the detected access points.

Wireless security posture grouping across the three locations (download)

Although modern WPA2/WPA3 encryption standards dominate current wireless deployments, the continued presence of open and legacy WPA deployments indicates that insecure wireless configurations remain relevant from an operational standpoint. These networks may expose users to passive traffic interception, unauthorized monitoring, rogue access point attacks, and credential harvesting techniques.

WPS-enabled networks

We also analyzed Wi-Fi Protected Setup (WPS) in all the locations to evaluate additional attack surfaces. WPS is a standard feature on wireless routers that enables devices such as printers, repeaters or mobile phones to connect to a secure Wi-Fi network without manually entering a long password, typically through a PIN-based enrolled mechanism. Although WPA2 and WPA3 provide strong encryption mechanisms, the presence of WPS can introduce security weaknesses due to inherently vulnerable PIN-based enrollment methods.

By combining detections from the three locations, we found that 55% of all detected access points did not advertise WPS capabilities, leaving 45% of deployments vulnerable to WPS-based abuse. These results suggest that, despite the adoption of modern encryption standards, a significant portion of wireless infrastructure continues to expose legacy convenience features.

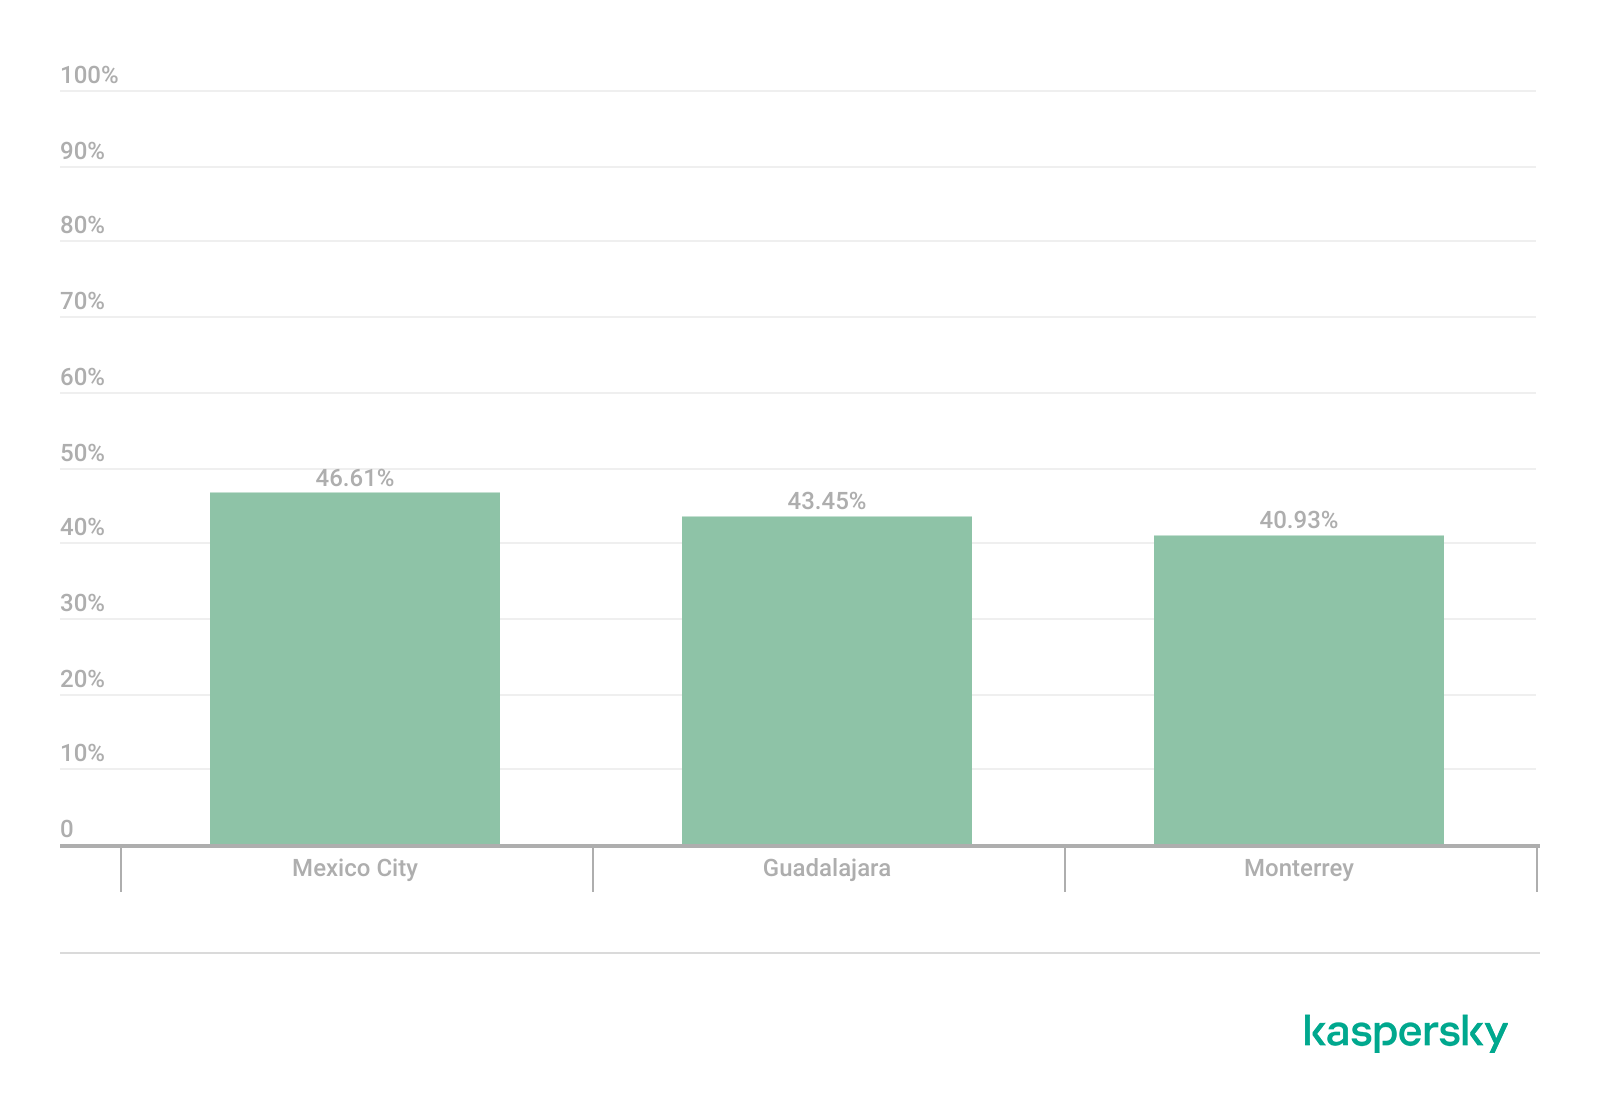
During the analysis, we found that Mexico City had the highest proportion of WPS-enabled networks, with 46.61% of the detected access points advertising WPS capabilities. Guadalajara was second with 43.45%, while Monterrey had the lowest proportion at 40.93%.

The percentage of detected access points advertising WPS capabilities across the three locations (download)

Almost half of the detected wireless networks in each city continued to advertise WPS, indicating that WPS prevalence is consistently high across the three cities.

Secure networks with WPS enabled

In many cases, networks classified as secure because of WPA2/WPA3 encryption still had WPS functionality enabled, which effectively increased the available attack surface.

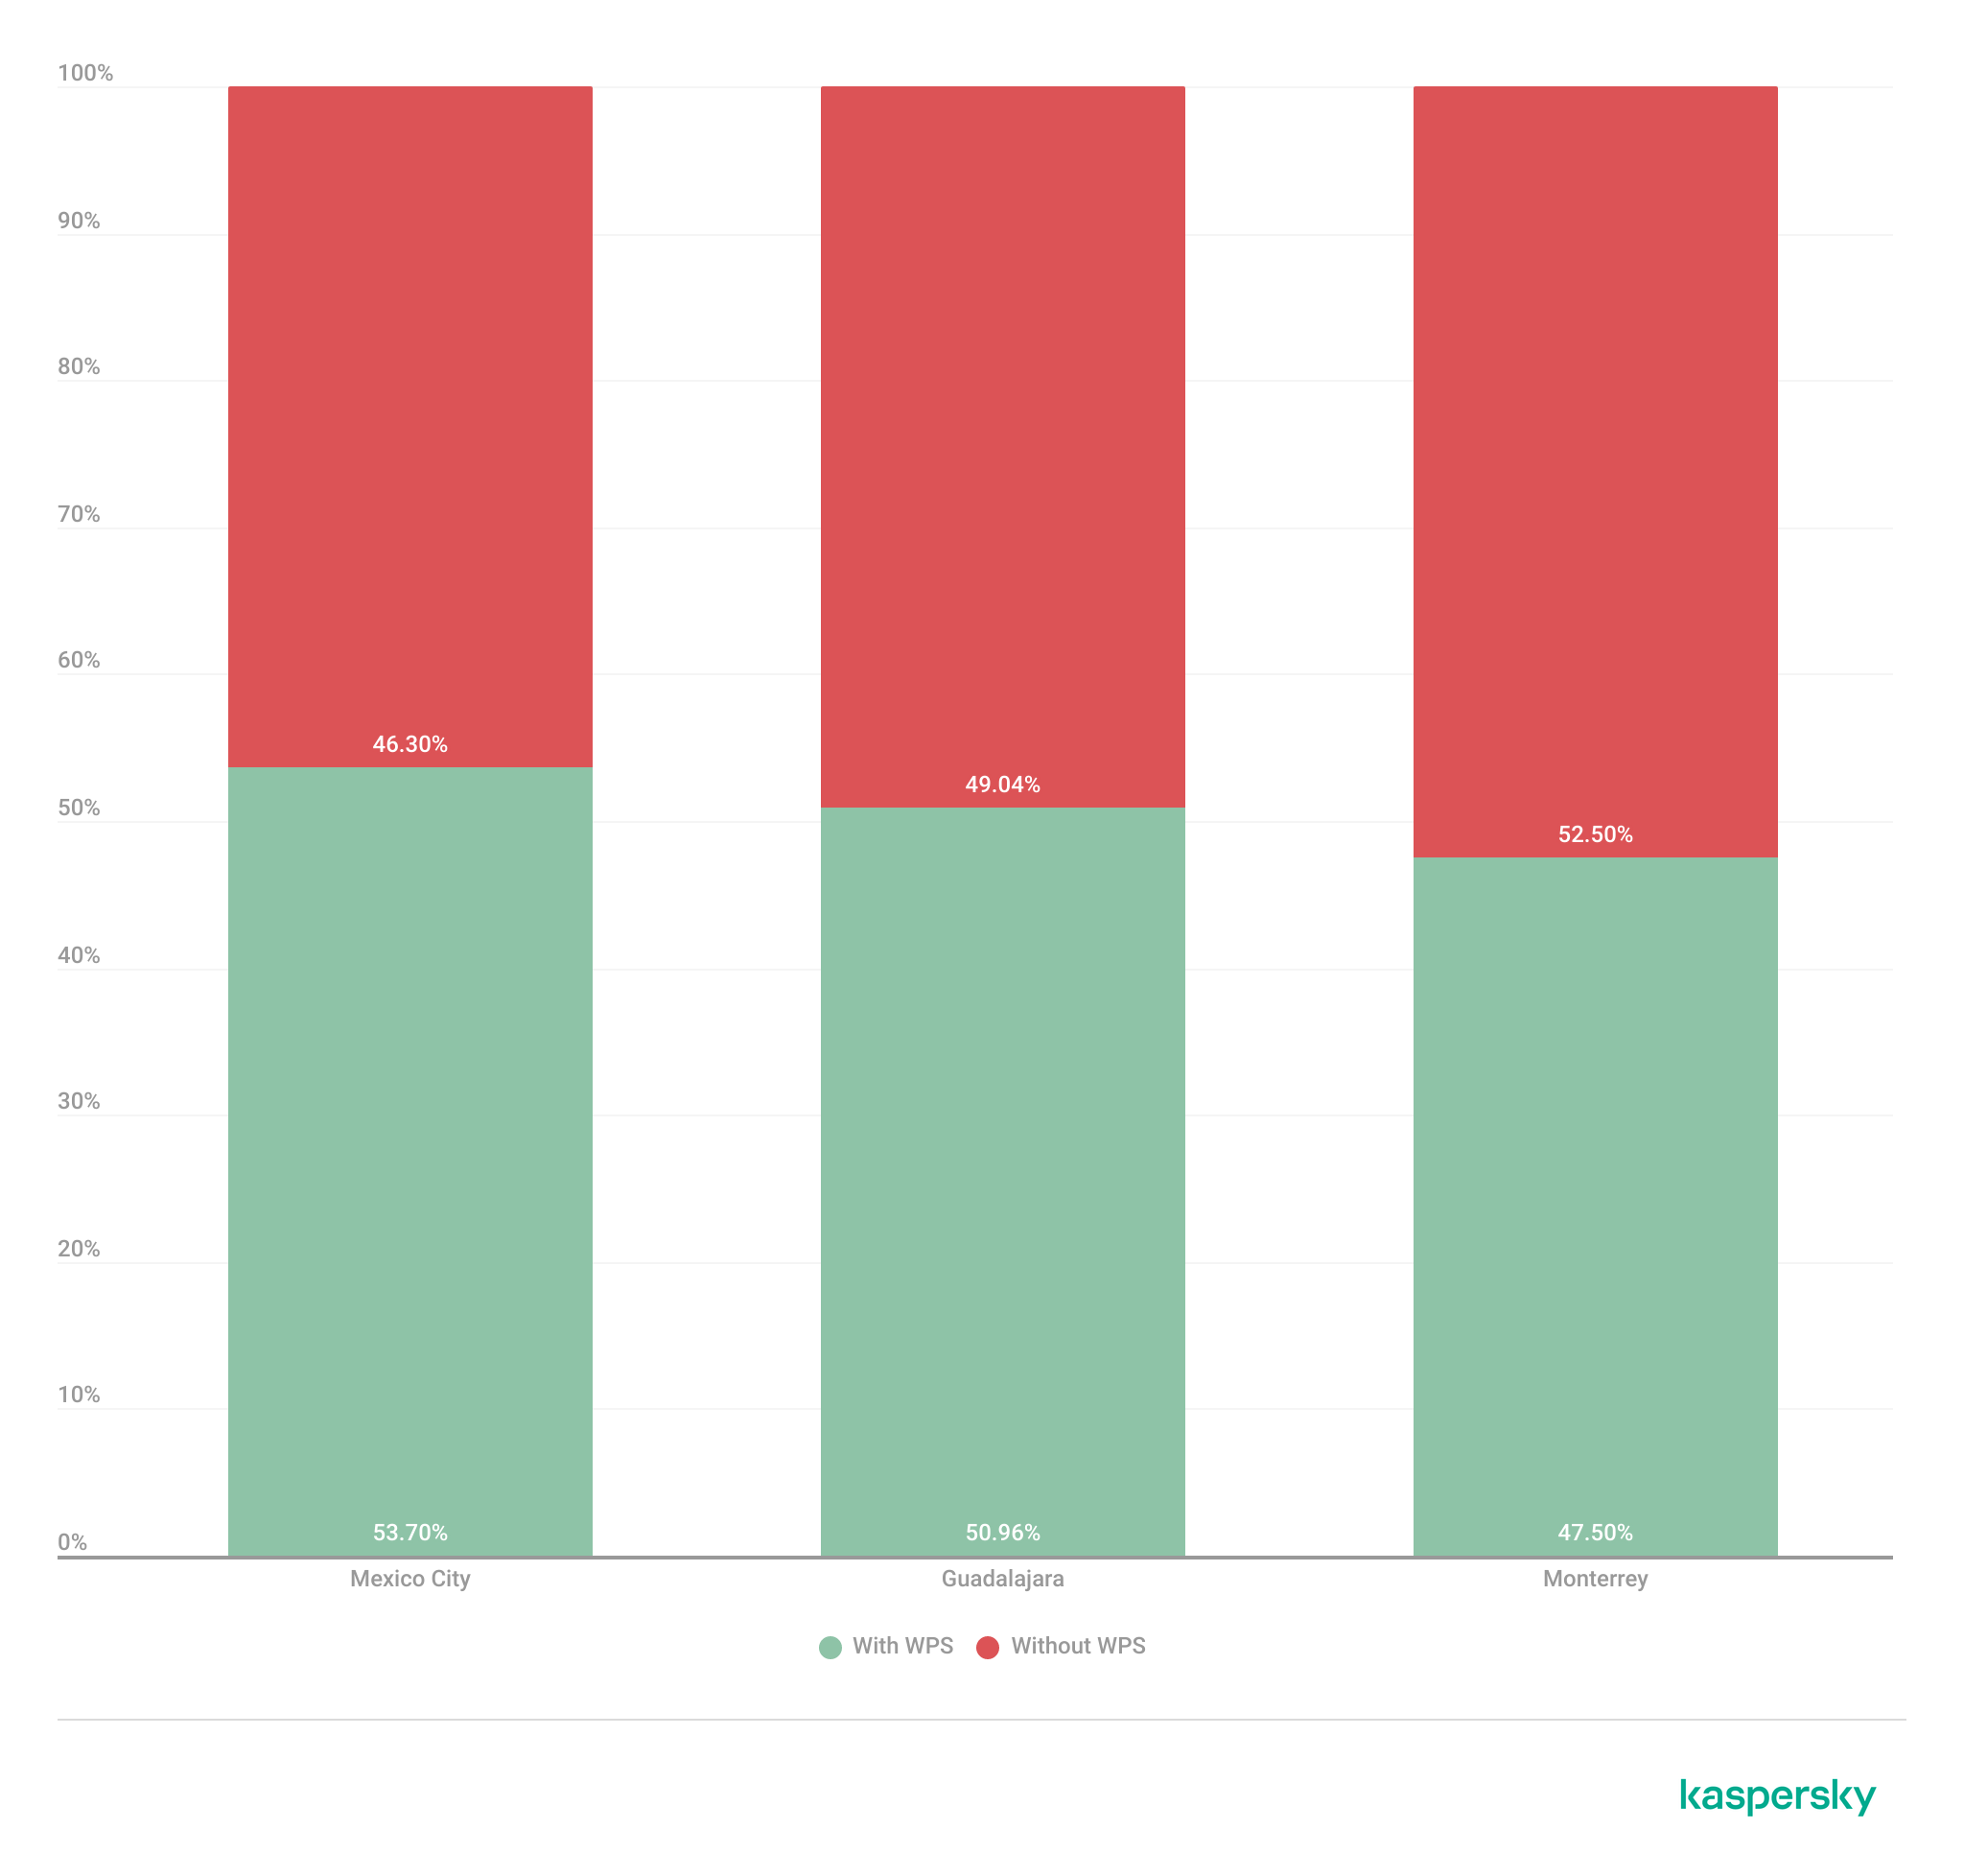
To further assess the relationship between encryption strength and WPS exposure, we conducted a secondary analysis of secure networks (WPA2/WPA3) only. The results showed that around half of all secure deployments still exposed WPS, with the following breakdown for each city:

  • Mexico City: 53.7%
  • Guadalajara: 50.9%
  • Monterrey: 47.5%

The proportion of secure networks with WPS enabled across the three locations (download)

These findings indicate that encryption strength alone is not enough to evaluate wireless security posture because additional protocol features, such as WPS, may still expose exploitable attack vectors.

Additional security considerations

Overall, travelers operating within dense public environments are exposed not only to insecure wireless infrastructure but also to various risks associated with digital interactions. These risks include many threats, from public USB charging systems and phishing QR codes to proximity-based protocols and exposure to shared public devices, such as interactive totems or kiosks. One particular point that should be taken into account in light of our research is the issue of rogue wireless deployments.

Rogue access points are not necessarily malicious; they may be set up accidentally by misconfiguring router settings. An entry point for potential compromise might be caused by various misconfigurations, from a weak password to an insecure protocol. However, attackers deploy such unauthorized hotspots with malicious intent to infiltrate a network. Threat actors may deploy rogue access points posing as legitimate public wireless networks in airports, hotels, cafés and tourist areas. These deployments are called “evil twins” and can trick users into connecting to attacker-controlled infrastructure capable of intercepting traffic, harvesting credentials, or performing man-in-the-middle attacks. Further risk lies in the potential compromise of local network devices or even malware distribution. Such threats complement our findings, underscoring the importance of implementing traffic encryption, using a security solution and exercising extreme caution while browsing via public networks.

Conclusion

The wardriving assessment conducted in Mexico City, Guadalajara, and Monterrey revealed that modern wireless infrastructure continues to present multiple forms of operational exposure despite the widespread adoption of WPA2 and WPA3 security standards. The analysis demonstrated that wireless environments are highly standardized in all the locations, with recurring ISP deployments, default SSID naming conventions, homogeneous manufacturer distribution, and predictable channel allocation practices observed in all three cities.

Although most of the detected networks were classified as secure under WPA2/WPA3 authentication mechanisms, a significant proportion were exposing additional attack surfaces through enabled WPS functionality, default configurations, sequential SSID structures, and infrastructure metadata disclosure. This demonstrates that encryption strength alone is insufficient for evaluating the overall security posture of wireless infrastructure. Additionally, the prevalence of open networks and legacy wireless configurations indicates that insecure deployments are still operationally relevant in all the locations.

The results also showed that wireless infrastructure is heavily concentrated within the 2.4 GHz spectrum, particularly around channels 11, 6, and 1. This leads to elevated congestion and increased co-channel interference in densely populated urban environments.

SSID analysis further revealed that publicly broadcast wireless identifiers frequently expose valuable operational information about ISPs, equipment manufacturers, deployment templates, organizational ownership, and user-defined naming practices. The identification of default ISP naming conventions, sequential SSID structures, and BSSID-derived SSIDs demonstrated that many deployments prioritize operational convenience and simplicity over exposure minimization and privacy.

The scope of the threats stemming from vulnerable wireless configurations poses serious digital exposure risks for users. The widespread presence of standard deployments, predictable SSID naming and publicly exposed infrastructure identifiers can facilitate passive reconnaissance, infrastructure fingerprinting and opportunistic targeting.

Recommendations

To minimize the risks of wireless-based exposure and the attack surface related to hotspot infrastructure, we recommend taking the following measures:

  • Disable WPS functionality on wireless routers whenever possible, particularly within WPA2/WPA3 deployments.
  • Avoid using default SSID naming conventions that disclose ISP providers, router manufacturers, or deployment templates.
  • Refrain from using personal, organizational, or location-based identifiers in wireless network names.
  • Avoid configuring SSID using BSSID or naming conventions derived from MAC addresses, as these may expose hardware fingerprinting information.
  • Promote migration toward modern WPA3-capable infrastructure while removing legacy wireless protocols when operationally feasible.
  • Reduce wireless congestion by optimizing channel allocation strategies and minimizing excessive dependence on the 2.4 GHz spectrum.
  • Encourage adoption of 5 GHz and newer wireless technologies to reduce interference and improve spectrum efficiency.

The findings presented in this assessment emphasize the importance of combining strong wireless encryption standards, secure deployment practices, exposure minimization strategies, and user awareness to enhance the overall security posture of wireless environments.

Wardriving assessment across Mexico: Preparing for the 2026 World Cup

2 June 2026 at 14:00

Introduction

Mexico is one of the host countries for the 2026 FIFA World Cup, with matches to be played in three major cities: Mexico City, Monterrey, and Guadalajara. These locations are expected to see a large influx of international visitors, increasing the potential security risks. Many of those risks arise from users connecting to public wireless networks.

To better understand the wireless environments that visitors may encounter, we at Kaspersky GReAT conducted a wardriving assessment in the three host cities. The aim of the study was to analyze characteristics, deployment patterns, security configurations and potential exposure risks of public Wi-Fi infrastructure in urban wireless environments.

The information collected during the assessment was used exclusively for passive observation and infrastructure analysis. No attempts were made to authenticate, intercept communications, exploit systems or interact with the detected wireless networks beyond the publicly broadcast management information.

During processing of the collected data, one step involved filtering out networks belonging to cars or cell phones categorized as mobile hotspots because they do not represent networks that can be considered part of the assessment.

Research scope

The cities included in the study have high population density and extensive wireless infrastructure deployments. We chose areas with the most prominent wireless network activity and highly concentrated public access points. We carried out wardriving research in Monterrey back in 2008, but the city’s hotspot landscape has changed since then.

We chose the following analysis areas for each of the cities:

  1. Mexico City: México City Stadium, Mexico City International Airport, Zócalo, Paseo de la Reforma, Colonia Roma, La Condesa, Polanco, and Coyoacán.
  2. Guadalajara: Guadalajara Stadium, Guadalajara International Airport, the city center, Zapopan, Providencia, Avenida Chapultepec, Colonia Americana, Tlaquepaque, and the area around Andares.
  3. Monterrey: Monterrey Stadium, Monterrey International Airport, Fundidora Park, Cintermex Monterrey, the downtown area, Barrio Antiguo, MacroPlaza, and the San Pedro financial district.

The wireless information was collected using passive wireless reconnaissance techniques. The collected information included:

  • SSID analysis and information exposure, including BSSID-derived SSIDs
  • Default router configurations and ISP deployments
  • Frequency and signal characteristics
  • Channel congestion and spectrum usage
  • Wireless security configurations, including:
    • Open and insecure wireless networks
    • WPS-enabled networks
    • Secure networks (WPA2/WPA3) with WPS enabled

We performed a wireless infrastructure analysis in Mexico City, Guadalajara, and Monterrey. We drove through the areas surrounding the World Cup stadiums, tourist zones, and other places where fan concentrations are likely to be largest. Our goal was to evaluate the security status, deployment characteristics and operational exposure of detected wireless networks.

In total, we recorded 84,588 signals with 69,473 unique Service Set Identifiers (SSIDs) in busy locations and World Cup zones across the three cities. Mexico City accounted for 61.4% of the signals, Guadalajara for 23.6%, and Monterrey for 14.8%. Approximately 82% of the signals had a single SSID (81.9%, 81.34%, and 84% respectively). Notably, they all operate under the IEEE 802.11 standard protocol.

Particular attention was given to identifying standard deployment patterns, legacy configurations, default vendor settings and information disclosure through publicly broadcast wireless identifiers.

The following sections present the results that were obtained by analyzing wireless infrastructure across the three locations.

Our findings

SSID analysis and information exposure

SSID analysis was conducted to evaluate naming conventions, deployment standardization and potential information exposure.

Only a few networks (0.0047%) have an invisible SSID, meaning the names of these networks are not broadcast. Some users prefer to hide the SSID for various reasons, such as the network’s purpose, the profile of its users, internal policies, etc. In contrast, the rest of the networks maintained active SSID broadcasting.

SSID structures may unintentionally disclose operational details about internet service providers (ISPs), device manufacturers, deployment practices, organizational ownership or user identity. The repeated presence of default SSID naming patterns across the analyzed locations indicates a significant degree of infrastructure homogeneity and reuse of default wireless configurations. It may also facilitate passive infrastructure profiling by revealing standard characteristics in use.

Approximately 34% of the detected networks retained the default SSID naming conventions provided by the manufacturer or ISP, while 66% used customized identifiers.

Distribution of SSID naming conventions (download)

Several recurring SSID naming conventions associated with ISP-provided deployments were identified in the three cities. The most frequently observed patterns include identifiers such as “Club_Totalplay_WiFi”, “izzi WiFi”, and “Megacable WiFi”, which suggests extensive standardization of wireless infrastructure deployment. Additionally, we observed distinctive location-specific SSIDs in each area of analysis, such as “XXXX-Internet para Todos-CDMX” or “RED JALISCO”.

Most frequently observed SSID patterns (download)

Sequential SSID naming structures were also identified during the analysis. Patterns such as “INFINITUMXX” and “IZZI-XX” suggest automated ISP deployment and large-scale deployment strategies.

We identified 33 unique sequential naming structures among the 137 sequential SSIDs in total, representing approximately 0.16% of the detected wireless networks.

The following graph shows the top five sequential SSID patterns found in the largest number of networks:

Five most frequently observed sequential patterns (download)

Several customized SSIDs contained personal or organizational identifiers, including family names, professions, addresses or internal department references. Although personalized SSIDs may simplify local network identification for users, they may also expose sensitive information that could be useful for social engineering, physical targeting, or organizational profiling.

BSSID-derived SSID

During the analysis, multiple networks were identified that used the physical MAC address of a Wi-Fi access point (BSSID) as the visible SSID. This practice exposes hardware-level information that could facilitate vendor fingerprinting and targeted reconnaissance activities.

The organizationally unique identifier (OUI) contained in the first bytes of the BSSID identifies the equipment manufacturer. Threat actors can correlate exposed manufacturers with device-specific vulnerabilities.

BSSID-derived SSID by city (download)

Notably, we found that more than 30% of networks in all three cities reuse the MAC address as the SSID.

Default router configurations and ISP deployments

We performed wireless infrastructure profiling to identify the most common wireless equipment manufacturers and ISP deployments across the three locations.

Large-scale ISP deployments frequently use standardized wireless configurations and vendor-specific hardware platforms. Identifying dominant manufacturers and ISP naming conventions can provide insight into infrastructure and deployment practices facilitating the mapping of standardized attack surfaces.

The following figure shows the distribution of the most commonly used manufacturers.

Most frequently observed wireless equipment manufacturers (download)

The manufacturer analysis revealed a strong concentration of wireless infrastructure among a limited number of vendors. Across the three locations, Huawei Technologies, MediaTek-based devices, and other manufacturers’ equipment that is distributed through ISP channels represented a significant portion of the detected deployments. Mexico City had the most diverse infrastructure, while Monterrey and Guadalajara had a greater concentration of wireless equipment known as SOHO (small office/home office) or residential-grade hardware. The widespread presence of standard vendor platforms may facilitate infrastructure fingerprinting and large-scale targeting of known device-specific vulnerabilities.

Most frequently observed wireless equipment manufacturers across the three cities (download)

ISP deployments frequently exhibited standardized configuration patterns and recurring manufacturer identifiers. Our ISP deployment analysis revealed a high concentration of access points associated with major residential internet providers. Deployments associated with Infinitum, Totalplay and Izzi represented a substantial portion of the detected wireless infrastructure across all locations. These findings suggest a high degree of deployment standardization across networks associated with major residential internet providers. This observation was supported by the repeated presence of ISP-associated SSIDs such as “Infinitum”, “Totalplay”, and “Izzi”, combined with manufacturer identifiers frequently associated with consumer equipment, including Huawei, ZTE and other residential wireless equipment vendors.

It is important to note that, for this analysis, ISPs were primarily inferred from SSID naming conventions and manufacturer fingerprint data. A significant portion of the detected wireless networks fell into the “UNKNOWN/CUSTOM” category. This classification includes custom hotspots and networks whose naming conventions did not expose identifiable ISP-associated patterns. The findings suggest that many users and organizations (as we saw previously, approximately 66%) use custom network names, limiting direct provider attribution.

The following figure illustrates the distribution of ISP-associated wireless deployments in general.

Most frequently observed ISPs (download)

To better understand this distribution, we took the most frequently observed ISPs by city.

Most frequently observed ISPs across the three cities (download)

Frequency and signal characteristics

We also analyzed wireless signal characteristics to evaluate coverage quality, signal strength, and frequency band utilization in the three cities. In dense urban environments, signal quality and frequency spectrum distribution can affect wireless reliability, client connectivity, roaming performance, and overall network efficiency.

Signal quality analysis revealed that a substantial portion of the detected access points operated under weak or very weak signal conditions. Monterrey had the highest percentage of very weak signals, with approximately 50% of detected deployments. Similar patterns were observed in Guadalajara and Mexico City, suggesting high-density wireless environments with overlapping coverage areas. Only a limited percentage of networks were classified within the very good or excellent signal categories across the three locations.

Signal quality distribution by city (download)

Signal stability analysis revealed that most detected wireless deployments exhibited stable beacon transmission behavior. More than 96% of the detected access points across all locations were classified as stable, while only a small percentage exhibited unstable or indeterminate signal behavior.

These findings imply that the majority of the wireless infrastructure observed during the assessment corresponded to permanently deployed access points rather than transient or intermittent wireless devices.

Signal stability status (download)

Frequency band analysis revealed the strong prevalence of 2.4 GHz wireless deployments across the three locations. More than 95% of the detected wireless networks operated within the 2.4 GHz spectrum, while only a small percentage of deployments were classified under the unknown or non-standard frequency categories. This uneven distribution reflects the continued prevalence of legacy-compatible wireless infrastructure and SOHO deployments.

Frequency band utilization (download)

These findings are consistent with dense urban wireless environments with large numbers of access points in restricted spectrum allocations.

Channel congestion and spectrum usage

Next, we analyzed wireless channel utilization to evaluate frequency spectrum congestion and channel allocation patterns across the three cities. Our analysis focused on the 2.4 GHz spectrum, where channel overlap and high access point density commonly produce interference and degraded wireless performance. In densely populated wireless environments, an excessive concentration of access points on a limited number of channels can lead to co-channel interference, packet collisions, reduced throughput, and degraded network stability.

Spectrum congestion analysis revealed that the 2.4 GHz band consistently experienced elevated congestion levels across the three cities. The detailed results showed a strong concentration of deployments on channels 11, 6 and 1, which are traditionally recommended as non-overlapping channels within the 2.4 GHz spectrum. Channel 11 was the most utilized channel, accounting for 25.2% of the detected access points, followed by channel 6 with 22.5% and channel 1 with 19.5%. This distribution indicates that most wireless deployments adhere to standard channel allocation practices for 2.4 GHz Wi-Fi environments.

The following figure illustrates the overall distribution of the most frequently utilized wireless channels.

Most utilized wireless channels (download)

To further assess wireless spectrum saturation, the detected access points were grouped according to channel congestion levels: VERY_HIGH, HIGH, UNKNOWN, MEDIUM, LOW and NONE.

Mexico City had the highest proportion of heavily congested wireless channels, with approximately 7% of detected access points operating under HIGH congestion conditions. Guadalajara followed with nearly 5% of deployments categorized as HIGH congestion, while Monterrey had the lowest percentage at approximately 3.29%.

These findings suggest that wireless spectrum saturation increases proportionally with urban infrastructure density and access point concentration. Despite the presence of congested deployments, most detected access points were categorized as LOW or MEDIUM congestion, suggesting severe spectrum saturation was localized rather than uniformly distributed.

Channel congestion by city (download)

A thorough analysis of individual channel utilization revealed that channels 11, 6 and 1 consistently experienced the highest congestion levels across the three cities, which correlates with our previous findings. These channels accounted for the majority of VERY_HIGH congestion classifications, particularly within the 2.4 GHz band.

In Mexico City, channel 11 alone accounted for more than 25% of detected deployments and consistently exhibited VERY_HIGH congestion levels.

This behavior reflects the limited availability of non-overlapping channels within the 2.4 GHz spectrum and the widespread reliance on default wireless configurations.

Most congested channels by city (download)

Overall, the channel utilization analysis showed that wireless deployments are concentrated heavily within the traditional, non-overlapping 2.4 GHz channels. While this strategy reduces adjacent-channel interference, excessive access point density on the same channels can still produce significant co-channel contention and poor wireless performance in high-density urban environments.

Wireless security configurations

The next thing we evaluated was the security posture of the detected wireless networks. We analyzed the wireless security configurations advertised by access points in each of the locations.

Overall security configuration distribution

The analysis revealed that WPA2 was the dominant wireless authentication mechanism across the three cities. Mexico City had the highest WPA2 adoption rate at 81.19%, followed by Monterrey at 79.19% and Guadalajara at 77.59%.

The study found that every 6th open access point (17%) was unsafe, namely 16.5% in Mexico City, 18.5% in Guadalajara, and 17.2% in Monterrey. Open wireless deployments were consistently present across all locations, ranging between 10% and 12% of detected access points. These findings show that despite the widespread deployment of modern wireless security standards, encryption adoption remains incomplete.

Distribution of wireless authentication mechanisms across the three locations (download)

To simplify the interpretation of wireless security posture, we grouped detected networks into four categories:

  • Secure (WPA2/WPA3)
  • Insecure (Open/WEP)
  • Weak (WPA)
  • Unknown

Across the three locations, secure networks comprised most of detected deployments, accounting for approximately 82% of all access points. However, insecure open networks still account for between 10% and 12% of detected wireless infrastructure, consistent with our previous findings. It is important to mention that networks within the unknown category are not considered secure.

Mexico City had the highest percentage of secure deployments at 83.54%, while Guadalajara had the highest percentage of insecure open networks at 12.46%. Although Monterrey had the lowest percentage of insecure networks, open deployments still accounted for more than 10% of the detected access points.

Wireless security posture grouping across the three locations (download)

Although modern WPA2/WPA3 encryption standards dominate current wireless deployments, the continued presence of open and legacy WPA deployments indicates that insecure wireless configurations remain relevant from an operational standpoint. These networks may expose users to passive traffic interception, unauthorized monitoring, rogue access point attacks, and credential harvesting techniques.

WPS-enabled networks

We also analyzed Wi-Fi Protected Setup (WPS) in all the locations to evaluate additional attack surfaces. WPS is a standard feature on wireless routers that enables devices such as printers, repeaters or mobile phones to connect to a secure Wi-Fi network without manually entering a long password, typically through a PIN-based enrolled mechanism. Although WPA2 and WPA3 provide strong encryption mechanisms, the presence of WPS can introduce security weaknesses due to inherently vulnerable PIN-based enrollment methods.

By combining detections from the three locations, we found that 55% of all detected access points did not advertise WPS capabilities, leaving 45% of deployments vulnerable to WPS-based abuse. These results suggest that, despite the adoption of modern encryption standards, a significant portion of wireless infrastructure continues to expose legacy convenience features.

During the analysis, we found that Mexico City had the highest proportion of WPS-enabled networks, with 46.61% of the detected access points advertising WPS capabilities. Guadalajara was second with 43.45%, while Monterrey had the lowest proportion at 40.93%.

The percentage of detected access points advertising WPS capabilities across the three locations (download)

Almost half of the detected wireless networks in each city continued to advertise WPS, indicating that WPS prevalence is consistently high across the three cities.

Secure networks with WPS enabled

In many cases, networks classified as secure because of WPA2/WPA3 encryption still had WPS functionality enabled, which effectively increased the available attack surface.

To further assess the relationship between encryption strength and WPS exposure, we conducted a secondary analysis of secure networks (WPA2/WPA3) only. The results showed that around half of all secure deployments still exposed WPS, with the following breakdown for each city:

  • Mexico City: 53.7%
  • Guadalajara: 50.9%
  • Monterrey: 47.5%

The proportion of secure networks with WPS enabled across the three locations (download)

These findings indicate that encryption strength alone is not enough to evaluate wireless security posture because additional protocol features, such as WPS, may still expose exploitable attack vectors.

Additional security considerations

Overall, travelers operating within dense public environments are exposed not only to insecure wireless infrastructure but also to various risks associated with digital interactions. These risks include many threats, from public USB charging systems and phishing QR codes to proximity-based protocols and exposure to shared public devices, such as interactive totems or kiosks. One particular point that should be taken into account in light of our research is the issue of rogue wireless deployments.

Rogue access points are not necessarily malicious; they may be set up accidentally by misconfiguring router settings. An entry point for potential compromise might be caused by various misconfigurations, from a weak password to an insecure protocol. However, attackers deploy such unauthorized hotspots with malicious intent to infiltrate a network. Threat actors may deploy rogue access points posing as legitimate public wireless networks in airports, hotels, cafés and tourist areas. These deployments are called “evil twins” and can trick users into connecting to attacker-controlled infrastructure capable of intercepting traffic, harvesting credentials, or performing man-in-the-middle attacks. Further risk lies in the potential compromise of local network devices or even malware distribution. Such threats complement our findings, underscoring the importance of implementing traffic encryption, using a security solution and exercising extreme caution while browsing via public networks.

Conclusion

The wardriving assessment conducted in Mexico City, Guadalajara, and Monterrey revealed that modern wireless infrastructure continues to present multiple forms of operational exposure despite the widespread adoption of WPA2 and WPA3 security standards. The analysis demonstrated that wireless environments are highly standardized in all the locations, with recurring ISP deployments, default SSID naming conventions, homogeneous manufacturer distribution, and predictable channel allocation practices observed in all three cities.

Although most of the detected networks were classified as secure under WPA2/WPA3 authentication mechanisms, a significant proportion were exposing additional attack surfaces through enabled WPS functionality, default configurations, sequential SSID structures, and infrastructure metadata disclosure. This demonstrates that encryption strength alone is insufficient for evaluating the overall security posture of wireless infrastructure. Additionally, the prevalence of open networks and legacy wireless configurations indicates that insecure deployments are still operationally relevant in all the locations.

The results also showed that wireless infrastructure is heavily concentrated within the 2.4 GHz spectrum, particularly around channels 11, 6, and 1. This leads to elevated congestion and increased co-channel interference in densely populated urban environments.

SSID analysis further revealed that publicly broadcast wireless identifiers frequently expose valuable operational information about ISPs, equipment manufacturers, deployment templates, organizational ownership, and user-defined naming practices. The identification of default ISP naming conventions, sequential SSID structures, and BSSID-derived SSIDs demonstrated that many deployments prioritize operational convenience and simplicity over exposure minimization and privacy.

The scope of the threats stemming from vulnerable wireless configurations poses serious digital exposure risks for users. The widespread presence of standard deployments, predictable SSID naming and publicly exposed infrastructure identifiers can facilitate passive reconnaissance, infrastructure fingerprinting and opportunistic targeting.

Recommendations

To minimize the risks of wireless-based exposure and the attack surface related to hotspot infrastructure, we recommend taking the following measures:

  • Disable WPS functionality on wireless routers whenever possible, particularly within WPA2/WPA3 deployments.
  • Avoid using default SSID naming conventions that disclose ISP providers, router manufacturers, or deployment templates.
  • Refrain from using personal, organizational, or location-based identifiers in wireless network names.
  • Avoid configuring SSID using BSSID or naming conventions derived from MAC addresses, as these may expose hardware fingerprinting information.
  • Promote migration toward modern WPA3-capable infrastructure while removing legacy wireless protocols when operationally feasible.
  • Reduce wireless congestion by optimizing channel allocation strategies and minimizing excessive dependence on the 2.4 GHz spectrum.
  • Encourage adoption of 5 GHz and newer wireless technologies to reduce interference and improve spectrum efficiency.

The findings presented in this assessment emphasize the importance of combining strong wireless encryption standards, secure deployment practices, exposure minimization strategies, and user awareness to enhance the overall security posture of wireless environments.

❌