Attackers are increasingly abusing Microsoft’s decades-old MSHTA utility to stealthily deliver stealers, loaders, and persistent malware through phishing, fake software downloads, and LOLBIN-based attack chains.
The statistics in this report are based on detection verdicts returned by Kaspersky products unless otherwise stated. The information was provided by Kaspersky users who consented to sharing statistical data.
Quarterly figures
In Q1 2026:
Kaspersky products blocked more than 343 million attacks that originated with various online resources.
Web Anti-Virus responded to 50 million unique links.
File Anti-Virus blocked nearly 15 million malicious and potentially unwanted objects.
2938 new ransomware variants were detected.
More than 77,000 users experienced ransomware attacks.
14% of all ransomware victims whose data was published on threat actors’ data leak sites (DLS) were victims of Clop.
More than 260,000 users were targeted by miners.
Ransomware
Quarterly trends and highlights
Law enforcement success
In January 2026, it was reported that the FBI had seized the domains of the RAMP cybercrime forum, a major platform used extensively by ransomware developers to advertise their RaaS programs and to recruit affiliates. There has been no official statement from the FBI, nor is it clear if RAMP servers were seized. In a post on an external website, a RAMP moderator mentioned law enforcement agencies gaining control over the forum. The takedown disrupted a key element of the RaaS ecosystem, creating ripple effects for ransomware operators, affiliates, and initial access brokers.
A man suspected of links to the Phobos group was apprehended in Poland. He was charged with the creation, acquisition, and distribution of software designed for unlawfully obtaining information, including data that facilitates unauthorized access to information stored within a computer system.
In March, a Phobos ransomware administrator pleaded guilty to the creation and distribution of the Trojan, which had been used in international attacks dating back to at least November 2020.
In March, the U.S. Department of Justice charged a man who had acted as a negotiator for ransomware groups. The company he worked for specializes in cyberincident investigations. The prosecution alleges the suspect colluded with the BlackCat threat actor to share privileged insights into the ongoing progress of negotiations. Additionally, the suspect is alleged to have had a prior direct role in BlackCat attacks, serving as an affiliate for the RaaS operation.
In a separate development this March, a U.S. court sentenced an initial access broker associated with the Yanluowang ransomware group to 81 months of imprisonment. According to the U.S. Department of Justice, the convict facilitated dozens of ransomware attacks across the United States, resulting in over $9 million in actual loss and more than $24 million in intended loss.
Vulnerabilities and attacks
The Interlock group has been heavily exploiting the CVE-2026-20131 zero-day vulnerability in Cisco Secure FMC firewall management software since at least January 26, 2026. The vulnerability enabled arbitrary Java code execution with root privileges on the affected device. This campaign demonstrates the ongoing reliance on zero-day vulnerabilities for initial access, a focus on network appliances as high-value entry points, and the rapid weaponization of new vulnerabilities within the ransomware ecosystem.
The most prolific groups
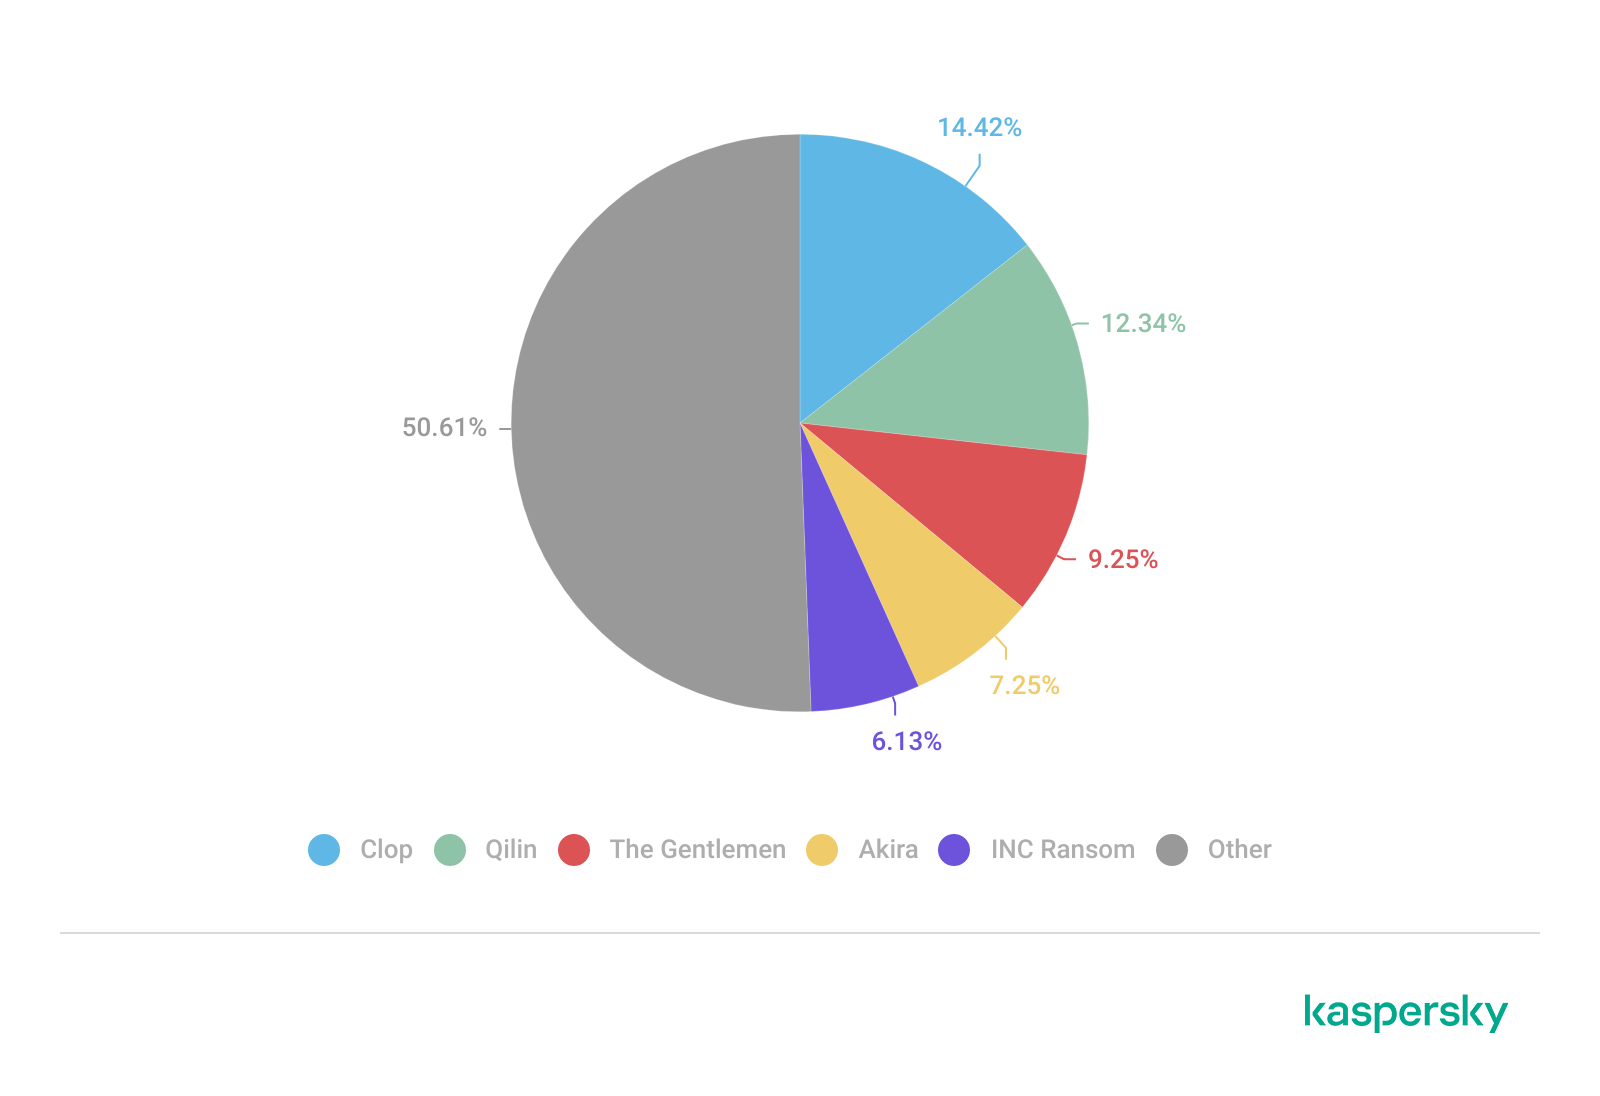
This section highlights the most prolific ransomware gangs by number of victims added to each group’s DLS. This quarter, the Clop ransomware (14.42%) returned to the top of the rankings, displacing Qilin (12.34%), which had held the leading position in the previous reporting period. Following closely is a new threat actor, The Gentlemen (9.25%). Emerging no later than July 2025, the group had already surpassed the activity levels of mainstays such as Akira (7.25%) and INC Ransom (6.13%).
Number of each group’s victims according to its DLS as a percentage of all groups’ victims published on all the DLSs under review during the reporting period (download)
Number of new variants
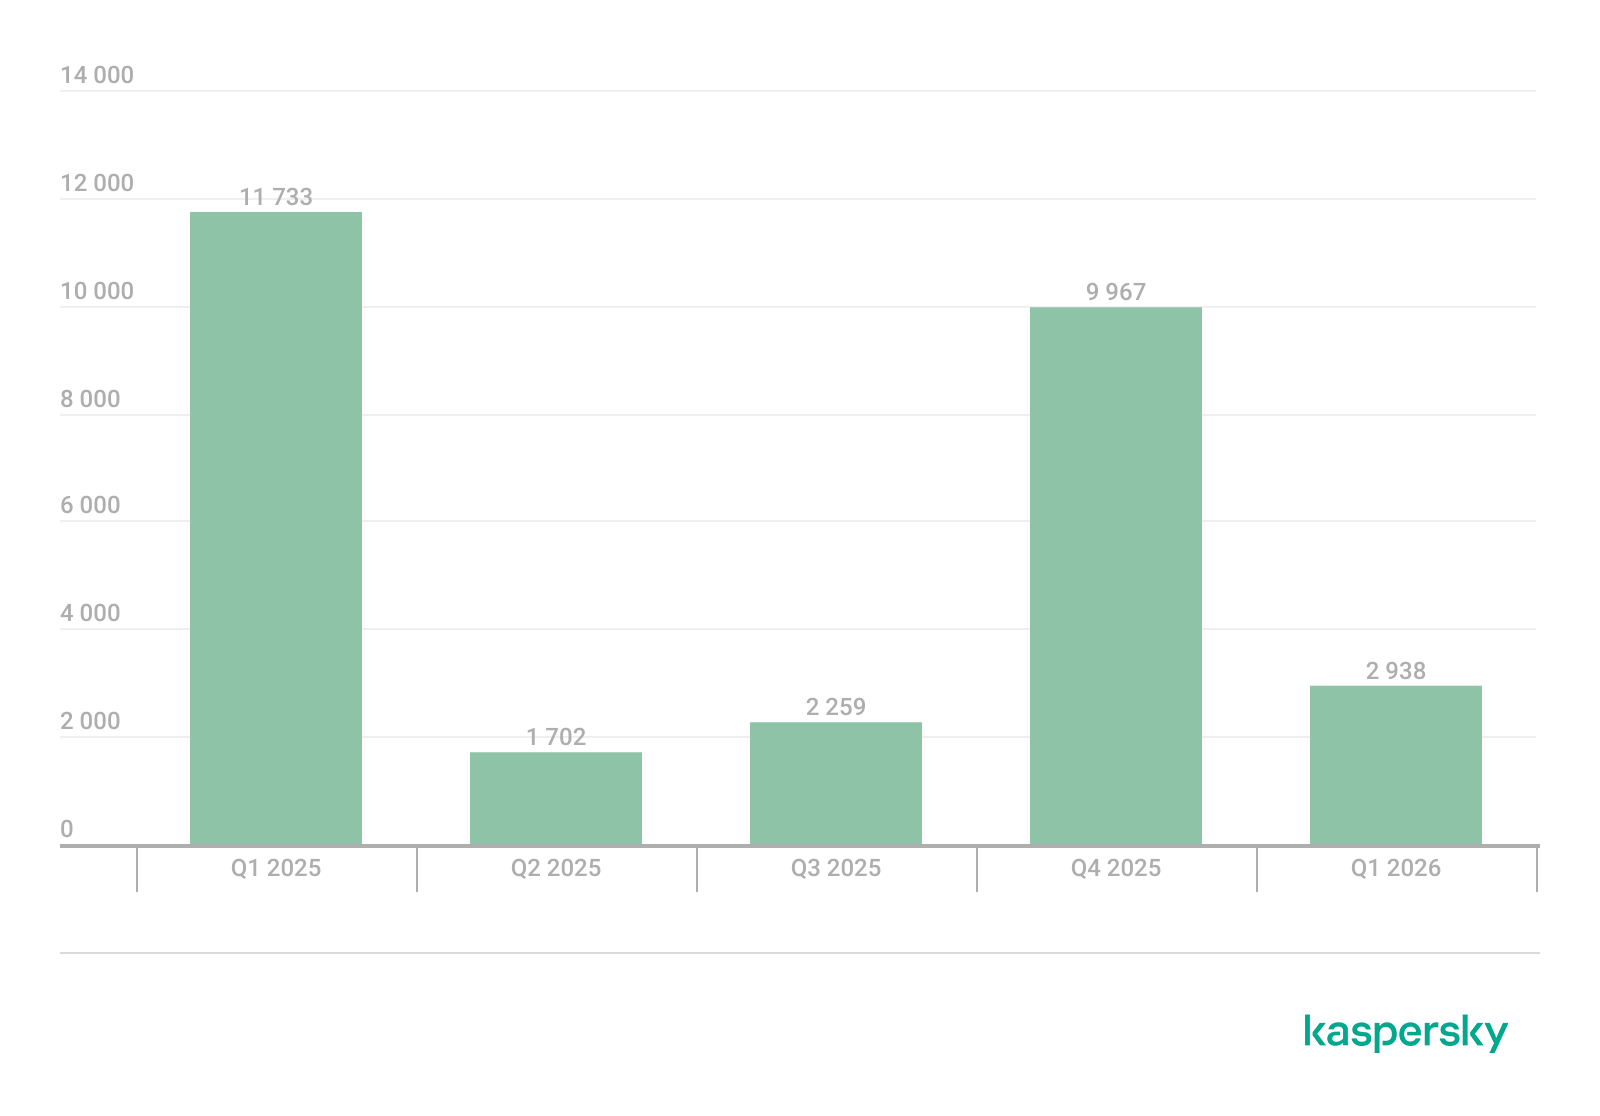
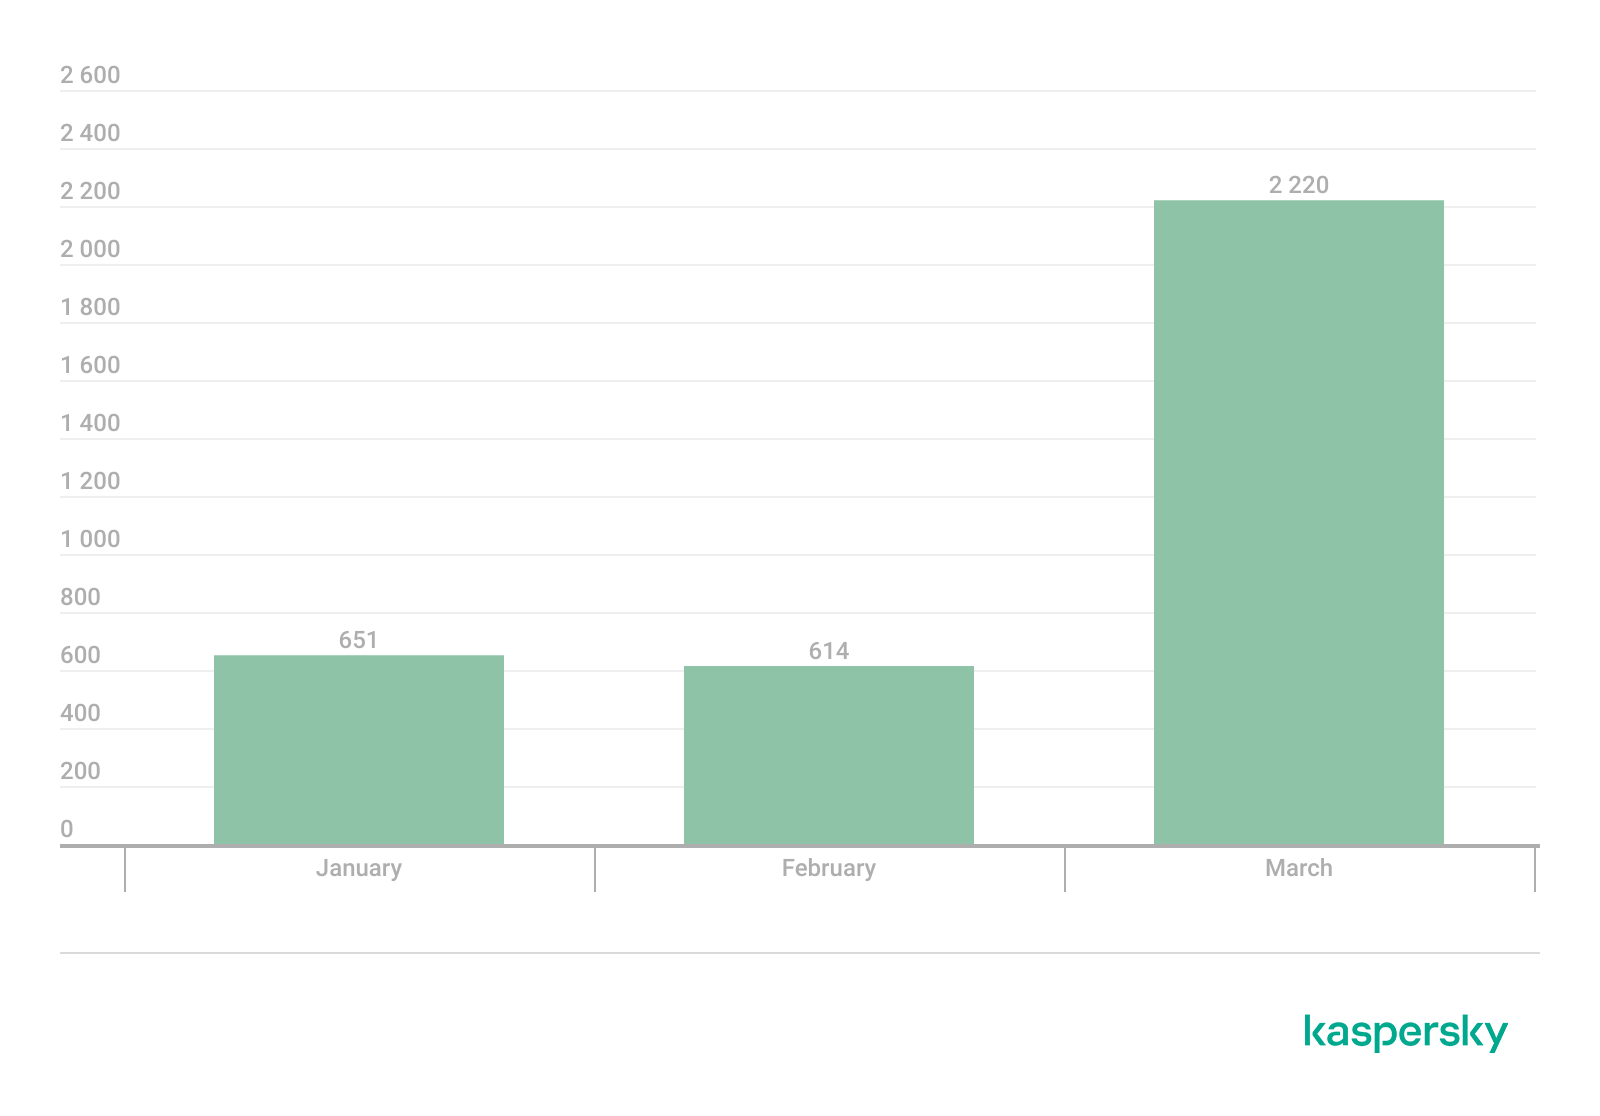
In Q1 2026, Kaspersky solutions detected six new ransomware families and 2938 new modifications. Volumes have returned to Q3 2025 levels following a surge in Q4 2025.
Number of new ransomware modifications, Q1 2025 — Q1 2026 (download)
Number of users attacked by ransomware Trojans
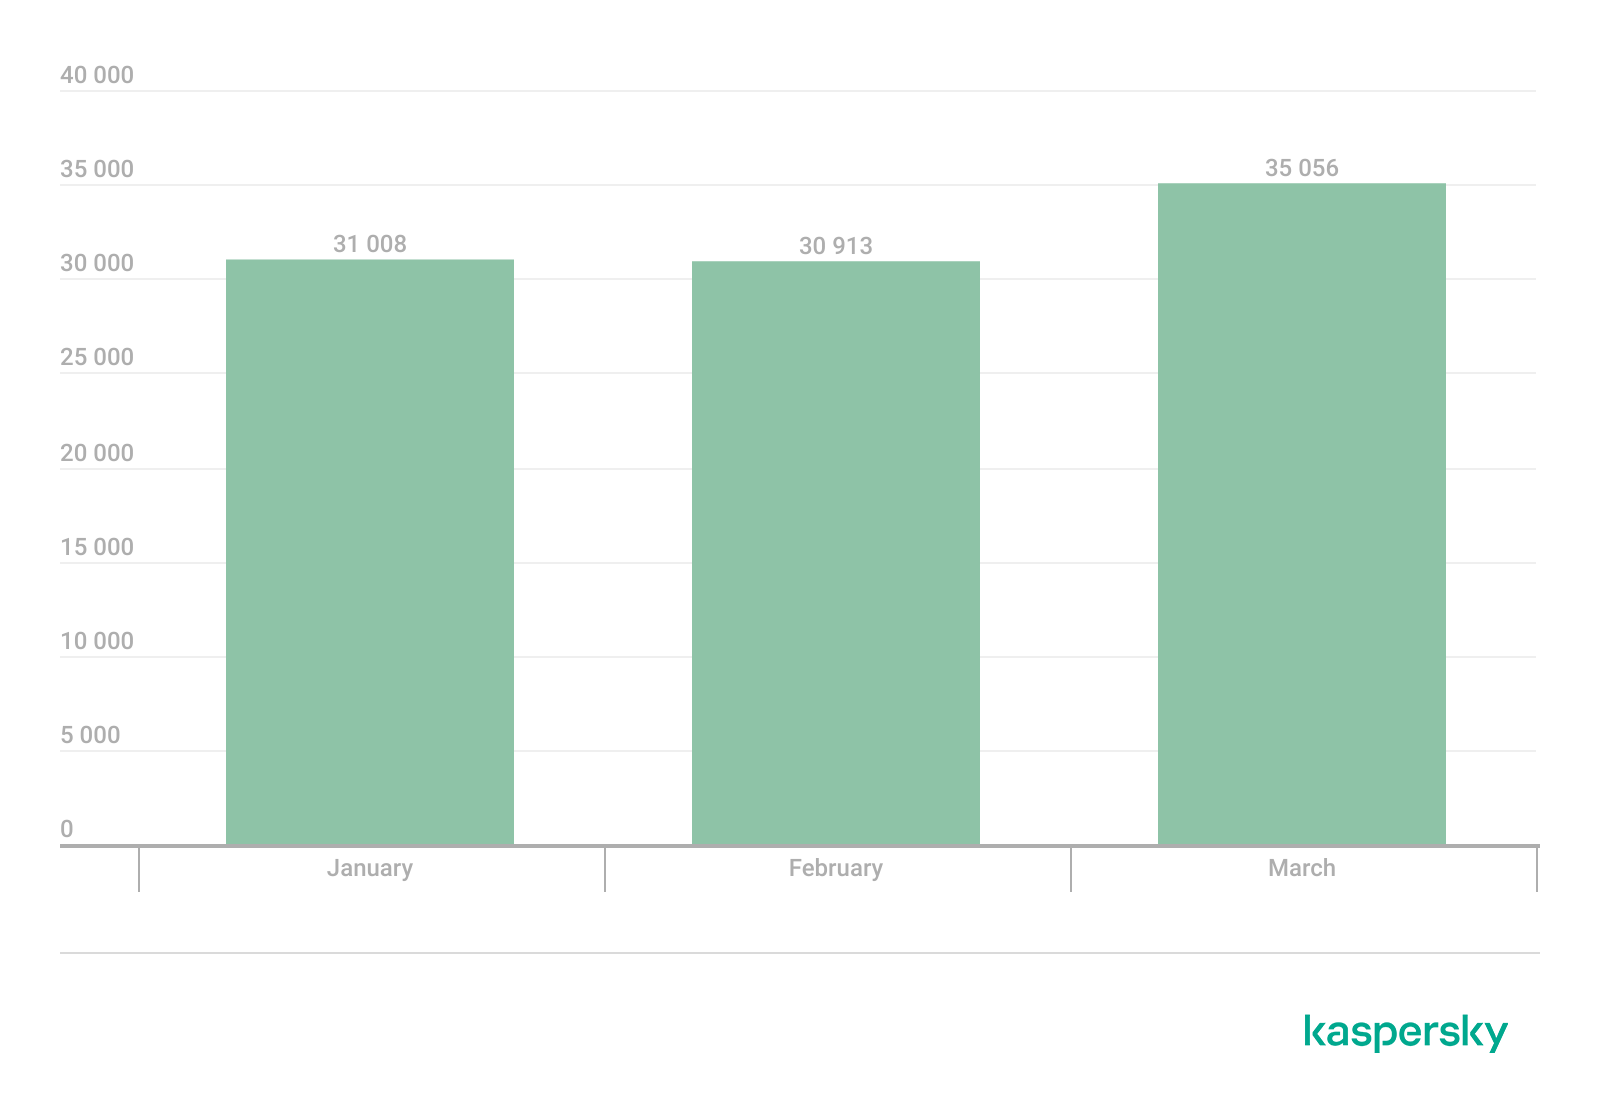
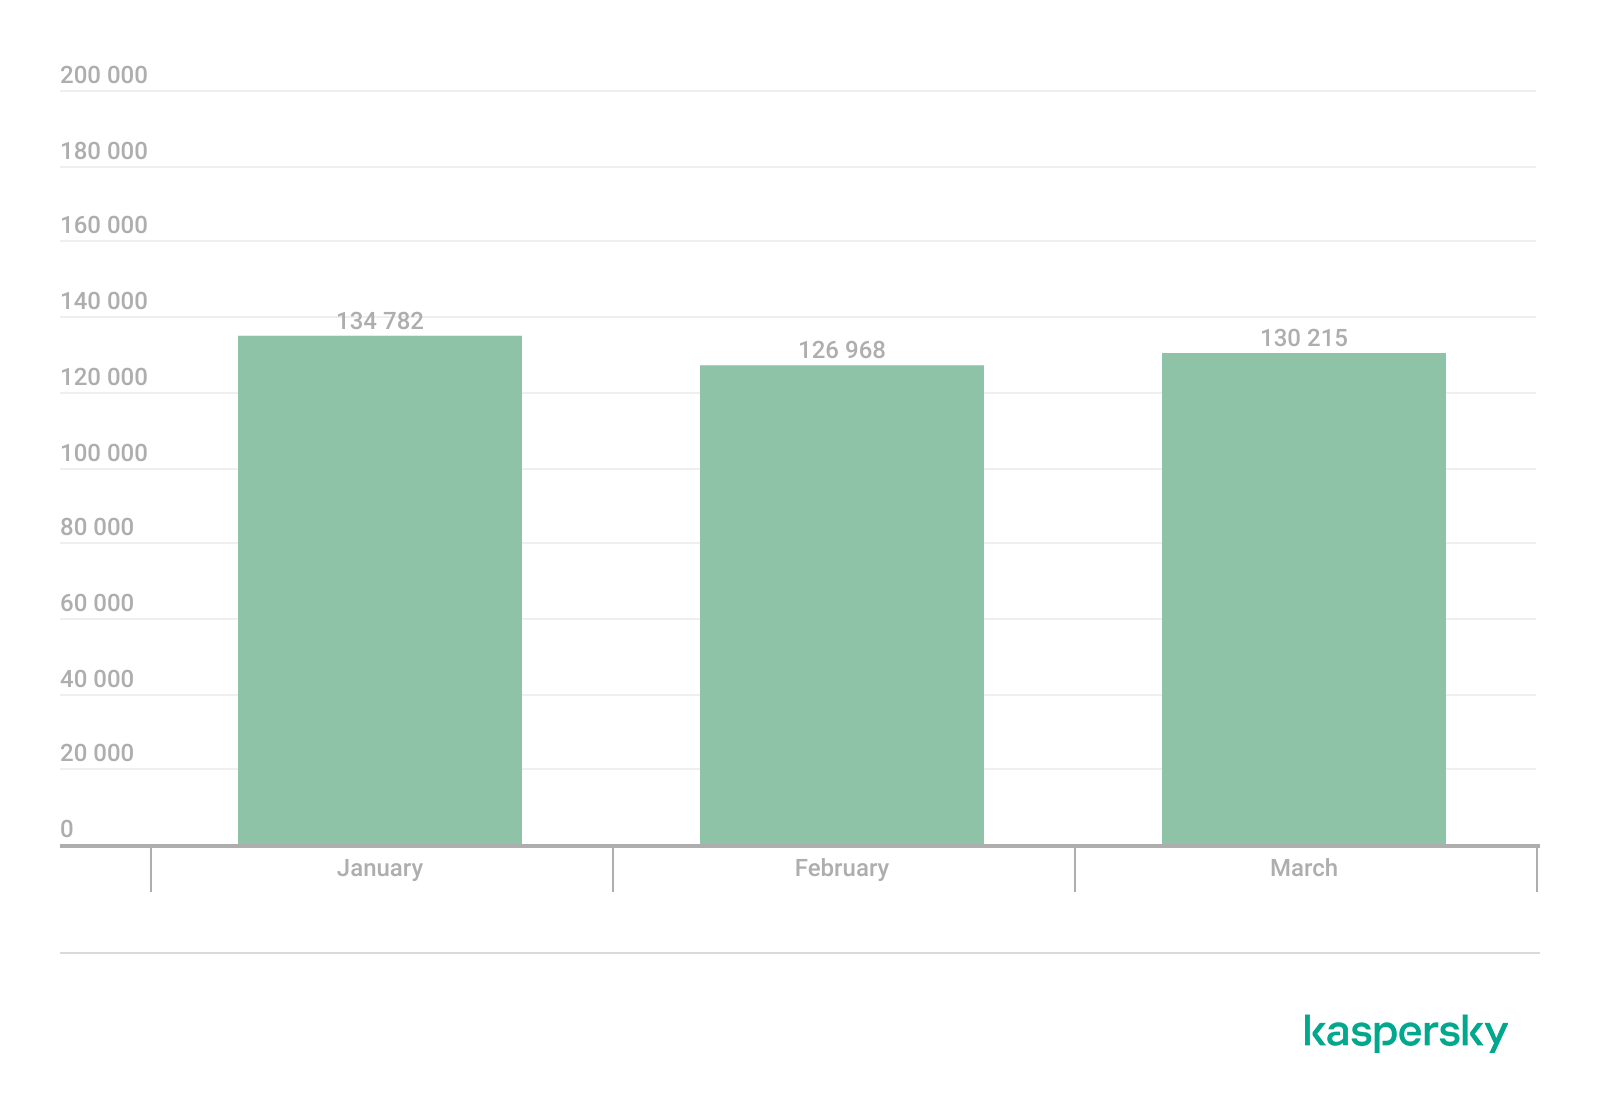
Throughout Q1, our solutions protected 77,319 unique users from ransomware. Ransomware activity was highest in March, with 35,056 unique users encountering such attacks during the month.
Number of unique users attacked by ransomware Trojans, Q1 2026 (download)
Attack geography
TOP 10 countries and territories attacked by ransomware Trojans
Country/territory*
%**
1
Pakistan
0.79
2
South Korea
0.64
3
China
0.52
4
Tajikistan
0.40
5
Libya
0.38
6
Turkmenistan
0.36
7
Iraq
0.35
8
Bangladesh
0.33
9
Rwanda
0.30
10
Cameroon
0.28
* Excluded are countries and territories with relatively few (under 50,000) Kaspersky users.
** Unique users whose computers were attacked by ransomware Trojans as a percentage of all unique users of Kaspersky products in the country/territory.
TOP 10 most common families of ransomware Trojans
Name
Verdict
%*
1
(generic verdict)
Trojan-Ransom.Win32.Gen
33.90
2
(generic verdict)
Trojan-Ransom.Win32.Crypren
6.38
3
WannaCry
Trojan-Ransom.Win32.Wanna
5.87
4
(generic verdict)
Trojan-Ransom.Win32.Encoder
4.68
5
(generic verdict)
Trojan-Ransom.Win32.Agent
3.80
6
LockBit
Trojan-Ransom.Win32.Lockbit
2.80
7
(generic verdict)
Trojan-Ransom.Win32.Phny
1.99
8
(generic verdict)
Trojan-Ransom.MSIL.Agent
1.96
9
(generic verdict)
Trojan-Ransom.Python.Agent
1.93
10
(generic verdict)
Trojan-Ransom.Win32.Crypmod
1.89
* Unique Kaspersky users attacked by the specific ransomware Trojan family as a percentage of all unique users attacked by this type of threat.
Miners
Number of new variants
In Q1 2026, Kaspersky solutions detected 3485 new modifications of miners.
Number of new miner modifications, Q1 2026 (download)
Number of users attacked by miners
In Q1, we detected attacks using miner programs on the computers of 260,588 unique Kaspersky users worldwide.
Number of unique users attacked by miners, Q1 2026 (download)
Attack geography
TOP 10 countries and territories attacked by miners
Country/territory*
%**
1
Senegal
3.19
2
Turkmenistan
3.06
3
Mali
2.63
4
Tanzania
1.62
5
Bangladesh
1.06
6
Ethiopia
0.95
7
Panama
0.88
8
Afghanistan
0.79
9
Kazakhstan
0.77
10
Bolivia
0.75
* Excluded are countries and territories with relatively few (under 50,000) Kaspersky users.
** Unique users whose computers were attacked by miners as a percentage of all unique users of Kaspersky products in the country/territory.
Attacks on macOS
In Q1 2026, Google uncovered a new cryptocurrency theft campaign. The scammers directed victims to a fraudulent video call, prompting them to execute malicious scripts under the guise of technical support fixes for connection problems.
In March, researchers with GTIG and iVerify reported the discovery of an in-the-wild exploit chain targeting both iOS and macOS devices. The exploit kit was apparently marketed on the dark web, providing threat actors with a suite of spyware capabilities alongside specialized cryptocurrency exfiltration modules. The exploit was delivered via drive-by downloads when victims visited various compromised websites. Our analysis confirmed that the toolkit included an updated version of a component previously identified in the Operation Triangulation attack chain.
Devices running macOS were similarly impacted by the high-profile supply chain attack targeting the Axios npm package, a widely used HTTP client for JavaScript. The installation of the infected package led to the deployment of a backdoor on macOS devices.
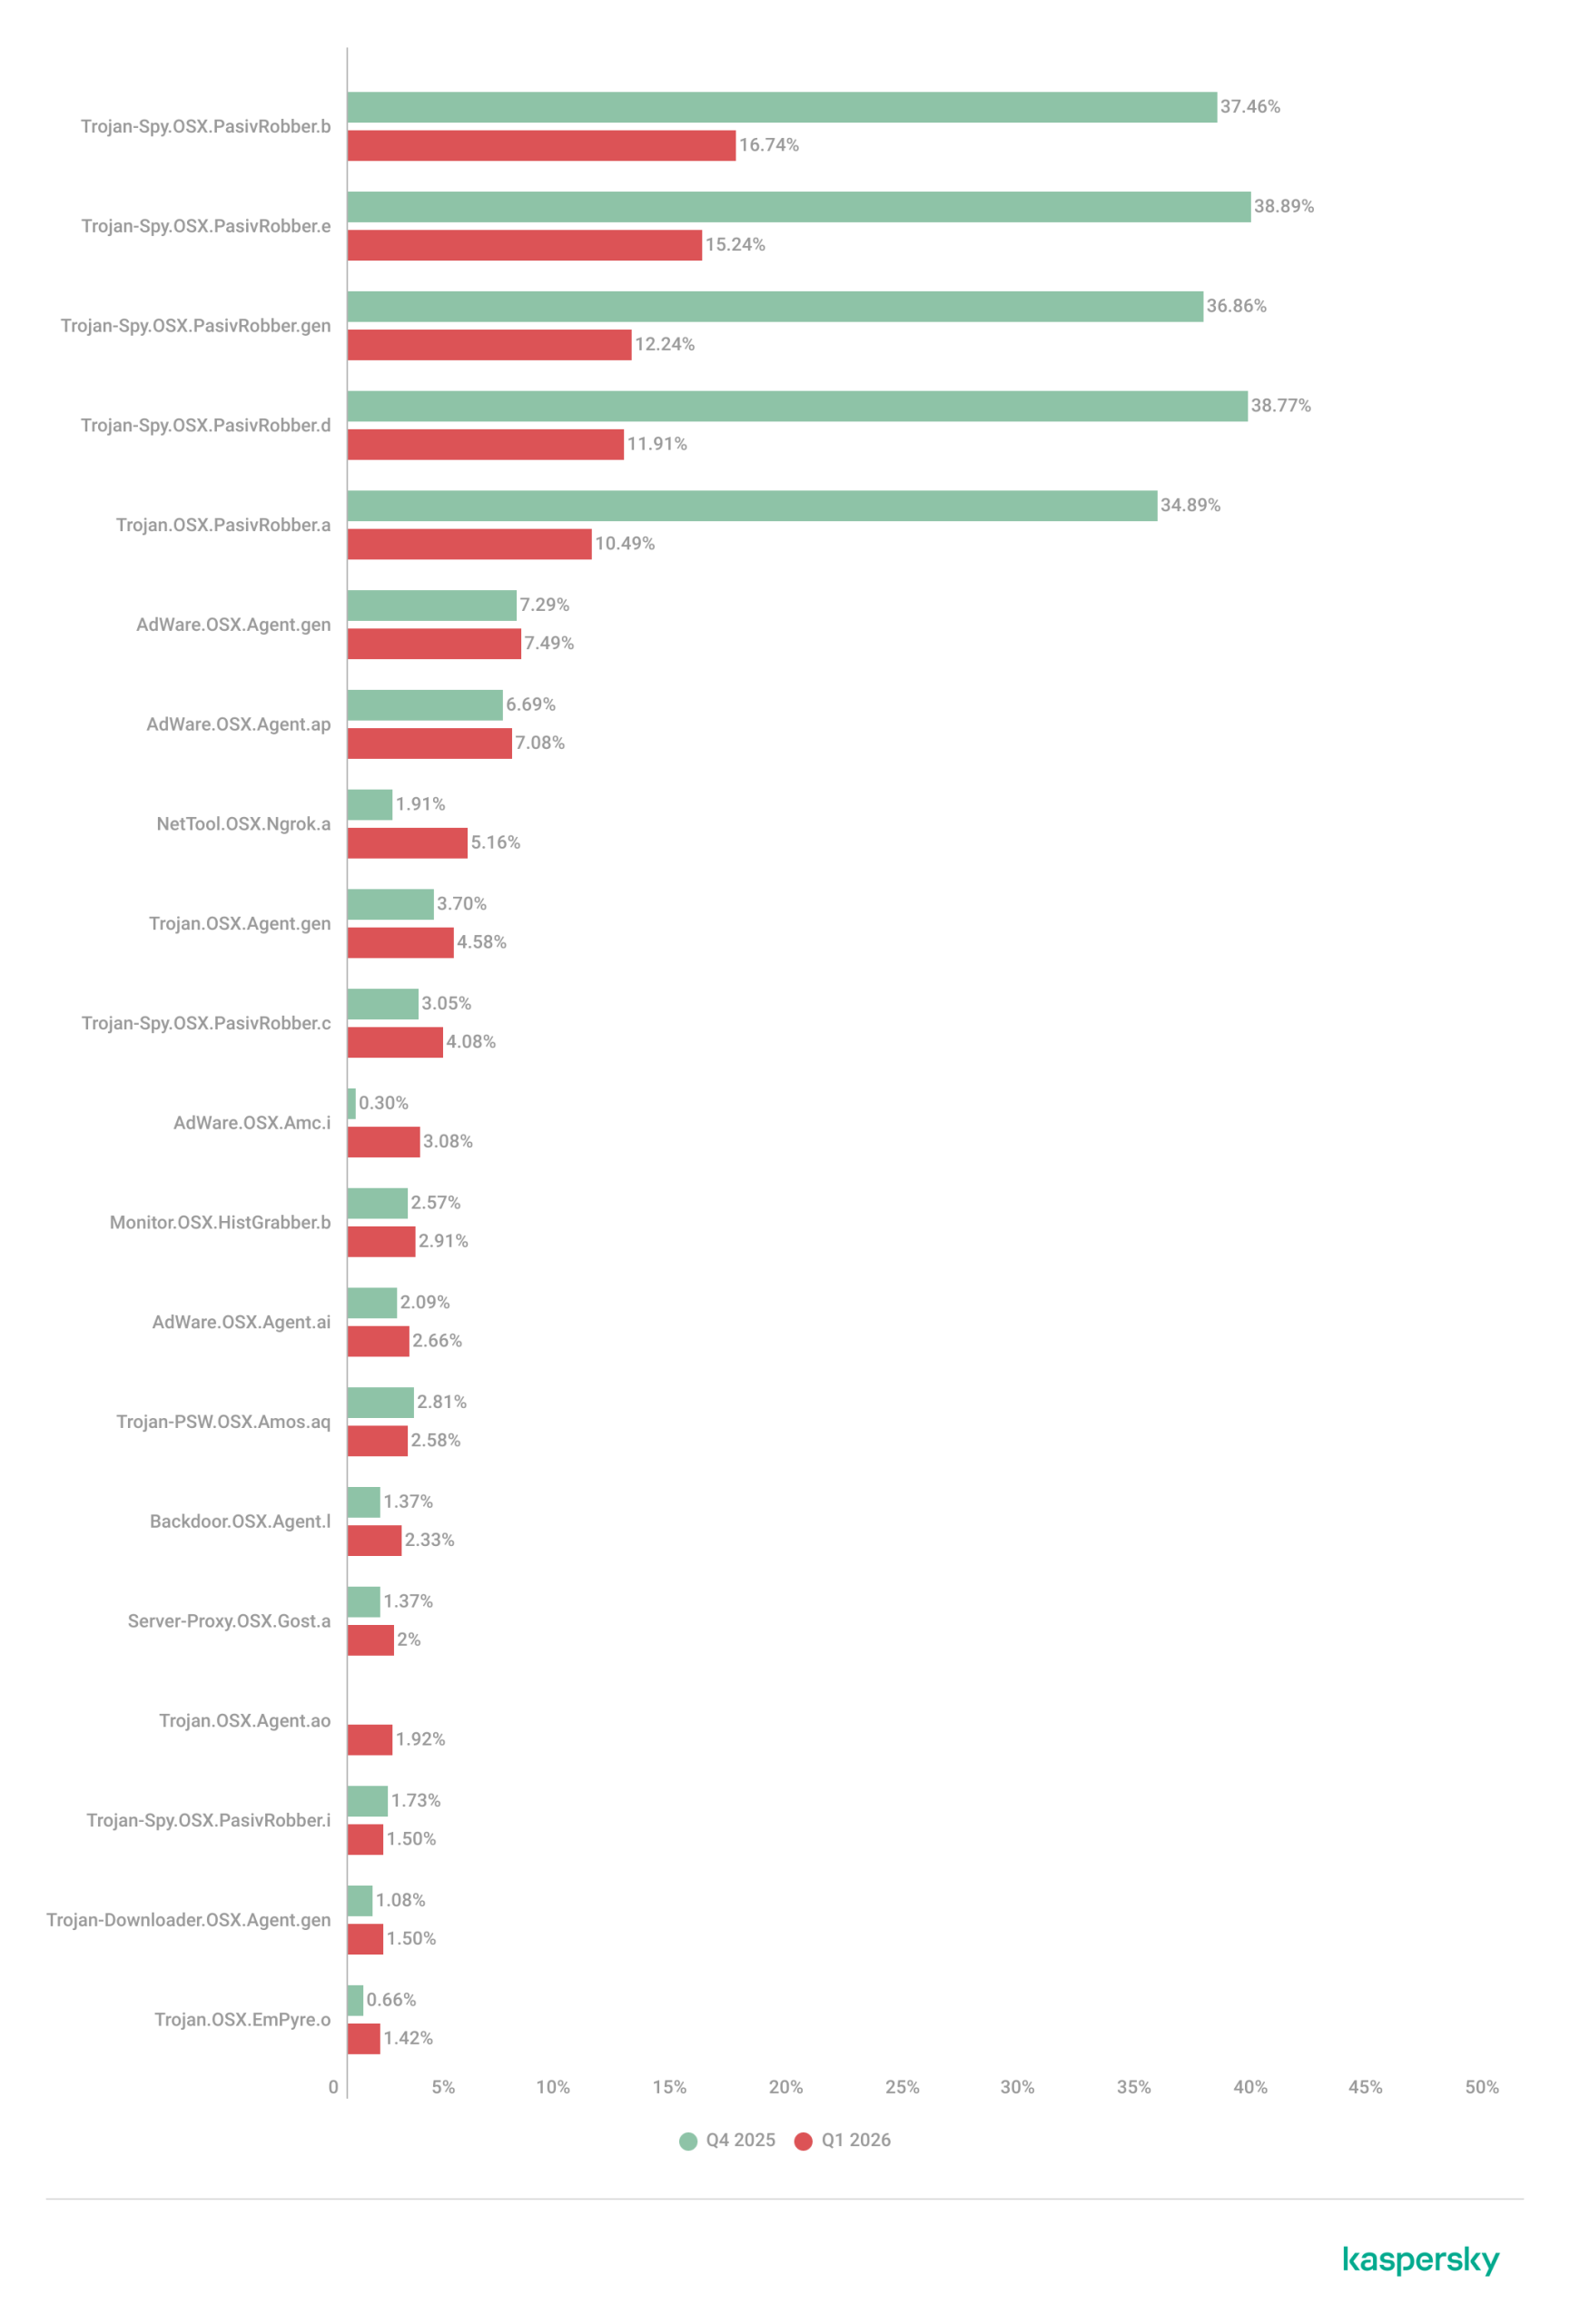
TOP 20 threats to macOS
Unique users* who encountered this malware as a percentage of all attacked users of Kaspersky security solutions for macOS (download)
* Data for the previous quarter may differ slightly from previously published data due to some verdicts being retrospectively revised.
The share of PasivRobber spyware attacks is beginning to decline, giving way to more traditional adware and Monitor-class software capable of tracking user activity. The popular Amos stealer also maintains its presence within the TOP 20.
Geography of threats to macOS
TOP 10 countries and territories by share of attacked users
Country/territory
%* Q4 2025
%* Q1 2026
China
1.28
1.97
France
1.18
1.07
Brazil
1.13
0.98
Mexico
0.72
0.52
Germany
0.71
0.45
The Netherlands
0.62
0.75
Hong Kong
0.49
0.53
India
0.42
0.48
Russian Federation
0.34
0.37
Thailand
0.24
0.27
* Unique users who encountered threats to macOS as a percentage of all unique Kaspersky users in the country/territory.
IoT threat statistics
This section presents statistics on attacks targeting Kaspersky IoT honeypots. The geographic data on attack sources is based on the IP addresses of attacking devices.
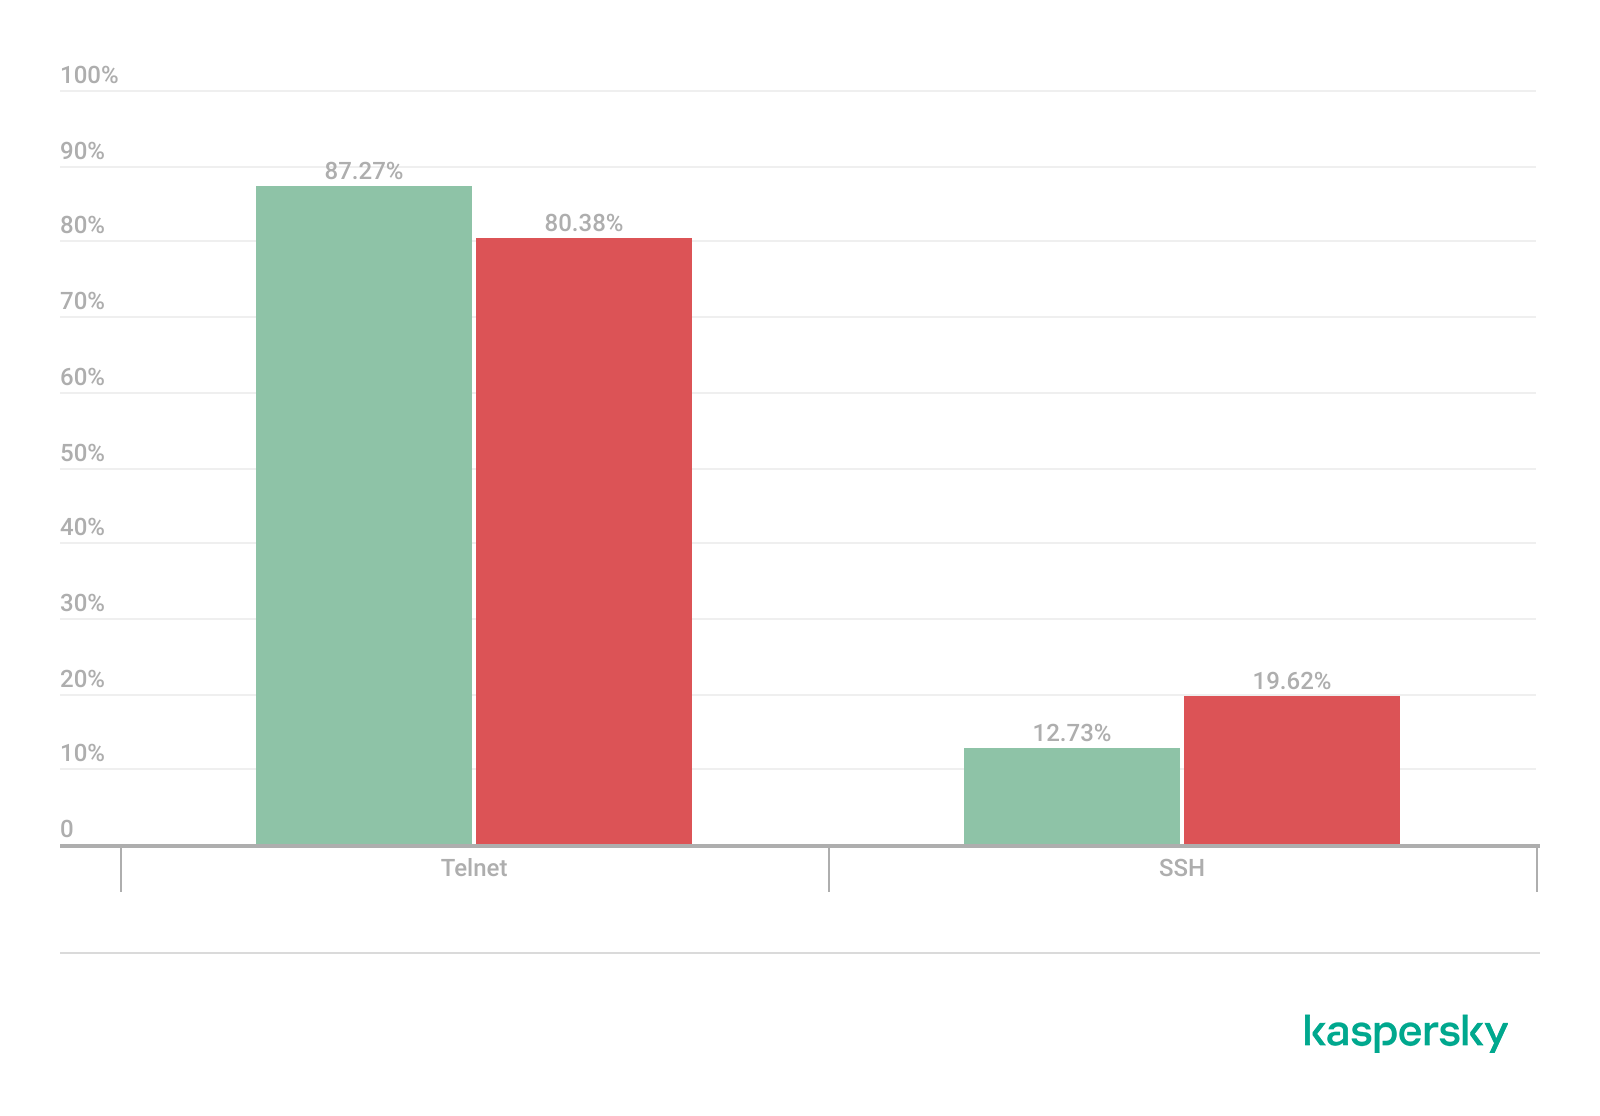
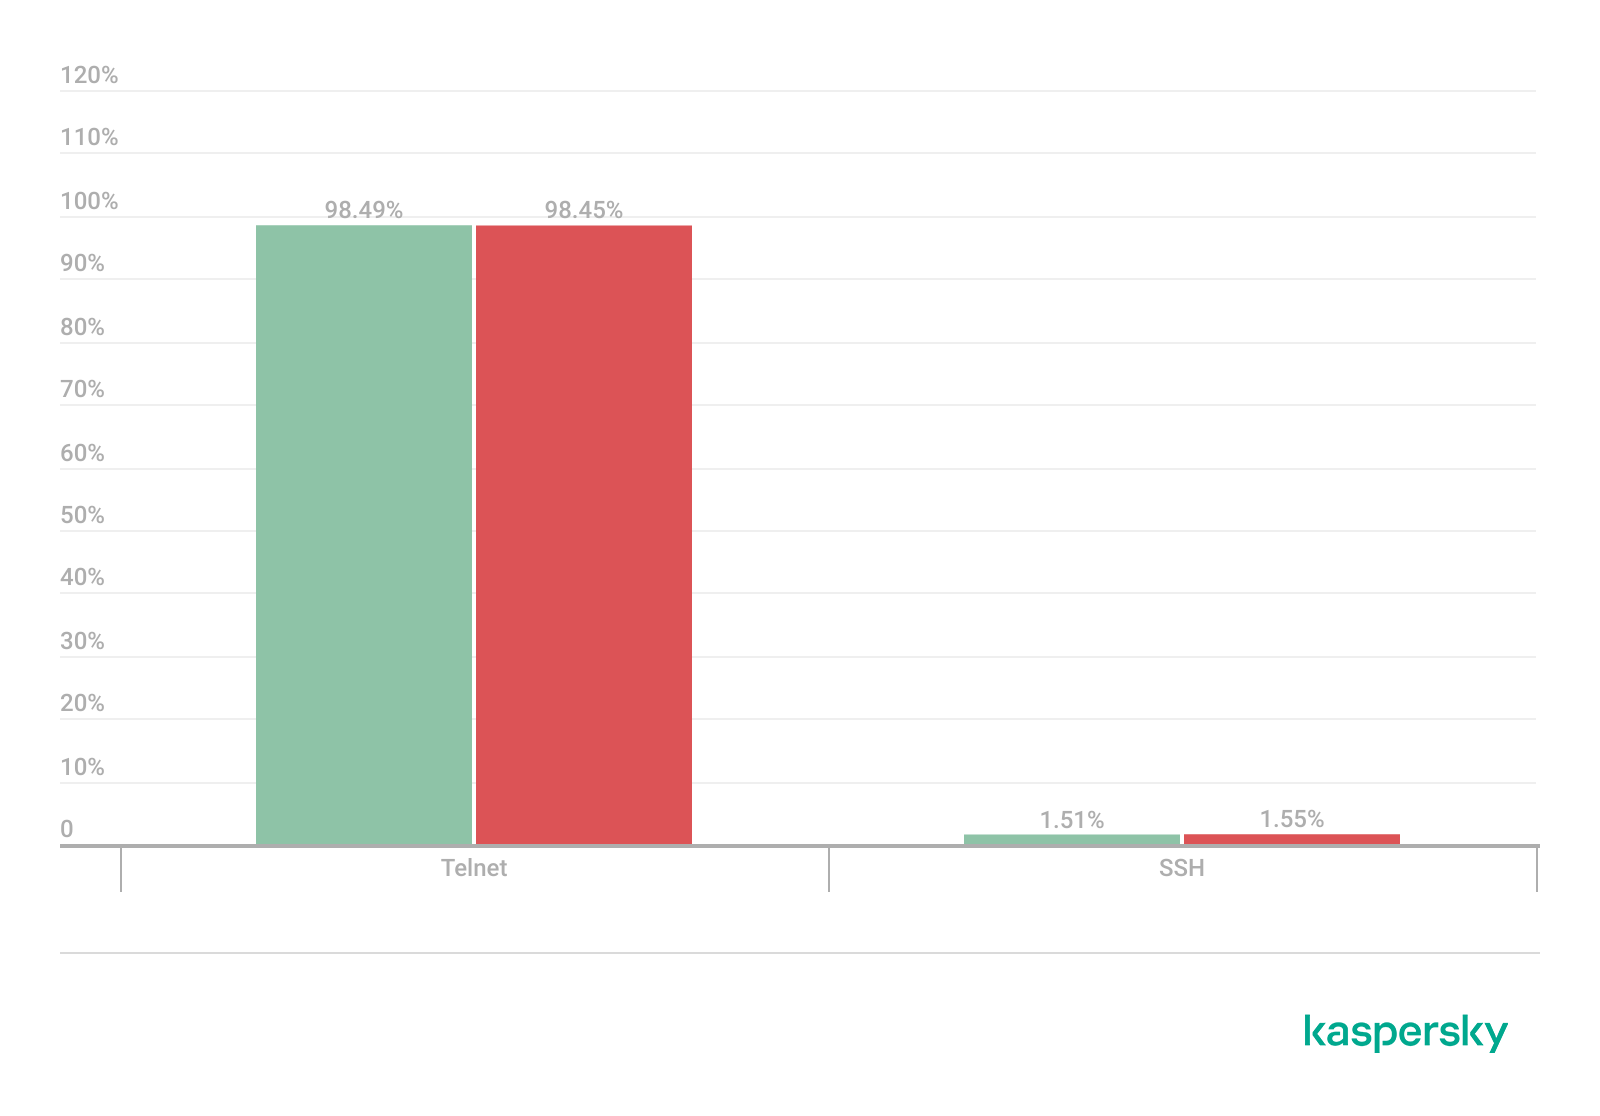
In Q1 2026, the share of devices attacking Kaspersky honeypots via the SSH protocol saw a significant increase compared to the previous reporting period.
Distribution of attacked services by number of unique IP addresses of attacking devices (download)
The distribution of attacks between Telnet and SSH maintained the ratio observed in Q4 2025.
Distribution of attackers’ sessions in Kaspersky honeypots (download)
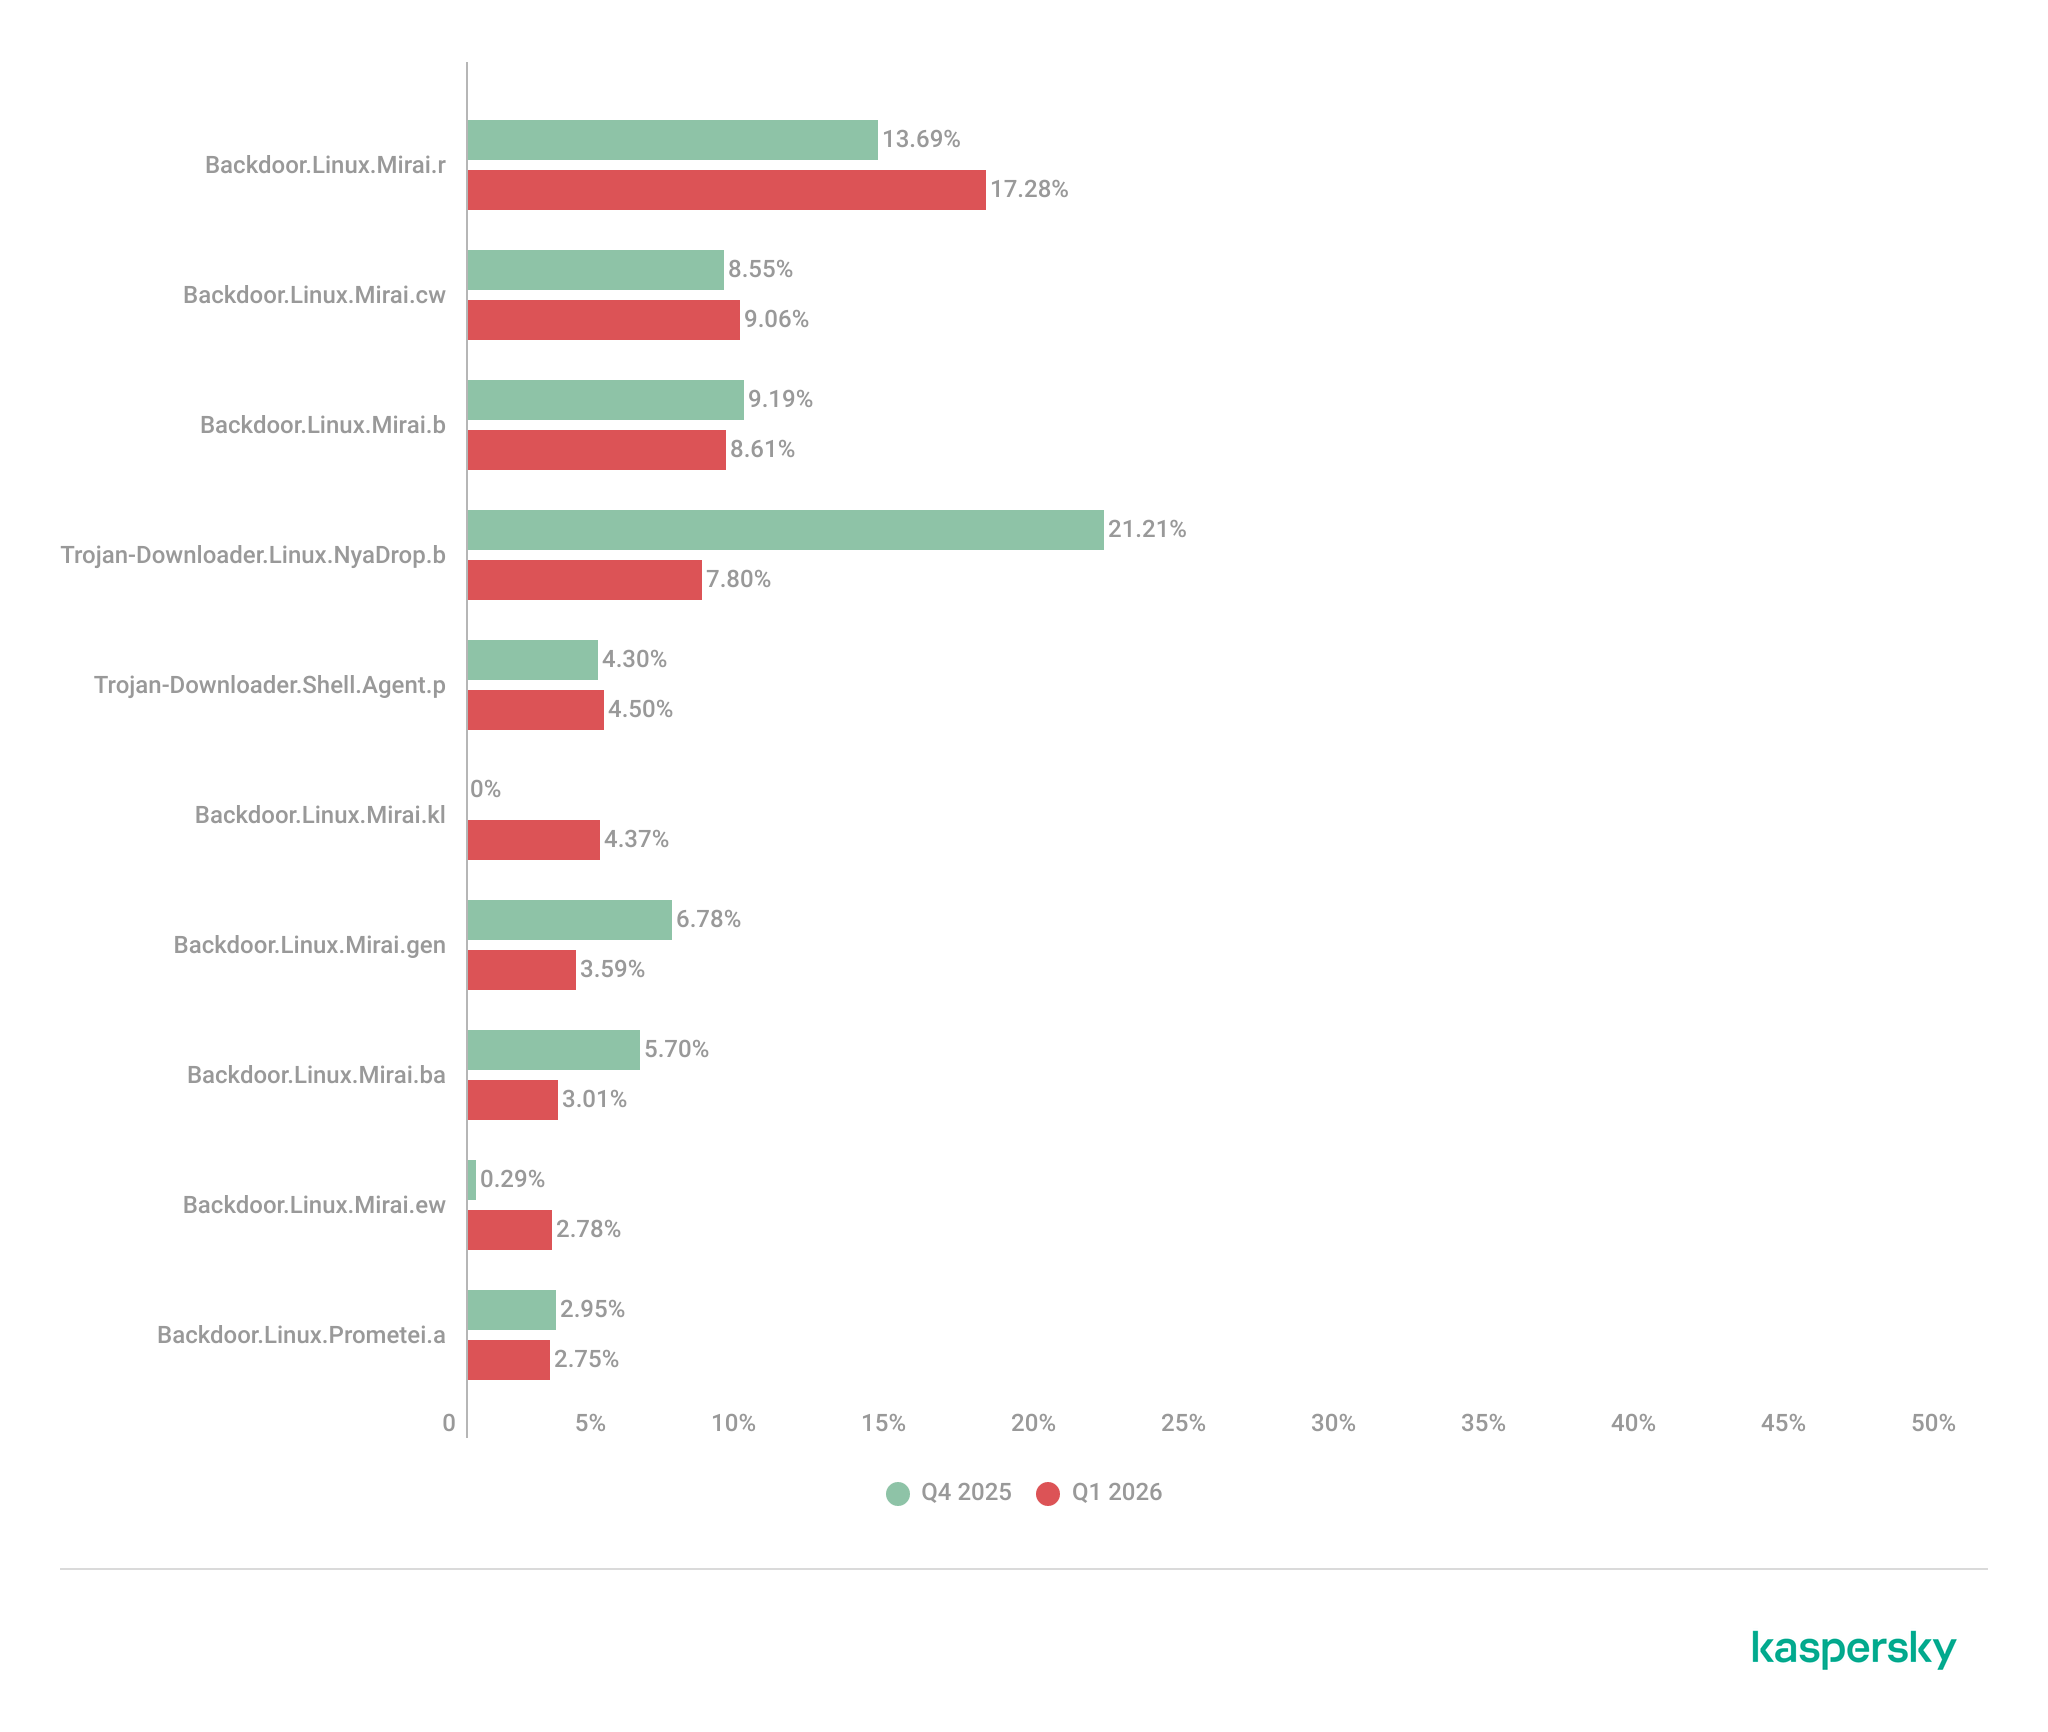
TOP 10 threats delivered to IoT devices
Share of each threat delivered to an infected device as a result of a successful attack, out of the total number of threats delivered (download)
The primary shifts in the IoT threat distribution are linked to the activity of various Mirai botnet variants, although members of this family continue to account for the majority of the list. Furthermore, a new variant, Mirai.kl, surfaced in the rankings. We also observed a significant decline in NyaDrop botnet activity during Q1.
Attacks on IoT honeypots
The United States, the Netherlands, and Germany accounted for the highest proportions of SSH-based attacks during this period.
Country/territory
Q4 2025
Q1 2026
United States
16.10%
23.74%
The Netherlands
15.78%
17.57%
Germany
12.07%
10.34%
Panama
7.72%
6.34%
India
5.32%
6.05%
Romania
4.05%
5.82%
Australia
1.62%
4.61%
Vietnam
4.21%
3.50%
Russian Federation
3.79%
2.35%
Sweden
2.25%
2.09%
China continues to account for the largest proportion of Telnet attacks, though there was a marked increase in activity originating from Pakistan.
Country/territory
Q4 2025
Q1 2026
China
53.64%
39.54%
Pakistan
14.27%
27.31%
Russian Federation
8.20%
8.25%
Indonesia
8.58%
6.71%
India
4.85%
4.66%
Brazil
0.06%
3.30%
Argentina
0.02%
2.51%
Nigeria
1.22%
1.38%
Thailand
0.01%
0.55%
Sweden
0.54%
0.55%
Attacks via web resources
The statistics in this section are based on detection verdicts by Web Anti-Virus, which protects users when suspicious objects are downloaded from malicious or infected web pages. These malicious pages are purposefully created by cybercriminals. Websites that host user-generated content, such as message boards, as well as compromised legitimate sites, can become infected.
TOP 10 countries and territories that served as sources of web-based attacks
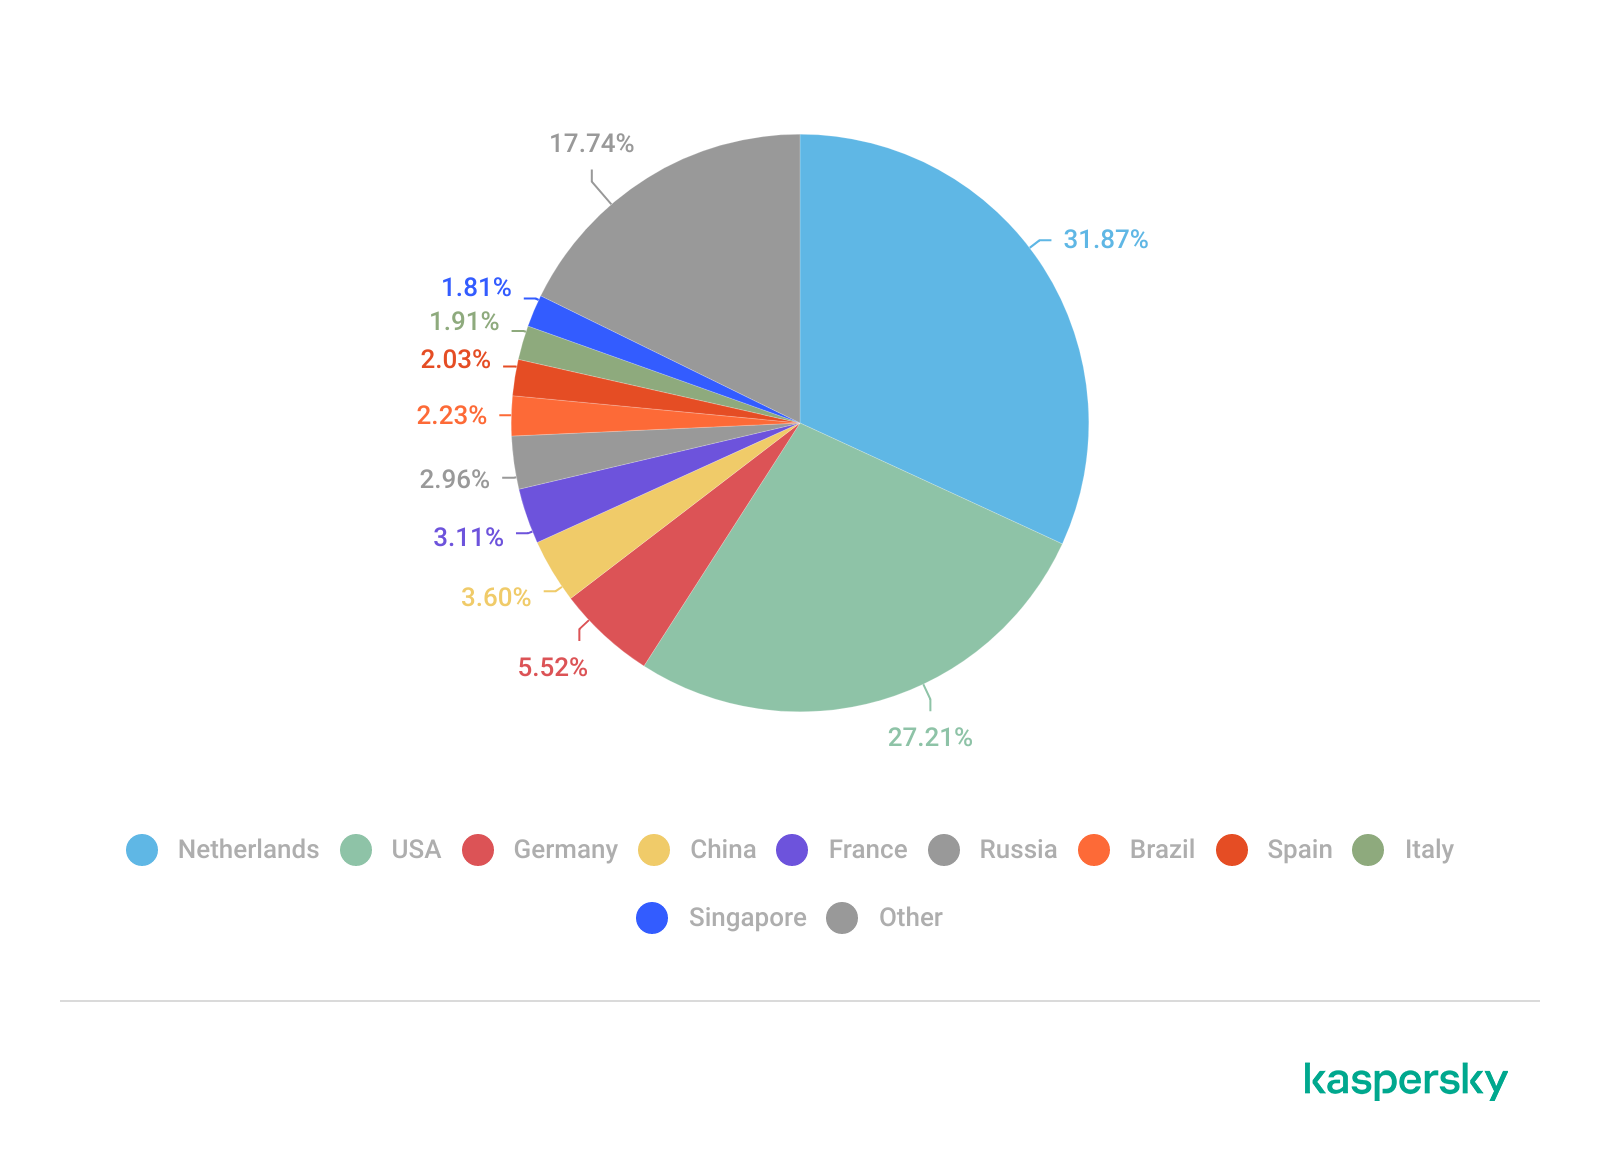
The following statistics show the distribution by country/territory of the sources of internet attacks blocked by Kaspersky products on user computers (web pages redirecting to exploits, sites containing exploits and other malicious programs, botnet C&C centers, and so on). One or more web-based attacks could originate from each unique host.
To determine the geographic source of web attacks, we matched the domain name with the real IP address where the domain is hosted, then identified the geographic location of that IP address (GeoIP).
In Q1 2026, Kaspersky solutions blocked 343,823,407 attacks launched from internet resources worldwide. Web Anti-Virus was triggered by 49,983,611 unique URLs.
Web-based attacks by country/territory, Q1 2026 (download)
Countries and territories where users faced the greatest risk of online infection
To assess the risk of malware infection via the internet for users’ computers in different countries and territories, we calculated the share of Kaspersky users in each location on whose computers Web Anti-Virus was triggered during the reporting period. The resulting data provides an indication of the aggressiveness of the environment in which computers operate in different countries and territories.
This ranked list includes only attacks by malicious objects classified as Malware. Our calculations leave out Web Anti-Virus detections of potentially dangerous or unwanted programs, such as RiskTool or adware.
Country/territory*
%**
1
Venezuela
9.33
2
Hungary
8.16
3
Italy
7.58
4
Tajikistan
7.48
5
India
7.21
6
Greece
7.13
7
Portugal
7.10
8
France
7.05
9
Belgium
6.83
10
Slovakia
6.80
11
Vietnam
6.62
12
Bosnia and Herzegovina
6.57
13
Canada
6.56
14
Serbia
6.50
15
Tunisia
6.36
16
Qatar
6.01
17
Spain
5.95
18
Germany
5.95
19
Sri Lanka
5.89
20
Brazil
5.88
* Excluded are countries and territories with relatively few (under 10,000) Kaspersky users.
** Unique users targeted by web-based Malware attacks as a percentage of all unique users of Kaspersky products in the country/territory.
On average during the quarter, 4.73% of users’ computers worldwide were subjected to at least one Malware web attack.
Local threats
Statistics on local infections of user computers are an important indicator. They include objects that penetrated the target computer by infecting files or removable media, or initially made their way onto the computer in non-open form. Examples of the latter are programs in complex installers and encrypted files.
Data in this section is based on analyzing statistics produced by anti-virus scans of files on the hard drive at the moment they were created or accessed, and the results of scanning removable storage media. The statistics are based on detection verdicts from the On-Access Scan (OAS) and On-Demand Scan (ODS) modules of File Anti-Virus and include detections of malicious programs located on user computers or removable media connected to the computers, such as flash drives, camera memory cards, phones, or external hard drives.
In Q1 2026, our File Anti-Virus detected 15,831,319 malicious and potentially unwanted objects.
Countries and territories where users faced the highest risk of local infection
For each country and territory, we calculated the percentage of Kaspersky users whose computers had the File Anti-Virus triggered at least once during the reporting period. This statistic reflects the level of personal computer infection in different countries and territories around the world.
Note that this ranked list includes only attacks by malicious objects classified as Malware. Our calculations leave out File Anti-Virus detections of potentially dangerous or unwanted programs, such as RiskTool or adware.
Country/territory*
%**
1
Turkmenistan
47.96
2
Tajikistan
31.48
3
Cuba
31.03
4
Yemen
29.59
5
Afghanistan
28.47
6
Burundi
26.93
7
Uzbekistan
24.81
8
Syria
23.08
9
Nicaragua
21.97
10
Cameroon
21.60
11
China
21.09
12
Mozambique
21.02
13
Algeria
20.64
14
Democratic Republic of the Congo
20.63
15
Bangladesh
20.44
16
Mali
20.35
17
Republic of the Congo
20.23
18
Madagascar
20.00
19
Belarus
19.78
20
Tanzania
19.52
* Excluded are countries and territories with relatively few (under 10,000) Kaspersky users.
** Unique users on whose computers local Malware threats were blocked, as a percentage of all unique users of Kaspersky products in the country/territory.
On average worldwide, Malware local threats were detected at least once on 11.55% of users’ computers during Q1.
The statistics in this report are based on detection verdicts returned by Kaspersky products unless otherwise stated. The information was provided by Kaspersky users who consented to sharing statistical data.
Quarterly figures
In Q1 2026:
Kaspersky products blocked more than 343 million attacks that originated with various online resources.
Web Anti-Virus responded to 50 million unique links.
File Anti-Virus blocked nearly 15 million malicious and potentially unwanted objects.
2938 new ransomware variants were detected.
More than 77,000 users experienced ransomware attacks.
14% of all ransomware victims whose data was published on threat actors’ data leak sites (DLS) were victims of Clop.
More than 260,000 users were targeted by miners.
Ransomware
Quarterly trends and highlights
Law enforcement success
In January 2026, it was reported that the FBI had seized the domains of the RAMP cybercrime forum, a major platform used extensively by ransomware developers to advertise their RaaS programs and to recruit affiliates. There has been no official statement from the FBI, nor is it clear if RAMP servers were seized. In a post on an external website, a RAMP moderator mentioned law enforcement agencies gaining control over the forum. The takedown disrupted a key element of the RaaS ecosystem, creating ripple effects for ransomware operators, affiliates, and initial access brokers.
A man suspected of links to the Phobos group was apprehended in Poland. He was charged with the creation, acquisition, and distribution of software designed for unlawfully obtaining information, including data that facilitates unauthorized access to information stored within a computer system.
In March, a Phobos ransomware administrator pleaded guilty to the creation and distribution of the Trojan, which had been used in international attacks dating back to at least November 2020.
In March, the U.S. Department of Justice charged a man who had acted as a negotiator for ransomware groups. The company he worked for specializes in cyberincident investigations. The prosecution alleges the suspect colluded with the BlackCat threat actor to share privileged insights into the ongoing progress of negotiations. Additionally, the suspect is alleged to have had a prior direct role in BlackCat attacks, serving as an affiliate for the RaaS operation.
In a separate development this March, a U.S. court sentenced an initial access broker associated with the Yanluowang ransomware group to 81 months of imprisonment. According to the U.S. Department of Justice, the convict facilitated dozens of ransomware attacks across the United States, resulting in over $9 million in actual loss and more than $24 million in intended loss.
Vulnerabilities and attacks
The Interlock group has been heavily exploiting the CVE-2026-20131 zero-day vulnerability in Cisco Secure FMC firewall management software since at least January 26, 2026. The vulnerability enabled arbitrary Java code execution with root privileges on the affected device. This campaign demonstrates the ongoing reliance on zero-day vulnerabilities for initial access, a focus on network appliances as high-value entry points, and the rapid weaponization of new vulnerabilities within the ransomware ecosystem.
The most prolific groups
This section highlights the most prolific ransomware gangs by number of victims added to each group’s DLS. This quarter, the Clop ransomware (14.42%) returned to the top of the rankings, displacing Qilin (12.34%), which had held the leading position in the previous reporting period. Following closely is a new threat actor, The Gentlemen (9.25%). Emerging no later than July 2025, the group had already surpassed the activity levels of mainstays such as Akira (7.25%) and INC Ransom (6.13%).
Number of each group’s victims according to its DLS as a percentage of all groups’ victims published on all the DLSs under review during the reporting period (download)
Number of new variants
In Q1 2026, Kaspersky solutions detected six new ransomware families and 2938 new modifications. Volumes have returned to Q3 2025 levels following a surge in Q4 2025.
Number of new ransomware modifications, Q1 2025 — Q1 2026 (download)
Number of users attacked by ransomware Trojans
Throughout Q1, our solutions protected 77,319 unique users from ransomware. Ransomware activity was highest in March, with 35,056 unique users encountering such attacks during the month.
Number of unique users attacked by ransomware Trojans, Q1 2026 (download)
Attack geography
TOP 10 countries and territories attacked by ransomware Trojans
Country/territory*
%**
1
Pakistan
0.79
2
South Korea
0.64
3
China
0.52
4
Tajikistan
0.40
5
Libya
0.38
6
Turkmenistan
0.36
7
Iraq
0.35
8
Bangladesh
0.33
9
Rwanda
0.30
10
Cameroon
0.28
* Excluded are countries and territories with relatively few (under 50,000) Kaspersky users.
** Unique users whose computers were attacked by ransomware Trojans as a percentage of all unique users of Kaspersky products in the country/territory.
TOP 10 most common families of ransomware Trojans
Name
Verdict
%*
1
(generic verdict)
Trojan-Ransom.Win32.Gen
33.90
2
(generic verdict)
Trojan-Ransom.Win32.Crypren
6.38
3
WannaCry
Trojan-Ransom.Win32.Wanna
5.87
4
(generic verdict)
Trojan-Ransom.Win32.Encoder
4.68
5
(generic verdict)
Trojan-Ransom.Win32.Agent
3.80
6
LockBit
Trojan-Ransom.Win32.Lockbit
2.80
7
(generic verdict)
Trojan-Ransom.Win32.Phny
1.99
8
(generic verdict)
Trojan-Ransom.MSIL.Agent
1.96
9
(generic verdict)
Trojan-Ransom.Python.Agent
1.93
10
(generic verdict)
Trojan-Ransom.Win32.Crypmod
1.89
* Unique Kaspersky users attacked by the specific ransomware Trojan family as a percentage of all unique users attacked by this type of threat.
Miners
Number of new variants
In Q1 2026, Kaspersky solutions detected 3485 new modifications of miners.
Number of new miner modifications, Q1 2026 (download)
Number of users attacked by miners
In Q1, we detected attacks using miner programs on the computers of 260,588 unique Kaspersky users worldwide.
Number of unique users attacked by miners, Q1 2026 (download)
Attack geography
TOP 10 countries and territories attacked by miners
Country/territory*
%**
1
Senegal
3.19
2
Turkmenistan
3.06
3
Mali
2.63
4
Tanzania
1.62
5
Bangladesh
1.06
6
Ethiopia
0.95
7
Panama
0.88
8
Afghanistan
0.79
9
Kazakhstan
0.77
10
Bolivia
0.75
* Excluded are countries and territories with relatively few (under 50,000) Kaspersky users.
** Unique users whose computers were attacked by miners as a percentage of all unique users of Kaspersky products in the country/territory.
Attacks on macOS
In Q1 2026, Google uncovered a new cryptocurrency theft campaign. The scammers directed victims to a fraudulent video call, prompting them to execute malicious scripts under the guise of technical support fixes for connection problems.
In March, researchers with GTIG and iVerify reported the discovery of an in-the-wild exploit chain targeting both iOS and macOS devices. The exploit kit was apparently marketed on the dark web, providing threat actors with a suite of spyware capabilities alongside specialized cryptocurrency exfiltration modules. The exploit was delivered via drive-by downloads when victims visited various compromised websites. Our analysis confirmed that the toolkit included an updated version of a component previously identified in the Operation Triangulation attack chain.
Devices running macOS were similarly impacted by the high-profile supply chain attack targeting the Axios npm package, a widely used HTTP client for JavaScript. The installation of the infected package led to the deployment of a backdoor on macOS devices.
TOP 20 threats to macOS
Unique users* who encountered this malware as a percentage of all attacked users of Kaspersky security solutions for macOS (download)
* Data for the previous quarter may differ slightly from previously published data due to some verdicts being retrospectively revised.
The share of PasivRobber spyware attacks is beginning to decline, giving way to more traditional adware and Monitor-class software capable of tracking user activity. The popular Amos stealer also maintains its presence within the TOP 20.
Geography of threats to macOS
TOP 10 countries and territories by share of attacked users
Country/territory
%* Q4 2025
%* Q1 2026
China
1.28
1.97
France
1.18
1.07
Brazil
1.13
0.98
Mexico
0.72
0.52
Germany
0.71
0.45
The Netherlands
0.62
0.75
Hong Kong
0.49
0.53
India
0.42
0.48
Russian Federation
0.34
0.37
Thailand
0.24
0.27
* Unique users who encountered threats to macOS as a percentage of all unique Kaspersky users in the country/territory.
IoT threat statistics
This section presents statistics on attacks targeting Kaspersky IoT honeypots. The geographic data on attack sources is based on the IP addresses of attacking devices.
In Q1 2026, the share of devices attacking Kaspersky honeypots via the SSH protocol saw a significant increase compared to the previous reporting period.
Distribution of attacked services by number of unique IP addresses of attacking devices (download)
The distribution of attacks between Telnet and SSH maintained the ratio observed in Q4 2025.
Distribution of attackers’ sessions in Kaspersky honeypots (download)
TOP 10 threats delivered to IoT devices
Share of each threat delivered to an infected device as a result of a successful attack, out of the total number of threats delivered (download)
The primary shifts in the IoT threat distribution are linked to the activity of various Mirai botnet variants, although members of this family continue to account for the majority of the list. Furthermore, a new variant, Mirai.kl, surfaced in the rankings. We also observed a significant decline in NyaDrop botnet activity during Q1.
Attacks on IoT honeypots
The United States, the Netherlands, and Germany accounted for the highest proportions of SSH-based attacks during this period.
Country/territory
Q4 2025
Q1 2026
United States
16.10%
23.74%
The Netherlands
15.78%
17.57%
Germany
12.07%
10.34%
Panama
7.72%
6.34%
India
5.32%
6.05%
Romania
4.05%
5.82%
Australia
1.62%
4.61%
Vietnam
4.21%
3.50%
Russian Federation
3.79%
2.35%
Sweden
2.25%
2.09%
China continues to account for the largest proportion of Telnet attacks, though there was a marked increase in activity originating from Pakistan.
Country/territory
Q4 2025
Q1 2026
China
53.64%
39.54%
Pakistan
14.27%
27.31%
Russian Federation
8.20%
8.25%
Indonesia
8.58%
6.71%
India
4.85%
4.66%
Brazil
0.06%
3.30%
Argentina
0.02%
2.51%
Nigeria
1.22%
1.38%
Thailand
0.01%
0.55%
Sweden
0.54%
0.55%
Attacks via web resources
The statistics in this section are based on detection verdicts by Web Anti-Virus, which protects users when suspicious objects are downloaded from malicious or infected web pages. These malicious pages are purposefully created by cybercriminals. Websites that host user-generated content, such as message boards, as well as compromised legitimate sites, can become infected.
TOP 10 countries and territories that served as sources of web-based attacks
The following statistics show the distribution by country/territory of the sources of internet attacks blocked by Kaspersky products on user computers (web pages redirecting to exploits, sites containing exploits and other malicious programs, botnet C&C centers, and so on). One or more web-based attacks could originate from each unique host.
To determine the geographic source of web attacks, we matched the domain name with the real IP address where the domain is hosted, then identified the geographic location of that IP address (GeoIP).
In Q1 2026, Kaspersky solutions blocked 343,823,407 attacks launched from internet resources worldwide. Web Anti-Virus was triggered by 49,983,611 unique URLs.
Web-based attacks by country/territory, Q1 2026 (download)
Countries and territories where users faced the greatest risk of online infection
To assess the risk of malware infection via the internet for users’ computers in different countries and territories, we calculated the share of Kaspersky users in each location on whose computers Web Anti-Virus was triggered during the reporting period. The resulting data provides an indication of the aggressiveness of the environment in which computers operate in different countries and territories.
This ranked list includes only attacks by malicious objects classified as Malware. Our calculations leave out Web Anti-Virus detections of potentially dangerous or unwanted programs, such as RiskTool or adware.
Country/territory*
%**
1
Venezuela
9.33
2
Hungary
8.16
3
Italy
7.58
4
Tajikistan
7.48
5
India
7.21
6
Greece
7.13
7
Portugal
7.10
8
France
7.05
9
Belgium
6.83
10
Slovakia
6.80
11
Vietnam
6.62
12
Bosnia and Herzegovina
6.57
13
Canada
6.56
14
Serbia
6.50
15
Tunisia
6.36
16
Qatar
6.01
17
Spain
5.95
18
Germany
5.95
19
Sri Lanka
5.89
20
Brazil
5.88
* Excluded are countries and territories with relatively few (under 10,000) Kaspersky users.
** Unique users targeted by web-based Malware attacks as a percentage of all unique users of Kaspersky products in the country/territory.
On average during the quarter, 4.73% of users’ computers worldwide were subjected to at least one Malware web attack.
Local threats
Statistics on local infections of user computers are an important indicator. They include objects that penetrated the target computer by infecting files or removable media, or initially made their way onto the computer in non-open form. Examples of the latter are programs in complex installers and encrypted files.
Data in this section is based on analyzing statistics produced by anti-virus scans of files on the hard drive at the moment they were created or accessed, and the results of scanning removable storage media. The statistics are based on detection verdicts from the On-Access Scan (OAS) and On-Demand Scan (ODS) modules of File Anti-Virus and include detections of malicious programs located on user computers or removable media connected to the computers, such as flash drives, camera memory cards, phones, or external hard drives.
In Q1 2026, our File Anti-Virus detected 15,831,319 malicious and potentially unwanted objects.
Countries and territories where users faced the highest risk of local infection
For each country and territory, we calculated the percentage of Kaspersky users whose computers had the File Anti-Virus triggered at least once during the reporting period. This statistic reflects the level of personal computer infection in different countries and territories around the world.
Note that this ranked list includes only attacks by malicious objects classified as Malware. Our calculations leave out File Anti-Virus detections of potentially dangerous or unwanted programs, such as RiskTool or adware.
Country/territory*
%**
1
Turkmenistan
47.96
2
Tajikistan
31.48
3
Cuba
31.03
4
Yemen
29.59
5
Afghanistan
28.47
6
Burundi
26.93
7
Uzbekistan
24.81
8
Syria
23.08
9
Nicaragua
21.97
10
Cameroon
21.60
11
China
21.09
12
Mozambique
21.02
13
Algeria
20.64
14
Democratic Republic of the Congo
20.63
15
Bangladesh
20.44
16
Mali
20.35
17
Republic of the Congo
20.23
18
Madagascar
20.00
19
Belarus
19.78
20
Tanzania
19.52
* Excluded are countries and territories with relatively few (under 10,000) Kaspersky users.
** Unique users on whose computers local Malware threats were blocked, as a percentage of all unique users of Kaspersky products in the country/territory.
On average worldwide, Malware local threats were detected at least once on 11.55% of users’ computers during Q1.
It’s nasty, but it requires physical access to the computer:
The exploit, named YellowKey, was published earlier this week by a researcher who goes by the alias Nightmare-Eclipse. It reliably bypasses default Windows 11 deployments of BitLocker, the full-volume encryption protection Microsoft provides to make disk contents off-limits to anyone without the decryption key, which is stored in a secured piece of hardware known as a trusted platform module (TPM). BitLocker is a mandatory protection for many organizations, including those that contract with governments.
Slashdot thread. And here’s Nightmare-Eclipse’s GitHub account.
In recent years, many sophisticated intrusions have increasingly avoided using noisy exploits, obvious malware, or custom tooling, instead leveraging systems that organizations already trust within their environments. By operating through legitimate and trusted administrative mechanisms, threat actors could more easily blend seamlessly into routine operations and remain undetected.
Microsoft Incident Response investigated an intrusion that followed this pattern. What initially appeared as routine administrative activity was instead found to be a coordinated campaign abusing trusted operational relationships and authentication processes to establish durable access. The threat actor in this incident leveraged a compromised third-party IT services provider and legitimate IT management tools to conduct a stealthy campaign focusing on long-term access, credential theft, and establishing a persistent foothold.
This blog walks through how the intrusion unfolded, why it was difficult to detect, and how trusted systems, including identity infrastructure, operational tooling, and third-party management relationships were leveraged to sustain access. By examining the investigation end to end, we highlight how modern intrusions succeed without reliance on malware-heavy techniques and what defenders can learn from identifying abuse in environments where trust is implicit. We also provide mitigation and protection recommendations, as well as Microsoft Defender detection and hunting guidance to help identify and investigate related activity.
Abuse of trusted relationships as an attack delivery mechanism
Rather than relying on exploits or malware-based delivery, this attack leveraged an existing trusted operational relationship for malicious activity across the environment. The investigation identified HPE Operations Agent (OA), an approved and signed enterprise management tool commonly used for monitoring and administrative automation, as the primary delivery mechanism. Importantly, this did not involve any vulnerability or flaw in HPE OA itself.
Analysis during the incident response process revealed that management of this operational platform had been delegated to a third-party IT services provider, expanding the trust boundary beyond the organization itself. While such arrangements are operationally common, they introduce implicit trust paths that, if compromised, could be leveraged by threat actors to move within the environment using legitimate access and tooling.
By operating through the HPE OA framework, the threat actor executed scripts and binaries in a manner indistinguishable from normal operations, allowing malicious activity to blend seamlessly into expected behavior and delaying detection.
This technique aligns with MITRE ATT&CK T1199 – Trusted Relationship, in which threat actors exploit established trust relationships to extend access. In this case, the threat actor’s ability to operate entirely through trusted systems allowed them to establish a foothold and execute follow-on actions without relying on exploit-driven techniques.
Attack timeline
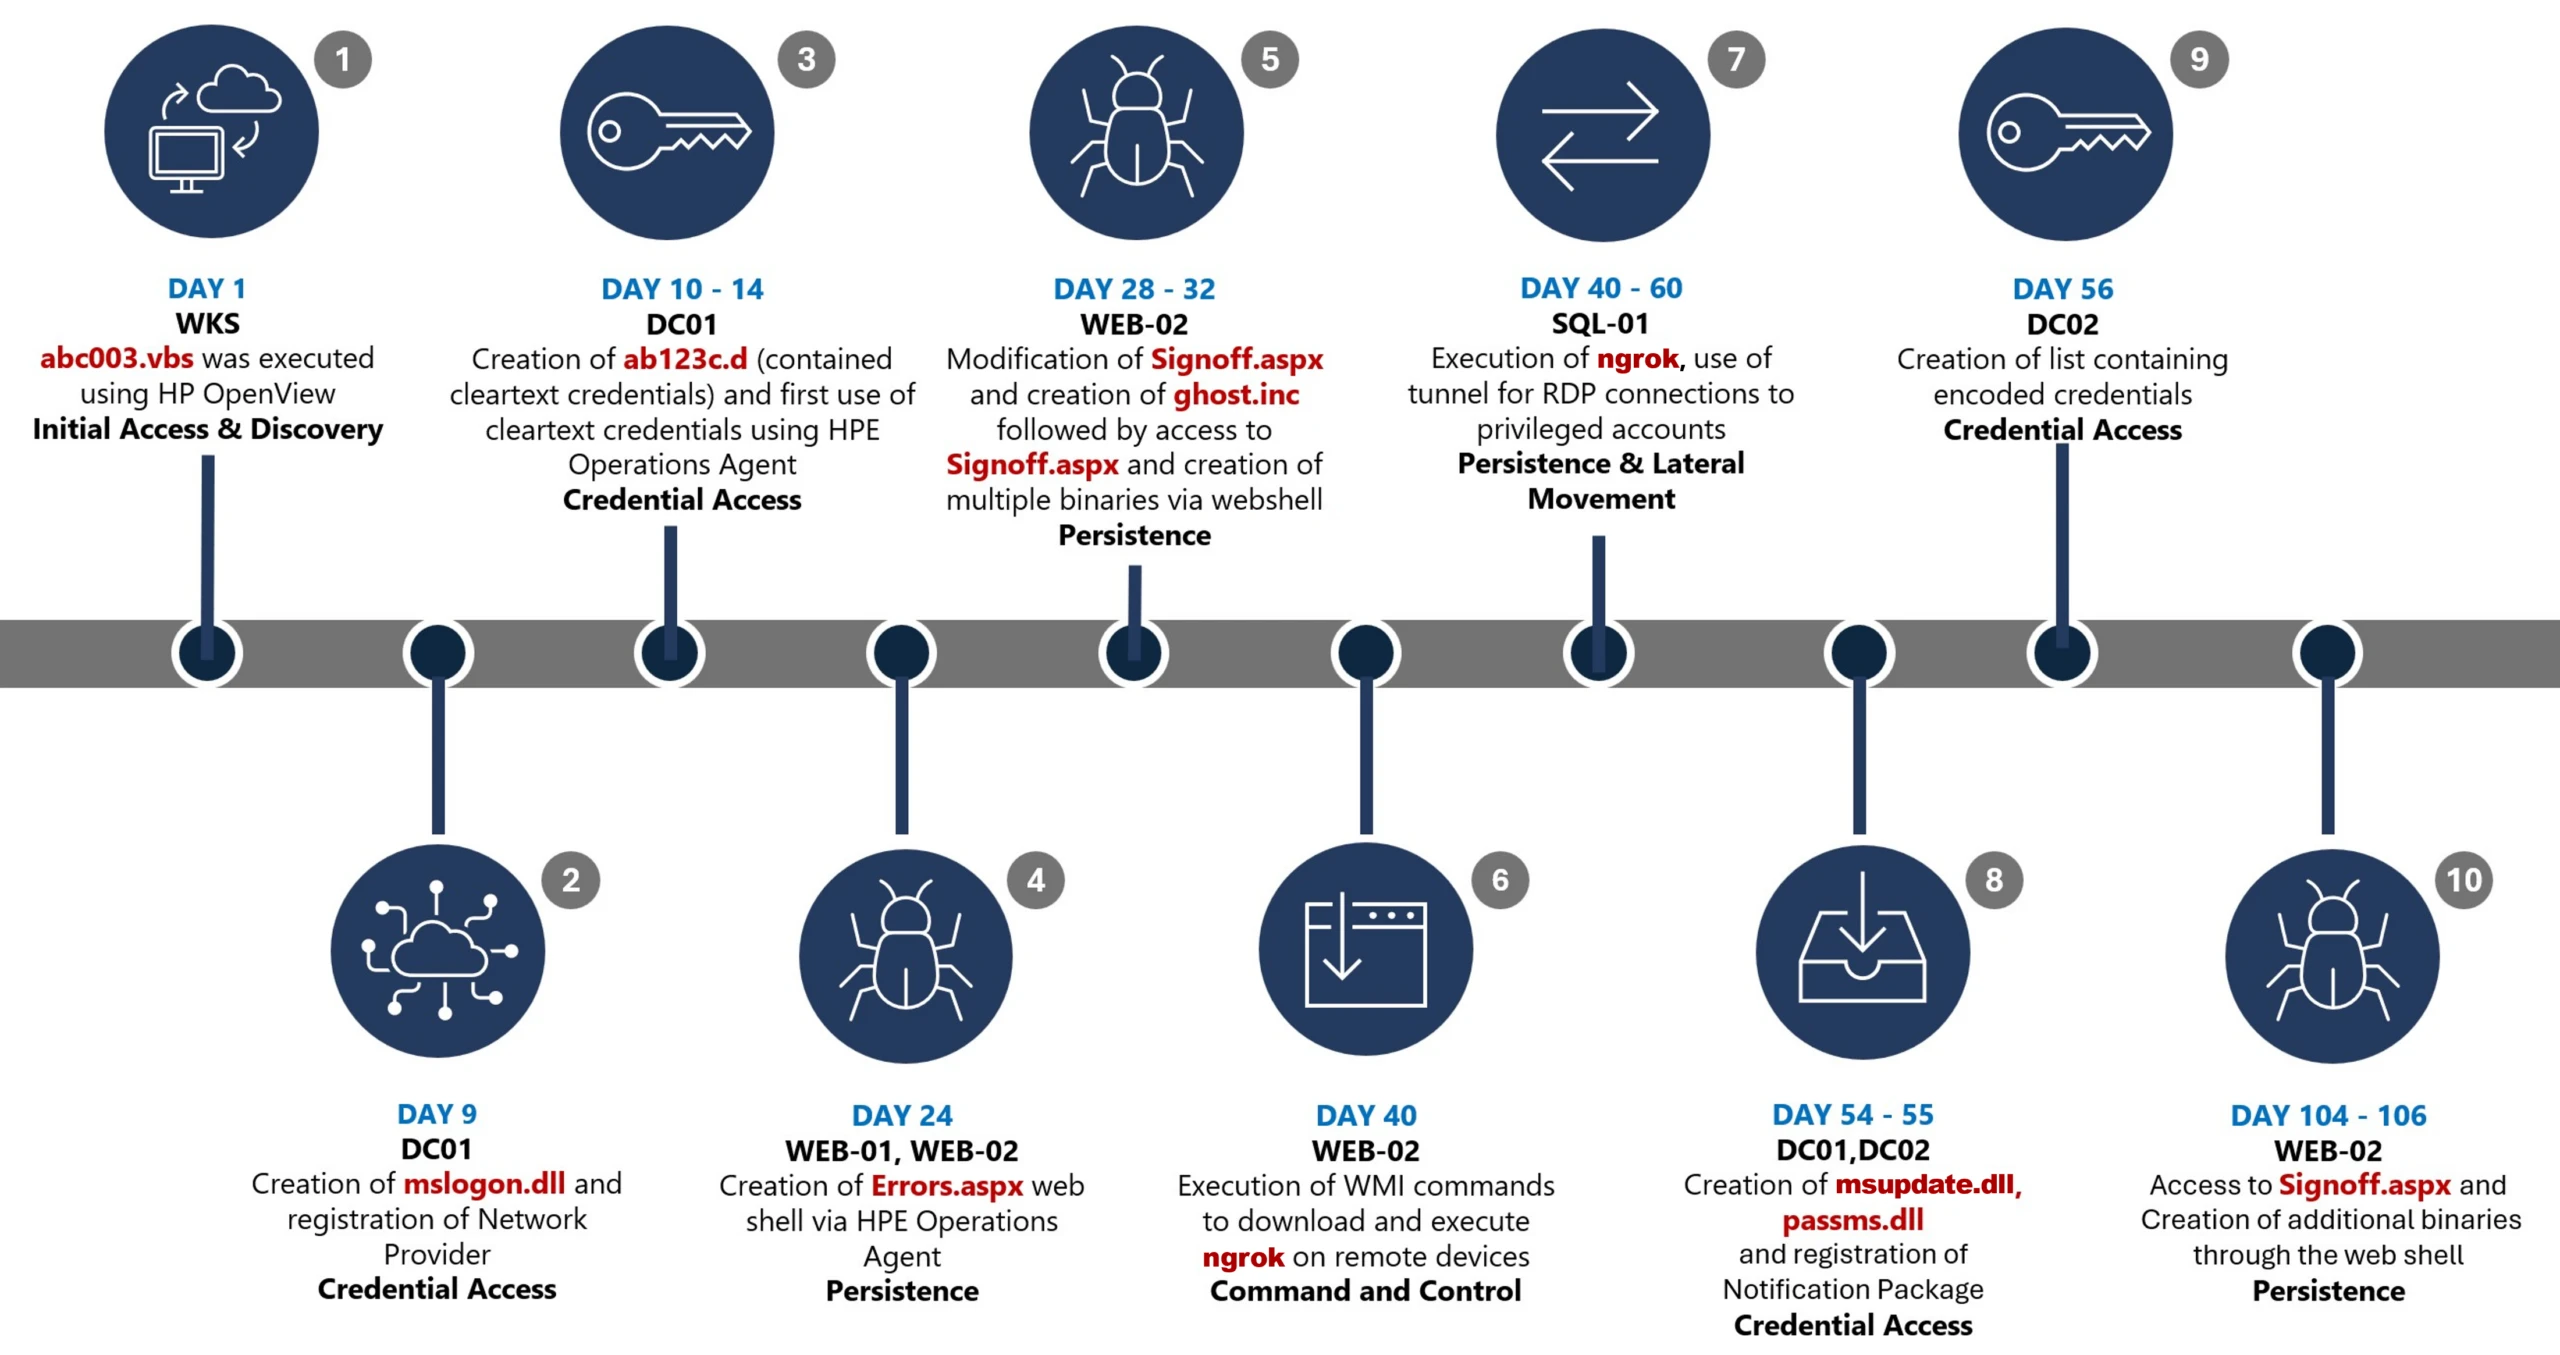
This timeline provides a high-level summary of the intrusion, highlighting key phases of the attack. A detailed analysis of each stage is presented in the sections that follow.
Figure 1. Attack timeline
Day 1: Initial foothold established
The threat actor gained initial access to the environment by compromising a third-party IT services provider and began operating through trusted systems, enabling execution without triggering immediate alerts.
Days 9–14: Credential access achieved
Credential interception capabilities were introduced on domain infrastructure, allowing the threat actor to harvest and reuse credentials to expand access across devices.
Days 24–32: Web-based persistence established
Persistent access was established on internet-facing servers, enabling the threat actor to maintain repeated access even if individual artifacts were removed.
Days 40–60: Lateral movement and remote access
The threat actor leveraged harvested credentials and covert connectivity to move laterally across devices, including highly sensitive assets.
Days 54–55: Additional credential interception deployed
Credential harvesting was further expanded on domain controllers, ensuring continued access during authentication and password change events.
Days 104–106: Persistence reestablished
Following initial detection, the threat actor returned to previously established access points to reenable persistence and deploy additional tooling.
Day 123: Incident response engagement
Microsoft Incident Response was engaged to investigate the intrusion.
Methods, tools, and access strategies
Initial access
During the investigation, two internet-exposed web servers, WEB-01 and WEB-02, were identified as the earliest known compromised assets. A web shell, Errors.aspx, was discovered on both of these devices; however, there was no indication that the servers had been previously exploited, and the mechanism that deployed the web shells couldn’t be determined.
Using intelligence from Microsoft Threat Intelligence regarding a known malicious domain, Microsoft Incident Response was able to identify a workstation communicating with this infrastructure. This led to the discovery of an execution path involving this domain, which revealed another execution path in which VBScripts (abc003.vbs) were deployed through HPE Operations Manager (HPOM).
HPOM and HPE OA form a distributed IT infrastructure monitoring platform. HPOM functions as a centralized management console for monitoring devices’ health, performance, and availability, while HPE OA is deployed on managed hosts to collect telemetry and execute automated, scheduled, or operator-initiated actions across the environment. In this case, the HPOM was operated by a third-party service provider responsible for managing the customer’s infrastructure.
The threat actor, operating HPOM, executed VBScripts on multiple servers, including the web server and a domain controller. The VBScripts had the following functionality:
System network configuration discovery
Active Directory discovery
External IP address discovery through PowerShell
Figure 2. Performed activities using HPOM
Credential access
After gaining initial access, the threat actor shifted focus to credential harvesting. The threat actor registered a legitimate network provider named mslogon on the domain controller DC01 through the same HP OA to hijack the authentication process. Network providers integrate into the Windows authentication mechanism, allowing the threat actor to capture cleartext user credentials during user sign-in and password changes. By delivering the component through a trusted and legitimate management channel, the threat actor was able to blend in with routine administrative activity and remain undetected for an extended period.
Analysis of the deployed network provider dynamic link library (DLL), mslogon.dll, revealed the deliberate abuse of Windows Credential Manager APIs, specifically NPLogonNotify and NPPasswordChangeNotify. These APIs are designed to notify registered providers during authentication events.
Figure 3. NPLogonNotify and NPPasswordChangeNotify APIs
NPLogonNotify is triggered when a user performs an interactive sign in. When triggered, the DLL captures the submitted username and password in cleartext.
NPPasswordChangeNotify is invoked when a user changes their password using secure attention sequence (Ctrl+Alt+Delete). When triggered, the DLL captured both the old and new credential pairs. These passwords are stored in cleartext under C:\Users\Public\Music\abc123c.d. This file enabled the threat actors to reuse both the current valid credentials and historical passwords for lateral movement.
Figure 4. Flow of credentials to the malicious network provider in the sign-in process
Later in the intrusion, on DC01 and DC02, the threat actor registered a malicious password filter, passms.dll, into the Windows authentication process by adding it to the Local Security Authority (LSA) notification packageconfiguration. Password filters are loaded by the Local Security Authority Subsystem Service (LSASS) on domain controllers and are invoked whenever a password is set or changed. This abused a legitimate Windows extensibility mechanism, which helped the threat actor blend in and remain undetected for an extended period; similar tactics were observed earlier in the intrusion.
During a password change operation, LSASS calls the PasswordFilter() API for each DLL listed under the Notification Packages registry value (Figure 5). The function receives the username and password in cleartext as input parameters. By registering a malicious password filter, the threat actor gained visibility into password modification events at the system level, allowing credential capture during normal authentication workflows.
Figure 5. Suspicious notification package passms on DC01 and DC02
When triggered, passms.dll intercepted the credential data and wrote the output toC:\ProgramData\WindowsUpdateService\UpdateDir\Ipd. The captured data was not stored in cleartext. Instead, it was double encoded, first by using Base64, followed by a custom encoding routine embedded within the DLL.
Figure 6. Reverse engineering of the custom encoding logic enabled recovery of the original values
A second module, msupdate.dll, was created on DC01 and DC02 which operated alongside passms.dll. It was invoked using the following command:
Figure 7. Command invoking msupdate.dll
Once invoked, the module read the contents of the Ipd file and transferred the encoded data over Server Message Block (SMB) to remote shares. The data was written into a file named icon02.jpeg, likely intended to blend with legitimate image assets.
In addition to SMB-based staging, msupdate.dll also contained email exfiltration capabilities. The module could send messages with the subject line “Update Service” using a predefined Simple Mail Transfer Protocol (SMTP) server, recipient address, and credentials retrieved from local files.
Execution
Execution was achieved through the abuse of an existing enterprise automation channel, allowing malicious VBScript and PowerShell scripts to run under the context of trusted system processes. By leveraging HPE OA to launch abc003.vbs, the threat actor performed system, network, and Active Directory discovery, while maintaining a low-noise execution profile.
Figure 8. Snippets of the code for abc003.vbs
On internet-facing web servers, execution was achieved through web shells (Errors.aspx and modified Signoff.aspx), which were used to run PowerShell scripts, deploy binaries, and trigger follow-on activity such as credential access and tunnelling tools.
Persistence
Web shells were the primary persistence mechanisms deployed on internet-facing web servers, WEB-01 and WEB-02. An initial web shell, Errors.aspx,allowed the threat actor to write files to disk. This was later used to modify a legitimate application page, Signoff.aspx, to load a secondary web shell, ghost.inc, from the Windows temporary directory. The secondary web shell provided command execution, file upload, and download capabilities, enabling repeated access even if individual artifacts were removed. This persistence relied on modifying existing application files rather than introducing new services, reducing the likelihood of detection.
Figure 9. Web shell creations and usage
The HPE OA was present on both servers and was highly likely used to deploy the web shell. However, because neither server had endpoint detection and response (EDR) coverage, Microsoft Incident Response was unable to confirm this. As a result, the origin and creation mechanism of the web shell, Errors.aspx, on the web server remain unknown.
Persistence was reinforced through the registration of malicious authentication components on domain controllers, DC01 and DC02, ensuring credential interception continued across reboot and credential reset events.
Prior to establishing persistent access, the threat actor first identified internal servers with outbound internet connectivity that could support tunneling. This discovery led to subsequent deployment of ngrok as a persistence mechanism. Instances of ngrok were launched on these internal servers, exposing them through encrypted tunnels to the threat actor’s infrastructure. These tunnels enabled continued inbound access for Remote Desktop Protocol (RDP) sessions without requiring exposed firewall ports, allowing persistence even in environments with restrictive perimeter controls.
Lateral movement
After establishing credential access, execution, and persistence, the threat actor moved laterally using a combination of valid credentials, remote management protocols, and covert network tunnelling using ngrok.
A compromised high-privileged account was used to initiate RDP sessions across the environment, enabling interactive access to critical devices including SQL servers and domain controllers.
To conceal the true source of these connections, the threat actor deployed ngrok, creating encrypted tunnels that exposed internal devices to the internet while bypassing perimeter-based monitoring. Evidence showed RDP connections originating from the ngrok tunnel hosted on SQL-01, masking the threat actor’s real infrastructure and complicating network-based detection.
Lateral movement was further supported by Windows Management Instrumentation (WMI)-based remote execution, which was used to deploy and launch ngrok on additional devices from compromised web servers.
Compromised credentials harvested using password filter DLLs and malicious network provider DLLs on domain controllers enabled continued access and movement without the need for exploit-based techniques.
Figure 10. Lateral movement using RDP
Campaign conclusion
This campaign demonstrated sustained operational maturity, reinforcing a consistent pattern: long-term access, commonly used tools, and campaigns designed to achieve strategic impact.
A recurring lesson from this activity is the abuse of trusted relationships. Third-party service providers and integrated management tools can become enforcement gaps when visibility is limited or validation is assumed. Threat actors understand this. They leverage legitimate components, trusted update paths, and approved integrations to anchor themselves inside environments that appear compliant on the surface.
Defenders should adopt a posture of deliberate verification. Trust your vendors and tooling but validate their behavior within your environment. Organizations operating in sensitive sectors should assume that threat actors with this level of tradecraft will continue refining third party abuse, credential interception, and stealthy persistence mechanisms to maintain strategic access.
Mitigation and protection guidance
Microsoft recommends the following mitigation measures to defend against such stealthy campaigns described in this blog.
Turn on cloud-delivered protection in Microsoft Defender Antivirus or the equivalent for your antivirus product to cover rapidly evolving attacker tools and techniques. Cloud-based machine learning protections block a majority of new and unknown variants.
Deploy endpoint detection and response (EDR) across all endpoints to strengthen visibility, accelerate detection, and improve response to malicious activity.
Adopt a default-deny egress filtering model so servers only allow explicitly approved outbound traffic, reducing opportunities for communication with malicious command-and-control and data exfiltration.
Remove unnecessary software and tools from systems to reduce the attack surface and limit opportunities for attacker abuse.
Enable detailed logging and monitoring on web servers and actively watch for anomalies (such as unexpected file changes or suspicious web requests).
Implement the enterprise access model to contain privilege escalation and enforce stronger access controls across the environment.
Strengthen security operations center (SOC) monitoring and incident response by addressing detection, response, and operational gaps identified during the incident.
Microsoft Defender detection and hunting guidance
Microsoft Defender customers can refer to the list of applicable detections below. Microsoft Defender XDR coordinates detection, prevention, investigation, and response across endpoints, identities, email, apps to provide integrated protection against attacks like the threat discussed in this blog.
Tactic
Observed activity
Microsoft Defender coverage
Command and Control
Decoding the binary data within the events revealed the hostname WKS, indicating it was likely carrying out suspicious activities, a VBScript abc003.vbs was responsible for reaching out to dREDEACTEDe.net, at least in the form of a DNS request
On internet-facing web servers, execution was achieved through web shells (Errors.aspx and modified Signoff.aspx), which were used to run PowerShell scripts, deploy binaries, and trigger follow-on activity such as credential access and tunnelling tools.
Microsoft Defender for Endpoint – ‘WebShell’ malware was detected and was active – An active ‘Webshell’ backdoor process was detected while executing and terminated
Microsoft Security Copilot
Microsoft Security Copilot is embedded in Microsoft Defender and provides security teams with AI-powered capabilities to summarize incidents, analyze files and scripts, summarize identities, use guided responses, and generate device summaries, hunting queries, and incident reports.
Security Copilot is also available as a standalone experience where customers can perform specific security-related tasks, such as incident investigation, user analysis, and vulnerability impact assessment. In addition, Security Copilot offers developer scenarios that allow customers to build, test, publish, and integrate AI agents and plugins to meet unique security needs.
Hunting queries
Microsoft Defender XDR customers can run the following advanced hunting queries to find related activity in their networks:
Password filters DLL
Look for unsigned / unverified DLLs configured as LSA notification packages.
DeviceRegistryEvents
| where RegistryKey has @"control\LSA"  and RegistryValueName has "Notification Packages" // Filter to LSA registry path
| project DeviceName, RegistryKey, RegistryValueName, RegistryValueData
| extend NotificationPackage = split(RegistryValueData, " ")
| mv-expand NotificationPackage
| extend NotificationPackage = tostring(NotificationPackage)
| extend Path = tolower(strcat(@"c:\windows\system32\", NotificationPackage, ".dll")) // Construct full DLL path in lower-case
| join kind=leftouter (
    DeviceFileEvents
    | extend Path = tolower(strcat(FolderPath)
    | project DeviceName, SHA1, Path
) on DeviceName, Path
| invoke FileProfile(SHA1) // Retrieve file signing information
| where SignatureState in~ ("SignedInvalid", "Unsigned") // Filter for files that are unsigned or have invalid signature
| project-away DeviceName1, SHA11
| distinct *
Network provider DLL
Look for custom network provider DLLs that are not signed and configured for Windows sign in.
let NetworkProviders = DeviceRegistryEvents
| where RegistryKey has @'\Control\NetworkProvider\Order' and RegistryValueName has 'ProviderOrder' // Filtering on 'ProviderOrder' entries
| extend Providers = split(RegistryValueData, ',')
| mv-expand Providers
| extend Providers = trim(@' ', tostring(Providers)) // Trim spaces around each provider name
| where Providers !in~ ('RDPNP','LanmanWorkstation') // Excluding default provider names
| distinct Providers; // Collect unique suspicious provider names
DeviceRegistryEvents
| where RegistryKey has_all (@'\Services\', @'\NetworkProvider') // Only registry keys under a service's NetworkProvider
and RegistryKey has_any (NetworkProviders) and
RegistryValueName =~ 'ProviderPath'
| project DeviceName, RegistryKey, RegistryValueName, RegistryValueData
| extend Path = tolower(replace_string(RegistryValueData, '%SystemRoot%', @'C:\Windows')) // Normalize path: replace environment variable and use lower-case
| join kind=leftouter (
    DeviceFileEvents
    | extend Path = tolower(strcat(FolderPath))
    | project DeviceName, SHA1, Path
) on DeviceName, Path
| invoke FileProfile(SHA1,1000)
| where SignatureState in~ ("SignedInvalid", "Unsigned")
| distinct *
To hear stories and insights from the Microsoft Threat Intelligence community about the ever-evolving threat landscape, listen to the Microsoft Threat Intelligence podcast.

 Login
Login