Normal view

Threat landscape for industrial automation systems in Q4 2025

15 April 2026 at 14:30

Statistics across all threats

The percentage of ICS computers on which malicious objects were blocked has been decreasing since the beginning of 2024. In Q4 2025, it was 19.7%. Over the past three years, the percentage has decreased by 1.36 times, and by 1.25 times since Q4 2023.
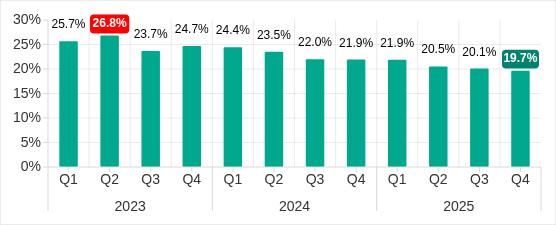
Percentage of ICS computers on which malicious objects were blocked, Q1 2023–Q4 2025

Percentage of ICS computers on which malicious objects were blocked, Q1 2023–Q4 2025

Regionally, in Q4 2025, the percentage of ICS computers on which malicious objects were blocked ranged from 8.5% in Northern Europe to 27.3% in Africa.
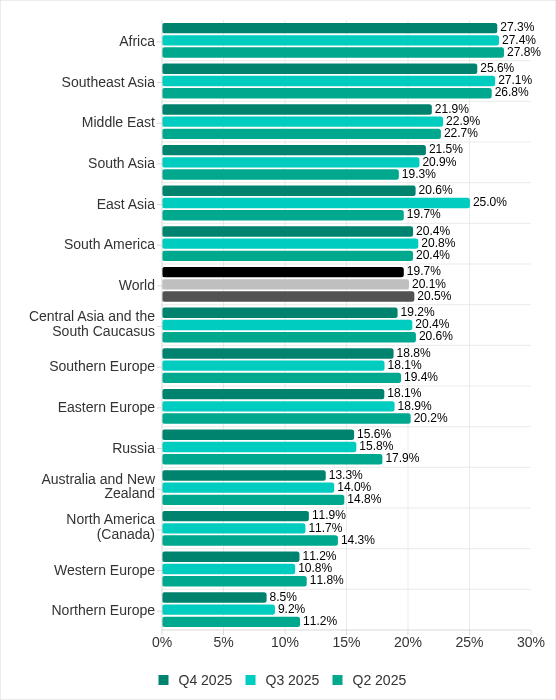
Regions ranked by percentage of ICS computers on which malicious objects were blocked

Regions ranked by percentage of ICS computers on which malicious objects were blocked

Four regions saw an increase in the percentage of ICS computers on which malicious objects were blocked. The most notable increases occurred in Southern Europe and South Asia. In Q3 2025, East Asia experienced a sharp increase triggered by the local spread of malicious scripts, but the figure has since returned to normal.
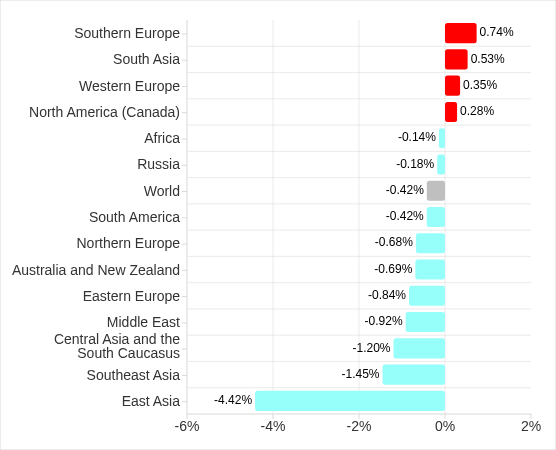
Changes in percentage of ICS computers on which malicious objects were blocked, Q4 2025

Changes in percentage of ICS computers on which malicious objects were blocked, Q4 2025

Feature of the quarter: worms in email

In Q4 2025, the percentage of ICS computers on which wormsinemailattachments were blocked increasedinallregions of the world.

Many of the blocked threats were related to the worm Backdoor.MSIL.XWorm. This malware is designed to persist on the system and then remotely control it.

Interestingly, this threat was not detected on ICS computers in the previous quarter, yet it appeared in all regions in Q4 2025.

A study found that the active spread of Backdoor.MSIL.XWorm via phishing emails was likely linked to the use by hackers of another malware obfuscation technique that was actively used during massive phishing campaigns in Q4 2025. These campaigns have been known since 2024 as “Curriculum-vitae-catalina”.

The attackers distributed phishing emails to HR managers, recruiters, and employees responsible for hiring. The messages were disguised as responses from job applicants with subjects such as “Resume” or “Attached Resume” and contained a malicious executable file under the guise of a curriculum vitae. Typically, the file was named Curriculum Vitae-Catalina.exe. When executed, it infected the system.

In Q4 2025, the threat spread across regions in two waves — one in October and another in November. Russia, Western Europe, South America, and North America (Canada) were attacked in October. A spike in Backdoor.MSIL.XWorm blocking was observed in other regions in November. The attack subsided in all regions in December.

The highest percentage of ICS computers on which Backdoor.MSIL.XWorm was blocked was observed in regions where threats from email clients had been historically blocked at high rates on ICS computers: Southern Europe, South America, and the Middle East.

At the same time, in Africa, where USB storage media are still actively used, the threat was also detected when removable devices were connected to ICS computers.

Selected industries

The biometrics sector has historically led the rankings of industries and OT infrastructures surveyed in this report in terms of the percentage of ICS computers on which malicious objects were blocked.

These systems are characterized by accessibility to and from the internet, as well as minimal cybersecurity controls by the consumer organization.
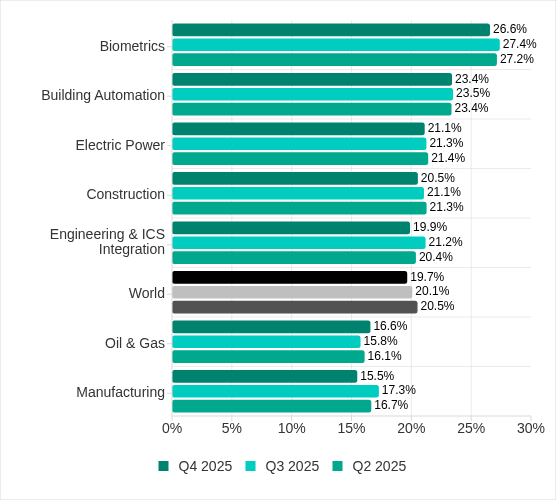
Rankings of industries and OT infrastructure by percentage of ICS computers on which malicious objects were blocked

Rankings of industries and OT infrastructure by percentage of ICS computers on which malicious objects were blocked

In Q4 2025, the percentage of ICS computers on which malicious objects were blocked increased only in one sector: oil and gas. The corresponding figures increased in two regions: Russia, and Central Asia and the South Caucasus.

However, if we look at a broader time span, there is a downward trend in all the surveyed industries.
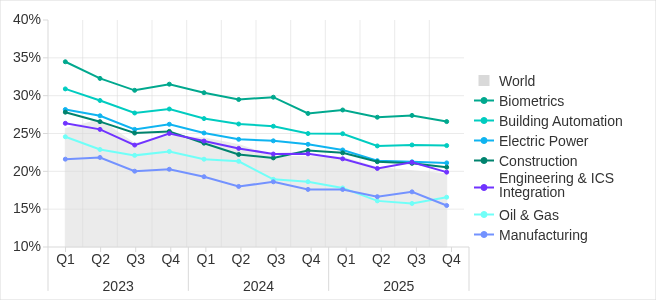
Percentage of ICS computers on which malicious objects were blocked in selected industries

Percentage of ICS computers on which malicious objects were blocked in selected industries

Diversity of detected malicious objects

In Q4 2025, Kaspersky protection solutions blocked malware from 10,142 different malware families of various categories on industrial automation systems.
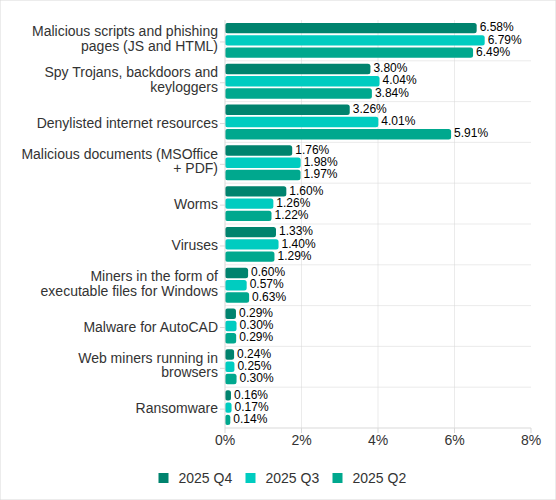
Percentage of ICS computers on which the activity of malicious objects from various categories was blocked

Percentage of ICS computers on which the activity of malicious objects from various categories was blocked

In Q4 2025, there was an increase in the percentage of ICS computers on which worms, and miners in the form of executable files for Windows were blocked. These were the only categories that exhibited an increase.

Main threat sources

Depending on the threat detection and blocking scenario, it is not always possible to reliably identify the source. The circumstantial evidence for a specific source can be the blocked threat’s type (category).

The internet (visiting malicious or compromised internet resources; malicious content distributed via messengers; cloud data storage and processing services and CDNs), email clients (phishing emails), and removable storage devices remain the primary sources of threats to computers in an organization’s technology infrastructure.

In Q4 2025, the percentage of ICS computers on which malicious objects from various sources were blocked decreased. All sources except email clients saw their lowest levels in three years.
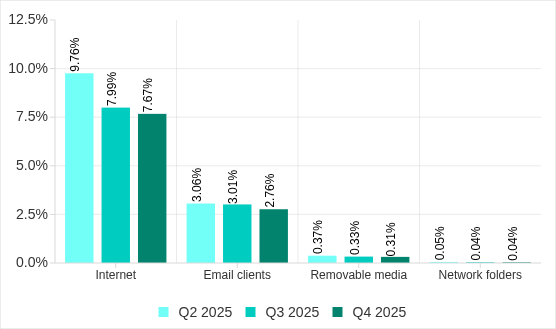
Percentage of ICS computers on which malicious objects from various sources were blocked

Percentage of ICS computers on which malicious objects from various sources were blocked

The same computer can be attacked by several categories of malware from the same source during a quarter. That computer is counted when calculating the percentage of attacked computers for each threat category, but is only counted once for the threat source (we count unique attacked computers). In addition, it is not always possible to accurately determine the initial infection attempt. Therefore, the total percentage of ICS computers on which various categories of threats from a certain source were blocked can exceed the percentage of computers affected by the source itself.

  • In Q4 2025, the percentage of ICS computers on which threats from the internet were blocked decreased to 7.67% and reached its lowest level since the beginning of 2023. The main categories of internet threats are malicious scripts and phishing pages, and denylisted internet resources. The percentage ranged from 3.96% in Northern Europe to 11.33% in South Asia.
  • The main categories of threats from email clients blocked on ICS computers were malicious scripts and phishing pages, spyware, and malicious documents. Most of the spyware detected in phishing emails was delivered as a password archive or a multi-layered script embedded in office document files. The percentage of ICS computers on which threats from email clients were blocked ranged from 0.64% in Northern Europe to 6.34% in Southern Europe.
  • The main categories of threats that were blocked when removable media was connected to ICS computers were worms, viruses, and spyware. The percentage of ICS computers on which threats from removable media were blocked ranged from 0.05% in Australia and New Zealand to 1.41% in Africa.
  • The main categories of threats that spread through network folders in Q4 2025 were viruses, AutoCAD malware, worms, and spyware. The percentage of ICS computers on which threats from network folders were blocked ranged from 0.01% in Northern Europe to 0.18% in East Asia.

Threat categories

Typical attacks blocked within an OT network are multi-step sequences of malicious activities, where each subsequent step of the attackers is aimed at increasing privileges and/or gaining access to other systems by exploiting the security problems of industrial enterprises, including OT infrastructures.

Malicious objects used for initial infection

In Q4 2025, the percentage of ICS computers on which denylisted internet resources were blocked decreased to 3.26%. This is the lowest quarterly figure since the beginning of 2022, and it has decreased by 1.8 times since Q2 2025.
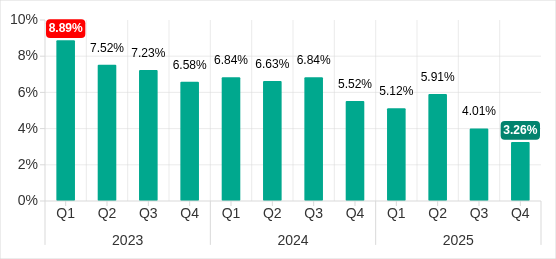
Percentage of ICS computers on which denylisted internet resources were blocked, Q1 2023–Q4 2025

Percentage of ICS computers on which denylisted internet resources were blocked, Q1 2023–Q4 2025

Regionally, the percentage of ICS computers on which denylisted internet resources were blocked ranged from 1.74% in Northern Europe to 3.93% in Southeast Asia, which displaced Africa from first place. Russia rounded out the top three regions for this indicator.

The percentage of ICS computers on which malicious documents were blocked increased for three consecutive quarters. However, in Q4 2025 it decreased by 0.22 pp to 1.76%.
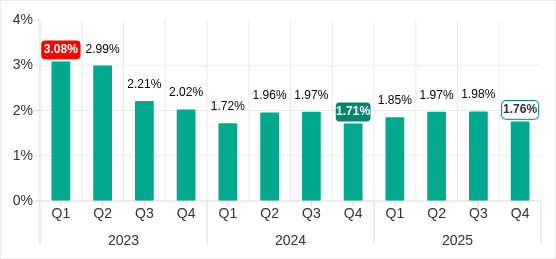
Percentage of ICS computers on which malicious documents were blocked, Q1 2023–Q4 2025

Percentage of ICS computers on which malicious documents were blocked, Q1 2023–Q4 2025

Regionally, the percentage ranged from 0.46% in Northern Europe to 3.82% in Southern Europe. In Q4 2025, the indicator increased in Eastern Europe, Russia, and Western Europe.

The percentage of ICS computers on which malicious scripts and phishing pages were blocked decreased to 6.58%. Despite the decline, this category led the rankings of threat categories in terms of the percentage of ICS computers on which they were blocked.
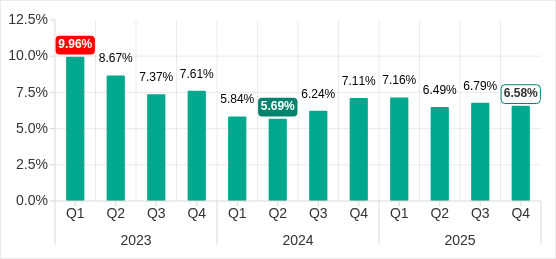
Percentage of ICS computers on which malicious scripts and phishing pages were blocked, Q1 2023–Q4 2025

Percentage of ICS computers on which malicious scripts and phishing pages were blocked, Q1 2023–Q4 2025

Regionally, the percentage ranged from 2.52% in Northern Europe to 10.50% in South Asia. The indicator increased in South Asia, South America, Southern Europe, and Africa. South Asia saw the most notable increase, at 3.47 pp.

Next-stage malware

Malicious objects used to initially infect computers deliver next-stage malware — spyware, ransomware, and miners — to victims’ computers. As a rule, the higher the percentage of ICS computers on which the initial infection malware is blocked, the higher the percentage for next-stage malware.

In Q4 2025, the percentage of ICS computers on which spyware, ransomware and web miners were blocked decreased. The rates were:

  • Spyware: 3.80% (down 0.24 pp). For the second quarter in a row, spyware took second place in the rankings of threat categories in terms of the percentage of ICS computers on which it was blocked.
  • Ransomware: 0.16% (down 0.01 pp).
  • Web miners: 0.24% (down 0.01 pp), this is the lowest level observed thus far in the period under review.

The percentage of ICS computers on which miners in the form of executable files for Windows were blocked increased to 0.60% (up 0.03 pp).

Self-propagating malware

Self-propagating malware (worms and viruses) is a category unto itself. Worms and virus-infected files were originally used for initial infection, but as botnet functionality evolved, they took on next-stage characteristics.

To spread across ICS networks, viruses and worms rely on removable media and network folders and are distributed in the form of infected files, such as archives with backups, office documents, pirated games and hacked applications. In rarer and more dangerous cases, web pages with network equipment settings, as well as files stored in internal document management systems, product lifecycle management (PLM) systems, resource management (ERP) systems and other web services are infected.

In Q4 2025, the percentage of ICS computers on which worms were blocked increased by 1.6 times to 1.60%. As mentioned above, this increase is related to a global phishing attack that spread the Backdoor.MSIL.XWorm backdoor worm across all regions of the world. The percentage increased in all regions. The biggest increase (up by 2.16 times) was in Southern Europe. The malware was primary distributed through email clients, and Southern Europe led the way in terms of the percentage of ICS computers on which threats from email clients were blocked.

The percentage of ICS computers on which viruses were blocked decreased to 1.33%.

AutoCAD malware

This category of malware can spread in a variety of ways, so it does not belong to a specific group.

After an increase in the previous quarter, the percentage of ICS computers on which AutoCAD malware was blocked decreased to 0.29% in Q4 2025.

For more information on industrial threats see the full version of the report.

Threat landscape for industrial automation systems in Q4 2025

15 April 2026 at 14:30

Statistics across all threats

The percentage of ICS computers on which malicious objects were blocked has been decreasing since the beginning of 2024. In Q4 2025, it was 19.7%. Over the past three years, the percentage has decreased by 1.36 times, and by 1.25 times since Q4 2023.

Percentage of ICS computers on which malicious objects were blocked, Q1 2023–Q4 2025

Percentage of ICS computers on which malicious objects were blocked, Q1 2023–Q4 2025

Regionally, in Q4 2025, the percentage of ICS computers on which malicious objects were blocked ranged from 8.5% in Northern Europe to 27.3% in Africa.

Regions ranked by percentage of ICS computers on which malicious objects were blocked

Regions ranked by percentage of ICS computers on which malicious objects were blocked

Four regions saw an increase in the percentage of ICS computers on which malicious objects were blocked. The most notable increases occurred in Southern Europe and South Asia. In Q3 2025, East Asia experienced a sharp increase triggered by the local spread of malicious scripts, but the figure has since returned to normal.

Changes in percentage of ICS computers on which malicious objects were blocked, Q4 2025

Changes in percentage of ICS computers on which malicious objects were blocked, Q4 2025

Feature of the quarter: worms in email

In Q4 2025, the percentage of ICS computers on which wormsinemailattachments were blocked increasedinallregions of the world.

Many of the blocked threats were related to the worm Backdoor.MSIL.XWorm. This malware is designed to persist on the system and then remotely control it.

Interestingly, this threat was not detected on ICS computers in the previous quarter, yet it appeared in all regions in Q4 2025.

A study found that the active spread of Backdoor.MSIL.XWorm via phishing emails was likely linked to the use by hackers of another malware obfuscation technique that was actively used during massive phishing campaigns in Q4 2025. These campaigns have been known since 2024 as “Curriculum-vitae-catalina”.

The attackers distributed phishing emails to HR managers, recruiters, and employees responsible for hiring. The messages were disguised as responses from job applicants with subjects such as “Resume” or “Attached Resume” and contained a malicious executable file under the guise of a curriculum vitae. Typically, the file was named Curriculum Vitae-Catalina.exe. When executed, it infected the system.

In Q4 2025, the threat spread across regions in two waves — one in October and another in November. Russia, Western Europe, South America, and North America (Canada) were attacked in October. A spike in Backdoor.MSIL.XWorm blocking was observed in other regions in November. The attack subsided in all regions in December.

The highest percentage of ICS computers on which Backdoor.MSIL.XWorm was blocked was observed in regions where threats from email clients had been historically blocked at high rates on ICS computers: Southern Europe, South America, and the Middle East.

At the same time, in Africa, where USB storage media are still actively used, the threat was also detected when removable devices were connected to ICS computers.

Selected industries

The biometrics sector has historically led the rankings of industries and OT infrastructures surveyed in this report in terms of the percentage of ICS computers on which malicious objects were blocked.

These systems are characterized by accessibility to and from the internet, as well as minimal cybersecurity controls by the consumer organization.

Rankings of industries and OT infrastructure by percentage of ICS computers on which malicious objects were blocked

Rankings of industries and OT infrastructure by percentage of ICS computers on which malicious objects were blocked

In Q4 2025, the percentage of ICS computers on which malicious objects were blocked increased only in one sector: oil and gas. The corresponding figures increased in two regions: Russia, and Central Asia and the South Caucasus.

However, if we look at a broader time span, there is a downward trend in all the surveyed industries.

Percentage of ICS computers on which malicious objects were blocked in selected industries

Percentage of ICS computers on which malicious objects were blocked in selected industries

Diversity of detected malicious objects

In Q4 2025, Kaspersky protection solutions blocked malware from 10,142 different malware families of various categories on industrial automation systems.

Percentage of ICS computers on which the activity of malicious objects from various categories was blocked

Percentage of ICS computers on which the activity of malicious objects from various categories was blocked

In Q4 2025, there was an increase in the percentage of ICS computers on which worms, and miners in the form of executable files for Windows were blocked. These were the only categories that exhibited an increase.

Main threat sources

Depending on the threat detection and blocking scenario, it is not always possible to reliably identify the source. The circumstantial evidence for a specific source can be the blocked threat’s type (category).

The internet (visiting malicious or compromised internet resources; malicious content distributed via messengers; cloud data storage and processing services and CDNs), email clients (phishing emails), and removable storage devices remain the primary sources of threats to computers in an organization’s technology infrastructure.

In Q4 2025, the percentage of ICS computers on which malicious objects from various sources were blocked decreased. All sources except email clients saw their lowest levels in three years.

Percentage of ICS computers on which malicious objects from various sources were blocked

Percentage of ICS computers on which malicious objects from various sources were blocked

The same computer can be attacked by several categories of malware from the same source during a quarter. That computer is counted when calculating the percentage of attacked computers for each threat category, but is only counted once for the threat source (we count unique attacked computers). In addition, it is not always possible to accurately determine the initial infection attempt. Therefore, the total percentage of ICS computers on which various categories of threats from a certain source were blocked can exceed the percentage of computers affected by the source itself.

  • In Q4 2025, the percentage of ICS computers on which threats from the internet were blocked decreased to 7.67% and reached its lowest level since the beginning of 2023. The main categories of internet threats are malicious scripts and phishing pages, and denylisted internet resources. The percentage ranged from 3.96% in Northern Europe to 11.33% in South Asia.
  • The main categories of threats from email clients blocked on ICS computers were malicious scripts and phishing pages, spyware, and malicious documents. Most of the spyware detected in phishing emails was delivered as a password archive or a multi-layered script embedded in office document files. The percentage of ICS computers on which threats from email clients were blocked ranged from 0.64% in Northern Europe to 6.34% in Southern Europe.
  • The main categories of threats that were blocked when removable media was connected to ICS computers were worms, viruses, and spyware. The percentage of ICS computers on which threats from removable media were blocked ranged from 0.05% in Australia and New Zealand to 1.41% in Africa.
  • The main categories of threats that spread through network folders in Q4 2025 were viruses, AutoCAD malware, worms, and spyware. The percentage of ICS computers on which threats from network folders were blocked ranged from 0.01% in Northern Europe to 0.18% in East Asia.

Threat categories

Typical attacks blocked within an OT network are multi-step sequences of malicious activities, where each subsequent step of the attackers is aimed at increasing privileges and/or gaining access to other systems by exploiting the security problems of industrial enterprises, including OT infrastructures.

Malicious objects used for initial infection

In Q4 2025, the percentage of ICS computers on which denylisted internet resources were blocked decreased to 3.26%. This is the lowest quarterly figure since the beginning of 2022, and it has decreased by 1.8 times since Q2 2025.

Percentage of ICS computers on which denylisted internet resources were blocked, Q1 2023–Q4 2025

Percentage of ICS computers on which denylisted internet resources were blocked, Q1 2023–Q4 2025

Regionally, the percentage of ICS computers on which denylisted internet resources were blocked ranged from 1.74% in Northern Europe to 3.93% in Southeast Asia, which displaced Africa from first place. Russia rounded out the top three regions for this indicator.

The percentage of ICS computers on which malicious documents were blocked increased for three consecutive quarters. However, in Q4 2025 it decreased by 0.22 pp to 1.76%.

Percentage of ICS computers on which malicious documents were blocked, Q1 2023–Q4 2025

Percentage of ICS computers on which malicious documents were blocked, Q1 2023–Q4 2025

Regionally, the percentage ranged from 0.46% in Northern Europe to 3.82% in Southern Europe. In Q4 2025, the indicator increased in Eastern Europe, Russia, and Western Europe.

The percentage of ICS computers on which malicious scripts and phishing pages were blocked decreased to 6.58%. Despite the decline, this category led the rankings of threat categories in terms of the percentage of ICS computers on which they were blocked.

Percentage of ICS computers on which malicious scripts and phishing pages were blocked, Q1 2023–Q4 2025

Percentage of ICS computers on which malicious scripts and phishing pages were blocked, Q1 2023–Q4 2025

Regionally, the percentage ranged from 2.52% in Northern Europe to 10.50% in South Asia. The indicator increased in South Asia, South America, Southern Europe, and Africa. South Asia saw the most notable increase, at 3.47 pp.

Next-stage malware

Malicious objects used to initially infect computers deliver next-stage malware — spyware, ransomware, and miners — to victims’ computers. As a rule, the higher the percentage of ICS computers on which the initial infection malware is blocked, the higher the percentage for next-stage malware.

In Q4 2025, the percentage of ICS computers on which spyware, ransomware and web miners were blocked decreased. The rates were:

  • Spyware: 3.80% (down 0.24 pp). For the second quarter in a row, spyware took second place in the rankings of threat categories in terms of the percentage of ICS computers on which it was blocked.
  • Ransomware: 0.16% (down 0.01 pp).
  • Web miners: 0.24% (down 0.01 pp), this is the lowest level observed thus far in the period under review.

The percentage of ICS computers on which miners in the form of executable files for Windows were blocked increased to 0.60% (up 0.03 pp).

Self-propagating malware

Self-propagating malware (worms and viruses) is a category unto itself. Worms and virus-infected files were originally used for initial infection, but as botnet functionality evolved, they took on next-stage characteristics.

To spread across ICS networks, viruses and worms rely on removable media and network folders and are distributed in the form of infected files, such as archives with backups, office documents, pirated games and hacked applications. In rarer and more dangerous cases, web pages with network equipment settings, as well as files stored in internal document management systems, product lifecycle management (PLM) systems, resource management (ERP) systems and other web services are infected.

In Q4 2025, the percentage of ICS computers on which worms were blocked increased by 1.6 times to 1.60%. As mentioned above, this increase is related to a global phishing attack that spread the Backdoor.MSIL.XWorm backdoor worm across all regions of the world. The percentage increased in all regions. The biggest increase (up by 2.16 times) was in Southern Europe. The malware was primary distributed through email clients, and Southern Europe led the way in terms of the percentage of ICS computers on which threats from email clients were blocked.

The percentage of ICS computers on which viruses were blocked decreased to 1.33%.

AutoCAD malware

This category of malware can spread in a variety of ways, so it does not belong to a specific group.

After an increase in the previous quarter, the percentage of ICS computers on which AutoCAD malware was blocked decreased to 0.29% in Q4 2025.

For more information on industrial threats see the full version of the report.
Mobile malware evolution in 2025

4 March 2026 at 11:00

Starting from the third quarter of 2025, we have updated our statistical methodology based on the Kaspersky Security Network. These changes affect all sections of the report except for the installation package statistics, which remain unchanged.

To illustrate trends between reporting periods, we have recalculated the previous year’s data; consequently, these figures may differ significantly from previously published numbers. All subsequent reports will be generated using this new methodology, ensuring accurate data comparisons with the findings presented in this article.

Kaspersky Security Network (KSN) is a global network for analyzing anonymized threat intelligence, voluntarily shared by Kaspersky users. The statistics in this report are based on KSN data unless explicitly stated otherwise.

The year in figures

According to Kaspersky Security Network, in 2025:

  • Over 14 million attacks involving malware, adware or unwanted mobile software were blocked.
  • Adware remained the most prevalent mobile threat, accounting for 62% of all detections.
  • Over 815 thousand malicious installation packages were detected, including 255 thousand mobile banking Trojans.

The year’s highlights

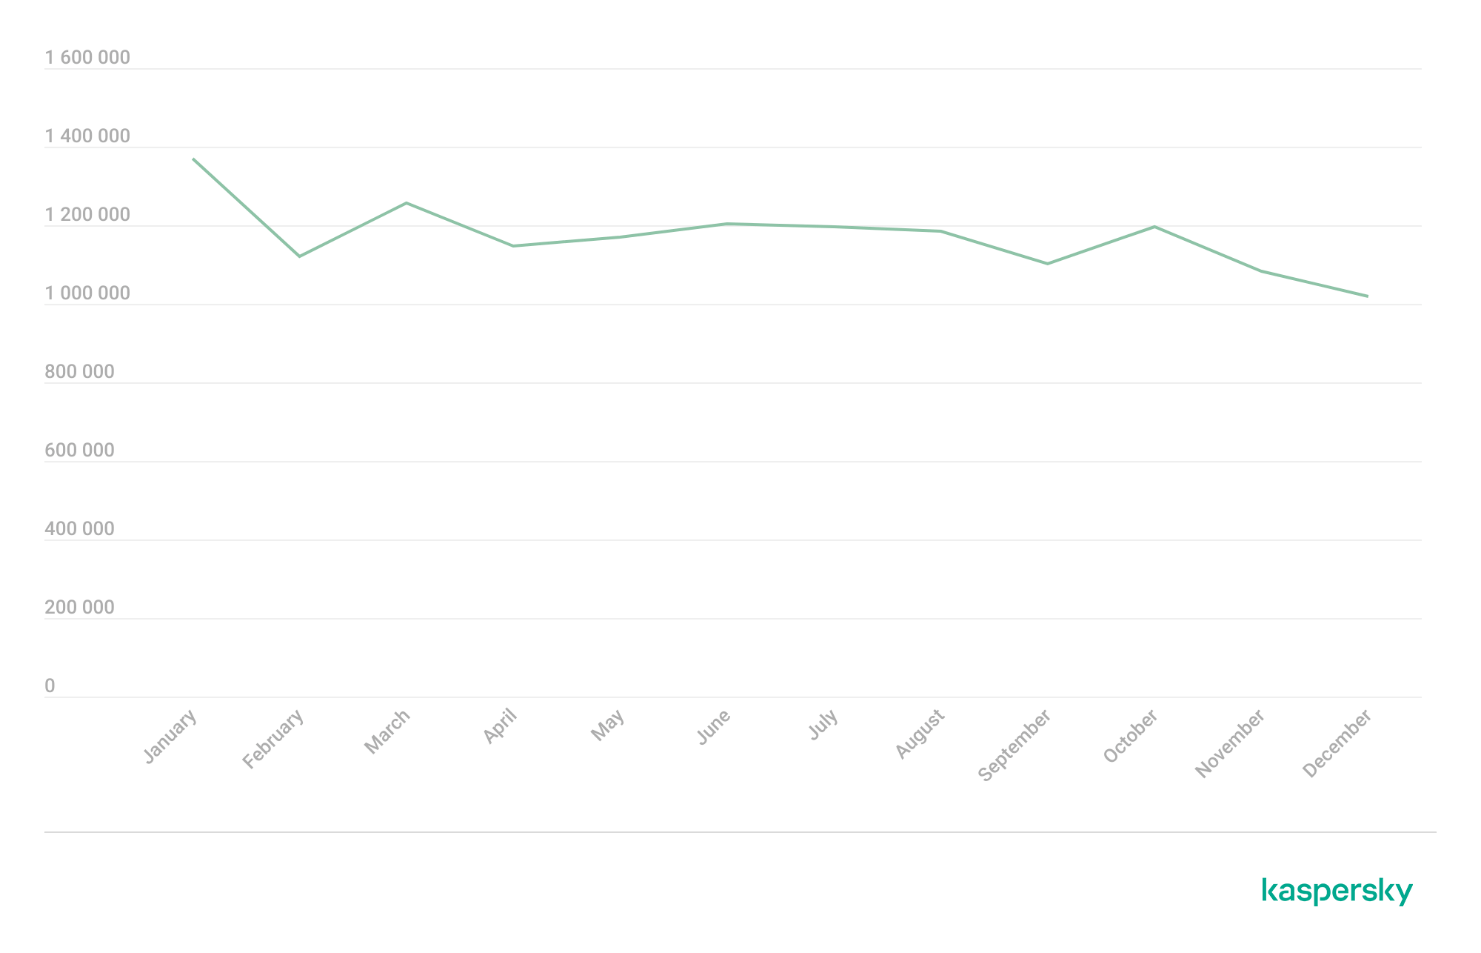
In 2025, cybercriminals launched an average of approximately 1.17 million attacks per month against mobile devices using malicious, advertising, or unwanted software. In total, Kaspersky solutions blocked 14,059,465 attacks throughout the year.

Attacks on Kaspersky mobile users in 2025 (download)

Beyond the malware mentioned in previous quarterly reports, 2025 saw the discovery of several other notable Trojans. Among these, in Q4 we uncovered the Keenadu preinstalled backdoor. This malware is integrated into device firmware during the manufacturing stage. The malicious code is injected into libandroid_runtime.so – a core library for the Android Java runtime environment – allowing a copy of the backdoor to enter the address space of every app running on the device. Depending on the specific app, the malware can then perform actions such as inflating ad views, displaying banners on behalf of other apps, or hijacking search queries. The functionality of Keenadu is virtually unlimited, as its malicious modules are downloaded dynamically and can be updated remotely.

Cybersecurity researchers also identified the Kimwolf IoT botnet, which specifically targets Android TV boxes. Infected devices are capable of launching DDoS attacks, operating as reverse proxies, and executing malicious commands via a reverse shell. Subsequent analysis revealed that Kimwolf’s reverse proxy functionality was being leveraged by proxy providers to use compromised home devices as residential proxies.

Another notable discovery in 2025 was the LunaSpy Trojan.

LunaSpy Trojan, distributed under the guise of an antivirus app

LunaSpy Trojan, distributed under the guise of an antivirus app

Disguised as antivirus software, this spyware exfiltrates browser passwords, messaging app credentials, SMS messages, and call logs. Furthermore, it is capable of recording audio via the device’s microphone and capturing video through the camera. This threat primarily targeted users in Russia.

Mobile threat statistics

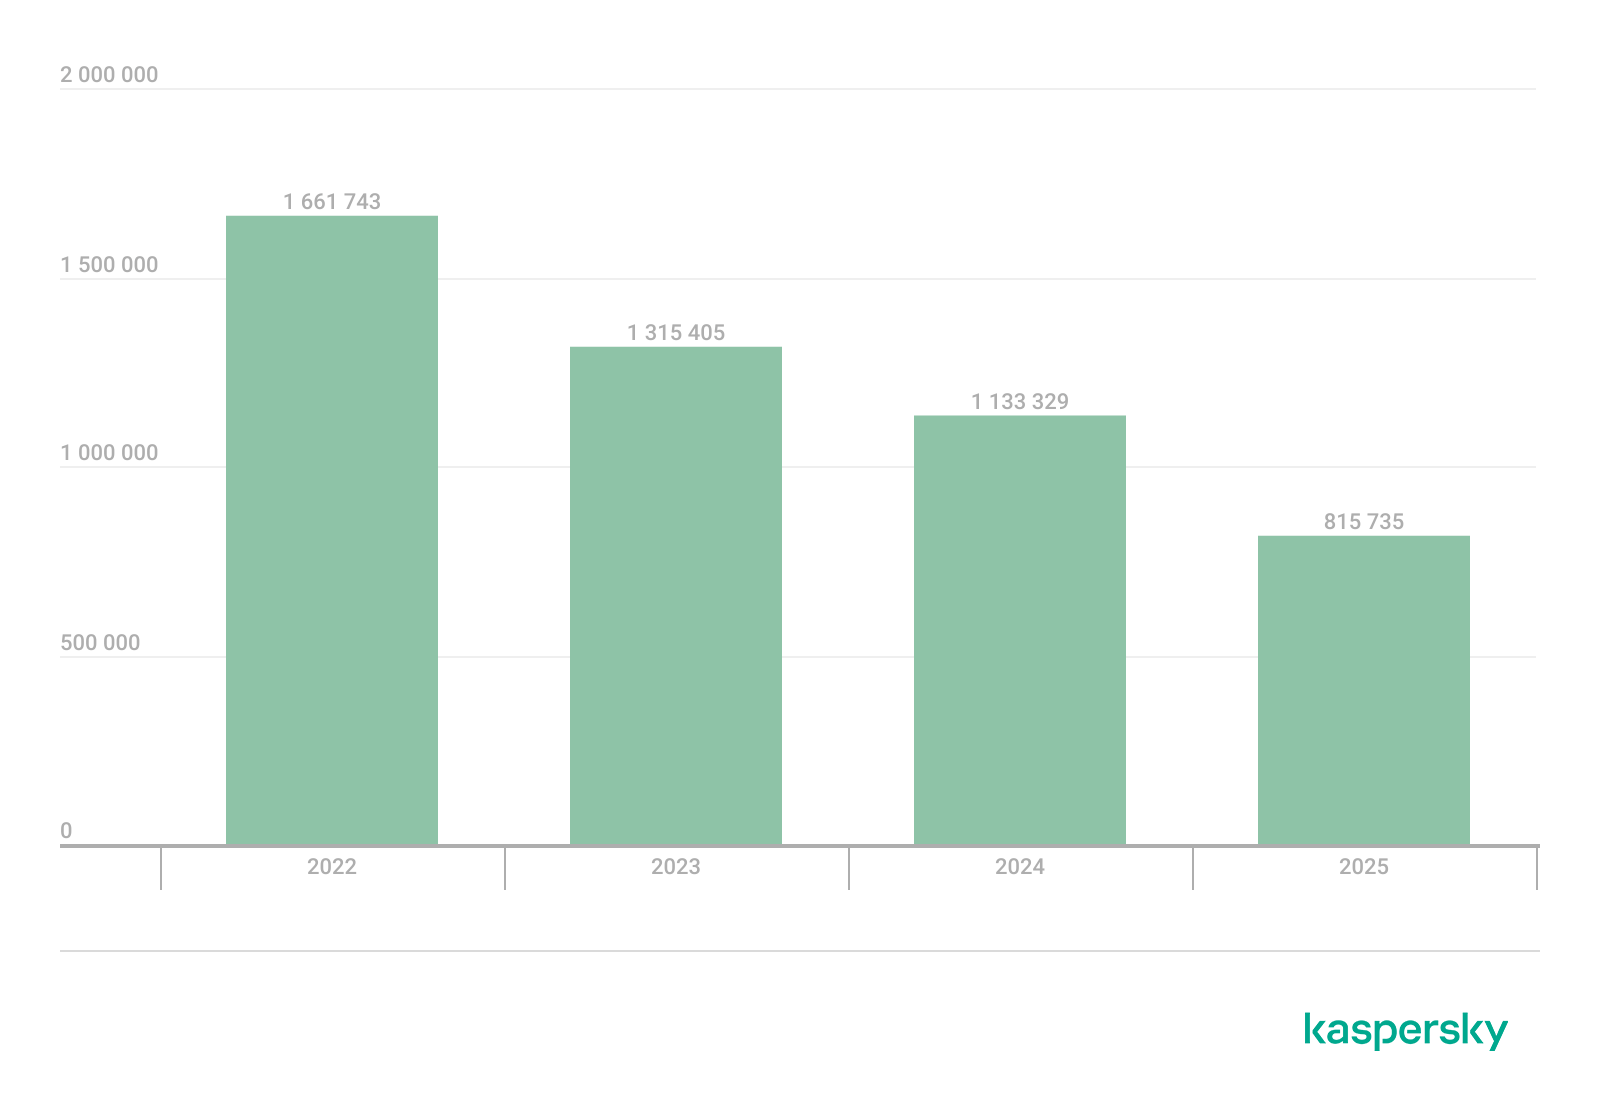
815,735 new unique installation packages were observed in 2025, showing a decrease compared to the previous year. While the decline in 2024 was less pronounced, this past year saw the figure drop by nearly one-third.

Detected Android-specific malware and unwanted software installation packages in 2022–2025 (download)

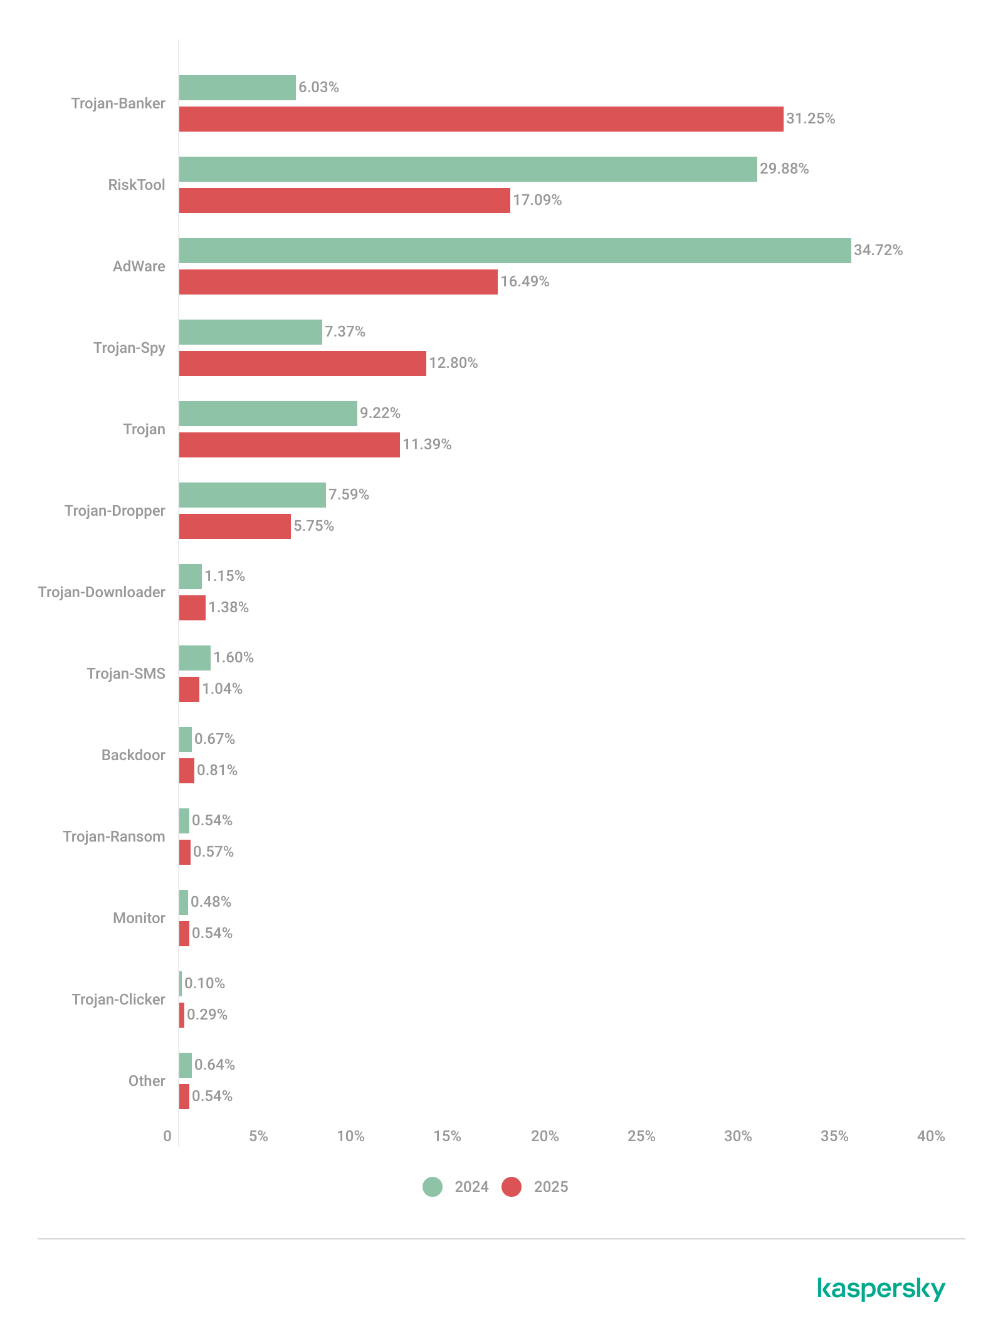
The overall decrease in detected packages is primarily due to a reduction in apps categorized as not-a-virus. Conversely, the number of Trojans has increased significantly, a trend clearly reflected in the distribution data below.

Detected packages by type

Distribution* of detected mobile software by type, 2024–2025 (download)

* The data for the previous year may differ from previously published data due to some verdicts being retrospectively revised.

A significant increase in Trojan-Banker and Trojan-Spy apps was accompanied by a decline in AdWare and RiskTool files. The most prevalent banking Trojans were Mamont (accounting for 49.8% of apps) and Creduz (22.5%). Leading the persistent adware category were MobiDash (39%), Adlo (27%), and HiddenAd (20%).

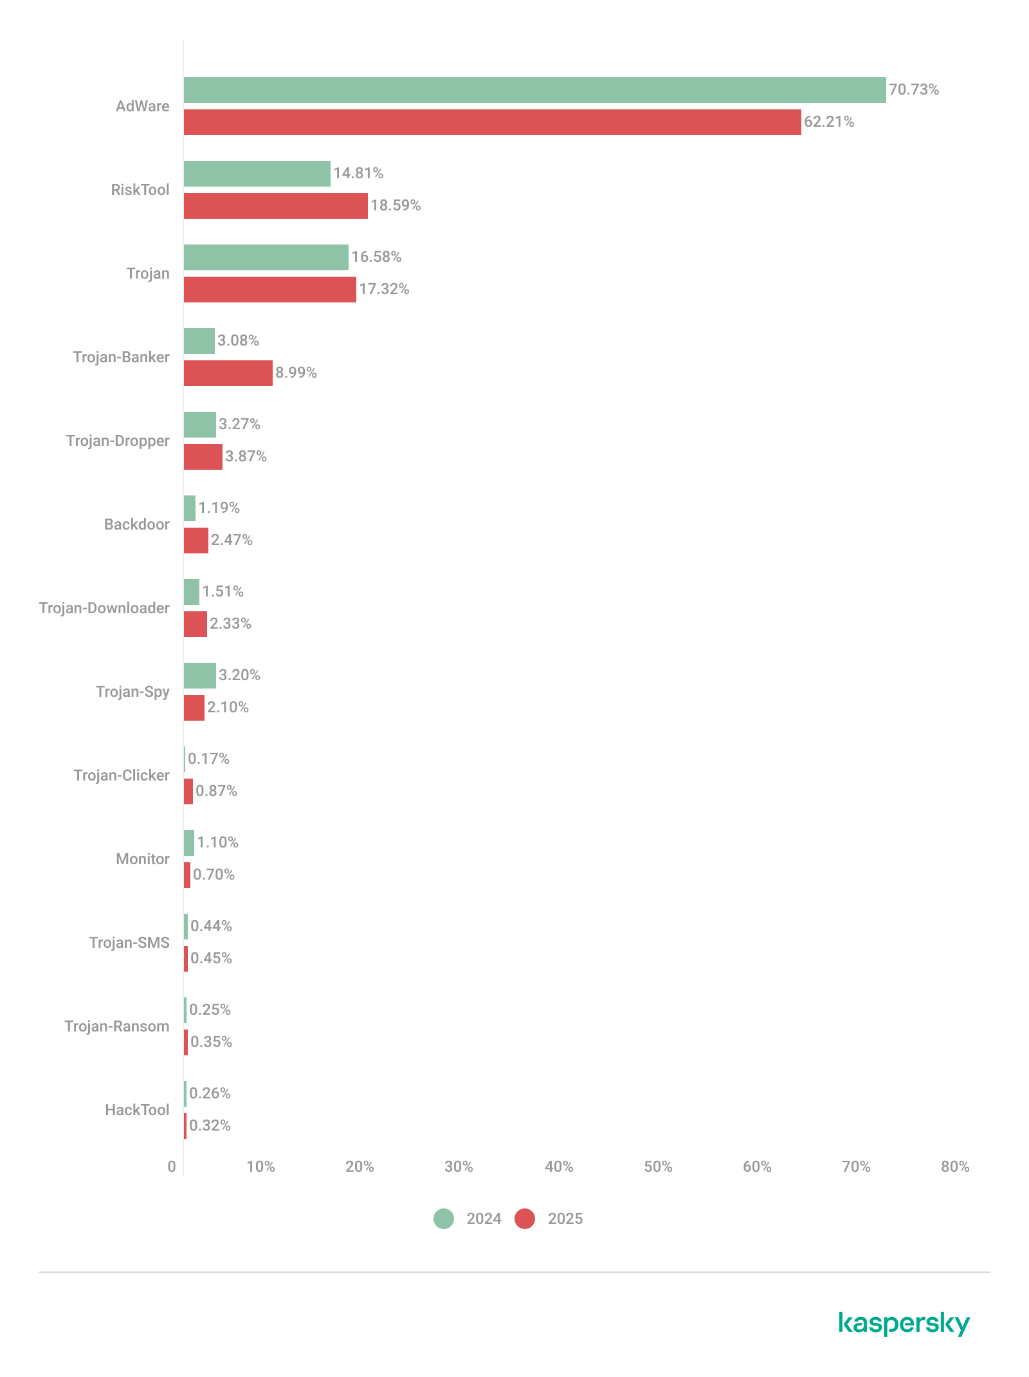
Share* of users attacked by each type of malware or unwanted software out of all users of Kaspersky mobile solutions attacked in 2024–2025 (download)

* The total may exceed 100% if the same users encountered multiple attack types.

Trojan-Banker malware saw a significant surge in 2025, not only in terms of unique file counts but also in the total number of attacks. Nevertheless, this category ranked fourth overall, trailing far behind the Trojan file category, which was dominated by various modifications of Triada and Fakemoney.

TOP 20 types of mobile malware

Note that the malware rankings below exclude riskware and potentially unwanted apps, such as RiskTool and adware.

Verdict % 2024* % 2025* Difference in p.p. Change in ranking
Trojan.AndroidOS.Triada.fe 0.04 9.84 +9.80
Trojan.AndroidOS.Triada.gn 2.94 8.14 +5.21 +6
Trojan.AndroidOS.Fakemoney.v 7.46 7.97 +0.51 +1
DangerousObject.Multi.Generic 7.73 5.83 –1.91 –2
Trojan.AndroidOS.Triada.ii 0.00 5.25 +5.25
Trojan-Banker.AndroidOS.Mamont.da 0.10 4.12 +4.02
Trojan.AndroidOS.Triada.ga 10.56 3.75 –6.81 –6
Trojan-Banker.AndroidOS.Mamont.db 0.01 3.53 +3.51
Backdoor.AndroidOS.Triada.z 0.00 2.79 +2.79
Trojan-Banker.AndroidOS.Coper.c 0.81 2.54 +1.72 +35
Trojan-Clicker.AndroidOS.Agent.bh 0.34 2.48 +2.14 +74
Trojan-Dropper.Linux.Agent.gen 1.82 2.37 +0.55 +4
Trojan.AndroidOS.Boogr.gsh 5.41 2.06 –3.35 –8
DangerousObject.AndroidOS.GenericML 2.42 1.97 –0.45 –3
Trojan.AndroidOS.Triada.gs 3.69 1.93 –1.76 –9
Trojan-Downloader.AndroidOS.Agent.no 0.00 1.87 +1.87
Trojan.AndroidOS.Triada.hf 0.00 1.75 +1.75
Trojan-Banker.AndroidOS.Mamont.bc 1.13 1.65 +0.51 +8
Trojan.AndroidOS.Generic. 2.13 1.47 –0.66 –6
Trojan.AndroidOS.Triada.hy 0.00 1.44 +1.44

* Unique users who encountered this malware as a percentage of all attacked users of Kaspersky mobile solutions.

The list is largely dominated by the Triada family, which is distributed via malicious modifications of popular messaging apps. Another infection vector involves tricking victims into installing an official messaging app within a “customized virtual environment” that supposedly offers enhanced configuration options. Fakemoney scam applications, which promise fraudulent investment opportunities or fake payouts, continue to target users frequently, ranking third in our statistics. Meanwhile, the Mamont banking Trojan variants occupy the 6th, 8th, and 18th positions by number of attacks. The Triada backdoor preinstalled in the firmware of certain devices reached the 9th spot.

Region-specific malware

This section describes malware families whose attack campaigns are concentrated within specific countries.

Verdict Country* %**
Trojan-Banker.AndroidOS.Coper.a Türkiye 95.74
Trojan-Dropper.AndroidOS.Hqwar.bj Türkiye 94.96
Trojan.AndroidOS.Thamera.bb India 94.71
Trojan-Proxy.AndroidOS.Agent.q Germany 93.70
Trojan-Banker.AndroidOS.Coper.c Türkiye 93.42
Trojan-Banker.AndroidOS.Rewardsteal.lv India 92.44
Trojan-Banker.AndroidOS.Rewardsteal.jp India 92.31
Trojan-Banker.AndroidOS.Rewardsteal.ib India 91.91
Trojan-Dropper.AndroidOS.Rewardsteal.h India 91.45
Trojan-Banker.AndroidOS.Rewardsteal.nk India 90.98
Trojan-Dropper.AndroidOS.Agent.sm Türkiye 90.34
Trojan-Dropper.AndroidOS.Rewardsteal.ac India 89.38
Trojan-Banker.AndroidOS.Rewardsteal.oa India 89.18
Trojan-Banker.AndroidOS.Rewardsteal.ma India 88.58
Trojan-Spy.AndroidOS.SmForw.ko India 88.48
Trojan-Dropper.AndroidOS.Pylcasa.c Brazil 88.25
Trojan-Dropper.AndroidOS.Hqwar.bf Türkiye 88.15
Trojan-Banker.AndroidOS.Agent.pp India 87.85

* Country where the malware was most active.
** Unique users who encountered the malware in the indicated country as a percentage of all users of Kaspersky mobile solutions who were attacked by the same malware.

Türkiye saw the highest concentration of attacks from Coper banking Trojans and their associated Hqwar droppers. In India, Rewardsteal Trojans continued to proliferate, exfiltrating victims’ payment data under the guise of monetary giveaways. Additionally, India saw a resurgence of the Thamera Trojan, which we previously observed frequently attacking users in 2023. This malware hijacks the victim’s device to illicitly register social media accounts.

The Trojan-Proxy.AndroidOS.Agent.q campaign, concentrated in Germany, utilized a compromised third-party application designed for tracking discounts at a major German retail chain. Attackers monetized these infections through unauthorized use of the victims’ devices as residential proxies.

In Brazil, 2025 saw a concentration of Pylcasa Trojan attacks. This malware is primarily used to redirect users to phishing pages or illicit online casino sites.

Mobile banking Trojans

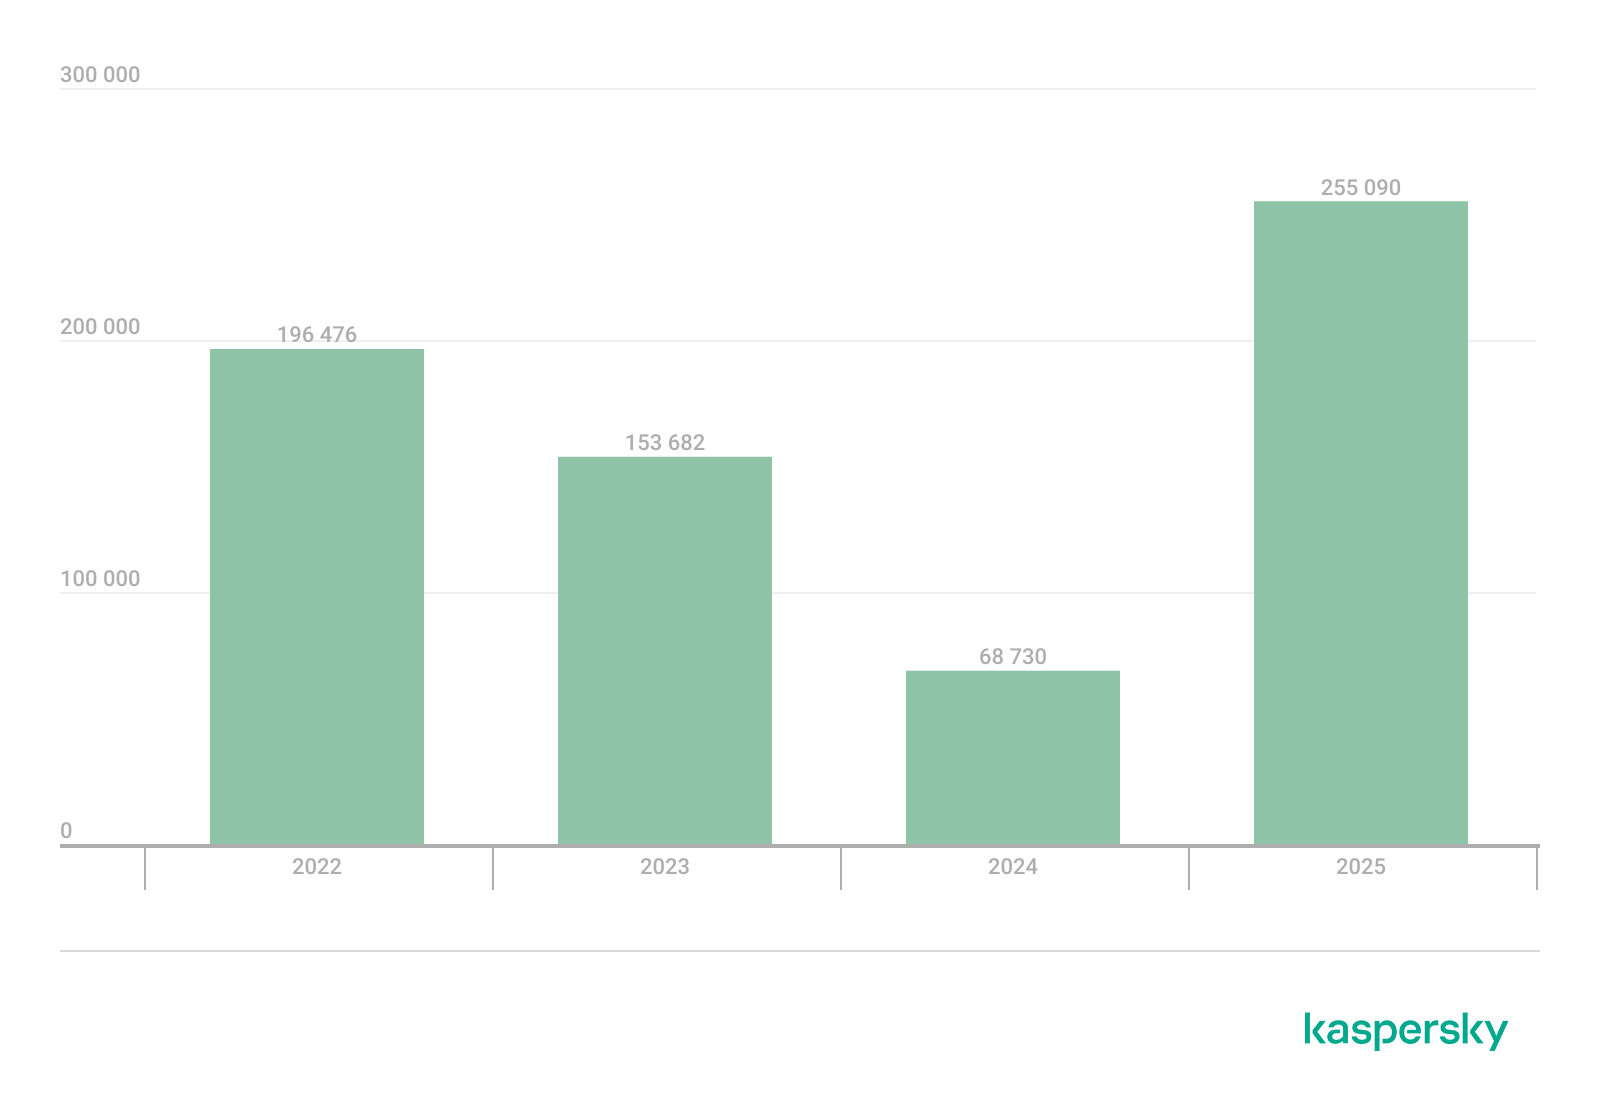
The number of new banking Trojan installation packages surged to 255,090, representing a several-fold increase over previous years.

Mobile banking Trojan installation packages detected by Kaspersky in 2022–2025 (download)

Notably, the total number of attacks involving bankers grew by 1.5 times, maintaining the same growth rate seen in the previous year. Given the sharp spike in the number of unique malicious packages, we can conclude that these attacks yield significant profit for cybercriminals. This is further evidenced by the fact that threat actors continue to diversify their delivery channels and accelerate the production of new variants in an effort to evade detection by security solutions.

TOP 10 mobile bankers

Verdict % 2024* % 2025* Difference in p.p. Change in ranking
Trojan-Banker.AndroidOS.Mamont.da 0.86 15.65 +14.79 +28
Trojan-Banker.AndroidOS.Mamont.db 0.12 13.41 +13.29
Trojan-Banker.AndroidOS.Coper.c 7.19 9.65 +2.46 +2
Trojan-Banker.AndroidOS.Mamont.bc 10.03 6.26 –3.77 –3
Trojan-Banker.AndroidOS.Mamont.ev 0.00 4.10 +4.10
Trojan-Banker.AndroidOS.Coper.a 9.04 4.00 –5.04 –4
Trojan-Banker.AndroidOS.Mamont.ek 0.00 3.73 +3.73
Trojan-Banker.AndroidOS.Mamont.cb 0.64 3.04 +2.40 +26
Trojan-Banker.AndroidOS.Faketoken.pac 2.17 2.95 +0.77 +5
Trojan-Banker.AndroidOS.Mamont.hi 0.00 2.75 +2.75

* Unique users who encountered this malware as a percentage of all users of Kaspersky mobile solutions who encountered banking threats.

In 2025, we observed a massive surge in activity from Mamont banking Trojans. They accounted for approximately half of all new apps in their category and also were utilized in half of all banking Trojan attacks.

Conclusion

The year 2025 saw a continuing trend toward a decline in total unique unwanted software installation packages. However, we noted a significant year-over-year increase in specific threats – most notably mobile banking Trojans and spyware – even though adware remained the most frequently detected threat overall.

Among the mobile threats detected, we have seen an increased prevalence of preinstalled backdoors, such as Triada and Keenadu. Consistent with last year’s findings, certain mobile malware families continue to proliferate via official app stores. Finally, we have observed a growing interest among threat actors in leveraging compromised devices as proxies.

Mobile malware evolution in 2025

4 March 2026 at 11:00

Starting from the third quarter of 2025, we have updated our statistical methodology based on the Kaspersky Security Network. These changes affect all sections of the report except for the installation package statistics, which remain unchanged.

To illustrate trends between reporting periods, we have recalculated the previous year’s data; consequently, these figures may differ significantly from previously published numbers. All subsequent reports will be generated using this new methodology, ensuring accurate data comparisons with the findings presented in this article.

Kaspersky Security Network (KSN) is a global network for analyzing anonymized threat intelligence, voluntarily shared by Kaspersky users. The statistics in this report are based on KSN data unless explicitly stated otherwise.

The year in figures

According to Kaspersky Security Network, in 2025:

  • Over 14 million attacks involving malware, adware or unwanted mobile software were blocked.
  • Adware remained the most prevalent mobile threat, accounting for 62% of all detections.
  • Over 815 thousand malicious installation packages were detected, including 255 thousand mobile banking Trojans.

The year’s highlights

In 2025, cybercriminals launched an average of approximately 1.17 million attacks per month against mobile devices using malicious, advertising, or unwanted software. In total, Kaspersky solutions blocked 14,059,465 attacks throughout the year.

Attacks on Kaspersky mobile users in 2025 (download)

Beyond the malware mentioned in previous quarterly reports, 2025 saw the discovery of several other notable Trojans. Among these, in Q4 we uncovered the Keenadu preinstalled backdoor. This malware is integrated into device firmware during the manufacturing stage. The malicious code is injected into libandroid_runtime.so – a core library for the Android Java runtime environment – allowing a copy of the backdoor to enter the address space of every app running on the device. Depending on the specific app, the malware can then perform actions such as inflating ad views, displaying banners on behalf of other apps, or hijacking search queries. The functionality of Keenadu is virtually unlimited, as its malicious modules are downloaded dynamically and can be updated remotely.

Cybersecurity researchers also identified the Kimwolf IoT botnet, which specifically targets Android TV boxes. Infected devices are capable of launching DDoS attacks, operating as reverse proxies, and executing malicious commands via a reverse shell. Subsequent analysis revealed that Kimwolf’s reverse proxy functionality was being leveraged by proxy providers to use compromised home devices as residential proxies.

Another notable discovery in 2025 was the LunaSpy Trojan.

LunaSpy Trojan, distributed under the guise of an antivirus app

LunaSpy Trojan, distributed under the guise of an antivirus app

Disguised as antivirus software, this spyware exfiltrates browser passwords, messaging app credentials, SMS messages, and call logs. Furthermore, it is capable of recording audio via the device’s microphone and capturing video through the camera. This threat primarily targeted users in Russia.

Mobile threat statistics

815,735 new unique installation packages were observed in 2025, showing a decrease compared to the previous year. While the decline in 2024 was less pronounced, this past year saw the figure drop by nearly one-third.

Detected Android-specific malware and unwanted software installation packages in 2022–2025 (download)

The overall decrease in detected packages is primarily due to a reduction in apps categorized as not-a-virus. Conversely, the number of Trojans has increased significantly, a trend clearly reflected in the distribution data below.

Detected packages by type

Distribution* of detected mobile software by type, 2024–2025 (download)

* The data for the previous year may differ from previously published data due to some verdicts being retrospectively revised.

A significant increase in Trojan-Banker and Trojan-Spy apps was accompanied by a decline in AdWare and RiskTool files. The most prevalent banking Trojans were Mamont (accounting for 49.8% of apps) and Creduz (22.5%). Leading the persistent adware category were MobiDash (39%), Adlo (27%), and HiddenAd (20%).

Share* of users attacked by each type of malware or unwanted software out of all users of Kaspersky mobile solutions attacked in 2024–2025 (download)

* The total may exceed 100% if the same users encountered multiple attack types.

Trojan-Banker malware saw a significant surge in 2025, not only in terms of unique file counts but also in the total number of attacks. Nevertheless, this category ranked fourth overall, trailing far behind the Trojan file category, which was dominated by various modifications of Triada and Fakemoney.

TOP 20 types of mobile malware

Note that the malware rankings below exclude riskware and potentially unwanted apps, such as RiskTool and adware.

Verdict % 2024* % 2025* Difference in p.p. Change in ranking
Trojan.AndroidOS.Triada.fe 0.04 9.84 +9.80
Trojan.AndroidOS.Triada.gn 2.94 8.14 +5.21 +6
Trojan.AndroidOS.Fakemoney.v 7.46 7.97 +0.51 +1
DangerousObject.Multi.Generic 7.73 5.83 –1.91 –2
Trojan.AndroidOS.Triada.ii 0.00 5.25 +5.25
Trojan-Banker.AndroidOS.Mamont.da 0.10 4.12 +4.02
Trojan.AndroidOS.Triada.ga 10.56 3.75 –6.81 –6
Trojan-Banker.AndroidOS.Mamont.db 0.01 3.53 +3.51
Backdoor.AndroidOS.Triada.z 0.00 2.79 +2.79
Trojan-Banker.AndroidOS.Coper.c 0.81 2.54 +1.72 +35
Trojan-Clicker.AndroidOS.Agent.bh 0.34 2.48 +2.14 +74
Trojan-Dropper.Linux.Agent.gen 1.82 2.37 +0.55 +4
Trojan.AndroidOS.Boogr.gsh 5.41 2.06 –3.35 –8
DangerousObject.AndroidOS.GenericML 2.42 1.97 –0.45 –3
Trojan.AndroidOS.Triada.gs 3.69 1.93 –1.76 –9
Trojan-Downloader.AndroidOS.Agent.no 0.00 1.87 +1.87
Trojan.AndroidOS.Triada.hf 0.00 1.75 +1.75
Trojan-Banker.AndroidOS.Mamont.bc 1.13 1.65 +0.51 +8
Trojan.AndroidOS.Generic. 2.13 1.47 –0.66 –6
Trojan.AndroidOS.Triada.hy 0.00 1.44 +1.44

* Unique users who encountered this malware as a percentage of all attacked users of Kaspersky mobile solutions.

The list is largely dominated by the Triada family, which is distributed via malicious modifications of popular messaging apps. Another infection vector involves tricking victims into installing an official messaging app within a “customized virtual environment” that supposedly offers enhanced configuration options. Fakemoney scam applications, which promise fraudulent investment opportunities or fake payouts, continue to target users frequently, ranking third in our statistics. Meanwhile, the Mamont banking Trojan variants occupy the 6th, 8th, and 18th positions by number of attacks. The Triada backdoor preinstalled in the firmware of certain devices reached the 9th spot.

Region-specific malware

This section describes malware families whose attack campaigns are concentrated within specific countries.

Verdict Country* %**
Trojan-Banker.AndroidOS.Coper.a Türkiye 95.74
Trojan-Dropper.AndroidOS.Hqwar.bj Türkiye 94.96
Trojan.AndroidOS.Thamera.bb India 94.71
Trojan-Proxy.AndroidOS.Agent.q Germany 93.70
Trojan-Banker.AndroidOS.Coper.c Türkiye 93.42
Trojan-Banker.AndroidOS.Rewardsteal.lv India 92.44
Trojan-Banker.AndroidOS.Rewardsteal.jp India 92.31
Trojan-Banker.AndroidOS.Rewardsteal.ib India 91.91
Trojan-Dropper.AndroidOS.Rewardsteal.h India 91.45
Trojan-Banker.AndroidOS.Rewardsteal.nk India 90.98
Trojan-Dropper.AndroidOS.Agent.sm Türkiye 90.34
Trojan-Dropper.AndroidOS.Rewardsteal.ac India 89.38
Trojan-Banker.AndroidOS.Rewardsteal.oa India 89.18
Trojan-Banker.AndroidOS.Rewardsteal.ma India 88.58
Trojan-Spy.AndroidOS.SmForw.ko India 88.48
Trojan-Dropper.AndroidOS.Pylcasa.c Brazil 88.25
Trojan-Dropper.AndroidOS.Hqwar.bf Türkiye 88.15
Trojan-Banker.AndroidOS.Agent.pp India 87.85

* Country where the malware was most active.
** Unique users who encountered the malware in the indicated country as a percentage of all users of Kaspersky mobile solutions who were attacked by the same malware.

Türkiye saw the highest concentration of attacks from Coper banking Trojans and their associated Hqwar droppers. In India, Rewardsteal Trojans continued to proliferate, exfiltrating victims’ payment data under the guise of monetary giveaways. Additionally, India saw a resurgence of the Thamera Trojan, which we previously observed frequently attacking users in 2023. This malware hijacks the victim’s device to illicitly register social media accounts.

The Trojan-Proxy.AndroidOS.Agent.q campaign, concentrated in Germany, utilized a compromised third-party application designed for tracking discounts at a major German retail chain. Attackers monetized these infections through unauthorized use of the victims’ devices as residential proxies.

In Brazil, 2025 saw a concentration of Pylcasa Trojan attacks. This malware is primarily used to redirect users to phishing pages or illicit online casino sites.

Mobile banking Trojans

The number of new banking Trojan installation packages surged to 255,090, representing a several-fold increase over previous years.

Mobile banking Trojan installation packages detected by Kaspersky in 2022–2025 (download)

Notably, the total number of attacks involving bankers grew by 1.5 times, maintaining the same growth rate seen in the previous year. Given the sharp spike in the number of unique malicious packages, we can conclude that these attacks yield significant profit for cybercriminals. This is further evidenced by the fact that threat actors continue to diversify their delivery channels and accelerate the production of new variants in an effort to evade detection by security solutions.

TOP 10 mobile bankers

Verdict % 2024* % 2025* Difference in p.p. Change in ranking
Trojan-Banker.AndroidOS.Mamont.da 0.86 15.65 +14.79 +28
Trojan-Banker.AndroidOS.Mamont.db 0.12 13.41 +13.29
Trojan-Banker.AndroidOS.Coper.c 7.19 9.65 +2.46 +2
Trojan-Banker.AndroidOS.Mamont.bc 10.03 6.26 –3.77 –3
Trojan-Banker.AndroidOS.Mamont.ev 0.00 4.10 +4.10
Trojan-Banker.AndroidOS.Coper.a 9.04 4.00 –5.04 –4
Trojan-Banker.AndroidOS.Mamont.ek 0.00 3.73 +3.73
Trojan-Banker.AndroidOS.Mamont.cb 0.64 3.04 +2.40 +26
Trojan-Banker.AndroidOS.Faketoken.pac 2.17 2.95 +0.77 +5
Trojan-Banker.AndroidOS.Mamont.hi 0.00 2.75 +2.75

* Unique users who encountered this malware as a percentage of all users of Kaspersky mobile solutions who encountered banking threats.

In 2025, we observed a massive surge in activity from Mamont banking Trojans. They accounted for approximately half of all new apps in their category and also were utilized in half of all banking Trojan attacks.

Conclusion

The year 2025 saw a continuing trend toward a decline in total unique unwanted software installation packages. However, we noted a significant year-over-year increase in specific threats – most notably mobile banking Trojans and spyware – even though adware remained the most frequently detected threat overall.

Among the mobile threats detected, we have seen an increased prevalence of preinstalled backdoors, such as Triada and Keenadu. Consistent with last year’s findings, certain mobile malware families continue to proliferate via official app stores. Finally, we have observed a growing interest among threat actors in leveraging compromised devices as proxies.

❌