Login
Login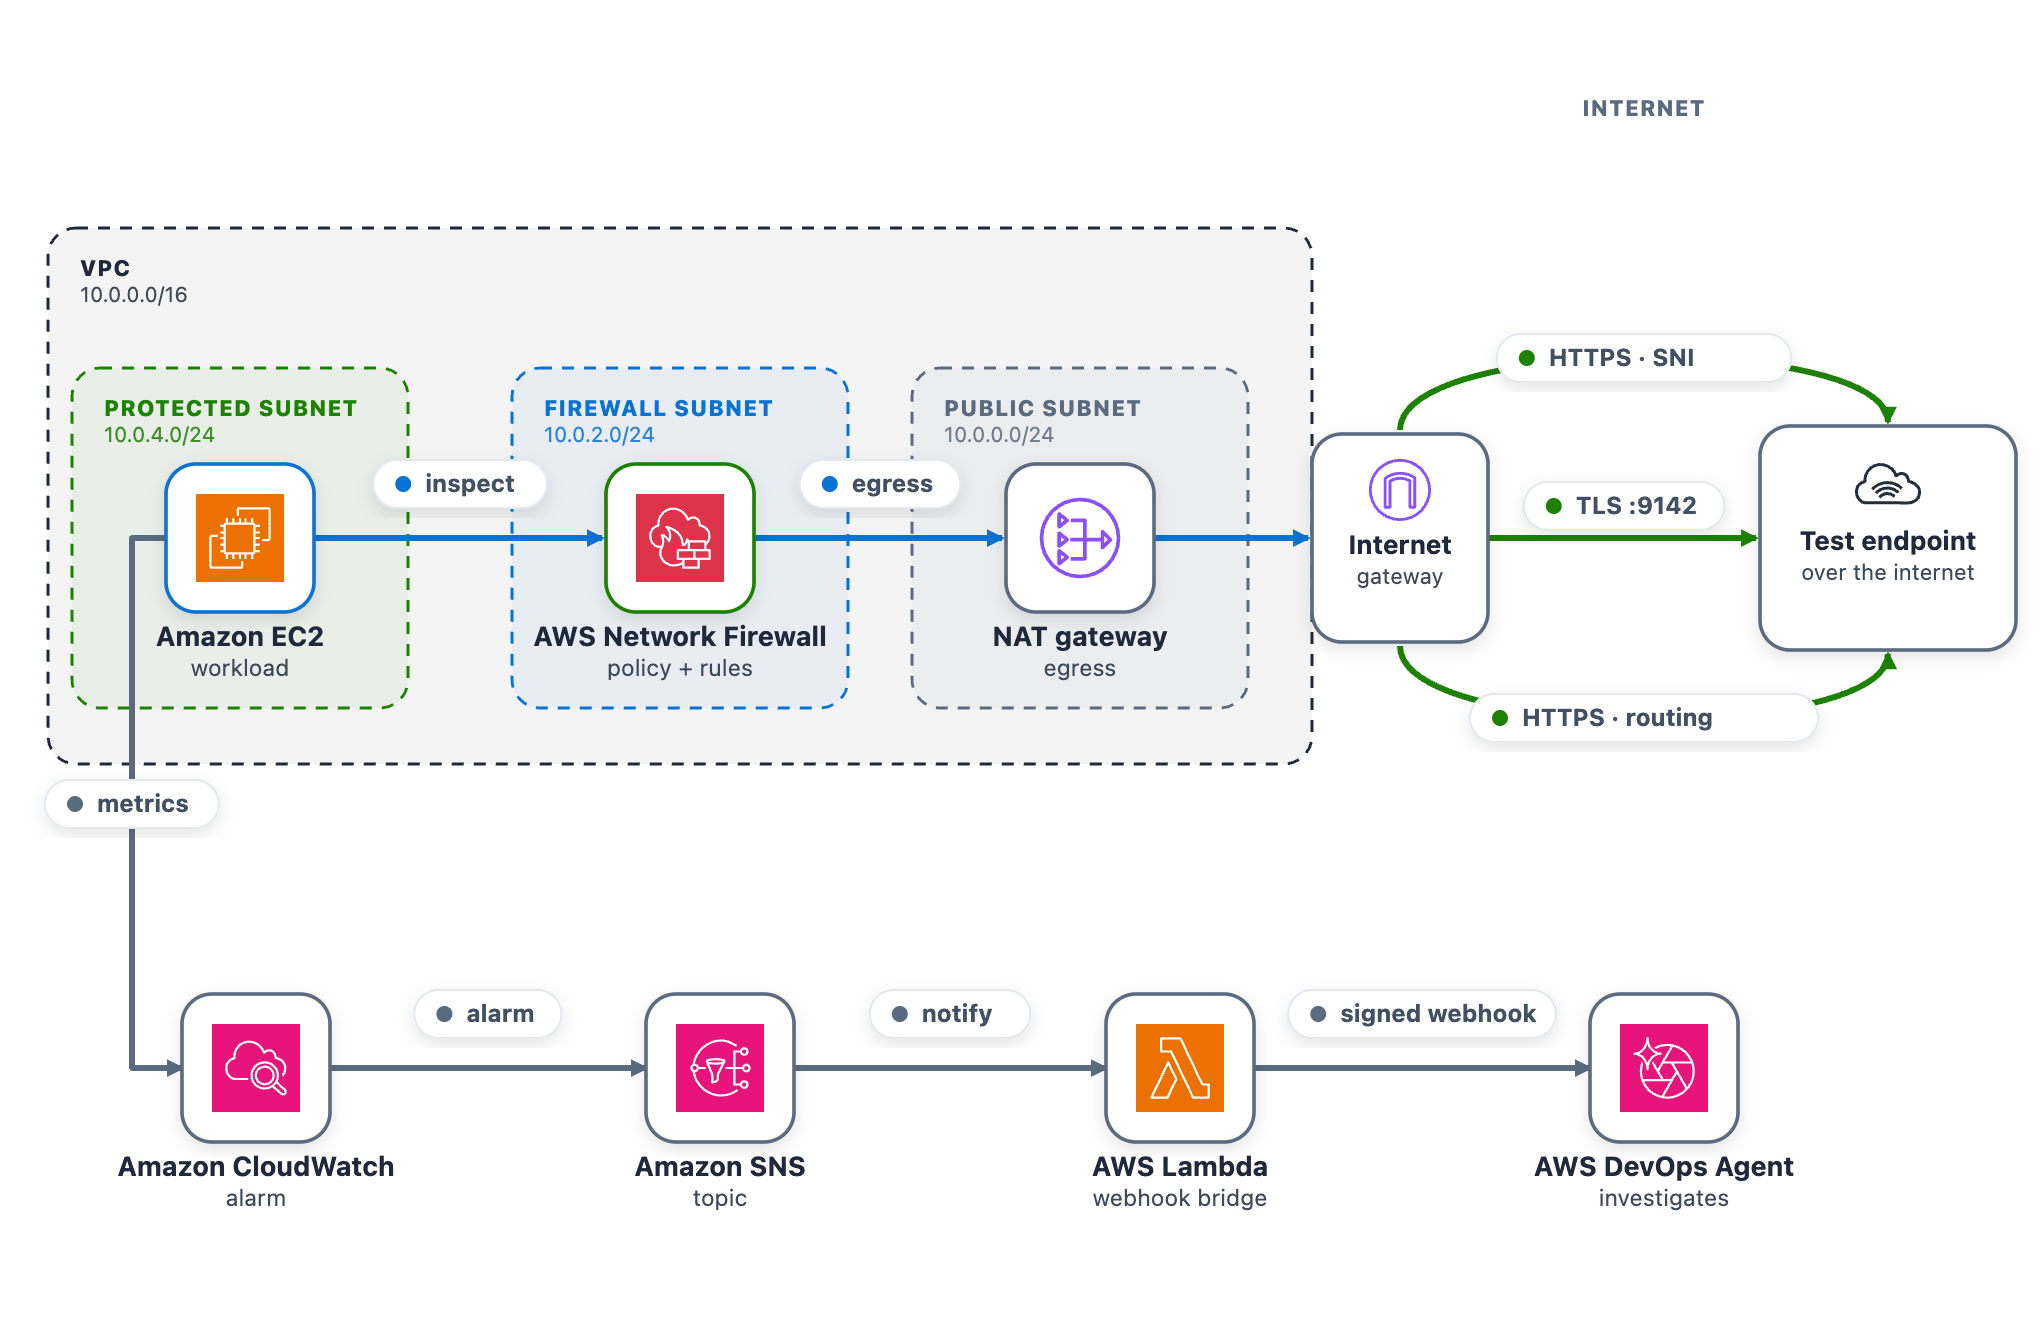


Accelerating AWS Network Firewall troubleshooting with AWS DevOps Agent
When an administrator introduces a rule change in AWS Network Firewall and network connectivity is disrupted, pinpointing the cause requires inspecting multiple points in the traffic path. The firewall gives you stateless and stateful rule engines, domain rules, and routing to the firewall endpoint inside your Amazon Virtual Private Cloud (Amazon VPC). A network drop looks the same from the workload no matter where it started. Isolating the cause means correlating the alert and flow logs with the firewall configuration, route tables, and recent API calls in AWS CloudTrail that might have changed them. That manual correlation is exactly where AWS DevOps Agent helps, accelerating root cause analysis so you can restore connectivity in minutes instead of hours.
AWS DevOps Agent does that correlation for you. As your always-available operations teammate, it resolves and proactively prevents operational issues across AWS, multicloud, and on-premises environments. When an Amazon CloudWatch alarm triggers, it reaches the agent through a webhook. The agent then reads the firewall configuration and logs through AWS APIs, ties the drop to recent API activity, and returns a root cause with a mitigation plan you review before you apply it.
This post connects CloudWatch monitoring to DevOps Agent. It walks through three Network Firewall failures from end to end. The first is a domain deny list blocking a legitimate endpoint. The second is a stateless rule priority misconfiguration. The third is an asymmetric cross Availability Zone (AZ) routing drop. Each maps to a different layer, so each leads down a different investigation path. An AWS Cloud Development Kit (AWS CDK) app deploys the whole environment in your own account so you can reproduce each failure and follow along.
The sample workload
As part of this blog post, we provide a CDK stack that deploys both the AWS DevOps Agent Space and a sample workload used to walk through three separate troubleshooting scenarios. A single t3.micro instance in a protected subnet checks its connectivity to a test endpoint on a continuous loop and publishes results to CloudWatch. Traffic takes the internet egress path through Network Firewall, the NAT gateway, and the internet gateway, so the firewall can intercept or drop it. After completing the walkthrough, you can apply the same troubleshooting techniques with DevOps Agent against your own Network Firewall deployments.
The test endpoint runs in a separate VPC deployed by the same CDK app. It serves HTTPS on port 443 and TCP on port 9142, giving each scenario a different protocol layer to exercise: Scenario 1 targets a TLS connection on 443 (matched by Server Name Indication), Scenario 2 targets a TCP connection on 9142, and Scenario 3 exercises the whole egress path.
A live status page shows one card per scenario plus the network topology. The whole stack deploys from a single CDK app across two Availability Zones, each with a firewall endpoint and NAT gateway, which is what makes Scenario 3 possible.
As shown in the following figure, the egress data path runs from the workload through Network Firewall and the NAT and internet gateways to the test endpoint. The alarm pipeline runs from CloudWatch through Amazon Simple Notification Service (Amazon SNS) and the webhook AWS Lambda function to DevOps Agent.

Figure 1: The sample workload
To use this with your own workload, you need a CloudWatch alarm that detects the connectivity problem and the webhook pipeline (SNS topic and Lambda function) that delivers it to DevOps Agent. The agent reads your firewall configuration, logs, and CloudTrail through AWS APIs, so no additional instrumentation is needed on the firewall side.
Prerequisites
To follow along with this post, you need:
- An AWS account with permissions to deploy Amazon VPC, Network Firewall, Amazon Elastic Compute Cloud (Amazon EC2), CloudWatch, Amazon SNS, Lambda, Amazon CloudFront, and AWS Identity and Access Management (IAM) resources
- Access to AWS DevOps Agent, with permission to configure its webhook
- Node.js 18 or later and npm installed
- AWS Command Line Interface (AWS CLI) 2.x configured with credentials
- AWS CDK 2.x is required. You can use it through the project’s npx dependency, or install it globally:
npm install -g aws-cdk
Deploy the sample workload
Clone the project and deploy it into us-east-1 with one command (set awsRegion to use another AWS Region).
git clone https://github.com/aws-samples/sample-accelerating-aws-network-firewall-troubleshooting-with-aws-devops-agent.git
cd sample-accelerating-aws-network-firewall-troubleshooting-with-aws-devops-agent
bash scripts/deploy.sh
The script checks prerequisites, installs dependencies, compiles and tests, and bootstraps the CDK if needed. It then deploys all the stacks from a clean baseline and prints the outputs, including the status-page URL and sign-in details.
- Open the status-page link (an
https://<random-id>.cloudfront.netaddress). - Sign in using the username and password provided from the CDK output and confirm all three cards show the green Healthy status.
- Keep the page open while you run the scenarios.
Connect AWS DevOps Agent
To connect AWS DevOps Agent to the alarm pipeline
- In the AWS DevOps Agent console, open the
nf-devops-agent-spaceAgent Space created by the CDK deployment. - Configure the DevOps Agent webhook and download the CSV file with the webhook URL and signing secret.
- On the status page, choose Configure webhook, paste the URL and signing secret, and save. The page writes them to the
nf-devops-agent-webhook-credentialsAWS Secrets Manager secret, so there is no AWS CLI or console step. Until you set it, the bridge Lambda function sees a placeholder and skips delivery. - Verify the path before you run a scenario. In the Lambda console, open
nf-devops-agent-webhookand use the Test tab with this event.{ "Records": [ { "Sns": { "Message": "{\"AlarmName\":\"TEST-webhook-verification\",\"AlarmDescription\":\"[TEST] Webhook integration test - not a real alarm.\",\"NewStateValue\":\"ALARM\",\"NewStateReason\":\"[TEST] Manual webhook connectivity test. Safe to ignore.\",\"Region\":\"us-east-1\"}" } } ] } - A
200response confirms the path, and a test investigation appears in the DevOps Agent Operator Web App view.
How the alarm pipeline works
Every scenario reaches DevOps Agent the same way. A CloudWatch alarm moves to ALARM and notifies the SNS topic. Amazon SNS invokes a Lambda function. The function reads the webhook URL and signing secret from Secrets Manager, signs an alarm payload, and POSTs it to the DevOps Agent webhook (as shown in Figure 1). Amazon SNS also provides delivery retries, fan-out to other subscribers, and cross-account publishing.
- Prebuilt Network Firewall metric (Scenario 1) –
Alarm-1watches theDroppedPacketsmetric, summed across the stateful streams, and triggers when drops rise above a baseline threshold. This requires no workload or custom metric and works on an already-deployed firewall. However, it only tells you that the firewall is dropping packets, not which rule is responsible. - Application health metric (Scenarios 2 and 3) –
Alarm-2andAlarm-3watch a custom metric from a connectivity check. Use this for an alarm tied to user-facing impact or to tell one traffic path from another, which requires running a component that emits the metric.
| Alarm | Source | Triggers when |
| Alarm-1 | Native AWS/NetworkFirewall DroppedPackets |
The firewall’s dropped-packet count rises above the baseline |
| Alarm-2 | Custom application health metric | The port 9142 (TCP) connectivity check to the test endpoint is being dropped |
| Alarm-3 | Custom application health metric | The cross Availability Zone connectivity check is being dropped |
Run the scenarios
Work through each of the scenarios one at a time, following the same cycle. Interrupt network connectivity, watch the alarm trigger, let DevOps Agent investigate, apply the recommended fix, and confirm recovery before moving on.
The status-page cards follow the live CloudWatch alarm state. A card shows a green dot and the word Healthy when its alarm is clear, and a red dot and the word DROPPED when its alarm triggers. In the DROPPED state the card also adds a Condition: line describing what’s being dropped, which isn’t shown when the card is healthy. Network Firewall applies changes to new flows, so a change shows within a minute or two. Recovery comes from the mitigation DevOps Agent recommends, which you review and apply.
Scenario 1. Domain deny list blocking a legitimate endpoint
At baseline, the rg-domain Suricata domain rule group denies only an unused placeholder, so the test endpoint stays reachable. The rule group inspects the TLS Server Name Indication (SNI) on each outbound connection and drops any that matches a denied domain. The exact rule syntax and console steps follow.
To add the domain deny rule
- Go to the Amazon VPC console.
- In the navigation pane, under Network Firewall, choose Network Firewall rule groups.
- Choose the
rg-domainrule group to open its details page. - In the Rules section, choose Edit.
- The rules box already contains two baseline placeholder rules (they match
blocked.placeholder.invalid, so nothing real is denied). Leave those in place. Find the<app-endpoint-dns>value for Scenario 1 in the deployment script output (a Nework Load Balancer (NLB) DNS name such asNfTest-AppNl-a1b2C3dEf4G5-1234abcd5678efgh.elb.us-east-1.amazonaws.com). On a new line below the existing rules, add a drop rule that matches that DNS name on the TLS SNI, then choose Save.drop tls $HOME_NET any -> $EXTERNAL_NET any (ssl_state:client_hello; tls.sni; content:"<app-endpoint-dns>"; startswith; nocase; endswith; msg:"S1 domain denylist"; flow:to_server, established; sid:2000002; rev:1;) - After saving, the rules box holds all three lines. The two placeholders remain, plus the new drop rule for the endpoint DNS name (note the distinct
sid 2000002).
Figure 2: Scenario 1 – Firewall rule change blocking the connection
What happens. The workload’s HTTPS check to the test endpoint times out, the “AWS/NetworkFirewall DroppedPackets metric climbs above baseline, and Alarm-1 moves to ALARM. The Scenario 1 card reads DROPPED (with the condition Firewall dropping the monitored domain on its allow/deny rules), while the Scenario 2 and Scenario 3 cards stay Healthy (Figure 3). On the topology, the alarm pipeline from CloudWatch through Amazon SNS and Lambda to DevOps Agent and the workload-to-firewall inspect lines both turn amber, which the legend defines as collateral / alarm active, because the packets are now dropped at the firewall. To demonstrate the resulting failure, the HTTPS · SNI line from the internet gateway to the test endpoint is shown in red, which the legend defines as dropped (root cause).
Figure 3: Scenario 1 active – Traffic blocked at the firewall
Let DevOps Agent investigate. The agent runs several lines of investigation in parallel and correlates them:
- Reads the
DroppedPacketsmetric and correlates the spike with a simultaneous drop in passed packets, confirming the firewall is actively blocking traffic. - Reads the
ALERTlog and finds the workload’s TLS connections to the test endpoint blocked by the S1 domain denylist rule. - Compares the current state against a baseline window, where the same endpoint was reachable with no alerts, which shows the block is new.
- Searches CloudTrail and surfaces the
UpdateRuleGroupcall that added the deny rule, identifying the user, role, and timestamp approximately one minute before the drops began. - Reports the root cause as that manual rule-group change. Recommends removing the deny entry or adding an allow exception and enabling
FirewallPolicyChangeProtectionto prevent unauthorized changes. - Presents this as a plan you review and apply, not an automatic change.
In the DevOps Agent Operator Web App view, the agent first restates the Alarm-1 trigger and confirms the firewall is dropping packets above the threshold (Figure 4).
Figure 4: Scenario 1 – The symptom
Next, the agent identifies the root cause: a manual update to the rg-domain rule group that added a domain deny rule (SID 2000002) shortly before the alarm fired, blocking TLS connections to the ELB endpoint (Figure 5).
Figure 5: Scenario 1 – The root cause
Finally, the agent presents a mitigation plan, recommending you remove the problematic deny rule (SID 2000002) to restore connectivity (Figure 6).
Figure 6: Scenario 1 – The mitigation plan
Note: In a real-world environment, this type of rule typically exists for a reason. Before removing it, verify whether it was intentional but scoped too broadly. If so, refine the rule to block only unauthorized endpoints rather than removing it entirely.
Confirm recovery. Apply the change the agent recommends. After the deny entry is gone, DroppedPackets falls back to baseline, Alarm-1 clears, and the card returns to green. Move on to Scenario 2.
Scenario 2. Stateless rule priority misconfiguration
At baseline, the rg-stateless-priority stateless rule group keeps the allow rule at priority 100 and the drop rule at 200 for the test class, TCP destination port 9142. The workload opens a TCP connection to the test endpoint on this port. Lower priority numbers evaluate first, so the allow rule wins. This scenario uses port 9142 instead of 443 to demonstrate a stateless rule, which matches on the packet’s 5-tuple (protocol, ports, addresses) rather than application content.
Introduce the change. Invert the two rule priorities so the drop rule evaluates before the allow rule. This is the kind of change a rushed rule edit can introduce.
To invert the stateless rule priorities
- Go to the Amazon VPC console.
- In the navigation pane, under Network Firewall, choose Network Firewall rule groups.
- Choose the
rg-stateless-priorityrule group to open its details page. - In the Rules section, choose Edit.
- Raise the (Action: Pass) rule’s priority number so it sits after the (Action: Drop) rule, then choose Save. For example, change the (Action: Pass) rule from
100to300(any number higher than the drop rule’s 200 works). You only need to move one rule, and using300avoids a clash with the drop rule that already sits at200. Network Firewall evaluates the lowest priority number first, so the (Action: Drop) rule at200now wins for this traffic class, ahead of the (Action: Pass) rule at300.
Figure 7: Scenario 2 – Rule priority change blocking the traffic class
What happens. The drop rule now wins, the TCP connection to the test endpoint on port 9142 times out, the StatelessRuleFailures metric climbs above baseline, and Alarm-2 moves to ALARM. The Scenario 2 card reads DROPPED (with the condition Stateless rules dropping the monitored traffic class), while the Scenario 1 and Scenario 3 cards stay Healthy (Figure 8). On the topology, the alarm pipeline from CloudWatch through Amazon SNS and Lambda to DevOps Agent and the workload-to-firewall inspect lines both turn amber, which the legend defines as collateral / alarm active, because the packets are now dropped at the firewall. To demonstrate the resulting failure, the TLS :9142 line from the internet gateway to the test endpoint is shown in red, which the legend defines as dropped (root cause).
Figure 8: Scenario 2 active
Let DevOps Agent investigate. A stateless drop happens before traffic reaches the stateful inspection engine, so it produces no ALERT log entries. The agent turns to configuration and flow logs instead:
- Reads the stateless rule group state and finds the drop rule at the lower priority number, ahead of the pass rule, so the drop evaluates first.
- Reads the flow logs and sees passed packets drop to zero within a minute of the change.
- Searches CloudTrail and surfaces the
UpdateRuleGroupcall that inverted the priorities, identifying the user, role, and timestamp about a minute before the alarm. - Reports the root cause as that priority inversion. Recommends removing the redundant drop rule and managing the rule group through infrastructure-as-code (IaC) to prevent manual misconfigurations.
- Presents this as a plan you review and apply, not an automatic change.
In the DevOps Agent Operator Web App view, the agent first restates the Alarm-2 trigger and confirms that a workload connectivity health check is failing because the firewall’s stateless rules are dropping egress (Figure 9).
Figure 9: Scenario 2 – The symptom
Next, the agent identifies the root cause, using the rule-group state and CloudTrail to pinpoint the conflicting DROP/PASS rules, where the new DROP rule’s lower priority number makes it match first (Figure 10).
Figure 10: Scenario 2 – The root cause
Finally, the agent presents a mitigation plan, recommending you remove the conflicting DROP rule at priority 200 to restore traffic flow (Figure 11).
Figure 11: Scenario 2 – The mitigation plan
Confirm recovery. Apply the change the agent recommends. After the allow rule is ahead of the drop rule again, Alarm-2 clears and the card returns to green. Move on to Scenario 3.
Scenario 3. Asymmetric cross Availability Zone routing drop
At baseline, the protected subnet in each Availability Zone routes its egress through the firewall endpoint in that same Availability Zone , and the matching return route uses that same endpoint. One endpoint sees both directions of the flow, so the stateful engine completes the handshake. The workload runs in the protected subnet in us-east-1a (CIDR 10.0.4.0/24), so at baseline its egress and its return both use the us-east-1a firewall endpoint.
Introduce the change. Make the flow asymmetric by sending egress out one Availability Zone endpoint while the return comes back through the other. This takes two route edits, and both are required. With only the first edit the flow can still complete, so the alarm will not trigger until both are saved. It makes no firewall-policy change, mirroring a real multi-Availability-Zone routing mistake.
To create asymmetric cross Availability Zone routing
- Go to the Amazon VPC console and choose Route tables in the navigation pane.
- Flip the egress. Select the
NfNetworkStack/SampleVpc/protectedSubnet1route table (theus-east-1aprotected subnet, where the workload runs). On the Routes tab, choose Edit routes. Its0.0.0.0/0route currently targets theus-east-1afirewall endpoint. For the target, choose Gateway Load Balancer Endpoint and select theus-east-1bfirewall endpoint, then choose Save changes. - Move the return. Select the
NfNetworkStack/SampleVpc/publicSubnet2route table (theus-east-1bpublic subnet, where egress now exits). Choose Edit routes, then Add route. For the destination enter the workload CIDR10.0.4.0/24. For the target, choose Gateway Load Balancer Endpoint and select theus-east-1afirewall endpoint. Choose Save changes.
After both edits, a flow’s egress leaves through the us-east-1b endpoint while its return is directed to the us-east-1a endpoint. Neither endpoint sees the whole flow.
Figure 12: Scenario 3 routing change breaking the flow’s symmetry
What happens. A new connection leaves through one endpoint. Its return arrives at the other endpoint, which never saw the connection open, so the handshake fails. Unlike Scenarios 1 and 2, this affects the whole subnet, so all egress stops and Alarm-2 and Alarm-3 both move to ALARM. The AWS/NetworkFirewall DroppedPackets alarm (Alarm-1) stays quiet because no endpoint is making a drop decision. The flow is lost to asymmetric routing rather than counted as a firewall drop. This is why monitoring application connectivity matters. A routing fault is invisible to the firewall’s own drop counter. On the status page, the Scenario 2 card reads DROPPED (with the condition “Stateless rules dropping the monitored traffic class”) and the Scenario 3 card reads DROPPED (with the condition Return traffic dropped by asymmetric cross-Availability-Zone routing), while the Scenario 1 card stays Healthy (Figure 13). On the topology, the alarm pipeline from CloudWatch through Amazon SNS and Lambda to DevOps Agent and the workload-to-firewall inspect lines both turn amber, which the legend defines as collateral / alarm active, while the egress path from the firewall through the NAT gateway and the TLS :9142 and HTTPS · routing lines to the test endpoint turn red, which the legend defines as dropped (root cause).
Figure 13: Scenario 3 – The status page during a path-wide outage
Let DevOps Agent investigate. Both Alarm-2 and Alarm-3 fire in the same datapoint. DevOps Agent recognizes them as linked and merges them into a single investigation:
- Reads the flow logs and sees bidirectional TLS connections stop abruptly, with only one-way traffic remaining and no flows reaching the established state.
- Reads the firewall metrics and sees received and passed packets shift from one Availability Zone to the other at the moment of the change.
- Calls
DescribeRouteTablesand finds the egress route pointing at one Availability Zone firewall endpoint while the return route points at the other. - Searches CloudTrail and surfaces the
ReplaceRouteandCreateRoutecalls by the same user, about a minute before both alarms fired. - Reports the root cause as that asymmetric routing change. Recommends restoring symmetric same-Availability-Zone routing so egress and return traverse the same endpoint.
- Presents this as a plan you review and apply, not an automatic change.
A mitigation plan is a recommendation you review, not an automatic change, and the right fix depends on the intended design. Restoring symmetric routing can mean sending the workload subnet’s egress back through its own-Availability-Zone firewall endpoint (this sample’s architecture) or, in a design that doesn’t inspect this path, back through a NAT gateway. The agent infers a plausible target from what it can observe, so review the specific route it proposes against your intended topology before you apply it. (Connecting your pipeline or infrastructure-as-code, covered in the next section, lets the agent recommend the target that matches your design.)
In the DevOps Agent Operator Web App view, the agent restates the Alarm-3 (AsymmetricFlowFailures) trigger and confirms the workload’s egress to a monitored endpoint is being blocked by the Network Firewall (Figure 14).
Figure 14: Scenario 3 – The symptom
Next, the agent identifies the root cause: manual route table changes that created cross-AZ asymmetric routing through the network firewall, breaking its symmetric routing requirement (Figure 15)
Figure 15: Scenario 3 – The root cause
Finally, the agent presents a mitigation plan, recommending you restore symmetric routing by pointing protectedSubnet1‘s default route back to the same Availability Zone firewall endpoint, so one endpoint sees both directions of the flow again (Figure 16).
Figure 16: Scenario 3 – The mitigation plan
Confirm recovery. Apply the change the agent recommends, after checking the route target matches your intended design. After the workload subnet’s egress and return use the same Availability Zone firewall endpoint again, the control probe recovers, the alarms clear, and every card returns to green.
Further considerations
In production a single change can trigger several alarms at the same time, as Scenario 3 shows. DevOps Agent links related investigations and works them as one, so you review a single root cause. You can validate the linked findings or unlink an alarm to investigate it independently. If you would rather collapse alarms before they reach the agent, you can add correlation logic in the bridge Lambda function, buffering and grouping by firewall. You can also add email, Amazon Simple Queue Service (Amazon SQS), or HTTP subscribers to the SNS topic, or add the webhook Lambda function to a topic you already run. DevOps Agent produces a mitigation plan but does not change your environment on its own.
You can also give the agent more to work with. DevOps Agent connects to source repositories and CI/CD pipelines, integrating with GitHub (including GitHub Enterprise Server and GitLab Self-Managed through a private connection). It can associate AWS resources with deployments of AWS CloudFormation, AWS CDK, Amazon Elastic Container Registry (Amazon ECR) images, and Terraform. With deployed configuration and recent deployment events in view, the agent correlates the disruption against the change that introduced it and recommends a fix matching your intended design. For this sample, that means recommending the workload subnet’s own Availability Zone firewall endpoint rather than a generic symmetric path.
DevOps Agent also supports proactive incident prevention. It analyzes patterns across past investigations and delivers recommendations to prevent similar issues from recurring, including governance recommendations that strengthen deployment processes and pipeline controls. For Network Firewall rule changes, this means the agent can recommend guardrails for your CI/CD pipeline based on the classes of misconfigurations it has already resolved. You can access these recommendations through the Improvements page in the DevOps Agent Operator Web App.
Clean up
Clean up the environment with one command.
bash scripts/destroy.shIt reverts any active scenario, runs cdk destroy for all stacks, and sweeps for stragglers by the Project = nf-devops-agent tag. The main cost drivers are the two Network Firewall endpoints, the NAT gateways (one in the main VPC for each Availability Zone, one in the test-endpoint VPC), and the test endpoint’s load balancers. Each of these bills at an hourly rate for as long as it’s provisioned, whether or not traffic is flowing, so a stack left running continues to accrue charges around the clock even while idle. Running the scenarios and tearing the stack down the same day limits the cost to a few active hours rather than days of idle hourly charges.
Conclusion
In this post, we showed you how AWS DevOps Agent accelerates troubleshooting for three common network firewall connectivity issues. The first was a domain deny list. The second was a stateless priority inversion. The third was an asymmetric cross-AZ routing drop. For each one, DevOps Agent investigated the drop and returned a root cause with a mitigation plan you approve before applying. The first scenario triggered on a prebuilt Network Firewall metric, and the other two on application health metrics. That shows both ways to alarm on a firewall problem through one pipeline.
The pattern isn’t specific to Network Firewall. The same flow fits any service that emits CloudWatch metrics and logs, such as AWS WAF, security groups, and network ACLs. Clone the sample repository to explore the solution, then apply what you learn to your own firewall, application, and alarms. For more details, see the AWS Network Firewall Developer Guide and the AWS Network Firewall pricing page. Start with the Getting Started with AWS DevOps Agent guide to connect your first webhook.