❌

Normal view

Threat landscape for industrial automation systems. Q1 2026

7 July 2026 at 12:00

All threats

The percentage of ICS computers on which malicious objects were blocked continued to decrease, reaching 19.6% in Q1 2026. This is the lowest value in three years, and it is 1.4 times lower than in Q2 2023.
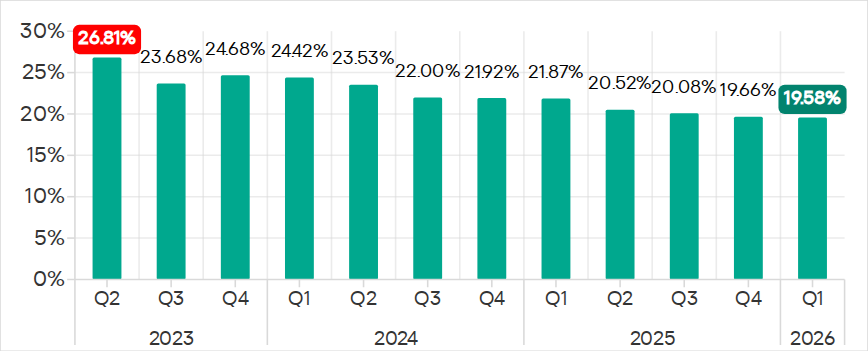
Percentage of ICS computers on which malicious objects were blocked, Q2 2023–Q1 2026

Percentage of ICS computers on which malicious objects were blocked, Q2 2023–Q1 2026

Regionally, the percentages ranged from 9.1% in Northern Europe to 27.4% in Africa.
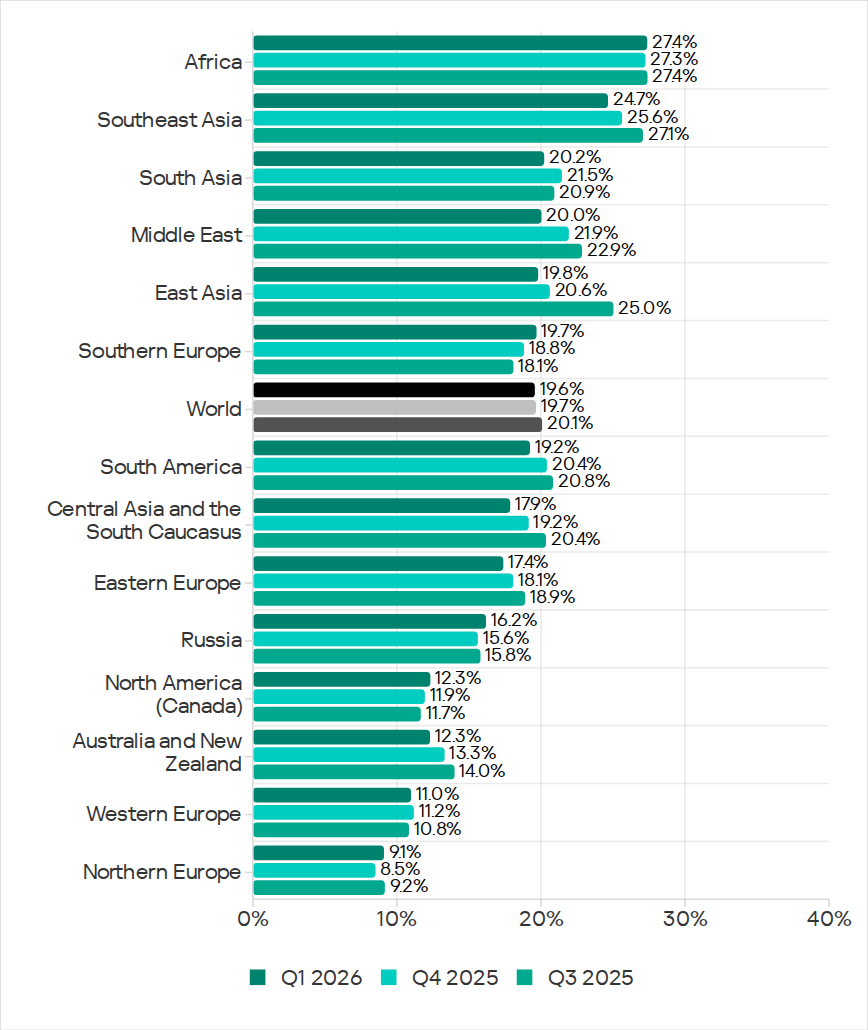
Regions ranked by percentage of attacked ICS computers

Regions ranked by percentage of attacked ICS computers

The percentage of ICS computers on which malicious objects were blocked increased in five regions over the quarter, most notably in Southern Europe, Northern Europe, and Russia.

In Q1 2026, Southern Europe led the way in growth for internet and email threats. The region also saw the fastest growth in spyware, as well as malicious scripts and phishing pages.

In Russia, the percentage of ICS computers on which malicious objects were blocked exceeded the figures for the previous two quarters. Russia saw an increase in the percentage for threats from the internet, and a slight increase in the figure for threats from email clients (Russia is one of three regions where this figure did not decrease).

Among the threat categories, the greatest increases were observed in the percentages for denylisted internet resources, as well as spyware (distributed in the region via the internet and email clients).

Selected industries

Biometric systems (26.4%) traditionally rank top among the industries and OT infrastructure types covered in this report in terms of the percentage of ICS computers on which malicious objects were blocked. These systems are characterized by internet access, extensive email use for data exchange and approvals (such as access granting), and, in many cases, minimal cybersecurity controls within the organizations that use these systems.
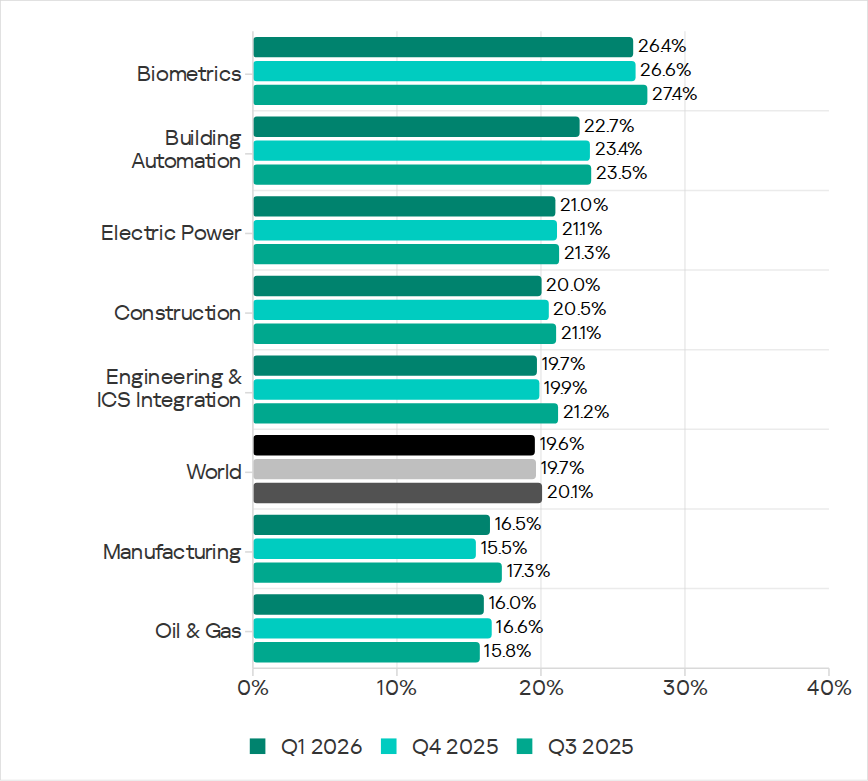
Industries ranked by the percentage of ICS computers on which malicious objects were blocked

Industries ranked by the percentage of ICS computers on which malicious objects were blocked

Biometric systems rank first among industries in terms of email threats. At the same time, unlike other industries, the percentage for email threats in biometric systems exceeds that for internet threats.

In all selected industries, the global average follows a downward trend. In Q1 2026, the percentage of ICS computers on which malicious objects were blocked increased only in the manufacturing sector β€” by 1.0 pp. The percentages for this industry increased across 10 regions, with the most notable increases in Western Europe, Northern Europe, and Russia.

Threat categories

In Q1 2026, Kaspersky security solutions blocked malware from 10,052 different malware families of various categories on industrial automation systems.

Over the quarter, the percentage of ICS computers on which denylisted internet resources were blocked increased (after decreasing over the previous two quarters), and there was a slight increase in the percentage for AutoCAD malware.
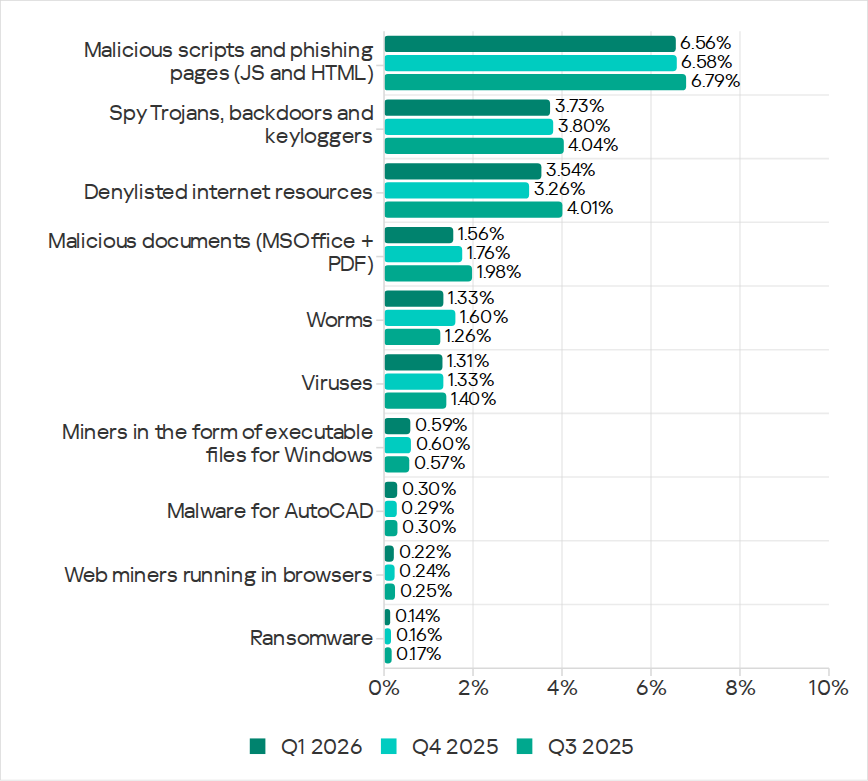
Percentage of ICS computers on which the activity of malicious objects from various categories was prevented

Percentage of ICS computers on which the activity of malicious objects from various categories was prevented

Malicious scripts and phishing pages (JS and HTML)

Malicious scripts and phishing pages retained their to spot among threat categories by the percentage of ICS computers on which these threats were blocked. The global average in Q1 2026 was 6.56%.

Over the quarter, the percentages increased in four regions. The most significant change was observed in Southern Europe (9.85%, +0.94 pp). The figures for malicious scripts in the region increased over three consecutive quarters.

Among the selected industries, across all regions, the highest percentages for the malicious scripts and phishing pages category were recorded for biometric systems (19.59%) and building automation (15.43%) in Southern Europe. These same industries lead in similar rankings for malicious documents and spyware.

Spyware

The percentage of ICS computers on which spyware was blocked decreased over two consecutive quarters, dropping to 3.73%. Despite the decline, spyware has ranked second among threat categories by the percentage of attacked computers for three consecutive quarters.

The percentages increased in five regions over the quarter, most notably in Southern Europe (5.46%, +0.35 pp) and Russia (2.84%, +0.24 pp).

In Southern Europe, the percentage of ICS computers on which spyware was blocked increased in all the selected industries except manufacturing. The greatest increase was observed in biometric systems.

Among the selected industries, the highest percentage of spyware in Russia was recorded in biometric systems. That said, the percentage of ICS computers on which spyware was blocked increased in all industries in the region except construction. The percentage figure has been increasing for two consecutive quarters in the oil and gas industry (by a factor of 1.63 over six months), and for three consecutive quarters in engineering and ICS integration, as well as electric power. In the remaining sectors, the values have been fluctuating.
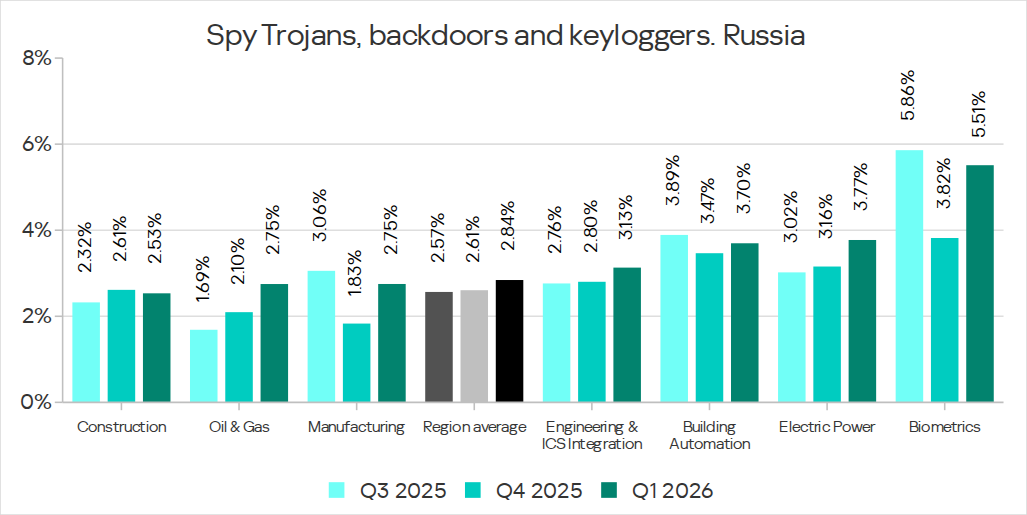
Percentage of ICS computers on which spyware was blocked in various industries in Russia, Q3 2025–Q1 2026

Percentage of ICS computers on which spyware was blocked in various industries in Russia, Q3 2025–Q1 2026

Denylisted internet resources

The percentage of ICS computers on which denylisted internet resources were blocked increased to 3.54%.

The most notable increase over the quarter occurred in Southeast Asia (4.58%, +0.65 pp). Among the industries in the region, the highest percentage figures for this threat category were recorded in electric power and construction. Over the quarter, the largest increases in percentages figures were observed in the electric power and manufacturing industries.

In North America (Canada), denylisted internet resources (2.14%) showed the greatest increase among all categories β€” by a factor of 1.22.

Among the selected industries across all regions, the highest percentage figures for the denylisted internet resources category were in the electric power (7.11%) and construction (6.25%) industries in Southeast Asia.

Malicious documents (Microsoft Office + PDF)

The percentage figure for this category decreased over two consecutive quarters, reaching its lowest value (1.56%) for the entire period of observations in Q1 2026. It increased just in two regions: Australia and New Zealand (1.12%, +0.04 pp), and Russia (0.62%, +0.01 pp).

Among the selected industries across all regions, the highest percentages for malicious documents were recorded for biometric systems (9.02%) and building automation (6.97%) in Southern Europe. These same industries also lead in similar rankings for malicious scripts and spyware.

Ransomware

The percentage of ICS computers on which ransomware was blocked has decreased for two consecutive quarters, dropping to 0.14%. This is the lowest value among all categories.

The percentage increased in two regions: North America (Canada) (0.11%, +0.04 pp) and slightly in Northern Europe (0.06%, +0.01 pp).

Among the selected industries across all regions, the highest percentages for ransomware were recorded in the oil and gas and manufacturing industries (0.92% and 0.65%, respectively) in Central Asia and the South Caucasus, and in biometric systems (0.89%) in Russia.

Miners in the form of executable files for Windows

The percentage of ICS computers on which miners in the form of executable files for Windows were blocked decreased to 0.59%.

The percentage increased in seven regions. The largest increase was observed in Africa (0.63%, +0.16 pp). Among the selected industries, the largest increases in the region were in the manufacturing and oil and gas industries.

Among the selected industries across all regions, the highest percentages for miners in the form of executable files were recorded in construction (1.99%), biometric systems (1.98%), and the oil and gas industry (1.97%) in Central Asia and the South Caucasus.

Web miners

The percentage of ICS computers on which web miners were blocked has been declining for a year, and in Q1 2026, it reached the lowest value for the entire period under review (0.22%).

At the same time, the percentage increased in seven regions. The largest increases were observed in South Asia (0.28%, +0.11 pp), the Middle East (0.31%, +0.09 pp), and Africa (0.34%, +0.08 pp). Despite the increases, the percentages in these regions for Q1 2026 did not exceed those observed in 2023–2024 and in Q1 2025.

Among the selected industries across all regions, the highest percentages for web miners were recorded for biometric systems (0.97%) in Russia. Biometric systems in South Asia (0.79%) ranked second, and the electric power sector in Southeast Asia (0.76%) ranked third.

Worms

The percentage of ICS computers on which worms were blocked decreased to 1.33%.

The percentage decreased across all regions following an increase in the previous quarter (due to a wave of phishing attacks that distributed the Backdoor.MSIL.XWorm backdoor worm across all regions of the world).

Among the selected industries across all regions, the highest percentage figure for worms was recorded for biometric systems (4.80%) in Central Asia and the South Caucasus. Two industries in Africa – biometric systems (4.04%) and electric power (3.53%) – took the second and third spots, respectively.

Viruses

The percentage of ICS computers on which viruses were blocked decreased to 1.31%.

The top 3 regions by this figure remained the same: Southeast Asia (6.11%, first by a wide margin), Africa (4.15%), and East Asia (2.97%). These same regions are also among the leaders by the percentage of systems affected by AutoCAD malware. The largest increase in this figure was observed in Africa (+0.41 pp).

Among the selected industries across all regions, the highest percentages for viruses were recorded in the construction industry (6.35%) and building automation (5.50%) in Southeast Asia.

Malware for AutoCAD

The percentage of ICS computers on which malware for AutoCAD was blocked increased to 0.30%.

The most notable increase over the quarter was observed in Africa, with the region’s percentage figure rising by 0.47 pp, a very significant increase for this category, and almost doubling (to 0.91%).

Among the selected industries across all regions, the highest percentages for AutoCAD malware were recorded in the construction industry in East Asia (5.58%) and Southeast Asia (3.87%).

Main threat sources

In Q1 2026, the average percentages across all threat sources, except threats from the internet, decreased globally.
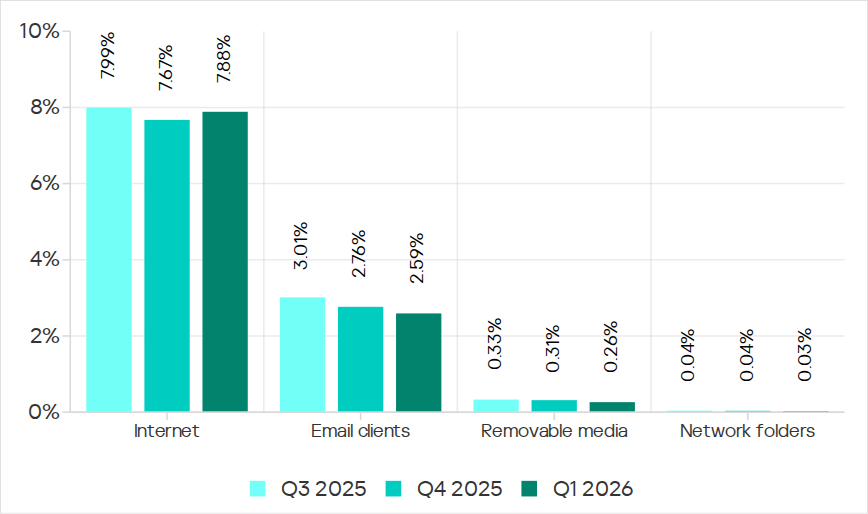
Percentage of ICS computers on which malicious objects from various sources were blocked

Percentage of ICS computers on which malicious objects from various sources were blocked

Internet

The percentage of ICS computers on which threats from the internet were blocked increased to 7.88%. However, over the past three years, the percentage figure for internet threats has followed a downward trend.

The largest increases in the percentages were recorded in Southern Europe (8.59%, +0.59 pp), Southeast Asia (10.16%, +0.55 pp), and Northern Europe (4.47%, +0.51 pp).

Among the selected industries across all regions, the highest percentages for threats from the internet were recorded in electric power (13.16%) and construction (12.55%) in Southeast Asia, and in the engineering and ICS integration sector (12.33%) in South Asia.

Email clients

The percentage of ICS computers on which threats delivered via email clients were blocked decreased to 2.59%. This is a three-year low.

The percentage of this threat source increased in three regions: Southern Europe (6.54%, +0.2 pp), East Asia (1.5%, +0.09 pp), and slightly in Russia (0.7%, +0.04 pp).

Among the selected industries across all regions, the highest percentages for email threats were recorded for biometric systems (19.78%) and building automation (12.34%) in Southern Europe. In these two industries, the percentage of ICS computers on which email threats are blocked is higher than the percentage for threats from the internet. A similar situation was observed in two other instances, both in biometric systems (in South America and Southeast Asia).

Removable media

The percentage of ICS computers on which threats were detected when connecting removable media continued to decrease, reaching its lowest value for the period under review (0.26%).

Among the selected industries across all regions, the highest percentages for removable media threats blocked on ICS computers were observed in the electric power sector in Central Asia and the South Caucasus (1.45%), East Asia (1.34%), and Africa (1.16%).

Network folders

The percentage of ICS computers on which threats are blocked in network folders is steadily decreasing. In Q1 2026, it was the lowest for the period under review (0.029%).

East Asia has traditionally led by a wide margin. The percentage for East Asia (0.135%) is 27 times higher than the lowest regional value (recorded in Northern Europe).

The largest increases in the percentages for threats from network folders were observed in Africa (0.037%, +0.006 pp) and South America (0.013%, +0.006 pp).
Among the selected industries across all regions, the construction industry in East Asia, at 0.36%, holds the top positions in the ranking by the percentage of ICS computers on which threats are blocked in network folders.

For more information on industrial threats see the full version of the report.

Threat landscape for industrial automation systems in Q4 2025

15 April 2026 at 14:30

Statistics across all threats

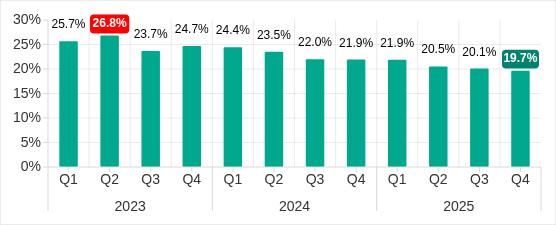
The percentage of ICS computers on which malicious objects were blocked has been decreasing since the beginning of 2024. In Q4 2025, it was 19.7%. Over the past three years, the percentage has decreased by 1.36 times, and by 1.25 times since Q4 2023.

Percentage of ICS computers on which malicious objects were blocked, Q1 2023–Q4 2025

Percentage of ICS computers on which malicious objects were blocked, Q1 2023–Q4 2025

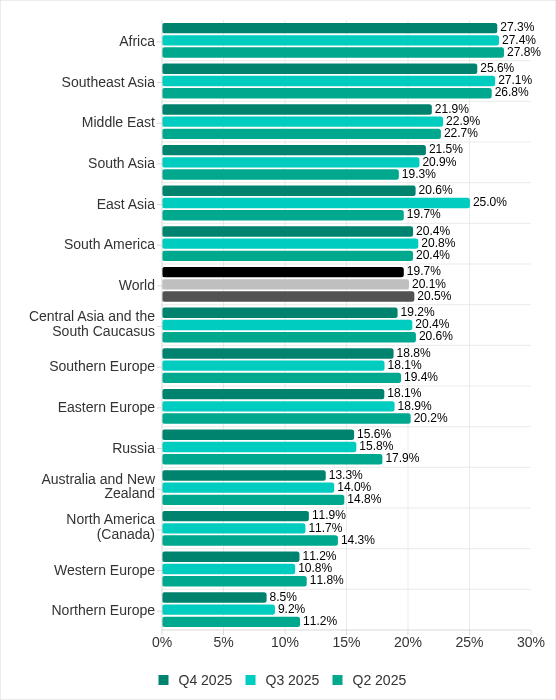
Regionally, in Q4 2025, the percentage of ICS computers on which malicious objects were blocked ranged from 8.5% in Northern Europe to 27.3% in Africa.

Regions ranked by percentage of ICS computers on which malicious objects were blocked

Regions ranked by percentage of ICS computers on which malicious objects were blocked

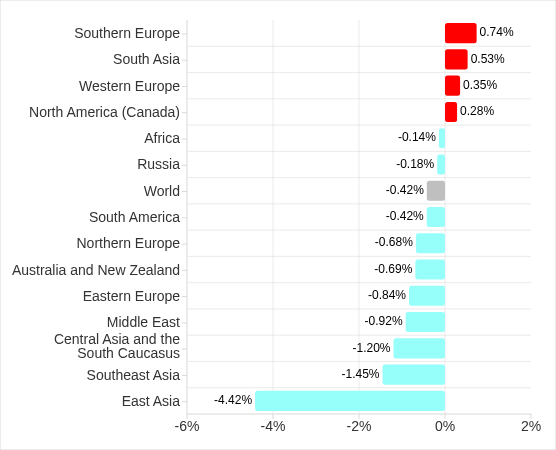
Four regions saw an increase in the percentage of ICS computers on which malicious objects were blocked. The most notable increases occurred in Southern Europe and South Asia. In Q3 2025, East Asia experienced a sharp increase triggered by the local spread of malicious scripts, but the figure has since returned to normal.

Changes in percentage of ICS computers on which malicious objects were blocked, Q4 2025

Changes in percentage of ICS computers on which malicious objects were blocked, Q4 2025

Feature of the quarter: worms in email

In Q4 2025, the percentage of ICS computers on which wormsinemailattachments were blocked increasedinallregions of the world.

Many of the blocked threats were related to the worm Backdoor.MSIL.XWorm. This malware is designed to persist on the system and then remotely control it.

Interestingly, this threat was not detected on ICS computers in the previous quarter, yet it appeared in all regions in Q4 2025.

A study found that the active spread of Backdoor.MSIL.XWorm via phishing emails was likely linked to the use by hackers of another malware obfuscation technique that was actively used during massive phishing campaigns in Q4 2025. These campaigns have been known since 2024 as β€œCurriculum-vitae-catalina”.

The attackers distributed phishing emails to HR managers, recruiters, and employees responsible for hiring. The messages were disguised as responses from job applicants with subjects such as β€œResume” or β€œAttached Resume” and contained a malicious executable file under the guise of a curriculum vitae. Typically, the file was named Curriculum Vitae-Catalina.exe. When executed, it infected the system.

In Q4 2025, the threat spread across regions in two waves β€” one in October and another in November. Russia, Western Europe, South America, and North America (Canada) were attacked in October. A spike in Backdoor.MSIL.XWorm blocking was observed in other regions in November. The attack subsided in all regions in December.

The highest percentage of ICS computers on which Backdoor.MSIL.XWorm was blocked was observed in regions where threats from email clients had been historically blocked at high rates on ICS computers: Southern Europe, South America, and the Middle East.

At the same time, in Africa, where USB storage media are still actively used, the threat was also detected when removable devices were connected to ICS computers.

Selected industries

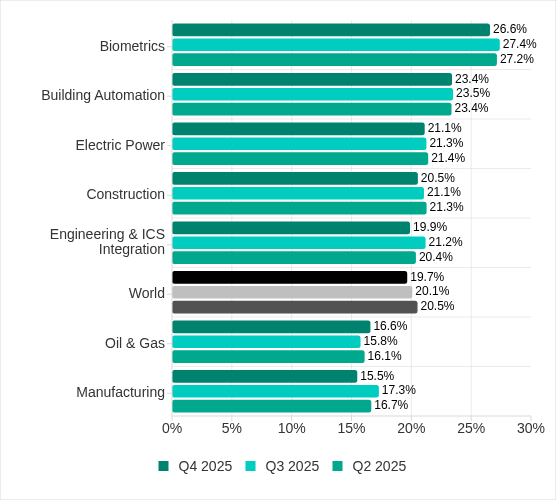
The biometrics sector has historically led the rankings of industries and OT infrastructures surveyed in this report in terms of the percentage of ICS computers on which malicious objects were blocked.

These systems are characterized by accessibility to and from the internet, as well as minimal cybersecurity controls by the consumer organization.

Rankings of industries and OT infrastructure by percentage of ICS computers on which malicious objects were blocked

Rankings of industries and OT infrastructure by percentage of ICS computers on which malicious objects were blocked

In Q4 2025, the percentage of ICS computers on which malicious objects were blocked increased only in one sector: oil and gas. The corresponding figures increased in two regions: Russia, and Central Asia and the South Caucasus.

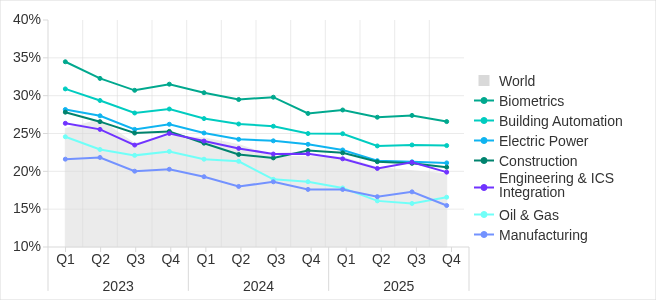
However, if we look at a broader time span, there is a downward trend in all the surveyed industries.

Percentage of ICS computers on which malicious objects were blocked in selected industries

Percentage of ICS computers on which malicious objects were blocked in selected industries

Diversity of detected malicious objects

In Q4 2025, Kaspersky protection solutions blocked malware from 10,142 different malware families of various categories on industrial automation systems.

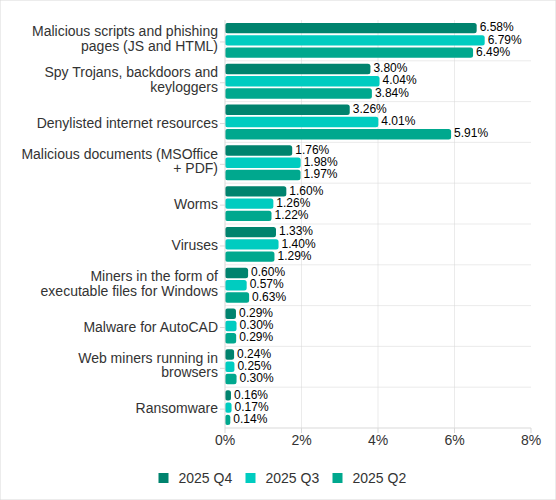
Percentage of ICS computers on which the activity of malicious objects from various categories was blocked

Percentage of ICS computers on which the activity of malicious objects from various categories was blocked

In Q4 2025, there was an increase in the percentage of ICS computers on which worms, and miners in the form of executable files for Windows were blocked. These were the only categories that exhibited an increase.

Main threat sources

Depending on the threat detection and blocking scenario, it is not always possible to reliably identify the source. The circumstantial evidence for a specific source can be the blocked threat’s type (category).

The internet (visiting malicious or compromised internet resources; malicious content distributed via messengers; cloud data storage and processing services and CDNs), email clients (phishing emails), and removable storage devices remain the primary sources of threats to computers in an organization’s technology infrastructure.

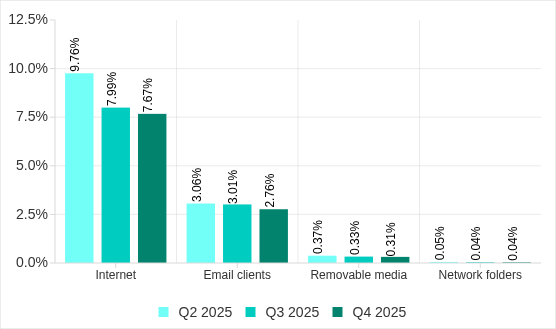
In Q4 2025, the percentage of ICS computers on which malicious objects from various sources were blocked decreased. All sources except email clients saw their lowest levels in three years.

Percentage of ICS computers on which malicious objects from various sources were blocked

Percentage of ICS computers on which malicious objects from various sources were blocked

The same computer can be attacked by several categories of malware from the same source during a quarter. That computer is counted when calculating the percentage of attacked computers for each threat category, but is only counted once for the threat source (we count unique attacked computers). In addition, it is not always possible to accurately determine the initial infection attempt. Therefore, the total percentage of ICS computers on which various categories of threats from a certain source were blocked can exceed the percentage of computers affected by the source itself.

  • In Q4 2025, the percentage of ICS computers on which threats from the internet were blocked decreased to 7.67% and reached its lowest level since the beginning of 2023. The main categories of internet threats are malicious scripts and phishing pages, and denylisted internet resources. The percentage ranged from 3.96% in Northern Europe to 11.33% in South Asia.
  • The main categories of threats from email clients blocked on ICS computers were malicious scripts and phishing pages, spyware, and malicious documents. Most of the spyware detected in phishing emails was delivered as a password archive or a multi-layered script embedded in office document files. The percentage of ICS computers on which threats from email clients were blocked ranged from 0.64% in Northern Europe to 6.34% in Southern Europe.
  • The main categories of threats that were blocked when removable media was connected to ICS computers were worms, viruses, and spyware. The percentage of ICS computers on which threats from removable media were blocked ranged from 0.05% in Australia and New Zealand to 1.41% in Africa.
  • The main categories of threats that spread through network folders in Q4 2025 were viruses, AutoCAD malware, worms, and spyware. The percentage of ICS computers on which threats from network folders were blocked ranged from 0.01% in Northern Europe to 0.18% in East Asia.

Threat categories

Typical attacks blocked within an OT network are multi-step sequences of malicious activities, where each subsequent step of the attackers is aimed at increasing privileges and/or gaining access to other systems by exploiting the security problems of industrial enterprises, including OT infrastructures.

Malicious objects used for initial infection

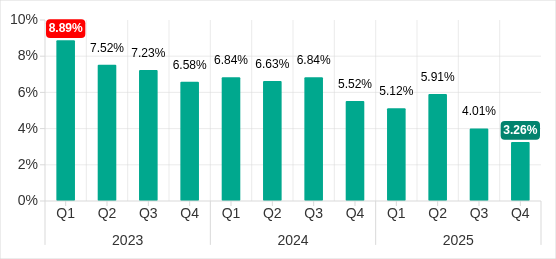
In Q4 2025, the percentage of ICS computers on which denylisted internet resources were blocked decreased to 3.26%. This is the lowest quarterly figure since the beginning of 2022, and it has decreased by 1.8 times since Q2 2025.

Percentage of ICS computers on which denylisted internet resources were blocked, Q1 2023–Q4 2025

Percentage of ICS computers on which denylisted internet resources were blocked, Q1 2023–Q4 2025

Regionally, the percentage of ICS computers on which denylisted internet resources were blocked ranged from 1.74% in Northern Europe to 3.93% in Southeast Asia, which displaced Africa from first place. Russia rounded out the top three regions for this indicator.

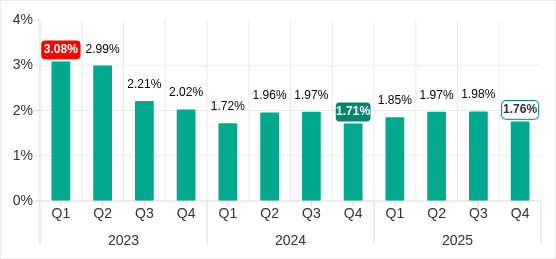
The percentage of ICS computers on which malicious documents were blocked increased for three consecutive quarters. However, in Q4 2025 it decreased by 0.22 pp to 1.76%.

Percentage of ICS computers on which malicious documents were blocked, Q1 2023–Q4 2025

Percentage of ICS computers on which malicious documents were blocked, Q1 2023–Q4 2025

Regionally, the percentage ranged from 0.46% in Northern Europe to 3.82% in Southern Europe. In Q4 2025, the indicator increased in Eastern Europe, Russia, and Western Europe.

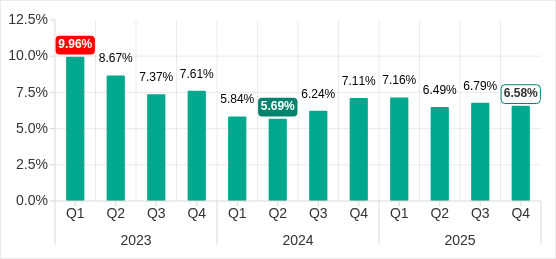
The percentage of ICS computers on which malicious scripts and phishing pages were blocked decreased to 6.58%. Despite the decline, this category led the rankings of threat categories in terms of the percentage of ICS computers on which they were blocked.

Percentage of ICS computers on which malicious scripts and phishing pages were blocked, Q1 2023–Q4 2025

Percentage of ICS computers on which malicious scripts and phishing pages were blocked, Q1 2023–Q4 2025

Regionally, the percentage ranged from 2.52% in Northern Europe to 10.50% in South Asia. The indicator increased in South Asia, South America, Southern Europe, and Africa. South Asia saw the most notable increase, at 3.47 pp.

Next-stage malware

Malicious objects used to initially infect computers deliver next-stage malware β€” spyware, ransomware, and miners β€” to victims’ computers. As a rule, the higher the percentage of ICS computers on which the initial infection malware is blocked, the higher the percentage for next-stage malware.

In Q4 2025, the percentage of ICS computers on which spyware, ransomware and web miners were blocked decreased. The rates were:

  • Spyware: 3.80% (down 0.24 pp). For the second quarter in a row, spyware took second place in the rankings of threat categories in terms of the percentage of ICS computers on which it was blocked.
  • Ransomware: 0.16% (down 0.01 pp).
  • Web miners: 0.24% (down 0.01 pp), this is the lowest level observed thus far in the period under review.

The percentage of ICS computers on which miners in the form of executable files for Windows were blocked increased to 0.60% (up 0.03 pp).

Self-propagating malware

Self-propagating malware (worms and viruses) is a category unto itself. Worms and virus-infected files were originally used for initial infection, but as botnet functionality evolved, they took on next-stage characteristics.

To spread across ICS networks, viruses and worms rely on removable media and network folders and are distributed in the form of infected files, such as archives with backups, office documents, pirated games and hacked applications. In rarer and more dangerous cases, web pages with network equipment settings, as well as files stored in internal document management systems, product lifecycle management (PLM) systems, resource management (ERP) systems and other web services are infected.

In Q4 2025, the percentage of ICS computers on which worms were blocked increased by 1.6 times to 1.60%. As mentioned above, this increase is related to a global phishing attack that spread the Backdoor.MSIL.XWorm backdoor worm across all regions of the world. The percentage increased in all regions. The biggest increase (up by 2.16 times) was in Southern Europe. The malware was primary distributed through email clients, and Southern Europe led the way in terms of the percentage of ICS computers on which threats from email clients were blocked.

The percentage of ICS computers on which viruses were blocked decreased to 1.33%.

AutoCAD malware

This category of malware can spread in a variety of ways, so it does not belong to a specific group.

After an increase in the previous quarter, the percentage of ICS computers on which AutoCAD malware was blocked decreased to 0.29% in Q4 2025.

For more information on industrial threats see the full version of the report.
Threat landscape for industrial automation systems in Q3 2025

25 December 2025 at 11:00

Statistics across all threats

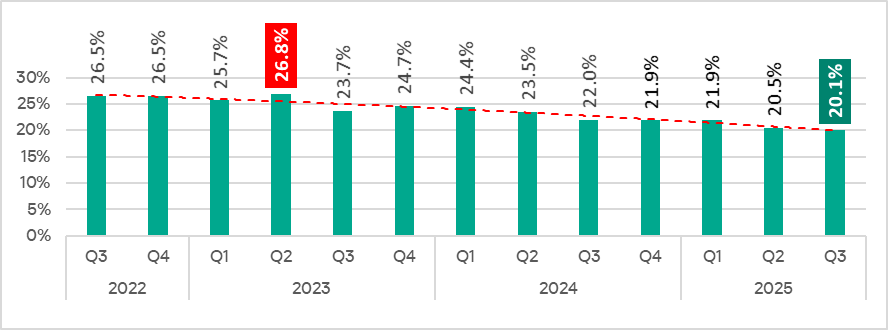
In Q3 2025, the percentage of ICS computers on which malicious objects were blocked decreased from the previous quarter by 0.4 pp to 20.1%. This is the lowest level for the observed period.

Percentage of ICS computers on which malicious objects were blocked, Q3 2022–Q3 2025

Percentage of ICS computers on which malicious objects were blocked, Q3 2022–Q3 2025

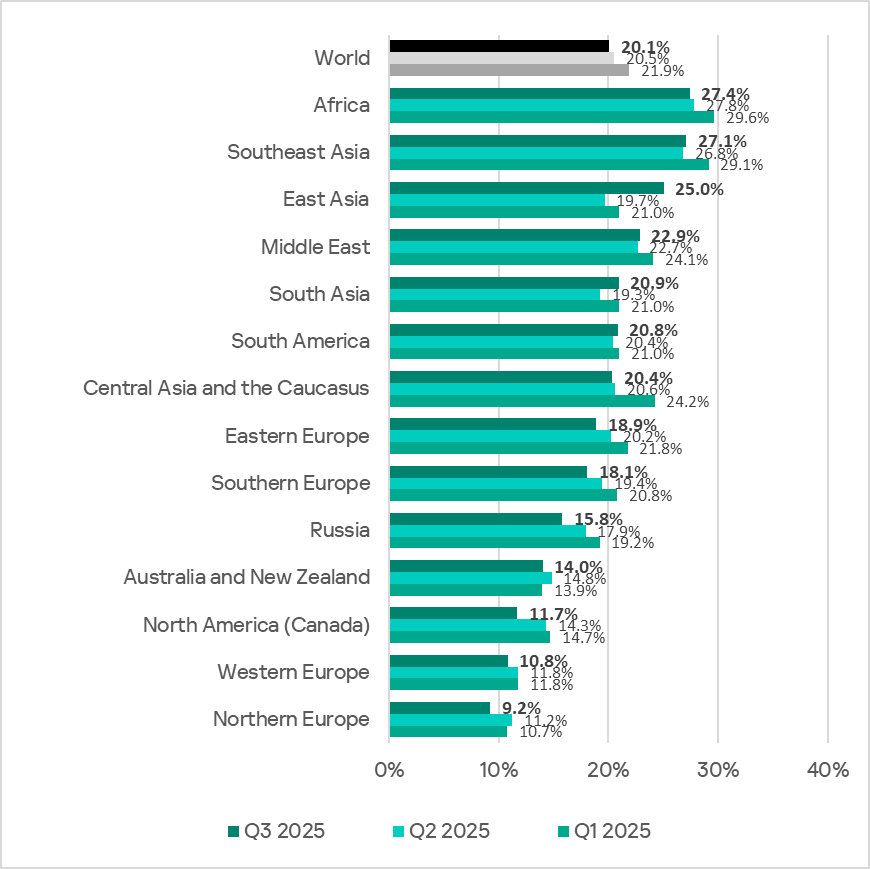
Regionally, the percentage of ICS computers on which malicious objects were blocked ranged from 9.2% in Northern Europe to 27.4% in Africa.

Regions ranked by percentage of ICS computers on which malicious objects were blocked

Regions ranked by percentage of ICS computers on which malicious objects were blocked

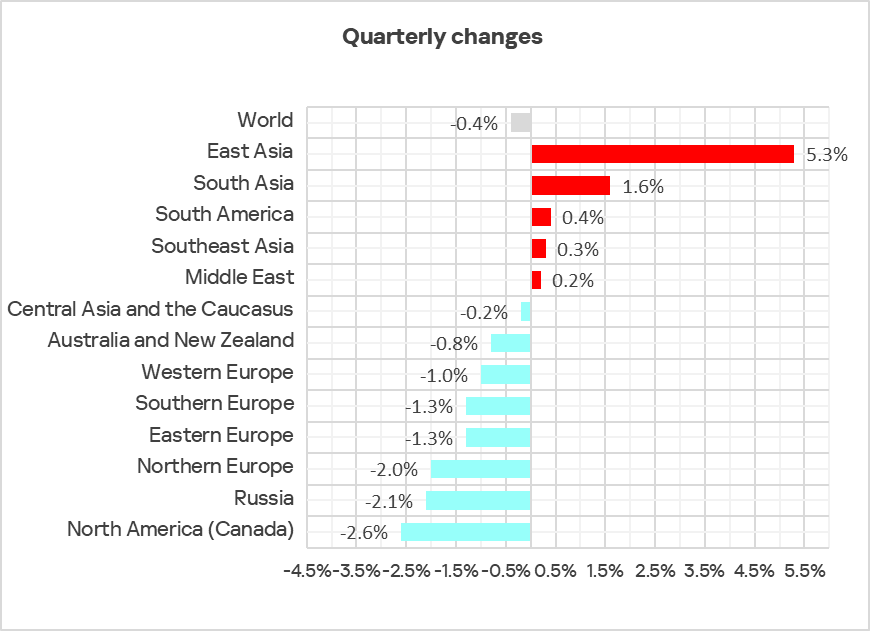
In Q3 2025, the percentage increased in five regions. The most notable increase occurred in East Asia, triggered by the local spread of malicious scripts in the OT infrastructure of engineering organizations and ICS integrators.

Changes in the percentage of ICS computers on which malicious objects were blocked, Q3 2025

Changes in the percentage of ICS computers on which malicious objects were blocked, Q3 2025

Selected industries

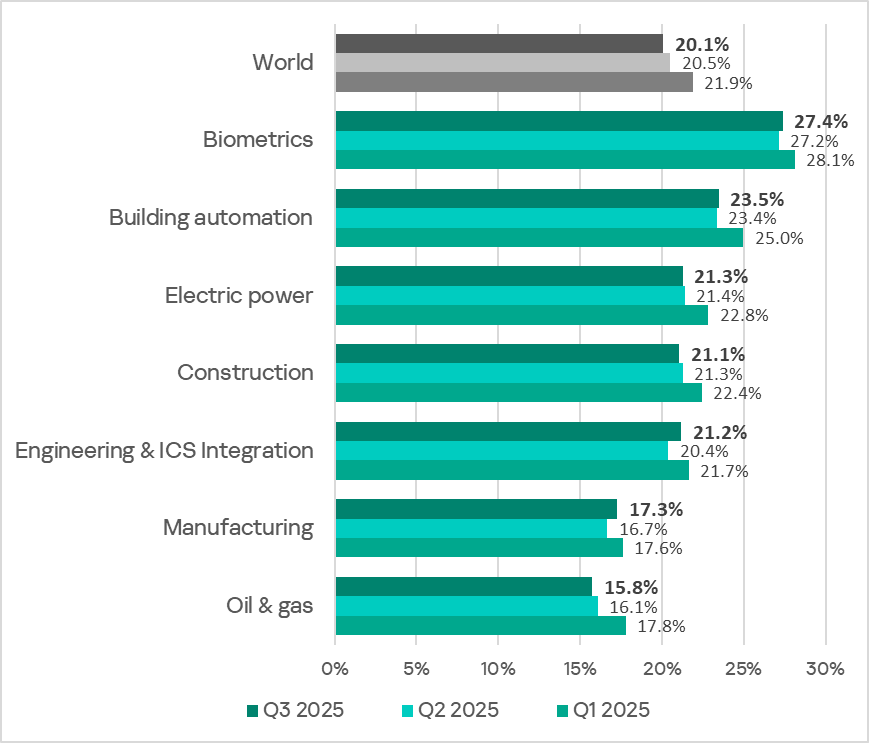
The biometrics sector traditionally led the rankings of the industries and OT infrastructures surveyed in this report in terms of the percentage of ICS computers on which malicious objects were blocked.

Rankings of industries and OT infrastructures by percentage of ICS computers on which malicious objects were blocked

Rankings of industries and OT infrastructures by percentage of ICS computers on which malicious objects were blocked

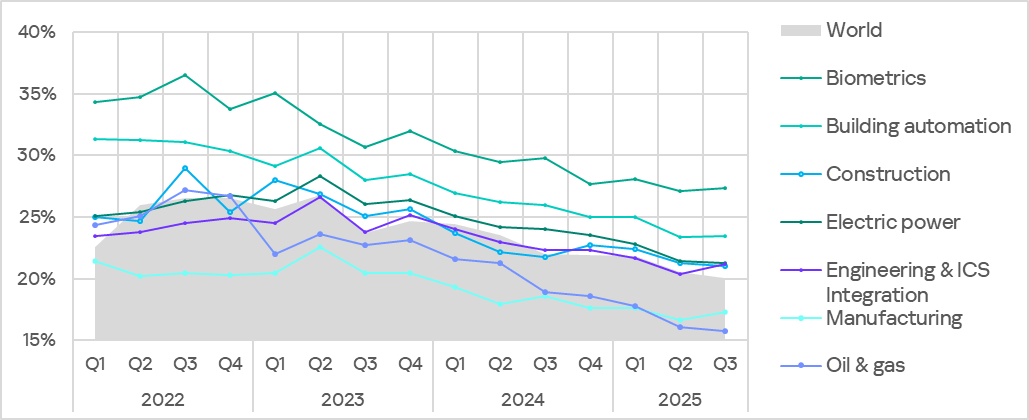
In Q3 2025, the percentage of ICS computers on which malicious objects were blocked increased in four of the seven surveyed industries. The most notable increases were in engineering and ICS integrators, and manufacturing.

Percentage of ICS computers on which malicious objects were blocked in selected industries

Percentage of ICS computers on which malicious objects were blocked in selected industries

Diversity of detected malicious objects

In Q3 2025, Kaspersky protection solutions blocked malware from 11,356 different malware families of various categories on industrial automation systems.

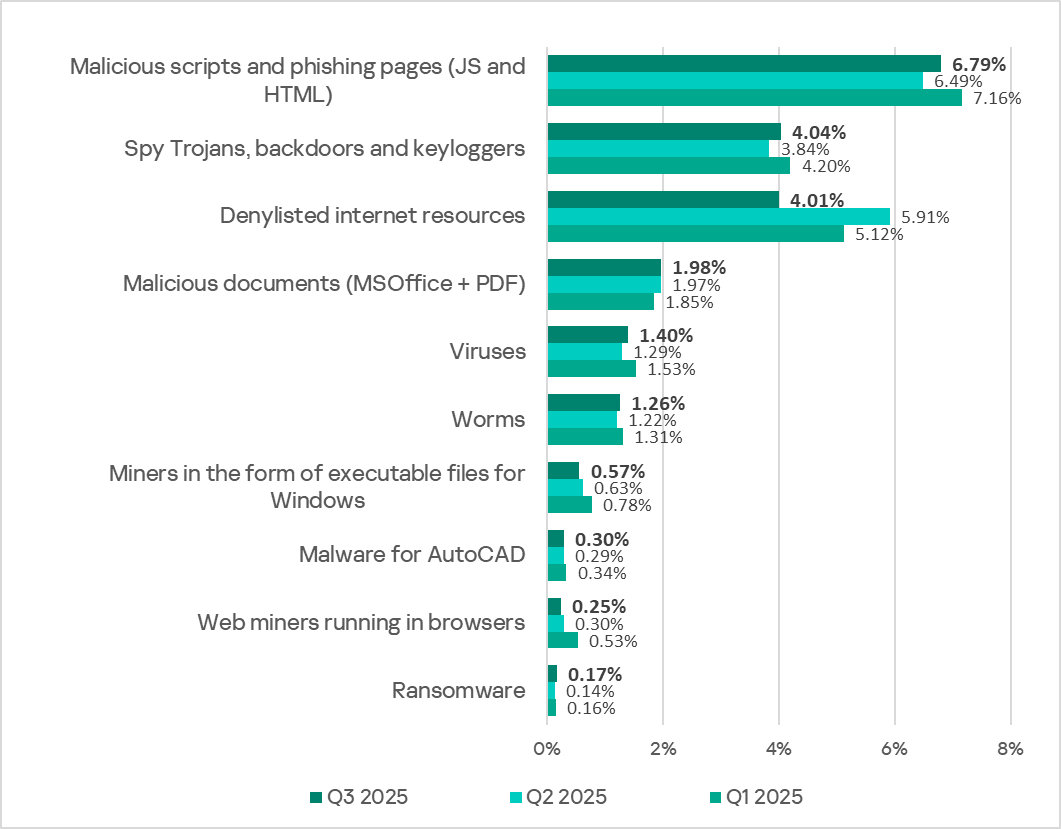
Percentage of ICS computers on which the activity of malicious objects of various categories was blocked

Percentage of ICS computers on which the activity of malicious objects of various categories was blocked

In Q3 2025, there was a decrease in the percentage of ICS computers on which denylisted internet resources and miners of both categories were blocked. These were the only categories that exhibited a decrease.

Main threat sources

Depending on the threat detection and blocking scenario, it is not always possible to reliably identify the source. The circumstantial evidence for a specific source can be the blocked threat’s type (category).

The internet (visiting malicious or compromised internet resources; malicious content distributed via messengers; cloud data storage and processing services and CDNs), email clients (phishing emails), and removable storage devices remain the primary sources of threats to computers in an organization’s technology infrastructure.

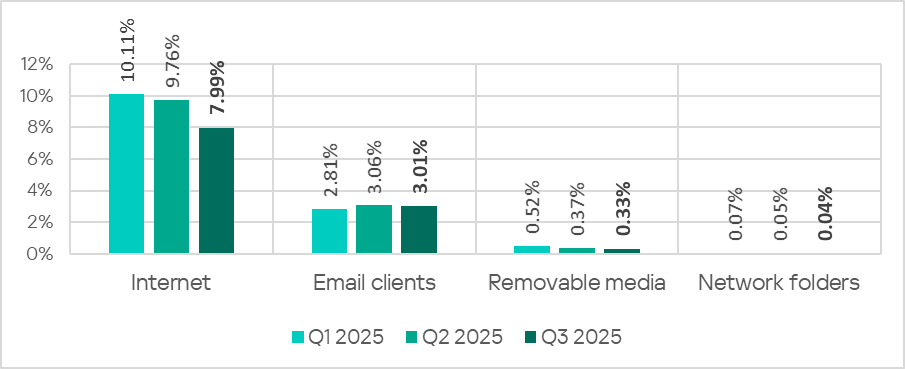
In Q3 2025, the percentage of ICS computers on which malicious objects from various sources were blocked decreased.

Percentage of ICS computers on which malicious objects from various sources were blocked

Percentage of ICS computers on which malicious objects from various sources were blocked

The same computer can be attacked by several categories of malware from the same source during a quarter. That computer is counted when calculating the percentage of attacked computers for each threat category, but is only counted once for the threat source (we count unique attacked computers). In addition, it is not always possible to accurately determine the initial infection attempt. Therefore, the total percentage of ICS computers on which various categories of threats from a certain source were blocked can exceed the percentage of threats from the source itself.

  • The main categories of threats from the internet blocked on ICS computers in Q3 2025 were malicious scripts and phishing pages, and denylisted internet resources. The percentage ranged from 4.57% in Northern Europe to 10.31% in Africa.
  • The main categories of threats from email clients blocked on ICS computers were malicious scripts and phishing pages, spyware, and malicious documents. Most of the spyware detected in phishing emails was delivered as a password-protected archive or a multi-layered script embedded in an office document. The percentage of ICS computers on which threats from email clients were blocked ranged from 0.78% in Russia to 6.85% in Southern Europe.
  • The main categories of threats that were blocked when removable media was connected to ICS computers were worms, viruses, and spyware. The percentage of ICS computers on which threats from this source were blocked ranged from 0.05% in Australia and New Zealand to 1.43% in Africa.
  • The main categories of threats that spread through network folders were viruses, AutoCAD malware, worms, and spyware. The percentages of ICS computers where threats from this source were blocked ranged from 0.006% in Northern Europe to 0.20% in East Asia.

Threat categories

Typical attacks blocked within an OT network are multi-step sequences of malicious activities, where each subsequent step of the attackers is aimed at increasing privileges and/or gaining access to other systems by exploiting the security problems of industrial enterprises, including technological infrastructures.

Malicious objects used for initial infection

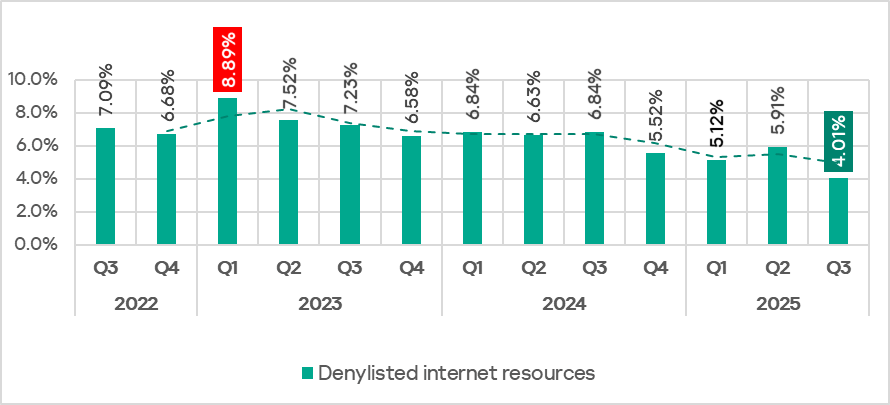
In Q3 2025, the percentage of ICS computers on which denylisted internet resources were blocked decreased to 4.01%. This is the lowest quarterly figure since the beginning of 2022.

Percentage of ICS computers on which denylisted internet resources were blocked, Q3 2022–Q3 2025

Percentage of ICS computers on which denylisted internet resources were blocked, Q3 2022–Q3 2025

Regionally, the percentage of ICS computers on which denylisted internet resources were blocked ranged from 2.35% in Australia and New Zealand to 4.96% in Africa. Southeast Asia and South Asia were also among the top three regions for this indicator.

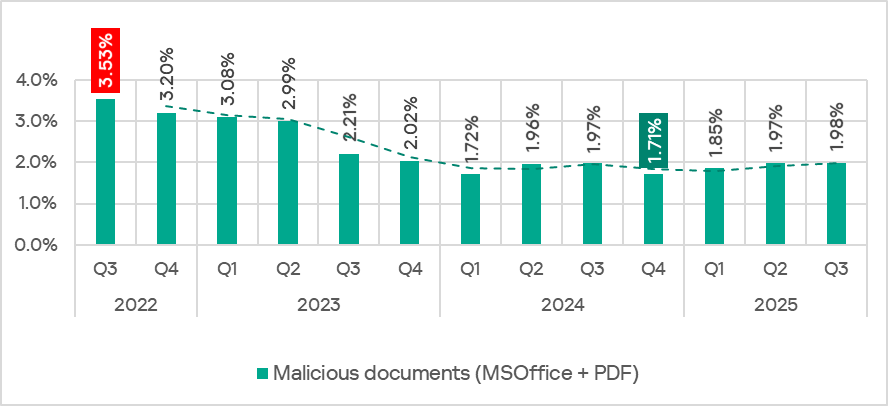
The percentage of ICS computers on which malicious documents were blocked has grown for three consecutive quarters, following a decline at the end of 2024. In Q3 2025, it reached 1,98%.

Percentage of ICS computers on which malicious documents were blocked, Q3 2022–Q3 2025

Percentage of ICS computers on which malicious documents were blocked, Q3 2022–Q3 2025

The indicator increased in four regions: South America, East Asia, Southeast Asia, and Australia and New Zealand. South America saw the largest increase as a result of a large-scale phishing campaign in which attackers used new exploits for an old vulnerability (CVE-2017-11882) in Microsoft Office Equation Editor to deliver various spyware to victims’ computers. It is noteworthy that the attackers in this phishing campaign used localized Spanish-language emails disguised as business correspondence.

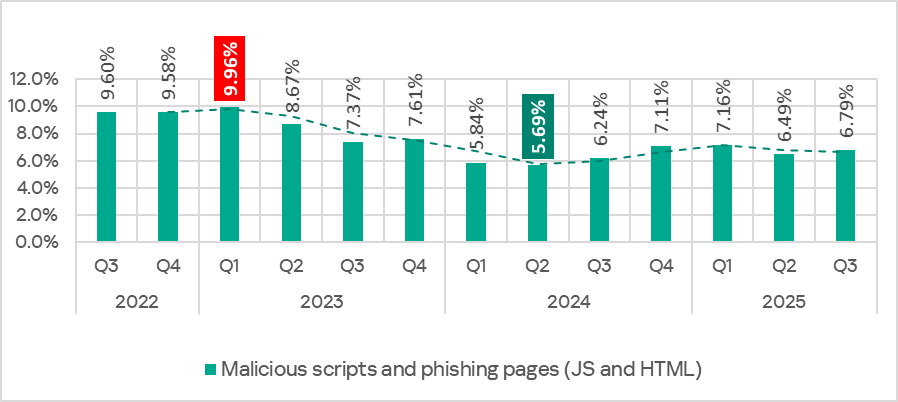
In Q3 2025, the percentage of ICS computers on which malicious scripts and phishing pages were blocked increased to 6.79%. This category led the rankings of threat categories in terms of the percentage of ICS computers on which they were blocked.

Percentage of ICS computers on which malicious scripts and phishing pages were blocked, Q3 2022–Q3 2025

Percentage of ICS computers on which malicious scripts and phishing pages were blocked, Q3 2022–Q3 2025

Regionally, the percentage of ICS computers on which malicious scripts and phishing pages were blocked ranged from 2.57% in Northern Europe to 9.41% in Africa. The top three regions for this indicator were Africa, East Asia, and South America. The indicator increased the most in East Asia (by a dramatic 5.23 pp) as a result of the local spread of malicious spyware scripts loaded into the memory of popular torrent clients including MediaGet.

Next-stage malware

Malicious objects used to initially infect computers deliver next-stage malware β€” spyware, ransomware, and miners β€” to victims’ computers. As a rule, the higher the percentage of ICS computers on which the initial infection malware is blocked, the higher the percentage for next-stage malware.
In Q3 2025, the percentage of ICS computers on which spyware and ransomware were blocked increased. The rates were:

  • spyware: 4.04% (up 0.20 pp);
  • ransomware: 0.17% (up 0.03 pp).

The percentage of ICS computers on which miners of both categories were blocked decreased. The rates were:

  • miners in the form of executable files for Windows: 0.57% (down 0.06 pp), it’s the lowest level since Q3 2022;
  • web miners: 0.25% (down 0.05 pp). This is the lowest level since Q3 2022.

Self-propagating malware

Self-propagating malware (worms and viruses) is a category unto itself. Worms and virus-infected files were originally used for initial infection, but as botnet functionality evolved, they took on next-stage characteristics.

To spread across ICS networks, viruses and worms rely on removable media and network folders in the form of infected files, such as archives with backups, office documents, pirated games and hacked applications. In rarer and more dangerous cases, web pages with network equipment settings, as well as files stored in internal document management systems, product lifecycle management (PLM) systems, resource management (ERP) systems and other web services are infected.

In Q3 2025, the percentage of ICS computers on which worms and viruses were blocked increased to 1.26% (by 0.04 pp) and 1.40% (by 0.11 pp), respectively.

AutoCAD malware

This category of malware can spread in a variety of ways, so it does not belong to a specific group.

In Q3 2025, the percentage of ICS computers on which AutoCAD malware was blocked slightly increased to 0.30% (by 0.01 pp).

For more information on industrial threats see the full version of the report.
God Mode On: how we attacked a vehicle’s head unit modem

16 December 2025 at 11:00

Introduction

Imagine you’re cruising down the highway in your brand-new electric car. All of a sudden, the massive multimedia display fills with Doom, the iconic 3D shooter game. It completely replaces the navigation map or the controls menu, and you realize someone is playing it remotely right now. This is not a dream or an overactive imagination – we’ve demonstrated that it’s a perfectly realistic scenario in today’s world.

The internet of things now plays a significant role in the modern world. Not only are smartphones and laptops connected to the network, but also factories, cars, trains, and even airplanes. Most of the time, connectivity is provided via 3G/4G/5G mobile data networks using modems installed in these vehicles and devices. These modems are increasingly integrated into a System-on-Chip (SoC), which uses a Communication Processor (CP) and an Application Processor (AP) to perform multiple functions simultaneously. A general-purpose operating system such as Android can run on the AP, while the CP, which handles communication with the mobile network, typically runs on a dedicated OS. The interaction between the AP, CP, and RAM within the SoC at the microarchitecture level is a β€œblack box” known only to the manufacturer – even though the security of the entire SoC depends on it.

Bypassing 3G/LTE security mechanisms is generally considered a purely academic challenge because a secure communication channel is established when a user device (User Equipment, UE) connects to a cellular base station (Evolved Node B, eNB). Even if someone can bypass its security mechanisms, discover a vulnerability in the modem, and execute their own code on it, this is unlikely to compromise the device’s business logic. This logic (for example, user applications, browser history, calls, and SMS on a smartphone) resides on the AP and is presumably not accessible from the modem.

To find out, if that is true, we conducted a security assessment of a modern SoC, Unisoc UIS7862A, which features an integrated 2G/3G/4G modem. This SoC can be found in various mobile devices by multiple vendors or, more interestingly, in the head units of modern Chinese vehicles, which are becoming increasingly common on the roads. The head unit is one of a car’s key components, and a breach of its information security poses a threat to road safety, as well as the confidentiality of user data.

During our research, we identified several critical vulnerabilities at various levels of the Unisoc UIS7862A modem’s cellular protocol stack. This article discusses a stack-based buffer overflow vulnerability in the 3G RLC protocol implementation (CVE-2024-39432). The vulnerability can be exploited to achieve remote code execution at the early stages of connection, before any protection mechanisms are activated.

Importantly, gaining the ability to execute code on the modem is only the entry point for a complete remote compromise of the entire SoC. Our subsequent efforts were focused on gaining access to the AP. We discovered several ways to do so, including leveraging a hardware vulnerability in the form of a hidden peripheral Direct Memory Access (DMA) device to perform lateral movement within the SoC. This enabled us to install our own patch into the running Android kernel and execute arbitrary code on the AP with the highest privileges. Details are provided in the relevant sections.

Acquiring the modem firmware

The modem at the center of our research was found on the circuit board of the head unit in a Chinese car.

Circuit board of the head unit

Circuit board of the head unit

Description of the circuit board components:

Number in the board photo Component
1 Realtek RTL8761ATV 802.11b/g/n 2.4G controller with wireless LAN (WLAN) and USB interfaces (USB 1.0/1.1/2.0 standards)
2 SPRD UMW2652 BGA WiFi chip
3 55966 TYADZ 21086 chip
4 SPRD SR3595D (Unisoc) radio frequency transceiver
5 Techpoint TP9950 video decoder
6 UNISOC UIS7862A
7 BIWIN BWSRGX32H2A-48G-X internal storage, Package200-FBGA, ROM Type – Discrete, ROM Size – LPDDR4X, 48G
8 SCY E128CYNT2ABE00 EMMC 128G/JEDEC memory card
9 SPREADTRUM UMP510G5 power controller
10 FEI.1s LE330315 USB2.0 shunt chip
11 SCT2432STER synchronous step-down DC-DC converter with internal compensation

Using information about the modem’s hardware, we desoldered and read the embedded multimedia memory card, which contained a complete image of its operating system. We then analyzed the image obtained.

Remote access to the modem (CVE-2024-39431)

The modem under investigation, like any modern modem, implements several protocol stacks: 2G, 3G, and LTE. Clearly, the more protocols a device supports, the more potential entry points (attack vectors) it has. Moreover, the lower in the OSI network model stack a vulnerability sits, the more severe the consequences of its exploitation can be. Therefore, we decided to analyze the data packet fragmentation mechanisms at the data link layer (RLC protocol).

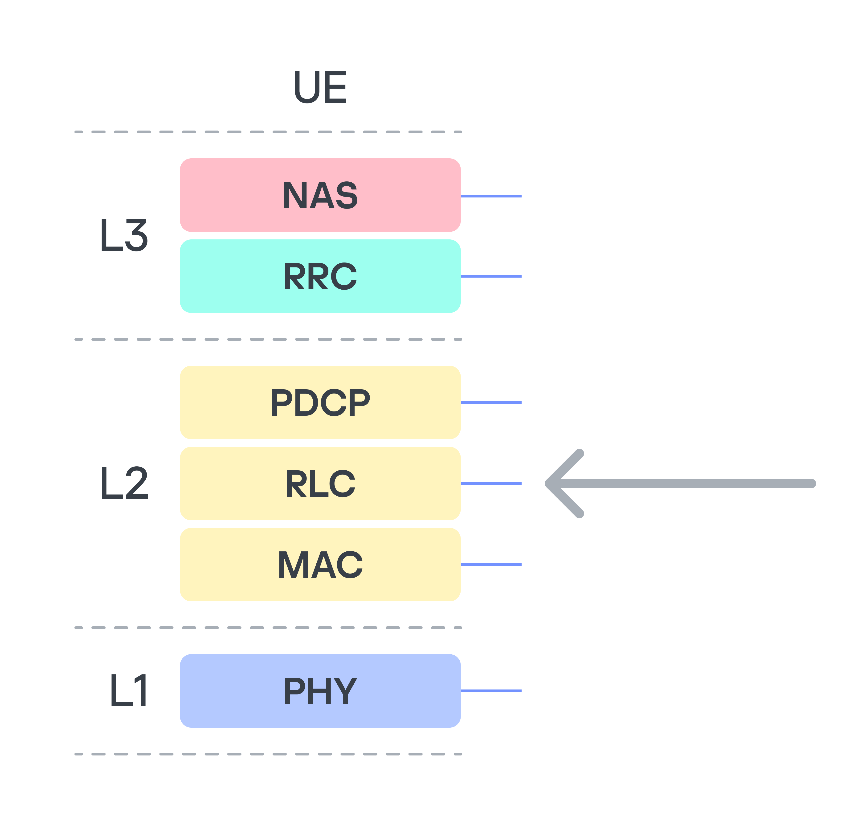
We focused on this protocol because it is used to establish a secure encrypted data transmission channel between the base station and the modem, and, in particular, it is used to transmit higher-layer NAS (Non-Access Stratum) protocol data. NAS represents the functional level of the 3G/UMTS protocol stack. Located between the user equipment (UE) and core network, it is responsible for signaling between them. This means that a remote code execution (RCE) vulnerability in RLC would allow an attacker to execute their own code on the modem, bypassing all existing 3G communication protection mechanisms.

3G protocol stack

3G protocol stack

The RLC protocol uses three different transmission modes: Transparent Mode (TM), Unacknowledged Mode (UM), and Acknowledged Mode (AM). We are only interested in UM, because in this mode the 3G standard allows both the segmentation of data and the concatenation of several small higher-layer data fragments (Protocol Data Units, PDU) into a single data link layer frame. This is done to maximize channel utilization. At the RLC level, packets are referred to as Service Data Units (SDU).

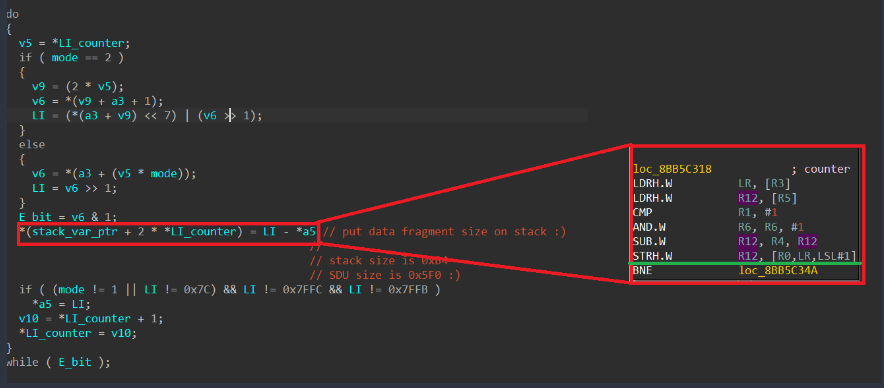
Among the approximately 75,000 different functions in the firmware, we found the function for handling an incoming SDU packet. When handling a received SDU packet, its header fields are parsed. The packet itself consists of a mandatory header, optional headers, and data. The number of optional headers is not limited. The end of the optional headers is indicated by the least significant bit (E bit) being equal to 0. The algorithm processes each header field sequentially, while their E-bits equal 1. During processing, data is written to a variable located on the stack of the calling function. The stack depth is 0xB4 bytes. The size of the packet that can be parsed (i.e., the number of headers, each header being a 2-byte entry on the stack) is limited by the SDU packet size of 0x5F0 bytes.

As a result, exploitation can be achieved using just one packet in which the number of headers exceeds the stack depth (90 headers). It is important to note that this particular function lacks a stack canary, and when the stack overflows, it is possible to overwrite the return address and some non-volatile register values in this function. However, overwriting is only possible with a value ending in one in binary (i.e., a value in which the least significant bit equals 1). Notably, execution takes place on ARM in Thumb mode, so all return addresses must have the least significant bit equal to 1. Coincidence? Perhaps.

In any case, sending the very first dummy SDU packet with the appropriate number of β€œcorrect” headers caused the device to reboot. However, at that moment, we had no way to obtain information on where and why the crash occurred (although we suspect the cause was an attempt to transfer control to the address 0xAABBCCDD, taken from our packet).

Gaining persistence in the system

The first and most important observation is that we know the pointer to the newly received SDU packet is stored in register R2. Return Oriented Programming (ROP) techniques can be used to execute our own code, but first we need to make sure it is actually possible.

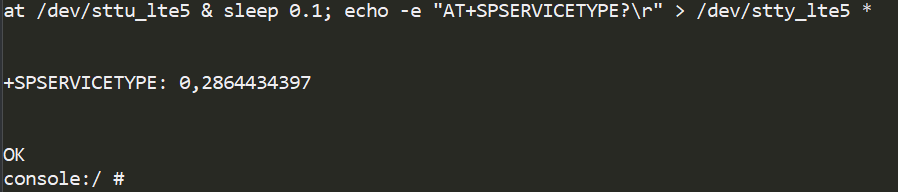
We utilized the available AT command handler to move the data to RAM areas. Among the available AT commands, we found a suitable function – SPSERVICETYPE.

Next, we used ROP gadgets to overwrite the address 0x8CE56218 without disrupting the subsequent operation of the incoming SDU packet handling algorithm. To achieve this, it was sufficient to return to the function from which the SDU packet handler was called, because it was invoked as a callback, meaning there is no data linkage on the stack. Given that this function only added 0x2C bytes to the stack, we needed to fit within this size.

Stack overflow in the context of the operating system

Stack overflow in the context of the operating system

Having found a suitable ROP chain, we launched an SDU packet containing it as a payload. As a result, we saw the output 0xAABBCCDD in the AT command console for SPSERVICETYPE. Our code worked!

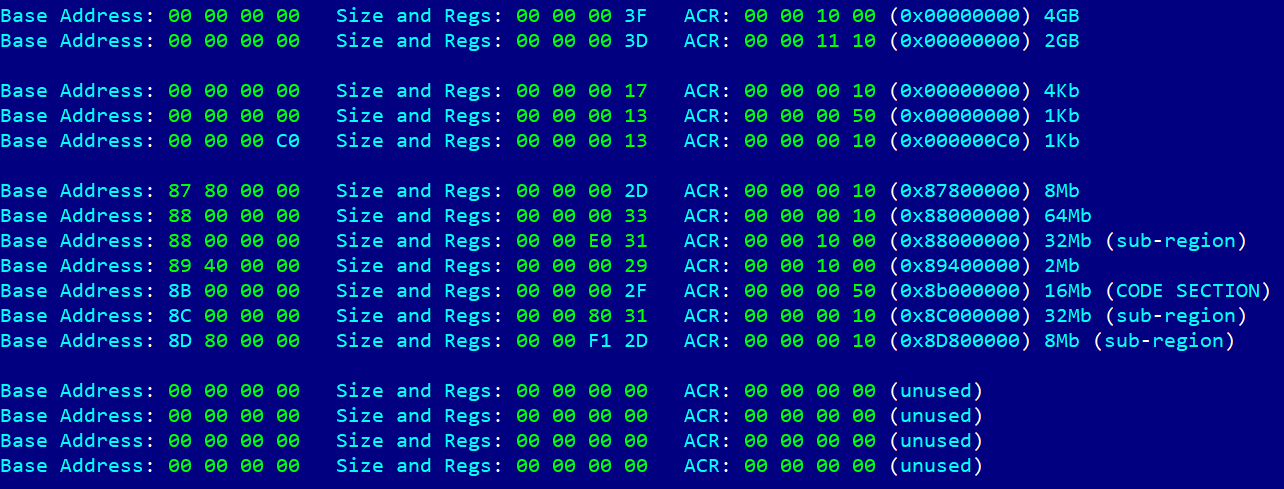
Next, by analogy, we input the address of the stack frame where our data was located, but it turned out not to be executable. We then faced the task of figuring out the MPU settings on the modem. Once again, using the ROP chain method, we generated code that read the MPU table, one DWORD at a time. After many iterations, we obtained the following table.

The table shows what we suspected – the code section is only mapped for execution. An attempt to change the configuration resulted in another ROP chain, but this same section was now mapped with write permissions in an unused slot in the table. Because of MPU programming features, specifically the presence of the overlap mechanism and the fact that a region with a higher ID has higher priority, we were able to write to this section.

All that remained was to use the pointer to our data (still stored in R2) and patch the code section that had just been unlocked for writing. The question was what exactly to patch. The simplest method was to patch the NAS protocol handler by adding our code to it. To do this, we used one of the NAS protocol commands – MM information. This allowed us to send a large amount of data at once and, in response, receive a single byte of data using the MM status command, which confirmed the patching success.

As a result, we not only successfully executed our own code on the modem side but also established full two-way communication with the modem, using the high-level NAS protocol as a means of message delivery. In this case, it was an MM Status packet with the cause field equaling 0xAA.

However, being able to execute our own code on the modem does not give us access to user data. Or does it?

The full version of the article with a detailed description of the development of an AR exploit that led to Doom being run on the head unit is available on ICS CERT website.

❌