
Normal view

DEW #155 - Gems from the 2026 Trenches

6 May 2026 at 14:03

Welcome to Issue #155 of Detection Engineering Weekly!

This week, I’m resurfacing some of my favorite Gems over the last five months. We’ll be back to our regularly scheduled newsletter starting next week!

Every week, I read, watch and listen to all the Detection Engineering content so you can consume it all in 10 minutes. Subscribe and get a weekly digest of the latest and greatest in threat detection engineering!

✍️ Musings from the life of Zack:

  • I’ve officially christened yard work shoes with an old pair of white sneakers. I just need some cargo pants, a cell phone clip attached to my hip, and a Bluetooth headset to really complete the outfit

  • I saw my friends playing Slay the Spire 2 on Steam, so I got it, and it’s so addictive! You know it’s bad when you think about game mechanics on your drive to the gym or between work meetings

  • Proud Dad moment: my daughter had her first-ever ballet recital, and she crushed it. She was in an auditorium with over 100 people, and she was in the youngest age group. She was all smiles and even found us in the crowd and waved


Detection Pipeline Maturity Model by Scott Plastine

I’m a huge fan of maturity models, and in the early days of my writing, I frequently referenced the work of Haider Dost and Kyle Bailey when discussing the maturity of detection engineering programs. As this space matured, technology matured with it, and we now have complex systems within each part of the Detection Engineering Lifecycle. So, to me, it makes sense that we now have folks like Plastine helping us understand what it means to measure the maturity of a Detection Pipeline.

Plastine outlines six different levels of maturity, starting with a classic favorite, no maturity! This involves having a security tool stack with no centralization, and analysts have dozens to hundreds of Google Chrome tabs open which gives me anxiety. The fundamental issues Plastine outlines and continues to improve here include:

  • Several security tools with their own alerting and detection systems

  • The need to log into and investigate each alert on each individual tool, so managing screen sprawl

  • The analyst manually building cases in some case management or ticketing tool, such as JIRA or ServiceNow

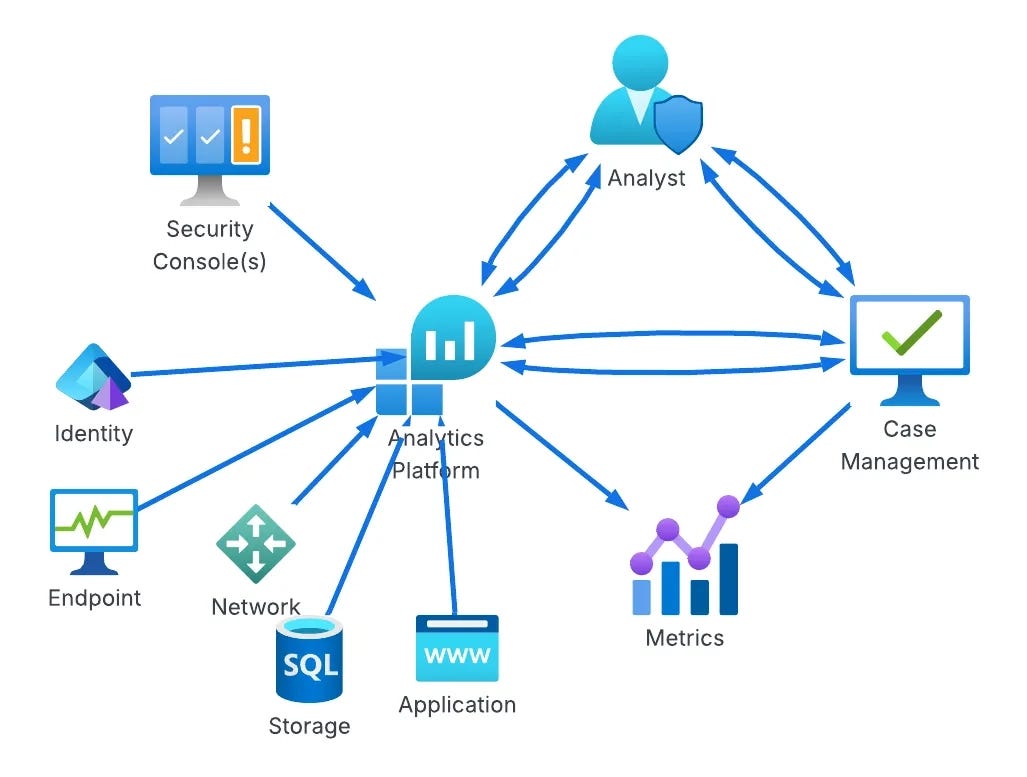
The next maturity step, Basic, addresses some of these issues by essentially placing the Case Management tool between the tools and the analyst, rather than being out of band. As maturity levels progress, so does the architecture of this setup. For example, the “Standard+” architecture has a much saner pipeline setup:
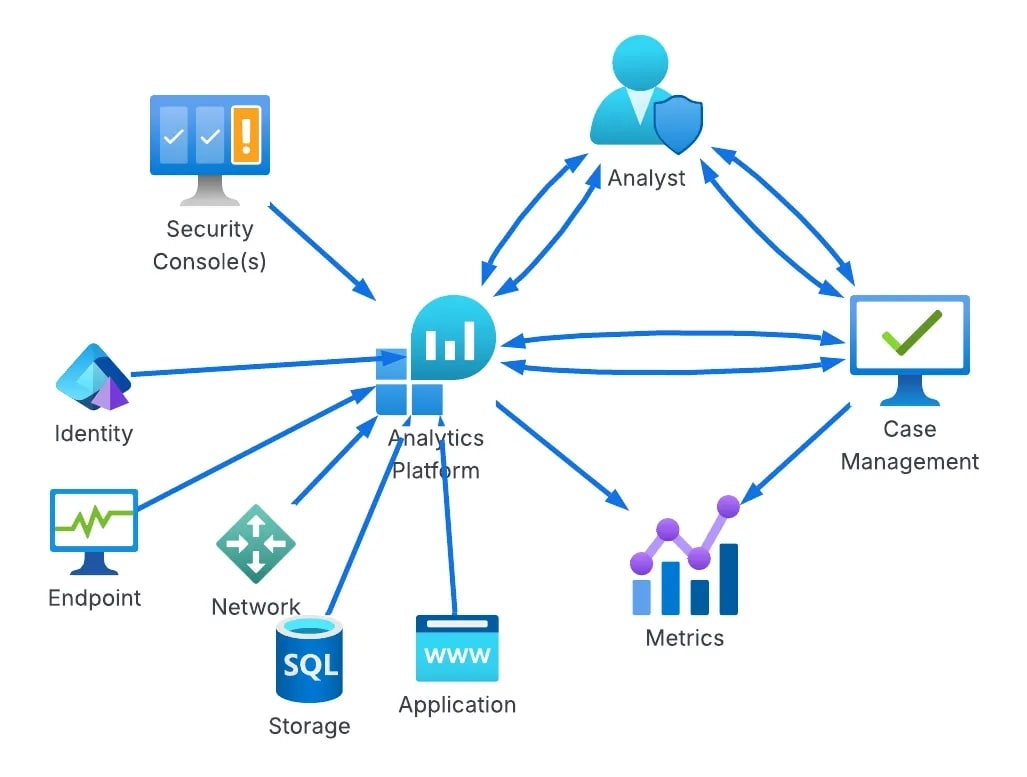
The cool part at this point in the maturity journey is switching from architecture improvements to more advanced concepts in the analytics platform. Custom telemetry, log normalization, and a risk-based alerting engine ideally surface only relevant alerts and reduce false positives. Teams begin to build composite rules, leveraging commercial detections alongside their own internal detection and risk alerting systems, and they all take advantage of learning from their data to inform their rule sets, not just their environment.

This diagram drove it home for me, and became my favorite:
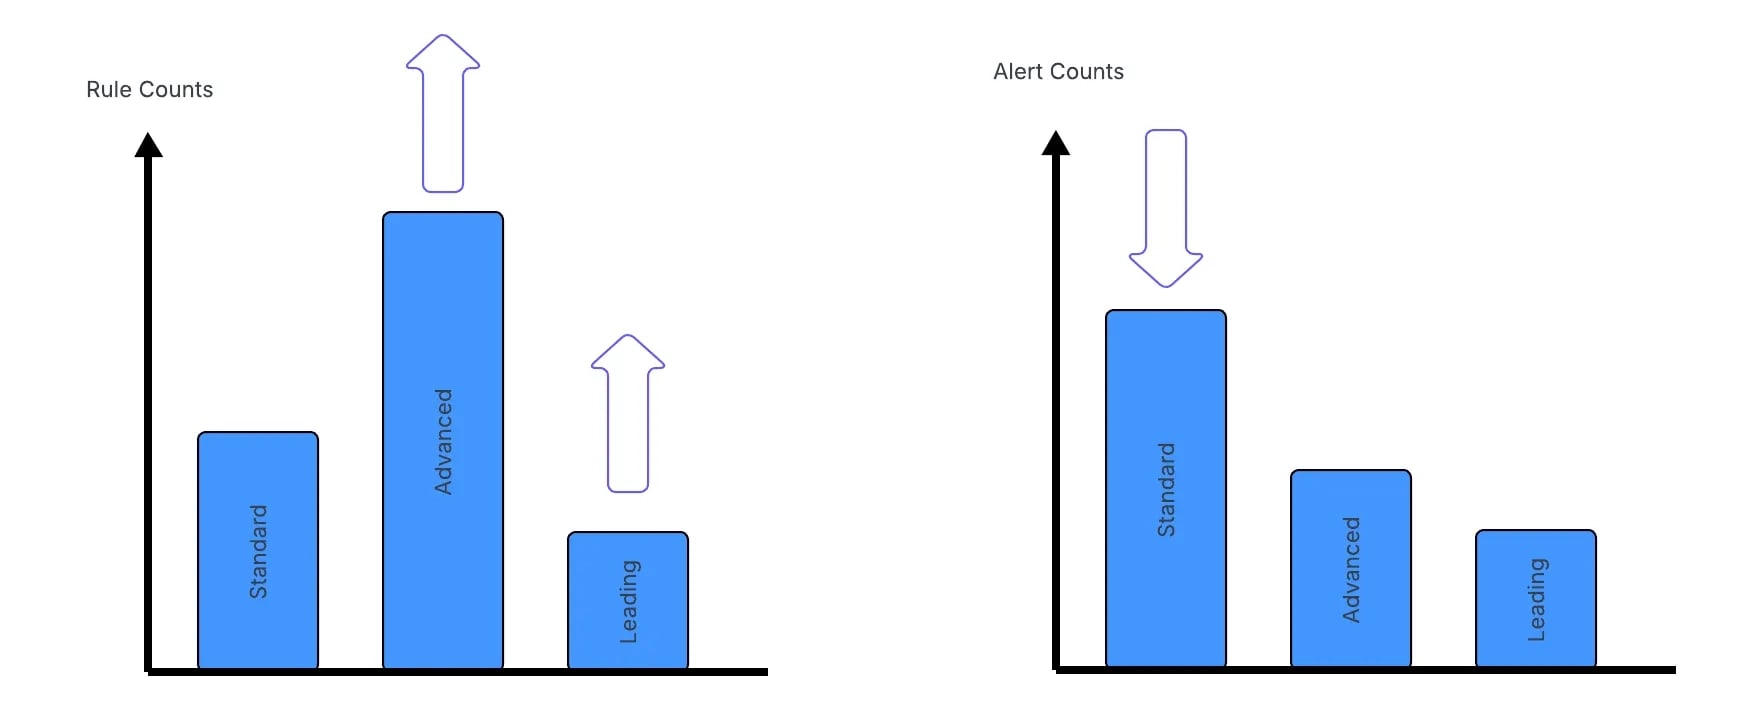
As you progress through maturity, the trap teams fall into is more rules is better. I think the measure of a Leading detection function is reducing rule count thereby reducing the complexity of managing rule sprawl.

Plastine posits that this can be achieved by using data-science-based rules, risk-based detection, and leveraging as much entity-based correlation as possible.


TTPI’s: Extending the Classic Model by Andrew VanVleet

Tactics, Techniques & Procedures (TTPs) is a table-stakes term in our industry. It binds our understanding of attacker behavior into a common lexicon. Within this lexicon, MITRE ATT&CK reigns supreme, and they have some generally agreed-upon definitions within their ATT&CK FAQ. Basically, in order to understand MITRE ATT&CK, you have to understand their nomenclature of TTPs, where:

  • Tactics describe an adversarial objective, such as initial access

  • Techniques describe how an attacker can execute some operation to achieve that objective

  • Procedures describe the implementation details of a technique in a given environment

In this post, VanVleet challenges this model because the specific details of how an attack is carried out at the Procedure level can sometimes be vague. I think this is by design on MITRE’s part, because the procedure to achieve it can differ depending on the environmental context I mentioned earlier. He makes the analogy that Procedures are like a cake, not necessarily a recipe. He proposes the concept of Instance, which is the recipe itself, to achieve that procedure.

ATT&CK does get close to this via Detection Strategies. As an example, VanVleet looks at T1070.001, Indicator Removal: Clear Windows Event Logs. The MITRE page includes a description of how this can be achieved, but it seems high-level enough that some more detail on the recipe would be helpful. The detection strategy can provide more clues from an event-ID perspective, but without the technical implementation, it may be hard to recreate and test. Here’s his idea of what an Instance section could look like:
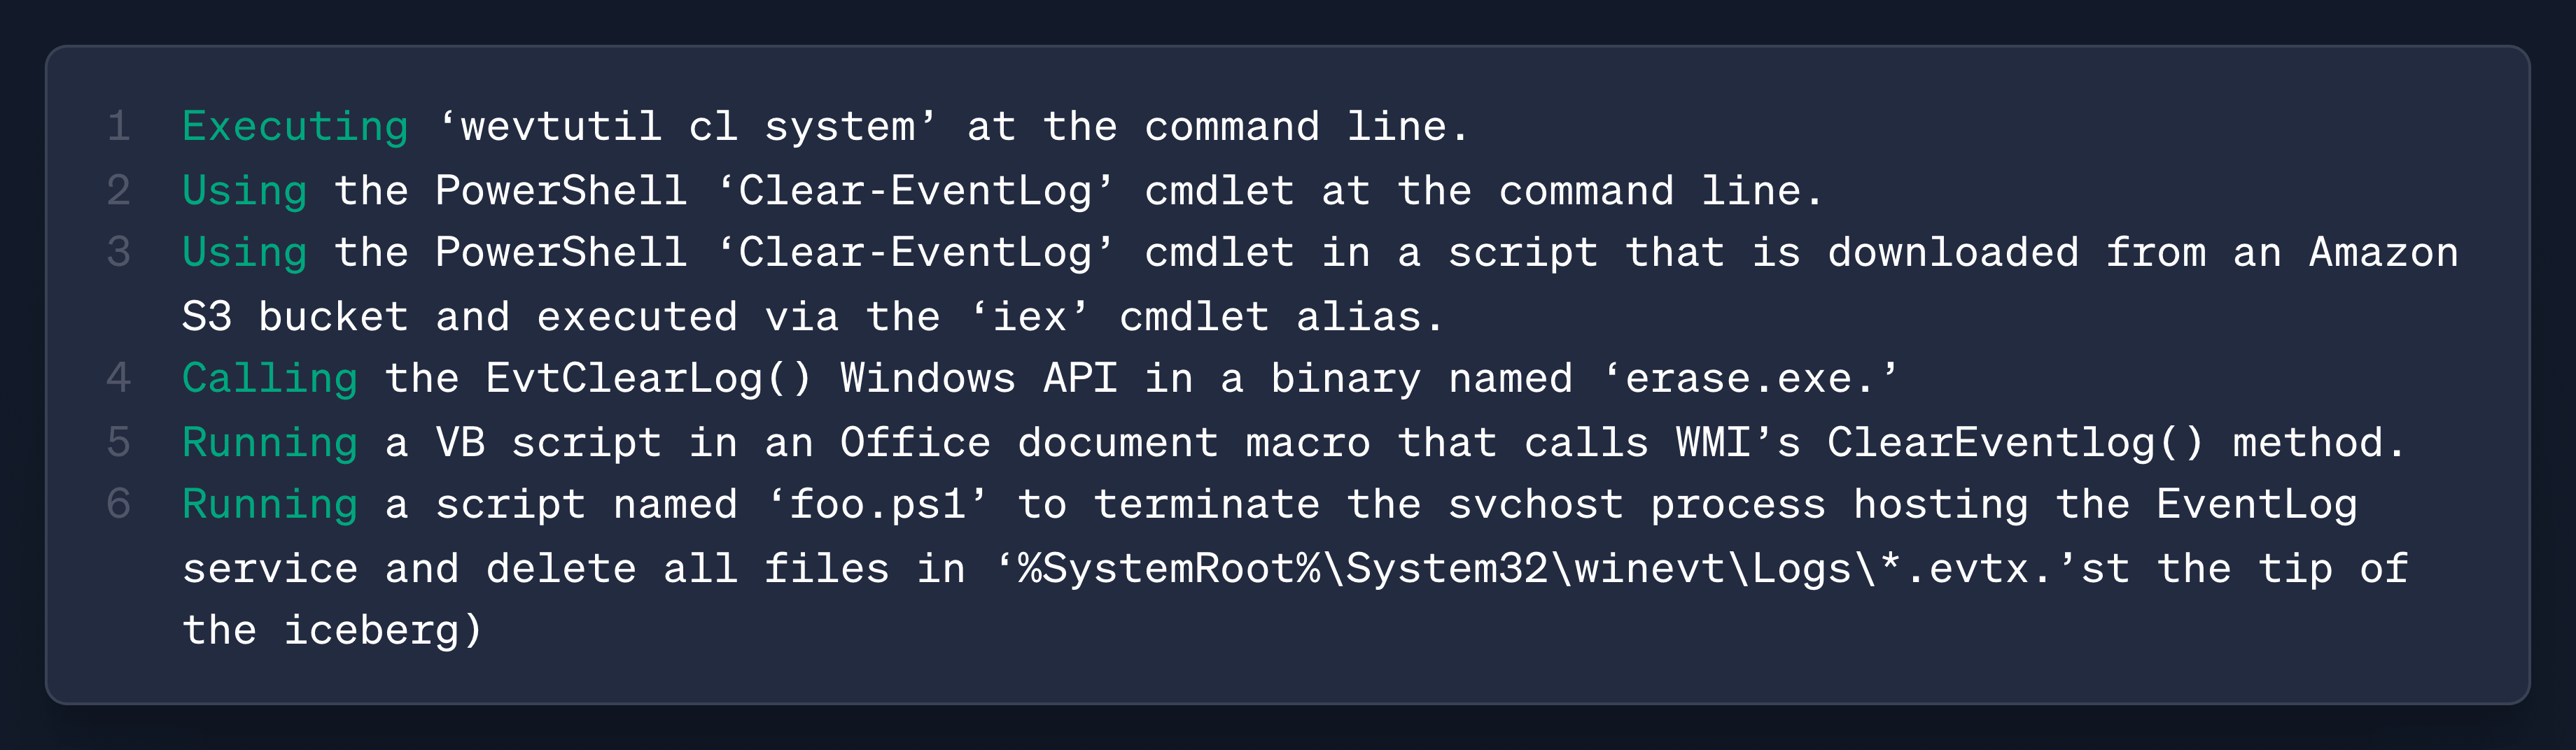
This could be helpful for detection engineers who want to recreate the attack in their own environment to test their telemetry generation and detection rules.

I’ve always had a hard time with the Pyramid of Pain for this exact reason. The “TTPs” part at the top of the Pyramid can encapsulate so much work, without any ability to reverse-engineer how the attack is captured. In fact, I’ve always thought TTPs/Tools should be combined, because almost every Procedure contains some level of tooling to capture the attack.

In the spirit of alliteration, and perhaps more as a thought exercise, he proposes the “Pyramid of Permanence”.
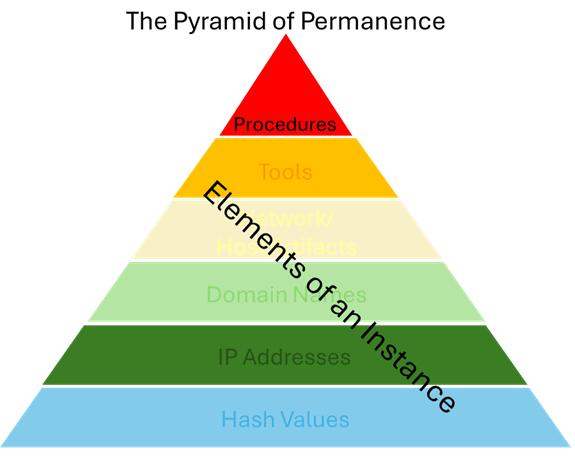
Basically, Procedures are what we want to capture, and everything below the tip of the Pyramid are Instances that supports the procedure. It’s an interesting thought experiment, and as long as it serves as a lexicon to drive the conversation on better modeling, I’m all for it.


Centralized Suppression Management for Detections Using Macros & Lookups by Harrison Pomeroy

Detection rule efficacy is the practice of curating rule sets that balance precision, recall, and the cost of triage. New detection engineers typically think about rules being the only place you can apply logic to help manage this balance. A more precise query that accounts for benign behaviors, given the tactic or technique, can increase the likelihood of capturing true positives. But there are other capabilities in SIEM technologies and software engineering practices that can perform filtering and suppress alerts in more dynamic, context-aware ways that align with the threat landscape or your environment.

This post by Harrison Pomeroy details the power of Splunk’s macro and lookup table functionality to perform suppression of alerts without re-deploying rules. A suppression is a concept in which detection engineers deploy a capability to dynamically mute alerts, thereby reducing the cost of both false-positive generation and the subsequent need to tune a rule on small fields. It also makes the rule more resilient because it can account for external factors related to benign behaviors, such as known service accounts, scheduled tasks, or internal tooling.

Harrison leverages Splunk’s macro and lookup table features to achieve this.
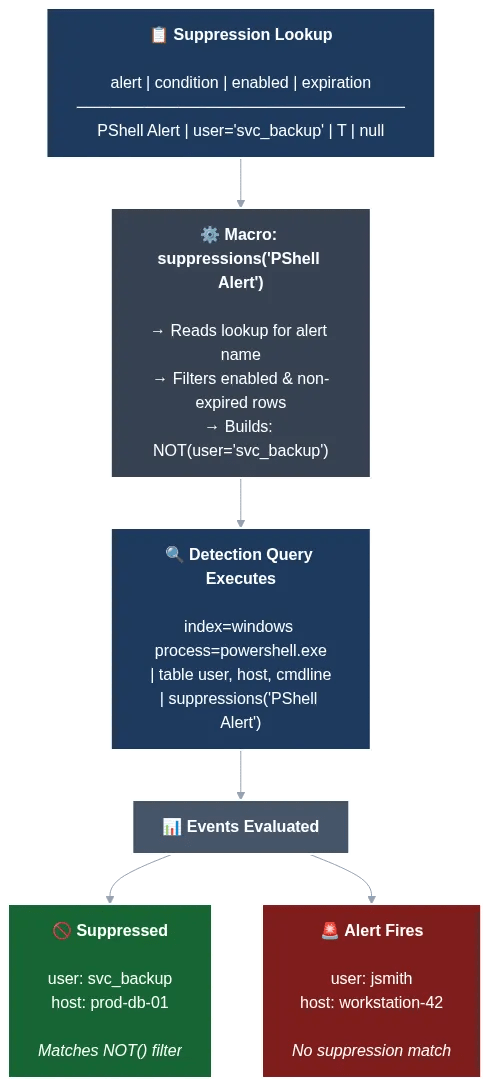
The above Mermaid diagram shows his really clever setup. When you apply macros to each of your Splunk rules, you can start bringing in logic to evaluate whether suppressions are enabled for the rule (the T value), and then specify a lookup table to find additional alert logic to append to your original rule to suppress false positives.

The above example suppresses alerting on any user called svc_backup. The macro executes based on the T value and performs a lookup in a table relevant to the PShell Alert rule. svc_backup is in the table and uses a NOT() filter to prevent an alert if svc_backup is present. The suppressed green box ensures the alert doesn’t fire, and the Alert red box fires because the user is jsmith.

This type of suppression occurs at query time, before the alert is generated. There are other suppressions you can apply before a log hits the index, or after the alert fires. This is a great topic for my Field Manual series, so thank you, Harrison, for the inspiration!

👉️ Read Online if Clipped 👈️


The Detection Engineering Baseline: Hypothesis and Structure (Part 1) by Brandon Lyons

Baselining is an overused term in this field because, at least in my experience, it’s a hand-wavy marketing term. You’ll read about a product that’ll perform baselines of your behavior and environment, and it’ll alert you if it detects something abnormal or outside that baseline. In practice, this works, but the opaqueness of some of these methods makes it hard to understand how it happens.

This is why posts like Lyons help cut through the opaqueness and show the receipts of how to do this in practice. And to be honest, it’s nothing groundbreaking, only in the sense that the concepts Lyons proposes here are part of entry-level statistics literacy. Which is why I’m pretty opinionated on the engineer of detection engineer. Don’t get it twisted: although the concepts in this post are entry-level statistics, understanding the application requires deep security expertise.

Lyons lays out a 7-step, repeatable process to establish a detection baseline, quoted here:

  • Backtesting of rule logic: Validate your detection against historical data before deploying

  • Codified thought process: Document why you chose specific thresholds and methods

  • Historical context: Capture what your environment looked like when the baseline was created

  • Reproducible process: Enable re-running when tuning or validating detection logic

  • Foundation for the ADS: Feed directly into your Alerting Detection Strategy documentation

  • Cross-team collaboration fuel: Surface insecure patterns and workflows with data-backed evidence

  • Threat hunting runway: When alert precision isn’t achievable, convert the baseline into a scheduled hunt

This process succinctly captures a well-thought-out detection process. Without data, how can anyone possibly deploy detections that will fire? Without context around that data, how can anyone possibly believe the rules that are firing outside of the baseline?

They step through the 7 steps here using a CloudTrail API example. Basically, Lyons tries to map out what anomalous behavior looks like for CloudTrail access across an environment. The statistics section focuses on a modified Z-Score. Here’s the rundown:

Security metrics (API calls per day, login attempts per hour, file accesses) approximate a normal distribution (a bell curve), especially when aggregated over time. This means that:

  • Most values cluster around the median (middle value)

  • Extreme values become increasingly rare as you move away from the center

  • The distribution is symmetric

To establish a baseline, Lyons collects historical data, such as 30 days of activity, and computes two key statistics:

  • Median - the middle value

  • MAD (Median Absolute Deviation) - measures spread around the median

When a new value enters your queue, you compute the Modified Z-score, which is the distance-via-standard-deviation of that value from the median. Modified Z-score is really good at capturing outliers, versus the regular Z-score, which focuses on standard deviations from the mean, and can be sensitive to outliers.

An outlier can be, according to Lyons, creating administrative credentials at 3am to an abnormal amount of S3 bucket accesses, perhaps used for exfiltration. Here’s a graphic I prompted Claude to create to drive this point home:
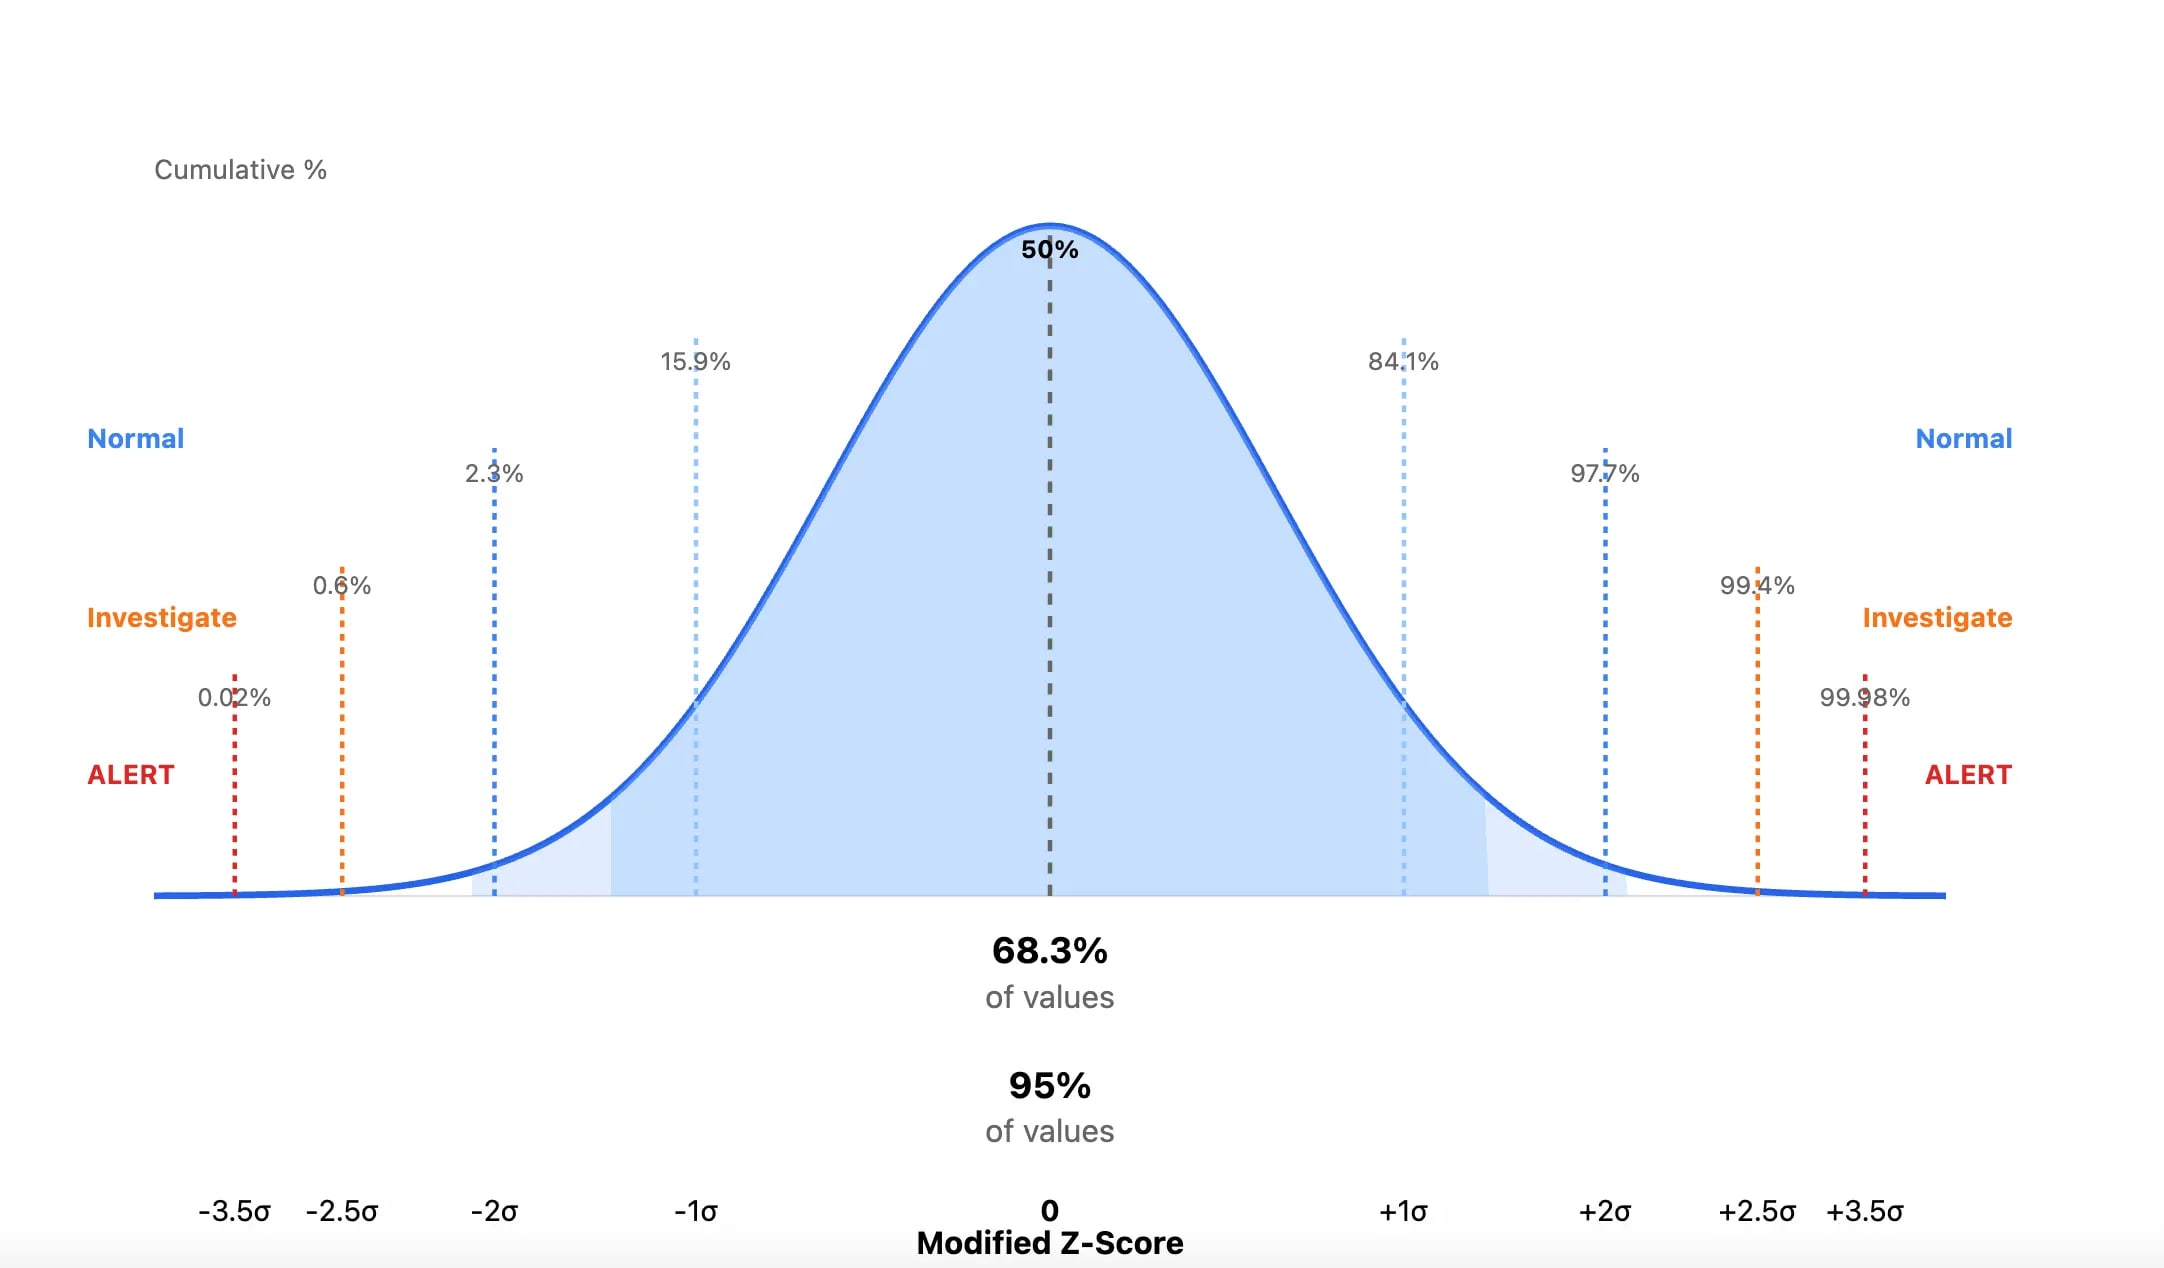
If my stats professor put normal distribution computation problems in the context of finding russian threat actors, I probably would have aced the class

This type of rigor removes the guessing game about whether events are absolute measurements. Is 1000 API calls weird, or is 100? Is 10 pm an acceptable window for Administrator access, or is 5 pm? By looking at the standard deviations away from the median, you focus on relative measurement. It removes the human judgment about the absolute weirdness of an event, and whenever you remove a human from a large data problem, you get a bit closer to sanity.

Lyons created a follow-along Jupyter notebook with synthetic data to recreate the measurements in his blog.

Every week, I read, watch and listen to all the Detection Engineering content so you can consume it all in 10 minutes. Subscribe and get a weekly digest of the latest and greatest in threat detection engineering!
DEW #154 - Mythos <> Firefox hype, RSigma gets an uplift, Detection-as-Code is overrated and TeamPCP Strikes Again

29 April 2026 at 14:04

Welcome to Issue #154 of Detection Engineering Weekly!

✍️ Musings from the life of Zack:

Every week, I read, watch and listen to all the Detection Engineering content so you can consume it all in 10 minutes. Subscribe and get a weekly digest of the latest and greatest in threat detection engineering!

  • I’m back from Spring Break and happy to report I have no sunburns. New England Spring is here as well, and it feels like the Northeast U.S. is coming out of hibernation

  • I just booked Hacker Summercamp (BlackHat & DEFCON), so excited to see folks there. If anyone wants to meet up/host an event/drink Miami Vice by the pool, HMU

    • For my BJJ fam: if anyone wants to train at Jeremiah Grossman’s Smackdown or hit an open mat during that week, let me know :D

Webinar with Forrester: AI x Security Operations, What Works and Doesn’t Work

I’m hosting a webinar with Allie Mellen from Forrester tomorrow, where we’ll be diving deep into security operations and how AI is working and not working for all of us.

We’ve had awesome discussions around this in the past. Feel free to register and come roast me in the chat!

Register & Roast Zack


💎 Detection Engineering Gem 💎

A quick look at Mythos run on Firefox: too much hype? by Antide Petit

The talk of the town last week was Mozilla's blog post on how they used Anthropic’s mysterious and powerful Mythos model to find and fix 271 vulnerabilities. The blog post itself isn’t bragadocious in the way you might see vulnerability reports; in fact, it has a level-headed take on how the Mozilla team is hopeful about the scale LLMs can find vulnerabilities, but that no singular vulnerability found was something that a human couldn’t find:

So far we’ve found no category or complexity of vulnerability that humans can find that this model can’t. - Petit

They used the term “vertigo” to describe how jarring the capabilities of LLMs are in changing our perception of defense.

Luckily, this post by Petit helps ground the announcements even further into reality, with some objections to the hype of the news. Petit reviewed Firefox’s issue trackers and commit history to gather more details about the 271 reported bugs. Petit went through the commit history to map bugs to CVEs, classify by exploitability and attack surface, and figure out which of the 271 actually met the bar for a CVE or had a PoC.”

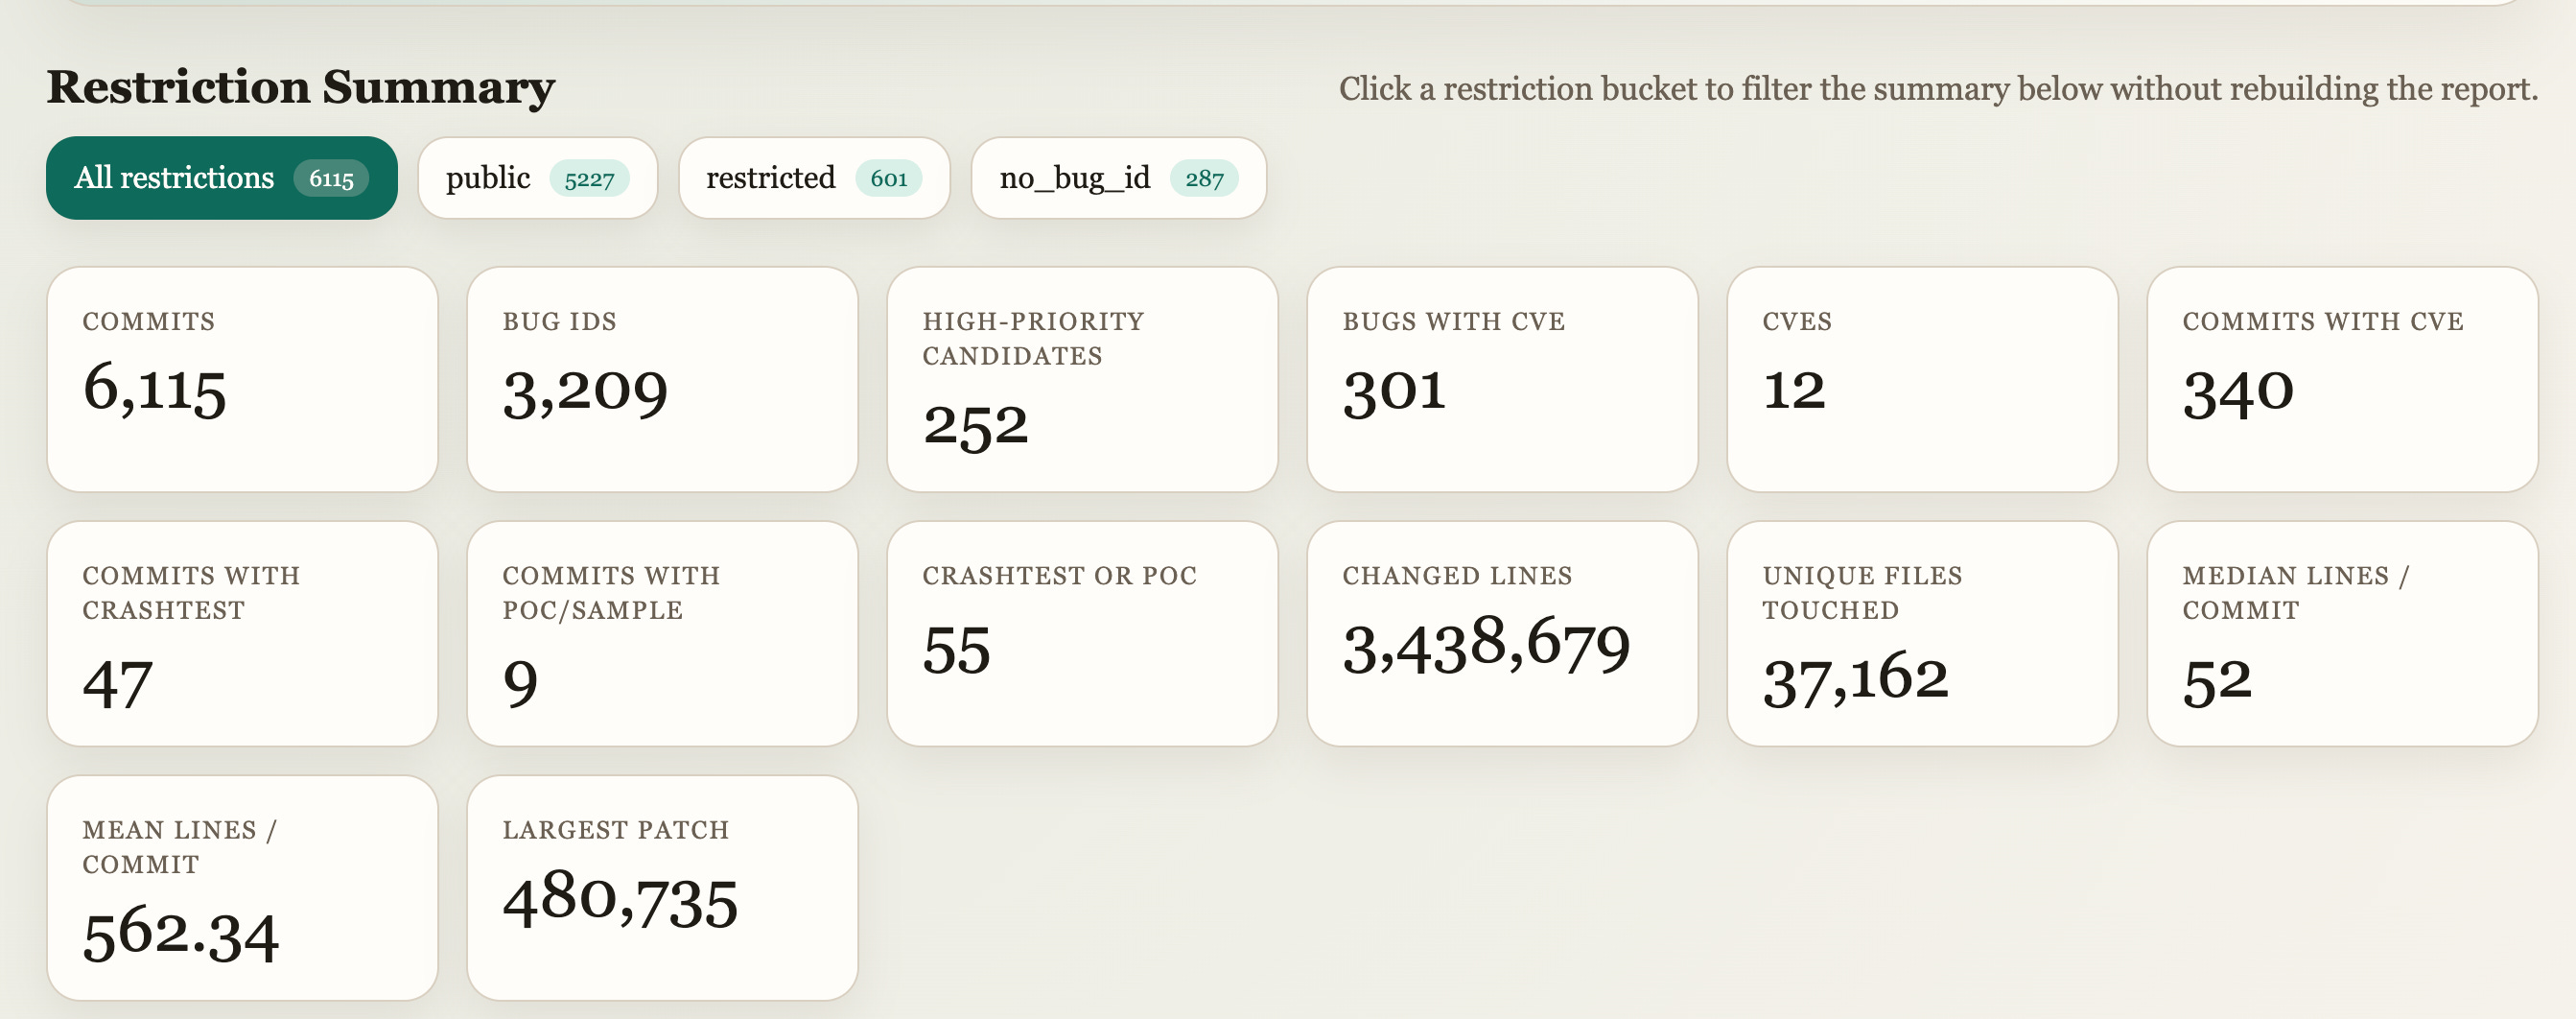
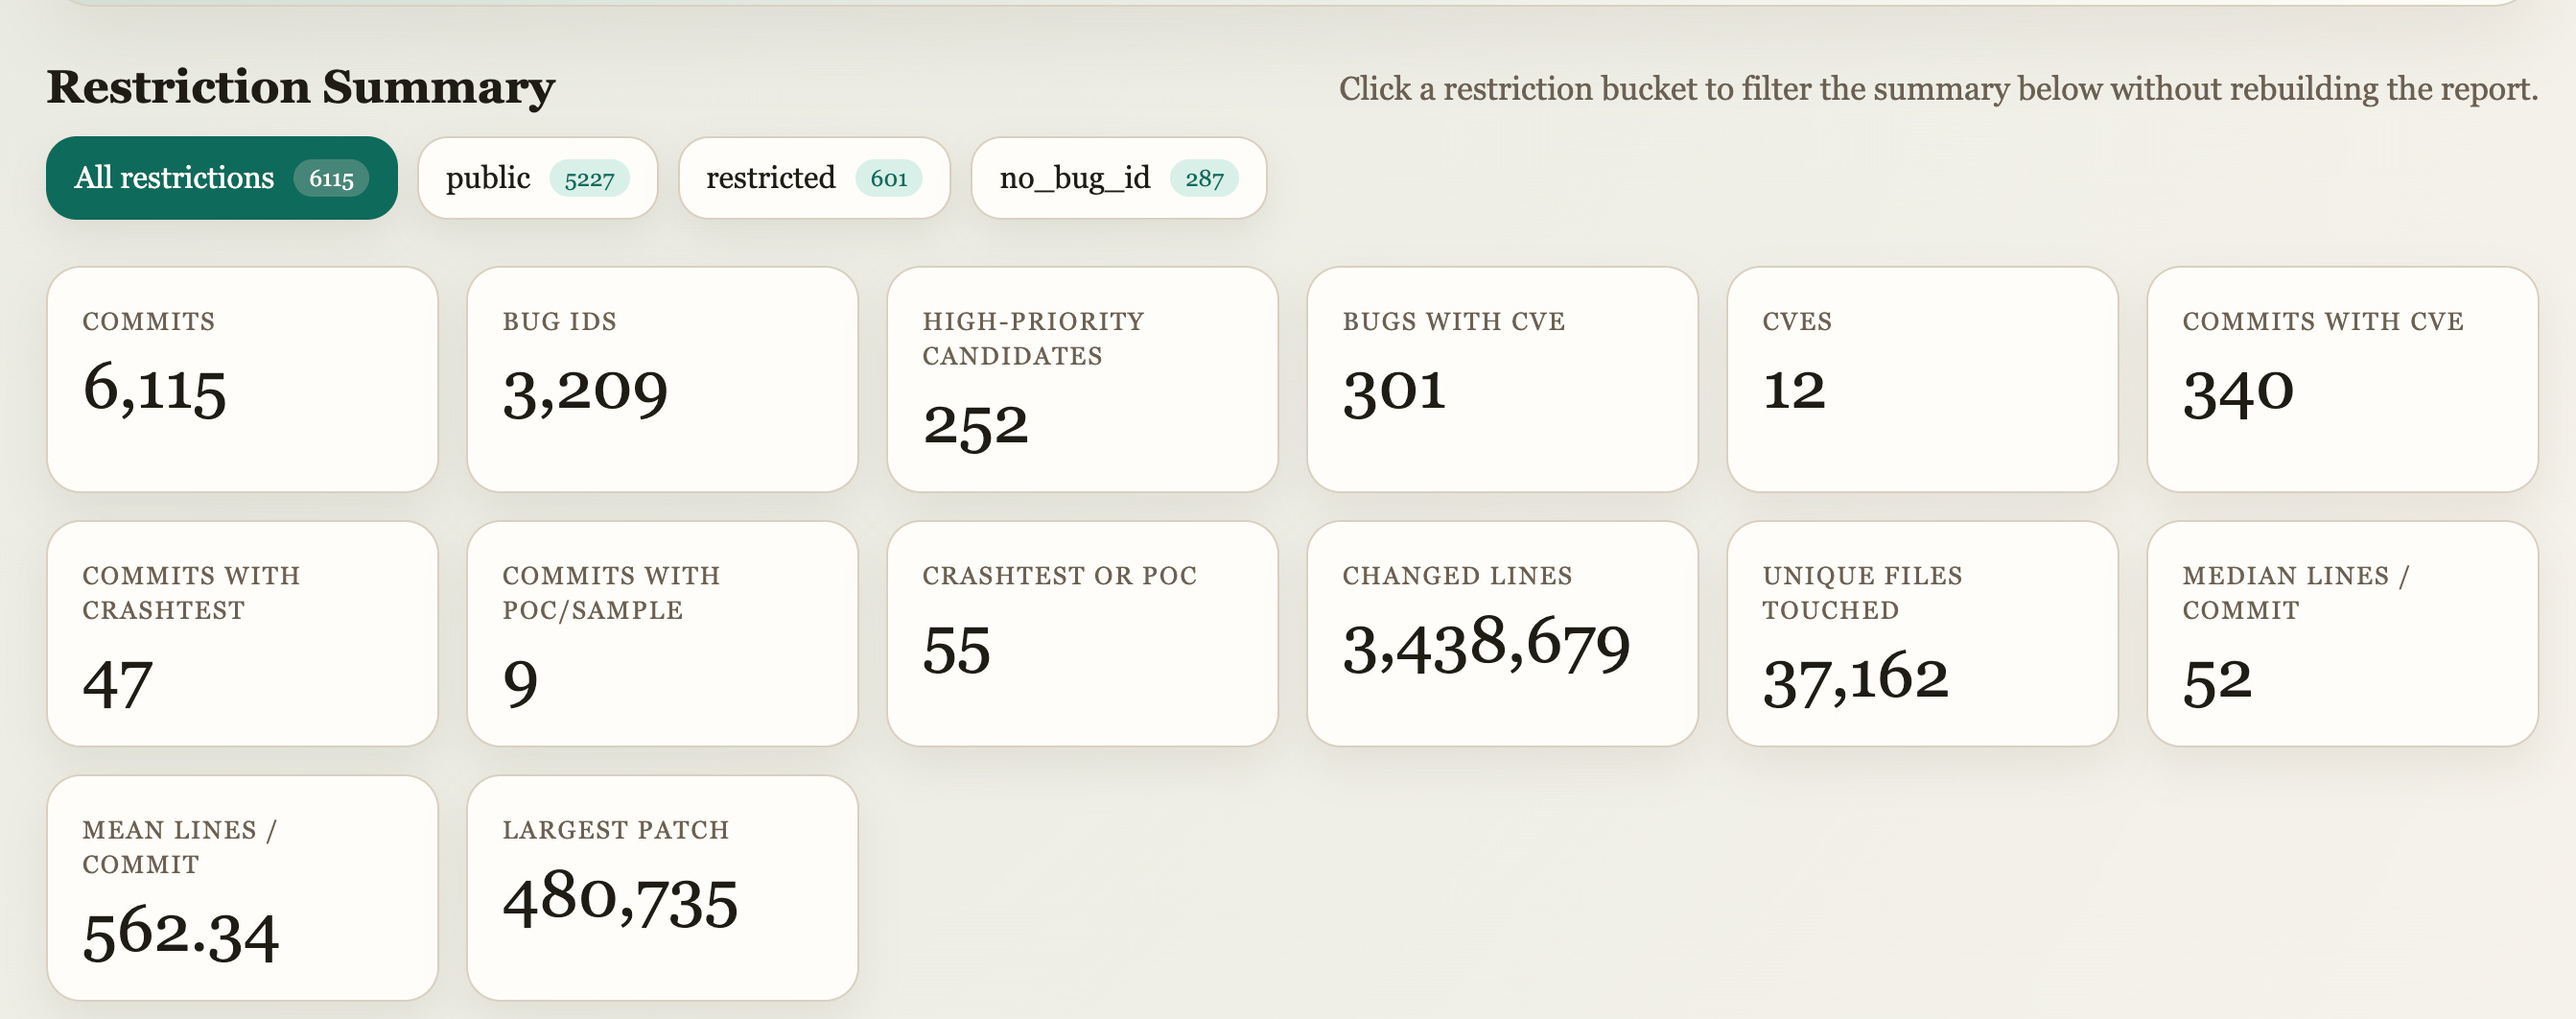
They vibe coded an excellent visualization tool with their findings, located here, with a neat dashboard shown below:

The 12 CVEs shown here tell a different story from the 271 vulnerabilities. Granted, the Firefox team did not say they issued 271 CVEs, but it depends on how we interpret those vulnerabilities and whether they are presented as exploitable or meet the bar for a CVE. The other finding here is that a vulnerability patched for a defender has a tighter distribution of usefulness than one found that is useful for offensive security purposes. A fully exploitable vulnerability still won’t guarantee a Firefox browser breakout, and you typically see these chained together to fully break out of the sandbox.

Petit ends the blog with a section on defender and attack relevance that captures my last point much better than I could ever explain it. Foundation models are proving themselves to be a useful tool for increasing the velocity of defense at a scale that sometimes gives us vertigo. But as an offensive security tool, it may not seem as useful or exciting because of the complexity of building a fully exploitable chain against an extremely hardened piece of software like a web browser.

The operational details of the research matter - Petit

Until this restraint on the opacity of research details becomes more transparent, it’s hard to separate the wheat from the chaff among blog post announcements from foundational labs. So, remain hopeful, but the hype is deliberate to build buzz, even though Anthropic does a good job of balancing this hype so it doesn’t seem disingenuous.


🔬 State of the Art

Streaming Logs to RSigma for Real-Time Detection by Mostafa Moradian

I covered Moradian’s RSigma tool in a previous gem, and he has been busy since then :). RSigma is a Rust binary that evaluates Sigma rules against JSON logs without a SIEM. Since that post, three releases have added some neat new features: NATS and HTTP inputs, a hot-reload feature for rules, observability via Prometheus metrics, and persistent correlation windows backed by SQLite.

Moradian walks through a well-known Okta cross-tenant impersonation scenario to show how these new features work in practice. The four SigmaHQ rules covering that attack (proxy login, MFA deactivation, privilege grant, IdP creation) each fire independently on events that are individually defensible.

The temporal_ordered correlation rule ties them together, requiring all four to fire in sequence from the same actor.alternateId within 30 minutes. Without stateful windowing across events, you risk creating noise on these four rules that may not be correlated. The field-mapping pipeline that reconciles Sigma rule field names with Okta’s camelCase API schema is what makes the whole thing portable. Moradian frames this as one of the hardest parts of detection portability. Vendors certainly take this for granted and leave the work to detection engineers, but Sigma is the closest to standardizing this.

RSigma is not a SIEM, as Moradian puts it, but it’s an impressive feat to build a self-contained Rust binary that operates much like one. For teams doing pre-SIEM rule validation or forensics, it’s a solid plug-and-play option for certain scenarios. It’s also a great read for understanding the deeper architectural challenges software engineers face when building high-volume distributed detection systems.


Are Detection-as-Code Pipelines Overrated? by Harrison Pomeroy

Detection-as-code (DaC) has been the gold standard maturity milestone for security teams for years. The goal of DaC is straightforward: provide governance, guardrails, human review, and validation of detections before they ever touch a production instance. It attempts to minimize regressions, detection drift, and cost increases through the lens of CI/CD and widely used SRE concepts.

Much like everything in security, agentic workflows present opportunities to improve this architecture or remove it altogether. So, in this post, Pomeroy explores this topic with an honest look at how we can scope out several portions of a DaC pipeline and move the work toward the agent running on the detection engineer’s laptop. Schema validation, metadata creation and documentation, linting, and accuracy validation agents for backtesting and accuracy checks can mostly be handled by an agent before it ever hits a pipeline.

We had many of these tasks within CI/CD because we expected humans to make errors. The governance aspect of DaC is attractive because centralizing knowledge around schemas and pre-deployment checks is deterministic by design. As Pomeroy points out, we perhaps overcorrected regarding the necessity of deterministic checks for safety, and an agent can provide both safety and speed. The DaC pipeline still exists, but in a much leaner form that still requires humans for approval.


Detection Pipeline Metrics by Scott Plastine

This short-but-sweet post on detection metrics is a continuation of Plastine’s post on Detection Visibility Metrics. I highly recommend reading the Visibility Metrics post, from which I learned two insights:

  • Visibility is just as important as detection itself. There is no rule without telemetry, and you should treat log sources as an asset as much as you treat developer laptops

  • We focus too heavily on rule metrics, such as coverage, and neglect business-level metrics like the number of users, coding environments, and servers we protect

After visibility, according to Plastine, you should focus on metrics within your logging pipelines themselves. I love how he used the Funnel of Fidelity as the inspiration for some of these measurements. If we don’t want to “clog the funnel”, we should look to reduce the amount of noise that arrives at alert inboxes. You reduce the amount of noise that makes it to alert queues by building more robust rule sets, risk scoring through composite rules or risk-based alerting, and building pipeline features that flatten or aggregate telemetry rather than sending in a ton of logs at once.


Midnight thinking on browser extension security by Anya Nessi

This is a great late-night musing piece on how it’s going to be harder to differentiate code authors as a detection signal due to agentic coding. The anchor is Red Canary’s Cyberhaven incident analysis, where the compromised extension update scored a modified z-score of 75.38 against the extension’s historical entropy baseline. For context, 3.5 is already a strong statistical outlier. A score of 75 means the injected script’s entropy was so far outside the distribution of the legitimate codebase that attribution to the same author was statistically implausible. I covered the modified z-score in Issue 145 if you want more background.

Nessi built her own entropy-based detection pipeline along similar lines, and it works. The question she’s grappling with is what will happen to this technique as LLM-assisted development becomes the norm for both legitimate developers and attackers. If both parties are writing code using tools trained on overlapping data, the distinct human authorship fingerprints that enable entropy-based detection begin to drift.


☣️ Threat Landscape

📦🔗 TeamPCP News

TeamPCP was back in the news this last week! These attacks don’t seem as impactful as the several I covered earlier this month, but there are some worthwhile callouts about updates to TTPs.

Malicious Checkmarx Artifacts Found in Official KICS Docker Repository and Code Extensions by Socket Research Team

The group compromised multiple Checkmarx distribution channels simultaneously: the official checkmarx/kics Docker Hub repository had trusted tags overwritten with a trojanized KICS binary that exfiltrated secrets during infrastructure-as-code scan runs for Terraform, CloudFormation, and K8S configs. Checkmarx ast-vscode-extension had an orphaned 2022 commit injected carrying a payload that runs via Bun and exfiltrates secrets, including MCP config files. It looks like the Bitwarden CLI npm hijack was part of the same campaign, and I wrote about this below.


TeamPCP Campaign Spreads to npm via a Hijacked Bitwarden CLI by Meitar Palas

In the next part of the campaign, the group compromised the npm CLI of the well-known password manager BitWarden. According to JFrog research, the group hijacked @bitwarden/cli version 2026.4.0, keeping the legitimate Bitwarden branding intact while rewiring the installation scripts to download Bun and execute a payload that attempts to exfiltrate GitHub tokens, SSH keys, and AWS/GCP/Azure secrets, as well as GitHub Actions secrets. The interesting part here, which I haven’t seen before, is that the malware explicitly targets ~/.claude.json and MCP config files, potentially marking a shift to use secrets from coding agents to pivot into victim environments.


Other News

I Left Port 22 Open on the Internet for 54 Days. Here's Who Showed Up. by Arman Hossain

This was a fun honeypot research project write-up in which Hossain deployed a basic SSH honeypot on a cheap VPS to collect and analyze connection attempts and attacks. Nothing here seems out of the ordinary or new from the sense of novel attacks, but it goes to show how noisy the Internet is and how easy it is to be targeted by Internet-wide scanners. Attackers attempted to run default credentials for well-known IoT devices, tried to download binaries to have their servers join a botnet, and had some level of hands-on keyboard operators interacting with the server. This would be a great experiment and exercise for folks getting into threat research and log analysis to build a server like this and analyze the logs.


Fibergrid: Inside the Bulletproof Host for 16,000+ Active Fake Shops by Harry Freeborough

Bulletproof Hosts are organizations that provide IP leasing space for customers and are known for not responding to takedown requests from abuse reports and, often, to law enforcement preservation requests. They are impressive feats of misdirection in that these organizations tend to layer themselves through shell companies and hard-to-contact administrators to maintain anonymity.

Fibergrid is a particularly unique bulletproof hoster because of its origin story. Netcraft Research has been tracking Fibergrid and attributed 16,700+ active fake shops and an IP address pool that traces back to the Great African IP Address Heist. Netcraft found that the servers are actually sitting in Equinix facilities across the US, UK, and the Netherlands, not Africa, which Netcraft argues gives Western law enforcement a real pressure point.


🔗 Open Source

F2u0a0d3/goodboy-framework

I was hoping to get a dog picture or instructions for training a dog to be a good boy in the README. Instead, I found an excellent resource for people trying to learn malware development, analysis, and detection engineering on Windows using Rust. There are 15 lessons or “stages”, and each one has a particular technique it’s trying to teach you to learn. They integrate malware technique development, such as direct or indirect syscalls, with analysis techniques for finding what you wrote along the way.


weirdmachine64/SharkMCP

Locally-run MCP server that provides tooling for local agents to perform PCAP analysis using Wireshark’s sharkd API. There are close to 20 tools that weirdmachine64 exposes for clients, and so you’ll want to add this one to your CTF arsenal, especially if you are looking at pcap files.


trailofbits/trailmark

Trailmark is a tool for visualizing code paths and dependencies. You feed it a codebase to analyze, and it’ll construct an abstract syntax tree in Treesitter format and pass it to a graphing function. You can then query the graph for specific classes or code paths, as well as use their querying capabilities to perform reachability analysis, annotate functions, find dependencies, or look for “paths in between” two nodes.


synacktiv/pike-agent

Pike-agent is an LLM assistant that reads strace telemetry and performs analysis based on the prompts you give it. For example, if a binary crashes every time you run it, you can feed it to pike-agent, and it’ll help you debug the root cause. I think the cool use case here, and I might be biased in security, is the malware analysis functionality :).


anondotli/awesome-privacy-tools

Yet another awesome-* list, this time focused on privacy tools. I’m surprised something like this hasn’t been made yet, but it’s nice to see an aggregation of useful tools that can help improve your OPSEC. Might be especially useful if you are a threat researcher or intel specialist doing cybercriminal research on underground forums.

Every week, I read, watch and listen to all the Detection Engineering content so you can consume it all in 10 minutes. Subscribe and get a weekly digest of the latest and greatest in threat detection engineering!

❌